Article

Assessment and Spatiotemporal Variability of Heavy Metals Pollution in Water and Sediments of a Coastal Landscape at the Nile Delta

1
Environmental Sciences Department, Faculty of Science, Port Said University, Port Said 42526, Egypt
2
Abdullah Alrushaid Chair for Earth Science Remote Sensing Research, Geology and Geophysics Department, College of Science, King Saud University, Riyadh 11451, Saudi Arabia
*
Author to whom correspondence should be addressed.
Water 2022, 14(23), 3981; https://doi.org/10.3390/w14233981
Submission received: 24 October 2022 / Revised: 24 November 2022 / Accepted: 25 November 2022 / Published: 6 December 2022

Abstract

:
This study assessed the spatiotemporal variability and pollution grades of heavy metals in water and sediments of Bahr El-Baqar drain, Eastern Nile Delta, Egypt, by integration of geochemical analysis, metal pollution indices, correlation, and multivariate statistical analyses. Twenty samples of water and sediments were collected during 2018 and analyzed for heavy metal concentrations using ICP-OES. Heavy metal contents in the water samples followed the order: Fe > Zn > Al > Pb > Mn > Cu > Ni. The drain sediments were highly contaminated with heavy metals that followed the order: Fe > Al > Mn > V > Zn > Cu > Cr > Ba > Ni > Pb > As. Spatiotemporally, most metals in the drain sediments showed a decreasing trend from upstream (south) to downstream sites (north). Results of principal component analysis (PCA) supported those from the Pearson correlation between investigated heavy metals. In water, Mn, Ni, Pb, Zn, Cu, and Fe showed highly significant correlations. In sediments, Ba, Ni, Zn, Fe, Al, Mn, and V showed strong positive correlations indicating that these metals were derived from similar anthropogenic sources. The calculated metal pollution indices: enrichment factor (EF), contamination factor (CF), pollution load index (PLI), degree of contamination (DC), and index of geo-accumulation (Igeo) indicated high loadings of heavy metals in the drain sediments. EFs revealed low, moderate to significant enrichment, whereas CFs showed low, moderate, and considerable contamination. PLI indicated low, baseline, and progressive contamination, while DC indicated low, moderate, and considerable degree of contamination. Igeo of all investigated metals (except for As; class 1) indicated extremely contaminated sediments (class 7).

1. Introduction

Heavy metals are very serious contaminants in the aquatic environment because of their toxicity, persistence, and accumulation in water, sediments, plants, and living organisms [1,2,3]. Due to anthropogenic activities and natural sources, the pollution of soil and water with heavy metals has considerably grown in recent decades [4,5,6]. These polluting activities include mining, industrial operations, non-point sources, especially vehicle exhaust, and the use of metal-enriched materials, chemical fertilizers, plant manures, sewage sludge, and wastewater drainage [7]. Because they do not biodegrade and remain persistent for a long time in our bodies and the environment, heavy metals bioaccumulate up the food chain, from the tiniest organisms to humans [8]. The increased discharge of domestic and municipal wastes with infrequent primary and secondary treatment hardly minimizes contamination while posing a threat to water resources [5,6,9]. According to recent studies, the soil and plants of the area south of Lake Manzala were highly contaminated with heavy metals due to the usage of wastewater for irrigation [10,11].
Bahr El-Baqar drain is one of the primary drains in the Eastern Nile Delta region that receives various types of polluted wastewater (e.g., domestic, industrial, and agricultural) [12]. Bahr El-Baqar is one of Egypt’s most polluted drains, which mixes fresh water with wastewater for irrigation, but using this water puts the public’s health at risk [9]. It is reported that the total water of the Bahr El-Baqar drain comes from drainage water sources: agricultural 58%, industrial 2%, and domestic and commercial 40% [12,13]. The drain receives about 300 million m3/year of treated and untreated sewage from Cairo and irrigates about 119.20 km2 of the nearby agricultural lands [1,12]. The major contamination sources of Bahr El-Baqar drain are industrial activities such as metal manufacturing, food processing, disinfectants and soap, paper and textile manufacturing, and municipal discharge [14].
For the management of sustainable irrigation, earlier research monitored and assessed the water quality of Bahr El-Baqar drain [15,16,17,18,19]. Monitoring of heavy metals in the water bodies offers continuous pollution surveillance, early warning, and planning for long-term reduction in such pollution and its determined impacts on the environment and human health [5,12,20]. Stahl et al., 2009 [17] collected and examined water samples from Belbeis and Bahr El-Baqar drains to investigate the water quality parameters, and heavy metals. The soils nearby and irrigated by the drain water become highly contaminated with heavy metals due to the discharge of industrial, agricultural, and domestic wastes [11,16,21,22].
Numerous studies have investigated the geographical distribution, geochemical speciation, and pollution levels of heavy metals in the soils near the Nile Delta drains [1,5,23,24,25]. Similar to this, several studies [14,22,26,27] examined the soils of agricultural lands close to and irrigated by Bahr El-Baqar drain water. However, little research was carried out on the drain sediments. In the shallow sediments of the drain outlet south of Lake Manzala, heavy metal levels followed the order: Fe > Cd > Ni > Co > Pb > Cr [11]. While the heavy metals in soil nearby the drain were identified as follows: Cd > Cu> Zn > Cr > Ni > Pb [14]. Different origins and point/non-point pollution sources could be attributed to the spatial variation of heavy metal concentrations in soil and sediments [1,5,14,15,27,28]. As a result, several metal pollution assessment indices, including enrichment factor, contamination factor, pollution load index, and index of geo-accumulation, were created to assess the potential source and pollution level of heavy metals in the examined soil/sediment samples [1,5,11,21,24,27,29,30,31,32,33,34].
This study investigated and assessed the environmental risk and spatiotemporal variation of physico-chemical parameters, dissolved salts, and selected heavy metals (e.g., As, Pb, Cu, Cr, Zn, Mn, Ni, V, Al, and Fe) in the water and sediments of Bahr El-Baqar drain, Eastern Nile Delta, Egypt, by integrating geochemical analysis, metal pollution indices, correlation, and multivariate statistical analysis.

2. Materials and Methods

2.1. Study Area

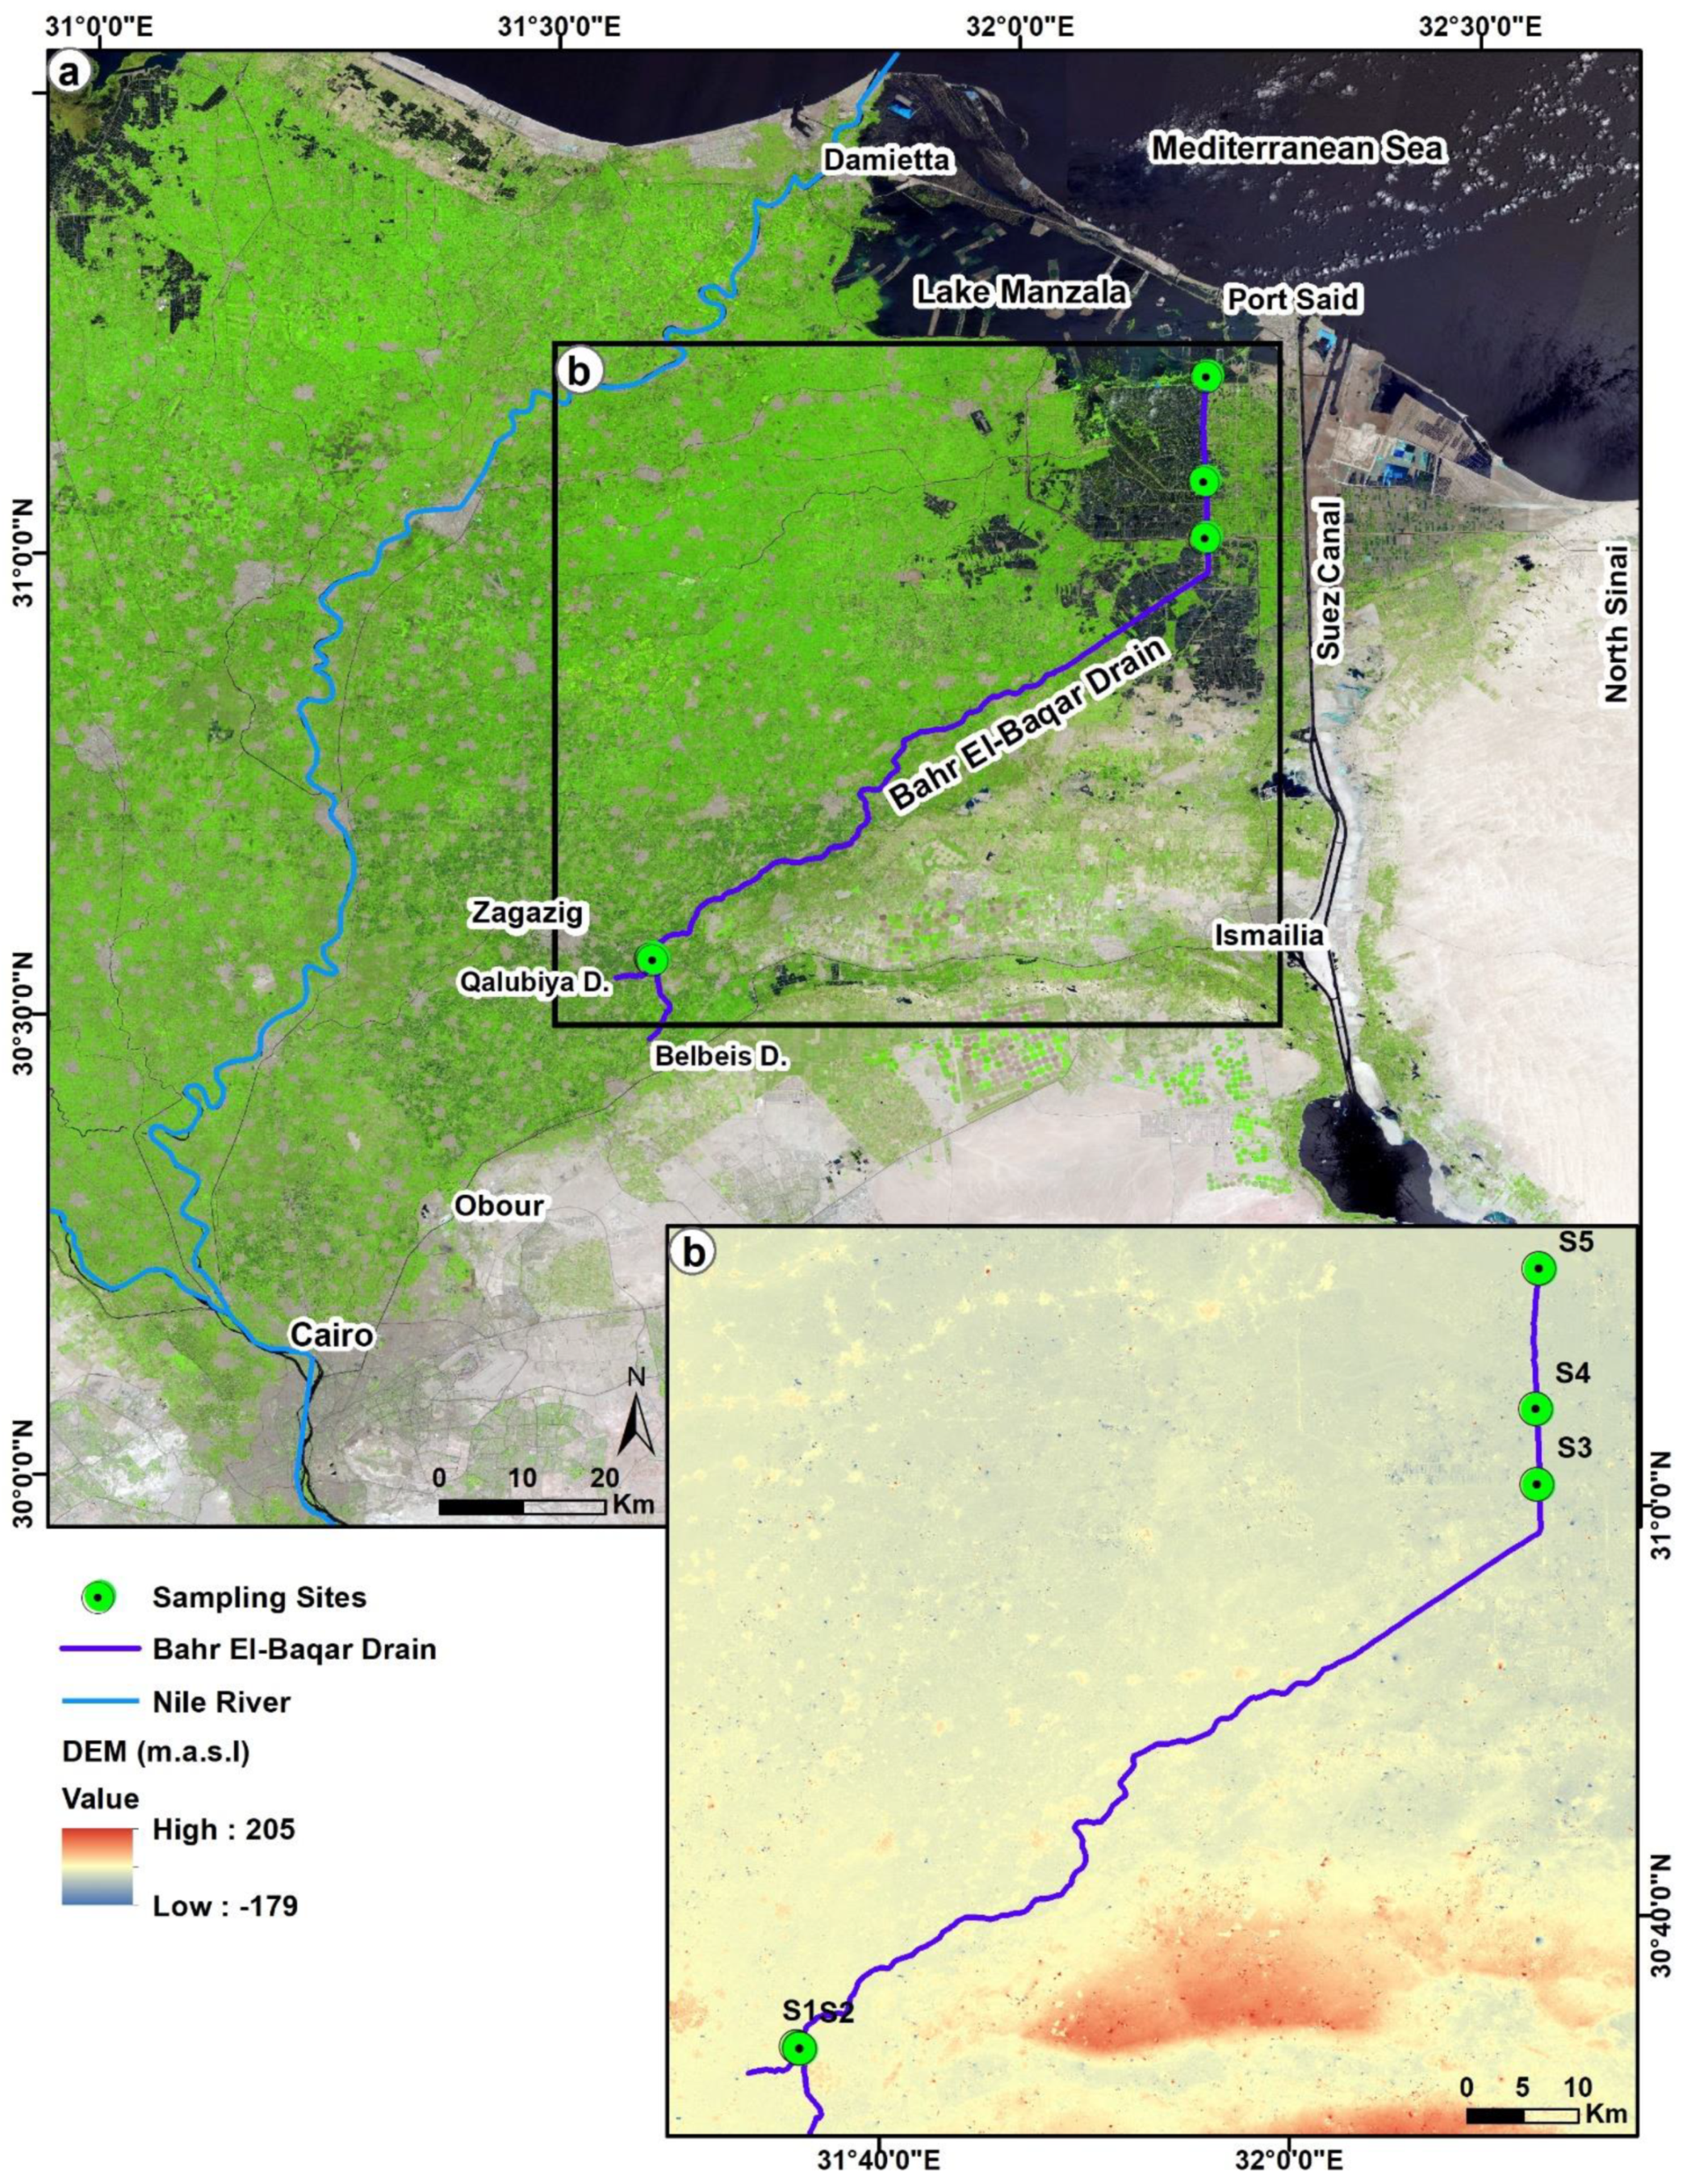
Bahr El-Baqar main drain, near Zagazig in the Sharqia Governorate, gathers wastewater from two secondary drains, Belbeis and Qalubiya, and flows downstream to Lake Manzala south of Port Said city (Figure 1). The study area includes five sampling sites of water and sediments along Bahr El-Baqar drain (S1, Qalubiya drain; S2, Belbeis drain; S3, at Bahr El-Baqar village; S4, near Bahr El-Baqar draino outlet; S5, south Lake Manzala) (Figure 1). High-resolution Sentinel-2A satellite image (scenes: 4; spatial resolution: 10 m; source: U.S. Geological Survey (USGS), website: (https://earthexplorer.usgs.gov/ accessed on 1 October 2022) was used as a location map showing various land use/cover features in the study area (Figure 1). ALOS PALSAR digital elevation model (DEM) (scenes: 4; spatial resolution: 25 m; source: Alaska Satellite Facility (ASF), website: (https://vertex.daac.asf.alaska.edu/# accessed on 1 October 2022), was used to delineate the elevation buffering zone of Bahr El-Baqar drain, which ranged from −1 (S5, downstream) to 12 m (S1, upstream) (Figure 1). The study area includes five sampling sites of water and sediments along Bahr El-Baqar drain (Figure 1). Bahr El-Baqar was the second-largest drain, with 25% of the total water flowing into Lake Manzala [35].
Lake Manzala is the most important source of fish production; however, it is one of Egypt’s most polluted water bodies. The lake receives wastewater from six main drains (Hados, Bahr El-Baqar, El-Serw, Ramsis, Farascor, and El-Mataria) [1,16]. The climate in the Lake Manzala area, North Egypt, is relatively semi-arid. Precipitation has an average annual rate (113 mm) and mostly occurs in the winter season (December, January, and February). The temperature of the lake area has an average value of 20 °C and ranges from 26 °C in the summer months (July and August) to 13 °C in the winter months (January and February). The relative humidity of the coastal area is mostly high and ranges from 71% in spring to 76 % in summer and winter months [36]. The formation of Lake Manzala is referred to as the subsidence and coastal erosion processes [36], it is bordered by the Mediterranean Sea to the north and by fish farms, villages, and agricultural lands to the south (Figure 1). The lake included about 1022 islands and is about 47 km long from northwest to southeast, and about 30 km wide, and it narrows to about 17 km in the middle. Lake Manzala has 4 main land use/cover classes; cultivated, bare, urban, and fishponds areas, while the lake area decreased up to 60% from 1972 to 2017 due to the reclamation and anthropogenic activities (e.g., the construction of the coastal highway and illegal fishponds). Lake Manzala is a famous water body spot for migrating birds worldwide in the winter season and would play a role in mitigating the adverse impacts of climate change as it could absorb the excess water from the potential rise in the Mediterranean Sea level, and protect the coastal cities (e.g., Port Said and Damietta) from floods and storm surges [37].

2.2. Sampling and Analysis of Water and Sediments

Ten samples of water and sediments were collected from the main five sites (S1–5) along the course of Bahr El-Baqar drain, beginning upstream near Zagazig, Sharqia Governorate, where Qalubiya drain (S1; west) meets with Belbeis drain (S2; east), and flowing downstream into Lake Manzala (S5; north) about 2 km south of Port Said city (Figure 1), during the summer and winter of 2018. From the drain bottom’s surface layer (0–30 cm), sediment samples were collected using a hand auger in triplicates and placed in 1 kg clean bags before being transported to the lab.
Water samples were collected in 1 L HDPE bottles and preserved with 2% HNO3 according to the standard method (3030 F) for sample preparation [38]. Water samples were filtered in the lab using a membrane filter with a 0.45 μm pore size. Following the standard method 3120 (total) for the examination of water and wastewater [38], methyl isobutyl ketone (MIBK) and ammonium pyrrolidinedithiocarbamate (APDC) were used to prepare solvent extraction to concentrate the dissolved heavy metals. The concentrated solutions of the heavy metals (e.g., Pb, Cu, Mn, Ni, Zn, Al, and Fe) were analyzed using ICP-OES at the National Research Centre (NRC), Egypt.
Sediment samples were analyzed for heavy metal concentrations following the method of [39]. The sediment samples were collected, air-dried at room temperature, homogeneously ground, and sieved into 2 mm mesh to get the finest texture. About 1 g of a sediment sample was digested in a mixture solution of nitric acid (HNO3), perchloric acid (HClO4), and hydrochloric acid (HCl) according to the method of [40]. The mixture was dried, diluted with deionized water to 25 mL, and then filtered to remove any residuals. Total contents of the metals (e.g., As, Pb, Cu, Cr, Zn, Mn, Ni, V, Al, and Fe) were extracted from sediments according to the method of [40] and analyzed using ICP-OES at the NRC, Egypt. A series of working standards covering the range 0.5 mg/L to 10 mg/L were prepared from certified reference materials; Agilent multi-element stock standard solution (1000 mg/L) for the metals: Ba, As, Pb, Cu, Cr, Zn, Mn, Ni, V, Al, and Fe with a matrix of 5% HNO3 and analyzed with the blank and samples. Each element was measured at specific atomic lines (nm) that give maximum sensitivity. The intensity of this emission is indicative of the concentration of the element within the samples. The detection limits of the utilized ICP-OES vary from 1 to 100 µg/mL in solution. The quality of the measurements was controlled by analysis of control samples after every 10 analyzed samples. As quality control samples, the Agilent multi-element calibration standard ICP-108 (21 elements at concentration 100 μg/mL) and ICP-106 calibration standard for surface water (Ba 50 μg/mL, As 50 μg/mL, Pb 25 μg/mL, Cu 20 μg/mL, Cr 20 μg/mL, Zn 50 μg/mL, Mn 30 μg/mL, Ni 50 μg/mL, V 100 μg/mL, Al 500 μg/mL, and Fe 100 μg/mL) were applied. The elemental recovery was between 95% and 102%. I indicate that the ICP-OES operating conditions were well and carefully chosen to maximize the sensitivity for the examined elements.

2.3. Metal Pollution Assessment Indices

Five metal pollution assessment indices, that are commonly used in the literature [5,27,29,30], were utilized in this study as follows.

2.3.1. Enrichment Factor (EF)

EF measures the level of anthropogenic pollution in soil/sediments, and is calculated by comparing a metal concentration in a sediment sample to its background value and Fe is frequently employed in literature as a normalizing element [30,41]. The EF is expressed by the equation as follows:
EF = (Cs/Fes)/(Cb/Feb)
where Cs is the metal concentration in the studied sediment sample, Cb is the metal background concentration in the Earth’s crust, and Feb is the Fe background value in uncontaminated areas [42]. The average metal abundances in the Earth’s crust of Ba, As, Cu, Cr, Mn, Ni, Pb, Zn, Fe, and Al are 425, 1.5, 26, 155.5, 1058, 20, 25, 66, 50,000, and 80,000 (mg/kg), respectively [43]. The EF is classified as follows: EF ≤ 1 background concentration; 1–2 deficiency to minimal enrichment; 2–5 moderate enrichment; 5–20 significant enrichment; 20–40 very high enrichment; and >40 extremely high enrichment [5,29,30].

2.3.2. Contamination Factor (CF)

The CF is the ratio calculated by dividing the metal concentration in the studied sediments by its background value according to [44], which is applied in all indices. The CF is expressed by the equation as follows:
CF = Cs/Cb
where Cs is the metal concentration in the studied sediment sample, while Cb is the metal baseline concentration [41]. The CF describes the metal pollution in sediments as follows: CF value < 1 (low); 1 ≤ CF < 3 (moderate); 3 ≤ CF < 6 (considerable); and CF ≥ 6 (high contamination) [44].

2.3.3. Pollution Load Index (PLI)

The PLI, developed by [45], is a simple integrated pollution index that indicates the cumulated contamination resulting from the increased element concentrations [29]. PLI is calculated as the root number (n) of multiplied CF values in all investigated metals and expressed by the equation as follows:
PLI = (CF1 * CF2 * CF3 * … * CFn)1/n
where “n” is the number of the investigated heavy metals, which is 11 in this study, and “CF” is the contamination factor for each of the eleven studied metals. PLI values can be explained as follows: 0 indicates no pollution; 1 indicates baseline levels of contamination; and >1 indicates progressive contamination of the site quality.

2.3.4. Degree of Contamination (DC)

The DC is an integrated pollution index and identified as the sum of all contamination factors for a given site and expressed by the equation:
DC = i = 1 n CF i
where CF is the single contamination factor and n is the count of the investigated elements (11 in this study). The DC values of <n indicate a low degree of contamination; n ≤ DC < 2n, a moderate degree of contamination; 2n ≤ DC < 4n, a considerable degree of contamination; and DC > 4n, a very high degree of contamination [1,29].

2.3.5. Index of Geo-Accumulation (Igeo)

The Igeo was originally identified by [46] to assess the presence and intensity of metal pollution in soil and sediments by comparing the measured metal contents with those in uncontaminated areas. The Igeo is expressed by the equation:
Igeo = log 2 Cn 1.5 * Bn ﴿
where Cn is the measured concentration of metal in soil and sediment, while Bn is the geochemical background value of element n, and factor 1.5 is used for normalizing the background data from lithological variations, and to detect anthropogenic influences [11,30]. Müller, 1981 [44] defined seven classes of Igeo as follows: Igeo = 0, uncontaminated (class 1); 0 < Igeo ≤ 1, uncontaminated to moderately contaminated (class 2); 1 < Igeo ≤ 2, moderately contaminated (class 3); 2 < Igeo ≤ 3, moderately to strongly contaminated (class 4); 3 < Igeo ≤ 4, strongly contaminated (class 5); 4 < Igeo ≤ 5, strongly to extremely contaminated (class 6); and Igeo > 5, extremely contaminated (class 7).

2.4. Statistical Analysis

Univariate (min, max, mean, median, and standard deviation; SD), bivariate (Pearson coefficient), and multivariate (principal component analysis; PCA) statistical analyses were carried out to show the variance of data and evaluate potential sources of heavy metals [5] using Statgraphics software [47].

3. Results

3.1. Heavy Metal Concentrations in Water

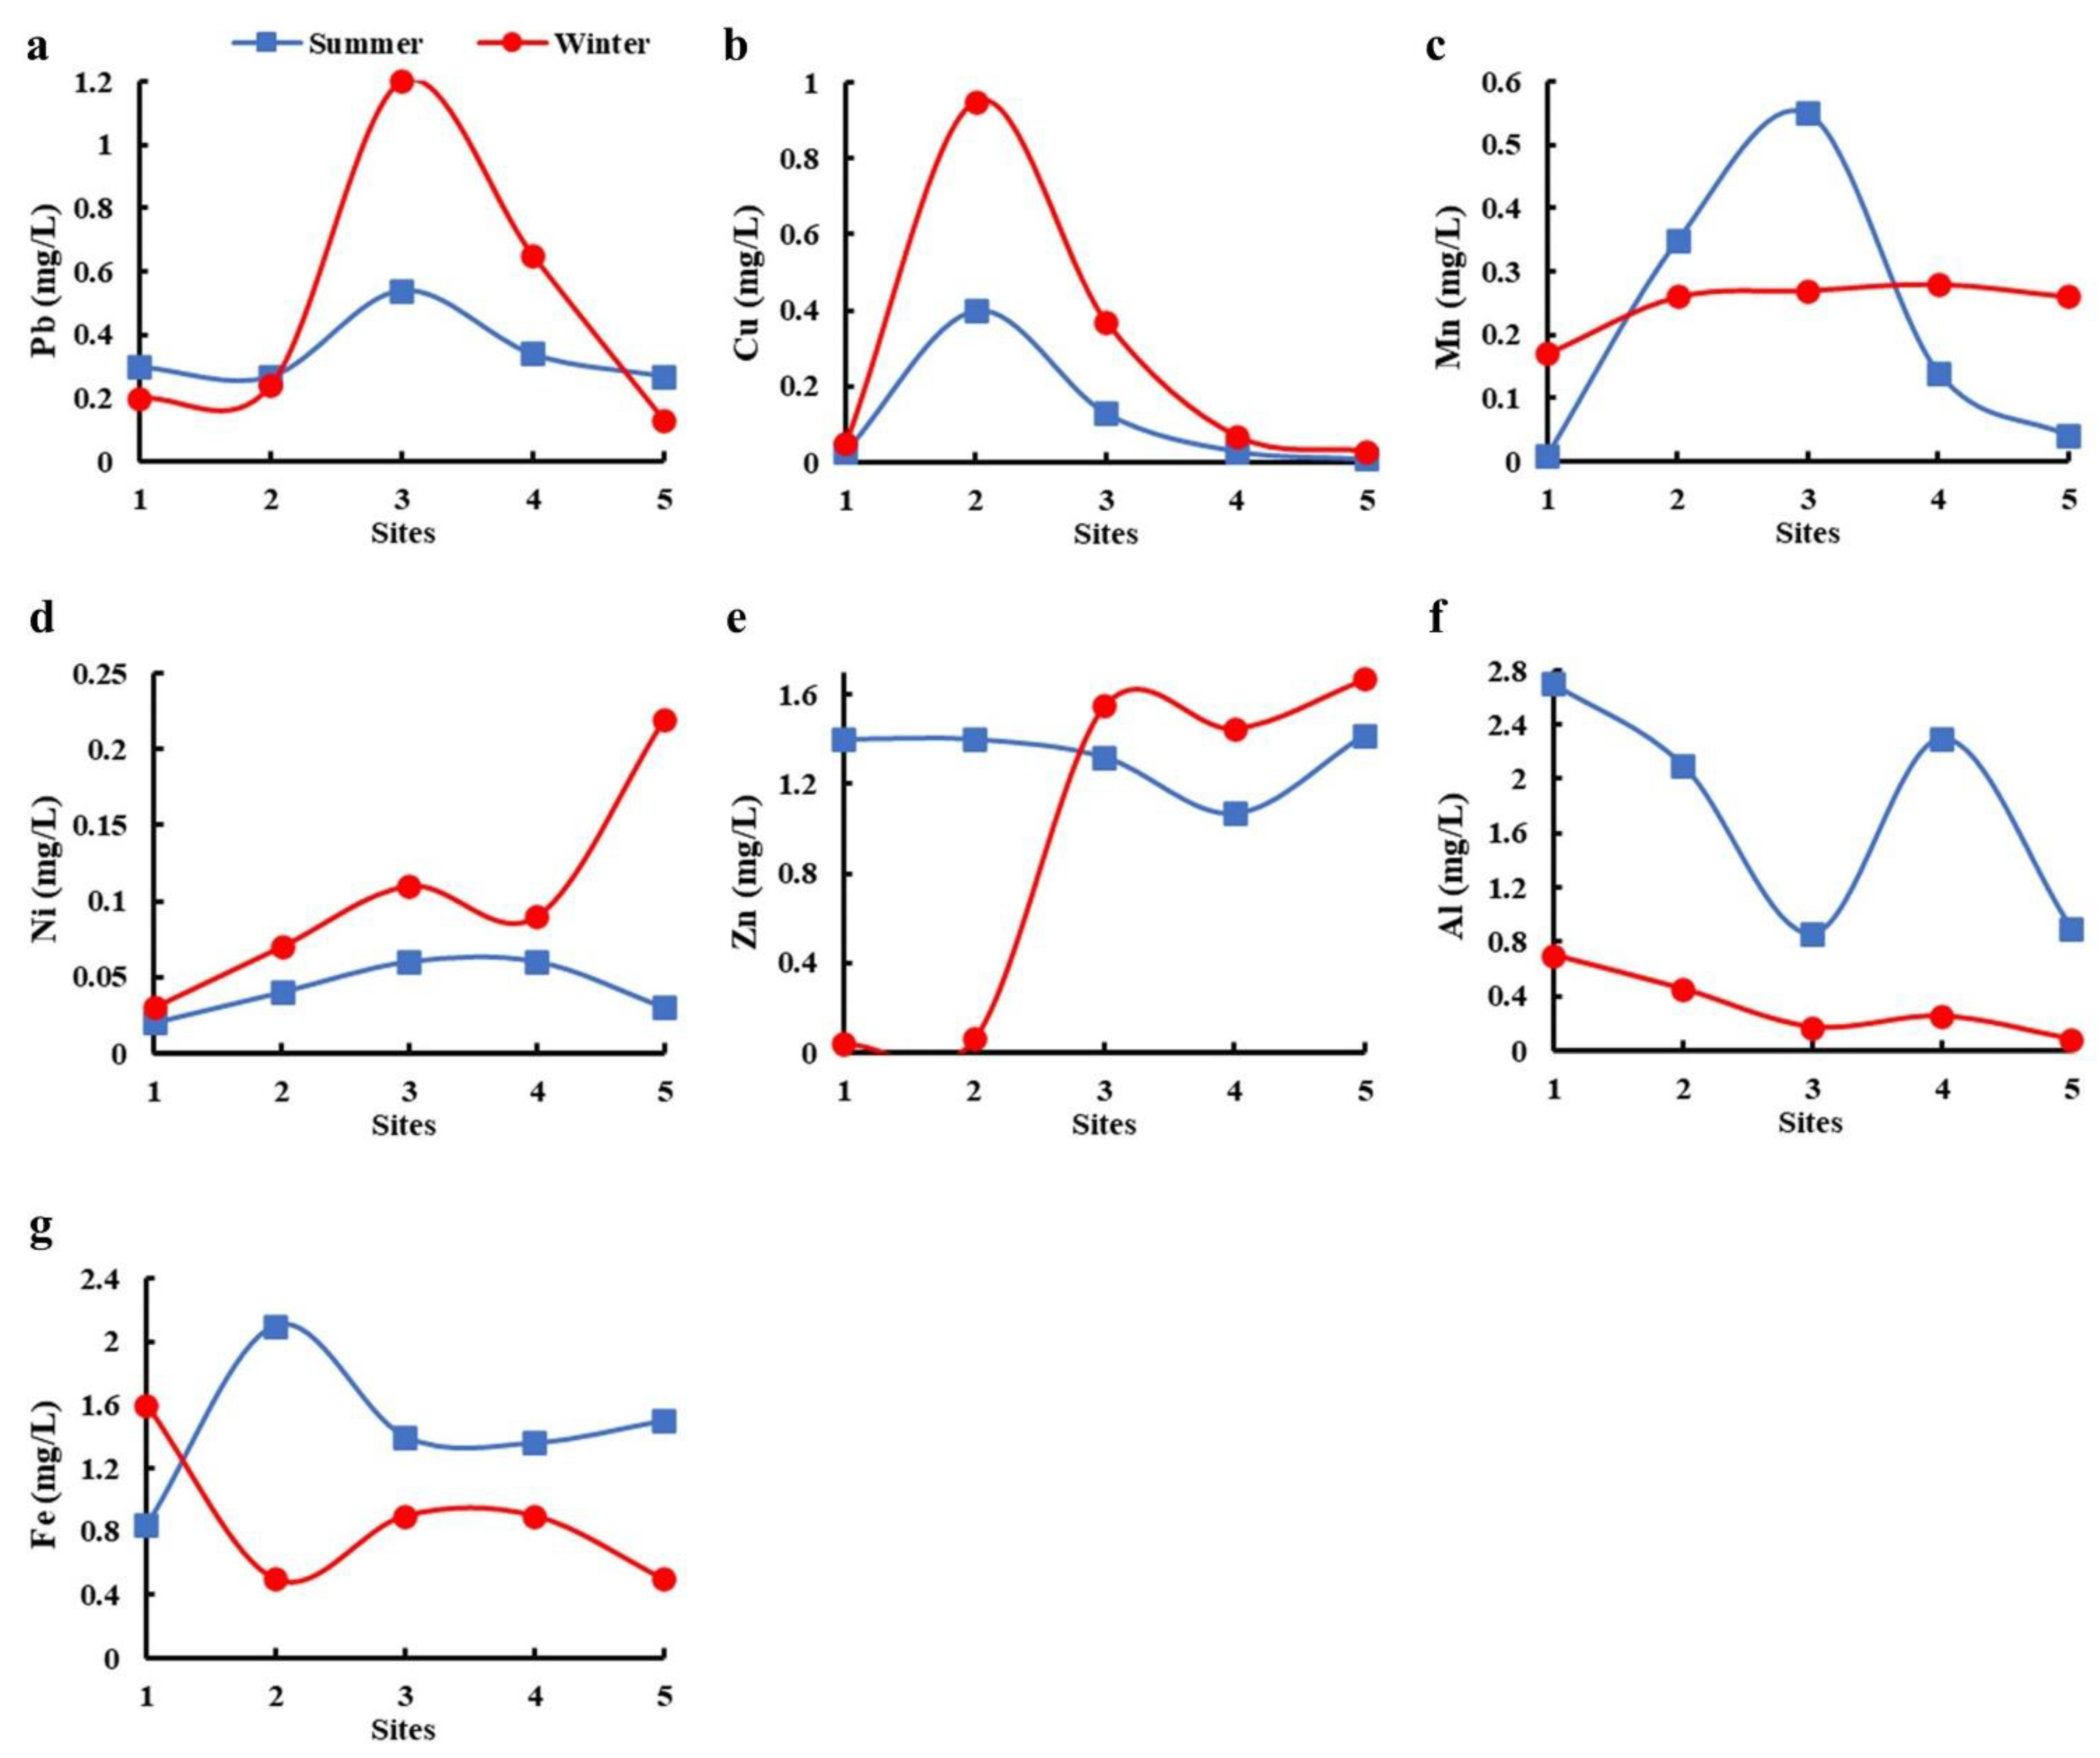
Total metal concentrations in the drain water samples were reported in Table 1 and spatially and temporally illustrated along the study sites (S1–5) in Figure 2. These metal concentrations were compared to values of similar metals in other studies conducted in Egypt and elsewhere in the world (Table 2). The analyzed heavy metals in the drain water samples have the decreasing order: Fe > Zn > Al > Pb > Mn > Cu > Ni with their average concentrations (mg/L): 1.16, 1.13, 1.05, 0.41, 0.23, 0.20, and 0.07, respectively (Figure 2 and Table 1).
Lead (Pb) is one of the most toxic metals in the environment and ranged in the investigated water samples from 0.13 to 1.20 mg/L with an average of 0.414 mg/L (Table 1 and Figure 2a), exceeding previous Pb levels recorded in the drain water; 0.01 mg/L [17], 0.11–0.35 mg/L [15], and 0.34–0.80 mg/L [48], but lower than 366–420 mg/L [10] (Table 2). Copper (Cu) in the drain water samples has a range of 0.01–0.91 mg/L, and an average of 0.2 mg/L (Table 1, Figure 2b), compared to higher Cu levels recorded in the drain water; 200–236 mg/L [10], and lower levels; 0.01–0.03 mg/L [15,17,26]. The highest level of Cu (0.95 mg/L) was reported in S2 from Belbeis drain (Figure 2b). Manganese (Mn) levels in the drain water samples ranged from 0.01 to 0.55 mg/L, with an average value of 0.20 mg/L (Table 1 and Figure 2c), compared to higher Mn levels previously reported; 310–361 mg/L [10], and lower Mn levels; 0.03–0.48 mg/L [15]; 0.4 mg/L [17]; and 0.01–2.88 mg/L [26] (Table 2). The highest Mn level (0.55 mg/L) in the drain water was recorded in S3 at the middle part of the drain (Figure 2c). Nickel (Ni) has the lowest levels in water samples (0.02–0.22 mg/L) with an average of 0.07 mg/L (Table 1 and Figure 2d), compared to extremely low Ni levels previously detected in the drain water; 0.01 mg/L [15,26]. Notably, low Ni levels were detected in the summer samples (<0.05 mg/L), compared to extremely higher levels in the winter samples (Figure 2d). Zinc (Zn) levels in the water samples ranged from 0.04 to 1.67 mg/L, with an average of 1.13 mg/L (Table 1 and Figure 2e), which is higher than Zn levels (0.01 mg/L) [26] and lower than 124.20 mg/L [10] previously recorded in the drain water. Aluminum (Al) in water samples ranged from 0.08 to 2.70 mg/L, with an average of 1.05 mg/L (Table 1 and Figure 2f), which is obviously higher than Al levels (0.10–1.20 mg/L) previously reported in the drain water [26]. Iron (Fe) has a range of 0.50–2.10 mg/L, and an average of 1.16 mg/L (Table 1 and Figure 2g), compared to low Fe levels (0.03–0.57 mg/L) [26].
In terms of spatiotemporal variability, S1 had the highest Al level (2.70 mg/L) from Qalubiya drain (Figure 1 and Figure 2f), which receives domestic and industrial wastes. Likewise, S2 had the highest Fe level (2.10 mg/L) from Belbeis drain (Figure 1 and Figure 2g). The average levels of Cu, Mn, and Zn in the drain water samples exceed the maximum concentrations for irrigation [49], however, the average levels of all studied heavy metals in the drain water samples were below the permissible limits of the Egyptian Environmental Law [50]. Overall, Pb, Cu, Ni, and Zn have significant spatiotemporal variability for the winter water samples, whereas Mn, Al, and Fe have large spatiotemporal variation for the summer water samples (Figure 2).
Figure 2. Spatiotemporal distribution plots of heavy metal concentrations (mg/L) in water sampling sites of Bahr El-Baqar drain during summer and winter of 2018: Pb (a), Cu (b), Mn (c), Ni (d), Zn (e), Al (f), and Fe (g).
Water 14 03981 g002
Table 1. Summary statistics of heavy metal concentrations (mg/L) in water of Bahr El-Baqar drain.
PbCuMnNiZnAlFe
Mean0.410.200.230.071.131.051.16
Min0.130.010.010.020.040.080.50
Max1.200.950.550.221.672.702.10
Med0.280.060.260.061.400.781.13
SD0.310.290.150.050.590.960.51
[49]5.000.200.200.200.205.005.00
[50]0.501.501.000.105.003.001.50
In comparison to similar metal levels in other areas of Egypt and around the world, it is noteworthy that the average levels of most heavy metals (e.g., Pb, Cu, Mn, Ni, Zn, Al, and Fe) in the investigated drain water are higher than those reported in Lake Manzala and the Nile River, Egypt [1,20], East Africa, Tanzania, Iran, Indonesia, and Kosovo [51,52,53,54,55] (Table 2). Specifically, Pb levels (0.41 mg/L) in the drain water samples are higher than 0.004–0.33 mg/L [1,20], and lower than 0.50–395.70 mg/L [1,20] (Table 2). Cu levels (0.207 mg/L) in the drain water are higher than 0.01–0.08 mg/L [1,20,21,26,51,53,54,56], and lower than 0.47–215.50 mg/L [4,10,55] (Table 2). Mn levels (0.23 mg/L) in the drain water are higher than 0.01–0.10 mg/L [20,21,49], and lower than 0.45–338.70 mg/L [10,26,55,56] (Table 2). Ni levels (0.07 mg/L) in the drain water are higher than 0.01–0.03 mg/L [4,20,21,26,51], and lower than 0.48–0.82 mg/L [55,56] (Table 2). Zn levels (1.13 mg/L) in the drain water are higher than 0.01–0.80 mg/L [1,4,15,20,21,26,51,52,53,54,55,56], and lower than 124.20 mg/L [10]. Al levels (1.05 mg/L) in the drain water are higher than 0.29 mg/L [26], and lower than 1.75–9.06 mg/L (Table 2). While Fe levels (1.16 mg/L) are higher than 0.03–1.10 mg/L [1,4,20,26,51,53,55], and lower than 1.75–9.06 mg/L [21,56] (Table 2).
Table 2. Average concentrations of heavy metals (mg/L) in the studied water samples compared to those of national and international studies.
LocationPbCuMnNiZnAlFeReference
Bahr El-Baqar drain, Egypt0.410.200.230.071.131.051.16This study
Bahr El-Baqar drain, Egypt396216339 124 [10]
Bahr El-Baqar drain, Egypt 0.010.560.010.010.290.31[26]
Lake Manzala, Egypt0.010.01 0.01 0.03[1]
Lake Manzala, Egypt 0.63 0.010.32 0.59[4]
Lake Manzala, Egypt 0.050.020.030.48 1.75[21]
Nile River, Egypt0.030.030.160.020.06 1.09[20]
El-Kharja, Egypt0.330.080.900.820.427.949.06[56]
Badovci Lake, Kosovo0.010.030.100.010.010.650.99[51]
Lake Victoria, East Africa0.01 0.02 [52]
Dar es Salaam, Tanzania0.500.10 0.80 1.10[53]
River Cihideung, Indonesia0.030.02 0.05 [54]
Tembi River, Iran1.130.470.450.480.20 0.56[55]

3.2. Heavy Metal Concentrations in Sediments

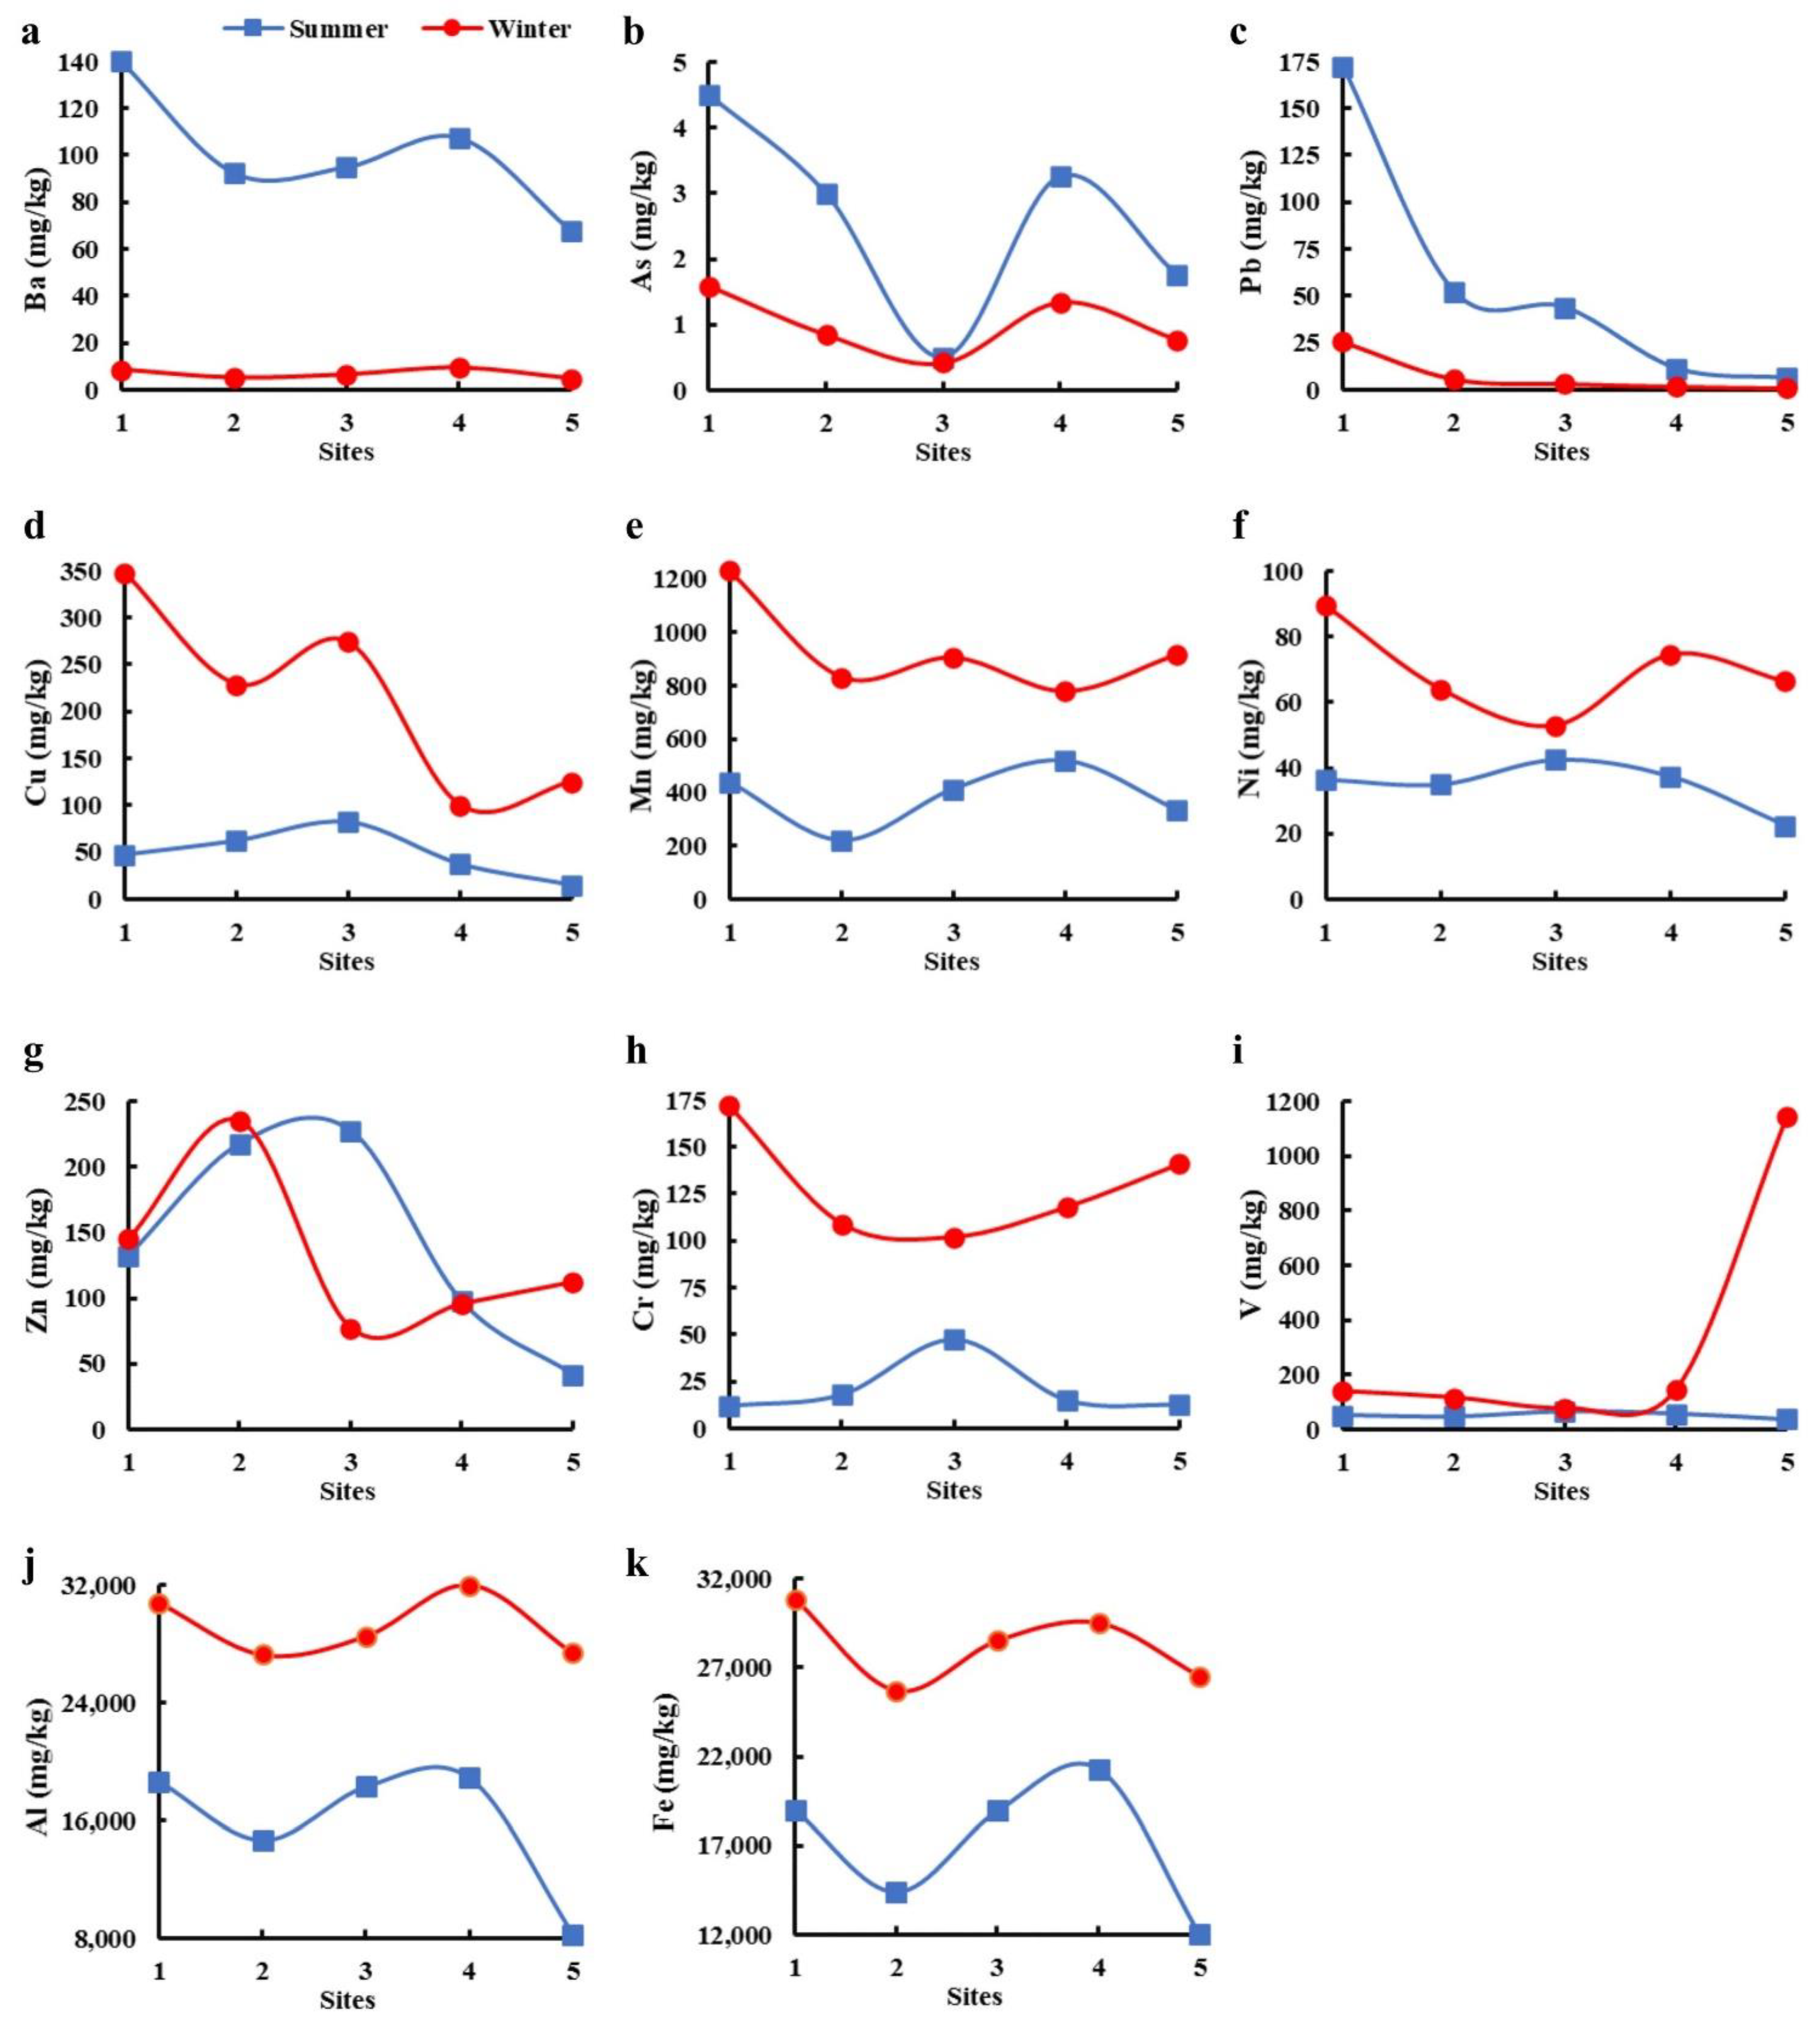
The analyzed heavy metals in the drain sediment samples have a decreasing order as follows: Fe > Al > Mn > V > Zn > Cu > Cr > Ba > Ni > Pb > As, with the average concentrations (mg/kg): 22,669, 22,485, 658.50, 188.33, 138.12, 132.10, 74.70, 53.38, 52.14, 32.36, and 1.79, respectively (Table 3). The spatiotemporal variation of the heavy metals along the study sites (S1–5) is depicted in Figure 3.
Barium (Ba) levels in the sediments ranged from 4.80 to 140.00 mg/kg with an average of 53.68 mg/kg (Table 3 and Figure 3a), which exceeds the Ba level in carbonate rocks (10 mg/kg). In Red Sea beach sediments, high concentrations of Ba were found ranging from 182 to 6776 ppm [57]. Arsenic (As), the most toxic and mobile metal, in the drain sediments ranged from 0.42 to 4.50 mg/kg (Figure 3b), which is higher than 0.34 mg/kg in the Nile sediments because of the drainage of fertilizers, detergents, and herbicides [29]. The As levels in the drain sediments were compared to higher levels of As (10–44 mg/kg) reported in Lake Burullus sediments, northwestern Nile Delta, Egypt [58], and up to 489 mg/kg in the sediments of India [59].
Table 3. Summary statistics of total concentrations of heavy metals (mg/kg) in Bahr El-Baqar drain sediments.
BaAsPbCuMnNiZnCrVAlFe
Mean53.681.7932.3613265952.1413874.7018822,48522,669
Min4.800.420.8515.0022322.5041.7512.0037.50828012,000
Max1404.50173348123089.40235172114632,00030,850
Med38.401.458.8791.2564847.7512274.7571.1523,10023,500
SD52.421.3652.5411332020.9867.4360.5333978306522
[60]--1025--12325---
[61]--300140-75300150---
[62]500127063-5020064130--
Pb levels in the sediments ranged from 0.85 to 172.50 mg/kg and an average of 32.36 mg/kg (Table 3 and Figure 3c), which is higher than (11.95 mg/kg) previously reported in the drain sediments [11], and comparable to those reported in the Nile sediments [29], however, it is lower than those recorded in soils around the drain; 506 mg/kg [10], 100 mg/kg [63], 67.12 mg/kg [27] (Table 4).
The range of Cu in the sediments is 15–348 mg/kg (Table 3 and Figure 3d), while the range of Mn is 223–1230 mg/kg (Table 3 and Figure 3e), which is marginally higher than (100–1200 mg/kg) in the Canadian soil [64]. Cu and Mn levels were compared to higher [10,14,27], and lower [22,26,63] values previously reported in Bahr El-Baqar drain water (Table 4).
Ni levels in the drain sediments varied from 22.50 to 89.40 mg/kg (Table 3 and Figure 3f), whereas Zn levels varied from 42 to 235 mg/kg (Figure 3g) and chromium (Cr) levels ranged from 12 to 172 mg/kg (Figure 3h). Higher Ni, Cr, and Zn levels were reported in the drain soil [27], and lower levels were also reported [11,26] (Table 2).
Vanadium (V) levels in the drain sediments varied from 37 to 1146 mg/kg with an average of 188.33 mg/kg (Table 3 and Figure 3i), which highly exceeds the typical V (20–150 mg/kg) in sediments, and (13.62–107.90 mg/kg) in Lake Manzala sediments [21], and the typical V concentration in sediments (20–150 mg/kg) [65], but lower than (2600 mg/kg) in China’s soil [66].
Al in the drain sediments has a range of 8280–32,000 mg/kg, and an average of 22,485 mg/kg (Table 3 and Figure 3j), compared to low levels (3247 mg/kg) previously reported [26] (Table 4). Fe in sediments has a range of 12,000–30,850 mg/kg, and an average of 22,669 mg/kg (Table 3 and Figure 3k), compared to higher (35,744 mg/kg) [27], and lower Fe levels (2665–3400 mg/kg) reported in the drain soil/sediments [11,26] (Table 4).
The results showed high spatiotemporal variability for Ba, As and Pb for the summer sediment samples (Figure 3a–c), where S1 (upstream) indicated the highest levels, and the lowest values were detected at S5 (downstream). The high spatiotemporal variability of Cu, Mn, Ni, Cr, V, Al, and Fe was observed in the winter sediment samples (Figure 3d–k). Most metals in the drain sediments have a northward decreasing trend (Figure 3), except for V, the highest value recorded in S5 at the drain outlet south of Lake Manzala (Figure 3i).
In comparison to similar metal levels in other areas in Egypt and worldwide, the average levels of most metals in the investigated sediments exceed those reported in sediments of Lake Manzala [1,21], El-Kharja, Egypt [56], Hurghada, Red Sea, Egypt [67]; Lake Victoria, East Africa [52]; Ghana [68]; and Tempi River, Iran [55], however, below those detected in sediments of the Nile River, Egypt [29], and Kosovo [51] (Table 4).
Table 4. Average concentrations of heavy metals (mg/kg) in the studied sediments compared to those of national and international studies.
LocationPbCuMnNiZnCrAlFeReference
Bahr El-Baqar drain, Egypt32.3610947435.4369.3164.6222,48522,669This study
Bahr El-Baqar drain, Egypt 59.3725023.8410134.7732472665[26]
Bahr El-Baqar drain, Egypt10032.50158 23.50 [63]
Bahr El-Baqar drain, Egypt67.12168 102194178 35,744[27]
Bahr El-Baqar drain, Egypt43.09123 67.83133112 [14]
Bahr El-Baqar drain, Egypt36.6465.7058.9873.2290.56107 47.45[22]
Bahr El-Baqar drain, Egypt506180933 218 [10]
Bahr El-Baqar drain, Egypt11.95 21.38 10.96 3399[11]
Lake Manzala, Egypt21.3917.50 29.0833.14 343[1]
Lake Manzala, Egypt 32.9466829.0054.9241.22 13,564[21]
Nile sediments, Egypt41.0510.40128815.57114110 56,059[29]
El-Kharja, Egypt3.434.171241503.574.85174175[56]
Hurghada, Egypt18.429.6531.898.1621.8 30.35[67]
Lake Victoria, East Africa0.45 1.580.16 [52]
Dar es Salaam, Tanzania2274178 3071 27,966[53]
Bontanga Reservoir, Ghana 0.1111.69 0.090.65 263[68]
Tembi River, Iran18251.5040987.8035.0042.00 232[55]
Lake Badovci, Kosovo16761.2066030512227617,00219,084[51]
Coromande Coast, India49.6276.45 27.9878.76110 7144[69]

3.3. Statistical Correlations

3.3.1. Pearson Correlations

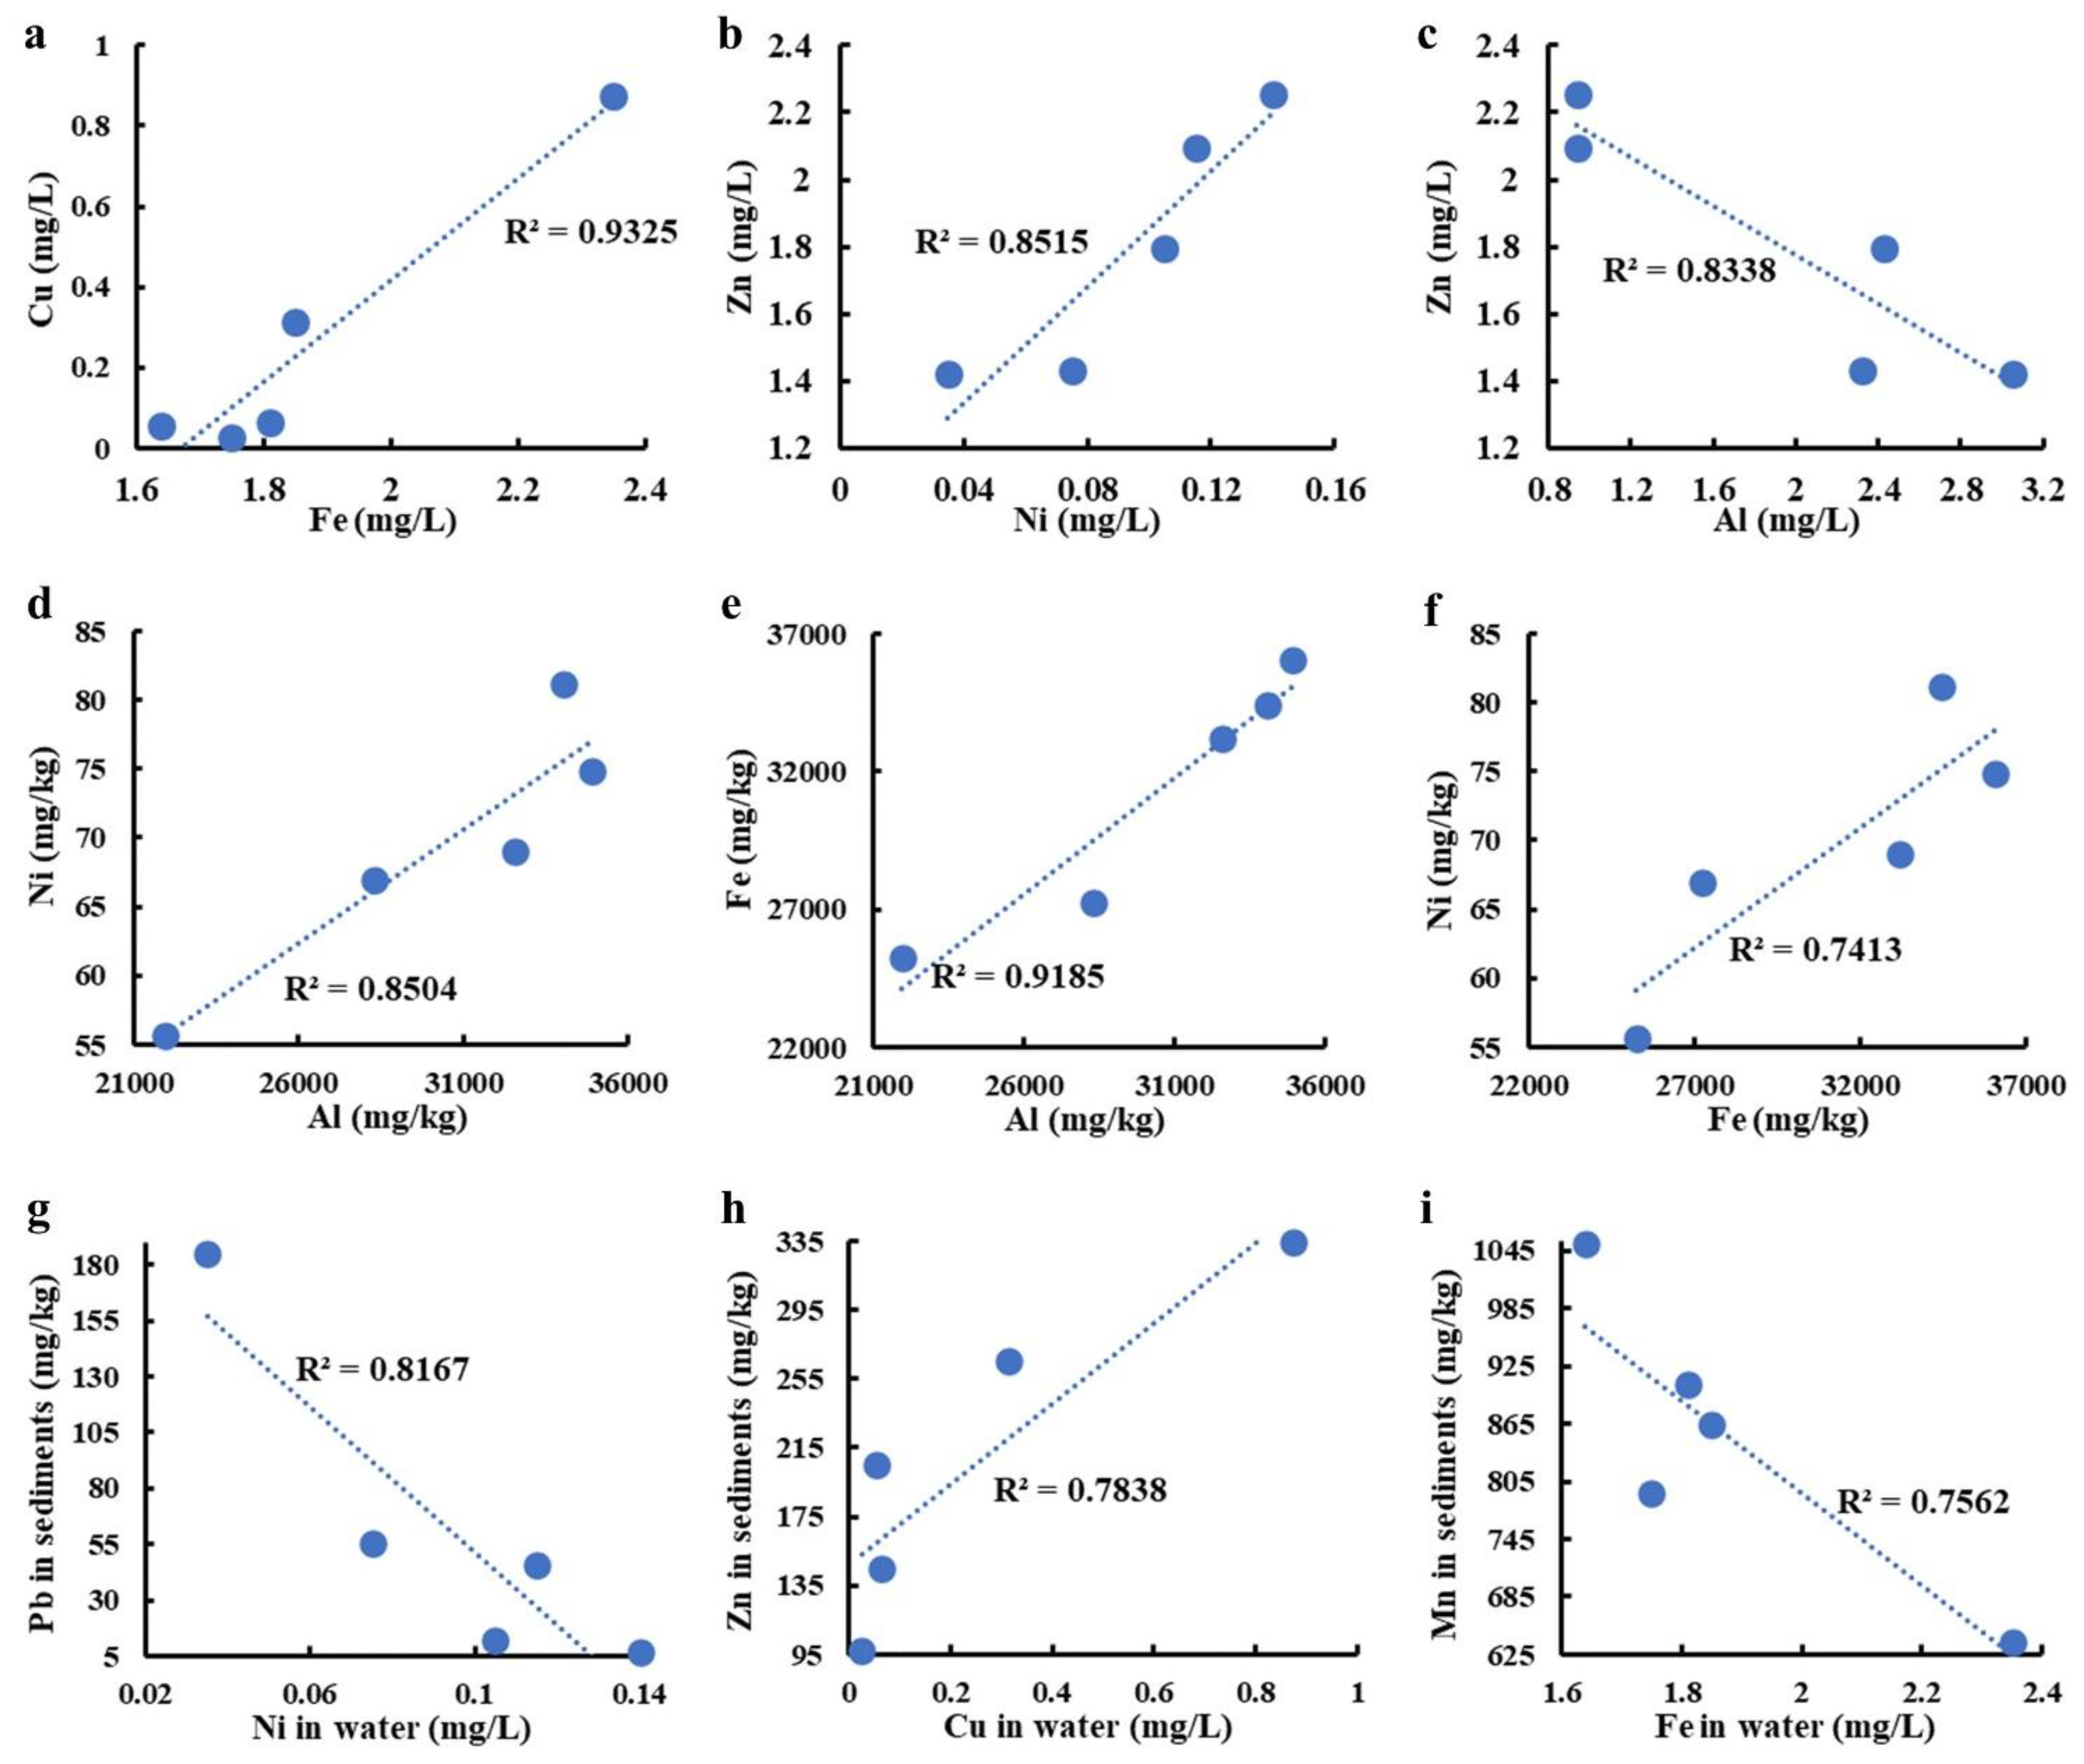
Significant Pearson-coefficient correlations between heavy metals in the studied drain water and sediments were represented in Figure 4. In water samples, Cu is positively correlated with Fe (R2 = 0.93; p < 0.01; Figure 4a), which is comparable to the correlation between Cu and Fe in sediments of Lake Manzala [1]. The correlation between Ni and Zn is also high (R2 = 0.85; p < 0.05; Figure 4b), whereas the correlation between Zn and Al is negative (R2 = 0.83; p < 0.05; Figure 4c).
In the drain sediments, Ni (R2 = 0.85) and Fe (R2 = 0.91) exhibit substantial positive correlations (p < 0.05) with Al (Figure 4d,e), while Ni shows a moderately positive correlation with Fe (R2 = 0.74, Figure 4f). In addition, Cu in water was positively correlated with Zn (R2 = 0.78; p < 0.05) in sediments (Figure 4h), but Ni in water was negatively correlated with Pb (R2 = 0.81; p < 0.05) in sediments (Figure 4g). Similarly, Mn in sediments and Fe in water exhibit a moderately negative correlation (R2 = 0.75; p < 0.05; Figure 4i). It was found that Pb and Mn in the water and Cu in sediment samples have no discernible relationships with other metals.

3.3.2. PCA Analysis

PCA is frequently used together with correlation analysis and is considered a useful tool to identify and evaluate potential sources of metals [5,22,28,31,32,33,67]. The PCA results that are shown in Figure 5, confirm those obtained from the Pearson correlation between the studied heavy metals in the drain water and sediments.
In water samples, 83.6% of the total variance of the data was explained by the first (PC1) and second (PC2) principal components. PC1 explained 47.1% of the cumulative variance and significantly and positively correlated with Pb, Ni, and Zn. PC2 explained 36.5% of the cumulative variance and showed highly positive loadings for Cu, Mn, and Fe (Figure 5a). Additionally, Pb loadings were high in the third component (PC3), which explained 14.55% of the cumulative variance, and the fourth component (PC4) accounted for 1.85% of the cumulative variance and had significant loadings of Ni and Al. PCA analysis of the investigated metals in water revealed highly significant correlations between Mn, Ni, Pb, and Zn on one hand, and Cu, and Fe on the other hand, while Al showed no correlations with other metals (Figure 5a).
In sediments, PC1 and PC2 explained nearly 75% of the cumulative data variance (Figure 5b). PC1 explained 56.44% of the cumulative data variance and showed high positive loadings of Ba, Ni, Zn, Fe, and Al. PC2 accounted for 18.55% of the cumulative data variance and had a high positive loading of Mn and V (Figure 5b). PC3 explained 14.60% of the data’s cumulative variance and revealed significant positive loadings of Cu and Cr, whereas PC4 explained 10.41% of the cumulative data variance and showed substantial positive loadings of As and Pb. PCA applied to metals in the drain sediments indicated highly significant correlations between Ba, As, Cu, Cr, Mn, Ni, Pb, Zn, Fe, and Al, however, V showed no correlations with other metals (Figure 5b). The metals that are positively correlated with each other most likely come from a common source [31]. The PCA revealed that anthropogenic activities may influence the sources of Ba, As, Cu, Cr, Mn, Ni, Pb, Zn, Fe, and Al in sediments, while V would come from different anthropogenic sources (Figure 5b).

3.4. Metal Pollution Indices in the Drain Sediments

3.4.1. Enrichment Factor (EF)

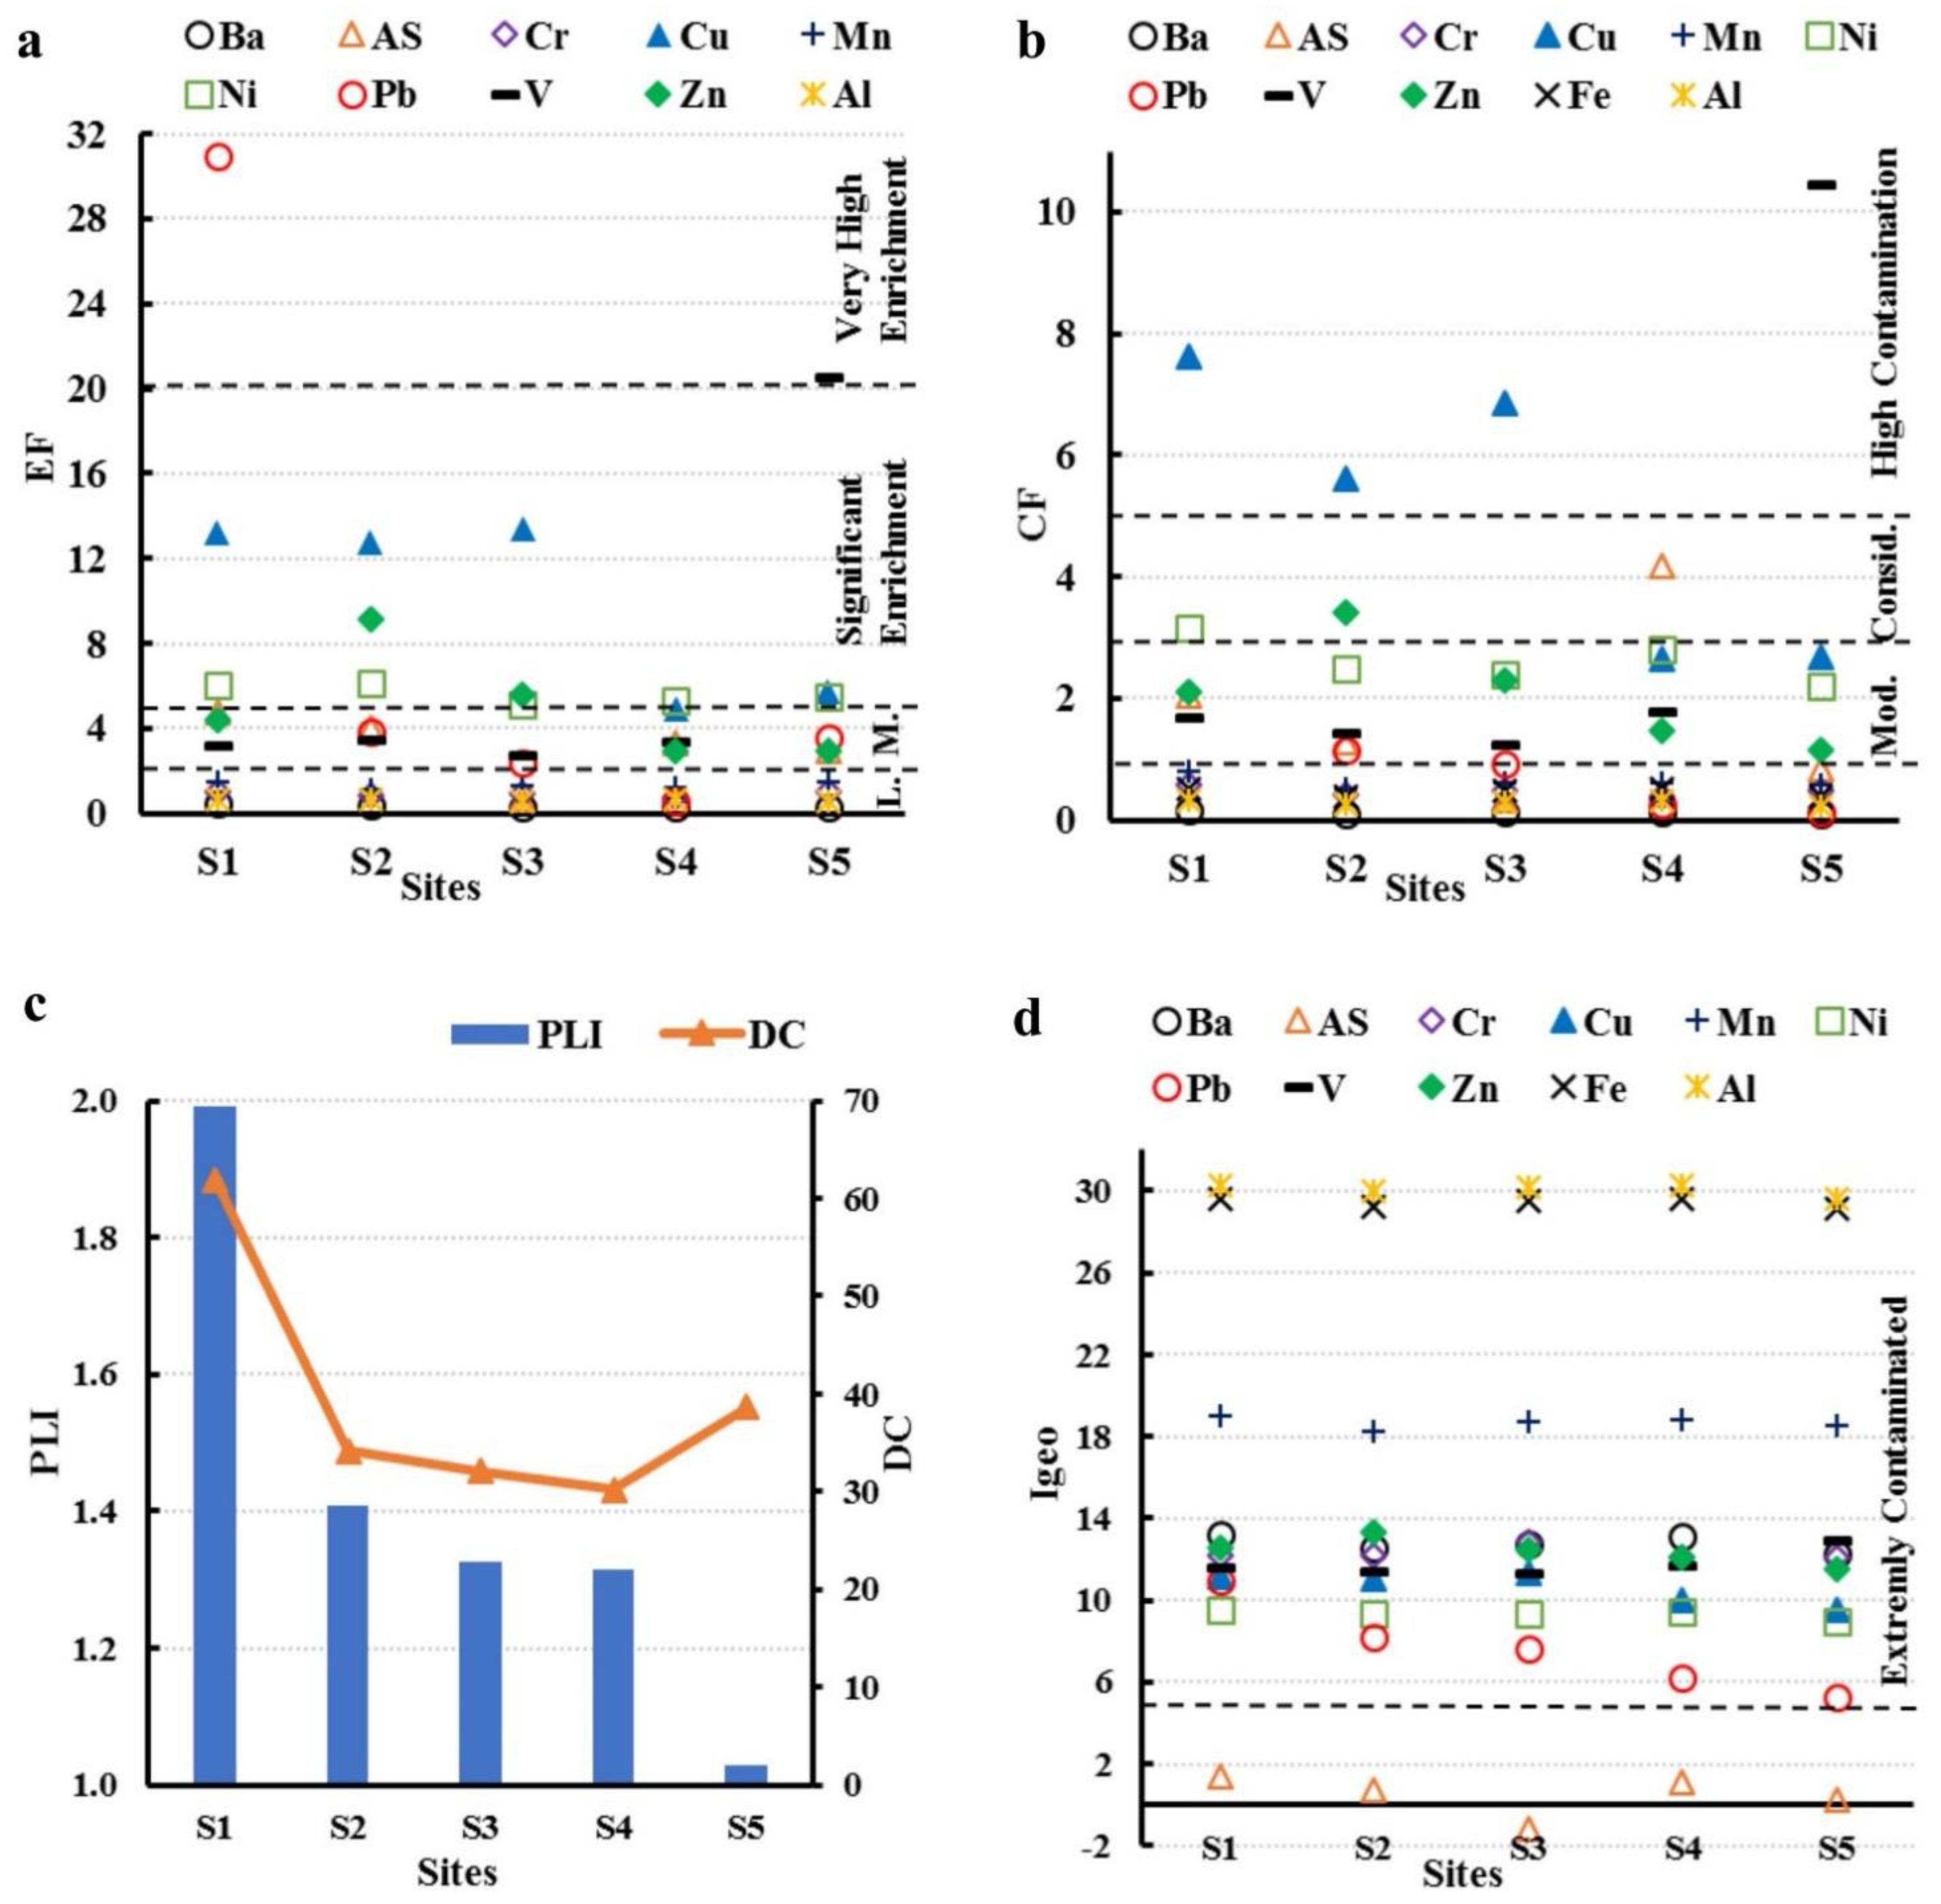
The average EFs varied from 0.36 to 10.02 and decreased in the following sequence: Cu (10.02) > Pb (7.68) > V (6.65) > Ni (5.62) > Zn (5.01) > As (3.14) > Mn (1.31) > Cr (0.92) > Al (0.60) > Ba (0.36) (Table 5 and Figure 6a). The average EFs of Cu, Pb, V, Ni, and Zn show moderate to significant enrichment by agricultural, urban, and industrial discharges into the drain [5], whereas the EFs of Ba, Cr, Mn, and Al show low enrichment (EF < 1.50), indicating that these metals come mostly from crustal sources (Figure 6a).

3.4.2. Contamination Factor (CF)

The average CFs varied from 0.12 to 5.08 and decreased in the following sequence: Cu (5.08) > V (3.33) > Pb (2.89) > Ni (2.61) > Zn (2.09) > As (1.72) > Mn (0.62) > Cr (0.47) > Fe (0.45) > Al (0.28) > Ba (0.12) (Table 6 and Figure 6b). The average CFs of Ba, Cr, Mn, Fe, and Al in the drain sediments show low contamination (CF < 1), and the mean CFs of As, Pb, Ni, and Zn show moderate contamination (1 ≤ CF < 3), whereas those of Cu and V show considerable contamination (3 ≤ CF < 6) (Figure 6b).

3.4.3. Pollution Load Index (PLI) and Degree of Contamination (DC)

The PLI levels in the studied sediments ranged from 0.34 to 1.07 with an average of 0.70, indicating that the drain sediment quality has low, baseline, and progressive contamination (PLI > 1) (Table 6 and Figure 6c). The DC values varied from 5.31 to 33.92 with an average of 19.69 (Table 6 and Figure 6c), indicating low (DC < n), moderate, and a considerable degree of contamination (2n ≤ DC < 4n, where n = 11) (Figure 6c).

3.4.4. Index of Geo-Accumulation (Igeo)

The average Igeo values in the drain sediments, according to Müller’s classification [44] and their corresponding contamination intensity, varied from 0.44 to 30.05 and decreased in the following sequence: Al (30.05) > Fe (29.43) > Mn (18.65) > Ba (12.81) > Zn (12.39) > Cr (12.27) > V (11.83) > Cu (10.61) > Ni (9.33) > Pb (7.64) > As (0.44) (Table 7 and Figure 6d). The Igeo of all investigated metals (Ba, Cr, Cu, Mn, Ni, Pb, V, Zn, Fe, and Al) exhibited class 7 (Igeo >5) indicating extremely contaminated sediments; however, As exhibited class 1 (Igeo 0–1) indicating uncontaminated to moderately contaminated sediments (Figure 6d).

4. Discussion

4.1. Heavy Metal Pollution Levels in the Drain Water and Sediments

The study findings revealed that Fe has the highest average level (1.16 mg/L) in the investigated water samples, while Ni has the lowest level (0.07 mg/L). These results agree with those of; Fe > Zn > Cu > Ni > Mn [21], and Fe > Zn > Pb > Cu [1] in the water of Lake Manzala, but not with; Ni > Pb > Fe > Zn > Mn > Cu [46], and Pb > Mn > Cu > Zn [10] in Bahr El-Baqar drain water (Table 2). Manganese sources are both natural (e.g., geologic weathering), and anthropogenic (e.g., coal mining, bitumen extraction, steel manufacturing, pulp, and paper mills, and wastewater and sewage discharge) [64]. The highest Mn level (0.55 mg/L) in water was recorded in S3 (Figure 2c), due to fertilizer-rich agricultural drainage water and the nearby fish farms [62]. Both Pb and Cu displayed similar spatiotemporal trends (Figure 3a,b). Similarly, in S3, summer water samples had the highest Mn level (0.55 mg/L), whereas winter samples had lower Mn levels on average of 0.23 mg/L (Figure 2c). The highest seasonal levels of Pb and Cu were detected in water samples from S3 (in the middle of the drain), this site has dense agricultural activities and dense traffic within a highly populated area, whereas the lowest levels were observed at S5 (at the drain end south of Lake Manzala). Spatiotemporally, low Ni levels were detected in the summer samples (< 0.05 mg/L), compared to higher levels in winter samples at S5 (Figure 2d). Additionally, the average Zn level (1.13 mg/L; Table 1) is five times higher than the U.S. EPA maximum concentration for irrigation (0.20 mg/L).
The analyzed heavy metals in the drain sediment samples showed that Fe has the highest levels (22,669 mg/kg), followed by Al (22,485 mg/kg), while As has the lowest levels (1.79 mg/kg) (Table 3 and Figure 3). High levels of Ba were detected in the drain sediments at S1 may come from industrial wastes dumped into the Qalubiya drain by the oil companies in Shubra El-Khema city and the industrial area in Obour city, north Cairo. Ba could be naturally released into the environment from the weathering of carbonate rocks and minerals. While most anthropogenic releases of Ba come from industrial processes such as oil exploration [57]. In Red Sea beach sediments, high concentrations of Ba were found ranging from 182 to 6776 mg/kg [57]. Mn cycling in sediment is affected by the oxygen content of the overlying water, the penetration of the oxygen into the sediments, and the benthic organic carbon supply [64]. The highest V level (1146 mg/kg) was recorded in S5 near Lake Manzala (Figure 3i), this excessive V is hazardous, carcinogenic, and should be managed similarly to Pb, As, and Hg [66]. The extremely high Fe and Al levels in the drain sediments are referred to as excessive drainage of domestic, agricultural, and industrial wastes into Bahr El-Baqar drain.
The average levels of Ba and As (53.68 and 1.79 mg/kg, respectively) in the drain sediments are below the recommended values for Canadian soil quality (500 and 12 mg/kg, respectively) [60]. While, levels of Pb and Zn (32.68 and 138.12 mg/kg, respectively) exceed the U.S. EPA permissible limits (10 and 123 mg/kg, respectively) in sediments [70]. Levels of Pb and Zn are below the European and Canadian soil quality standards [61,62] (Table 3). The average levels of Cu, Ni, and Cr (132.1, 52.14, and 74.7 mg/kg, respectively) exceed the U.S. EPA limits (25 mg/kg) and Canadian soil quality guidelines (63, 50, and 64 mg/kg, respectively) [62,70] (Table 3). The average V level in the drain sediments (188.33 mg/kg) exceeds the Canadian soil quality guideline (130 mg/kg) [62] (Table 3), while the average Fe level (22,669 mg/kg) is about 75-fold higher than the WHO/FAO safe limit (300 mg/kg) of iron in soil [71]. Despite As having the lowest values in sediments, it is the most toxic and mobile inorganic metal, and higher As levels may cause arsenic-borne diseases (e.g., melanosis, keratosis, and skin cancer) [59]. It is reported that elevated values of Pb, Cu, Mn, and Zn in soils nearby Bahr El-Baqar drain were directly connected to the long-term use of this contaminated water for irrigation [6,10].

4.2. Metal Pollution Indices in the Drain Sediments

The calculated five metal pollution indices EF, CF, PLI, DC, and Igeo are reported in Table 5, Table 6 and Table 7, while the average values of the indices along the sediment study sites (S1–5) were illustrated in Figure 6. The maximum EF was 60.26 for Pb in summer samples at site-S1 (near the beginning of the drain), followed by 38.27 for V in winter samples at S5 south Lake Manzala (Table 6). While the lowest EF was 0.02 for Ba at S2 and S5 (Table 5 and Figure 6a). The EFs in the examined drain sediments (0.36–10.02) are greater than the EFs of 1.30–3.70 reported for Lake Manzala sediments [21] and less than 5 for Lake Nasser sediments [34].
The calculated CFs (0.12 to 5.08) are consistent with those reported in soils near Kitchener drain, Northern Nile Delta, Egypt [5]. Furthermore, the CFs of Pb in this study (0.03–22.90) are higher than (0.17–3.28) in Lake Manzala sediments [1] and <1 in Lake Nasser sediments [34]. It is noted that some sites of Pb (CF: 22.90 at S1) and V (CF: 20.28 at S5) show very high contamination (CF > 6) (Table 7). In comparison to summer samples, most CFs in winter samples displayed increased contamination (Table 6 and Figure 6b). Site S1 near the beginning of the drain had the highest PLI and DC values (1.07 and 33.92, respectively), and S5 near the drain outlet south of Lake Manzala had the lowest PLI and DC values (0.34 and 5.31, respectively) (Table 6 and Figure 6c).
The highest Igeo was 30.67 for Al at S4 near Bahr El-Baqar drain’s outlet, followed by 29.94 for Fe at S1 from the Qalubiya drain (Figure 6d), and the lowest Igeo was −1.25 for As at S3 in the central part of Bahr El-Baqar drain (Table 7 and Figure 6d). Moreover, the Igeo in sediments highly exceeds those previously reported in sediments of Bahr El-Baqar drain (class 0) [11], Kitchener drain (class 1) [5], and Lake Nasser (class 0) [34].

4.3. Anthropogenic Contamination Impacts on Lake Manzala Ecosystem with Mitigation Plans

Anthropogenic activities with variable municipal, sewage, agricultural, and industrial wastes through the five drains were the primary source of heavy metal pollution in Lake Manzala [36]. Recently, the health risk assessment studies of the water and sediment quality in Lake Manzala exhibited an alarming concern for the population and fishermen’s health risk from intake of the heavy metals through fish consumption [72]. Illegal fishpond activities inside Lake Manzala have negatively impacted the functions and biodiversity of the lake ecosystem and consequently threatened the lake’s sustainability. Discharging massive quantities of nutrients from the fishponds caused eutrophication and excessive plant growth in the lake and reduce the free fishing areas and the lake’s productivity [37]. Accordingly, the current and continuous dredging activities in Lake Manzala will remove these illegal fishponds and mud islands to improve its water flow and quality and safeguard the lake ecosystem.

5. Conclusions

This study assessed the spatiotemporal variability and pollution grades of heavy metals in water and sediments of Bahr El-Baqar drain, Eastern Nile Delta, Egypt. The average levels of heavy metals (mg/L) in the drain water followed the order: Fe > Zn > Al > Pb > Mn > Cu > Ni and were compared to values of related metals in other research studies conducted in Egypt and around the world. Spatiotemporally, Mn, Al, and Fe showed high spatiotemporal variations in summer samples, while Pb, Cu, Ni, and Zn indicated high variability in winter samples. The average level of Zn (1.13 mg/L) in the drain water samples exceeds about five times the U.S. EPA maximum concentration for irrigation (0.20 mg/L) because of the long-term and various domestic and industrial waste discharge.
The drain sediments were highly contaminated with heavy metals (mg/kg) and followed the order: Fe > Al > Mn > V > Zn > Cu > Cr > Ba > Ni > Pb > As and were compared to values of similar metals in Egypt and worldwide. Spatiotemporally, S1 (Qalubiya drain) had the highest metal contents, including Ba, As, Pb, Cu, Mn, Ni, and Cr, because of wastewater discharges from domestic and industrial districts north of Cairo. While S2 (Belbies drain, near Zagazig city) had the highest value of Zn, and S5 (near the drain outlet, south of Port Said city) had the highest value of V in the studied sediments.
The results of PCA analysis supported those obtained from the Pearson correlation. In water samples, PCA revealed a highly significant correlation between Mn, Ni, Pb, and Zn in one group, and between Cu and Fe in a second group (PC1 and PC2 exhibited 83.60% of cumulative data variance). In sediments, PCA showed strong positive loadings of Ba, Ni, Zn, Fe, Al, Mn, and V (PC1 and PC2 accounted for 75% of the cumulative data variance). The heavy metals in sediments would be migrating together and coming from similar anthropogenic sources which are depicted from their positive and significant correlation.
The calculated pollution indices indicated high loadings of heavy metals in sediments. EFs revealed low, moderate-to-significant enrichment, whereas CFs showed low, moderate, and considerable contamination. PLI indicated low, baseline, and progressive contamination. DC indicated low, moderate, and considerable degrees of contamination. Igeo of all investigated metals (except for As: class 1) indicated extremely contaminated sediments (class 7).
From significant efforts that are being made by various Egyptian agencies to prevent pollution of Bahr El-Baqar drain and reduce its threats to the environment and public health, the Bahr El-Baqar water treatment plant was constructed and began operating in September 2021 with a productivity of 64.80 m3/s. The treated water will be transformed to reclaim new desert lands in Sinai [18].

Author Contributions

Conceptualization, A.A.; methodology, A.A.; software, A.A. and F.A.; formal analysis, A.A.; resources, A.A., F.A., and S.A.A.; data curation, A.A. and A.E.; writing—original draft preparation, A.A. and A.E; writing—review and editing, A.A., A.I.A. and F.A.; supervision, A.A. and A.I.A. All authors are contributed equally to this work. All authors have read and agreed to the published version of the manuscript.

Funding

This research was funded by Abdullah Alrushaid Chair for Earth Science Remote Sensing Research at King Saud University, Riyadh, Saudi Arabia.

Institutional Review Board Statement

Not applicable.

Informed Consent Statement

Not applicable.

Data Availability Statement

The data that support the findings of this study are available on request from the corresponding author.

Acknowledgments

The authors extend their appreciation to the Abdullah Alrushaid Chair for Earth Science Remote Sensing Research for funding.

Conflicts of Interest

The authors declare no conflict of interest.

References

  1. Zahran, M.A.E.; El-Amier, Y.A.; Elnaggar, A.A.; Mohamed, H.A.E.; El-Alfy, M.A. Assessment and distribution of heavy metals pollutants in Manzala Lake, Egypt. J. Geosci. Environ. Prot. 2015, 3, 107–122. [Google Scholar] [CrossRef] [Green Version]
  2. Ahmad, W.; Alharthy, R.D.; Zubair, M.; Ahmed, M.; Hameed, A.; Rafique, S. Toxic and heavy metals contamination assessment in soil and water to evaluate human health risk. Sci. Rep. 2021, 11, 17006. [Google Scholar] [CrossRef]
  3. Mannaa, A.A.; Khan, A.A.; Haredy, R.; Al-Zubieri, A.G. Contamination evaluation of heavy metals in a sediment core from the Al-Salam Lagoon, Jeddah Coast, Saudi Arabia. J. Mar. Sci. Eng. 2021, 9, 899. [Google Scholar] [CrossRef]
  4. Ismail, A. Environmental damage caused by wastewater discharge into the Lake Manzala in Egypt. Am. J. Biosci. Bioeng. 2017, 5, 141. [Google Scholar] [CrossRef]
  5. Aitta, A.; El-Ramady, H.; Alshaal, T.; El-Henawy, A.; Shams, M.; Talha, N.; Elbehiry, F.; Brevik, E.C. Seasonal and spatial distribution of soil trace elements around Kitchener Drain in the Northern Nile Delta, Egypt. Agric 2019, 9, 152. [Google Scholar] [CrossRef] [Green Version]
  6. Abd-Elaty, I.; Pugliese, L.; Zelenakova, M.; Mesaros, P.; El Shinawi, A. Simulation-based solutions reducing soil and groundwater contamination from fertilizers in arid and semi-arid regions: Case study the Eastern Nile Delta, Egypt. Int. J. Environ. Res. Public Health 2020, 17, 9373. [Google Scholar] [CrossRef]
  7. He, Z.L.; Yang, X.E.; Stoffella, P.J. Trace elements in agroecosystems and impacts on the environment. J. Trace Elem. Med. Biol. 2005, 19, 125–140. [Google Scholar] [CrossRef]
  8. Briffa, J.; Sinagra, E.; Blundell, R. Heavy metal pollution in the environment and their toxicological effects on humans. Heliyon. 2020, 6, e04691. [Google Scholar] [CrossRef]
  9. Abdel-Shafy, H.I.; Raouf, O.A. Water issue in Egypt: Resources, pollution and protection endeavors. Cent. Eur. J. Occup. Environ. Med. 2002, 8, 3–21. [Google Scholar]
  10. Abdel-Azeem, A.M.; Abdel-Moneim, T.S.; Ibrahim, M.E.; Hassan, M.A.A.; Saleh, M.Y. Effects of long-term heavy metal contamination on diversity of terricolous fungi and nematodes in Egypt—A case study. Water. Air. Soil Pollut. 2007, 186, 233–254. [Google Scholar] [CrossRef]
  11. El-Alfy, M.A.; El-Amier, Y.A.; El-Eraky, T.E. Land use/cover and eco-toxicity indices for identifying metal contamination in sediments of drains, Manzala Lake, Egypt. Heliyon 2020, 6, e03177. [Google Scholar] [CrossRef]
  12. Abd-Elaty, I.; Zelenakova, M.; Straface, S.; Vranayová, Z.; Abu-hashim, M. Integrated modelling for groundwater protection process techniques. Water 2019, 11, 2321. [Google Scholar] [CrossRef] [Green Version]
  13. Saad, A.K. Environmental Hydrogeologic Impacts of Ground Water Withdrawal in the Eastern Nile Delta Region with Emphasis on Groundwater Pollution Potential. Ph.D. Thesis, Institute of Environmental Studies, Ain Shams University, Cairo, Egypt, 1997. [Google Scholar]
  14. Omran, E.E.; Abd El Razek, A.A. Mapping and screening risk assessment of heavy metals concentrations in soils of the Bahr El-Baker Region, Egypt. J. Soil Sci. Environ. Manag. 2012, 3, 182–195. [Google Scholar]
  15. Elbana, T.A.; Bakr, N.; George, B.; Elbana, M. Assessment of marginal quality water for sustainable irrigation management: Case study of Bahr El-Baqar Area, Egypt. Water. Air. Soil Pollut. 2017, 228, 214. [Google Scholar] [CrossRef]
  16. Abdel-Fattah, M.K.; Helmy, A.M. Assessment of water quality of wastewaters of Bahr El-Baqar, Bilbies and El-Qalyubia Drains in East Delta, Egypt for irrigation purposes. Egypt. J. Soil Sci. 2015, 55, 287–302. [Google Scholar]
  17. Stahl, R.; Ramadan, A.B.; Pimpl, M. Bahr El-Baqar Drain System / Egypt Environmental Studies Part I: Bilbeis Drain /Bahr El-Baqar Drain; Karlsruher Institut für Technologie: Karlsruhe, Germany, 2009. [Google Scholar]
  18. Raslan, A.M.; Riad, P.H.; Hagras, M.A. 1D hydraulic modelling of Bahr El-Baqar new channel for northwest Sinai reclamation project, Egypt. Ain Shams Eng. J. 2020, 11, 971–982. [Google Scholar] [CrossRef]
  19. Karaman, H.G. Identifying uncertainty of the mean of some water quality variables along water quality monitoring network of Bahr El Baqar drain. Water Sci. 2014, 27, 48–56. [Google Scholar] [CrossRef] [Green Version]
  20. Abdel-Satar, A.M.; Ali, M.H.; Goher, M.E. Indices of water quality and metal pollution of Nile River, Egypt. Egypt. J. Aquat. Res. 2017, 43, 21–29. [Google Scholar] [CrossRef]
  21. Elmorsi, R.R.; Abou-El-Sherbini, K.S.; Mostafa, G.; Hamed, M.A. Distribution of essential heavy metals in the aquatic ecosystem of Lake Manzala, Egypt. Heliyon 2019, 5, e02276. [Google Scholar] [CrossRef] [Green Version]
  22. Omran, E.E. Inference model to predict heavy metals of Bahr El Baqar soils, Egypt using spectroscopy and chemometrics technique. Model. Earth Syst. Environ. 2016, 2, 1–17. [Google Scholar] [CrossRef] [Green Version]
  23. Hagras, A.E.; Elbaghdady, A.M.; Gouda, A.M.R. Assessment of water quality and heavy metals in water, sediments, and some organs of African Catfish (Clarias gariepinus) in El-Serw drain, Nile Delta, Egypt. Int. J. Environ. 2018, 7, 124–141. [Google Scholar]
  24. Abowaly, M.E.; Belal, A.A.A.; Abd Elkhalek, E.E.; Elsayed, S.; Abou Samra, R.M.; Alshammari, A.S.; Moghanm, F.S.; Shaltout, K.H.; Alamri, S.A.M.; Eid, E.M. Assessment of soil pollution levels in north Nile Delta, by integrating contamination indices, gis, and multivariate modeling. Sustainability 2021, 13, 8027. [Google Scholar] [CrossRef]
  25. Shokr, M.S.; El Baroudy, A.A.; Fullen, M.A.; El-beshbeshy, T.R.; Ramadan, A.R.; Abd El Halim, A.; Guerra, A.J.T.; Jorge, M.C.O. Spatial distribution of heavy metals in the middle Nile Delta of Egypt. Int. Soil Water Conserv. Res. 2016, 4, 293–303. [Google Scholar] [CrossRef] [Green Version]
  26. Badawy, R.K.; Abd El-Gawad, A.M.; Osman, H.E. Health risks assessment of heavy metals and microbial contamination in water, soil and agricultural foodstuff from wastewater irrigation at Sahl El-Hessania area, Egypt. J. Appl. Sci. Res. 2013, 9, 3091–3107. [Google Scholar]
  27. El-bady, M.S.M. Spatial distribution of some important heavy metals in the soils south of Manzala Lake in Bahr El-Baqar Region, Egypt. Nov. J. Eng. Appl. Sci. 2014, 2, 1–15. [Google Scholar]
  28. Baran, A.; Wieczorek, J.; Mazurek, R.; Urbański, K.; Klimkowicz-Pawlas, A. Potential ecological risk assessment and predicting zinc accumulation in soils. Environ. Geochem. Health 2018, 40, 435–450. [Google Scholar] [CrossRef]
  29. Abou El-Anwar, E.A. Assessment of heavy metal pollution in soil and bottom sediment of Upper Egypt: Comparison study. Bull. Natl. Res. Cent. 2019, 43, 180. [Google Scholar] [CrossRef] [Green Version]
  30. Barbieri, M. The importance of enrichment factor (EF) and geoaccumulation index (Igeo) to evaluate the soil contamination. J. Geol. Geophys. 2016, 5, 237. [Google Scholar] [CrossRef]
  31. El-Amier, Y.A.; El-Alfy, M.A.; Darwish, D.H.; Basiony, A.I.; Mohamedien, L.I.; El-Moselhy, K.M. Distribution and ecological risk assessment of heavy metals in core sediments of Burullus lake, Egypt. Egypt. J. Aquat. Biol. Fish. 2021, 25, 1041–1059. [Google Scholar] [CrossRef]
  32. Barik, S.S.; Prusty, P.; Singh, R.K.; Tripathy, S.; Farooq, S.H.; Sharma, K. Seasonal and spatial variations in elemental distributions in surface sediments of Chilika Lake in response to change in salinity and grain size distribution. Environ. Earth Sci. 2020, 79, 269. [Google Scholar] [CrossRef]
  33. Bahloul, M.; Baati, H.; Amdouni, R.; Azri, C. Assessment of heavy metals contamination and their potential toxicity in the surface sediments of Sfax Solar Saltern, Tunisia. Environ. Earth Sci. 2018, 77, 27. [Google Scholar] [CrossRef]
  34. Goher, M.E.; Farhat, H.I.; Abdo, M.H.; Salem, S.G. Metal pollution assessment in the surface sediment of Lake Nasser, Egypt. Egypt. J. Aquat. Res. 2014, 40, 213–224. [Google Scholar] [CrossRef] [Green Version]
  35. El-Ghazali, A.M.; Amer, A.; Mustafa, M.M. Proposed decision support system for reduction of total phosphorus in Lake Manzala. Egypt. Comput. Sci. J. 2015, 39, 56–70. [Google Scholar]
  36. Hereher, M. The Lake Manzala of Egypt: An ambiguous future. Environ. Earth. Sci. 2014, 72, 1801–1809. [Google Scholar] [CrossRef]
  37. Abd Ellah, R.G. Using single-beam bathymetric data technique to estimate dredging: A case study in Lake Manzala (Egypt). Arab. J. Geosci. 2022, 15, 1649. [Google Scholar] [CrossRef]
  38. APHA. Standard Methods for the Examination of Water and Wastewater, 23rd ed.; Baird, R.B., Eaton, A.D., Rice, E.W., Eds.; American Public Health Association (APHA); American Water Works Association (AWWA); Water Environment Federation (WEF): Washington, DC, USA, 2017. [Google Scholar]
  39. Haluschak, P. Laboratory Methods of Soil Analysis Canada-Manitoba Soil Survey. Methods of Soil Analysis. 2006; pp. 1–133. Available online: https://www.gov.mb.ca/agriculture/soil/soil-survey/pubs/laboratory_methods_of_soil_analysis.pdf (accessed on 1 October 2022).
  40. Oregioni, B.; Aston, S.R. The Determination of Selected Trace metals in Marine Sediments by Flameless/ Flam-Atomic Absorption Spectrophotometry; IAEA Monaco Laboratory Internal Report; IAEA Monaco Laboratory: Monaco City, Monaco, 1984; (cited from: Reference Methods for Marine Pollution Studies, United Nations Environment Programme, Switzerland. 1986, 38). [Google Scholar]
  41. Varol, M. Assessment of heavy metal contamination in sediments of the Tigris River (Turkey) using pollution indices and multivariate statistical techniques. J. Hazard. Mater. 2011, 195, 355–364. [Google Scholar] [CrossRef]
  42. Zhang, J.; Liu, C.L. Riverine composition and estuarine geochemistry of particulate metals in China—Weathering features, anthropogenic impact and chemical fluxes. Estuar. Coast. Shelf Sci. 2002, 54, 1051–1070. [Google Scholar] [CrossRef]
  43. Kabata-Pendias, A.; Mukherjee, A.B. Trace Elements from Soil to Human; Springer: Berlin/Heidelberg, Germany; New York, NY, USA, 2007. [Google Scholar]
  44. Hakanson, L. An ecological risk index for aquatic pollution control. A sedimentological approach. Water Res. 1980, 14, 975–1001. [Google Scholar] [CrossRef]
  45. Tomlinson, D.L.; Wilson, J.G.; Harris, C.R.; Jeffrey, D.W. Problems in the assessment of heavy-metal levels in estuaries and the formation of a pollution index. Helgoländer Meeresunters. 1980, 33, 566–575. [Google Scholar] [CrossRef] [Green Version]
  46. Müller, G. Die Schwermetallbelastung der sedimente des Neckars und seiner Nebenflusse Eine Bestandsaufnahme. Chem. Zeitung. 1981, 105, 157–164. [Google Scholar]
  47. Reimann, C.; Filzmoser, P.; Garrett, P.; Dutter, R. Statistical Dataanalysis Explained; John Wiley & Sons, Ltd.: Hoboken, NJ, USA, 2008; ISBN 978-0-470-98581-6. [Google Scholar]
  48. El-Sherbeny, G.A.A.; Ramadan, S.M. Biomonitring of drainage water quality by eichhornia crassipes (Mart.) solms in Bahr El-Baqar Drain, Egypt. Int. J. Bot. 2016, 12, 1–10. [Google Scholar] [CrossRef] [Green Version]
  49. U.S. EPA. Guidelines for Water Reuse; EPA/600/R-12/618; Office of Wastewater Management, U.S. Environmental Protection Agency: Washington, DC, USA, 2012. Available online: https://www.epa.gov/sites/default/files/2019-08/documents/2012-guidelines-water-reuse.pdf (accessed on 1 October 2022).
  50. EEL/4. Egyptian environmental protection law (EEL) No. 4 of 1994 and Its Amendments in 2009, Egypt. 1994. Available online: http://extwprlegs1.fao.org/docs/pdf/egy4984E.pdf (accessed on 1 October 2022).
  51. Malsiu, A.; Shehu, I.; Stafilov, T.; Faiku, F. Assessment of heavy metal concentrations with fractionation method in sediments and waters of the Badovci Lake (Kosovo). J. Environ. Public Health 2020, 2020, 3098594. [Google Scholar] [CrossRef]
  52. Ogoyi, D.O.; Mwita, C.J.; Nguu, E.K.; Shiundu, P.M. Determination of heavy metal content in water, sediment and microalgae from Lake Victoria, East Africa. Open Environ. Eng. J. 2011, 4, 156–161. [Google Scholar]
  53. Kacholi, D.S.; Sahu, M. Levels and health risk assessment of heavy metals in soil, water, and vegetables of Dar es Salaam, Tanzania. J. Chem. 2018, 2018, 1402674. [Google Scholar] [CrossRef]
  54. Effendi, H. River water quality preliminary rapid assessment using pollution index. Procedia Environ. Sci. 2016, 33, 562–567. [Google Scholar] [CrossRef] [Green Version]
  55. Shanbehzadeh, S.; Vahid Dastjerdi, M.; Hassanzadeh, A.; Kiyanizadeh, T. Heavy metals in water and sediment: A case study of Tembi River. J. Environ. Public Health 2014, 2014, 858720. [Google Scholar] [CrossRef] [Green Version]
  56. Ibrahim, A.T.; Wassif, E.T.; Mariana, S.A. Heavy metals assessment in water, sediments and some organs of Oreochromis niloticus under the impact of sewage water. J. Heavy Met. Toxic. Dis. 2016, 1, 1–7. [Google Scholar] [CrossRef]
  57. El-Mamoney, M.; Rifaat, A. Discrimination of sources of barium in beach sediments, Marsa Alam-Shuqeir, Red Sea Coast, Egypt. J. King Abdulaziz Univ. Sci. 2001, 12, 149–160. [Google Scholar] [CrossRef] [Green Version]
  58. El-Badry, A.E.M.A.; Khalifa, M.M. The occurrence and distribution of high-arsenic, selenium, tin and antimony in bottom sediments of Burullus lagoon and its effects on human health, Egypt. J. Afr. Earth Sci. 2017, 136, 305–311. [Google Scholar] [CrossRef]
  59. Patel, K.S.; Shrivas, K.; Brandt, R.; Jakubowski, N.; Corns, W.; Hoffmann, P. Arsenic contamination in water, soil, sediment and rice of central India. Environ. Geochem. Health 2005, 27, 131–145. [Google Scholar] [CrossRef]
  60. U.S. EPA. National Recommended Water Quality Criteria; U.S. Environmental Protection Agency: Washington, DC, USA, 2002. Available online: https://www.epa.gov/sites/default/files/2018-12/documents/national-recommended-hh-criteria-2002.pdf (accessed on 1 October 2022).
  61. European Commission. Heavy Metals in Waste final Report; DG ENV. E3. Project Environment, European Commission; COWI A/S: Lyngby, Denmark, 2002; pp. 1–86. [Google Scholar]
  62. CSQG. Canadian Soil Quality Guidelines (CSQG) for the Protection of Environmental and human Health: Summary Tables; Canadian Council of Ministers of the Environment (CCME): Winnipeg, MB, Canada, 2007; Updated September, 2007; Available online: https://www.esdat.net/environmental%20standards/canada/soil/rev_soil_summary_tbl_7.0_e.pdf (accessed on 1 October 2022).
  63. Hamed, Y.A.; Abdelmoneim, T.S.; ElKiki, M.H.; Hassan, M.A.; Berndtsson, R. Assessment of heavy metals pollution and microbial contamination in water, sediments and fish of Lake Manzala, Egypt. Life Sci. J. 2013, 10, 86–99. [Google Scholar]
  64. CCME. Scientific Criteria Document for the Development of the Canadian Water Quality Guidelines for the Protection of Aquatic Life: Manganese; Canadian Council of Ministers of the Environment (CCME): Winnipeg, MB, Canada, 2019; Available online: https://www.ccme.ca/en/res/2019-manganese-cwqg-scd-1601-en.pdf (accessed on 1 October 2022).
  65. El-Moselhy, K.M. Distribution of vanadium in bottom sediments from the marine coastal area of the Egyptian seas. Egypt. J. Aquat. Res. 2006, 32, 12–21. [Google Scholar]
  66. Yang, J.; Wang, Y.; Gao, X.; Zuo, R.; Song, L.; Jin, C.; Wang, J.; Teng, Y. Vanadium: A review of different extraction methods to evaluate bioavailability and speciation. Minerals 2022, 12, 642. [Google Scholar] [CrossRef]
  67. Abdelkader, A.I.; Abuelregal, M.; El-Metwally, M.E.; Hassaan, M.A.; Sanad, E.F. Ecological risk assessment of heavy metals in Hurghada Coastal. Pollution 2018, 4, 759–774. [Google Scholar]
  68. Asare, M.L.; Cobbina, S.J.; Akpabey, F.J.; Duwiejuah, A.B.; Abuntori, Z.N. Heavy metal concentration in water, sediment and fish species in the bontanga reservoir, Ghana. Toxicol. Environ. Health Sci. 2018, 10, 49–58. [Google Scholar] [CrossRef]
  69. Anbuselvan, N.; Senthil Nathan, D.; Sridharan, M. Heavy metal assessment in surface sediments off Coromandel Coast of India: Implication on marine pollution. Mar. Pollut. Bull. 2018, 131, 712–726. [Google Scholar]
  70. U.S. EPA. A Guidance Manual to Support the Assessment of Contaminated Sediments in Freshwater Ecosystems; Report EPA-905-B02-001-A; U.S. Environmental Protection Agency: Washington, DC, USA, 2002; pp. 1–234. Available online: https://www.cerc.usgs.gov/pubs/sedtox/volumeI.pdf (accessed on 1 October 2022).
  71. Iyama, W.A.; Okpara, K.; Techato, K. Assessment of heavy metals in agricultural soils and plant (Vernonia amygdalina Delile) in Port Harcourt Metropolis, Nigeria. Agriculture 2022, 12, 27. [Google Scholar] [CrossRef]
  72. Abu Khatita, A.M.; Shaker, I.M.; Shetaia, S.A. Water quality assessment and potential health risk of Manzala Lake- Egypt. Al Azhar Bull. Sci. 2017, 9, 119–136. [Google Scholar]
Figure 1. Location map for the study area and sampling sites (S1−5) draped over a high−resolution Sentinel−2A satellite image (a) and Advanced Land Observing Satellite (ALOS) Phased Array type L-band Synthetic Aperture Radar (PALSAR) digital elevation model (DEM) (b) displaying the elevation buffering zone of Bahr El-Baqar drain, Eastern Nile Delta, Egypt. Belbeis and Qalubiya secondary drains meet in the south at Zagazig, Sharqia Governorate, to form Bahr El-Baqar drain, which flows north to Lake Manzala, south of Port Said city.
Water 14 03981 g001
Figure 3. Spatiotemporal distribution plots of total contents of heavy metals (mg/kg) in Bahr El-Baqar drain sediments during summer and winter of 2018: Ba (a), As (b), Pb (c), Cu (d), Mn (e), Ni (f), Zn (g), Cr (h), V (i), Al (j) and Fe (k) collected in summer and winter of 2018.
Water 14 03981 g003
Figure 4. Bivariate plots of significant relationships between heavy metals in water and sediments of Bahr El-Baqar drain: Cu versus Fe (a), Zn versus Ni (b), and Zn versus Al (c) in water (mg/L); Ni versus Al (d), Fe versus Al (e), and Ni versus Fe (f) in sediments (mg/kg); Pb in sediments (mg/kg) versus Ni in water (mg/L) (g), and Zn in sediments (mg/kg) versus Cu in water (mg/L) (h), and Mn in sediments (mg/kg) versus Fe in water (mg/L) (i).
Water 14 03981 g004
Figure 5. PCA analysis of the studied heavy metals in water (a) and sediments (b).
Water 14 03981 g005
Figure 6. The average values of enrichment factor (EF; (a)), contamination factor (CF; (b)), geo−accumulation index (Igeo; (c)), pollution load index (PLI), and degree of contamination (DC; (d)) of the eleven studied heavy metals in sediments of Bahr El−Baqar drain.
Water 14 03981 g006
Table 5. The enrichment factor (EF) of the investigated metals in the drain sediment samples.
SiteBaAsCrCuMnNiPbVZnFeAl
Summer
S10.877.890.204.811.094.8060.262.455.281.000.61
S20.766.940.408.350.736.087.292.9211.441.000.64
S30.590.880.818.381.035.614.653.049.101.000.60
S40.595.090.233.391.154.401.082.393.471.000.55
S50.664.860.332.401.324.691.042.772.641.000.43
Winter
S10.031.711.7921.691.887.241.653.993.561.000.62
S20.021.101.3617.141.536.230.443.996.931.000.66
S30.030.491.1518.491.504.650.222.402.051.000.63
S40.041.501.296.521.256.320.114.352.451.000.68
S50.020.971.719.071.636.260.0638.273.201.000.65
Mean0.363.140.9210.021.315.627.686.655.011.000.60
Table 6. The contamination factor (CF), pollution load index (PLI), and degree of contamination (DC) of the investigated metals in the drain sediment samples.
SiteBaAsCrCuMnNiPbVZnFeAlPLIDC
Summer
S10.333.000.081.830.411.8322.900.932.010.380.230.9233.92
S20.222.000.122.400.211.752.100.843.300.290.180.6813.40
S30.220.330.313.170.392.131.761.153.450.380.230.7413.52
S40.252.170.021.440.491.880.461.021.480.430.240.549.86
S50.161.170.080.580.321.130.250.660.630.240.100.345.31
Winter
S10.021.051.1113.381.164.471.022.462.200.620.391.0727.88
S20.010.570.708.810.793.200.232.053.560.510.340.7320.77
S30.020.280.6610.540.862.650.131.371.170.570.360.5918.58
S40.026.200.763.850.743.730.072.571.450.590.400.7820.36
S50.010.510.914.810.873.320.0320.281.700.530.340.6833.31
Mean0.121.720.475.080.622.612.893.332.090.450.280.7019.69
Table 7. The geo-accumulation index (Igeo) of the investigated metals in the drain sediment samples.
SiteBaAsCrCuMnNiPbVZnFeAl
Summer
S115.282.1710.289.6918.248.9313.2210.9512.5129.2429.89
S214.681.5810.8710.0817.268.879.7710.8113.2228.8429.54
S314.72−1.0012.2710.4818.159.159.5211.2613.2929.2329.86
S414.891.7010.609.3418.488.977.5811.0812.0729.4029.91
S514.220.8110.348.0217.858.236.7010.4610.8428.5828.72
Winter
S111.230.6614.1212.5619.7310.228.7312.3512.6429.9430.61
S210.52−0.2313.4611.9519.169.746.5712.0913.3429.6730.44
S310.85−1.2513.3712.2119.289.465.7411.5111.7329.8230.50
S411.360.4113.5810.7619.079.964.8012.4212.0429.8730.67
S510.41−0.3813.8411.0819.309.793.8215.4012.2729.7230.44
Mean12.810.4412.2710.6118.659.337.6411.8312.3929.4330.05
Publisher’s Note: MDPI stays neutral with regard to jurisdictional claims in published maps and institutional affiliations.