Article

Numerical Investigation on EOR in Porous Media by Cyclic Water Injection with Vibration Frequency

School of Civil and Resource Engineering, University of Science and Technology Beijing, Beijing 100083, China
*
Author to whom correspondence should be addressed.
Water 2022, 14(23), 3961; https://doi.org/10.3390/w14233961
Submission received: 3 November 2022 / Revised: 24 November 2022 / Accepted: 2 December 2022 / Published: 5 December 2022
(This article belongs to the Topic Energy-Water Nexus)

Abstract

:
Water injection with an oscillatory pressure boundary is a promising technology, which can achieve a more economical and environment-friendly EOR (enhanced oil recovery). However, due to the unclear critical injection frequency, its oil production performance has been unstable and is far from reaching the optimal level. Here, a numerical model is established for oil recovery by the water injection with the oscillatory boundary condition to find out the critical frequency for the optimal EOR. The correlations between the water injection frequency and the EOR level at diverse oil–water surface tensions and oil viscosities are integrated into the model. Our numerical model reveals that an optimal EOR of roughly 10% is achieved at the critical water injection frequency compared with water injection without an oscillatory boundary. The EOR mechanism is revealed showing that upon water injection with the optimum frequency, the formation of the preferential pathways is inhibited and the pressure transmits to the wall sides to displace the oil. Moreover, it is indicated that the required critical frequency increases with higher surface tension and larger oil viscosity. In addition, the difference between the residual oil saturation at the optimal frequency increases with the increase in surface tension compared with water injection without an oscillatory boundary. Last but not least, it is elucidated that at a constant injection frequency, a higher EOR is achieved when the water–oil surface tension is lower but the oil viscosity is larger. Our work promises economic, eco-friendly and controllable enhanced oil recovery.

1. Introduction

Water flooding is an ordinary technique in secondary oil recovery. However, as the water saturation increases, the enhanced oil recovery (EOR) by water flooding becomes constrained. Currently, the water cut of a majority of oil fields in the late stage of water flooding is over 90%, and even 98% in certain old oil fields, which means that the ordinary water flooding no longer satisfies the demands of further EOR [1,2]. Therefore, a more efficient and reliable EOR technique is required. The present adopted techniques for enhanced oil recovery after water flooding consist of water alternating gas (N2, CO2) flooding, surfactant injection, micro/nanoparticle injection, polymer injection, microorganism injection and fracturing development [3,4,5,6]. Though higher EOR has been achieved via the enhanced oil recovery techniques than the water flooding, these techniques required the oil companies to append the gas compressor investment, update the surface pipe network system and pump stations and re-consider the compatibility of surfactants, polymers and microorganisms with the original equipment [7,8,9]. In addition, the residual surfactants, polymers and microorganisms in reservoirs after the enhanced oil recovery probably contaminated the groundwater [10,11,12]. Meanwhile, the injected micro/nanoparticles plug the reservoir pores, which is not conducive to the recycling and sustainability of the reservoir for CO2 capture, utilization and underground storage and hydrogen underground storage [13,14]. Nevertheless, by optimizing the water flooding techniques, it is able to achieve EOR, maintain, and even reduce, the investment and operation costs of the oil field, and eliminate the pollution of groundwater and the destruction of reservoirs simultaneously.
The optimizations of water flooding techniques consist of cycle optimization, location optimization and water optimization. Cycle optimization was used to constantly alter the pressure distribution in the reservoir by intermittent water injection and oil recovery to tune the flow path of the injected water, inhibit the formation of the predominant flow path, expand the displacing area of the injected water and achieve EOR [15,16]. The location optimization is divided into layer-based water injection vertically and the well pattern infill horizontally. Layer-based water injection was used to put a packer in the injection well to redistribute the injected water to ensure a higher flux of injected water with higher pressure flooded the low-permeability layer to achieve a better EOR [17,18]. Well pattern infill was used to increase the number of wells to expand the displacing area of water injection and enhance the oil recovery. The water optimization aims to optimize the physical parameters of the injected fluid, such as the non-Newtonian property, viscoelasticity and wettability [19,20,21]. Compared with location and water optimization, cycle optimization reduced the oil field investment and shortened the development period, which was an economical, practicable and no extra time costing scenario of water injection optimization [22,23,24,25].
Water injection under oscillatory boundary conditions, called cyclic water injection (CWI) as well, has been broadly applied to oil fields as one of the cycle optimization techniques and investigated by experimental and numerical methods. Surguchev et al. [26] claimed that CWI was a zero-cost EOR technique. They established a CWI model and applied the model to the Heidrun Field. They solved the model numerically and predicted the EOR of the field in 5 years ranging from 3% to 8%. Stirpe et al. [27] constructed a three-dimension black oil model by using the parameters extracted from the Lagocinco Field. They used the model to calculate and predict the EOR performance for diverse cycles, pressure and well spacing by adopting the CWI. They achieved the optimal EOR of 5.1% with a 3-month cycle, an injection–stop ratio of 1:3, a pressure of 4017 psi and short well spacing. Meng et al. [28] investigated the feasibility of EOR in low-permeability reservoirs by adopting CWI by performing the core flooding experiments and the numerical simulations (CMG). They revealed that the EOR of the low-permeability reservoir was significant by using CWI, reaching 20%. Sun et al. [29] designed an algorithm to optimize the injection–stop ratio of the CWI, and applied the optimal CWI to achieve a 6.8% EOR. Kulathu et al. [13] comprehensively considered the effects of CWI and water salinity on EOR. They achieved a 33.9% higher EOR than without CWI and a ppm water salinity by adopting the CWI and a 5500 ppm water salinity.
Although the reliability of the CWI on EOR has been proved by core flooding experiments, field development and numerical simulations, the EOR performances reported by the researchers vary from 3% to 20%, indicating that diverse frequencies trigger various EOR effects. Moreover, few studies have found a critical frequency for the optimal EOR by CWI from a pore-scale perspective; therefore, the correlation between the frequency of water injection and the EOR is still to be revealed [30,31]. In addition, for operability, the field site generally sets the water injection frequency constant based on the engineering experience, rather than the critical frequency of the optimal EOR at the present residual oil saturation. Moreover, the affecting factors on the critical frequency of the optimal EOR are unclarified. Even though at the same residual oil saturation, the critical frequency varies as the surface tension between oil and water and oil viscosity alters [32,33].
To achieve a more economical, and a more environment-friendly and optimal EOR, an innovative model is established to figure out the critical frequency of water injection under oscillatory boundary conditions and clarify correlations between the water injection frequency and the EOR level with a diverse oil–water surface tension and oil viscosity. In Section 2, the model is theoretically derived and the conditions and hypotheses are described. In Section 3, the OpenFOAM platform for solving the model is validated via the case of displacing a non-wetting droplet in a pore-throat channel by cyclic water injection. In Section 4, the critical frequency of EOR by water injection with the oscillatory boundary condition is clarified, and the relationship between frequency and residual oil saturation under different conditions is elucidated by changing the surface tension and the viscosity of the oil. The concluding remarks are drawn in Section 5.

2. Model and Methodology

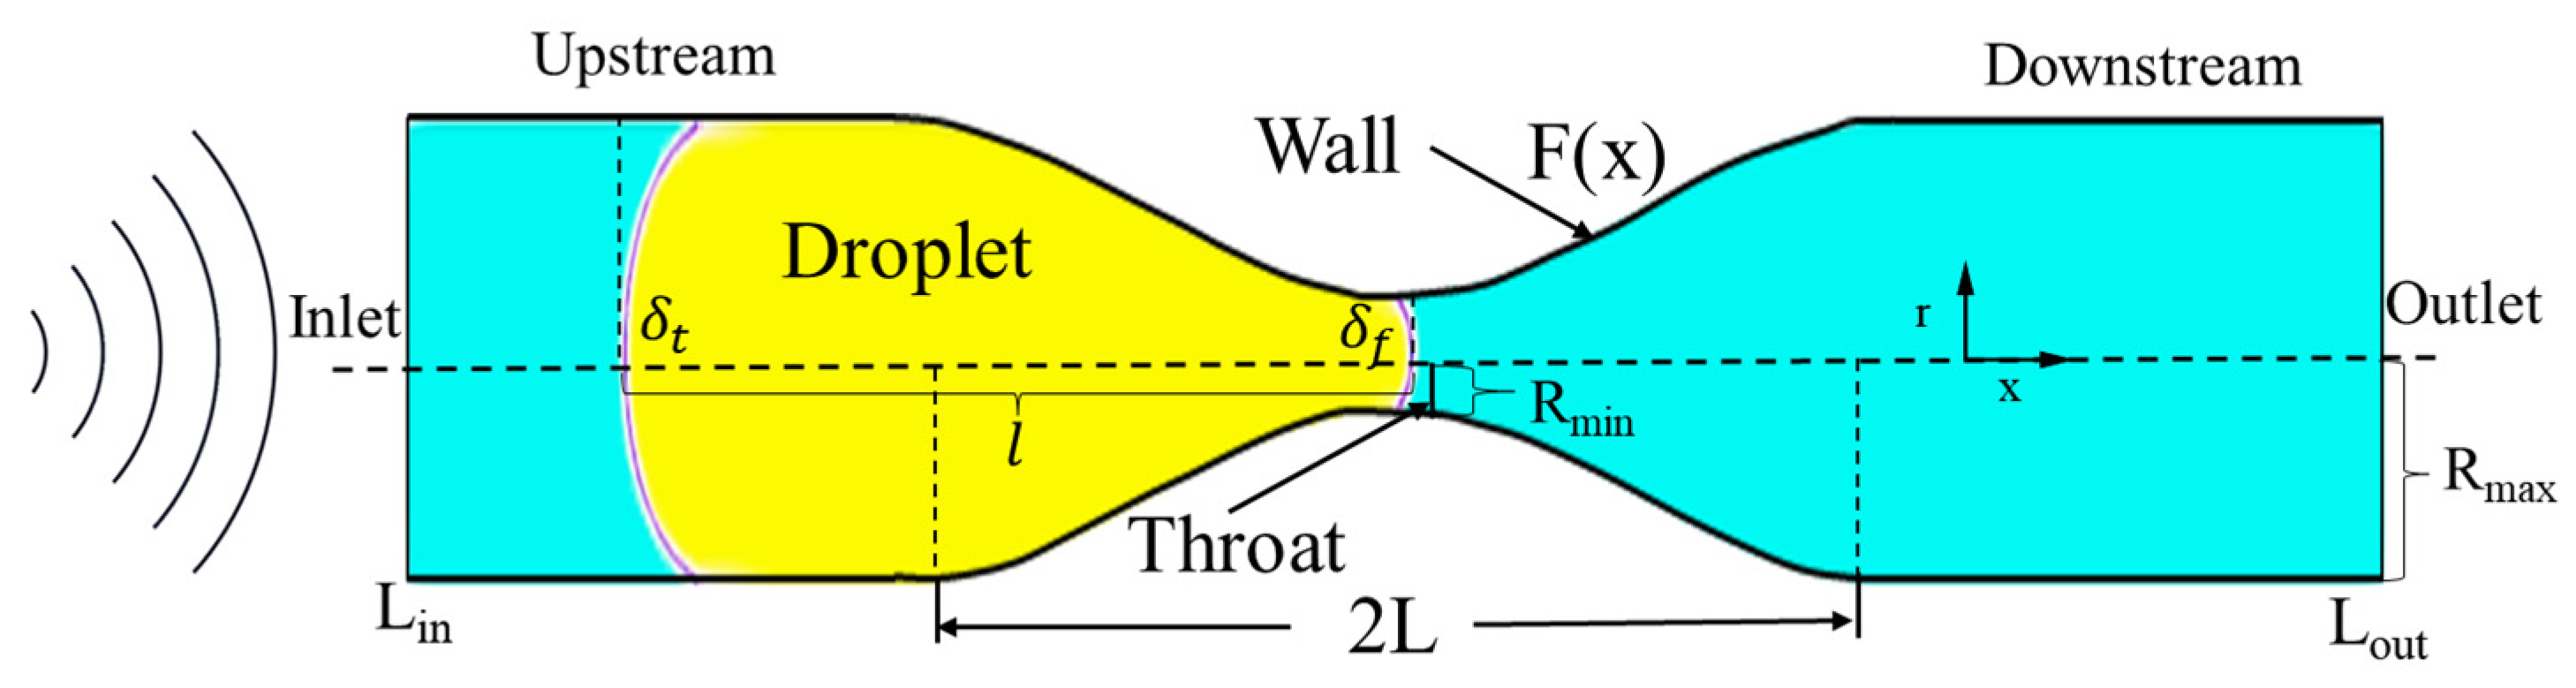
2.1. Problem Description

Two-dimensional micromodel numerical simulations are performed to investigate the EOR by adopting cyclic water injection. Though the pore structures in actual oil fields are heterogeneous, to focus on the relations between EOR and the frequency (Figure 1) regardless of the pore heterogeneity, the micromodels with a homogeneous pattern are designed. The micromodels consist of an inlet buffer, a porous region and an outlet buffer in order, where microcylinders are placed aligned in the width direction and staggered in the length direction in the porous region (Figure 1). A whole micromodel is 590 μm in length L t and 185 μm in width W . The inlet buffer has a length of 50 μm, and the outlet buffer has a length of 100 μm. The porous region is 440 μm in length L m . The diameter of the microcylinders D in the porous region is 40 μm. The water density ρ w is 1000 kg/m3 and the water viscosity μ w is 1 mPa·s. The number of grids in the three directions of x, y, and z is 590 × 185 × 1.
Initially, the porous region is saturated with oil (the yellow region in Figure 1), while the inlet buffer and the outlet buffer are filled with water (the blue region in Figure 1). The left boundary of the inlet buffer is set as the water inlet with pressure boundary condition, and the right boundary of the outlet buffer is set as the water and oil outlet with zero pressure (Figure 1). Other boundaries of the micromodel are set as the wall. First the water is injected into the micromodel with no frequency. The water injection is unstopped until the oil saturation in the porous region no longer alters and the residual oil saturation is recorded. Afterward, the porous region with oil and injected with water with a frequency f is re-saturated. After the same duration of ordinary water injection, the cyclic water injection is stopped and the residual oil saturation is recorded. By comparing the residual oil saturations from ordinary water injection and cyclic water injection, the EOR achieved by cyclic water injection is obtained.
Furthermore, the oil saturation and water injection with oscillation with altered frequency are replicated to find out the critical frequency at the optimal EOR. After obtaining the critical frequency, the cyclic water injection experiments are repeated by altering the surface tension between water and oil and the oil viscosity, to investigate how they affect the critical frequency.

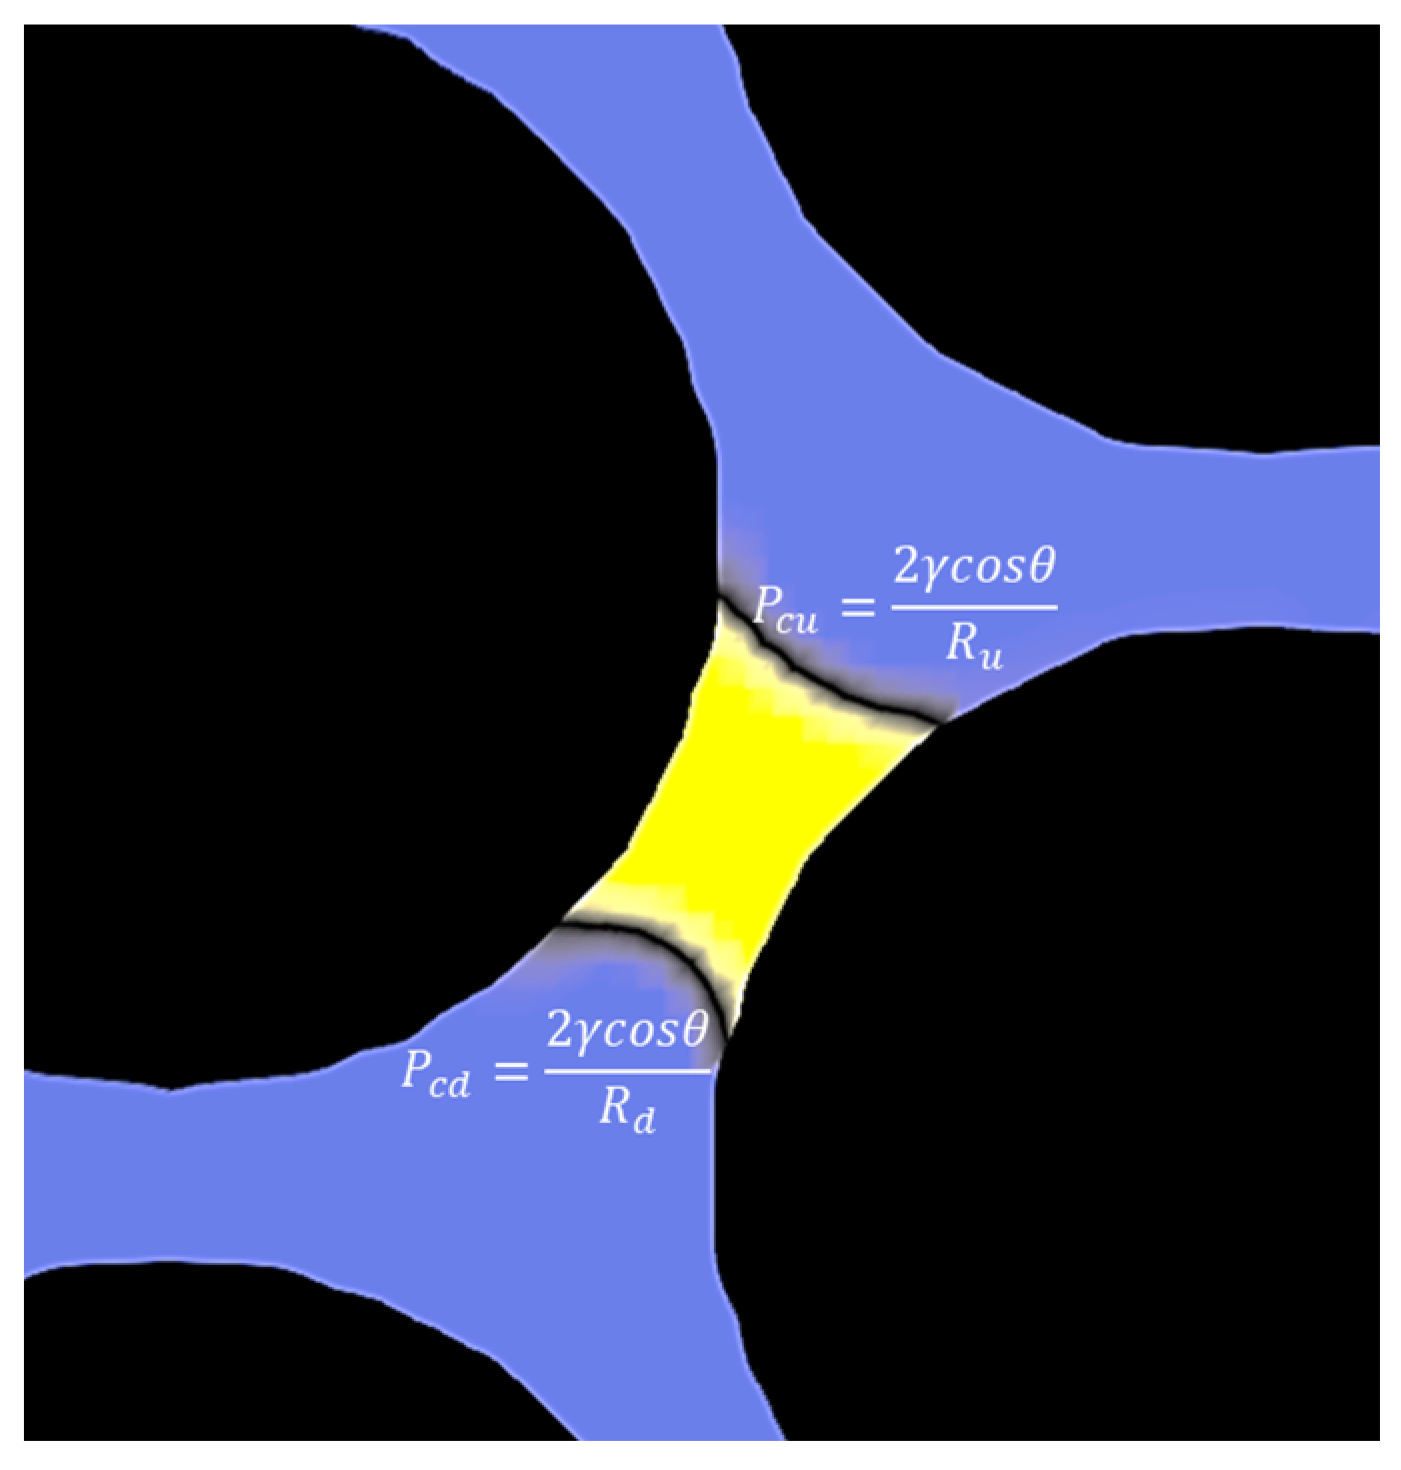
2.2. Mathematical Models

The oil recovery by cyclic water injection is governed by the continuity Equation (1) and the Navier–Stokes Equation (2):
· ρ u = 0
ρ u t + · ρ u · u = P + · μ u + F s
where u is velocity, m/s; P is pressure, Pa; ρ is density, kg/m3; μ is viscosity, Pa·s; ∇ is the Hamiltonian operator; F s is the continuous surface force (CSF) applied on the interface [34],
F s = γ κ n
where γ is the surface tension, N/m; κ is the curvature of the interface, m−1; n is the normal vector of the interface.
To capture the interface, the VOF model [35] is adopted:
α i t + u · α i = 0
where α is the volume fraction in a mesh grid; the subscript i represents the ith phase. The volume fraction of each phase sums 1, where α i = 1 . In addition, the volume fraction of phase i values from 0 to 1:
α i =   0                             No   phase   i   in   the   mesh   grid   0 < α i < 1   The   mesh   is   partly   filled   with   phase   i 1                             The   mesh   is   filled   with   phase   i
The parameters in the mesh are determined by their averages according to the volume fractions:
ρ = α i ρ i
μ = α i μ i
The inlet pressure P i n t is described as:
P i n t = P A s i n 2 π f t + P r e f
where P A is the amplitude of the inlet pressure, Pa; f is the frequency of the cyclic injection, Hz; P r e f is the reference pressure, Pa. The outlet pressure is constantly set to 0 Pa.
Gravity is not considered in the model. The wall boundary condition is no slip.

2.3. Numerical Scheme
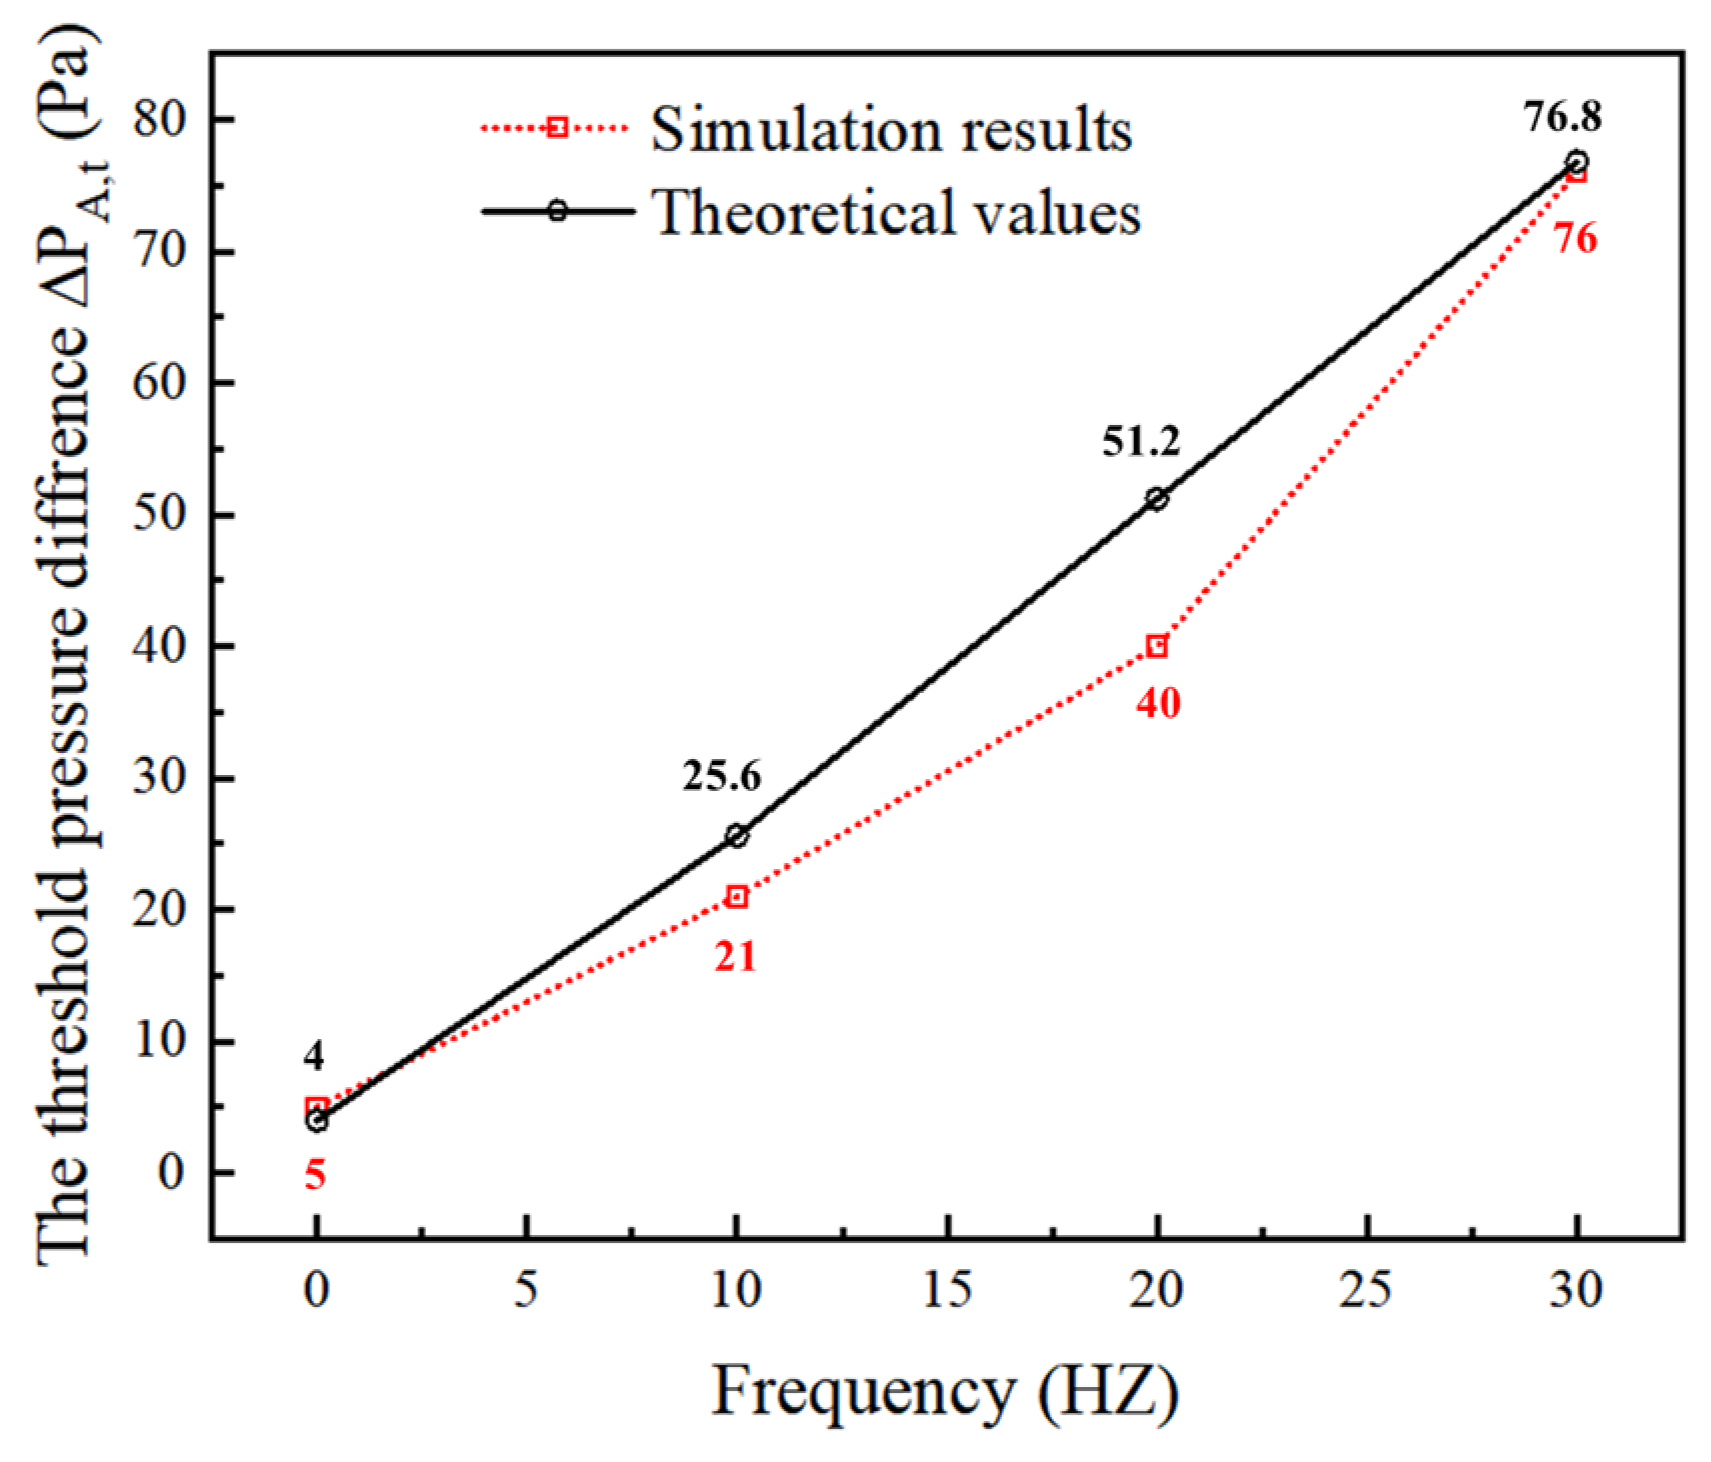
The geometric reconstruction is applied to the interface, and the second-order implicit method is adopted for the discretization of the time derivative when simultaneously solving the Equations (1), (2) and (4). Detailed numerical configurations can be found in previous researches [36,37]. Equations (1)–(8) are numerically solved in the OpenFOAM platform, and the finite volume method [38] is used in OpenFOAM. The finite volume method was based on the integral form of the conservation laws, rather than their differential form which led to more accuracy/stability, especially for sharp gradients inside a domain, which was also called the shock-capturing property.
Specifically, the frequency f of the cyclic water injection is altered to find out the effect on the EOR. Furthermore, the effects of the frequency f on the EOR at diverse oil–water surface tension γ and oil viscosity μ o are investigated. The detailed parameter configurations are listed in Table 1.

3. Model Benchmark

3.1. Problem Definition

The accuracy of our numerical framework is verified by the squeezing of a single non-wetting liquid drop driven by wave water injection through a pore-throat channel. The structure schematic and initial phase distribution of the model are shown in Figure 2, where the region of yellow is the trapped droplet and the other is the water. The pipe wall profile is determined by the following formula
F ( x ) =                                         R m a x                                                                                     ,                     L i n < x < L R m i n [ R m a x R m i n + 1 R m a x R m i n ( 1 + c o s ( π x L ) ) ]       ,                 L < x < L                                         R m a x                                                                                     ,                     L < x < L o u t
where R m a x and R m i n are the maximum pore radius and the throat radius, respectively; L i n and L o u t are the channel’s inlet and outlet positions, respectively; 2 L is the total length of the sinusoidal part of the channel.
Beresnev et al. [39,40] found that trapped droplets can only be released when the pressure difference between the inlet and outlet reaches the “unplugging” threshold Δ P A , t , and the threshold value is proportional to the imposed frequency f . Deng et al. [37] developed a new theoretical model that described the response of two-phase flow to oscillatory forcing created by a seismic wave passing a porous medium. The model was used to determine at which seismic wave amplitude, for a given frequency, the droplet became dislodged. This theoretical relationship can be found in [41] by solving the force balance Equation (10) below
ρ o d d t V   U ¯ d V = F x + P i n , r e f P o u t , r e f Δ P c + F Δ P A L o u t L i n , f  
where ρ   o is the density of the trapped oil droplet, and U ¯ is the mean velocity of the trapped oil droplet, on the left side of the equation is the momentum integral term of the trapped oil droplet; F x is the viscous drag force; P i n , r e f denotes the reference inlet pressure, P o u t , r e f is the reference outlet pressure, which is fixed at 0 Pa; Δ P c is the capillary resistance that has a maximum value of Δ P c , m = 2 γ 1 R m i n 1 R m a x when the droplet front meniscus reaches the narrowest throat position; F Δ P A L o u t L i n , f is the external oscillatory force to generate the elastic wave determined by the imposed pressure gradient Δ P A L o u t L i n and frequency f ; L o u t L i n is the total span from inlet to outlet.
Add oscillatory pressure at the inlet with a fixed pressure value of P i n , r e f , which can be expressed as Δ P i n t , and the total pressure at the single-channel inlet P i n _ s t is the sum of them
P i n _ s t = P i n , r e f + Δ P i n t = P i n , r e f + Δ P A sin 2 π f t
As shown in Figure 2, the oil droplet is located on the left side of the throat channel, and the front position δ f of the oil droplet is −0.5 mm, the tail position δ t of the oil droplet is −15 mm, and the total length l of the oil droplet is 14.5 mm at the initial moment. Other parameter values can be found in Table 2. The maximum capillary resistance Δ P c , m is tested by varying the inlet reference pressure P i n , r e f , and taking its critical value of when the droplet is squeezed through. Given these conditions, Δ P c , m is found at around 140 Pa in this model. Then P i n , r e f is fixed to 135 Pa and added oscillation Δ P i n t with different frequency f to drive and release the oil droplet. At the same time, the relationship between the threshold value of the oscillation amplitude Δ P A , t and the frequency f is explored, where the threshold value of the oscillation amplitude Δ P A , t represents the corresponding oscillation amplitude when the trapped droplet can be released just by changing the amplitude of the oscillation at a certain frequency.

3.2. Simulation Results

The results show that by changing the frequency f of the additional oscillation Δ P i n t , the threshold Δ P A , t of the oscillation amplitude required for the final successful release of the trapped droplet will also change. The result is shown in Figure 3; the general rule is that the threshold value Δ P A , t of the oscillation amplitude increases with the increase in frequency f . This result is in good agreement with the theoretical solution obtained from the theoretical model established by Deng et al. [41], thus verifying the correctness of our numerical framework.

4. Results and Discussion

This work focus on the influence of wave parameters and oil–water physical parameters on enhancing oil recovery, including wave frequency f , the interfacial tension between oil and water γ and the dynamic viscosity of oil μ o . Through a series of parameter discussions, it is found that the frequency of the wave has an optimal value, and the residual oil saturation in porous media will be significantly reduced at this frequency. For different physical parameters of oil and water, there are corresponding optimum frequencies. The results show that the optimum frequency increases with the increases in the interfacial tension γ between oil and water, and increases with the increase in the dynamic viscosity of oil μ o .

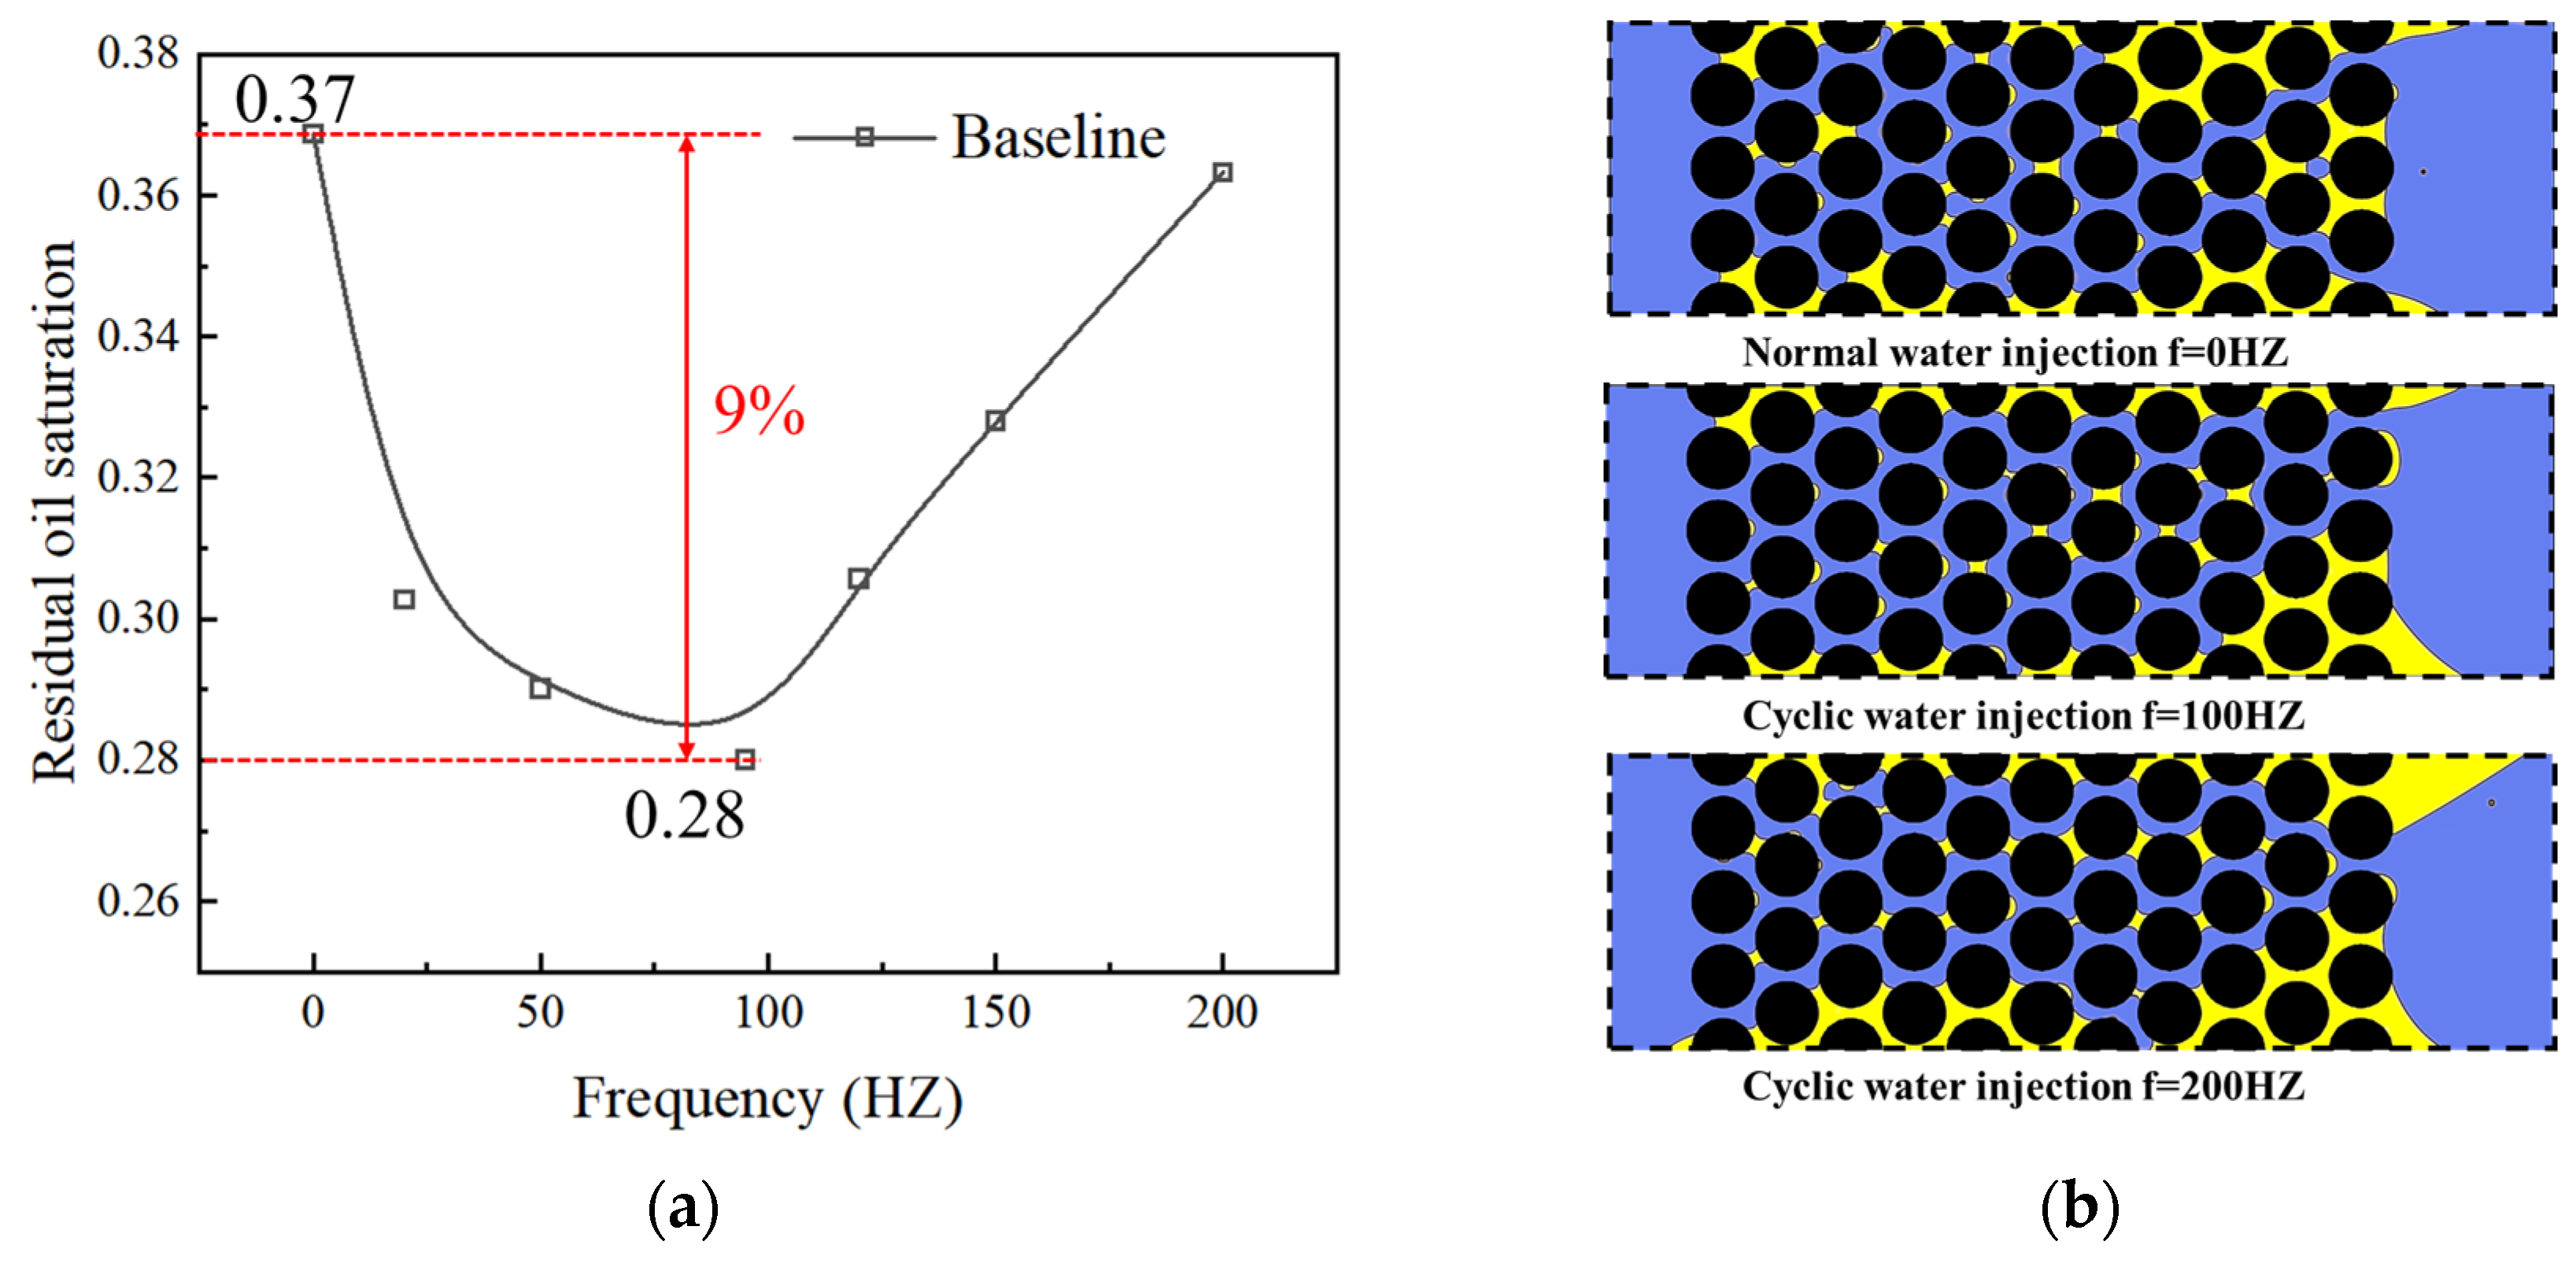
4.1. The Critical Frequency

The relationship between frequency f and residual oil saturation revealed from the model is shown in Figure 4. Upon water injection without an oscillatory boundary (represented by 0 Hz in Figure 4a), a 37% residual oil is observed. As the injection frequency is increased, the residual oil continuously decreases with the decrease rate slowing down. At the frequency of 100 Hz, the lowest residual oil value of 28% is observed. As the injection frequency increases, the residual oils rebound and reach the same residual oil saturation observed at the water injection without an oscillatory boundary at the frequency of approximately 200 Hz. Therefore, an optimum injection frequency, 100 Hz, is revealed via the numerical model for enhanced oil recovery. At the optimum injection frequency, the oil recovery is enhanced by 9% compared with that upon the water injection without an oscillatory boundary, which is consistent with the highest EOR obtained from a conventional reservoir reported in the literature [26,27,29].
The oil/water distributions at the end time of 0, 100, and 200 Hz are shown in Figure 4b. The mechanisms of EOR by an optimum injection frequency are further interpreted according to the oil/water distribution. Upon water injection without an oscillatory boundary (0 Hz), due to the continuous water injection and pressure transmission in the porous media, preferential pathways are formed. Therefore, the injected water prefers to escape instead of displacing the oil residues on the walls. Upon water injection with the optimum frequency (100 Hz), the formation of the preferential pathways is inhibited since the pressure is intermittently transmitted into the porous media. In particular, at the increase stage of the injection cycle, the pressure transmits forward to displace the oil in the middle porous media. At the decrease stage of the injection cycle, the pressure in the inlet is lower than that inside the porous media; hence, the pressure transmits to the wall sides to displace the oil. Therefore, the residual oil attached to the walls is successfully recovered. Upon water injection with a frequency higher than the optimum one (200 Hz), the increase stage of the injection cycle is too short to displace the oil forward. At the decrease stage of the injection cycle, the oil is accumulated to be clusters and residues in the porous media.

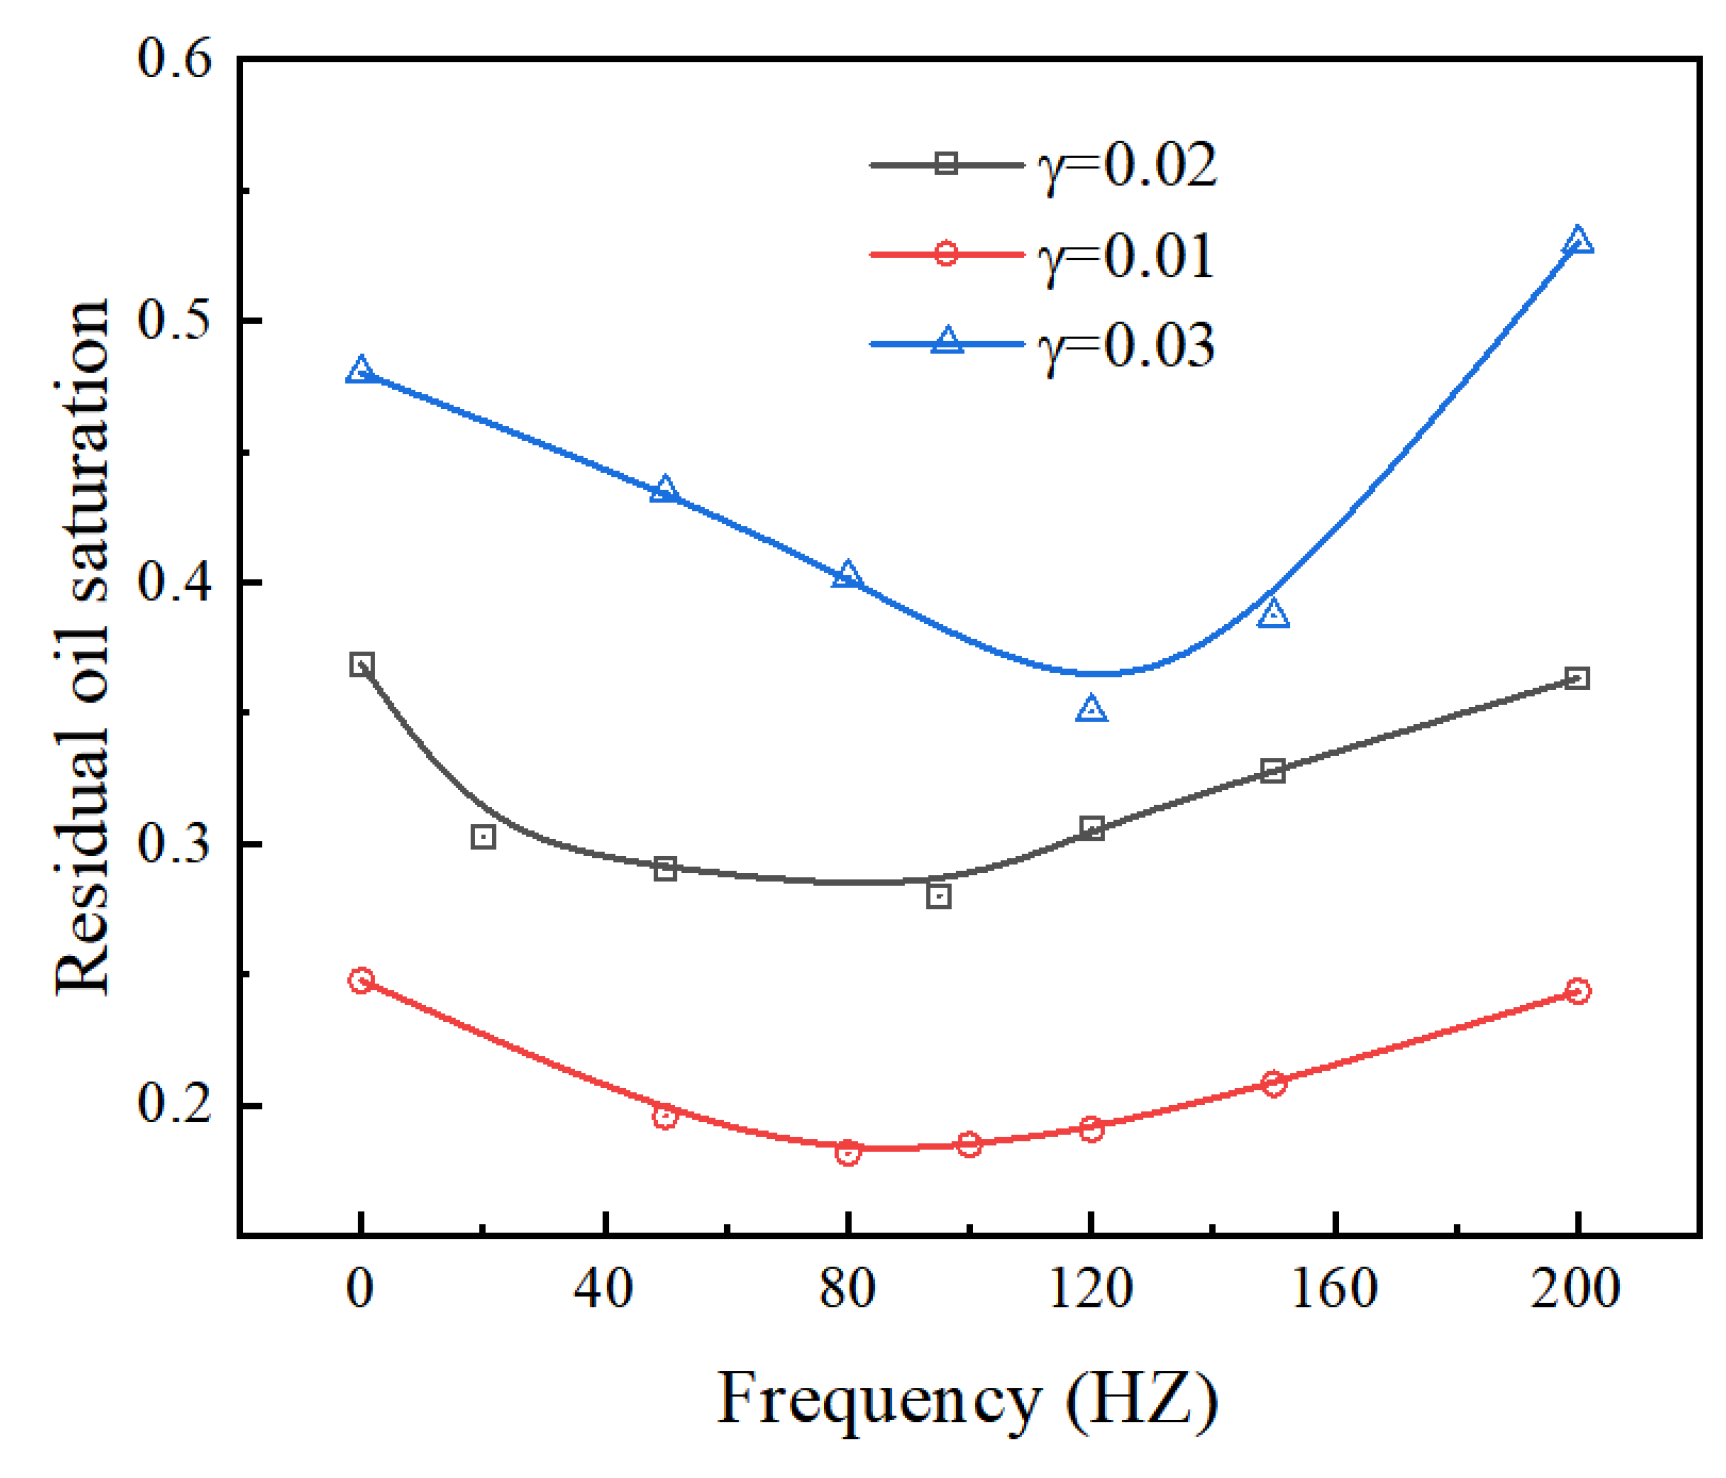
4.2. The Effect of Interfacial Tension

It is indicated that the required critical frequency increases with a higher surface tension (Figure 5). As the water–oil surface tension γ is increased from 0.01 to 0.03 N/m, the optimum frequency for EOR by water injection with an oscillatory boundary increases from 80 to 120 Hz. Moreover, at a low water–oil surface tension, the residual oil saturation varies slightly as the injection frequency increases. As the water–oil surface tension is raised, the residual oil saturation varies significantly with the variation in the injection frequency.
In addition, it is revealed that at a constant injection frequency, a higher EOR is achieved as the water–oil surface tension is lower. This phenomenon is interpreted by the formula of capillary pressure. According to the Young–Laplace equation, the capillary pressure of the two-phase interface at the upstream and downstream of the trapped droplet is:
P c u = 2 γ R u
P c d = 2 γ R d
where the P c u and the P c d are the capillary pressures of the upstream and the downstream of the trapped oil droplet, respectively, and the R u and the R d represent the radiuses of the curvatures of the upstream and downstream meniscus, respectively. The capillary pressure difference between the upstream and the downstream of the trapped oil droplet is shown by:
Δ P = 2 γ 1 R u 1 R d
According to the Young–Laplace equation, the capillary pressure difference of a trapped oil droplet is determined by the interface tension γ and the radiuses of the curvatures R u and R d   of the meniscus. As shown in Figure 6, it is assumed that the three-phase contact points of the oil drop are fixed; that is, when the radiuses of the curvatures are fixed, the greater the interfacial tension γ , and the greater the capillary pressure difference between the upstream and the downstream. Then the required force to release the trapped oil droplet increases. Therefore, the greater the interfacial tension, the greater the remaining oil saturation at the same frequency.

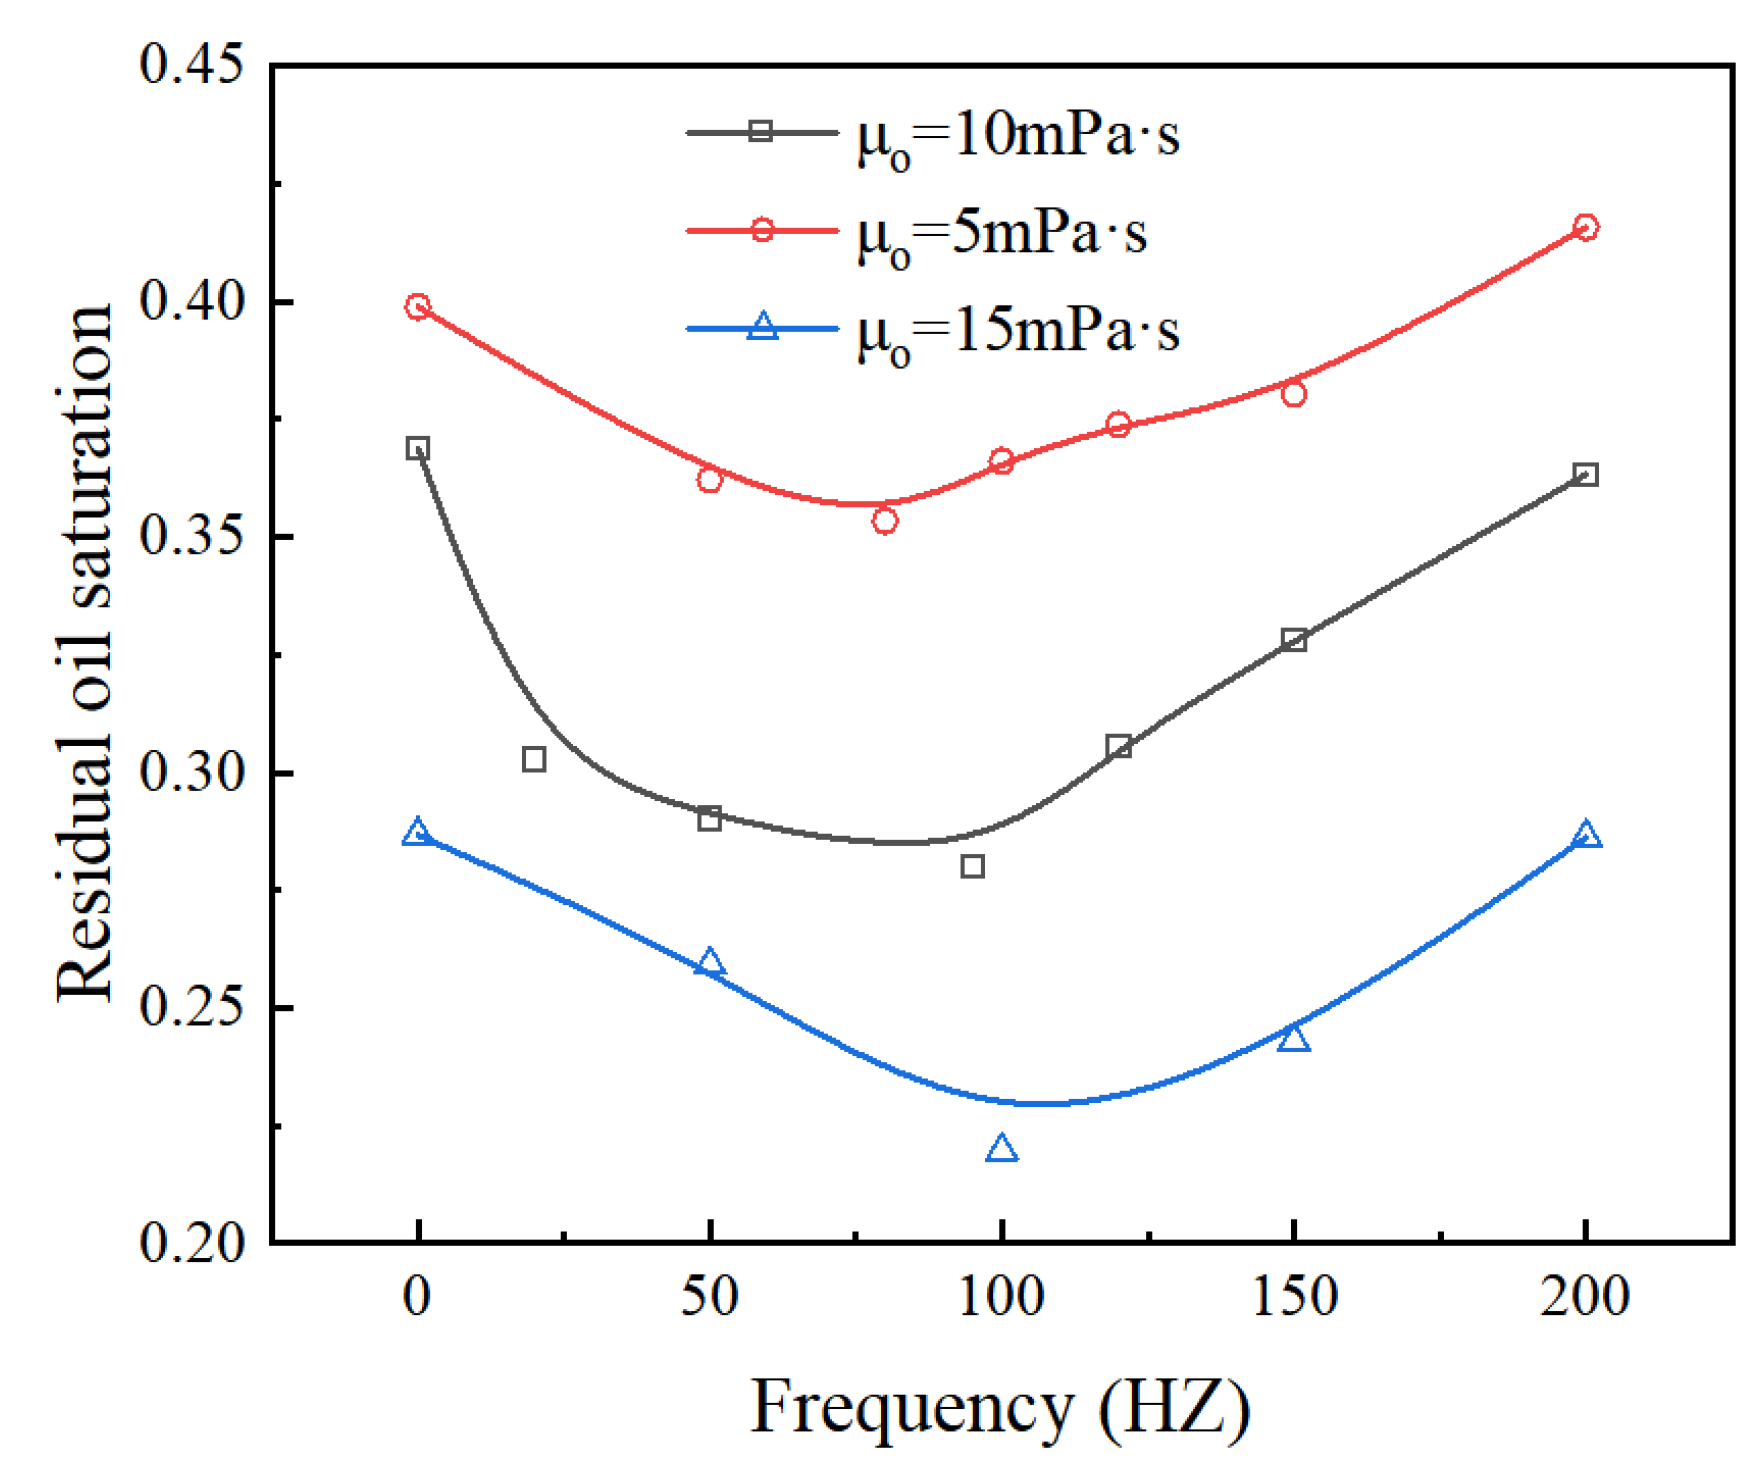
4.3. The Effect of Viscosity of Oil

It is demonstrated that the required critical frequency increases with a larger oil viscosity (Figure 7). As the oil viscosity is raised from 5 to 15 mPa s, the optimum frequency for the EOR by water injection with an oscillatory boundary increases from 80 to 100 Hz. Notably, the most significant variation in the residual oil saturation is observed at the oil viscosity of 10 mPa s instead of 5 or 15 mPa s, which is worth further investigation.
In addition, the residual oil saturation at the same frequency increases with the increase in the viscosity of oil μ o . This may be different from the law in the actual rock stratum, mainly because many factors such as the porosity, rock stratum homogeneity, and viscosity difference between oil and water need to be considered in the actual rock stratum. However, in this model, when the pore structure and homogeneity are consistent, the smaller the viscosity difference between the oil and water is, the easier it is to form a dominant channel after water injection, which will lead to faster water breakthrough and more residual oil saturation.

5. Conclusions

Water injection with an oscillatory boundary is an economical and eco-friendly technique for enhanced oil recovery (EOR); however, the critical frequency under diverse development conditions remains unclear. At first, a 2D numerical model of oil recovery by cyclic water injection in porous media is established to investigate the correlation between the frequency and the residual oil saturation and solve the model in the OpenFOAM platform. In addition, the OpenFOAM platform is validated via the problem of displacing a non-wetting droplet in a pore-throat channel by cyclic water injection. The relationship between frequency and residual oil saturation under different conditions is studied by changing the surface tension between oil and water and the viscosity of oil.
It is revealed that an optimal EOR of roughly 10% is achieved at the critical water injection frequency compared with water injection without an oscillatory boundary. The mechanisms of EOR by an optimum injection frequency are further interpreted according to the oil/water distribution. Upon water injection without an oscillatory boundary (0 HZ), due to the continuous water injection and pressure transmission in the porous media, preferential pathways are formed. Therefore, the injected water prefers to escape instead of displacing the oil residues on the walls. Upon water injection with the optimum frequency (100 Hz), the formation of the preferential path ways is inhibited since the pressure is intermittently transmitted into the porous media. Upon water injection with a frequency higher than the optimum one (200 Hz), the oil is accumulated to be clusters and residues in the porous media by the overhigh injection frequency. The required critical frequency increases with higher surface tension and larger oil viscosity is demonstrated. It is discovered that at a constant injection frequency, a higher EOR is achieved when the water–oil surface tension is lower but the oil viscosity is larger. The Young–Laplace equation and capillary pressure are used to explain the differences in residual oil saturation caused by different surface tensions. According to the rule of water breakthrough time and the homogeneity of porous media, it is interpreted that the residual oil saturation is different under different oil viscosities. The difference between the residual oil saturation at the optimal frequency increases with the increase in surface tension compared with water injection without an oscillatory boundary. Our work promises a more economic, eco-friendly and controllable enhanced oil recovery.

Author Contributions

Conceptualization, H.S.; methodology, H.Y.; software, H.Y.; validation, J.L.; formal analysis, H.Y. and J.L.; investigation, H.Y. and D.T.; resources, H.S.; writing—original draft preparation, H.Y.; writing—review and editing, H.S.; visualization, J.L.; supervision, H.S. All authors have read and agreed to the published version of the manuscript.

Funding

The authors acknowledge financial support from the National Natural Science Foundation of China (No. 11972073).

Data Availability Statement

The raw data supporting the conclusion of this article will be made available by the authors, without undue reservation.

Conflicts of Interest

The authors declare no conflict of interest.

References

  1. Wei, C.J.; Song, H.Q.; Li, Y.; Zhang, Q.; Song, B.B.A.; Wang, J.L. Production Characteristics with Different Superimposed Modes Using Variogram: A Case Study of a Super-Giant Carbonate Reservoir in the Middle East. Energies 2017, 10, 250. [Google Scholar] [CrossRef] [Green Version]
  2. Song, J.L.; Zhang, J.; Liu, C.L.; Liu, C.; Zhu, K.K.; Yang, F.F.; Liu, X.G.; Figueiro Longo, J.P.; Alexandre Muehlmann, L.; Azevedo, R.B.; et al. Design and synthesis of pregnenolone/2-cyanoacryloyl conjugates with dual NF-kappaB inhibitory and anti-proliferative activities. Bioorg. Med. Chem. Lett. 2017, 27, 4682–4686. [Google Scholar] [CrossRef] [PubMed]
  3. Kong, E.; Zhu, J.; Wu, W.; Ren, H.; Jiao, X.; Wang, H.; Zhang, Z. Nifurtimox Inhibits the Progression of Neuroblastoma in vivo. J. Cancer 2019, 10, 2194–2204. [Google Scholar] [CrossRef] [PubMed] [Green Version]
  4. Zhang, J.; Song, H.Q.; Zhu, W.Y.; Wang, J.L. Liquid Transport Through Nanoscale Porous Media with Strong Wettability. Transp. Porous Media 2021, 140, 697–711. [Google Scholar] [CrossRef]
  5. Zhu, W.Y.; Li, J.H.; Lou, Y.; Song, H.Q. Experiment and Capillary Bundle Network Model of Micro Polymer Particles Propagation in Porous Media. Transp. Porous Media 2018, 122, 43–55. [Google Scholar] [CrossRef]
  6. Sæle, A.; Graue, A.; Alcorn, Z. Unsteady-state CO2 foam injection for increasing enhanced oil recovery and carbon storage potential. Adv. Geo-Energy Res. 2022, 6, 472–481. [Google Scholar] [CrossRef]
  7. Song, H.Q.; Cao, Y.; Yu, M.X.; Wang, Y.H.; Killough, J.E.; Leung, J. Impact of permeability heterogeneity on production characteristics in water-bearing tight gas reservoirs with threshold pressure gradient. J. Nat. Gas Sci. Eng. 2015, 22, 172–181. [Google Scholar] [CrossRef]
  8. Wan, T.; Yu, Y.; Sheng, J.J. Experimental and numerical study of the EOR potential in liquid-rich shales by cyclic gas injection. J. Unconv. Oil Gas Resour. 2015, 12, 56–67. [Google Scholar] [CrossRef] [Green Version]
  9. Wang, B.H.; Liang, Y.T.; Yuan, M.; Wang, J.H.; Zhang, H.R.; Li, X.J. Optimal design of oilfield surface pipeline networks for the cyclic water injection development method. J. Pet. Sci. Eng. 2018, 171, 1400–1408. [Google Scholar] [CrossRef]
  10. Song, H.Q.; Liu, C.C.; Lao, J.M.; Wang, J.L.; Du, S.Y.; Yu, M.X. Intelligent Microfluidics Research on Relative Permeability Measurement and Prediction of Two-Phase Flow in Micropores. Geofluids 2021, 2021, 1194186. [Google Scholar] [CrossRef]
  11. Wang, J.L.; Song, H.Q.; Wang, Y.H. Investigation on the micro-flow mechanism of enhanced oil recovery by low-salinity water flooding in carbonate reservoir. Fuel 2020, 266, 117156. [Google Scholar] [CrossRef]
  12. Sidiq, H.; Abdulsalam, V.; Nabaz, Z. Reservoir simulation study of enhanced oil recovery by sequential polymer flooding method. Adv. Geo-Energy Res. 2019, 3, 115–121. [Google Scholar] [CrossRef]
  13. Kulathu, S.; Dandekar, A.; Patil, S.; Khataniar, S. Low salinity cyclic water floods for enhanced oil recovery on Alaska North Slope. In Proceedings of the SPE Asia Pacific Oil and Gas Conference and Exhibition, Jakarta, Indonesia, 22–24 October 2013. [Google Scholar]
  14. Xie, C.Y.; Lei, W.H.; Balhoff, M.T.; Wang, M.R.; Chen, S.Y. Self-adaptive preferential flow control using displacing fluid with dispersed polymers in heterogeneous porous media. J. Fluid Mech. 2021, 906, A10. [Google Scholar] [CrossRef]
  15. Ji, Y.L.; Zhuang, L.; Wu, W.; Hofmann, H.; Zang, A.; Zimmermann, G. Cyclic Water Injection Potentially Mitigates Seismic Risks by Promoting Slow and Stable Slip of a Natural Fracture in Granite. Rock Mech. Rock Eng. 2021, 54, 5389–5405. [Google Scholar] [CrossRef]
  16. Li, Y.; Zhao, L.M.; Wang, S.; Sun, L.; Zhang, W.Q.; Yang, Y.; Hu, D.D.; Chen, Y.H. Using cyclic alternating water injection to enhance oil recovery for carbonate reservoirs developed by linear horizontal well pattern. Pet. Explor. Dev. 2021, 48, 1139–1151. [Google Scholar] [CrossRef]
  17. Liu, L.J.; Liu, Y.Z.; Yao, J.; Huang, Z.Q. Mechanistic study of cyclic water injection to enhance oil recovery in tight reservoirs with fracture deformation hysteresis. Fuel 2020, 271, 117677. [Google Scholar] [CrossRef]
  18. Pourabdollah, K. Process Design of Cyclic Water Flooding by Real-Time Monitoring. J. Energy Resour. Technol.-Trans. ASME 2018, 140, 112701. [Google Scholar] [CrossRef]
  19. Xie, C.Y.; Qi, P.P.; Xu, K.; Xu, J.P.; Balhft, M.T. Oscillative Trapping of a Droplet in a Converging Channel Induced by Elastic Instability. Phys. Rev. Lett. 2022, 128, 054502. [Google Scholar] [CrossRef]
  20. Xie, C.Y.; Xu, K.; Mohanty, K.; Wang, M.R.; Balhoff, M.T. Nonwetting droplet oscillation and displacement by viscoelastic fluids. Phys. Rev. Fluids 2020, 5, 063301. [Google Scholar] [CrossRef]
  21. Zhang, T.C.; Zou, Q.L.; Jia, X.Q.; Liu, T.; Jiang, Z.B.; Tian, S.X.; Jiang, C.Z.; Cheng, Y.Y. Effect of cyclic water injection on the wettability of coal with different SiO2 nanofluid treatment time. Fuel 2022, 312, 122922. [Google Scholar] [CrossRef]
  22. Turakhanov, A.; Tsyshkova, A.; Mukhina, E.; Popov, E.; Kalacheva, D.; Dvoretskaya, E.; Kasyanenko, A.; Prochukhan, K.; Cheremisin, A. Cyclic Subcritical Water Injection into Bazhenov Oil Shale: Geochemical and Petrophysical Properties Evolution Due to Hydrothermal Exposure. Energies 2021, 14, 4570. [Google Scholar] [CrossRef]
  23. Wei, C.J.; Wang, L.G.; Li, B.Z.; Xiong, L.H.; Liu, S.S.; Zheng, J.; Hu, S.M.; Song, H.Q. A Study of Nonlinear Elasticity Effects on Permeability of Stress Sensitive Shale Rocks Using an Improved Coupled Flow and Geomechanics Model: A Case Study of the Longmaxi Shale in China. Energies 2018, 11, 329. [Google Scholar] [CrossRef] [Green Version]
  24. Xie, C.Y.; Lv, W.F.; Wang, M.R. Shear-thinning or shear-thickening fluid for better EOR?—A direct pore-scale study. J. Pet. Sci. Eng. 2018, 161, 683–691. [Google Scholar] [CrossRef]
  25. Yin, D.Y.; Zhou, W. Mechanism of Enhanced Oil Recovery for In-Depth Profile Control and Cyclic Waterflooding in Fractured Low-Permeability Reservoirs. Geofluids 2021, 2021, 6615495. [Google Scholar] [CrossRef]
  26. Surguchev, L.; Koundin, A.; Melberg, O.; Rolfsvag, T.A.; Menard, W.P. Cyclic water injection: Improved oil recovery at zero cost. Pet. Geosci. 2002, 8, 89–95. [Google Scholar] [CrossRef]
  27. Stirpe, M.; Guzman, J.; Manrique, E.; Alvarado, V. Cyclic water injection simulations for evaluations of its potential in Lagocinco field. In Proceedings of the SPE/DOE Symposium on Improved Oil Recovery, Tulsa, OK, USA, 17–21 April 2004. [Google Scholar]
  28. Meng, X.; Zhang, Q.; Dai, X.; Xue, S.; Feng, X.; Zhang, Y.; Tu, B.; Li, X. Experimental and simulation investigations of cyclic water injection in low-permeability reservoir. Arab. J. Geosci. 2021, 14, 791. [Google Scholar] [CrossRef]
  29. Sun, X.F.; Zhang, Y.Y.; Wu, J.; Xie, M.K.; Hu, H. Optimized Cyclic Water Injection Strategy for Oil Recovery in Low-Permeability Reservoirs. J. Energy Resour. Technol.-Trans. ASME 2019, 141, 012905. [Google Scholar] [CrossRef]
  30. Yu, Y.; Sheng, J.J. Experimental investigation of light oil recovery from fractured shale reservoirs by cyclic water injection. In Proceedings of the SPE Western Regional Meeting, Anchorage, AK, USA, 23–26 May 2016. [Google Scholar]
  31. Zhan, J.; Fan, C.; Ma, X.L.; Zheng, Z.G.; Su, Z.Z.; Niu, Z.H. High-Precision Numerical Simulation on the Cyclic High-Pressure Water Slug Injection in a Low-Permeability Reservoir. Geofluids 2021, 2021, 3507426. [Google Scholar] [CrossRef]
  32. Cha, L.M.; Xie, C.Y.; Feng, Q.H.; Balhoff, M. Geometric Criteria for the Snap-Off of a Non-Wetting Droplet in Pore-Throat Channels With Rectangular Cross-Sections. Water Resour. Res. 2021, 57, e2020WR029476. [Google Scholar] [CrossRef]
  33. Xie, C.Y.; Balhoff, M.T. Lattice Boltzmann Modeling of the Apparent Viscosity of Thinning-Elastic Fluids in Porous Media. Transp. Porous Media 2021, 137, 63–86. [Google Scholar] [CrossRef]
  34. Brackbill, J.U.; Kothe, D.B.; Zemach, C. A continuum method for modeling surface tension. J. Comput. Phys. 1992, 100, 335–354. [Google Scholar] [CrossRef]
  35. Hirt, C.W.; Nichols, B. Volume of fluid (VOF) method for the dynamics of free boundaries. J. Comput. Phys. 1981, 39, 201–225. [Google Scholar] [CrossRef]
  36. Cha, L.; Feng, Q.; Wang, S.; Xu, S.; Xie, C. Pore-Scale Modeling of Immiscible Displacement In Porous Media: The Effects of Dual Wettability. SPE J. 2022, SPE-210589-PA. [Google Scholar] [CrossRef]
  37. Raeini, A.Q.; Blunt, M.J.; Bijeljic, B. Modelling two-phase flow in porous media at the pore scale using the volume-of-fluid method. J. Comput. Phys. 2012, 231, 5653–5668. [Google Scholar] [CrossRef]
  38. Eymard, R.; Gallouët, T.; Herbin, R. Finite volume methods. Handb. Numer. Anal. 2000, 7, 713–1018. [Google Scholar]
  39. Beresnev, I.A. Theory of vibratory mobilization on nonwetting fluids entrapped in pore constrictions. Geophysics 2006, 71, N47–N56. [Google Scholar] [CrossRef]
  40. Beresnev, I.A.; Vigil, R.D.; Li, W.; Pennington, W.D.; Turpening, R.M.; Iassonov, P.P.; Ewing, R.P. Elastic waves push organic fluids from reservoir rock. Geophys. Res. Lett. 2005, 32, L13303. [Google Scholar] [CrossRef] [Green Version]
  41. Deng, W.; Cardenas, M.B. Dynamics and dislodgment from pore constrictions of a trapped nonwetting droplet stimulated by seismic waves. Water Resour. Res. 2013, 49, 4206–4218. [Google Scholar] [CrossRef]
Figure 1. The schematics of the simulation for the cyclic water injection stimulated two-phase displacements in porous media. The computational domain and initial fluid distributions.
Water 14 03961 g001
Figure 2. The schematic of droplet displacement by an elastic wave in a pore-scale channel.
Water 14 03961 g002
Figure 3. The threshold pressure difference Δ P A , t required for the elastic wave to successfully squeeze droplets under different frequencies: comparisons between the simulation results and theoretical predictions by Deng et al. [41].
Water 14 03961 g003
Figure 4. The effect of wave frequency on EOR. (a) The relationship between the frequency and the final remaining oil saturation. (b) The final remaining oil saturation of three typical frequencies.
Water 14 03961 g004
Figure 5. Comparison of residual oil saturation affected by various interfacial tensions γ in different frequencies.
Water 14 03961 g005
Figure 6. Schematic diagram of a single trapped oil droplet in the pore, where the yellow area represents trapped oil droplet, the blue area is water, and the black area is grain.
Water 14 03961 g006
Figure 7. Comparison of residual oil saturation affected by various viscosities of oil μ o in different frequencies.
Water 14 03961 g007
Table 1. The frequency of various conditions.
Parameters (Unit)Baseline ValueDiscussed Value
The   interfacial   tension   γ (N/m)0.020.01, 0.03
The   viscosity   of   the   oil   μ o (Pa·s)0.010.005, 0.015
The   frequency   f (HZ)050, 80, 100, 120, 150, 200
Table 2. Geometric parameters and flow properties used in simulations.
Parameters (Unit)Value
The minimum radius of the throat R m i n (mm)0.5
The maximum radius of the pore R m a x (mm)2
The inlet position L i n (mm)−20
The outlet position L o u t (mm)20
The length of the sinusoidal part of the channel 2 L (mm)20
The density of the wetting phase ρ w (kg/m3)1000
The viscosity of the wetting phase μ w (Pa·s)0.001
The droplet density ρ o (kg/m3)1000
The droplet viscosity μ o (Pa·s)0.01
The interfacial tension σ (N/m)0.05
The static contact angle θ (°)0
Publisher’s Note: MDPI stays neutral with regard to jurisdictional claims in published maps and institutional affiliations.

