Article

Mathematical Modeling of Microalgal Growth during Anaerobic Digestion Effluent Bioremediation

by
Georgios Manthos
,
Eleni Koutra
,
Savvas Giannis Mastropetros
,
Dimitris Zagklis
and
Michael Kornaros
*
Laboratory of Biochemical Engineering & Environmental Technology (LBEET), Department of Chemical Engineering, University of Patras, 26504 Patras, Greece
*
Author to whom correspondence should be addressed.
Water 2022, 14(23), 3938; https://doi.org/10.3390/w14233938
Submission received: 31 October 2022 / Revised: 26 November 2022 / Accepted: 30 November 2022 / Published: 3 December 2022

Abstract

:
The development of kinetic models aims at predicting the behavior of a system or analyzing the underlying mechanisms. This process is essential for understanding microalgal growth and optimizing culture conditions. In the case of microalgal cultivation in wastewater, the analysis becomes even more difficult as growth is often inhibited by several factors, such as nutrient limitation and light inadequacy. In this context, a mathematical model was developed to describe the microbial growth of the species Parachlorella kessleri in different reactor setups using either sterile or non-sterile anaerobic digestion effluent as a substrate. Three different mass balances were taken into consideration to describe biomass growth, phosphorus, and nitrogen consumption. Concerning biomass growth, the logistic model was applied to evaluate the inhibition in biomass formation due to lack of illumination. The maximum optical density under which these species could grow was quantified with an ODmax parameter, which was estimated at 4.07 AU/cm for the Erlenmeyer flask and 2.79 AU/cm for cylindrical photobioreactors. Regarding the nitrogen mass balance, two different terms concerning microalgal assimilation and ammonia stripping were implemented into the equation. The proposed model predicted biomass growth with high accuracy in model training (R2 = 0.90) and validation (R2 = 0.89).

1. Introduction

Anaerobic digestion, as a biogas production process through the exploitation of organic waste, becomes more and more common, as it is applied both by specialized units and by individuals in agricultural areas and households [1]. According to the European Biogas Association, biogas production units within European borders increased by approximately 11,000 from 2009 to 2016, and this number continues to grow to this day [2]. In the United States, although the number of biogas units is small (about 2000 plants), more than 10,000 plants are expected to be built in the coming years [2]. Finally, it is worth mentioning that in China the largest source of biogas production is household digesters, which are estimated to be over 40 million in number [2].
The widespread use of this process results in the production of large volumes of solid residues (residual biomass) and liquid effluents that need to be properly evaluated and managed. Although the entire effluent, called digestate, is often used as a fertilizer due to its ammonium nitrogen (NH4-N) and total phosphorus (TP) content, this should be carried out with caution, as it may lead to undesirable consequences in case the digestate contains elevated levels of ammonia and/or organic carbon [3]. The discharge of these effluents into water recipients causes an increase in the concentration of nutrients, rapidly leading to eutrophication [4,5]. In the case of the direct land application of the digestate as liquid fertilizer, part of the contained nutrients can end up in underground aquifers and cause eutrophication in nearby water recipients [6]. Furthermore, when digestates are deposited on arable land, they likely burden the soil due to their heavy metals content and the pathogenic microorganisms might be contained [7]. Various physicochemical treatments such as membrane filtration, ammonia stripping, and phosphorus recovery through struvite precipitation have been proposed in the literature, but their high cost directs interest to biological management methods [3,8,9,10]. Another method of digestate treatment is the construction of wetlands, where a plethora of biological and physicochemical processes occur with the aim of producing biomass. Despite the satisfactory reduction of both organic carbon and nitrogen, operation instability is observed related to changes in weather conditions [11]. In addition to wetlands, the cultivation of specific robust species of photosynthetic microorganisms in these effluents offers a high yield of nutrient reduction.
Both microalgae and cyanobacteria can consume nitrogen, phosphorous, and organic carbon provided by wastewater and convert them into valuable biopolymers such as proteins, sugars, and lipids [12]. The use of wastewater as a substrate for microalgae growth could replace the expensive synthetic substrates and vast volumes of water needed for their cultivation, positively affecting the economic viability of a biorefinery approach for this type of effluent [13]. On the other hand, the cultivation of photosynthetic microorganisms in digestates seems to be a demanding process, mainly due to the toxicity of the high ammonia levels and the effluent’s turbidity, which in combination with its dark color, hinders photosynthetic activity [14,15]. Finally, since the composition of the anaerobic effluent depends on the material that was anaerobically processed, certain heavy metals, such as arsenic and chromium derived from agro-industrial products, coexist with nutrients, making the growth environment unfavorable [16,17].
Regardless of the process’ scale (lab, pilot, or industrial), photosynthetic microorganisms are cultivated either in open or closed systems. The most common open-type containers are elongated basins, while the various photobioreactors (PBRs) are considered closed systems. Although open ponds are characterized by low construction and operation costs, promoting waste treatment on a large scale, open cultures get more easily contaminated and make harvesting difficult. On the contrary, photobioreactors provide easily controlled culture conditions with the gain of a high productivity; however, they have a high construction cost [18,19].
During the last decades, a large variety of photosynthetic microorganisms (eukaryotic microalgae and prokaryotic cyanobacteria) have been examined with the aim of anaerobic effluent treatment. Some of the species that have been tested in substrates containing digestate and exhibited remarkable performance are Chlorella vulgaris and Arthrospira platensis [20,21]. Despite the existence of many published results regarding photosynthetic cultures, few mathematical models have been developed to describe such biological processes, as many difficulties arise approaching, not only the biological assimilation of nutrients but also the various physicochemical processes that take place. Thus, closed bioreactors with regulated conditions (pH, temperature, etc.) are currently preferred in order to avoid unpredictable/undesirable phenomena in favor of developing models to study microalgae and cyanobacteria [22]. Many authors have studied microalgae cultivation modeling. Several authors have used the Monod model to describe the microbial growth with several modifications to include the irradiance at the reactor surface [23], while others have tried to estimate the maximum specific growth rate after linearization of the Monod equation [24]. Moreover, He et al. have implemented the logistic equation to biomass mass balance to describe the maximum biomass concentration of microalgae in the reactor [25].
From this point of view, the present work aims to evaluate a not-so-widely studied photosynthetic microorganism, Parachlorella kessleri, which was called to adapt and proliferate in the substrate with anaerobic effluent. For a complete analysis of this specific species’ behavior, a mathematical model was developed which satisfactorily described both the biomass accumulation and the biodegradation of the liquid digestate in batch photobioreactors. The constructed mathematical model can be applicable in the cases of many microalgae and cyanobacteria growing in wastewater, but small alterations will be needed according to the metabolism to be described.

2. Materials and Methods

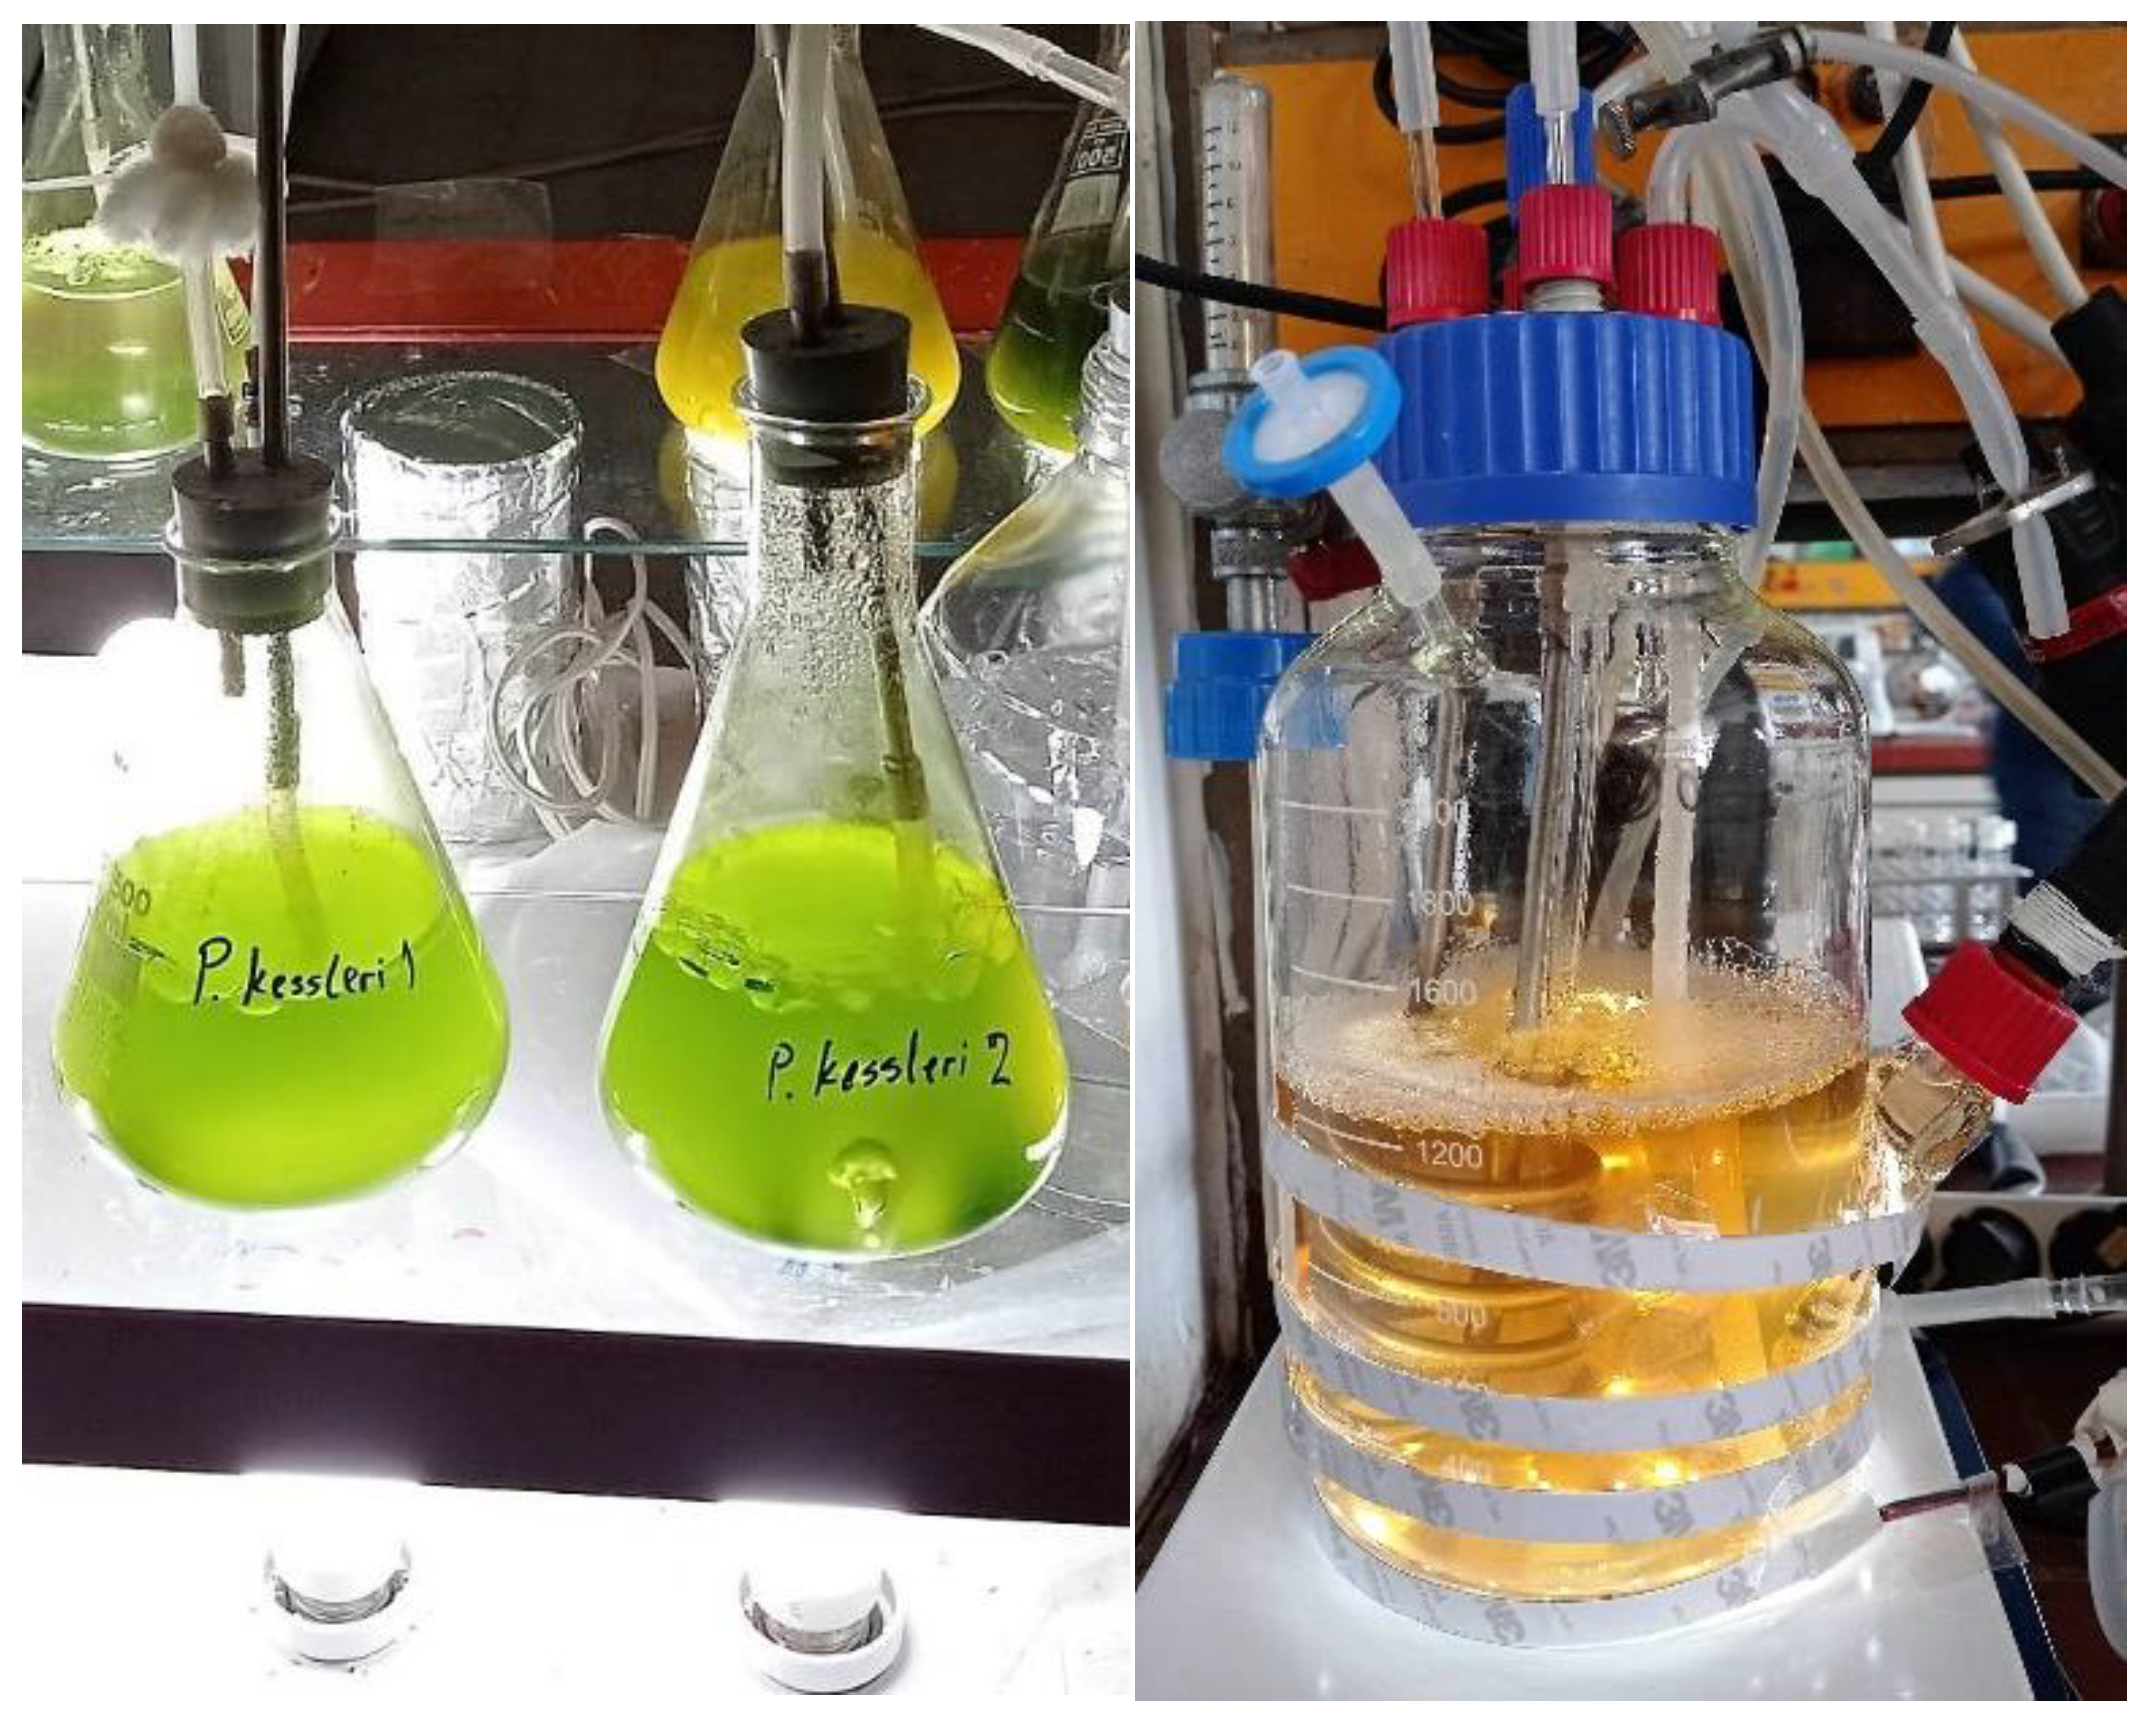
2.1. Microalgal Species

The microalgal species used was Parachlorella kessleri. This specific species belongs to the Chlorophyta and is characterized by a high biomass production and fatty acids accumulation, even when cultivated in wastewater [26,27]. P. kessleri (211–11 g) was obtained from the SAG Culture Collection (University of Göttingen), and aseptic medium BG-11 (73816, Sigma-Aldrich, St. Louis, Missouri, MO, USA) supplemented with trace element solution (Mix A5 with Co 92949, Sigma-Aldrich) was used. Cultures were kept in Erlenmeyer flasks under 25 °C using an air heater and a thermostat. In addition, constant cool white illumination of about 25 μmol photons m−2 s−1 was provided by LED lamps.

2.2. Experimental Setup

Before each experimental culture, inoculums/pre-cultures were prepared in BG-11 supplemented with trace elements at 25 °C. Cool white illumination of 200 μmol photons m−2 s−1 from a LED white bulb and aeration of approximately 0.5 L min−1 were continuously provided.
In the first stage, cultures were carried out in 500 mL Erlenmeyer flasks containing 2% v/v (8 mL of digestate in medium with total volume of 400 mL) and 10% v/v (40 mL of digestate in medium with total volume of 400 mL) anaerobic effluent as substrate. Specifically, the effluent that was used originated from the local agro-industrial activity and contained 3.67 ± 0.87 g NH4-N L−1 and 0.15 ± 0.02 g TP L−1. The liquid digestate was diluted with ultrapure water and sterilized (121 °C, 20 min) when necessary. Cultures were illuminated with cool white light at 200 μmol photon m−2 s−1 and filtered atmospheric air was supplied to the culture medium at a flow rate of approximately 0.5 L min−1 Lculture−1. The temperature was maintained at 25 ± 2 °C, while the pH value was initially set at 7.8 and was regularly adjusted by the addition of dilute acid or base solution to remain at 8.0 ± 1.0, according to the literature [28,29]. During cultivation time, biomass growth was monitored simultaneously with the consumption of NH4-N and phosphorus. The goal was the collection of data to train the developed mathematical model describing the cultivation of the microalga P. kessleri in the anaerobic effluent.
Subsequently, cultivation was carried out in substrates with an anaerobic effluent of non-sterilized medium at 10% v/v. These experiments were run in cylindrical photobioreactors with a working volume of 1 L under controlled temperature and pH. More specifically, the temperature was maintained at 25 ± 2 °C and pH was kept at 8.0 ± 0.5, similar to the cultures for calibrating the model. In the case of the photobioreactors, the light was derived by LED strips with 400 μmol of photons m−2 s−1, and aeration was ensured at a flow rate of 0.5 L min−1 Lculture−1. Both experimental setups (Erlenmeyer flasks and photobioreactors) are presented in Figure 1.
The biomass growth limitations were crucial factors in model accuracy since they determined the trend of the other independent variables (P and N). To this end, different experiments with cultivations in sterilized and non-sterilized anaerobic digestion effluent (ADE) were used to calibrate the proposed model in different ADE loadings (2%, 10% v/v) and experimental set-ups (Erlenmeyer flasks and PBR). The prediction of the biomass growth was tested in sterilized ADE loadings of 1% and 50% v/v. Regarding the N and P accumulation performance, data from experiments in Erlenmeyer flasks with ADE loading of 2% and 10% v/v were used for model training, while the results of PBR fermentation performance were used for model validation. These statements are summarized in Table 1.

2.3. Analytical Techniques

The increase in biomass concentration was related to the increase in solid particles in the liquid medium. Thus, the cell growth was calculated based on the dry weight of the suspended solids measured according to the Standard Methods for the Determination of Total Suspended Solids (TSS) [30].
Determination of the concentration of both NH4-N and total TP was carried out during microalgal cultivation to evaluate the bioremediation of the digestate. Analysis was performed on filtered samples (using Whatman GF/F filters). The concentration of both NH4-N and TP was measured according to Standard Methods [30]. More specifically, NH4-N was determined by the photometric ‘’phenate’’ method, while phosphorus was estimated by the ascorbic acid assay [30]. The total amount of NH4-N corresponds to the nitrogen present in the samples in both NH4+ and NH3 forms.

2.4. Model Development

The description of the P. kessleri growth, expressed as dry biomass concentration (g DW L−1), was based on the logistic model (sigmoidal growth curve), which is widely used to describe microalgal autotrophic cultures [31,32]. According to this type of model, there is no substrate dependence on the specific growth rate. It predicts the increase of a variable up to a maximum value. In this case, the biomass inhibition was quantified with a maximum optical density parameter (ODmax). Thus, when the optical density reaches the ODmax value the biomass growth stops. The equation that describes the biomass accumulation is presented in Equation (1).
d x d t = μ m a x   x   ( 1 O D x w + O D d i g O D m a x   )
where x indicates the biomass concentration at time t, μ m a x represents the maximum specific growth rate, while ODdig represents the digestate’s optical density measured by the absorbance at 550 nm (not time-dependent and calculated considering the concentration of the digestate in the growth medium). The biomass optical density (ODxw) was dependent on the biomass concentration according to Equation (2), which correlates microalgal concentration with its optical density value at 550 nm (this was identified experimentally in synthetic medium with different biomass concentrations, and the experimental data are included in Appendix A).
O D x w = x 0.3427   0.0504
At the same time, the biological assimilation of the dissolved phosphorus was described by Equation (3):
d P d t = 1 Y x / p   d x d t
where Y x / p is the yield coefficient for the amount of biomass produced over phosphorus consumption. This equation considers that the rate of phosphorus assimilation is related to the biomass growth rate. Finally, a mathematical equation was developed to describe the removal of NH4-N, which is attributed to both biological assimilation and ammonia stripping due to the alkaline pH of the anaerobic effluent and the forced aeration of the system. The biological assimilation of N was modeled similarly with the case of P, with its rate being controlled by biomass production, and a yield coefficient for the amount of biomass produced over nitrogen consumption (Yx/N). The ammonia stripping process can be described by the chemical equilibrium between NH3 and NH4+, and the mass transfer of free ammonia at the bulk’s interface with the air bubbles (Equation (4)):
d Ν d t = 1 Y x / N   d x d t A r N k l a ( [ N H 3 ] k H P N H 3 )
where Y x / N represents the yield coefficient of biomass to NH4-N [g biomass/g NH4-N], PNH3 indicates the ammonia partial pressure in equilibrium between liquid and gas phase, ArN indicates the nitrogen atomic mass [g N/mol N], kH is the Henry’s constant for ammonia equilibrium, and kla is an indicative hyperparameter for the mass transfer coefficient at the liquid-gas interface multiplied by the volumetric flow of the air supplied to the system [d−1]. The ammonia concentration in a solution, [NH3], can be estimated from the equilibrium of NH3-NH4+ at a certain pH (Equation (5)). The estimation of ammonia in the liquid phase was done using Equations (5) and (6).
[ N m e a s u r e d ] = [ N H 4 + ] + [ N H 3 ]
K a = [ N H 3 ]   [ H + ] [ N H 4 + ]
The main assumption that was made was that the ammonia concentration in the gas phase of the liquid-gas interface equilibrium was zero due to its negligible concentration in combination with the intense mass transfer phenomena caused by the continuous atmospheric air supply. This fact was a reasonable assumption considering that negligible ammonia content in the gas phase can be maintained through a high aeration rate [33]. Considering this equilibrium, the nitrogen mass balance equation was transformed to Equation (7):
d Ν d t = 1 Y x / N   d x d t A r N k l a K a [ N m e a s u r e d ] K a + 10 p H

2.5. Numerical Methods

The estimation of the model’s parameters was carried out in the model training step. The data that were used in this step were experimental results of P. kessleri cultivations in different digestate dilution, in either sterilized or non-sterilized conditions, cultivated both in Erlenmeyer flasks and PBR setup. The model training step was initialized by setting initial values to the parameters. The algorithm was constructed to find the optimum parameter values to minimize the sum of squares of errors between the experimental and theoretically estimated values (Equation (8)).
min x j = 1 m i = 1 n ( y e x p , i , j y s i m , i , j ) 2 max ( y e x p , j )
where y e x p , i , j denotes the experimental data in point i and experiment j and y s i m , i , j denotes the numerical estimated data in point i and experiment j. The normalization of the ‘sum of errors ’ with the maximum experimental value for an experiment was carried out in order to balance the parameter optimization, avoiding the favoring of the compounds with higher concentration values.
The mathematical modeling was performed using the MATLAB R2018a software, a numerical computing environment, which, among other things, is used to solve differential equations with numerical methods such as the native function ode23s. In addition, the optimization tool used was the fmincon function, which computes the minimum of a constrained multivariate gradient function f(x) starting from an initial estimate xo. The confidence intervals were estimated by linearizing the total error and propagating it to the parameters using Taylor theorem and Jacobian matrix according to [34,35,36].
After the model calibration step, the model validity was tested using experimental data that was not used in the model training step. A good fit of the simulated to experimental data denotes that the model might accurately predict cultivation behaviors outside of its training dataset.

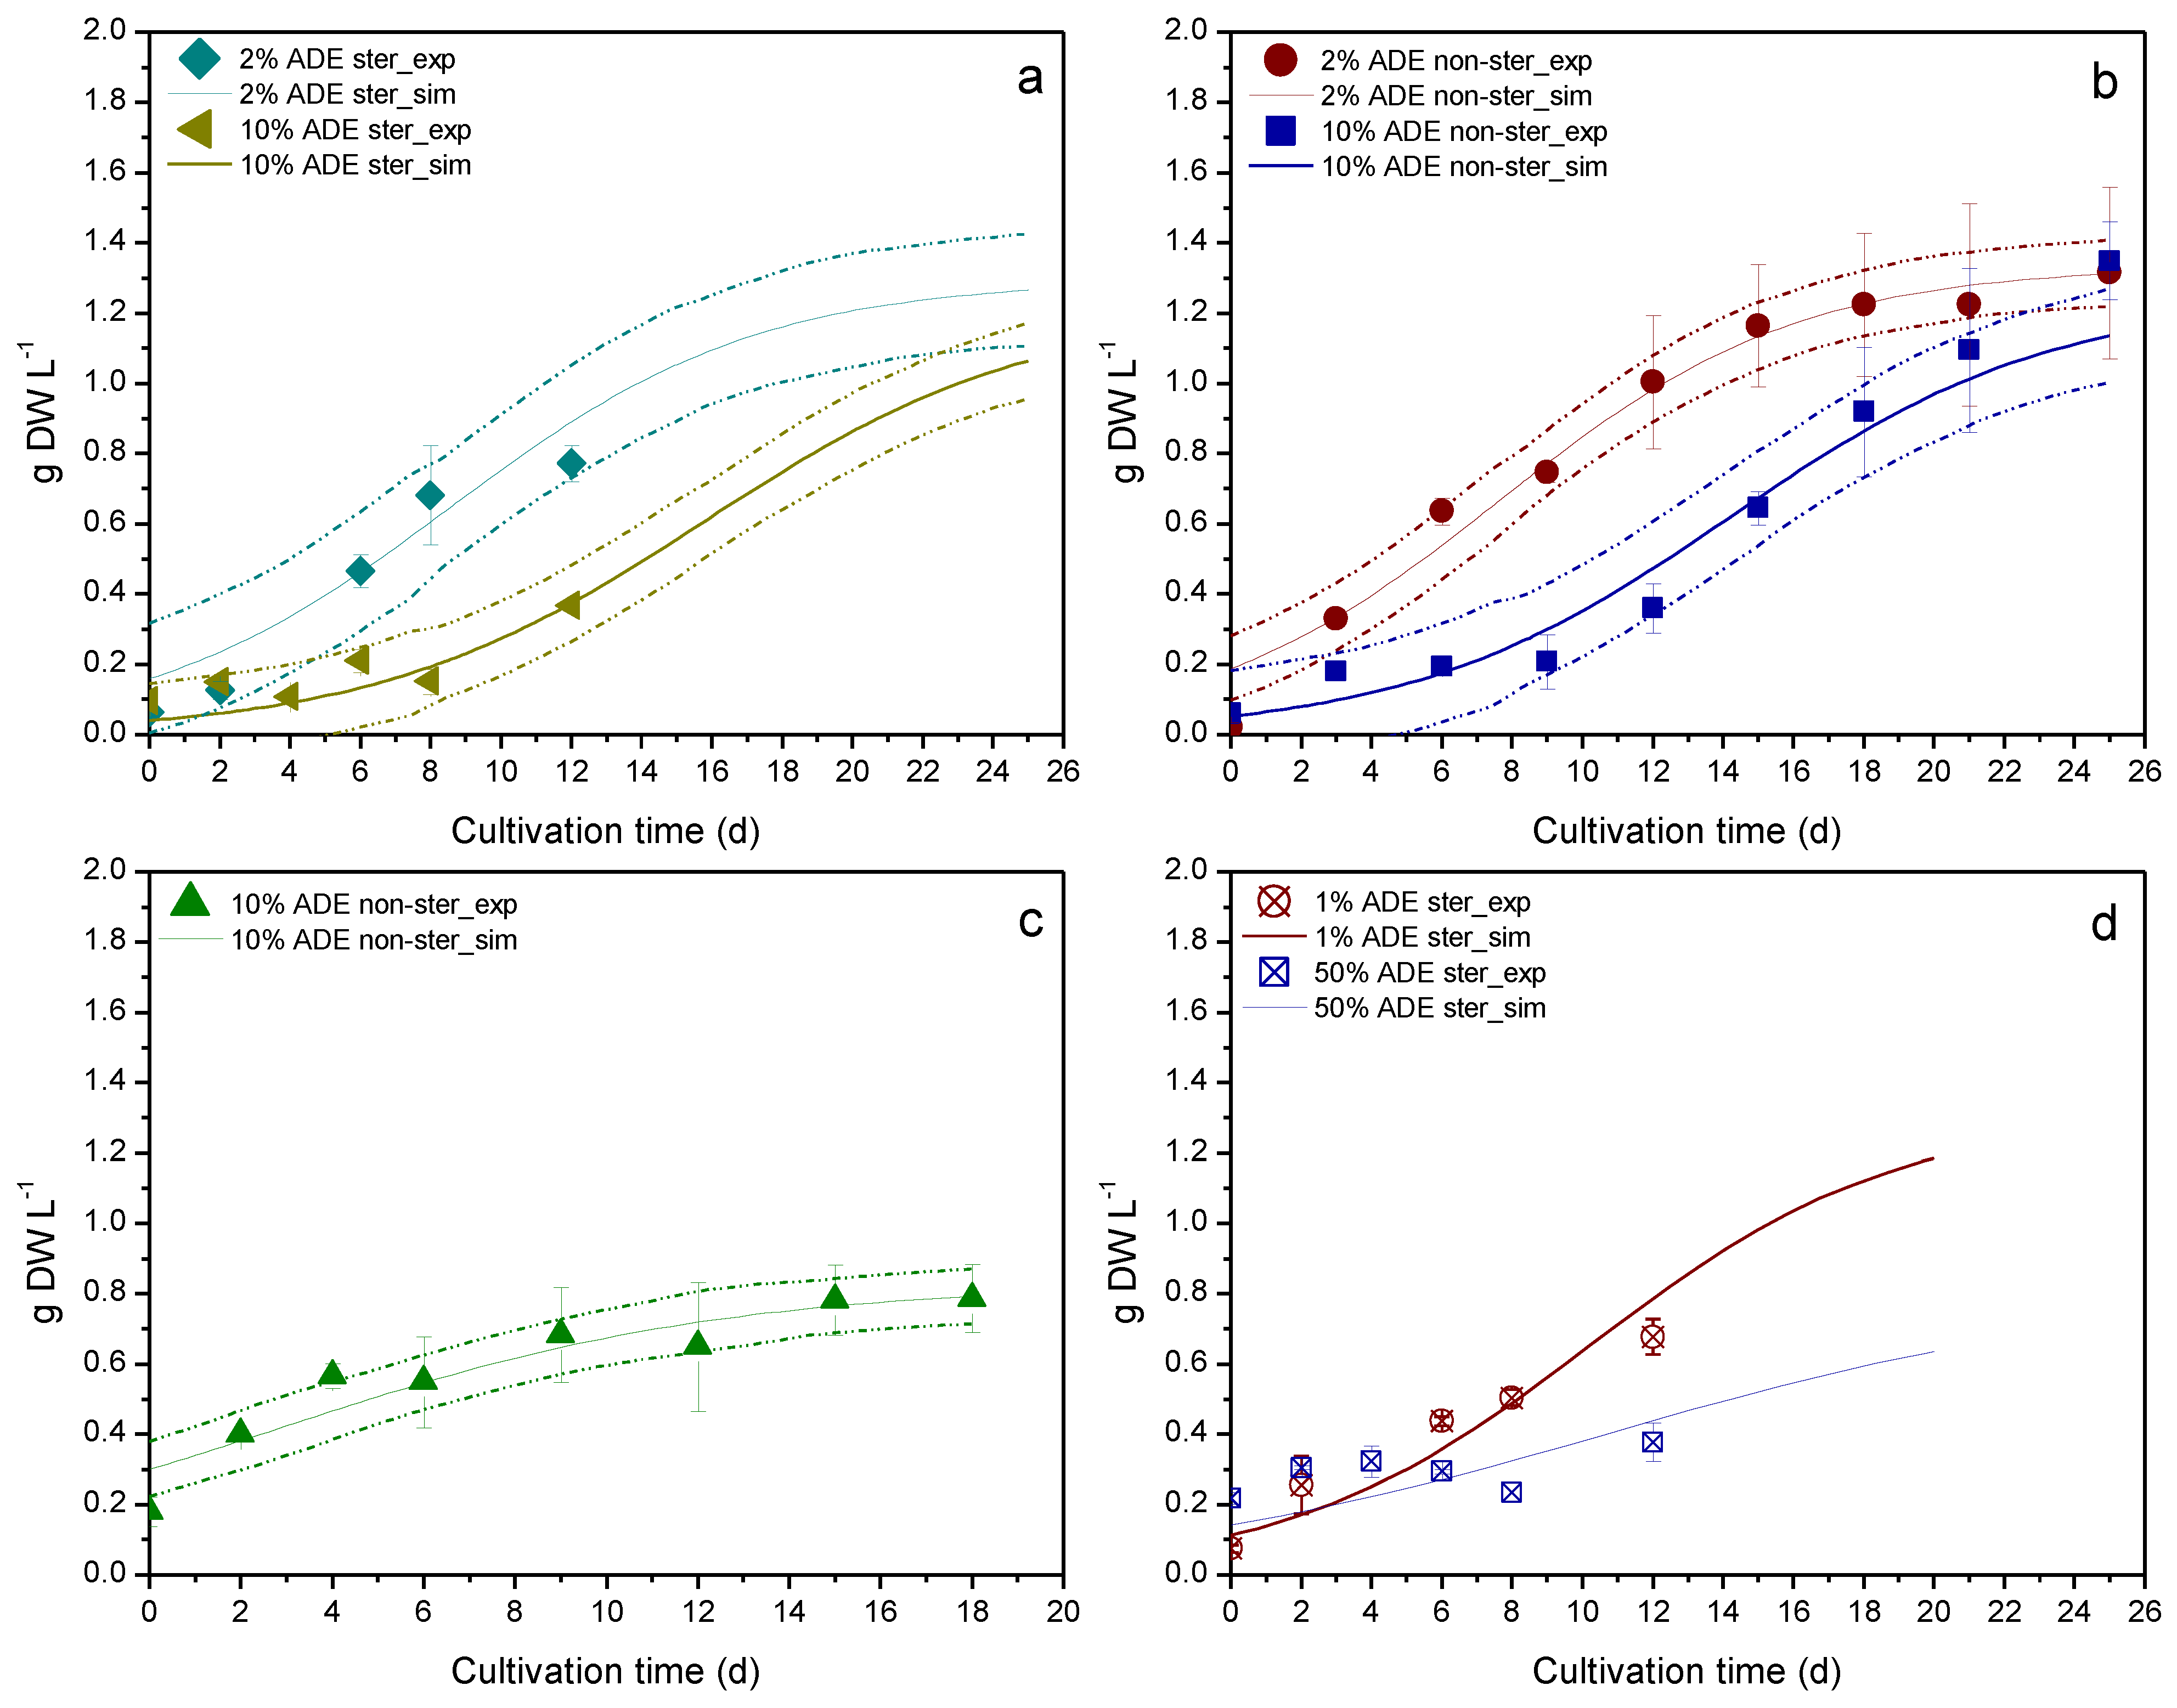
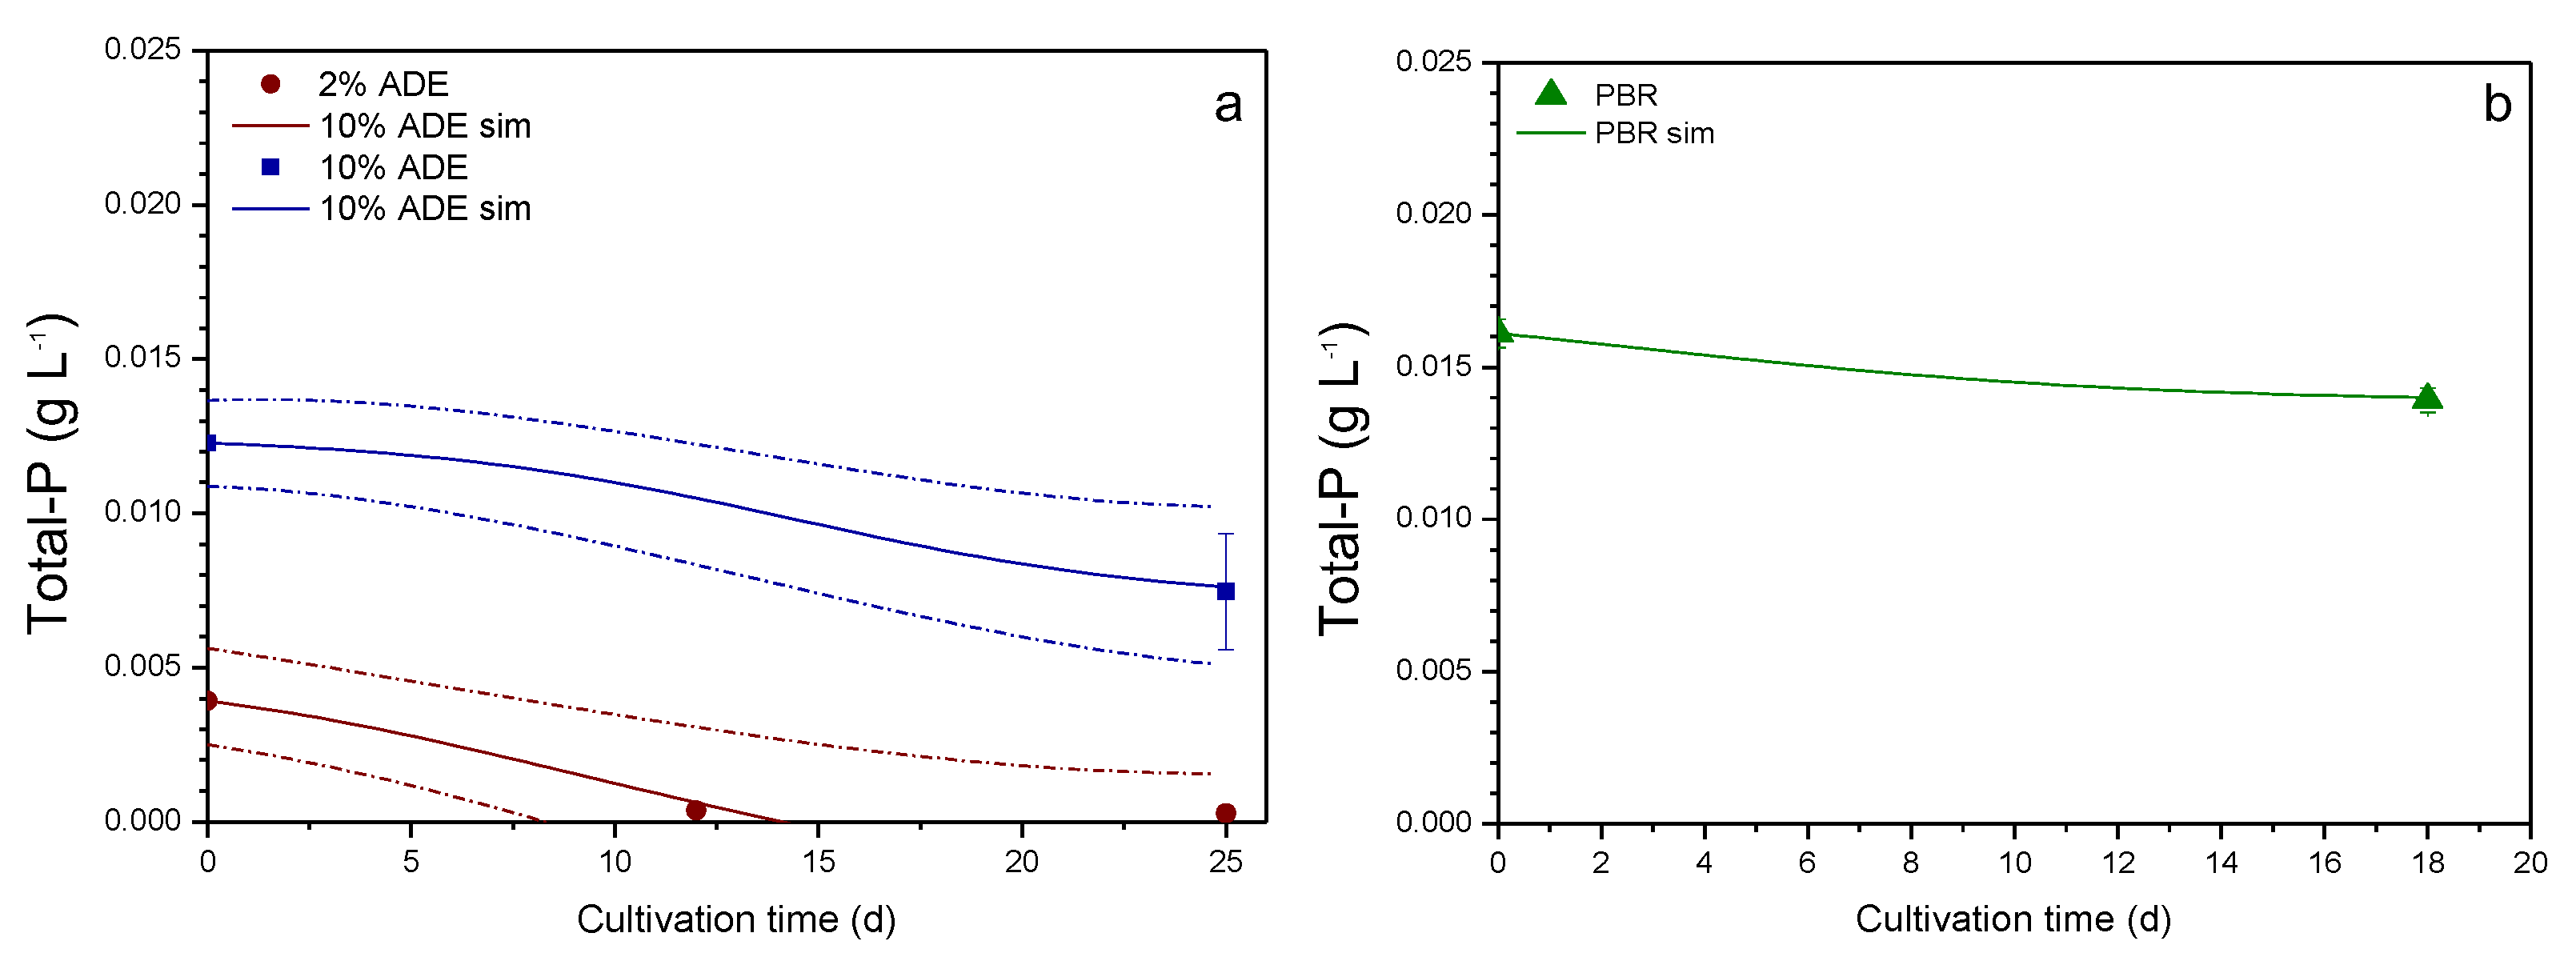
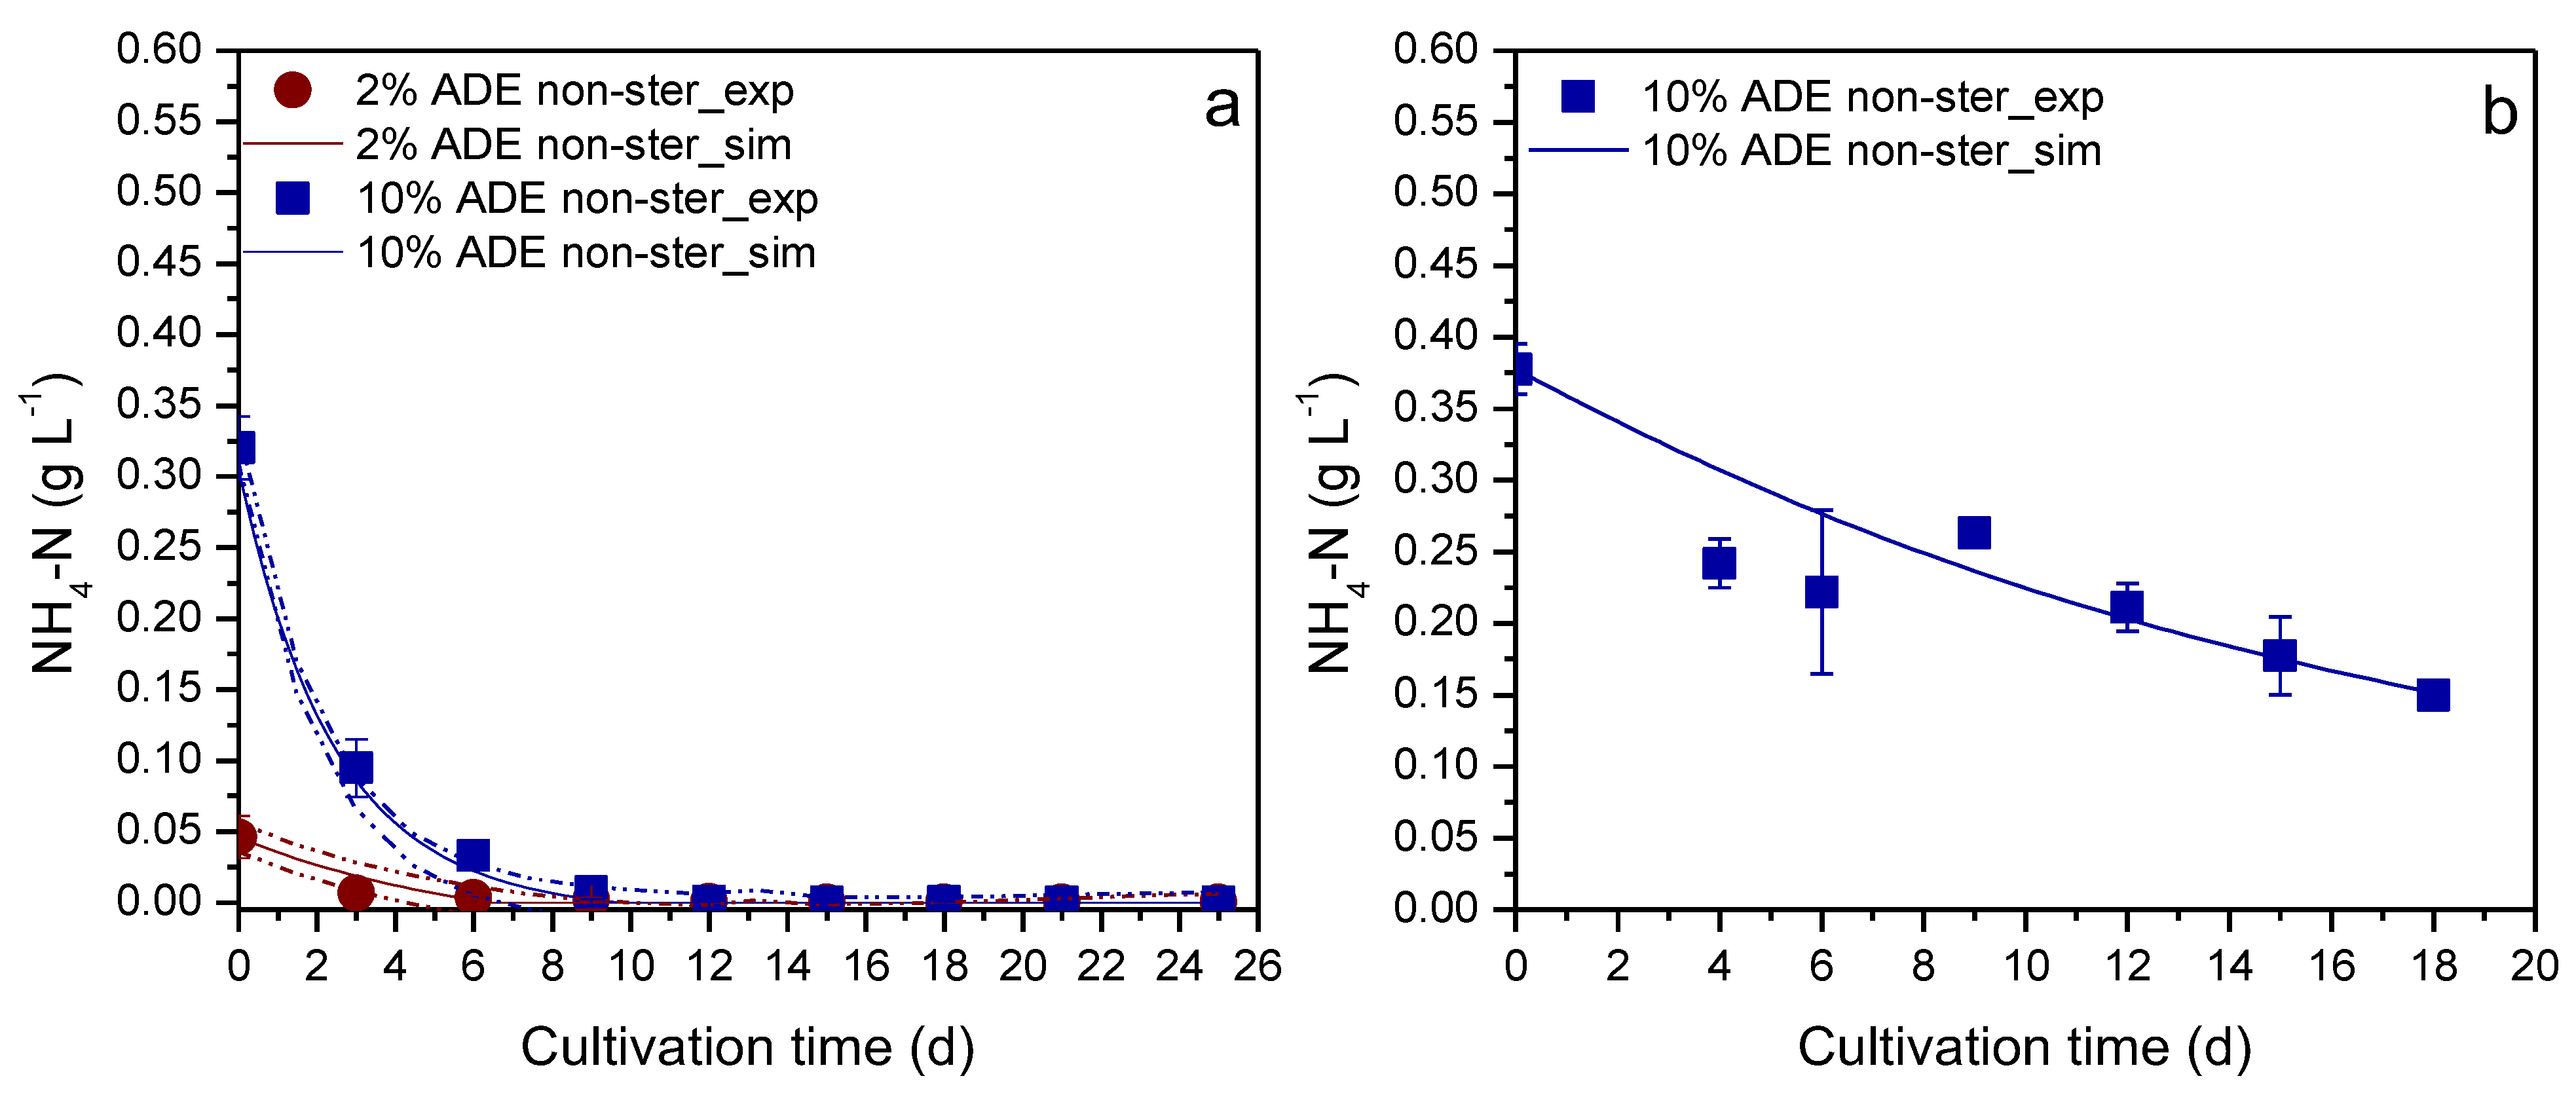
3. Results & Discussion

The results obtained from the experimental measurements and model simulation for P. kessleri biomass production at different concentrations of the anaerobic effluent under sterile and non-sterile conditions, as well as in different experimental setups (Erlenmeyer flasks and PBR) (Figure 2), demonstrate microalgal growth prediction with high accuracy. It was observed that the model can satisfactorily describe biomass growth in both sterilized and non-sterilized substrate. This fact might indicate the dominance of the microalgal species against the other digestate bacteria in the cultivation since only the microalgae growth rate has been considered in the model equations.
The estimated parameters of the proposed model are presented in Table 2. The experimental results of the PBR operation (N and P) were used for model validation. Nevertheless, the ODmax parameter was re-estimated considering the different illumination sources and set-up. All the other parameters were kept constant in the model validation step.
It was observed that the biomass concentration reached a maximum value of 1.2 g/L in Erlenmeyer flasks and only 0.8 g/L in PBR. This fact demonstrates that the Erlenmeyer flask was a more efficient arrangement regarding lighting efficiency than PBR in which the light source was LED strips, despite the higher intensity of light provided. Extensive comparison with literature values for C. vulgaris could be done considering that P kessleri and C. vulgaris are both green eukaryotic microalgae that belong to Chlorophyta. The higher biomass efficiency of cultivation illuminated with fluorescent lamps compared to LED light sources was also recently observed in the case of C. vulgaris, leading to 79.33 × 10⁶ cells/mL, compared to 66.63 × 10⁶ cells/mL in the case of white LED [37]. This fact corresponds to the values of the ODmax parameter in different experimental setups as presented in Table 2. Also, in the work of [38], the xmax parameter of the logistic model was estimated at 1.35 g/L for a light density equal to 230 μmol/m2/s for the cultivation of C. vulgaris.
Simultaneously with biomass production, the consumption of TP at 2% and 10% non-sterilized ADE (v/v) was described. Parachlorella kessleri can be promising for wastewater bioremediation, as it assimilates sufficient amounts of nitrogen and phosphorus, producing biomass rich in fatty acids. More specifically, when grown in filtered livestock wastewater, the microorganism caused the reduction of ammonium nitrogen and phosphorus by 99% and 82%, respectively [39].
The model fitting results are illustrated in Figure 3. From the equations describing the biomass growth and TP depletion, the values of the parameters μmax, ODmax and Yx/p were calculated with high accuracy (R2 > 0.9). Table 2 presents the values of these parameters. In this direction, the value of μmax for P. kessleri is 0.24 d−1, similar to the case of C. vulgaris where, based on the mathematical model developed to describe growth for waste treatment, the value of μmax calculated was equal to 0.25 d−1 [40]. In addition, based on the calculated value of Yx/p, the phosphorus content of P. kessleri biomass was 0.5%. The corresponding percentage found for C. vulgaris ranges between 0.12% [41] and 9% [40], while in the first case the value predicted by the relevant model was 0.08%. Also, in the work of [41], the Yx/P value was quantified equal to 383–1250 gbiomass/gP, depending on the wastewater characteristics. These values agree with the parameter value of this work.
Finally, in the case of determining the NH4-N concentration in cultures grown in both the Erlenmeyer flasks and the PBR, the model prediction was also very accurate, with R2 values between 0.83–0.99 (Figure 4 and Table 3). The calculations were carried out considering the percentage composition of P. kessleri biomass in nitrogen (4%), as obtained from elemental analysis. This percentage was consistent with values described in the literature ranging between 2.1–6.3% [40,41]. Parachlorella kessleri has been reported in the past for its ability to grow in substrates with either ammonium or nitrates as nitrogen source. Its high biomass yield (2.75 g L−1) was accompanied with up to 90% reduction of the initial NH4-N after 2–3 days, as was the case in the experiments of this work [42]. Moreover, several studies have described the stripping effect in microalgae species cultivation. In the work of [43], the kla parameter was determined to be 0.68 d−1 in the step of model calibration, one order of magnitude lower than the value estimated in this work. The increased kla parameter value of this study might be exhibited due to the reactor’s stirring conditions [43].

4. Conclusions

A mathematical model describing microalgal cultivation in sterile and non-sterile ADE was developed. Regarding the maximum OD in which the biomass could grow, a logistic model was used to describe the limitation of biomass growth rate due to lack of illumination. Furthermore, the analysis exhibited that a significant amount of the TP of anaerobic effluent was not consumed during the microalgae cultivation. The simulation results demonstrate that the sterilization has not affected the process (R2 > 0.9 for sterilized and unsterilized experiments) since the same mathematical model was used for both experimental conditions. Moreover, it was exhibited that the nitrogen stripping ratio was very low in the pH of the cultivation. A parameter (kla) that is affected by the airflow supply and can quantify the air stripping ratio was considered in the proposed model. This model could be the step towards microalgae modeling, considering it as a useful tool for biomass productivity optimization in full-scale units.

Author Contributions

Conceptualization, G.M. and E.K.; methodology, G.M. and E.K.; software, G.M.; validation, G.M., E.K. and D.Z.; formal analysis, G.M., E.K. and S.G.M.; investigation, G.M. and E.K.; resources, M.K.; data curation, E.K and D.Z..; writing—original draft preparation, G.M and S.G.M.; writing—review and editing, D.Z.; visualization, G.M and S.G.M.; supervision, M.K.; project administration, M.K.; funding acquisition, M.K. All authors have read and agreed to the published version of the manuscript.

Funding

This research received no external funding.

Institutional Review Board Statement

Not applicable.

Informed Consent Statement

Not applicable.

Data Availability Statement

Data will be made available upon request.

Conflicts of Interest

The authors declare that they have no conflicts of interest.

Appendix A

Figure A1. Optical density of P. kessleri culture in 550 nm wavelength versus dry weight of biomass.
Water 14 03938 g0a1

References

  1. Slorach, P.C.; Jeswani, H.K.; Cuéllar-Franca, R.; Azapagic, A. Environmental Sustainability of Anaerobic Digestion of Household Food Waste. J. Environ. Manag. 2019, 236, 798–814. [Google Scholar] [CrossRef]
  2. Zamri, M.F.M.A.; Hasmady, S.; Akhiar, A.; Ideris, F.; Shamsuddin, A.H.; Mofijur, M.; Fattah, I.M.R.; Mahlia, T.M.I. A Comprehensive Review on Anaerobic Digestion of Organic Fraction of Municipal Solid Waste. Renew. Sustain. Energy Rev. 2021, 137, 110637. [Google Scholar] [CrossRef]
  3. Styles, D.; Adams, P.; Thelin, G.; Vaneeckhaute, C.; Chadwick, D.; Withers, P.J.A. Life Cycle Assessment of Biofertilizer Production and Use Compared with Conventional Liquid Digestate Management. Environ. Sci. Technol. 2018, 52, 7468–7476. [Google Scholar] [CrossRef] [PubMed]
  4. Yu, H.; Kim, J.; Lee, C. Nutrient Removal and Microalgal Biomass Production from Different Anaerobic Digestion Effluents with Chlorella Species. Sci. Rep. 2019, 9, 1–13. [Google Scholar] [CrossRef] [PubMed] [Green Version]
  5. Vázquez-Rowe, I.; Golkowska, K.; Lebuf, V.; Vaneeckhaute, C.; Michels, E.; Meers, E.; Benetto, E.; Koster, D. Environmental Assessment of Digestate Treatment Technologies Using LCA Methodology. Waste Manag. 2015, 43, 442–459. [Google Scholar] [CrossRef] [PubMed]
  6. Zhang, Y.; Jiang, Y.; Wang, S.; Wang, Z.; Liu, Y.; Hu, Z.; Zhan, X. Environmental Sustainability Assessment of Pig Manure Mono-and Co-Digestion and Dynamic Land Application of the Digestate. Renew. Sustain. Energy Rev. 2021, 137, 110476. [Google Scholar] [CrossRef]
  7. Chen, T.; Qiu, X.; Feng, H.; Yin, J.; Shen, D. Solid Digestate Disposal Strategies to Reduce the Environmental Impact and Energy Consumption of Food Waste-Based Biogas Systems. Bioresour. Technol. 2021, 325, 124706. [Google Scholar] [CrossRef]
  8. Camilleri-Rumbau, M.S.; Briceño, K.; Søtoft, L.F.; Christensen, K.V.; Roda-Serrat, M.C.; Errico, M.; Norddahl, B. Treatment of Manure and Digestate Liquid Fractions Using Membranes: Opportunities and Challenges. Int. J. Environ. Res. Public Health 2021, 18, 1–30. [Google Scholar] [CrossRef]
  9. Limoli, A.; Langone, M.; Andreottola, G. Ammonia Removal from Raw Manure Digestate by Means of a Turbulent Mixing Stripping Process. J. Environ. Manag. 2016, 176, 1–10. [Google Scholar] [CrossRef]
  10. Hidalgo, D.; Corona, F.; Martín-Marroquín, J.M.; del Álamo, J.; Aguado, A. Resource Recovery from Anaerobic Digestate: Struvite Crystallisation versus Ammonia Stripping. Desalin. Water Treat. 2016, 57, 2626–2632. [Google Scholar] [CrossRef]
  11. Han, Z.; Miao, Y.; Dong, J.; Shen, Z.; Zhou, Y.; Liu, S.; Yang, C. Enhanced Nitrogen Removal and Microbial Analysis in Partially Saturated Constructed Wetland for Treating Anaerobically Digested Swine Wastewater. Front. Environ. Sci. Eng. 2019, 13, 1–11. [Google Scholar] [CrossRef]
  12. Koutra, E.; Economou, C.N.; Tsafrakidou, P.; Kornaros, M. Bio-Based Products from Microalgae Cultivated in Digestates. Trends Biotechnol. 2018, 36, 819–833. [Google Scholar] [CrossRef] [PubMed]
  13. Rajesh Banu, J.; Preethi; Kavitha, S.; Gunasekaran, M.; Kumar, G. Microalgae Based Biorefinery Promoting Circular Bioeconomy-Techno Economic and Life-Cycle Analysis. Bioresour. Technol. 2020, 302, 122822. [Google Scholar] [CrossRef] [PubMed]
  14. Chuka-ogwude, D.; Ogbonna, J.; Borowitzka, M.A.; Moheimani, N.R. Screening, Acclimation and Ammonia Tolerance of Microalgae Grown in Food Waste Digestate. J. Appl. Phycol. 2020, 32, 3775–3785. [Google Scholar] [CrossRef]
  15. Webb, J.P.; van Keulen, M.; Wong, S.K.S.; Hamley, E.; Nwoba, E.; Moheimani, N.R. Light Spectral Effect on a Consortium of Filamentous Green Algae Grown on Anaerobic Digestate Piggery Effluent (ADPE). Algal Res. 2020, 46, 101723. [Google Scholar] [CrossRef]
  16. Tsigkou, K.; Zagklis, D.; Tsafrakidou, P.; Zafiri, C.; Kornaros, M. Composting of Anaerobic Sludge from the Co-Digestion of Used Disposable Nappies and Expired Food Products. Waste Manag. 2020, 118, 655–666. [Google Scholar] [CrossRef]
  17. Kwon, H.K.; Jeon, J.Y.; Oh, S.J. Potential for Heavy Metal (Copper and Zinc) Removal from Contaminated Marine Sediments Using Microalgae and Light Emitting Diodes. Ocean Sci. J. 2017, 52, 57–66. [Google Scholar] [CrossRef]
  18. Narala, R.R.; Garg, S.; Sharma, K.K.; Thomas-Hall, S.R.; Deme, M.; Li, Y.; Schenk, P.M. Comparison of Microalgae Cultivation in Photobioreactor, Open Raceway Pond, and a Two-Stage Hybrid System. Front. Energy Res. 2016, 4, 29. [Google Scholar] [CrossRef] [Green Version]
  19. Zuccaro, G.; Yousuf, A.; Pollio, A.; Steyer, J.-P. Microalgae Cultivation Systems. In Microalgae Cultivation for Biofuels Production; Elsevier: Amsterdam, The Netherlands, 2020; pp. 11–29. [Google Scholar]
  20. Cicci, A.; Bravi, M. Production of the Freshwater Microalgae Scenedesmus Dimorphus and Arthrospira Platensis by Using Cattle Digestate. Chem. Eng. 2014, 38, 85–90. [Google Scholar]
  21. Mastropetros, S.G.; Koutra, E.; Amouri, M.; Aziza, M.; Ali, S.S.; Kornaros, M. Comparative Assessment of Nitrogen Concentration Effect on Microalgal Growth and Biochemical Characteristics of Two Chlorella Strains Cultivated in Digestate. Mar. Drugs 2022, 20, 415. [Google Scholar] [CrossRef]
  22. Talaghat, M.R.; Mokhtari, S.; Saadat, M. Modeling and Optimization of Biodiesel Production from Microalgae in a Batch Reactor. Fuel 2020, 280, 118578. [Google Scholar] [CrossRef]
  23. García-Malea, M.C.; Acién, F.G.; Fernández, J.M.; Cerón, M.C.; Molina, E. Continuous Production of Green Cells of Haematococcus Pluvialis: Modeling of the Irradiance Effect. Enzyme Microb. Technol. 2006, 38, 981–989. [Google Scholar] [CrossRef]
  24. Lee, E.; Zhang, Q. Integrated Co-Limitation Kinetic Model for Microalgae Growth in Anaerobically Digested Municipal Sludge Centrate. Algal Res. 2016, 18, 15–24. [Google Scholar] [CrossRef] [Green Version]
  25. He, Y.; Chen, L.; Zhou, Y.; Chen, H.; Zhou, X.; Cai, F.; Huang, J.; Wang, M.; Chen, B.; Guo, Z. Analysis and Model Delineation of Marine Microalgae Growth and Lipid Accumulation in Flat-Plate Photobioreactor. Biochem. Eng. J. 2016, 111, 108–116. [Google Scholar] [CrossRef]
  26. Qu, W.; Zhang, C.; Zhang, Y.; Ho, S.-H. Optimizing Real Swine Wastewater Treatment with Maximum Carbohydrate Production by a Newly Isolated Indigenous Microalga Parachlorella Kessleri QWY28. Bioresour. Technol. 2019, 289, 121702. [Google Scholar] [CrossRef]
  27. O’Rourke, R.; Gaffney, M.; Murphy, R. The Effects of Parachlorella Kessleri Cultivation on Brewery Wastewater. Water Sci. Technol. 2016, 73, 1401–1408. [Google Scholar] [CrossRef]
  28. Viriato, C.; da Silveira, C.B.; de Souza, M.P.; de Souza Schneider, R.C.; Skoronski, E.; Neves, F.F. Cultivation of the Microalgae Parachlorella Kessleri Using Wastewater from a Fishmeal & Oil Industry and Its Application for Nitrogen Removal. Rev Latinoam Hiperte 2019, 10, 1–12. [Google Scholar]
  29. Beigbeder, J.-B.; Sanglier, M.; de Medeiros Dantas, J.M.; Lavoie, J.-M. CO2 Capture and Inorganic Carbon Assimilation of Gaseous Fermentation Effluents Using Parachlorella Kessleri Microalgae. J. CO2 Util. 2021, 50, 101581. [Google Scholar] [CrossRef]
  30. Eaton, A.D.; Clesceri, L.S.; Greenberg, A.E.; Franson, M.A.H. Standard Methods for the Examination of Water and Wastewater, 22nd ed.; APHA: Washington, DC, USA, 2012. [Google Scholar]
  31. Meng, Y.; Li, A.; Li, H.; Shen, Z.; Ma, T.; Liu, J.; Zhou, Z.; Feng, Q.; Sun, Y. Effect of Membrane Blocking on Attached Cultivation of Microalgae. J. Clean. Prod. 2021, 284, 124695. [Google Scholar] [CrossRef]
  32. Ambriz-Pérez, D.L.; Orozco-Guillen, E.E.; Galán-Hernández, N.D.; Luna-Avelar, K.D.; Valdez-Ortiz, A.; Santos-Ballardo, D.U. Accurate Method for Rapid Biomass Quantification Based on Specific Absorbance of Microalgae Species with Biofuel Importance. Lett. Appl. Microbiol. 2021, 73, 343–351. [Google Scholar] [CrossRef]
  33. Yellezuome, D.; Zhu, X.; Wang, Z.; Liu, R. Mitigation of Ammonia Inhibition in Anaerobic Digestion of Nitrogen-Rich Substrates for Biogas Production by Ammonia Stripping: A Review. Renew. Sustain. Energy Rev. 2022, 157, 112043. [Google Scholar] [CrossRef]
  34. Tsafrakidou, P.; Manthos, G.; Zagklis, D.; Mema, J.; Kornaros, M. Assessment of Substrate Load and Process PH for Bioethanol Production–Development of a Kinetic Model. Fuel 2022, 313, 123007. [Google Scholar] [CrossRef]
  35. Manthos, G.; Zagklis, D.; Kornaros, M. Mathematical Modeling of the Effect of PH on 4-Ethylphenol Formation during Two-Phase Olive Pomace Storage. Biochem. Eng. J. 2022, 186, 108552. [Google Scholar] [CrossRef]
  36. Rasmuson, A.; Andersson, B.; Olsson, L.; Andersson, R. Mathematical Modeling in Chemical Engineering; Cambridge University Press: Cambridge, UK, 2014; pp. 1–183. [Google Scholar] [CrossRef] [Green Version]
  37. Satthong, S.; Saego, K.; Kitrungloadjanaporn, P.; Nuttavut, N.; Amornsamankul, S.; Triampo, W. Modeling the Effects of Light Sources on the Growth of Algae. Adv. Differ. Equations 2019, 2019, 1–6. [Google Scholar] [CrossRef]
  38. Chang, H.-X.; Huang, Y.; Fu, Q.; Liao, Q.; Zhu, X. Kinetic Characteristics and Modeling of Microalgae Chlorella Vulgaris Growth and CO2 Biofixation Considering the Coupled Effects of Light Intensity and Dissolved Inorganic Carbon. Bioresour. Technol. 2016, 206, 231–238. [Google Scholar] [CrossRef]
  39. Aketo, T.; Hoshikawa, Y.; Nojima, D.; Yabu, Y.; Maeda, Y.; Yoshino, T.; Takano, H.; Tanaka, T. Selection and Characterization of Microalgae with Potential for Nutrient Removal from Municipal Wastewater and Simultaneous Lipid Production. J. Biosci. Bioeng. 2020, 129, 565–572. [Google Scholar] [CrossRef] [PubMed]
  40. Decostere, B.; De Craene, J.; Van Hoey, S.; Vervaeren, H.; Nopens, I.; Van Hulle, S.W.H. Validation of a Microalgal Growth Model Accounting with Inorganic Carbon and Nutrient Kinetics for Wastewater Treatment. Chem. Eng. J. 2016, 285, 189–197. [Google Scholar] [CrossRef]
  41. Ruiz, J.; Arbib, Z.; Álvarez-Díaz, P.D.; Garrido-Pérez, C.; Barragán, J.; Perales, J.A. Photobiotreatment Model (PhBT): A Kinetic Model for Microalgae Biomass Growth and Nutrient Removal in Wastewater. Environ. Technol. 2013, 34, 979–991. [Google Scholar] [CrossRef]
  42. Lv, J.; Wang, X.; Feng, J.; Liu, Q.; Nan, F.; Jiao, X.; Xie, S. Comparison of Growth Characteristics and Nitrogen Removal Capacity of Five Species of Green Algae. J. Appl. Phycol. 2019, 31, 409–421. [Google Scholar] [CrossRef]
  43. Viruela, A.; Aparicio, S.; Robles, Á.; Falomir, L.B.; Serralta, J.; Seco, A.; Ferrer, J. Kinetic Modeling of Autotrophic Microalgae Mainline Processes for Sewage Treatment in Phosphorus-Replete and-Deplete Culture Conditions. Sci. Total Environ. 2021, 797, 149165. [Google Scholar] [CrossRef]
Figure 1. Experimental setup used in this study for the cultivation of Parachlorella kessleri in Erlenmeyer flasks (left) and in cylindrical photobioreactors (right).
Water 14 03938 g001
Figure 2. Experimental data and model fitting for biomass production of the microalgae P. kessleri, in 2% and 10% sterile digestate in Erlenmeyer flasks (a), 2% and 10% non-sterile digestate in Erlenmeyer flasks (b), 10% non-sterile digestate in PBR (c), and model prediction for species growth in 1% and 50% sterilized digestate in Erlenmeyer flasks (d).
Water 14 03938 g002
Figure 3. Estimated values of the change in TP concentration as a result of biological removal exclusively by the microalgae P. kessleri in 10% (v/v) non-sterilized digested agro-industrial waste and corresponding model simulation, in the case of culture in Erlenmeyer flasks (a) and PBR (b).
Water 14 03938 g003
Figure 4. Experimental data and model simulation for ammonia nitrogen removal during growth of the microalgae P. kessleri species in 2% and 10% (v/v) non-sterile digested agro-industrial waste (a) and in 10% (v/v) non-sterile effluent in a photobioreactor (b).
Water 14 03938 g004
Table 1. Description of the experiments used in proposed model training and validation.
ExperimentSterilized
Medium
ApparatusDigestate Loading (v/v)Available DataUse
1YesErlenmeyer flask2%BiomassT
2YesErlenmeyer flask10%BiomassT
3NoErlenmeyer flask2%Biomass, N, PT
4NoErlenmeyer flask10%Biomass, N, PT
5NoPBR10%Biomass, N, PT, V
6YesErlenmeyer flask1%BiomassV
7YesErlenmeyer flask50%BiomassV
T: training. V: validation.
Table 2. Estimated kinetic parameters of the proposed model for P. kessleri cultivation in ADE.
Model ParametersErlenmeyer FlaskPBR
μmax [d−1]0.24 ± 0.04
ODmax [AU cm−1]4.07 ± 0.302.79 ± 0.59
Yx/Total-P [g g−1Total-P]194.9 ± 13.3
kLa [d−1]3.6 10−4 ± 1.4 10−4
Table 3. Coefficient of determination values (R2) after optimization or simulation of the model describing the cultivation of P. kessleri in anaerobic digestion effluent.
Culture ParameterApparatusDigestate Loading (v/v)Sterilized MediumR2
BiomassErlenmeyer flask2%Yes0.8955 a
Erlenmeyer flask10%Yes0.6790 a
Erlenmeyer flask2%No0.9704 a
Erlenmeyer flask10%No0.9523 a
PBR10%No0.8993 a
Erlenmeyer flask1%Yes0.8730 b
Erlenmeyer flask50%Yes0.5417 b
Total PErlenmeyer flask2%No0.8339 a
Erlenmeyer flask10%No0.9981 a
PBR10%No0.9996 b
NitrogenErlenmeyer flask2%No0.9394 a
Erlenmeyer flask10%No0.9901 a
PBR10%No0.8335 b
a: Refers to model training. b: Refers to model validation.
Publisher’s Note: MDPI stays neutral with regard to jurisdictional claims in published maps and institutional affiliations.

