Flood Modeling in a Coastal Town in Northern Colombia: Comparing MODCEL vs. IBER
Abstract
:1. Introduction
2. Materials and Methods
2.1. Description of Modeling Tools
2.1.1. MODCEL (Modeling by Cells)
2.1.2. IBER
2.2. Study Area
2.3. Steps in the Configuration of the IBER Application
2.3.1. Mesh and Surface
2.3.2. Land Use
2.3.3. Initial Conditions, Internal and Boundary Conditions, Calculation Parameters
2.4. Calibration and Validation
2.5. Modeling Scenarios
3. Results
3.1. Model Performance
3.1.1. Calibration
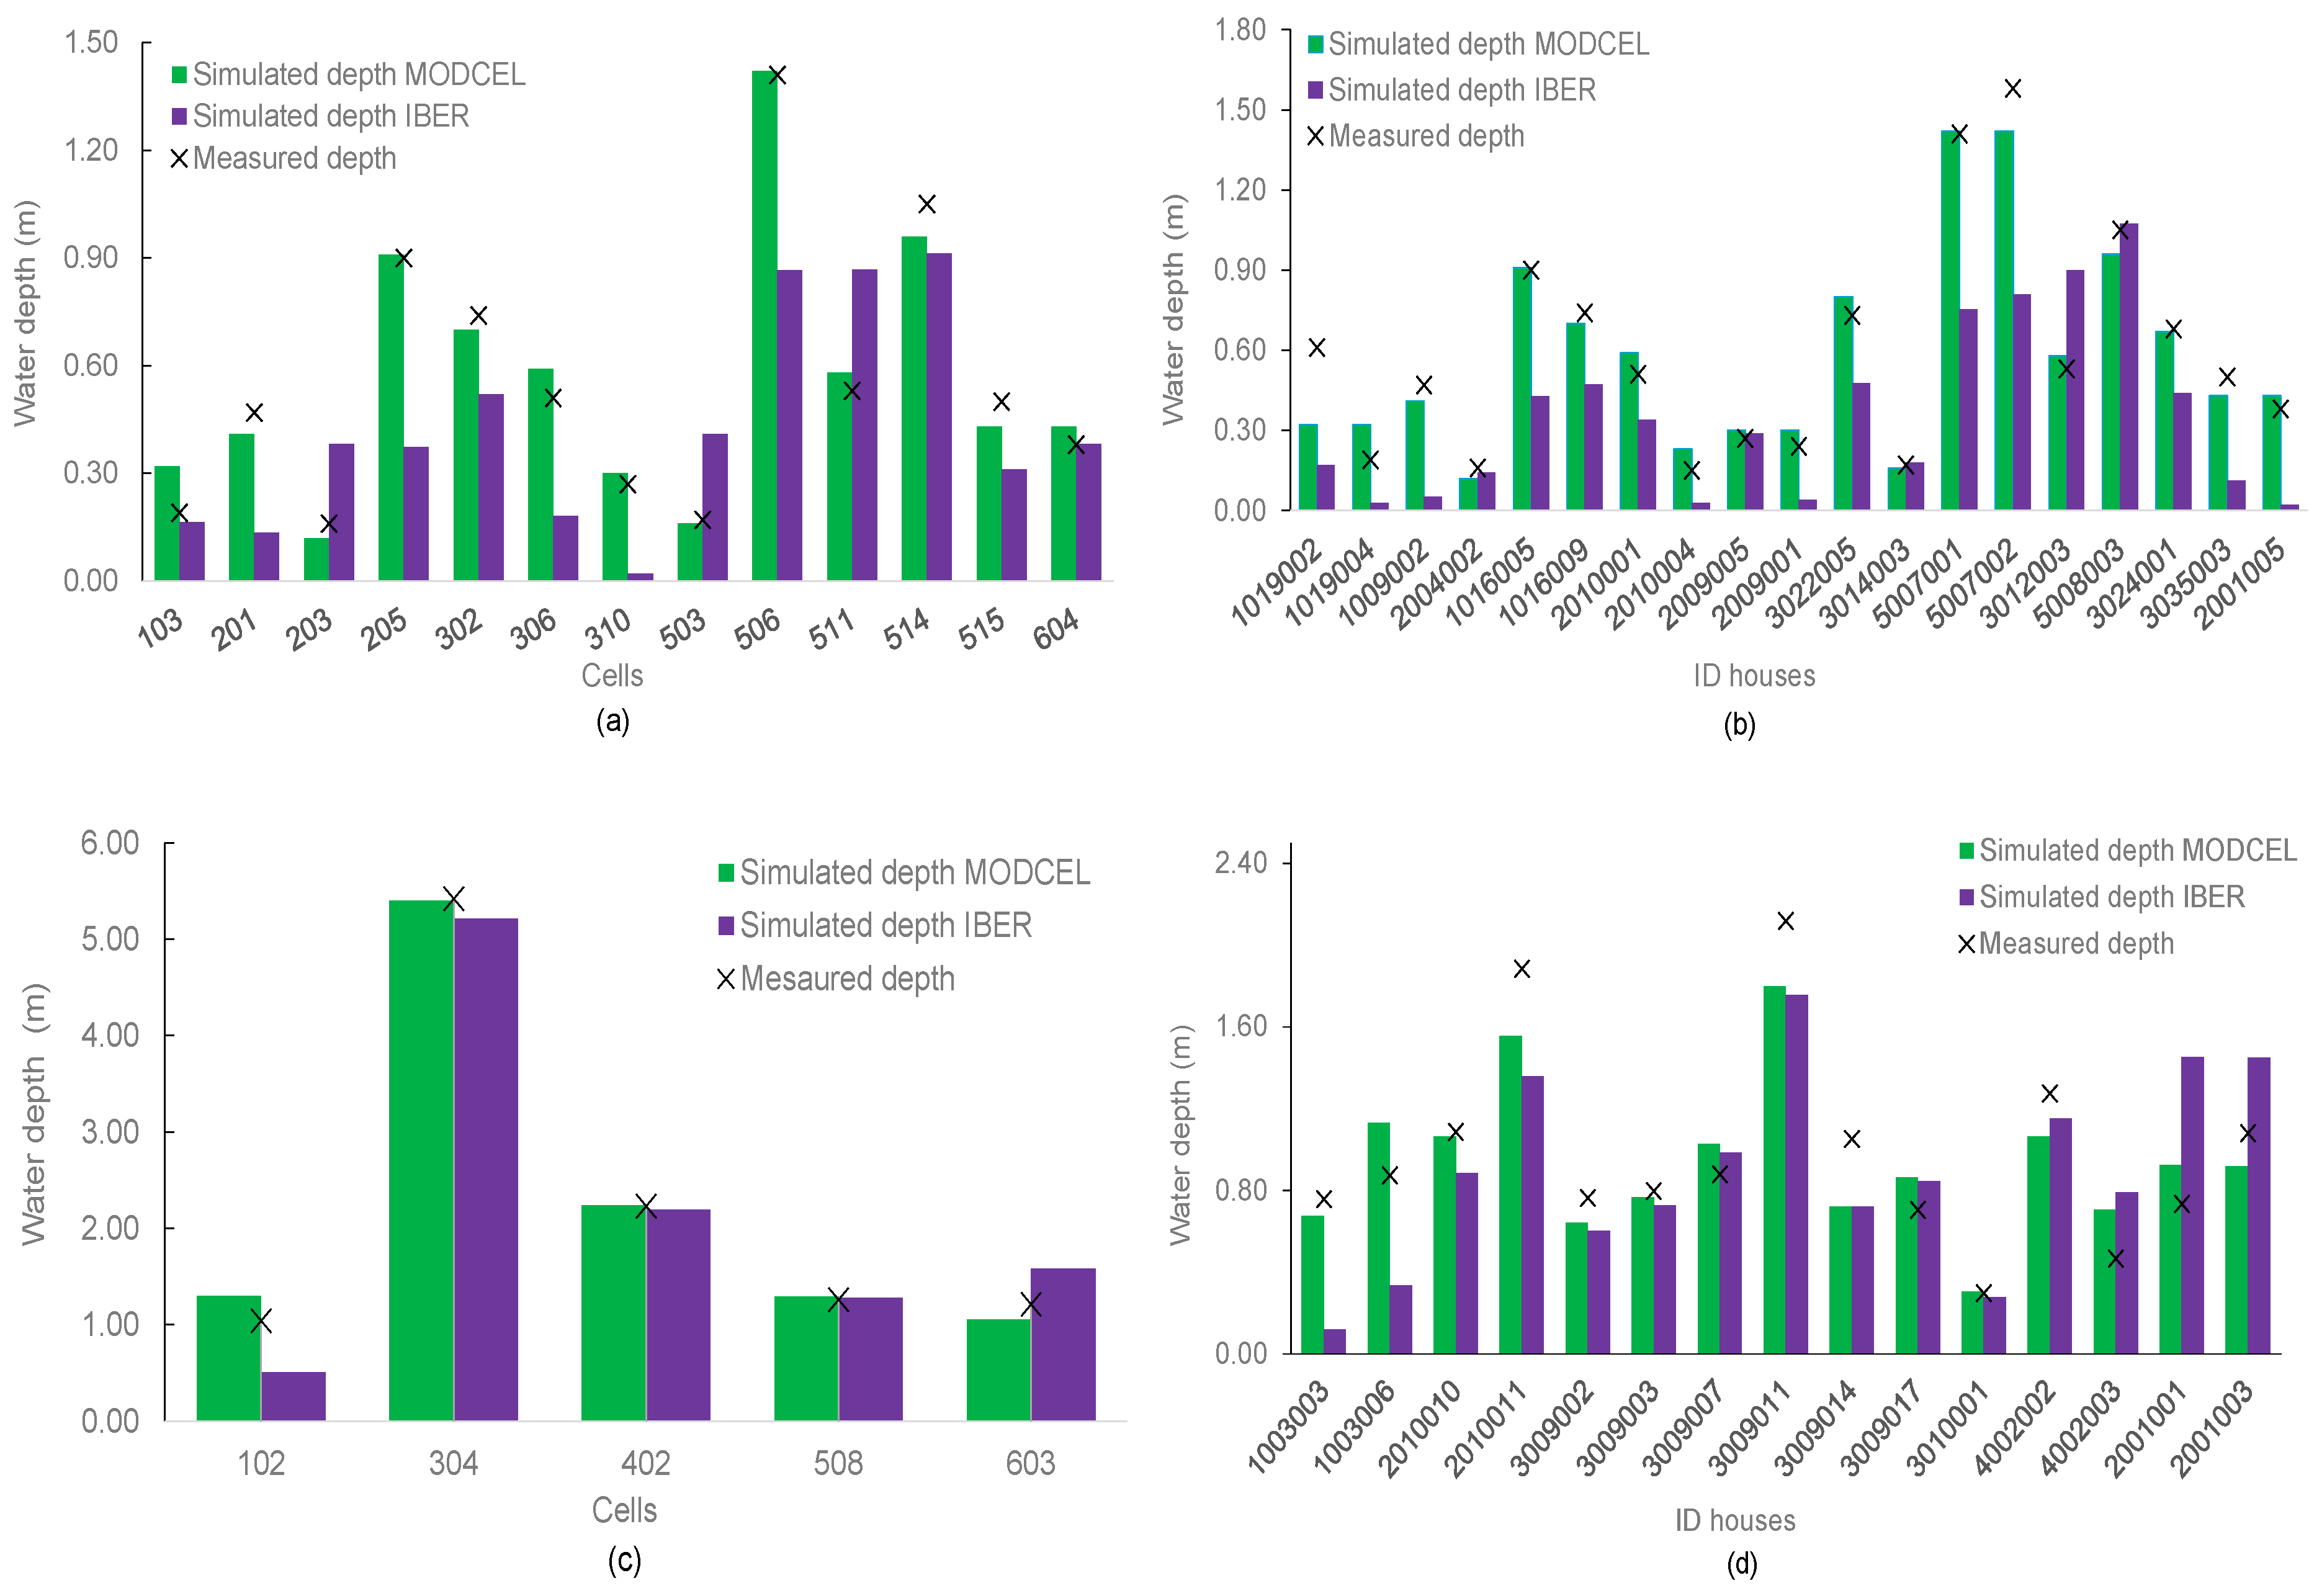
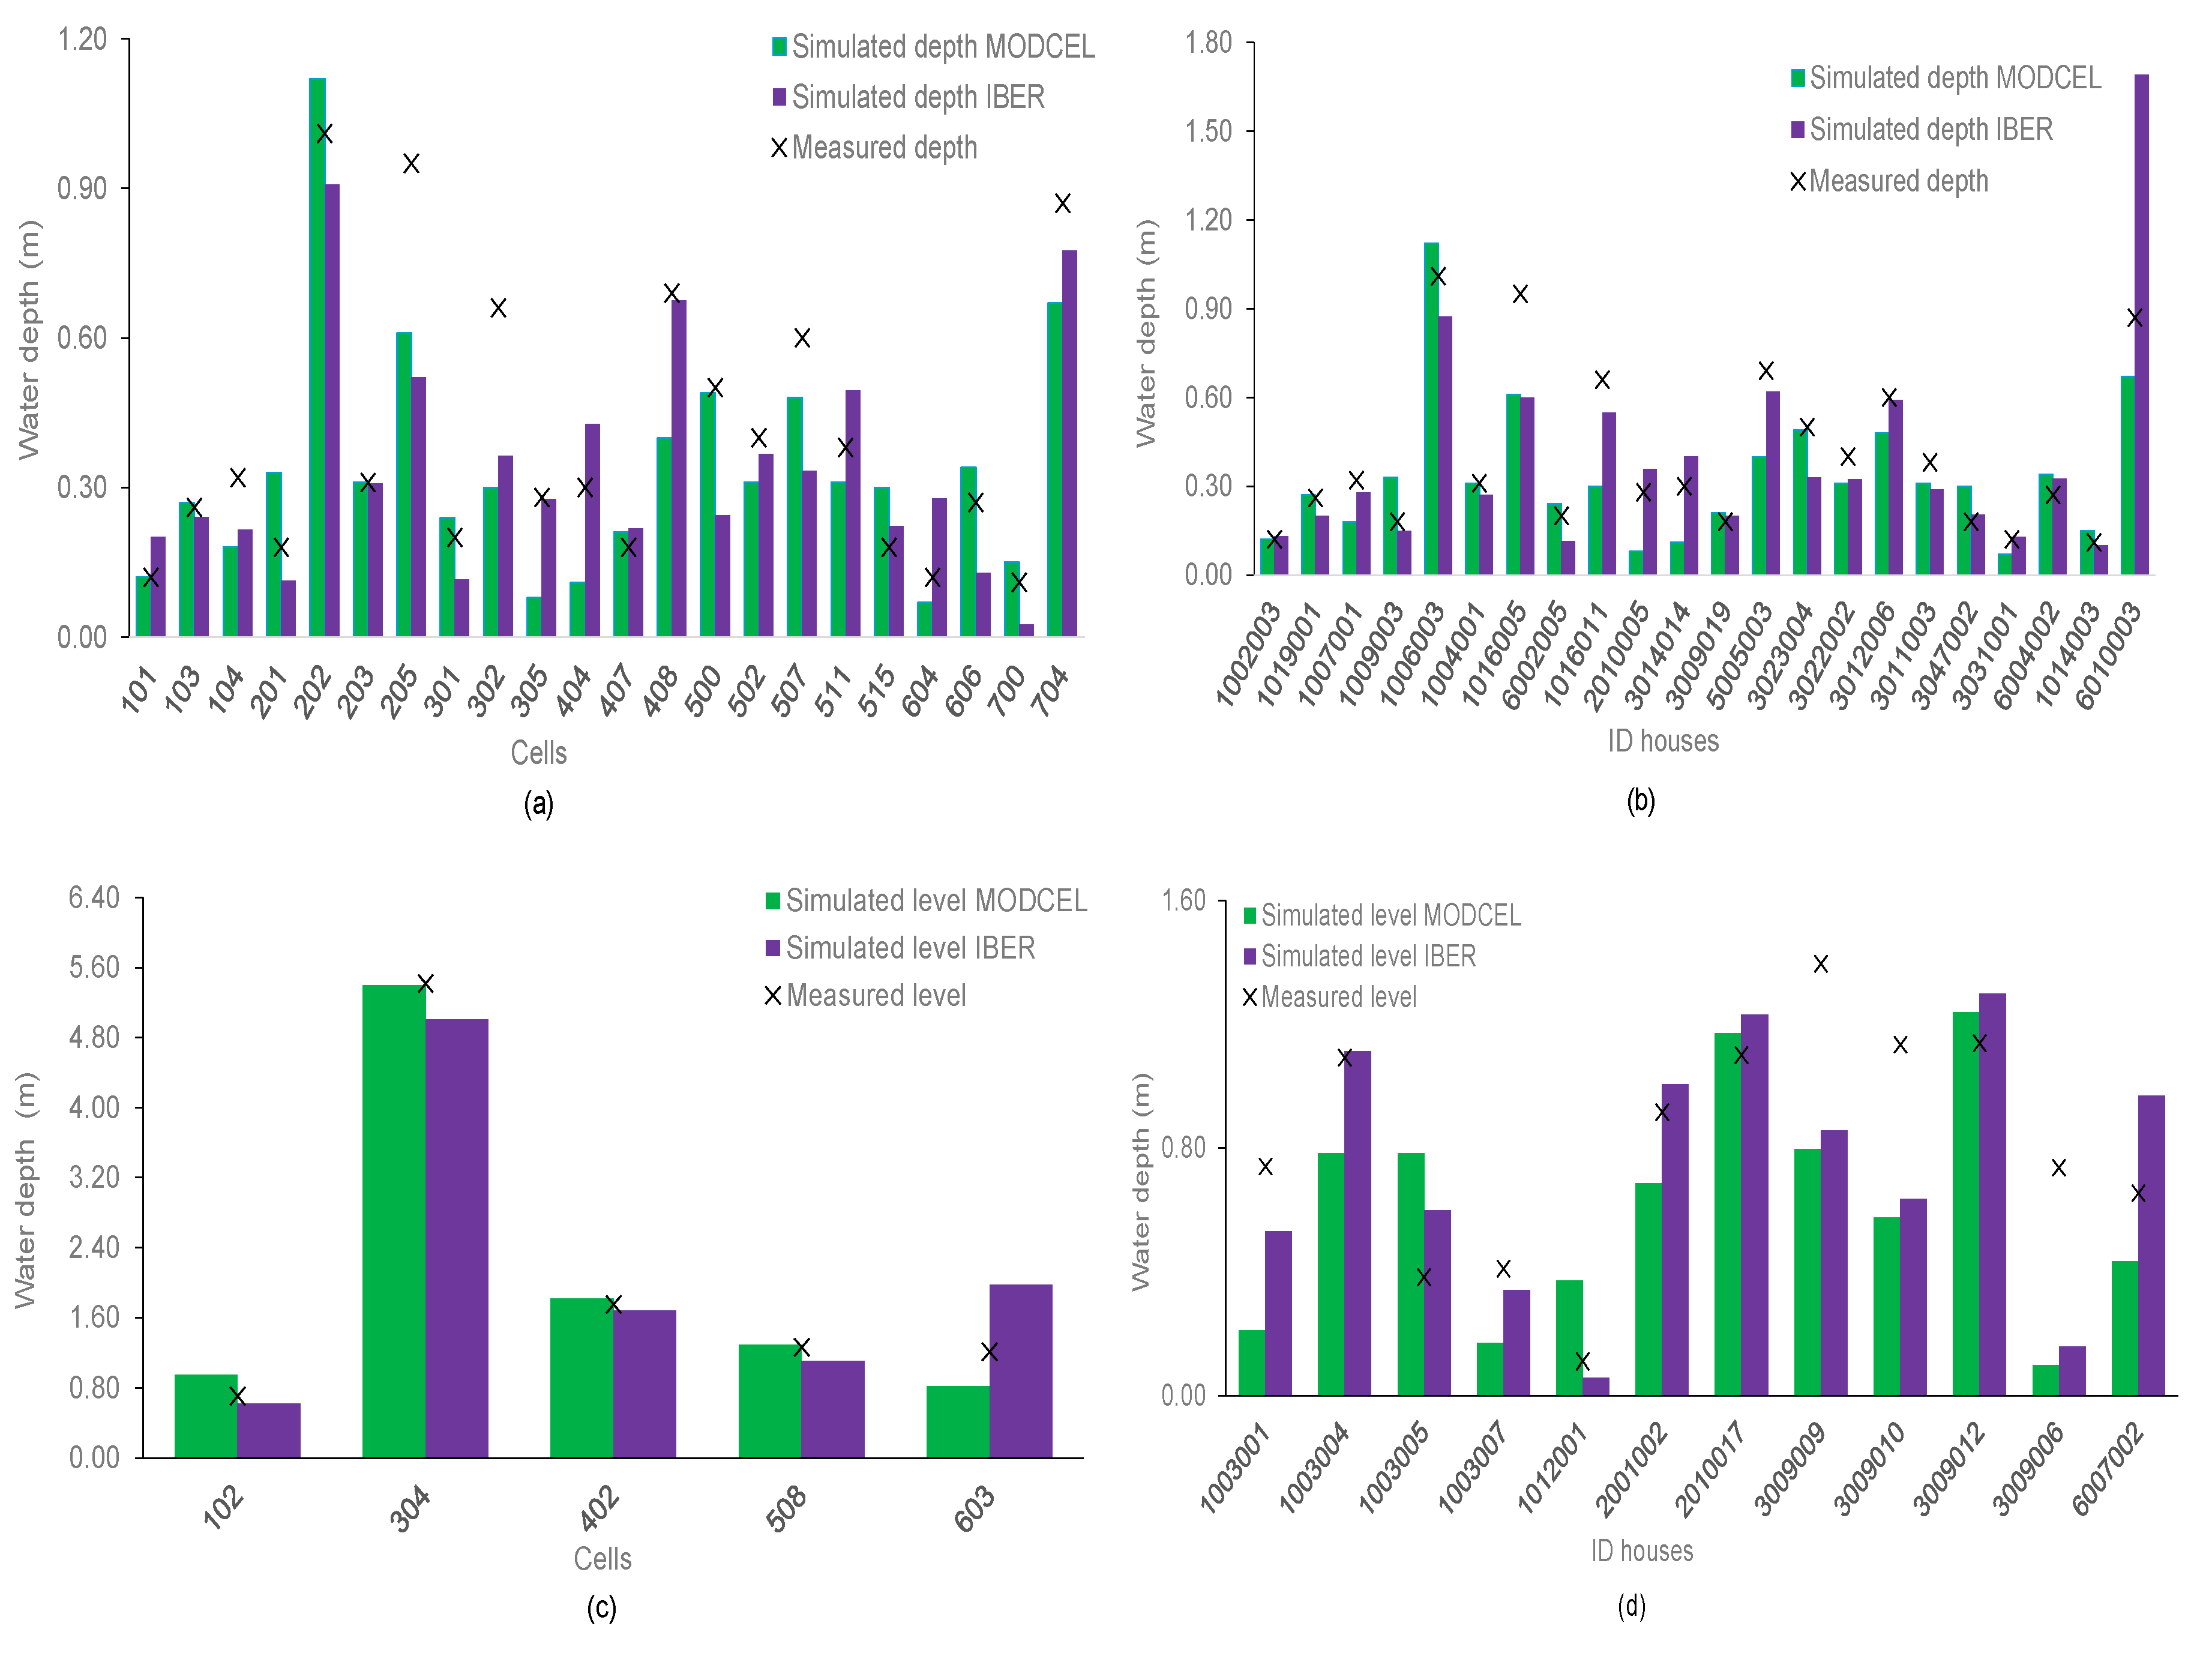
- Transport type cells: CENTER. MODCEL performed much better than IBER. However, the average relative error (emean) is low in both models; specifically, MODCEL overestimates the measured values and IBER underestimates them. The Bias indicator confirms the underestimation of IBER and an acceptable value for MODCEL, which could be due to the non-coincidence of the cell centers taken in MODCEL with the lowest points of the DTM: in IBER the runoff depends on the topography and in this case, no refined MDT was available.
- Transport type cells: HOUSES. MODCEL keeps performing better than IBER, whose performance improves if compared to the results obtained in the cell centers. The emean and Bias confirm that IBER underestimates the data. It has to be reminded that, in addition to the poor topography, in IBER for each house, the local simulation output is considered, while in MODCEL, just the cell center datum is available.
- Tank type cells: CENTER. These cells correspond to the four wetlands present in the urban sub-watershed and cell 508, which represents a low area of the city. In this case, the indicators are similar in the two models, and both fit the measurements quite well. The Bias is within the acceptability range (−20 < Bias < 20). The very high value of σ²exp may call for attention, but it is a consequence of the fact that the DTM in the wetland cells is not influential as what counts is the accumulated volume and the correspondence elevation volume. It is important to clarify that the elevations in these cells present a strong variation because of filling from the initial elevation (very low) to the maximum elevation (high values) in the flooding process.
- Tank type cells: HOUSES. These results are very different from those of the cell center and show similarities to those obtained in the transport cells. The Bias, although lying in the appropriate range, confirms, together with the emean, the underestimation of IBER with respect to the flood data collected in the survey.
3.1.2. Validation
- Transport type cells: CENTER: MODCEL worsens its performance across all the indicators, while IBER does the opposite, with exception made for emean; in addition, Bias, that in calibration indicated sub-estimation, (−24.10%) is now acceptable (−16.16%).
- Transport type cells: HOUSES: The result is similar to the previous case (CENTER), although now for IBER |eM| and σ²exp Worsen. Again Bias improved (from −40.03% to an acceptable −1.75%). Notice that for MODCEL the indicators coincide with the previous case (CENTER): this is because we just had one only house in both cases and the output only refers to the cell center.
- Tank type cells: CENTER: MODCEL slightly improves its performance for indicadors emean, σe, σ²exp, Bias (which switched from an acceptable negative value to an acceptable positive value). It worsens, however, a bit in terms of|eM|, RMSE, and MAE. IBER in turn worsens in terms of emean, |eM|, r, and MAE, while the remaining indicators improve. Analogously to calibration, both models show similar values of the indicators.
- Tank type cells: HOUSES: MODCEL worsens its performance in all the indicators and Bias passed from acceptable (−3.99%) to sub-estimation (−28.95%). IBER improves all indicators, with an exception made for emean.
3.2. Future Flood Scenarios
4. Discussion
5. Conclusions
Author Contributions
Funding
Institutional Review Board Statement
Informed Consent Statement
Data Availability Statement
Acknowledgments
Conflicts of Interest
References
- Higgins, S.A.; Overeem, I.; Steckler, M.S.; Syvitski, J.P.M.; Seeber, L.; Akhter, S.H. InSAR Measurements of Compaction and Subsidence in the Ganges-Brahmaputra Delta, Bangladesh. J. Geophys. Res. Earth Surf. 2014, 119, 1768–1781. [Google Scholar] [CrossRef]
- CRED (Centre for Research on the Epidemiology of Disasters). The Human Cost of Natural Disaters 2015: A Global Perspective; CRED: Brussels, Belgium, 2015. [Google Scholar]
- Makondo, C.C.; Thomas, D.S.G. Climate Change Adaptation: Linking Indigenous Knowledge with Western Science for Effective Adaptation. Environ. Sci. Policy 2018, 88, 83–91. [Google Scholar] [CrossRef]
- Sarzynski, A. Public Participation, Civic Capacity, and Climate Change Adaptation in Cities. Urban Clim. 2015, 14, 52–67. [Google Scholar] [CrossRef]
- Toté, C.; Patricio, D.; Boogaard, H.; van der Wijngaart, R.; Tarnavsky, E.; Funk, C. Evaluation of Satellite Rainfall Estimates for Drought and Flood Monitoring in Mozambique. Remote Sens. 2015, 7, 1758–1776. [Google Scholar] [CrossRef] [Green Version]
- Luo, P.; Luo, M.; Li, F.; Qi, X.; Huo, A.; Wang, Z.; He, B.; Takara, K.; Nover, D.; Wang, Y. Urban Flood Numerical Simulation: Research, Methods and Future Perspectives. Environ. Model. Softw. 2022, 156, 105478. [Google Scholar] [CrossRef]
- Arrighi, C.; Arosio, M. Indirect and Intangible Impacts in Flood Risk Assessment of Complex Systems. In Proceedings of the Weak Points in the Flood Risk Modelling Chain—An initiative by the IAHR Committee on Flood Risk Management, 7 February 2021. [Google Scholar]
- Guo, K.; Guan, M.; Yu, D. Urban Surface Water Flood Modelling—A Comprehensive Review of Current Models and Future Challenges. Hydrol. Earth Syst. Sci. 2021, 25, 2843–2860. [Google Scholar] [CrossRef]
- Pérez, J.I.; Escobar, J.R.; Fragozo, J.M. Modelación Hidráulica 2D de Inundaciones En Regiones Con Escasez de Datos. El Caso Del Delta Del Río Ranchería, Riohacha-Colombia. Inf. Tecnol. 2018, 29, 143–156. [Google Scholar] [CrossRef] [Green Version]
- Timbe, L.; Willems, P. Desempeño de Modelos Hidráulicos 1D y 2D Para La Simulación de Inundaciones. MASKANA 2011, 2, 69–76. [Google Scholar] [CrossRef]
- Nardini, A.; Miguez, M.G. An Integrated Plan to Sustainably Enable the City of Riohacha (Colombia) to Cope with Increasing Urban Flooding, While Improving Its Environmental Setting. Sustainability 2016, 8, 198. [Google Scholar] [CrossRef] [Green Version]
- Miguez, M.G.; Battemarco, B.P.; De Sousa, M.M.; Rezende, O.M.; Veról, A.P.; Gusmaroli, G. Urban Flood Simulation Using MODCEL—An Alternative Quasi-2D Conceptual Model. Water 2017, 9, 445. [Google Scholar] [CrossRef]
- Rezende, O.M.; Franco, A.B.R.D.C.D.; de Oliveira, A.K.B.; Jacob, A.C.P.; Miguez, M.G. A Framework to Introduce Urban Flood Resilience into the Design of Flood Control Alternatives. J. Hydrol. 2019, 576, 478–493. [Google Scholar] [CrossRef]
- CREACUA. Proyecto: “Adaptación Urbana Verde Frente a Inundaciones Con El Soporte de La Modelación Matemática y Del Software MODCEL En Riohacha, La Guajira, Colombia”; Convenio de Cooperación No 9677-04-1047-2013; CREACUA: Riohacha, Colombia, 2013; Available online: http://modcelrhcdatos.wixsite.com/modcel-riohacha/avance (accessed on 22 March 2017).
- Fletcher, T.D.; Shuster, W.; Hunt, W.F.; Ashley, R.; Butler, D.; Arthur, S.; Trowsdale, S.; Barraud, S.; Semadeni-Davies, A.; Bertrand-Krajewski, J.L.; et al. SUDS, LID, BMPs, WSUD and More—The Evolution and Application of Terminology Surrounding Urban Drainage. Urban Water J. 2015, 12, 525–542. [Google Scholar] [CrossRef]
- Hall, J. Direct Rainfall Flood Modelling: The Good, the Bad and the Ugly. Australas. J. Water Resour. 2015, 19, 74–85. [Google Scholar] [CrossRef]
- Gharbi, M.; Soualmia, A.; Dartus, D.; Masbernat, L. Comparison of 1D and 2D Hydraulic Models for Floods Simulation on The. J. Mater. Environ. Sci 2016, 7, 3017–3026. [Google Scholar]
- Jahanbazi, M.; Egger, U. Application and Comparison of Two Different Dual Drainage Models to Assess Urban Flooding. Urban Water J. 2014, 11, 584–595. [Google Scholar] [CrossRef]
- Dazzi, S.; Shustikova, I.; Domeneghetti, A.; Castellarin, A.; Vacondio, R. Comparison of Two Modelling Strategies for 2D Large-Scale Flood Simulations. Environ. Model. Softw. 2021, 146, 105225. [Google Scholar] [CrossRef]
- Lavoie, B.; Mahdi, T.-F. Comparison of Two-Dimensional Flood Propagation Models: SRH-2D and Hydro_AS-2D. Nat. Hazards 2017, 86, 1207–1222. [Google Scholar] [CrossRef] [Green Version]
- Iber, M. Bidimensional del flujo en Lámina Libre en Aguas Poco Profundas Pre- and Post-Processing. Available online: https://iberaula.es/1071/iber-model/pre-and-post-processing (accessed on 30 July 2022).
- Bladé, E.; Sánchez, H.; Dolz, J.; Sánchez, M.; Domínguez, R.; Arganis, M.; Juárez, J. Estimación Del Hidrograma de Salida En Una Cuenca Usando Un Modelo Hidrológico Distribuido y Un Modelo Hidráulico Bidimensional En Volúmenes Finitos; UNAM: Ciudad de México, Mexico, 2014. [Google Scholar]
- González-Cao, J.; Fernández-Nóvoa, D.; García-Feal, O.; Figueira, J.R.; Vaquero, J.M.; Trigo, R.M.; Gómez-Gesteira, M. The Rivillas Flood of 5–6 November 1997 (Badajoz, Spain) Revisited: An Approach Based on Iber+ Modelling. J. Hydrol. 2022, 610, 127883. [Google Scholar] [CrossRef]
- Nardini, A.; Mercado, L.C.; Montiel, J.P. MODCEL vs. IBER: A Comparison of Flooding Models in Riohacha, a Coastal Town of La Guajira, Colombia. Contemp. Eng. Sci. 2018, 11, 3253–3266. [Google Scholar] [CrossRef] [Green Version]
- Nkwunonwo, U.C.; Whitworth, M.; Baily, B. A Review of the Current Status of Flood Modelling for Urban Flood Risk Management in the Developing Countries. Sci. Afr. 2020, 7, e00269. [Google Scholar] [CrossRef]
- Miguez, M.G.; Mascarenhas, F.C.B.; Prodanoff, J.H.A.; Magalhes, L.P.C. Simulating Floods in Urban Watersheds: Hydrodynamic Modelling of Macro, Micro-Drainage and Flows over Streets. WIT Trans. Ecol. Environ. 2007, 103, 645–654. [Google Scholar] [CrossRef]
- Mascarenhas, F.C.B.; Miguez, M.G. Urban Flood Control through a Mathematical Cell Model. Water Int. 2002, 27, 208–218. [Google Scholar] [CrossRef]
- Cerrillo, R.N.; De La Orden, M.S.; Bonilla, J.G.; Garcia-Ferrer, A.; Clemente, R.H.; Lanjeri, S. LIDAR-Based Estimation of Leaf Area Index on Holm Oak [Quercus Ilex L. Subsp. Ballota (Desf.) Samp.] Trees. For. Syst. 2010, 19, 61. [Google Scholar] [CrossRef] [Green Version]
- Li, N.; Yamazaki, Y.; Roeber, V.; Cheung, K.F.; Chock, G. Probabilistic Mapping of Storm-Induced Coastal Inundation for Climate Change Adaptation. Coast. Eng. 2018, 133, 126–141. [Google Scholar] [CrossRef]
- Bladé, E.; Cea, L.; Corestein, G.; Escolano, E.; Puertas, J.; Vázquez-Cendón, E.; Dolz, J.; Coll, A. Iber: Herramienta de Simulación Numérica Del Flujo En Ríos. Rev. Int. Métodos Numéricos Cálculo Diseño Ing. 2014, 30, 1–10. [Google Scholar] [CrossRef] [Green Version]
- Bomers, A. Hydraulic Modelling Approaches to Decrease Uncertainty in Flood Frequency Relations; University of Twente: Enschede, The Netherlands, 2020. [Google Scholar]
- Li, J.; Bortolot, Z.J. Quantifying the Impacts of Land Cover Change on Catchment-Scale Urban Flooding by Classifying Aerial Images. J. Clean. Prod. 2022, 344, 130992. [Google Scholar] [CrossRef]
- Miguez, M.G.; Mascarenhas, F.C.B. Modelação Matemática de Cheias Urbanas Através de um Esquema de Células de Escoamento. Rev. Bras. Recur. Hídricos RBRH 1999, 4, 119–140. [Google Scholar]
- Sanz-Ramos, M.; Cea, L.; Bladé, E.; López-Gómez, D.; Sañudo, E.; Corestein, G.; García-Alén, G.; Aragón-Hernández, J. Iber v3. Reference Manual and User’s Interface of the New Implementations; CIMNE: Barcelona, Spain, 2022. [Google Scholar]
- Behrouz, M.S.; Zhu, Z.; Matott, L.S.; Rabideau, A.J. A New Tool for Automatic Calibration of the Storm Water Management Model (SWMM). J. Hydrol. 2020, 581, 124436. [Google Scholar] [CrossRef]
- Ren, X.; Hong, N.; Li, L.; Kang, J.; Li, J. Effect of Infiltration Rate Changes in Urban Soils on Stormwater Runoff Process. Geoderma 2020, 363, 114158. [Google Scholar] [CrossRef]
- Weber, J.F. Parámetros Del Modelo de Infiltración de Horton Obtenidos Mediante El Uso de Un Simulador de Lluvia, Córdoba, Argentina. Ambient. Agua Interdiscip. J. Appl. Sci. 2014, 9, 161–172. [Google Scholar] [CrossRef]
- Hu, C.; Xia, J.; She, D.; Song, Z.; Zhang, Y.; Hong, S. A New Urban Hydrological Model Considering Various Land Covers for Flood Simulation. J. Hydrol. 2021, 603, 126833. [Google Scholar] [CrossRef]
- Özgen, I.; Zhao, J.; Liang, D.; Hinkelmann, R. Urban Flood Modeling Using Shallow Water Equations with Depth-Dependent Anisotropic Porosity. J. Hydrol. 2016, 541, 1165–1184. [Google Scholar] [CrossRef]
- López, C.F.; Bladé, E.I.C. Modelización de la ruptura de una balsa de laminación y análisis según el esquema de cálculo; Universidad Politécnica de Catalunya: Barcelona, Spain, 2011. [Google Scholar]
- Srivastav, R.K.; Schardong, A.; Simonovic, S.P. Equidistance Quantile Matching Method for Updating IDFCurves under Climate Change. Water Resour. Manag. 2014, 28, 2539–2562. [Google Scholar] [CrossRef]
- Li, J. Assessing Spatial Predictive Models in the Environmental Sciences: Accuracy Measures, Data Variation and Variance Explained. Environ. Model. Softw. 2016, 80, 1–8. [Google Scholar] [CrossRef]
- Valderrama, J.O.; Alvarez, V.H. Correct Way of Reporting Results When Modelling Supercritical Phase Equilibria Using Equations of State. Can. J. Chem. Eng. 2008, 83, 578–581. [Google Scholar] [CrossRef]
- Xia, X.; Liu, Z.; Yang, H. Regularized Estimation for the Least Absolute Relative Error Models with a Diverging Number of Covariates. Comput. Stat. Data Anal. 2016, 96, 104–119. [Google Scholar] [CrossRef]
- Mentaschi, L.; Besio, G.; Cassola, F.; Mazzino, A. Problems in RMSE-Based Wave Model Validations. Ocean Model. 2013, 72, 53–58. [Google Scholar] [CrossRef]
- Frías-Paredes, L.; Mallor, F.; Gastón-Romeo, M.; León, T. Assessing Energy Forecasting Inaccuracy by Simultaneously Considering Temporal and Absolute Errors. Energy Convers. Manag. 2017, 142, 533–546. [Google Scholar] [CrossRef]
- López-Bermeo, C.; Montoya, R.D.; Caro-Lopera, F.J.; Díaz-García, J.A. Validation of the Accuracy of the CHIRPS Precipitation Dataset at Representing Climate Variability in a Tropical Mountainous Region of South America. Phys. Chem. Earth, Parts A/B/C 2022, 127, 103184. [Google Scholar] [CrossRef]
- Nawaz, M.; Iqbal, M.F.; Mahmood, I. Validation of CHIRPS Satellite-Based Precipitation Dataset over Pakistan. Atmos. Res. 2021, 248, 105289. [Google Scholar] [CrossRef]
- Jiang, W.; Yu, J.; Wang, Q.; Yue, Q. Understanding the Effects of Digital Elevation Model Resolution and Building Treatment for Urban Flood Modelling. J. Hydrol. Reg. Stud. 2022, 42, 101122. [Google Scholar] [CrossRef]
- Wang, Y.-M.; Luo, Y. Integration of Correlations with Standard Deviations for Determining Attribute Weights in Multiple Attribute Decision Making. Math. Comput. Model. 2010, 51, 1–12. [Google Scholar] [CrossRef]
- Municipio de Riohacha Plan de Ordenamiento Territorial Del Municipio de Riohacha, La Guajira-Colombia 2002–2105. Available online: https://goo.gl/NQaMUZ (accessed on 25 January 2015).
- Álvarez, M.; Puertas, J.; Peña, E.; Bermúdez, M. Two-Dimensional Dam-Break Flood Analysis in Data-Scarce Regions: The Case Study of Chipembe Dam, Mozambique. Water 2017, 9, 432. [Google Scholar] [CrossRef] [Green Version]
- Vozinaki, A.E.K.; Morianou, G.G.; Alexakis, D.D.; Tsanis, I.K. Comparing 1D and Combined 1D/2D Hydraulic Simulations Using High-Resolution Topographic Data: A Case Study of the Koiliaris Basin, Greece. Hydrol. Sci. J. 2017, 62, 642–656. [Google Scholar] [CrossRef]
- Villanueva, J.R.E.; Martínez, L.I.; Montiel, J.I.P. DEM Generation from Fixed-Wing UAV Imaging and LiDAR-Derived Ground Control Points for Flood Estimations. Sensors 2019, 19, 3205. [Google Scholar] [CrossRef] [Green Version]
- Santillan, J.R.; Makinano-Santillan, M. Vertical Accuracy Assessment of 30-M Resolution ALOS, ASTER, and SRTM Global DEMS over Northeastern Mindanao, Philippines. Int. Arch. Photogramm. Remote Sens. Spat. Inf. Sci ISPRS Arch. 2016, 41, 149–156. [Google Scholar] [CrossRef] [Green Version]
- Gibson, M.J.; Savic, D.A.; Djordjevic, S.; Chen, A.S.; Fraser, S.; Watson, T. Accuracy and Computational Efficiency of 2D Urban Surface Flood Modelling Based on Cellular Automata. Procedia Eng. 2016, 154, 801–810. [Google Scholar] [CrossRef] [Green Version]
- Salvan, L.; Abily, M.; Gourbesville, P.; Schoorens, J. Drainage System and Detailed Urban Topography: Towards Operational 1D-2D Modelling for Stormwater Management. Procedia Eng. 2016, 154, 890–897. [Google Scholar] [CrossRef] [Green Version]
- Ozdemir, H.; Sampson, C.C.; De Almeida, G.A.M.; Bates, P.D. Evaluating Scale and Roughness Effects in Urban Flood Modelling Using Terrestrial LIDAR Data. Hydrol. Earth Syst. Sci. 2013, 17, 4015–4030. [Google Scholar] [CrossRef] [Green Version]
- Morgan, A.; Olivier, D.; Nathalie, B.; Claire-Marie, D.; Philippe, G. High-Resolution Modelling With Bi-Dimensional Shallow Water Equations Based Codes—High-Resolution Topographic Data Use for Flood Hazard Assessment Over Urban and Industrial Environments. Procedia Eng. 2016, 154, 853–860. [Google Scholar] [CrossRef]


| Cell | f0 (mm/h) | fc (mm/h) | K (min−1) |
|---|---|---|---|
| 203 | 15.000 | 0.375 | 1.200 |
| 503 | 15.000 | 0.375 | 1.100 |
| 306, 310 | 0.500 | 0.375 | 3.000 |
| 205 | 0.375 | 0.200 | 3.200 |
| 201 | 0.375 | 0.100 | 3.300 |
| All others | 2.000 | 0.375 | 2.000 |
| Box Culvert | Regime | Weir Parameter | Threshold Elevation (masl) |
|---|---|---|---|
| La vía | Subcritical | 0.150001 | 3.28 |
| Vivero | Subcritical | 0.150001 | 2.13 |
| Pescadería | Subcritical | 0.150001 | 1.20 |
| Name | Symbol | Description | Unit | Range | Sense | Source |
|---|---|---|---|---|---|---|
| Mean realtive error | emean | Arithmetic mean of the errors; provides a general idea. | % | −∞ ÷ ∞ | The closer to zero the better | [43,44,45] |
| Maximum absolute error | |eM| | Max absolute value of the errors, either by defect or excess. | m | 0 ÷ ∞ | The smaller the better | [46] |
| Root of the mean square error | RMSE | RMSE indicates the adherence of the model to data. It is sensitive to large errors, because of the squared operator. | m | 0 ÷ ∞ | Better the closer it approaches zero | [45,47,48,49] |
| Correlation coefficient | R | r says if model and data vary in the same sense. | ad | −1 ÷ 1 | The closer to one the better | [47,50] |
| Standard deviation of error | σe | This measures the dispersion of errors. | ad | 0 ÷ ∞ | The smaller the better | |
| Variance explained | σ²exp | This expresses how much the model captures the variable pattern relative to its intrinsic variability. | ad | 0 ÷ 1 | Closer to 1 the better 1 | [42] |
| Mean relative bias | Bias | Bias points out whether there is a systematic difference. | % | −∞ ÷ ∞ | The closer to zero the better 2 | [47] |
| Mean absolute error | MAE | MAE points out whether there is a significant average error either by excess or deficiency. | m | 0 ÷ ∞ | The smaller the better | [48] |
| Model | CENTER/HOUSES | N | Dmean (m) | emean (%) | |eM| (m) | RMSE (m) | r | σe | σ²exp | Bias (%) | MAE (m) |
|---|---|---|---|---|---|---|---|---|---|---|---|
| MODCEL | Transport cells CENTER | 13 | 0.56 | 3.690 | 0.130 | 0.062 | 0.986 | 0.061 | 0.971 | 0.687 | 0.052 |
| Transport cells HOUSES | 19 | 4.042 | 0.290 | 0.096 | 0.972 | 0.095 | 0.943 | −1.775 | 0.071 | ||
| Tank cells CENTER | 5 | 2.23 | 2.847 | 0.260 | 0.138 | 0.997 | 0.135 | 0.993 | 0.896 | 0.096 | |
| Tank cells HOUSES | 15 | 1.534 | 0.330 | 0.197 | 0.910 | 0.193 | 0.827 | −3.996 | 0.174 | ||
| IBER | Transport cells CENTER | 13 | 0.56 | −5.835 | 0.540 | 0.301 | 0.674 | 0.269 | 0.443 | −24.100 | 0.258 |
| Transport cells HOUSES | 19 | −41.917 | 0.770 | 0.350 | 0.764 | 0.258 | 0.583 | −40.03 | 0.282 | ||
| Tank cells CENTER | 5 | 2.23 | −5.035 | 0.536 | 0.306 | 0.984 | 0.295 | 0.968 | −3.515 | 0.232 | |
| Tank cells HOUSES | 15 | −3.560 | 0.717 | 0.361 | 0.674 | 0.350 | 0.433 | −8.872 | 0.308 | ||
| MODCEL | Transport cells CENTER | 22 | 0.40 | −7.944 | 0.360 | 0.159 | 0.847 | 0.143 | 0.717 | −16.760 | 0.120 |
| Transport cells HOUSES | 22 | −7.944 | 0.360 | 0.159 | 0.847 | 0.143 | 0.717 | −16.760 | 0.120 | ||
| Tank cells CENTER | 5 | 2.07 | 1.517 | 0.390 | 0.208 | 0.993 | 0.133 | 0.994 | −0.676 | 0.150 | |
| Tank cells HOUSES | 12 | −3.599 | 0.640 | 0.394 | 0.780 | 0.332 | 0.588 | −28.950 | 0.347 | ||
| IBER | Transport cells CENTER | 22 | 0.40 | −6.873 | 0.429 | 0.157 | 0.850 | 0.143 | 0.719 | −16.162 | 0.116 |
| Transport cells HOUSES | 22 | −2.468 | 0.820 | 0.203 | 0.807 | 0.203 | 0.432 | −1.755 | 0.109 | ||
| Tank cells CENTER | 5 | 2.07 | 5.284 | 0.769 | 0.400 | 0.975 | 0.258 | 0.977 | 0.323 | 0.301 | |
| Tank cells HOUSES | 12 | −18.064 | 0.579 | 0.310 | 0.817 | 0.305 | 0.653 | −7.492 | 0.250 |
| Celda | Connected Cell | Event 18 September 2011 (m) | Scenario 1 (m) | Scenario 2 (m) |
|---|---|---|---|---|
| 103 | La mano de Dios | 0.16 | 0.20 | 0.19 |
| 201 | Mano de Dios | 0.13 | 0.17 | 0.16 |
| 203 | Taguaira | 0.38 | 0.40 | 0.44 |
| 205 | Mano de Dios | 0.37 | 0.41 | 0.43 |
| 302 | Comunitario | 0.52 | 0.49 | 0.61 |
| 306 | San Judas Tadeo | 0.18 | 0.20 | 0.22 |
| 310 | San Judas Tadeo | 0.02 | 0.02 | 0.02 |
| 503 | San Francisco | 0.41 | 0.39 | 0.50 |
| 506 | Calancala y Las Villas | 0.87 | 0.89 | 1.02 |
| 511 | Luis Eduardo Cuellar | 0.87 | 0.93 | 1.03 |
| 514 | Luis Eduardo Cuellar | 0.91 | 0.95 | 1.16 |
| 515 | San Francisco | 0.31 | 0.32 | 0.37 |
| 604 | Camilo Torres | 0.38 | 0.44 | 0.45 |
| Model | Advantages | Weaknesses |
|---|---|---|
| MODCEL | - no commercial software, free for research purposes - can be used even when topographic information lacks detail - ability to represent surface and undergound drainage- sewarage systems (both free surface and pressure) and their interconnection with surface runoff - high calculation speed as it does not imply partial differential equations - requires a deep understanding of the physical system which helps selecting the appropriate representation of its components and avoids critical misunderstandings - good educational potential to drive students to master the ability to schematize reality | - the access, for the moment, requires contact with its creator - no user-friendly interface (although evolutions are likely) - outputs are numerical tables, so a GIS tool and post-processing are required to show results and to obtain data useful for risk calculations - velocities have a physical meaning only in 1D cells (conduits) - it is, in general, not easy to use without specific training or support by its developers, and few training or application documentation is available (and mainly in Portuguese only) - no open access code; however, its developers are open to improving it. |
| IBER | - free software, well-known world-wide - rich information available on its use and applications - nice interface (although its logic is far from being intuitive) - georeferenced, 2D spatial outputs useful for communication and risk calculations - velocities have a physical meaning - open access code | - it requires a detailed topographic information (DTM) - hard incorporation of a surface (open channel) drainage system - challenging representation of hydraulic structures (manholes, outlets) - impossibility to include the connection and interactive interaction with underground drainage-sewarage systems - very long calculation time |
Publisher’s Note: MDPI stays neutral with regard to jurisdictional claims in published maps and institutional affiliations. |
© 2022 by the authors. Licensee MDPI, Basel, Switzerland. This article is an open access article distributed under the terms and conditions of the Creative Commons Attribution (CC BY) license (https://creativecommons.org/licenses/by/4.0/).
Share and Cite
Pérez-Montiel, J.I.; Cardenas-Mercado, L.; Nardini, A.G.C. Flood Modeling in a Coastal Town in Northern Colombia: Comparing MODCEL vs. IBER. Water 2022, 14, 3866. https://doi.org/10.3390/w14233866
Pérez-Montiel JI, Cardenas-Mercado L, Nardini AGC. Flood Modeling in a Coastal Town in Northern Colombia: Comparing MODCEL vs. IBER. Water. 2022; 14(23):3866. https://doi.org/10.3390/w14233866
Chicago/Turabian StylePérez-Montiel, Jhonny I., Leyner Cardenas-Mercado, and Andrea Gianni Cristoforo Nardini. 2022. "Flood Modeling in a Coastal Town in Northern Colombia: Comparing MODCEL vs. IBER" Water 14, no. 23: 3866. https://doi.org/10.3390/w14233866
APA StylePérez-Montiel, J. I., Cardenas-Mercado, L., & Nardini, A. G. C. (2022). Flood Modeling in a Coastal Town in Northern Colombia: Comparing MODCEL vs. IBER. Water, 14(23), 3866. https://doi.org/10.3390/w14233866


