Article

Advancement of a Liquid Scintillation Counter and Semiconductor Alpha Spectroscopy Detector to Estimate the Radon Concentration in Groundwater

1
Department of Physics, College of Science, University of Hafr Al Batin, Al Jamiah, Hafr Al Batin 39524, Saudi Arabia
2
Department of Chemistry, College of Science, University of Hafr Al Batin, Al Jamiah, Hafr Al Batin 39524, Saudi Arabia
*
Author to whom correspondence should be addressed.
Water 2022, 14(23), 3849; https://doi.org/10.3390/w14233849
Submission received: 2 October 2022 / Revised: 2 November 2022 / Accepted: 17 November 2022 / Published: 26 November 2022

Abstract

:
Radon is one of the most natural forms of radiation for human exposure. However, high-accuracy measurement of natural radon in water samples is very challenging due to the background correction, data acquisition, and sampling time. Liquid scintillation counter (LSC) and semiconductor alpha spectroscopy detectors are the most commonly used methods of determining radon concentration in water. The present study utilizes both methods to estimate radon in groundwater collected from various locations in the northeast region of Saudi Arabia. The estimated radon concentrations using Hidex 300SL are compared with a Durridge RAD7 detector to evaluate each apparatus’s abilities, advantages, and disadvantages. Both methods show radon concentrations between 0.1 and 3.20 Bq/L with an average of 0.96 Bq/L, with a standard deviation of 0.82 Bq/L. The estimated values are found to be in the safe limit recommended by the USEPA and EAEC and are far below the safe level recommended by UNSCEAR and the WHO. Comparing the estimated radon concentration using the two methods shows that although the two devices have many advantages and disadvantages based on the two different techniques, the experimental results are almost the same with experimental error.

1. Introduction

Radon gas and its short-lived decay products are the main sources of human exposure [1]. It is reported that most of the annual effective natural radiation is caused by radon exposure [2,3]. Exposure to radon and its progeny released from water can cause serious health problems, such as lung cancer [1,4]. However, exposure to radon, induced at even a minimal amount, can transfer a large amount of energy to vulnerable cells in the inner organs. Since the lifetime of radon is much longer than the typical breath rate, a very small amount of radon decays in the lungs, where the progeny can cause serious problems. It was found that most radon-induced cancer originates from inhaled progeny in the lungs [5]. Various techniques are now used to estimate the radon concentration in water [6,7], such as the use of liquid scintillation counters (LSCs), Lucas cells [8], ionization chambers, gamma and alpha spectroscopy, solid-state alpha detectors and water aeration [9,10]. These methods have advantages and disadvantages based on principles, experimental techniques, and procedures. Among them, scintillation counters, Lucas cells, ionization chambers and semiconductor alpha spectroscopy detectors are mainly used. All of the mentioned detectors can measure alpha particles for low background levels [11].
The advantage of a liquid scintillation counter is that it can count low radon activity. Various types of samples, for example, solids, liquids, suspensions, and gels, can be accommodated with an LSC counter. Moreover, different isotopes can be counted simultaneously. However, liquid scintillation counters are cumbersome [12].
A semiconductor alpha spectroscopy counter, for example, Durridge RAD7, uses a semiconductor material of silicon that converts the alpha radiation into an electrical signal. It can determine the energy of each alpha particle that gives us the isotope information, particularly about polonium-218 and polonium-214. It can differentiate between old radon to new radon, radon from thoron and signal from noise. Ruggedness is another advantage of the RAD7 detector, which makes this device more applicable.
Moreover, a Durridge RAD7 digital radon detector can be used for field analysis with a big bottle system and water kit equipment to elute radon gas from water [13]. It is a portable and battery-operated device. The RAD7 device can be connected to a big bottle system with a bubbling kit that aerates radon gas from water to air in a closed loop [13,14,15]. This device can estimate the radon concentration in a short time with high accuracy. The device with a big bottle accessory has the capacity to measure a radon concentration from 1 pCi/L to 10,000 pCi/L. However, this apparatus cannot analyze more than one sample at a time.
The present article uses scintillation counter and semiconductor alpha spectroscopy methods to estimate radon concentrations under optimum conditions. The estimated radon concentrations using the liquid scintillation counter of the Hidex 300SL and RAD7 detectors are compared for groundwater collected from various locations in the northeast region of Saudi Arabia. Their advantages and disadvantages are also discussed in detail.

2. Materials and Methods

The present study selected three main cities: Hafr Al Batin, Thybiyah, and Qaisumah, which are located in the Eastern Province of the northeast part of Saudi Arabia. The area lies between the longitude of 28°26′3′′ N and latitude of 45°57′49′′ E (Figure S2 in the Supporting Information). The Eastern Province of Saudi Arabia has aquifers of good water quality due to its wide variation in geological settings. According to Vincent [16] and Alsharhan et al. [17], the origin aquifers include the Quaternary sands of the wadi system, quartz sandstones, conglomerates with primary porosity and calcarenite, coquinite, and oolitic limestone with secondary porosity. Hafr Al Batin has a Quaternary sand aquifer where deep wells supply relatively good water compared to shallow wells. Higher radon concentrations are usually detected in groundwater associated with granite and metamorphic rocks [18]. This report uses two methods to estimate the radon concentration in groundwater: the scintillation counting method and the semiconductor alpha spectroscopy method.
A Hidex 300SL liquid scintillation counter was used to estimate radon in groundwater samples. The device is based on the triple-to-double coincidence ratio (TDCR). The TDCR method is an important tool in radionuclide metrology for standardizing pure [2]- and pure EC radionuclides. The detector has three photomultipliers that enable counting of the triple-to-double coincidence ratio, a method to obtain the counting efficiency of an unknown sample without any standard source [19]. The method is an absolute activity measurement method specifically developed for pure beta- and pure EC-emitter activity determination, in which the detection efficiency is calculated from a physical and statistical model of the photon distribution emitted by the scintillating source [20]. A photograph of such a measuring device in our laboratory with a scintillation principle is shown in Figure 1a,b. The device has three photomultiplier tubes on the same plane at an angle of 120 degrees to each other (Figure 1c). The detector has three photomultipliers that enable counting of the triple-to-double coincidence ratio, a method to obtain the counting efficiency of an unknown sample without any standard source. The triple-to-double coincidence ratio is a method that can be applied for both chemical and color quenching, aqua- and organic samples, cocktails, and isotopes. First, an appropriate scintillation cocktail (Hidex Aqualight plus) was added to the scintillation vial. Then, the water sample was taken below the scintillation cocktail to avoid any aeration of the water and secured with a tight cap. The samples were always kept in cool and dark places, since luminescence can have a significant effect. Hidex 300SL discharges static electricity from the sample to avoid the static electricity effect. Samples were prepared by adding 12 mL of a water-soluble cocktail with 8 mL of an aqueous sample. The scintillation device then measured the radon activity by emitting photons. It should be mentioned that special attention should be taken during the sample preparation; otherwise, the estimated result will be influenced by escaping the radon gas from the water sample. Radon gas might escape from water during contact with the atmosphere. Therefore, groundwater samples were collected directly from the pump into glass bottles and capped immediately.
A Hidex 300SL counter has an option to separate alpha and beta isotopes and can even separate alpha isotopes in the presence of beta radiation. The results can be calibrated and validated with the 2D/3D spectrum using analytical tools, even for unknown mixtures of alpha and beta isotopes. The counter is equipped with an autosampler to hold large quantities of samples to count automatically. The data analysis, efficiency correction, graph plotting, various calculations, and radioimmunoassay are programmable and can be controlled using a built-in computer.
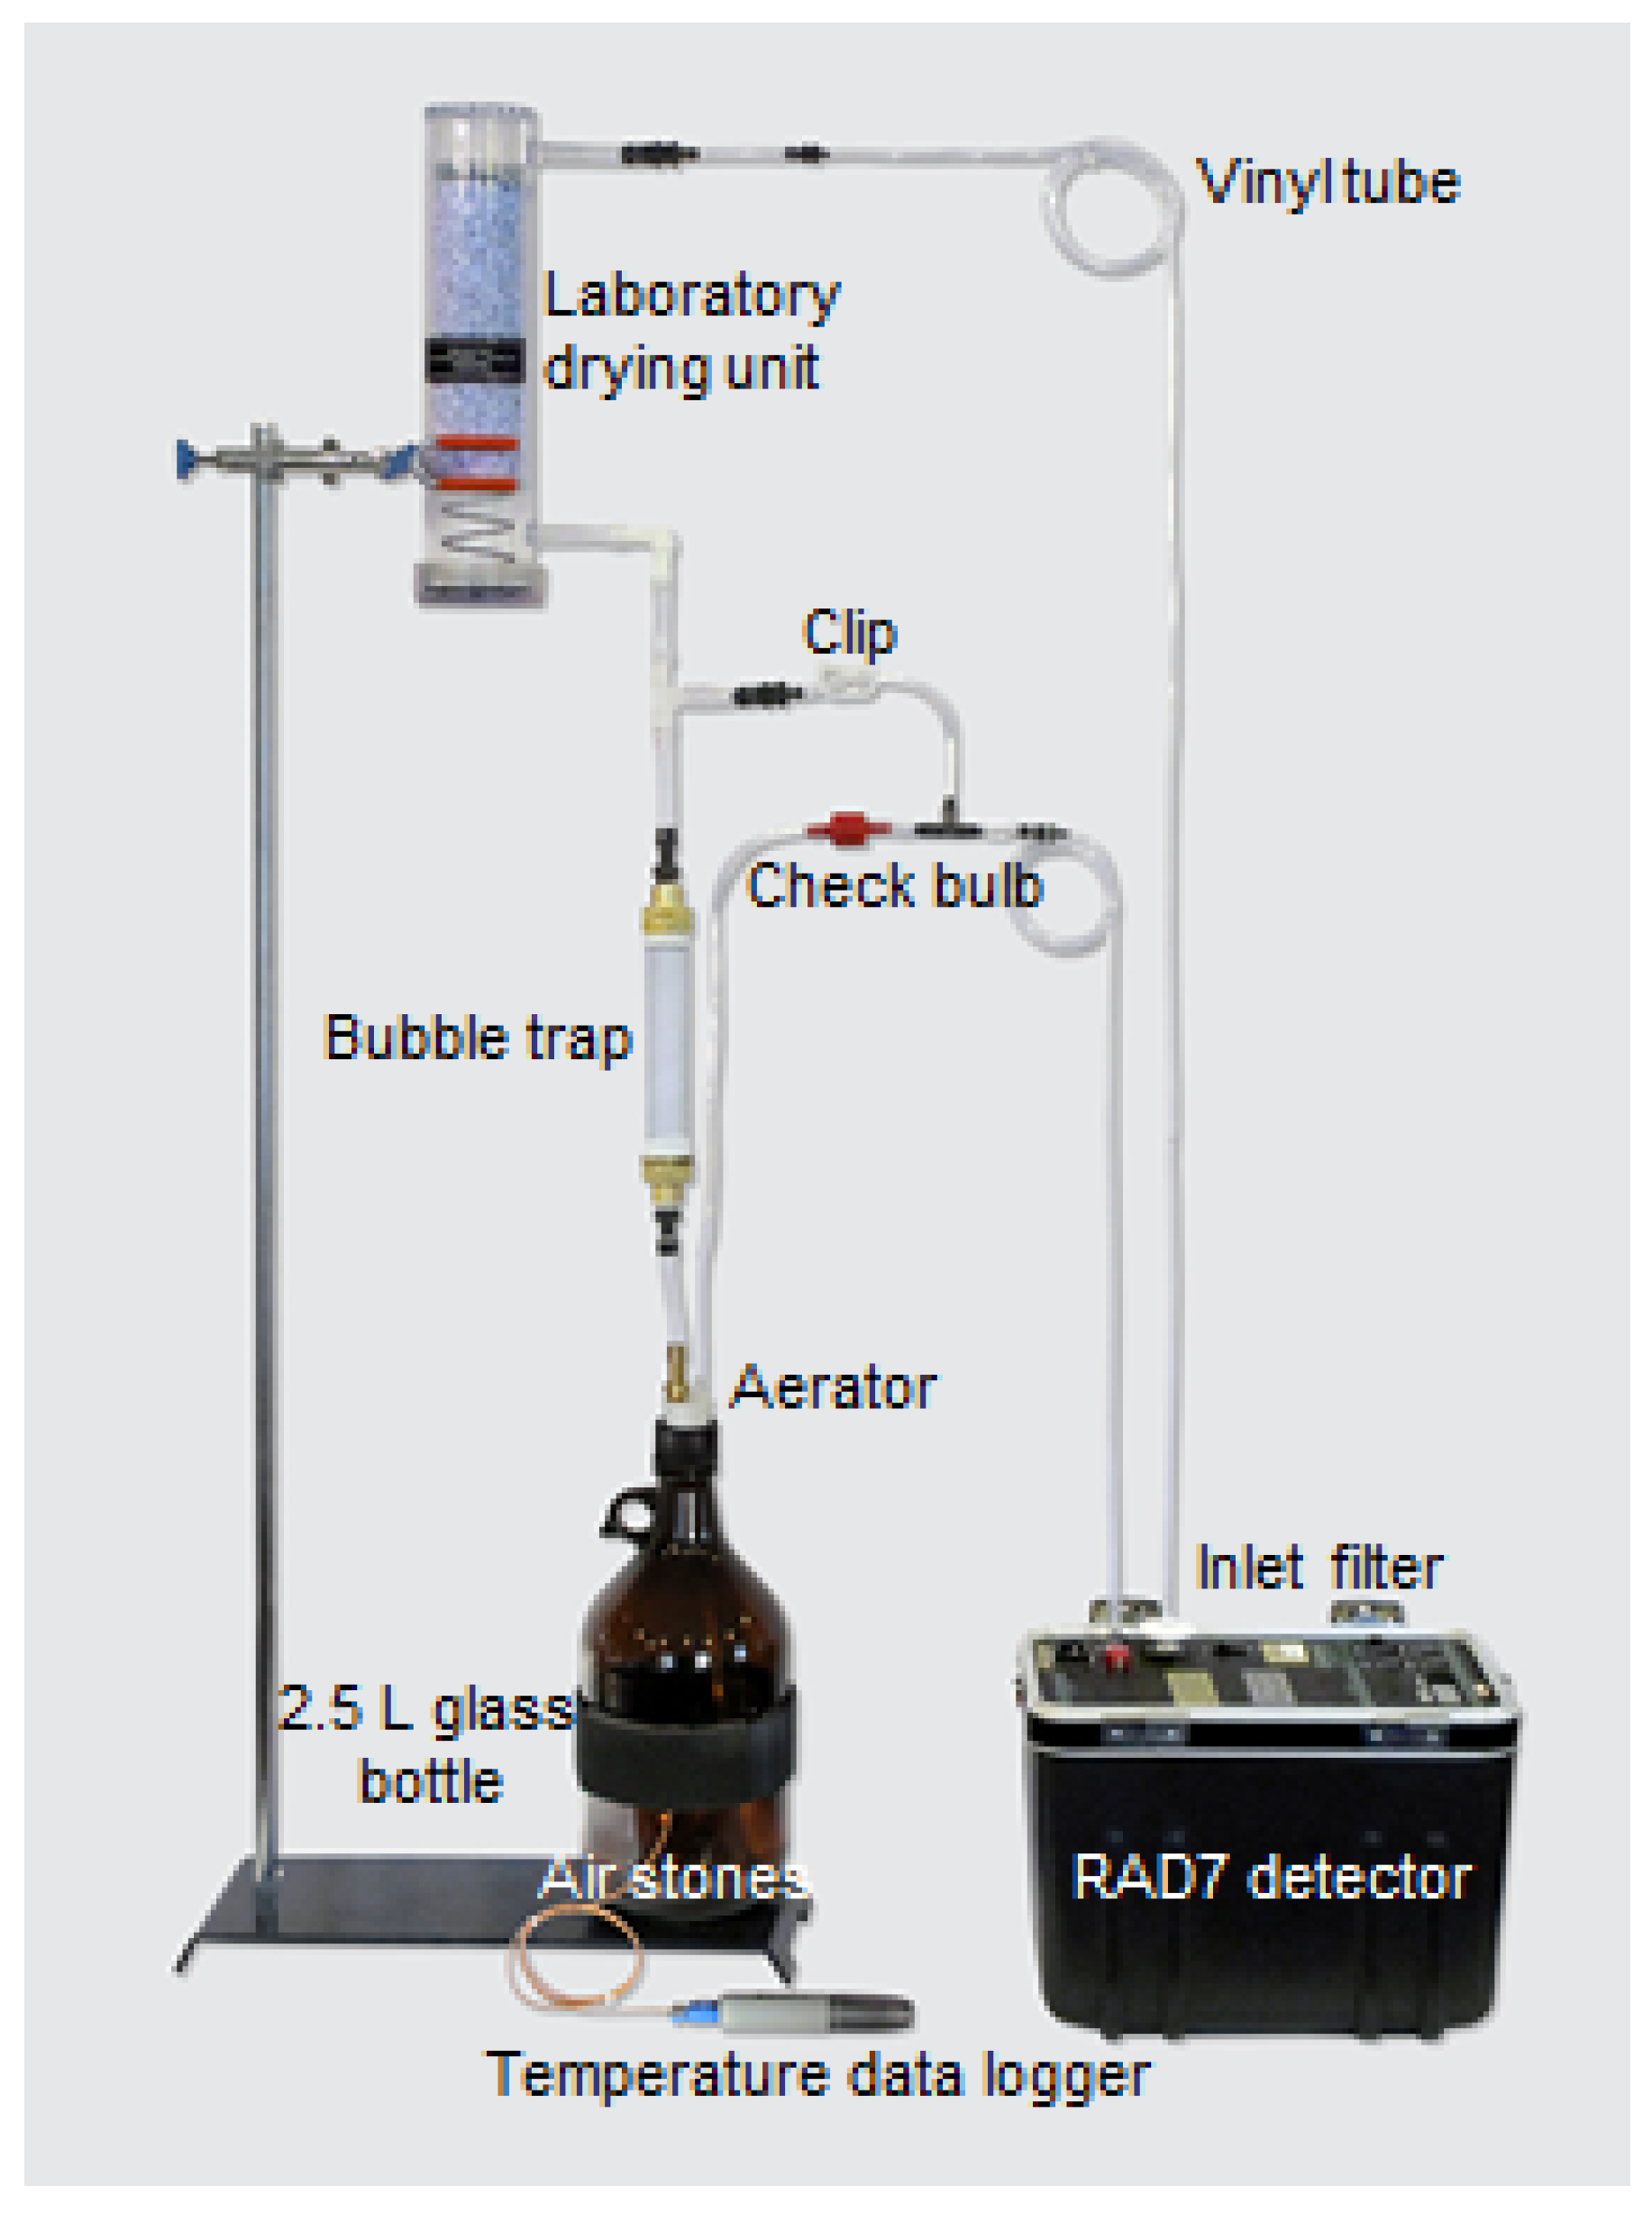
A Durridge RAD7 digital detector meter (Durridge Company Inc., Billerica, MA, USA) with a big bottle accessory was used to estimate the radon concentration using the semiconductor alpha spectroscopy method (Figure 2). For better performance, in most cases, the measurements were carried out instantly on the spot and within four hours after sample collection. Before the experiment, RAD7 runs for ten minutes to purge air to evacuate the residual radon gas from the measuring chamber. Several drying options can be chosen, but it is convenient to use a large drying unit for purging air in laboratory use. A photograph of the measuring device is shown in Figure S1. Later, an appropriate program was run for the radon estimation continuously for fifteen cycles. Every two minutes of measurement, the relative data, corresponding bar charts and related cumulative spectra can be printed using a wireless infrared printer provided by the company. The data from the detector were collected by a USB serial port to the computer and analyzed using RAD7 data acquisition and analysis software (CAPTURE, Durridge Company Inc., USA). The detector gives the average counting results of thirty minutes of analysis, considering a sensitivity level close to or exceeding that of liquid scintillation techniques [14,21]. Finally, corrections for the system’s temperature, humidity, water salinity, and volume were made using the CAPTURE analysis software.

3. Results and Discussion

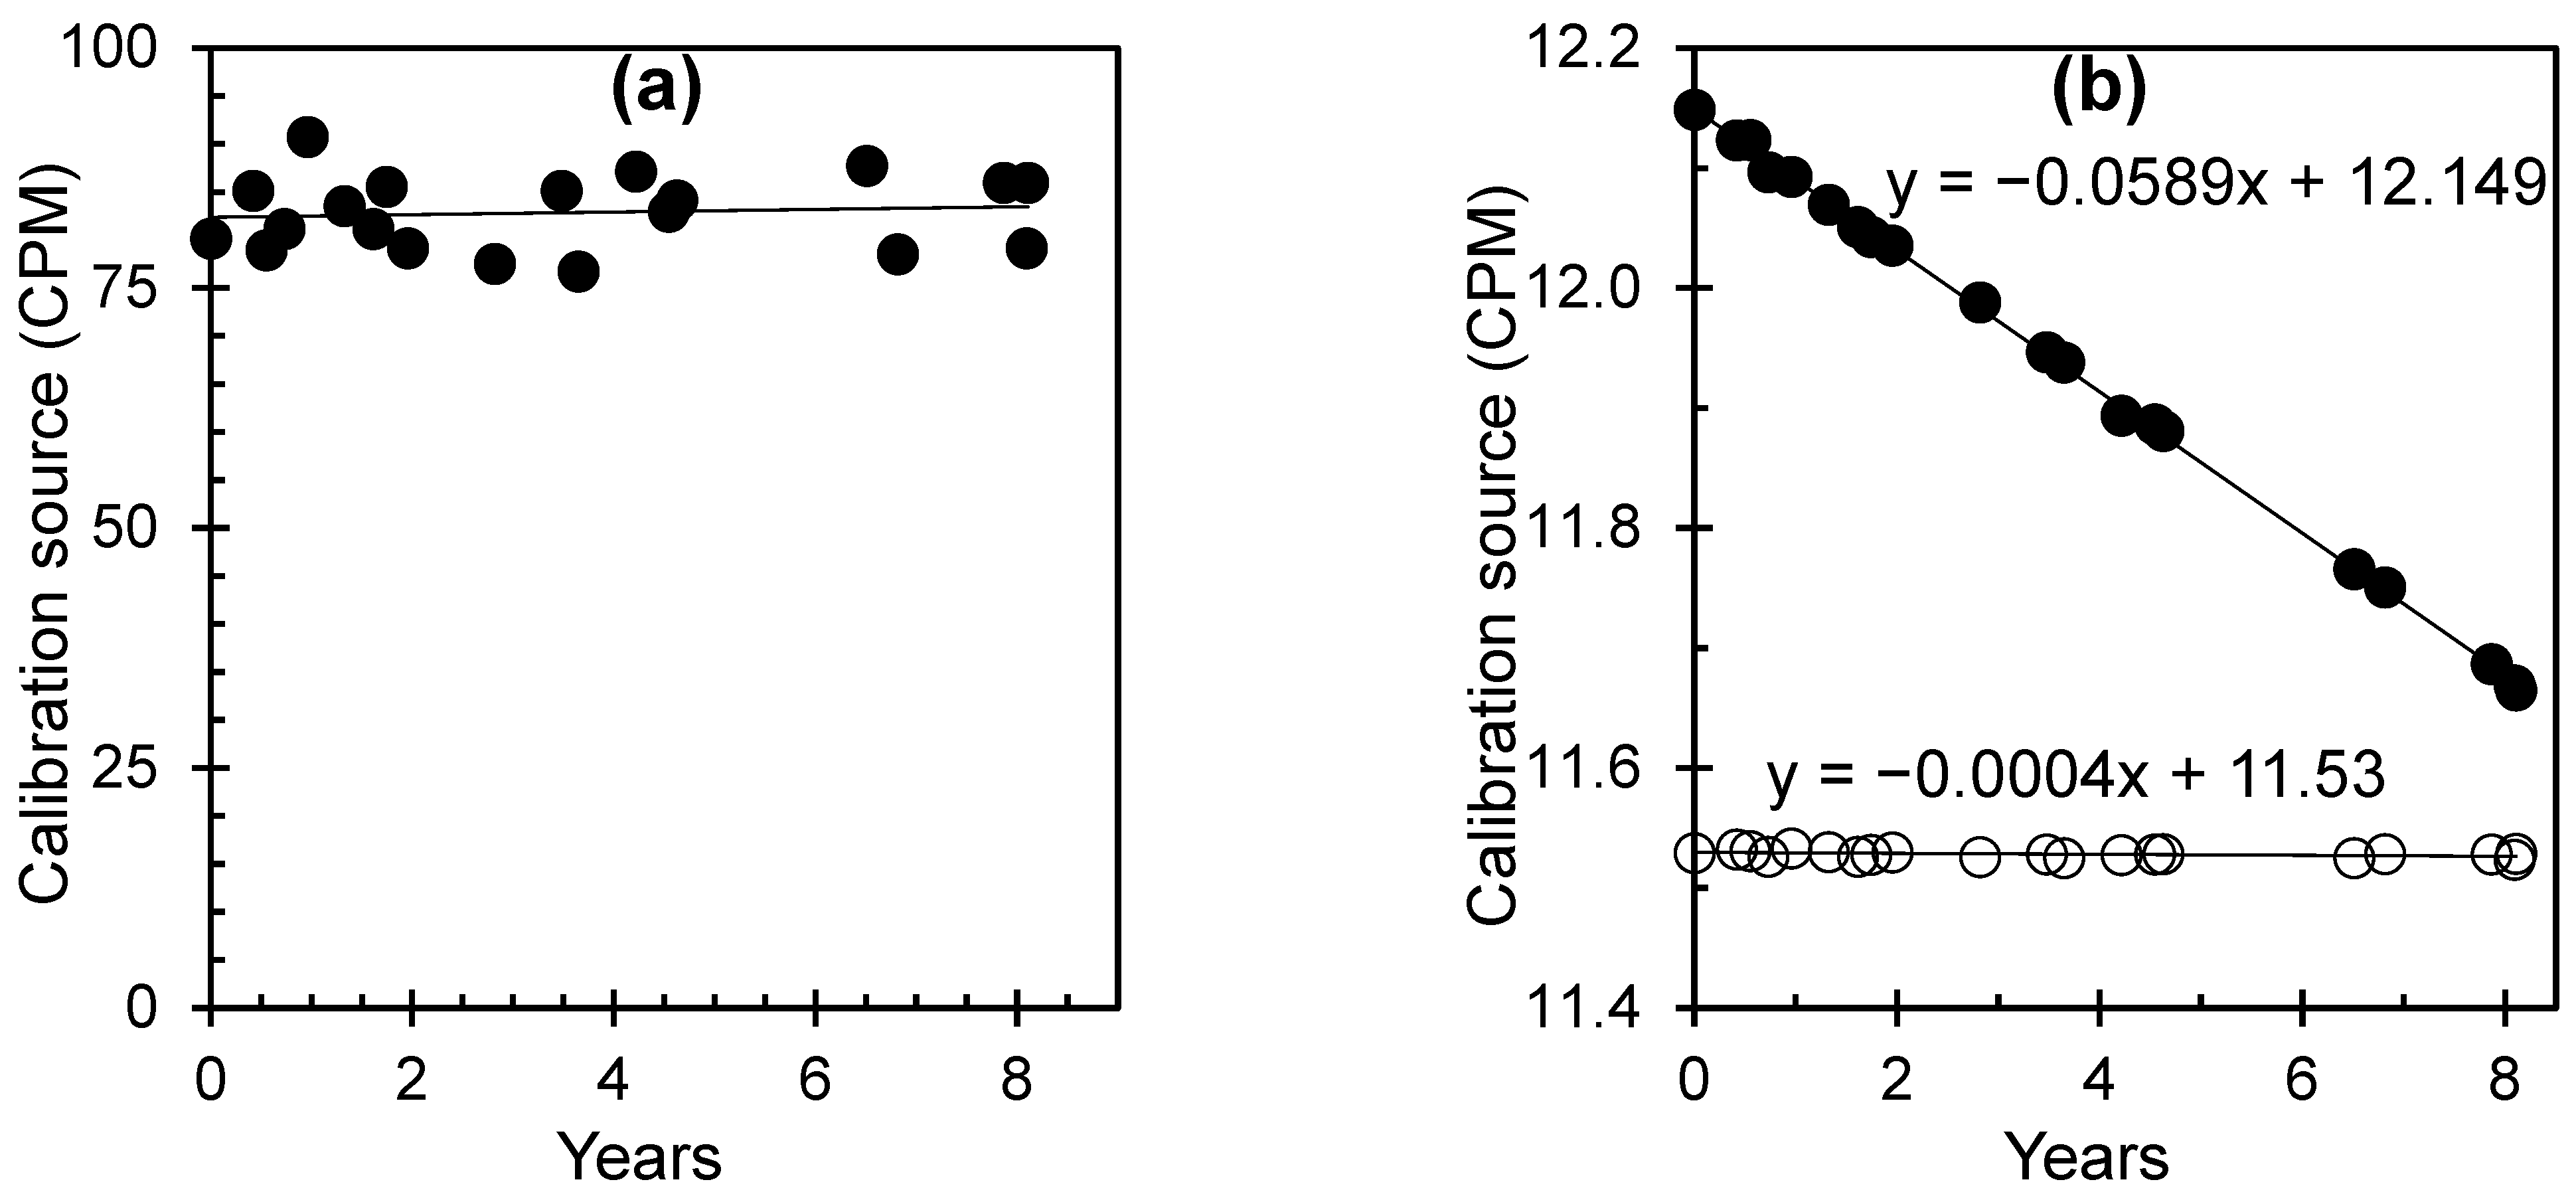
It is essential to check the device performance with calibration and efficiency calculations to estimate the radon concentration of a given sample when using a liquid scintillation counter. The device should be monitored biweekly or monthly using a standard source. The background radiation, calibration, and efficiency were checked periodically. Such a controlled chart for the calibration using an authoritative source of certified activity-free solution, carbon 14 (14C) source, and tritium source (3H) is shown in Figure 3. The activity-free solution shows an almost constant reading with minimal experimental error in the last eight years (Figure 3a). The data imply that minimal radiation is always present in the activity-free solution and the environment. For the standard source, a natural logarithm plot of carbon 14, no significant changes in count per minute (CPM) were detected due to its longer half-life (approximately 5715 ± 40 years) [22]. On the other hand, for the standard tritium source (3H), the natural logarithmic plot shows a linear decrease in the count for the last eight years of device initialization (0.6162 times the initial count) (Figure 3b). Using the gradual linear curve from natural logarithmic scale, a rough estimation shows a half-life of approximately 11.8 years for 3H, which is close to the published data of 12.3 years reported in the literature [23]. Such a result of a stable background count and constant 14C count with time implies the excellent performance of the liquid scintillation device. It should be mentioned that if the measured value is approximately 1000 times higher than the background count, the background effect can be ignored.
The radon concentration can be calculated using the following equation:
A = N n e t ε × f × V .
A, activity concentration of radon
Nnet, net count rate in CPS
ε, counting efficiency
f, in-growth factor
V, the volume of the sample in the liter
and
f = 1 e λ R n 222 . t m s
λRn222, decay rate of 222Rn per day
tms→s, time laps between sample collection and measurement using LSC. The estimated radon concentration using a liquid scintillation counter is tabulated in Table 1 and will be discussed in a later section combined with the Durridge RAD7 results.
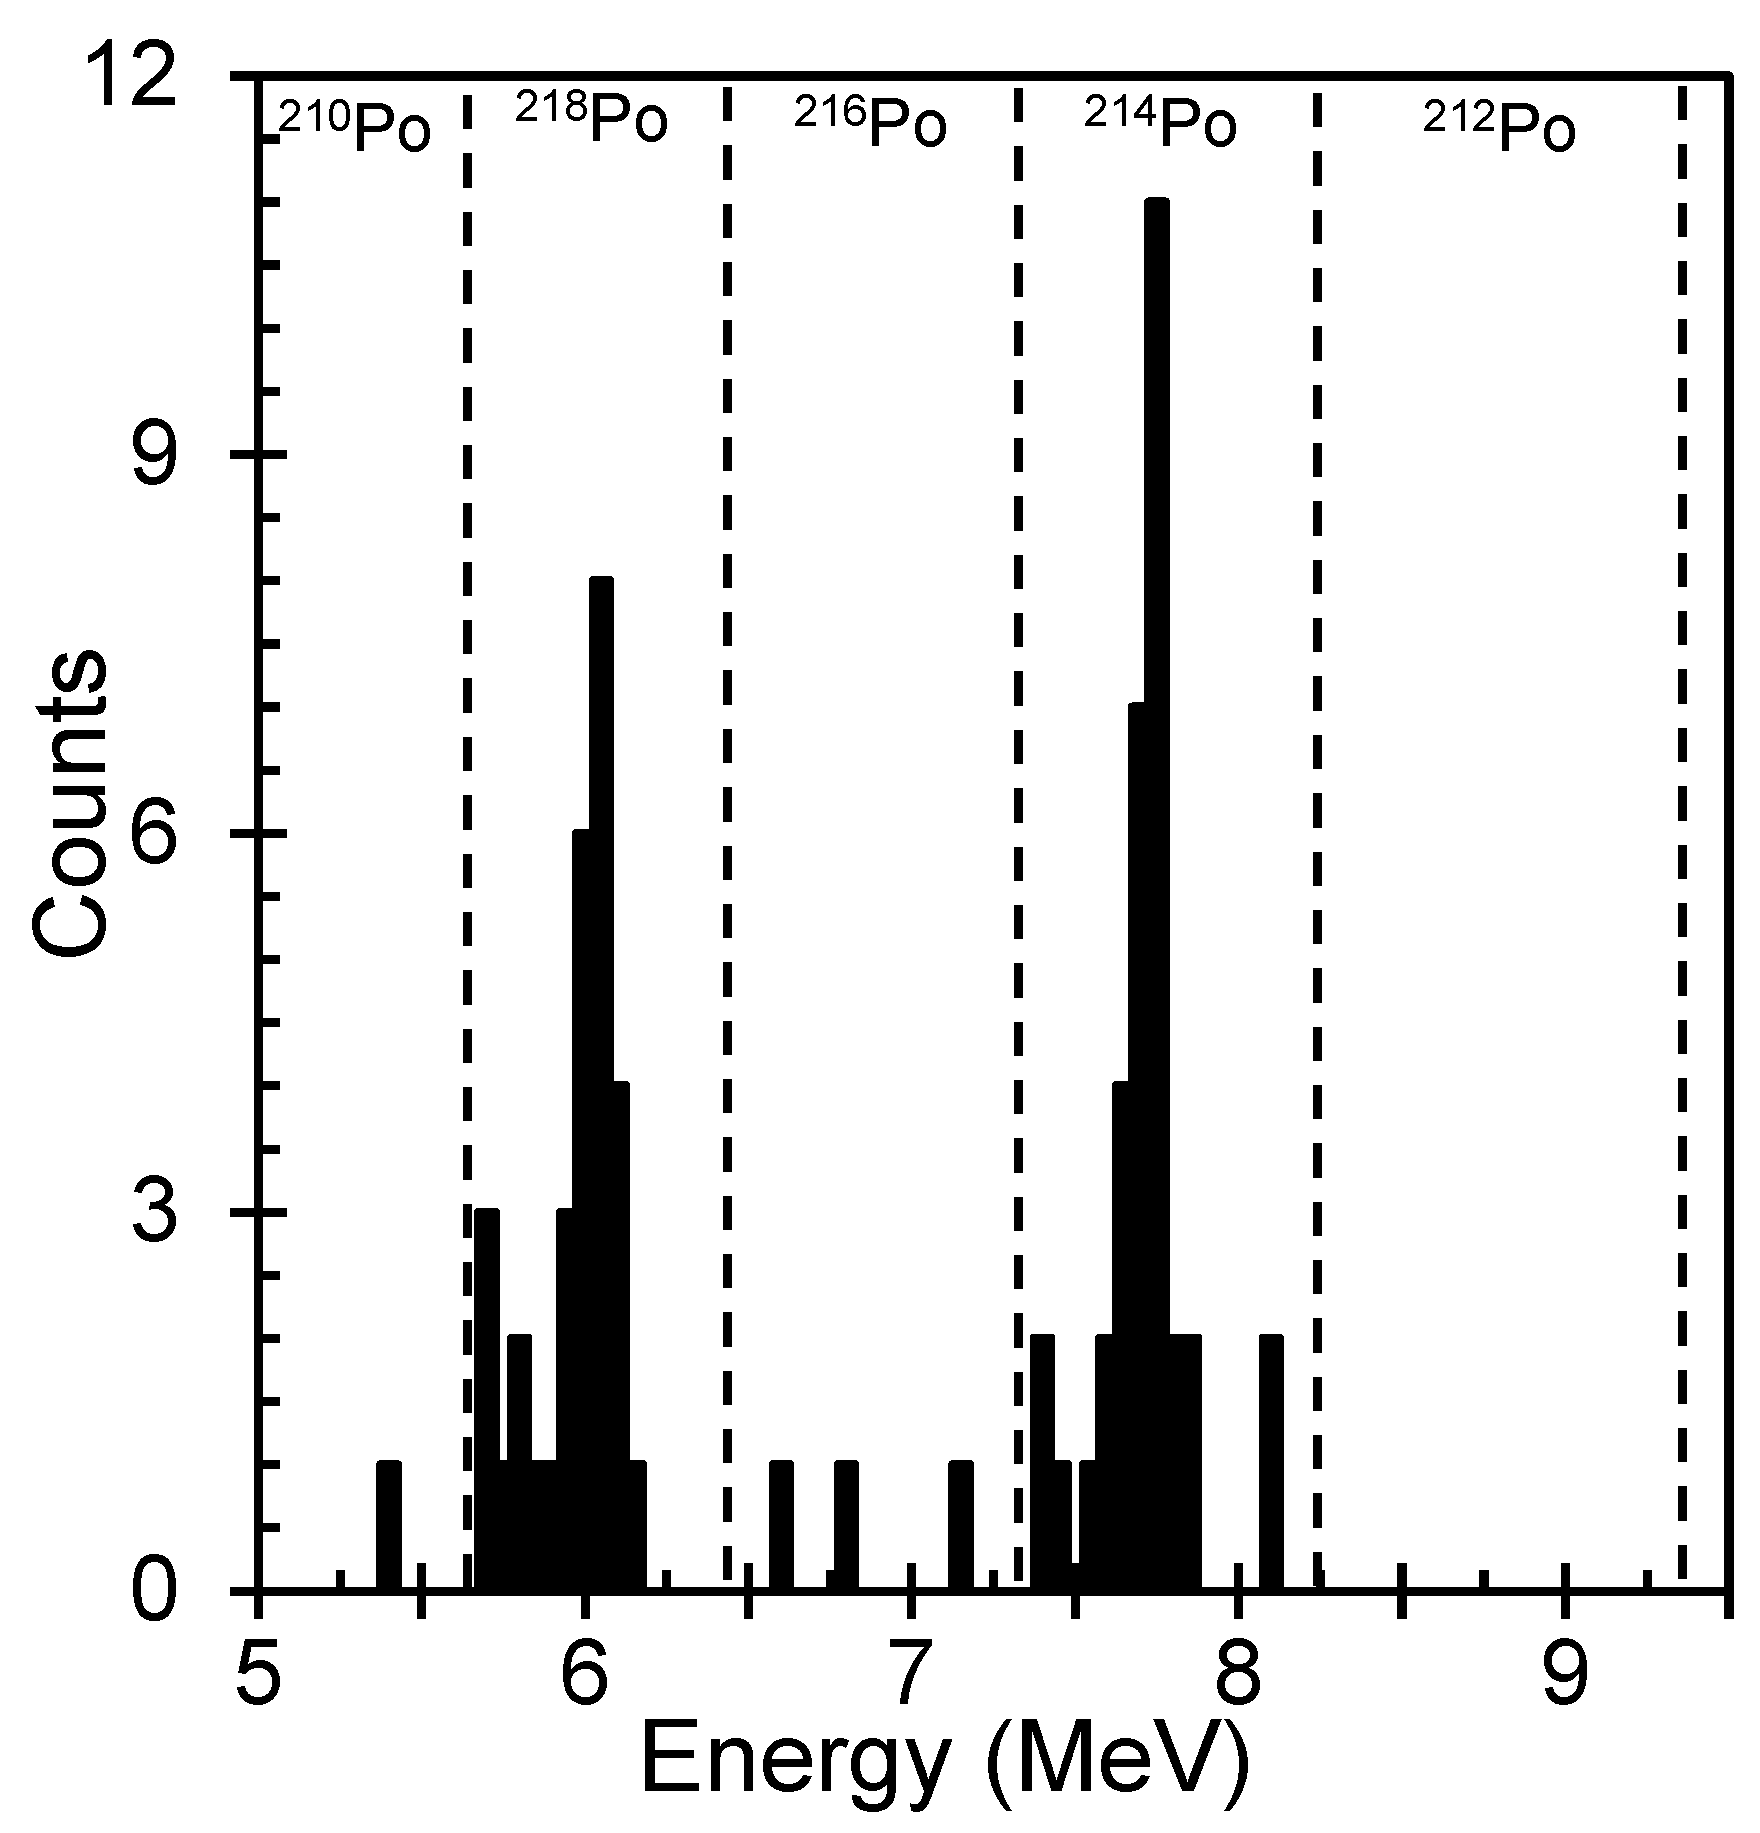
To detect radon using a semiconductor alpha spectroscopy detector, the silicon (Si) scintillation detector of a computerized multichannel radon detector RAD7 converts the α-radiation energy from radon gas directly into an electrical signal, amplifies that signal, and then converts the signal into a digital format [24]. The data processor of RAD7 receives the signal and processes it to form an energy spectrum within the energy range (1–10) MeV. Such a typical spectrum of sample H10 by RAD7 with different windows is shown in Figure 4. The signal for radon and thorium decay appears at 5–9 MeV. The spectra with 200 channels with other windows show specific isotopes of alpha particles for Po-218 (6 MeV) or the Po-214 nucleus (7.75 MeV).
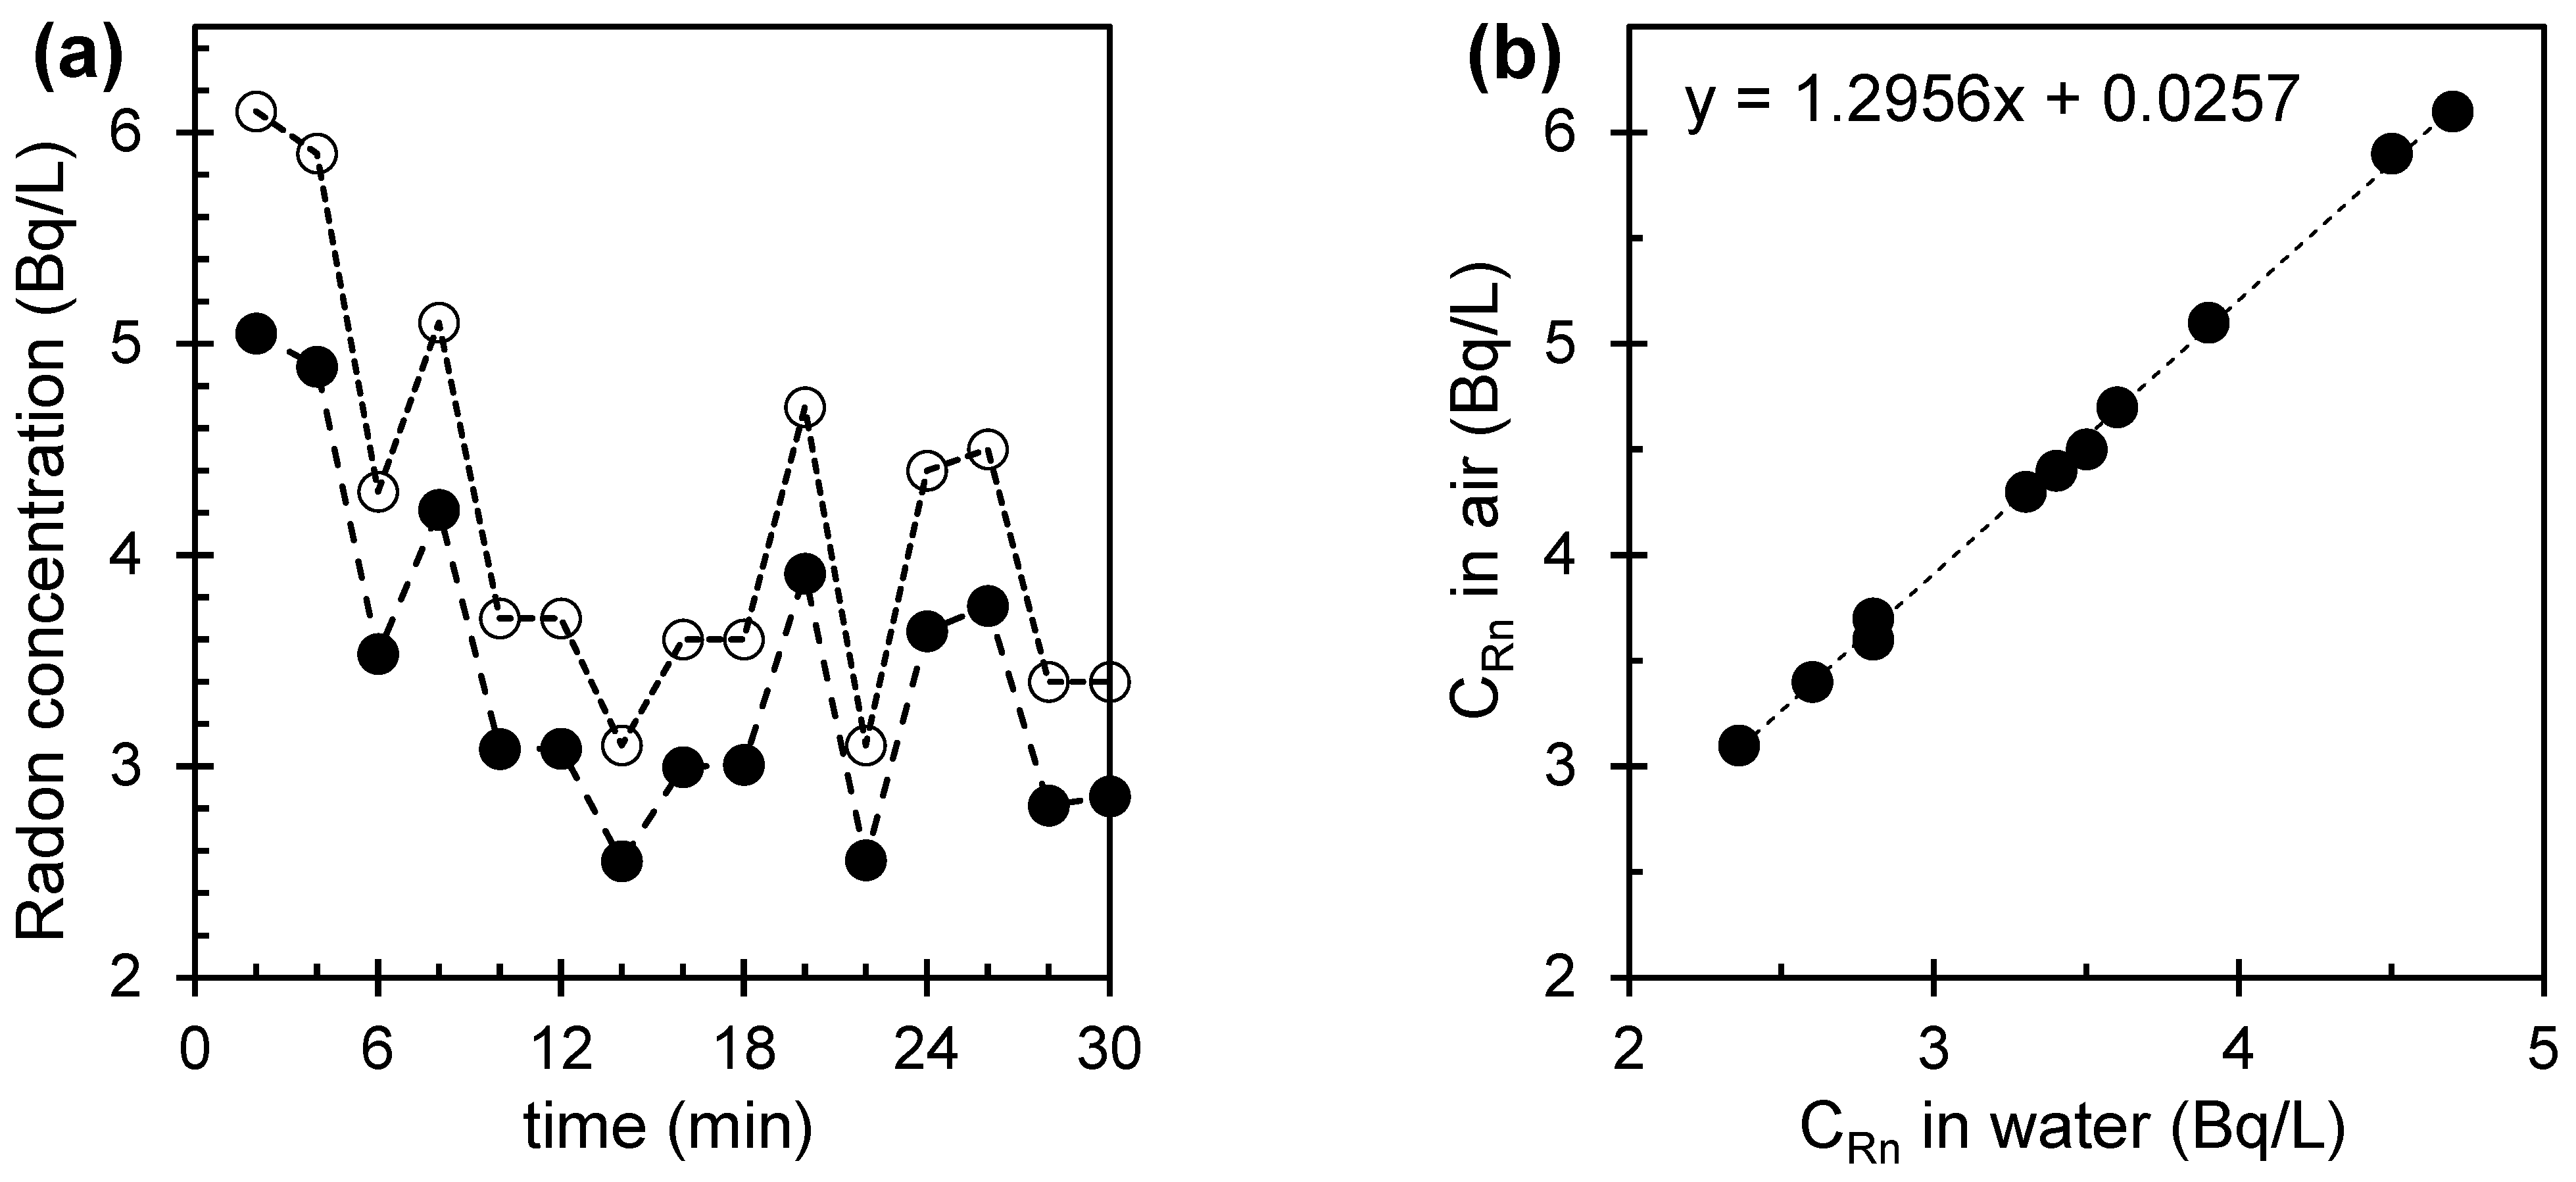
During the continuous measurement process, the activity concentration might influence the number of cycles due to aeration. Since the measurement takes at least half an hour, the concentration was tested due to the continuous aeration of water in the big bottle system. The more prolonged aeration effect, typically measured data of concentration with time, is shown in Figure 5 for sample 10d04. The concentration fluctuated slightly with time due to the aeration effect for prolonged measurement. Due to aeration, more radon gas might separate from the water; hence, the concentration varies with time. However, to minimize the deviation, the measurement was taken for two minutes for fifteen cycles, and an average was made. After measuring the radon concentration in air (solid circle in Figure 5a), CAPTURE software was used to generate data files for the big bottle system. There is an option for converting the radon concentration in air to water using user-specified parameters, such as the measurement method, air and water volume, water salinity, humidity, temperature, etc. Every sample was corrected accordingly (open circle in Figure 5a). It was found that the radon concentration in air is consistently overestimated (~1.3 times) compared to the estimated results in water (Figure 5b).
The standard deviation (σ) was calculated mathematically for each groundwater sample. Statistically, the standard deviation of a series of samples indicates the deviation from the mean value and is a measure of the precision of the measurements. Radioactive decay follows the Poisson distribution law, from which it is possible to calculate the standard deviation as the square root of recorded counts by the RAD7 detector. When no decay is recorded, instead of reporting zero uncertainty, RAD7 reports an uncertainty value based on 2σ. In this study, the cycle time was increased to thirty minutes for maximum certainty, and the measurement uncertainty are tabulated with the radon concentration in Table 1. The radon concentration in the water sample obtained in Bq/m3 was converted to Bq/L.
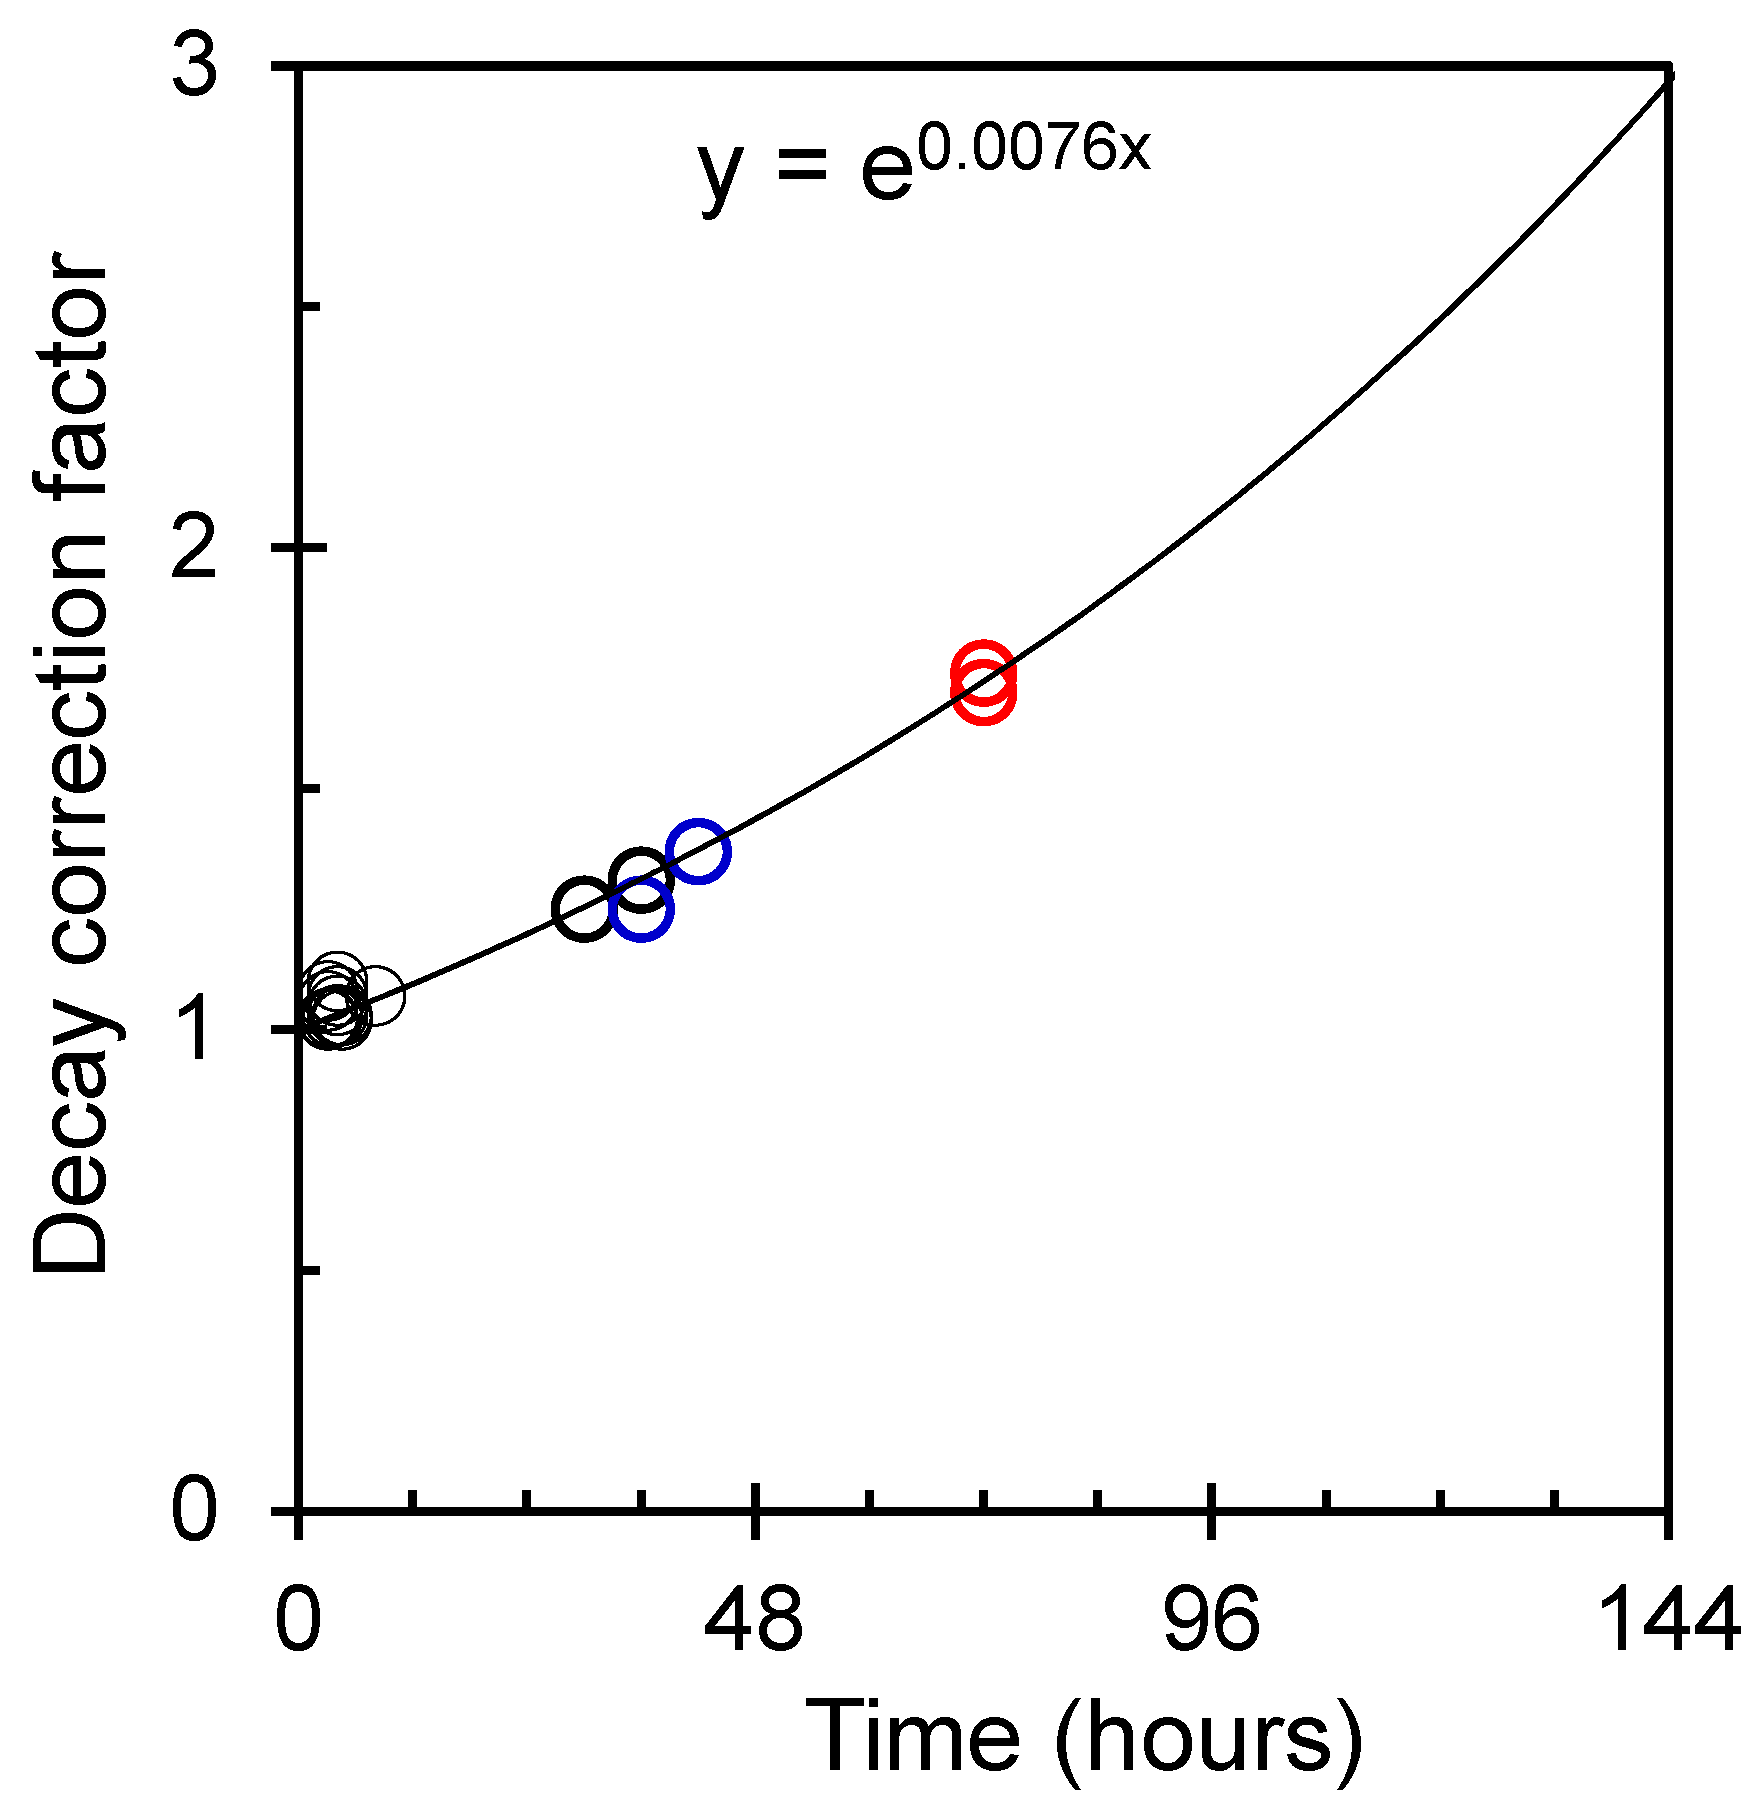
If the sample was collected earlier but analyzed later, there must be a decay due to the delay in measuring radon concentration. Therefore, a correction should be made for the sample decay depending on the sampling time. The decay correction factor is simply an exponential function with a time constant of 132.4 h and is calculated based on the following formula:
D C F = e ( T / 132.4 )
where T is the duration (in hours) between the sampling and counting by the LSC instrument, and 132.4 h is the mean lifetime of the 222Rn atom (radon has a half-life of 3.825 days, multiplied by 24 h per day and divided by the natural logarithm of 2) [25]. Such a decay correction factor with time is plotted in Figure 6 (solid line). From the decay correction plot, it can be seen that samples with appropriate sealed, stored and counted within twenty-four hours; no significant correction is needed. However, a modification is required if the sample is not measured immediately, and the DCF increases exponentially with time. In this study, in most cases, the sample was counted immediately within four hours of sample collection (black circles) except for six (blue and red open circle in Figure 6) collected from other Thybiyah and Qaisumah cities (those cities are far from the measurement laboratory). A proper correction using the DCF equation is tabulated in Table 1.
The measured concentrations of radon for 18 groundwater samples collected from the Hafr Al Batin, Thybiyah, and Qaisumah areas, Saudi Arabia, are tabulated in Table 1. It was found that the concentration varies in the range of 0.1 to 3.20 Bq/L with an average of 0.96 Bq/L, with a standard deviation of 0.82 Bq/L. Many national and international organizations have established their radon levels worldwide. For instance, the United States Environmental Protection Agency (USEPA) set a value of 11.1 Bq/L for the radon concentration in groundwater [26]. The UNSCEAR set 40 Bq/L as a safe limit in their published report, [27] while the European Commission (EC) and World Health Organization (WHO) have described a value of 100 Bq/L as an action limit [28,29,30]. As observed, all samples measured radon levels below those limits. Approximately 90% of the samples were far less than the radon levels reported earlier [24,31]. Furthermore, the estimated radon concentrations in the present study are comparable to those found in the rest of Saudi Arabia [2,13,14]. For example, a range of 1.45–9.15 Bq/L was found in the Al-Jawa area as reported by Althoyaib et al. [32]; 0.76–4.69 Bq/L was found for groundwater from the Al-Qassim area reported by El-Taher et al. [33]; 0.92–2.12 Bq/L was found in the Jeddah area reported by Tayyeb et al. [34]; 0.11–9.20 Bq/L was found in the Dammam area reported by Abuelhia [13]; and 1.74–4.32 Bq/L was found in the Jazan area as reported by El-Araby et al. [35].
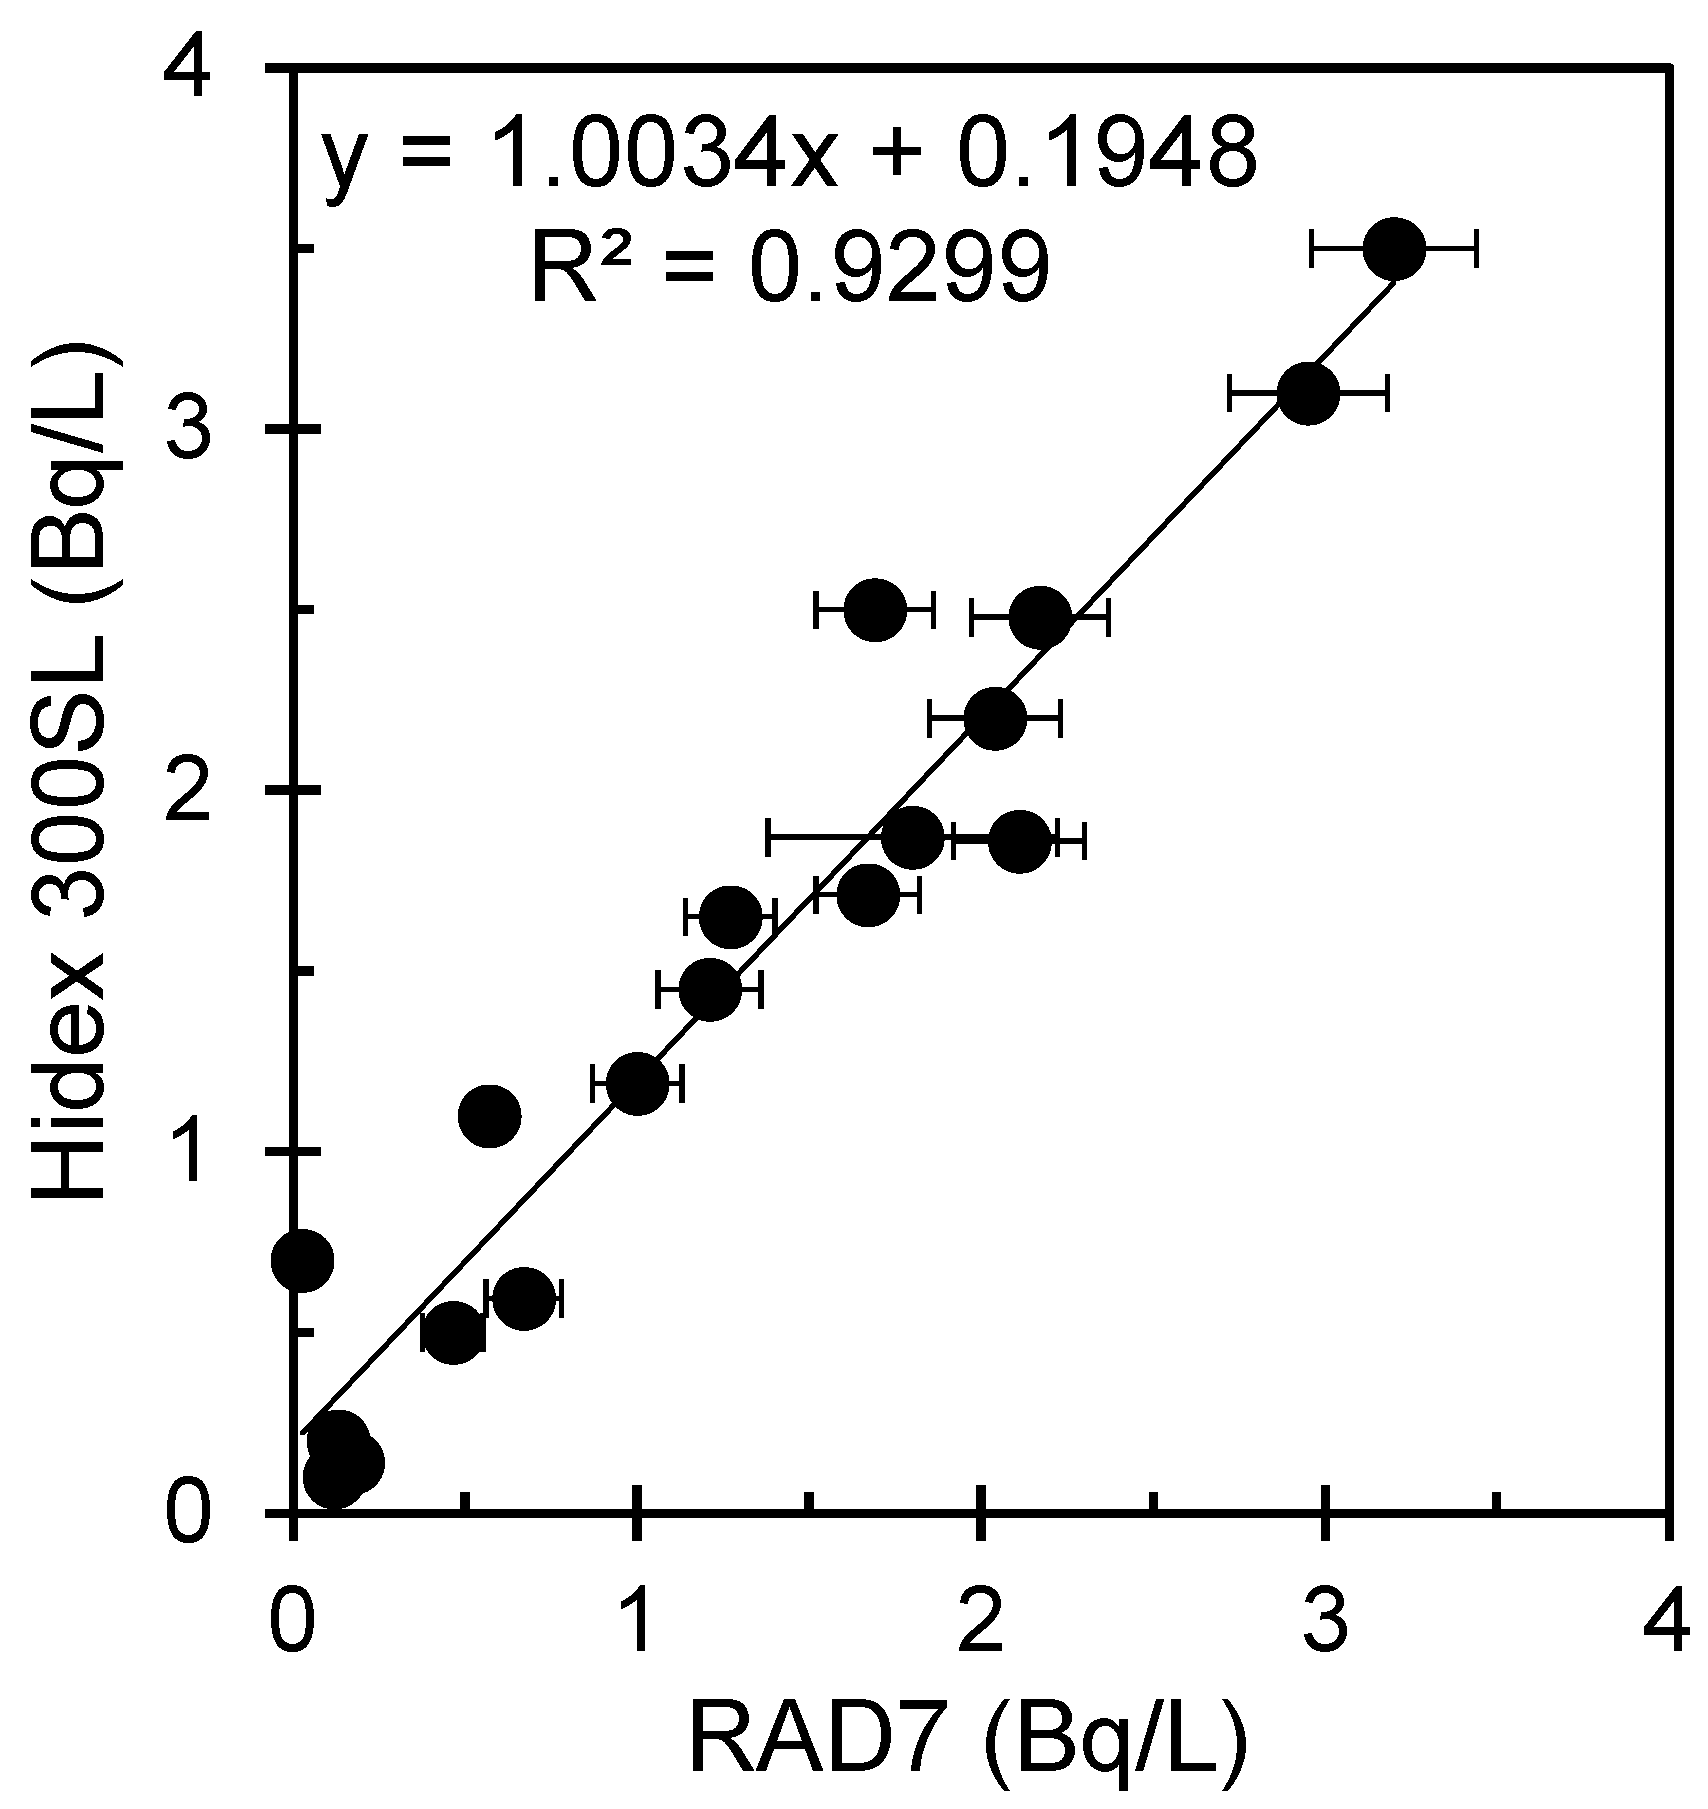
For a comparison between the estimated radon concentration found using the Hidex 300SL and RAD7 detector meters, the values are plotted in Figure 7. The variation shows a nearly unique inferred result. Comparing the estimated radon concentration using the two methods shows that although the two devices have many advantages and disadvantages based on the two different techniques, the experimental results are almost the same with the measurement of experimental uncertainty.

4. Conclusions

Two advanced methods of the use of a scintillation counter and semiconductor alpha spectroscopy were used to estimate the radon concentrations of groundwater samples from three cities in the Eastern Province of Saudi Arabia. Both methods estimate the radon concentration to be between 0.1 and 3.20 Bq/L with an average of 0.96 Bq/L, with a standard deviation of 0.82 Bq/L. The values are within the safe limit recommended by the USEPA and EAEC and are far below the safe level recommended by UNSCEAR and the WHO. Therefore, the radon level in groundwater in the mentioned area is significantly lower than the permissible international standard limit of 100 Bq/L, ensuring that there is no risk of radon exposure in groundwater samples of the tested area of the Eastern Province of Saudi Arabia. Both the liquid scintillation counter and semiconductor alpha spectroscopy detector have several advantages for measuring radon concentrations. RAD7 does not require any treatment using chemicals or cocktails for sample preparation. It can measure radon concentrations in air, water, and soil. Furthermore, it is very convenient for movement due to its low weight, it is battery operated, and it has an ultralow level detection limit. On the other hand, the Hidex 300SL has facilities to measure hundreds of samples simultaneously with an autosampler, can count alpha and beta isotopes simultaneously for a given sample, and has a low level of detection limit. Furthermore, by comparing the two methods, it was found that although they are based on two different principles, the experimental data are almost the same with a significant measurement uncertainty.

Supplementary Materials

The following supporting information can be downloaded at https://www.mdpi.com/article/10.3390/w14233849/s1. Figure S1. Photograph of the measuring devices of the RAD7 digital radon detection meter for radon concentration. Figure S2. Map of the cities in the study area (Eastern Province, Saudi Arabia from google map).

Author Contributions

Conceptualization, A.M.; methodology, A.M.; formal analysis, A.M.; investigation, A.M.; resources, A.S.A.; data curation, A.M.; writing—original draft preparation, A.M.; writing—review and editing, A.M.; visualization, A.M.; supervision, A.S.A.; project administration, A.S.A.; funding acquisition, A.M. All authors have read and agreed to the published version of the manuscript.

Funding

This work is financially supported by the Institutional Funding Project (No: IFP-A-202-1-3) from the Ministry of Education, Saudi Arabia.

Data Availability Statement

The dataset used in this study are available from the corresponding author on reasonable request except for data that is subject to third party restrictions.

Acknowledgments

The authors thank the Deanship of Scientific Research, University of Hafr Al Batin, for the experimental facilities. Furthermore, the authors are thankful to Department of Nondestructive Evaluation Technology (NDET), Hafr Al Batin Community College, for the experimental facilities.

Conflicts of Interest

The authors declare no conflict of interest.

References

  1. UNSCEAR Sources. Effects and Risks of Ionizing Radiation; United Nations: New York, NY, USA, 1988; p. 199. [Google Scholar]
  2. Aleissa, K.A.; Alghamdi, A.S.; Almasoud, F.I.; Islam, M.S. Measurement of radon levels in groundwater supplies of Riyadh with liquid scintillation counter and the associated radiation dose. Radiat. Prot. Dosim. 2012, 154, 95–103. [Google Scholar] [CrossRef] [PubMed]
  3. Przylibski, T.A.; Domin, E.; Gorecka, J.; Kowalska, A. 222Rn Concentration in Groundwaters Circulating in Granitoid Massifs of Poland. Water 2020, 12, 748. [Google Scholar] [CrossRef] [Green Version]
  4. Harrison, J.D. Lung cancer risk and effective dose coefficients for radon: UNSCEAR review and ICRP conclusions. J. Radiol. Prot. 2021, 41, 433–441. [Google Scholar] [CrossRef] [PubMed]
  5. Petoussi-Henss, N.; Satoh, D.; Endo, A.; Eckerman, K.; Bolch, W.; Hunt, J.; Jansen, J.T.M.; Kim, C.H.; Lee, C.; Saito, K.; et al. ICRP Publication 144: Dose Coefficients for External Exposures to Environmental Sources. Ann. ICRP 2020, 49, 11–145. [Google Scholar] [CrossRef] [PubMed]
  6. Malik, M.F.I.; Rabaiee, N.A.; Jaafar, M.S. Determination of radon concentration in water using RAD7 with RAD H2accessories. In Proceedings of the National Physics Conference 2014 (PERFIK 2014), Kuala Lumpur, Malaysia, 18–19 November 2014; p. 120005. [Google Scholar]
  7. Hopke, P.K.; Borak, T.B.; Doull, J.; Cleaver, J.E.; Eckerman, K.F.; Gundersen, L.C.S.; Harley, N.H.; Hess, C.T.; Kinner, N.E.; Kopecky, K.J.; et al. Health Risks Due to Radon in Drinking Water. Environ. Sci. Technol. 2000, 34, 921–926. [Google Scholar] [CrossRef] [Green Version]
  8. Calin, M.R.; Ion, A.C.; Radulescu, I.; Simion, C.A.; Mincu, M.M.; Ion, I. Analysis of the radon concentrations in natural mineral and tap water using Lucas cells technique. J. Environ. Eng. Landsc. Manag. 2022, 30, 370–379. [Google Scholar] [CrossRef]
  9. De Simone, G.; Galli, G.; Lucchetti, C.; Tuccimei, P. Calibration of Big Bottle RAD H2O set-up for radon in water using HDPE bottles. Radiat. Meas. 2015, 76, 1–7. [Google Scholar] [CrossRef]
  10. Alonso, H.; Cruz-Fuentes, T.; Rubiano, J.G.; González-Guerra, J.; Cabrera, M.D.C.; Arnedo, M.A.; Tejera, A.; Rodríguez-Gonzalez, A.; Pérez-Torrado, F.J.; Martel, P. Radon in Groundwater of the Northeastern Gran Canaria Aquifer. Water 2015, 7, 2575–2590. [Google Scholar] [CrossRef] [Green Version]
  11. Durridge. RAD7 Manual. Durridge Company Inc., USA. Available online: https://durridge.com/documentation/RAD7%20Manual.pdf (accessed on 15 September 2022).
  12. Cho, B.; Hwang, J.; Lee, B.; Oh, Y.; Choo, C. Radon Concentrations in Raw Water and Treated Water Used for Bottled Water in South Korea. Sustainability 2020, 12, 5313. [Google Scholar] [CrossRef]
  13. Abuelhia, E. Evaluation of annual effective dose from indoor radon concentration in Eastern Province, Dammam, Saudi Arabia. Radiat. Phys. Chem. 2017, 140, 137–140. [Google Scholar] [CrossRef]
  14. Abuelhia, E. Assessment of radiation dose from radon ingestion and inhalation in commercially bottled drinking water and its annual effective dose in Eastern Province, Saudi Arabia. Int. J. Environ. Health Res. 2019, 29, 164–172. [Google Scholar] [CrossRef]
  15. Salih, N.F. Determine the Contaminations of Radon in the Drinking Water Using NTDs (CR-39) and RAD7 Detectors. Arab. J. Sci. Eng. 2021, 46, 6061–6074. [Google Scholar] [CrossRef]
  16. Vincent, P. Saudi Arabia: An Environmental Overview; CRC Press: Boca Raton, FL, USA, 2008. [Google Scholar]
  17. Alsharhan, A.S.; Rizk, Z.A.; Nairn, A.E.M.; Bakhit, D.W.; Alhajari, S.A. Preface. In Hydrogeology of an Arid Region: The Arabian Gulf and Adjoining Areas; Alsharhan, A.S., Rizk, Z.A., Nairn, A.E.M., Bakhit, D.W., Alhajari, S.A., Eds.; Elsevier Science B.V.: Amsterdam, The Netherlands, 2001. [Google Scholar]
  18. Durrani, S.A. Radon concentration values in the field: Correlation with underlying geology. Radiat. Meas. 1999, 31, 271–276. [Google Scholar] [CrossRef]
  19. Arun, B.; Viswanathan, S.; Venkatesan, S.; Jose, M.T.; Balasubramaniam, V. Study of Triple to Double Coincidence Method for Tritium Measurements. Radiochemistry 2021, 63, 221–226. [Google Scholar] [CrossRef]
  20. Broda, R.; Maletka, K. The TDCR Method as an Important Tool in Radionuclide Metrology; International Atomic Energy Agency: Vienna, Austria, 2003. [Google Scholar]
  21. Alzurfi, S.; Abojassim, A.; Mraity, H. Monthly Monitoring of Physicochemical and Radiation Properties of Kufa River, Iraq. Pak. J. Sci. Ind. Res. Ser. A Phys. Sci. 2018, 61, 43–50. [Google Scholar] [CrossRef]
  22. Choppin, G.R.; Liljenzin, J.-O.; Rydberg, J.A.N. (Eds.) CHAPTER 5—Radionuclides in Nature. In Radiochemistry and Nuclear Chemistry, 3rd ed.; Butterworth-Heinemann: Woburn, UK, 2002; pp. 94–122. [Google Scholar] [CrossRef]
  23. Lucas, L.L.; Unterweger, M.P. Comprehensive Review and Critical Evaluation of the Half-Life of Tritium. J. Res. Natl. Inst. Stand. Technol. 2000, 105, 541–549. [Google Scholar] [CrossRef]
  24. Aljaloud, K.B.; ElBatouti, M. Statistical analysis of 222Rn concentration in Zamzam and other water sources in the Kingdom of Saudi Arabia. Heliyon 2021, 7, e06057. [Google Scholar] [CrossRef]
  25. Salvato, C. The role of micro-strategies in the engineering of firm evolution. J. Manag. Stud. 2003, 40, 83–108. [Google Scholar] [CrossRef]
  26. USEPA. National Primary Drinking Water Regulations; Radionuclides; Final Rule. Fed. Reg. 2000, 65, 76708. [Google Scholar]
  27. UNSCEAR. The General Assembly with Scientific Annex; United Nations: New York, NY, USA, 2000. [Google Scholar]
  28. EC. Radon in Workplaces: Implementing the Requirements in Council Directive; Publications Office: Luxembourg, 2019. [Google Scholar] [CrossRef]
  29. WHO. Guidelines for Drinking-Water Quality; World Health Organization: Geneva, Switzerland, 2011; Volume 216, pp. 303–304. [Google Scholar]
  30. WHO. Management of Radioactivity in Drinking-Water; World Health Organization: Geneva, Switzerland, 2018. [Google Scholar]
  31. Al-Jaseem, Q.K.; Almasoud, F.I.; Ababneh, A.M.; Al-Hobaib, A.S. Radiological assessment of water treatment processes in a water treatment plant in Saudi Arabia: Water and sludge radium content, radon air concentrations and dose rates. Sci. Total Environ. 2016, 563–564, 1030–1036. [Google Scholar] [CrossRef]
  32. Althoyaib, S.; El-Taher, A. Natural radioactivity measurements in groundwater from Al-Jawa, Saudi Arabia. J. Radioanal. Nucl. Chem. 2015, 304, 547–552. [Google Scholar] [CrossRef]
  33. El-Taher, A.; Al-Turki, A. Radon activity measurements in irrigation water from Qassim Province by RAD7. J. Environ. Biol. 2016, 37, 1299–1302. [Google Scholar] [PubMed]
  34. Tayyeb, Z.; Kinsara, A.; Farid, S. A study on the radon concentrations in water in Jeddah (Saudi Arabia) and the associated health effects. J. Environ. Radioact. 1998, 38, 97–104. [Google Scholar] [CrossRef]
  35. El-Araby, E.H.; Soliman, H.A.; Abo-Elmagd, M. Measurement of radon levels in water and the associated health hazards in Jazan, Saudi Arabia. J. Radiat. Res. Appl. Sci. 2019, 12, 31–36. [Google Scholar] [CrossRef]
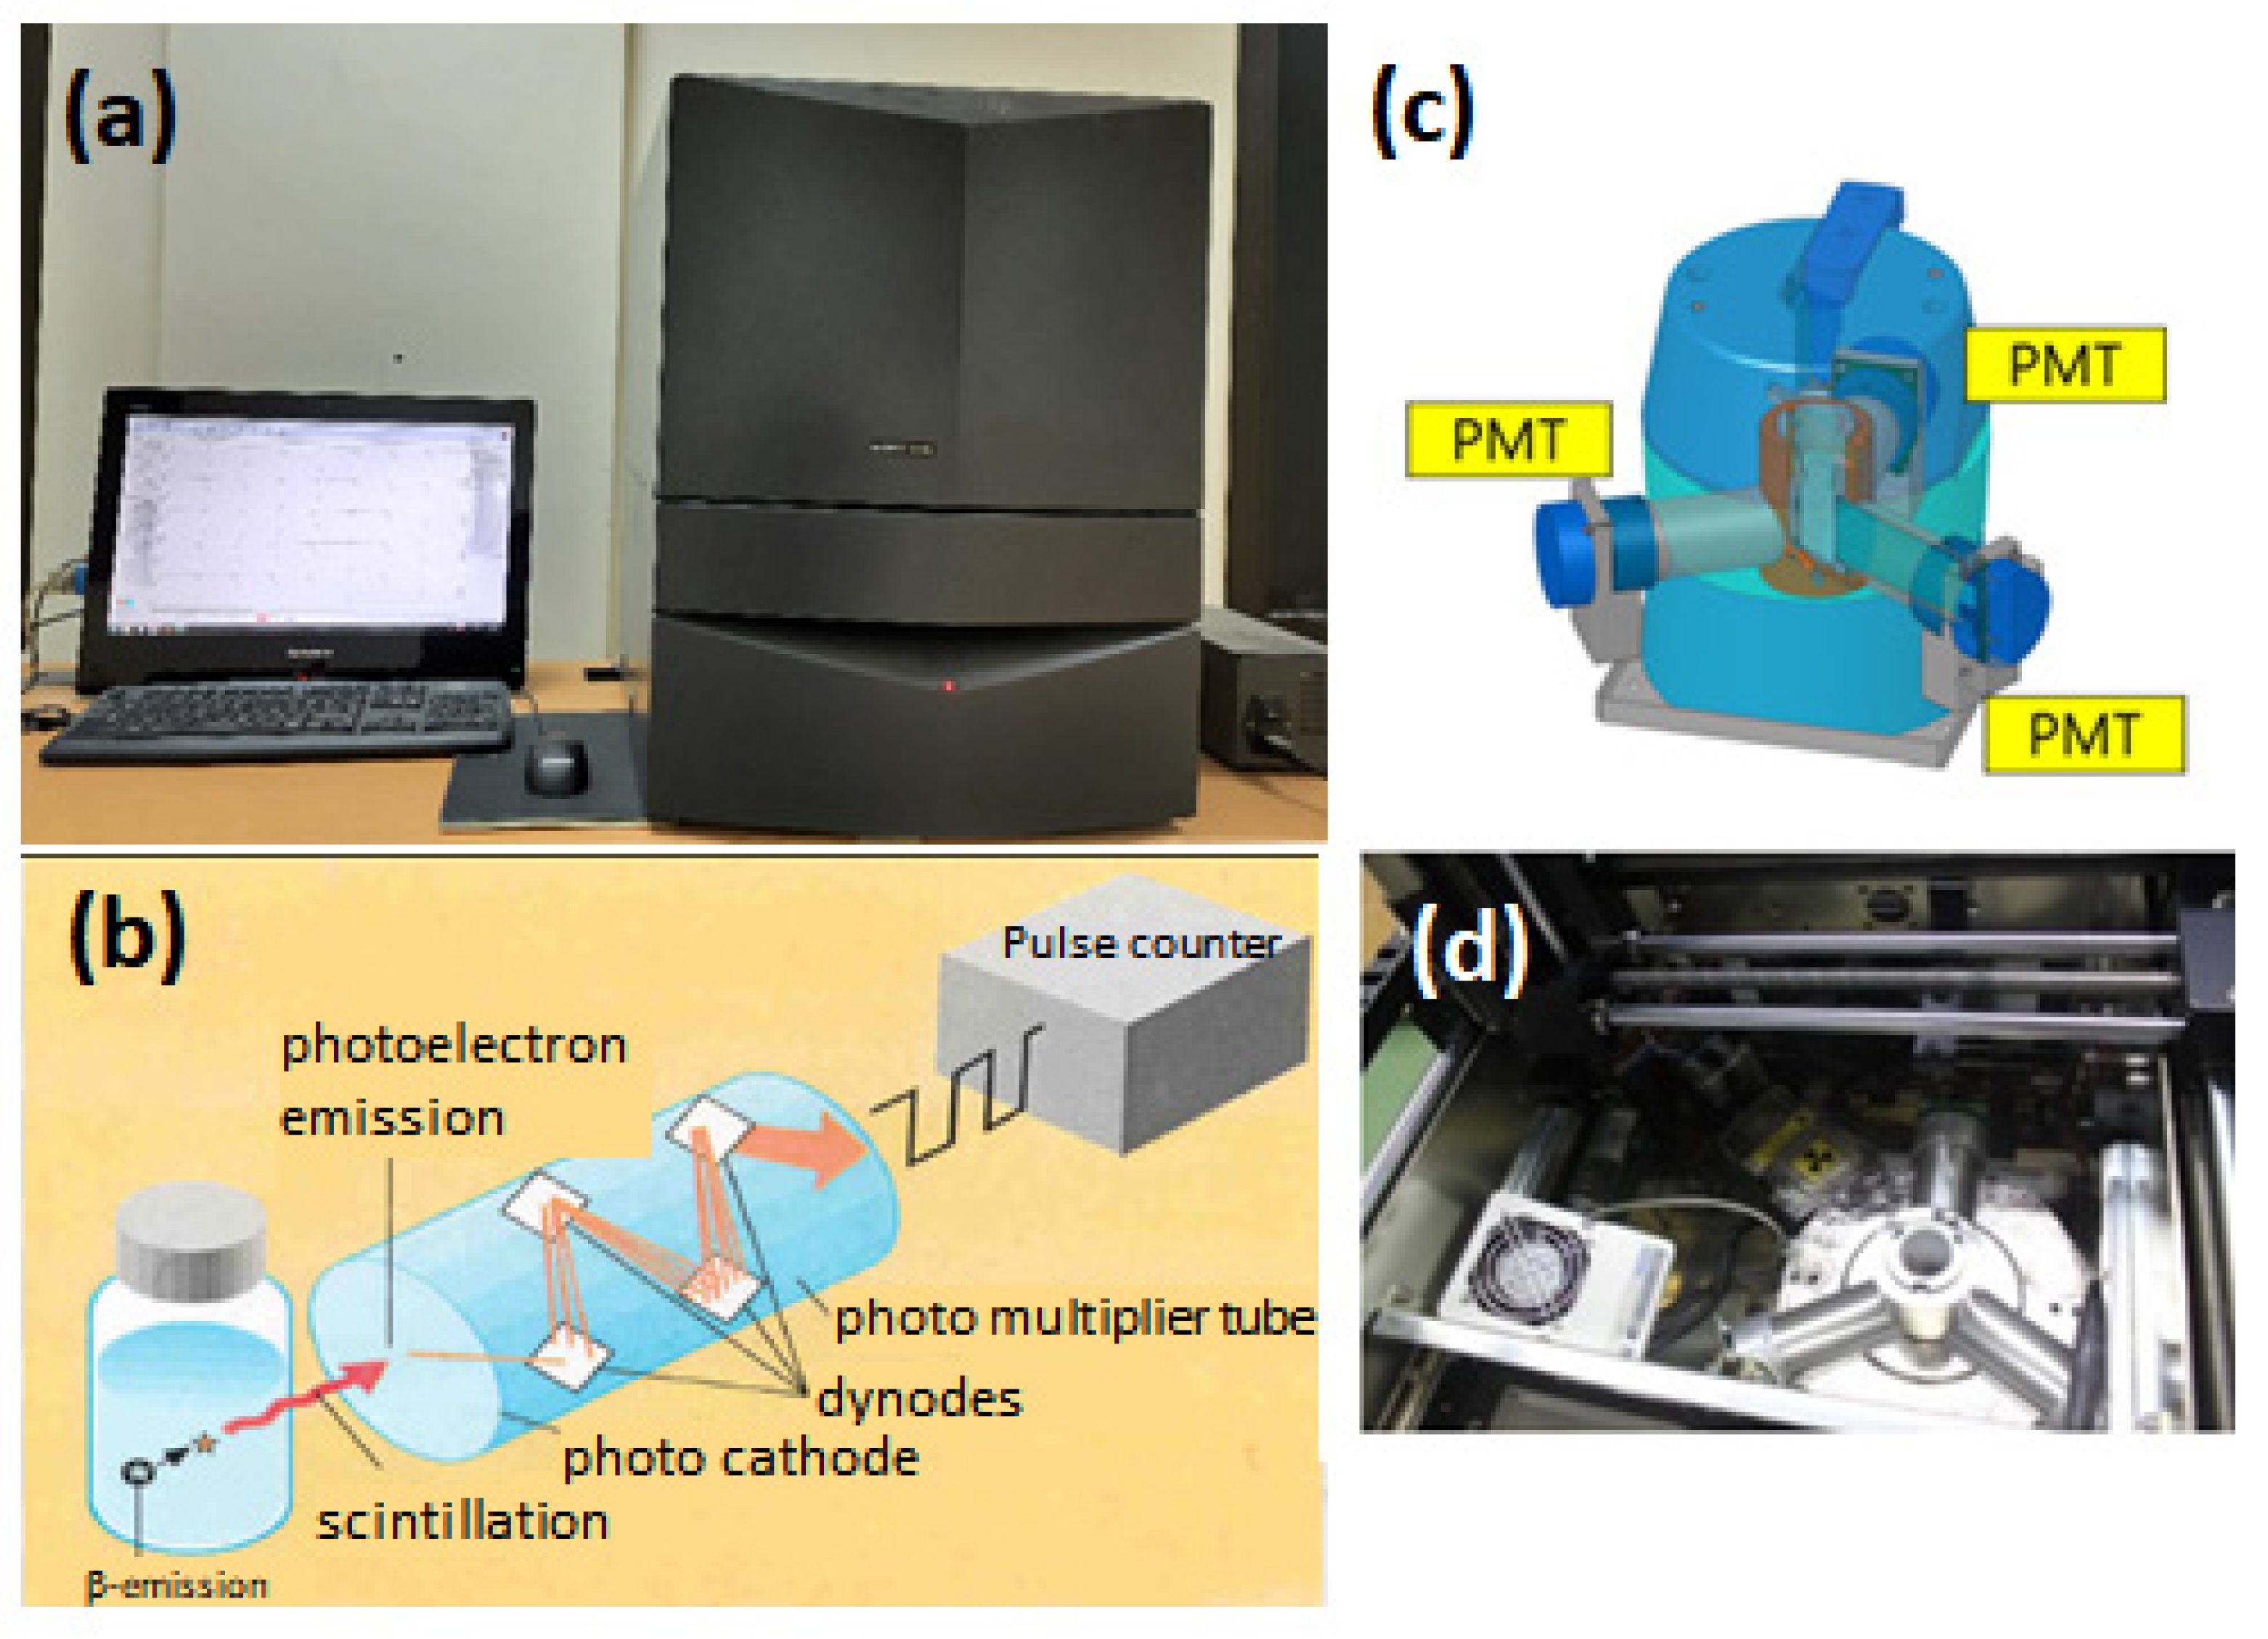
Figure 1. (a) Front view of the measuring device of Hidex 300SL. (b) Schematic working diagram of scintillation counter. (c) Diagram of photomultiplier tube. (d) Photograph of the photomultiplier.
Water 14 03849 g001
Figure 2. Schematic diagram of the RAD7 detector meter with big bottle system (modified from Durridge Company Inc., USA manual at www.durridge.com, 15 September 2022).
Water 14 03849 g002
Figure 3. Control chart for the calibration source for the certified solution of (a) activity-free water for the background, (b) certified source of 14C (open circle), and certified source of 3H (solid circle), where the counts are in a natural logarithmic scale.
Water 14 03849 g003
Figure 4. Cumulative spectrum for the selected channel for a typical measurement for sample 10d04 with the different window of alpha energy spectrum recorded by RAD7 detector.
Water 14 03849 g004
Figure 5. (a) Radon concentration with number cycles converted to measurement time for sample 10d04; radon in the air (open circle) and radon in water for big bottle system (solid circle) calculated using CAPTURE software; and (b) ratio between estimated radon concentration in air and water.
Water 14 03849 g005
Figure 6. The sampling time-dependent decay correction factor (DCF) is shown as a solid line, and a few samples corrected with DCF (blue and red circles) collected from the Thybiyah and Qaisumah areas are far from our laboratory.
Water 14 03849 g006
Figure 7. Radon concentration using Hidex 300SL (Bq/L) and RAD7 (Bq/L). The error bar represents the measurement uncertainty (Bq/L) using RAD7.
Water 14 03849 g007
Table 1. Radon activity concentration.
Serial
No
Sample
ID
AreaDepth
of Wells
Purpose of UseLocationHidex 300SL
(Bq/L)
RAD7
(Bq/L)
Measurement
Uncertainty for RAD7 (Bq/L)
102d01HafrShallowdomestic use only28.291586, 45.9483910.700.030.02
203DSt01HafrDeepDrinking water treatment plant28.463895, 45.9837651.862.110.19
305DSt03HafrDeepDrinking water treatment plant28.406443, 45.9295051.191.000.13
407DSt05HafrDeepDrinking water treatment plant28.400995, 45.9972800.600.670.11
509d03HafrShallowdomestic and irrigation28.322659, 45.9007951.651.270.13
610d04HafrShallowdomestic use only28.248143, 45.9306333.503.200.24
711St06HafrDeepDrinking water treatment plant28.389733, 46.0016131.711.670.15
812St07HafrDeepDrinking water treatment plant28.362908, 45.9908940.140.170.05
915d07HafrShallowdomestic use only28.424565, 46.0372090.500.460.09
1019St08HafrDeepDrinking water treatment plant28.391609, 45.9855093.102.950.23
1120d11HafrShallowdomestic use only28.372591, 45.9980951.871.800.42
1224d15ThybiyahShallowdomestic use only28.064204, 45.7435462.501.690.17
1325d16ThybiyahShallowdomestic use only28.122389, 45.6714392.482.170.20
1428St11ThybiyahDeepDrinking water treatment plant28.115714, 45.6627152.202.040.19
1532St12ThybiyahDeepDrinking water treatment plant28.109055, 45.6634821.451.210.15
1638d24HafrShallowdomestic use only28.350853, 45.9863741.100.570.04
1740d26QaisumahShallowdomestic use only28.294281, 46.0959290.200.130.05
1844d30QaisumahShallowdomestic use only28.300982, 46.1388080.100.120.04
Publisher’s Note: MDPI stays neutral with regard to jurisdictional claims in published maps and institutional affiliations.