Article

The Rain-Induced Urban Waterlogging Risk and Its Evaluation: A Case Study in the Central City of Shanghai

1
Shanghai Central Meteorological Observatory, Shanghai 200030, China
2
Center of Data Assimilation for Research and Application, Nanjing University of Information Science and Technology, Nanjing 210044, China
3
Wuxi New District Development Group Co., Ltd., Wuxi 214028, China
*
Authors to whom correspondence should be addressed.
Water 2022, 14(22), 3780; https://doi.org/10.3390/w14223780
Submission received: 30 October 2022 / Revised: 11 November 2022 / Accepted: 14 November 2022 / Published: 21 November 2022
(This article belongs to the Special Issue Effects of Vegetation on Rainfall)

Abstract

:
Waterlogging induced by rain in urban areas has a potential risk impact on property and safety. This paper focuses on the impact of rain on waterlogging and evaluates the waterlogging risk in the central city of Shanghai. A simplified waterlogging depth model is developed in different areas with different drainage capacity and rainfall in consumption of simplifying the effect of complex terrain characteristics and hydrological situation. Based on urban waterlogging depth and its classification collection, a Rain-induced Urban Waterlogging Risk Model (RUWRM) is further established to evaluate waterlogging risk in the central city. The results show that waterlogging depth is closely linked with rainfall and drainage, with a linear relationship between them. More rainfall leads to higher waterlogging risk, especially in the central city with imperfect drainage facilities. Rain-induced urban waterlogging risk model can rapidly gives the waterlogging rank caused by rainfall with a clear classification collection. The results of waterlogging risk prediction indicate that it is confident to get the urban waterlogging risk rank well and truly in advance with more accurate rainfall prediction. This general study is a contribution that allows the public, policy makers and relevant departments of urban operation to assess the appropriate management to reduce traffic intensity and personal safety or strategy to lead to less waterlogging risk.

1. Introduction

With the extreme weather and rapid urbanization during the recent years, cities in China were suffered by urban waterlogging because of short-time heavy rain [1,2,3,4]. In urban areas all over the world, waterlogging is one of the most serious natural disasters, which usually causes traffic break, building damage and even life death, resulting in loss of property and safety [5,6]. Waterlogging has become an important and complex issue in the sustainable development process of global cities, which has attracted great attention from scientists, sociologists and even government officials around the world [7,8]. Many studies explore the causes of urban waterlogging from the perspective of attribution analysis and through the statistics of waterlogging events. The analysis shows that urban waterlogging is caused by many factors [9,10]. Urban waterlogging is closely related to rainfall. Urban climate and environmental changes lead to changes in water cycle, and the artificial emission of particulate matter, air pollution and urban heat island effect cause the change of urban microclimate, thus the precipitation mode changes [11,12]. Some studies conclude that heavy rain will become more often and more serious due to global warming and rapid urbanization procedure in the future [13], thus urban waterlogging will be more serious [14,15]. From the meteorological point of view, it is generally believed that short-term heavy precipitation is more likely to lead to urban waterlogging. Due to its short duration and high intensity, the urban drainage system exceeds the design standard and causes water accumulation. The urban surface and river network conditions, as well as hydrological process are of great importance whether the city will cause waterlogging or not [16,17,18,19]. The rainwater is not easy to permeate through the hard ground, resulting in reduced natural rainwater storage capacity. Poor river network, construction waste or household garbage blocking pipelines, deficiencies or breakdown of drainage facilities will also lead to waterlogging [20,21]. Many studies start from waterlogging models through hydrodynamic numerical simulation or statistical methods for better simulation of ground water variation [22,23,24,25], so as to predict the occurrence and degree of waterlogging and provide favorable tools for risk management. Accordingly, the occurrence of urban waterlogging will bring a series of social and economic impacts [26,27,28], usually causing road and street block flooding, traffic interruption, housing property damage and other effects, so the study of waterlogging risk is of importance. Urban rainstorm waterlogging risk assessment can be conducted using remote sensing or GIS technology [29,30], combining with land use, topographty and so on.
It is necessary to constitute an organic urban waterlogging model system with high accuracy of precipitation simulation, fine and accurate urban surface and river network information, optimized hydrodynamic model system, as well as artificial drainage facilities and management. However, these methods need to take complex terrain characteristics and hydrological situation into consideration. However, most of the existing research will require lots of relevant data which could not be acquired easily [31], thus it is difficult to carry out studies on waterlogging risk in an area where the terrain characteristic and hydrological interaction are not obvious. But the potential impact of rain on waterlogging is very crucial. It is necessary to find out how rain impacts on waterlogging and optimize the schemes of infiltration, storage and drainage against waterlogging [32]. So, the urban waterlogging risk model and its evaluation are needed.
Different from the existing studies, this study aims to establish a simple and practicable waterlogging risk assessment method mainly focusing on rainfall conditions and drainage capacity, and to simplify the cumbersome data processing as much as possible. Taking the central city of Shanghai as a case study, the present research attempts to discover the impact of rain on waterlogging and evaluate the waterlogging risk since the urban waterlogging problems often trouble the people’s daily life in Shanghai. Also, a waterlogging depth model is developed in different areas with different drainage capacity and rainfall in the central city. Then, based on urban waterlogging depth and its classification collection, a simplified Rain-induced Urban Waterlogging Risk Model (RUWRM) is built. This will give great contribution that allows municipal administration who highly concerns about disaster reduction, taking action to assess the appropriateness of local traffic and drainage management strategies.

2. Materials and Methods

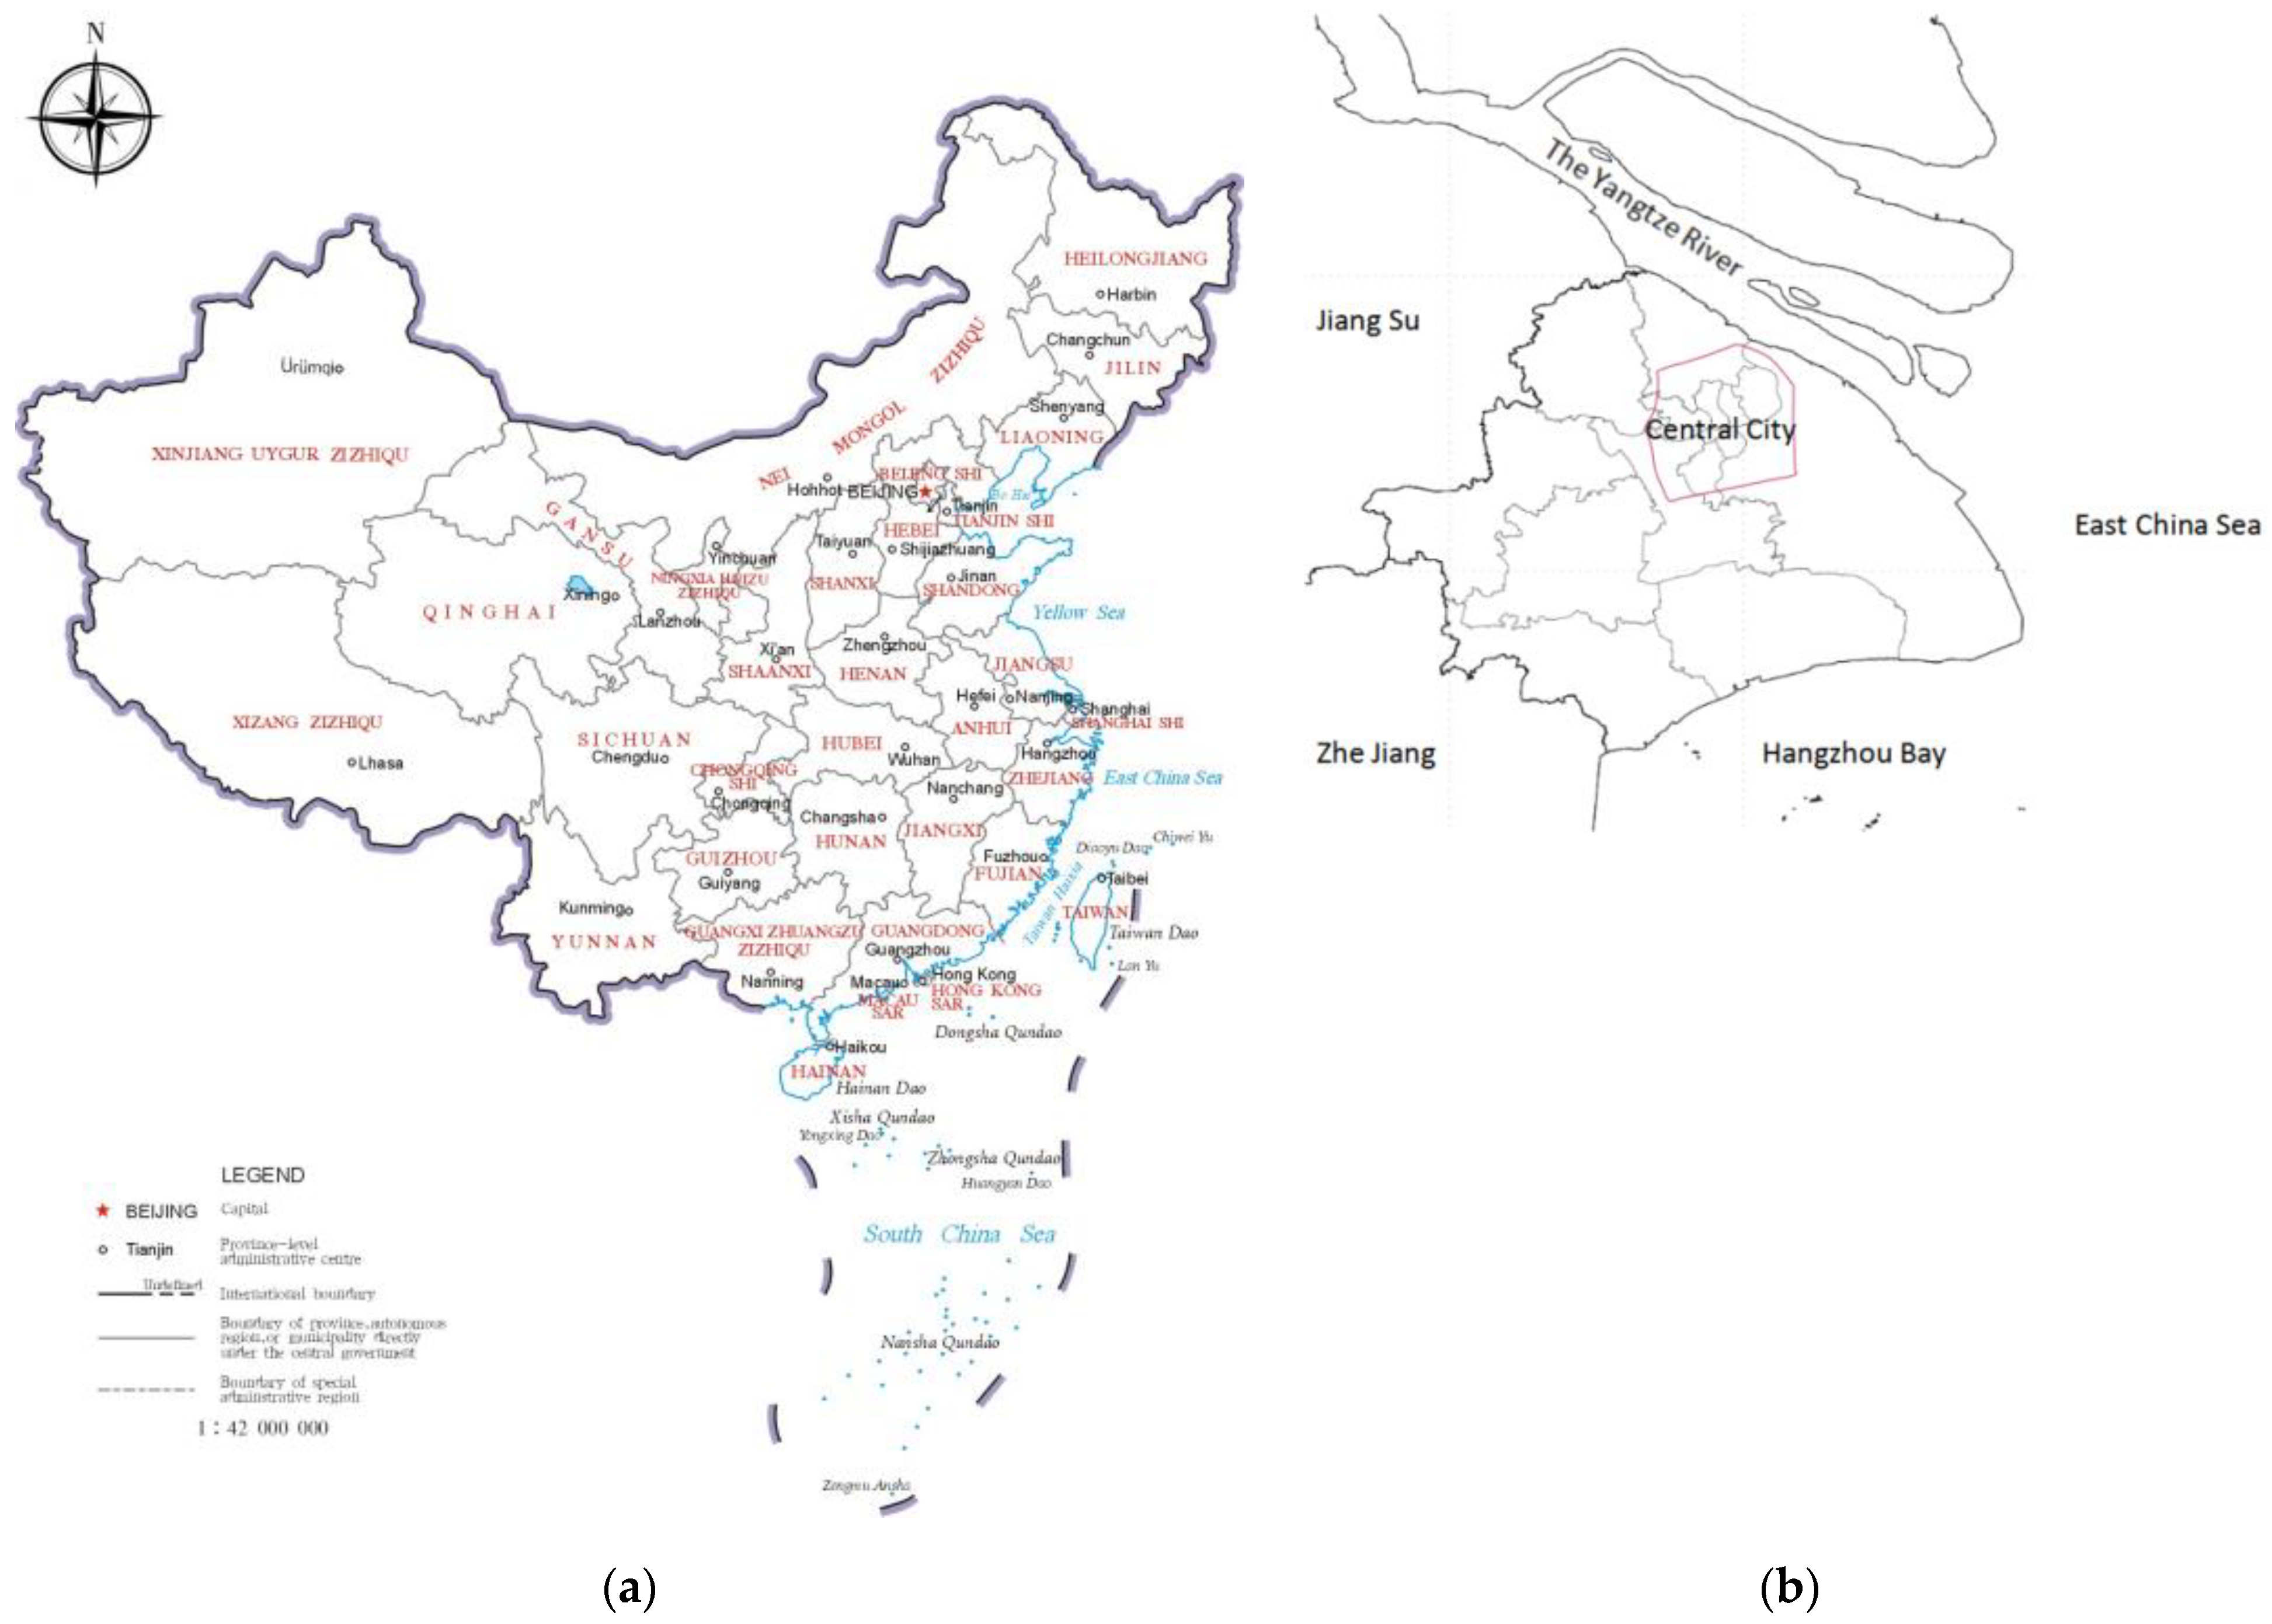
2.1. The Case-Study City and Concerns

Shanghai, located on the east of China with a territory of 6340 km2 and 24.9 million population, is China’s international economy, finance, trade, shipping and science and technology innovation centre. As shown in Figure 1, Shanghai lies in the tidal river network area of the Yangtze River Delta, bordering the East China Sea in the east, Hangzhou Bay in the south, Jiangsu and Zhejiang provinces in the west, and the mouth of the Yangtze River in the north. The river network of Shanghai is mainly composed by the main Channel Huangpu River, passing the urban area, and its tributaries Suzhou River, Chuan Yang River, Dian Pu River and so on. The annual rainfall is about 1200 mm and average rainfall day is about 132 days. About 60% of total rainfall occurs in flooding season from May to September with notable spatial distribution [33]. Because of deltaic deposit, the terrain of Shanghai is low and flat, with an average elevation of about 4 m, and the low-lying elevation is only 2–3 m. Geology is mainly constituted of cohesive soil. The groundwater level is high, and the diving level buried depth is generally 0.5–1.5 m [34].
Shanghai’s total population continues to grow, and its resources, environment and infrastructure are under great pressure. Severe weather occurs from time to time every year, especially in the flood season. Disasters, such as typhoon, rainstorm, high tide and flood etc., frequently attack the city infrastructure, so it is worth focusing on the study district, especially the central city, which has the most dense of population, buildings, traffic infrastructure and so on [35]. Whether the heavy rain causes waterlogging or not is also closely related to the local terrain, underlying surface, road density and even people’s activities [36]. The areas, usually the central city, with a large proportion of old houses and old underground rainwater systems will suffer more than newly-built areas with the same precipitation intensity [37]. Therefore, the performance evaluation of waterlogging risk prediction solutions in this study will focus on the central city of Shanghai, which is circled by pink polygon in Figure 1b.
Also, urban waterlogging risk gives useful information to public, policy makers and relevant departments of urban operation, such as drivers, drainage operational or road management staffs, taking notice of the area or roads which will impact by extreme heavy rain and waterlogging to avoid traffic jam and personal safety [38].

2.2. Methods

Figure 2 depicts our model process across the entire factors that drive waterlogging hazards and interact with the city infrastructures and drainage controls. To find out the relationship between rainfall and waterlogging depth at the different areas and locations, urban accumulated Automatic Weather Station (AWS) rainfall, waterlogging depth and drainage capacity information of different areas in shanghai with a historical series of about ten years are analyzed to develop a Waterlogging Depth Model (WDM). Additionally, drainage facilities information is included. After model calibration, WDM is converted to Rain-induced Urban Waterlogging Risk Model (RUWRM) with the classification collection by thresholds. To further check accuracy of the RUWRM simulation in terms of waterlogging risk, the real-time AWS rain gauge data and Numerical Weather Prediction (NWP) rainfall data are engaged in for model evaluation, thus waterlogging risk analysis is achieved. Consequently, the analysis will give cost-effective of solutions for the public, policy makers and relevant departments of urban operation.

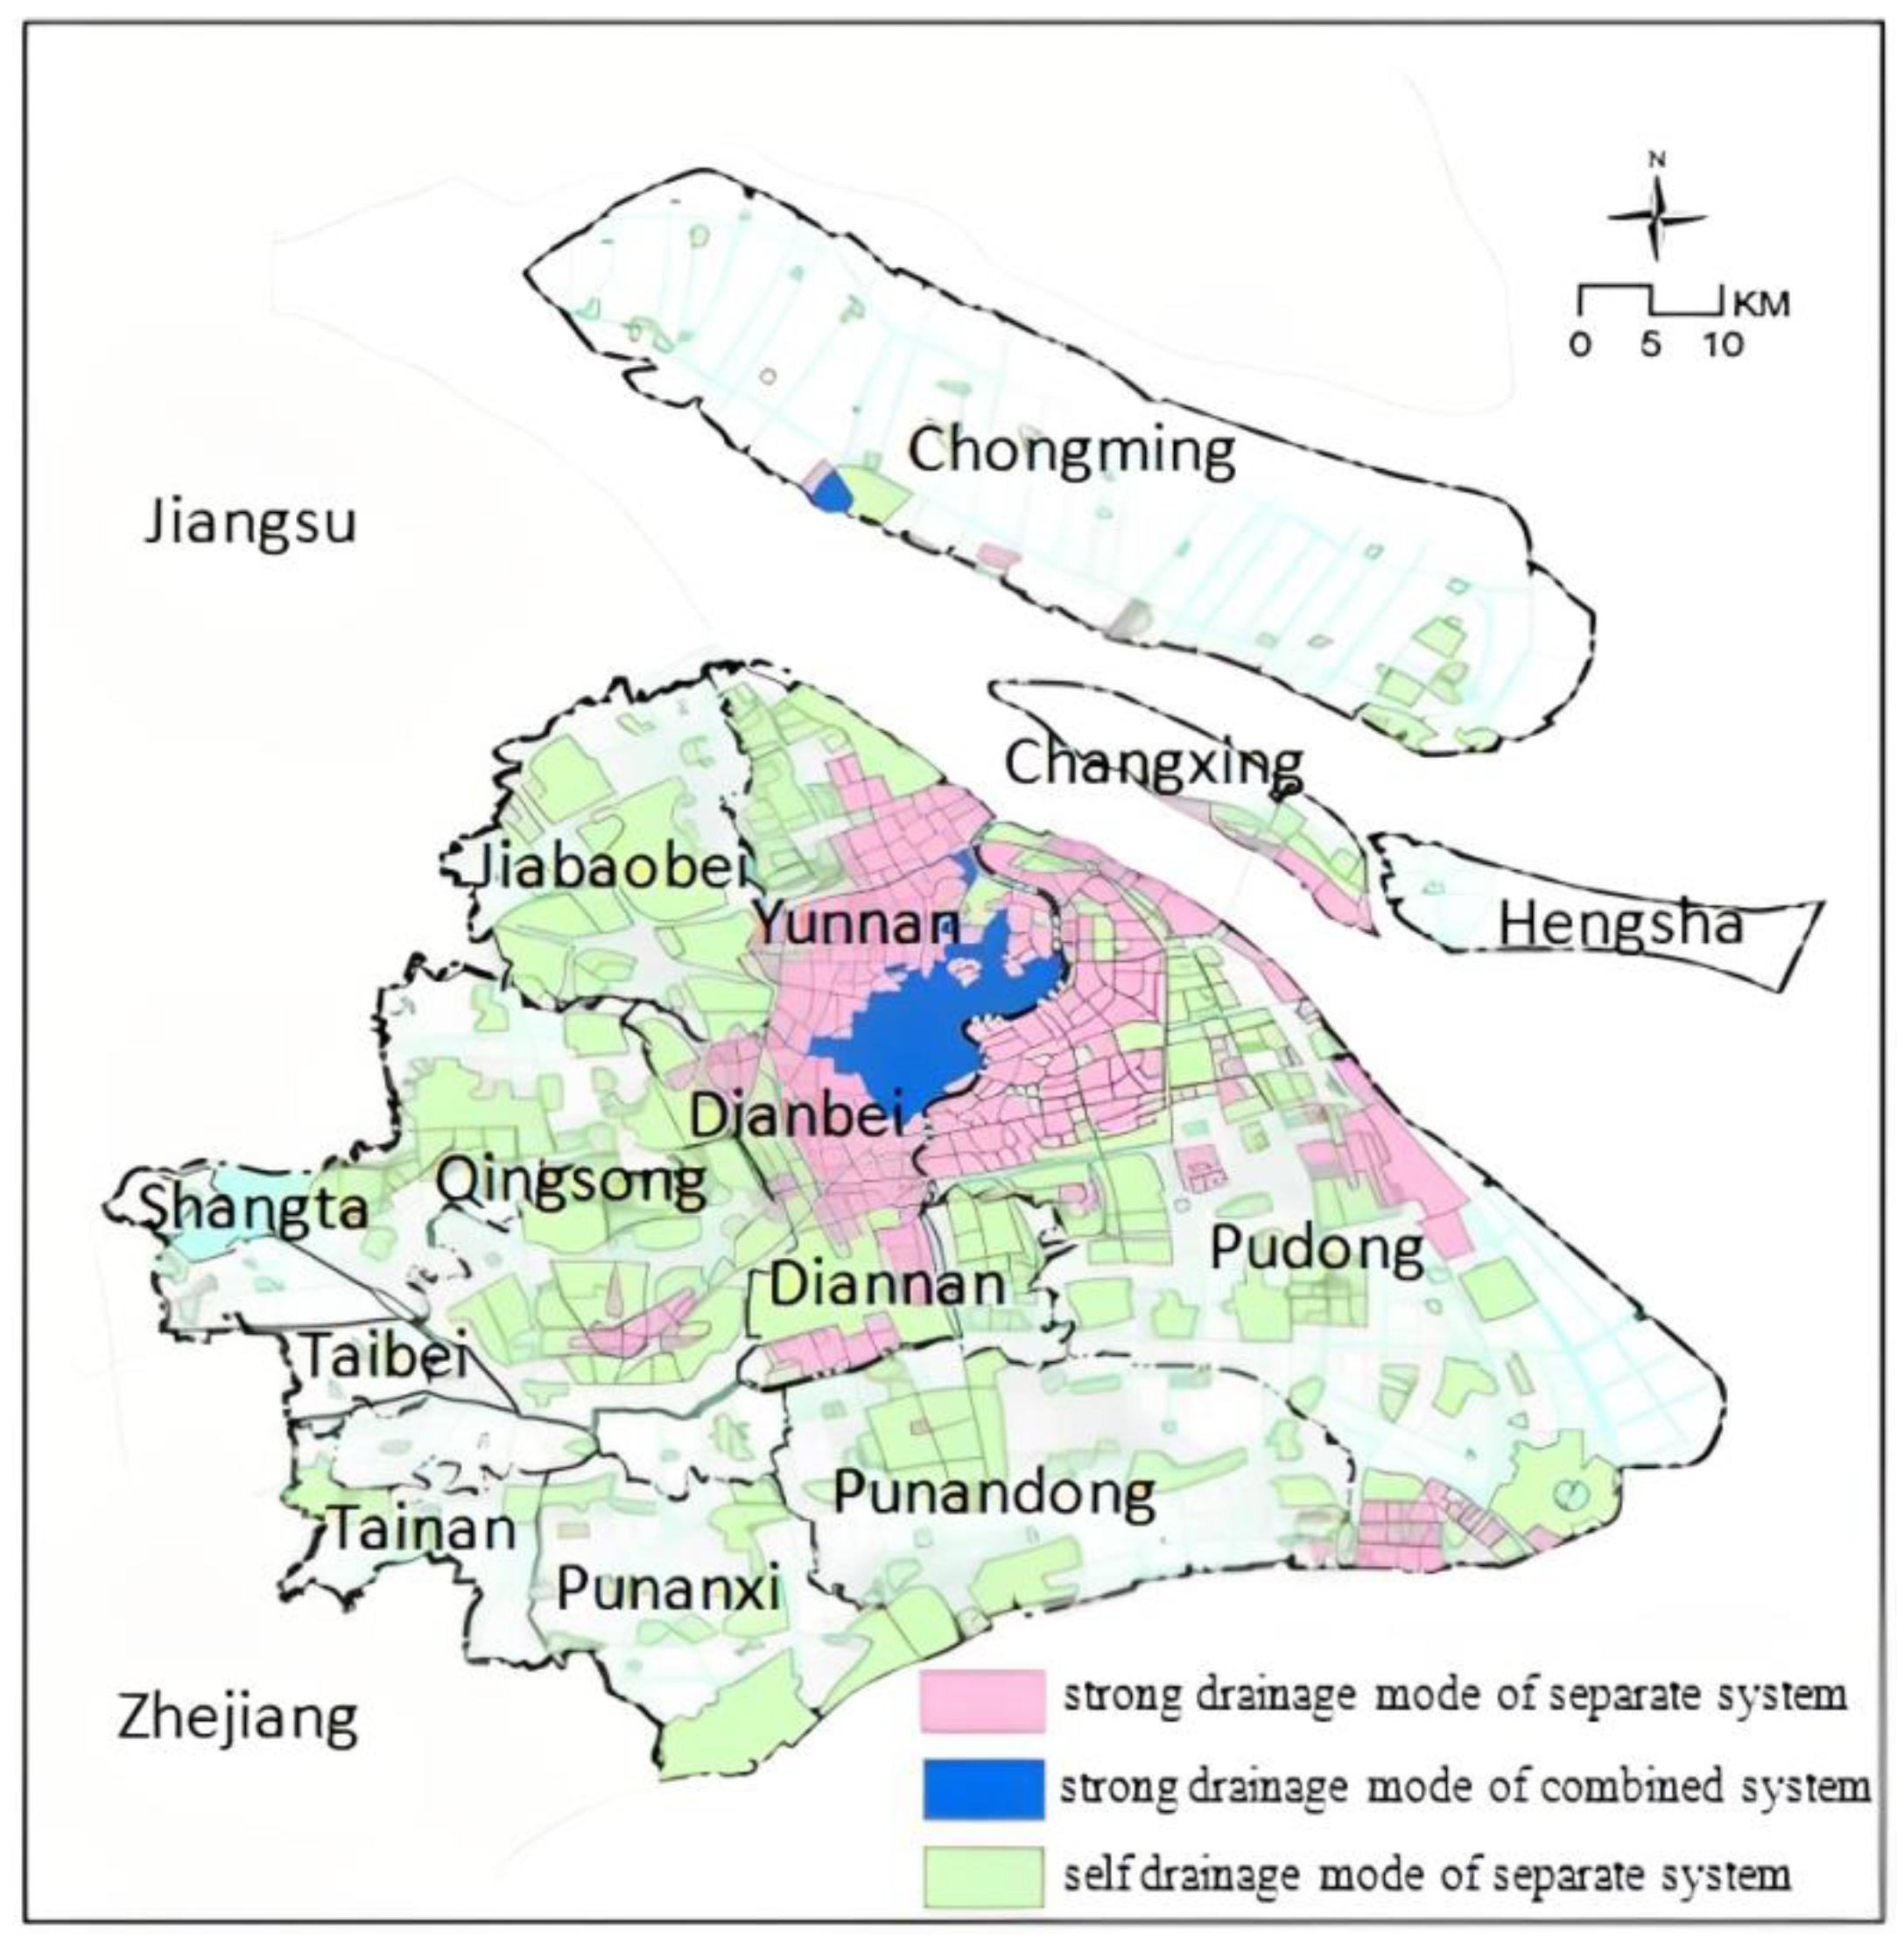
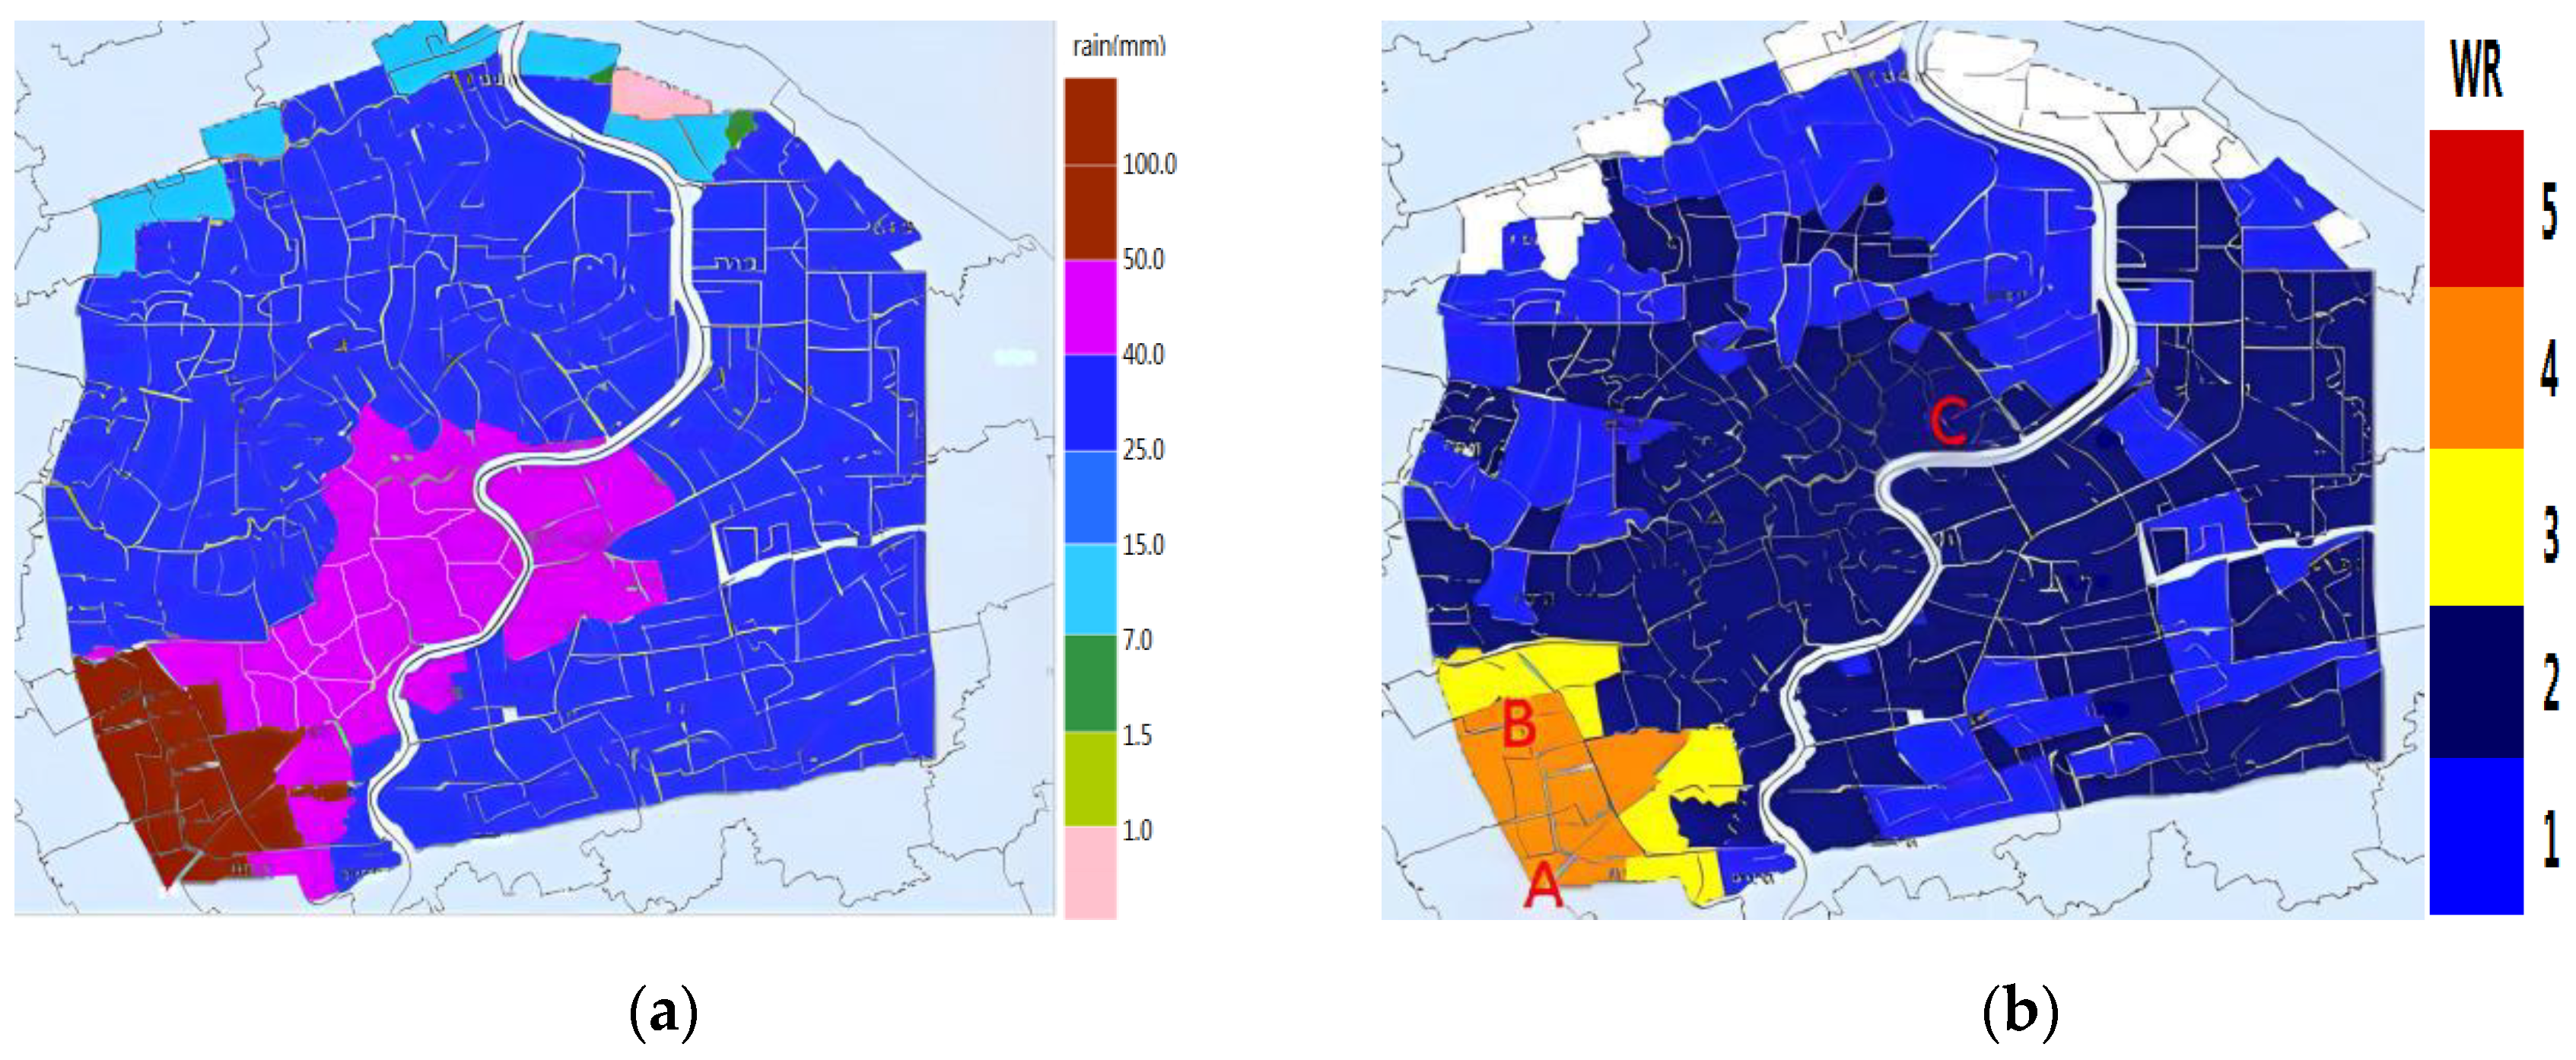
2.2.1. Drainage Area Zoning and Drainage Capacity of the Central City

According to the water conservancy section boundary, the city area is divided into 14 rain water drainage zones [39]. The distribution of drainage areas is as Figure 3 shows. The main feature of Shanghai is flat and low-lying, most areas have no good drainage conditions, water discharge mainly relies on pumping. There are over 1400 rain drainage facilities distributed over a considerable extent in Shanghai with different drainage mode in charge of a number of roads and street blocks. Also, the urban land in each zone is further divided into several strong drainage areas and self-drainage areas because of the different drainage modes. Among them, the central city mainly involves Jiabaobei, Yunnan, Dianbei, Diannan and Pudong (Table 1), which is mainly controlled by strong drainage mode, supplemented by self-drainage mode. In other rural areas, the self-drainage mode is mainly adopted, supplemented by the strong drainage mode.
The central city of Shanghai is the area within the outer ring, covering a territory of 660 km2, which is divided into 284 drainage units. These units are classified into four categories for different drainage capacities, those respectively follow the maximum drainage capability with precipitation intensity reaching 27 mm/h, 30 mm/h, 36 mm/h and 50 mm/h, which are called as I for the area of imperfect drainage facilities, II for the area of once-in-half-a-year waterlogging with strong drainage, III for the area of once-in-a-year waterlogging with strong drainage and IV for the area of once-in-three-year waterlogging with strong drainage.

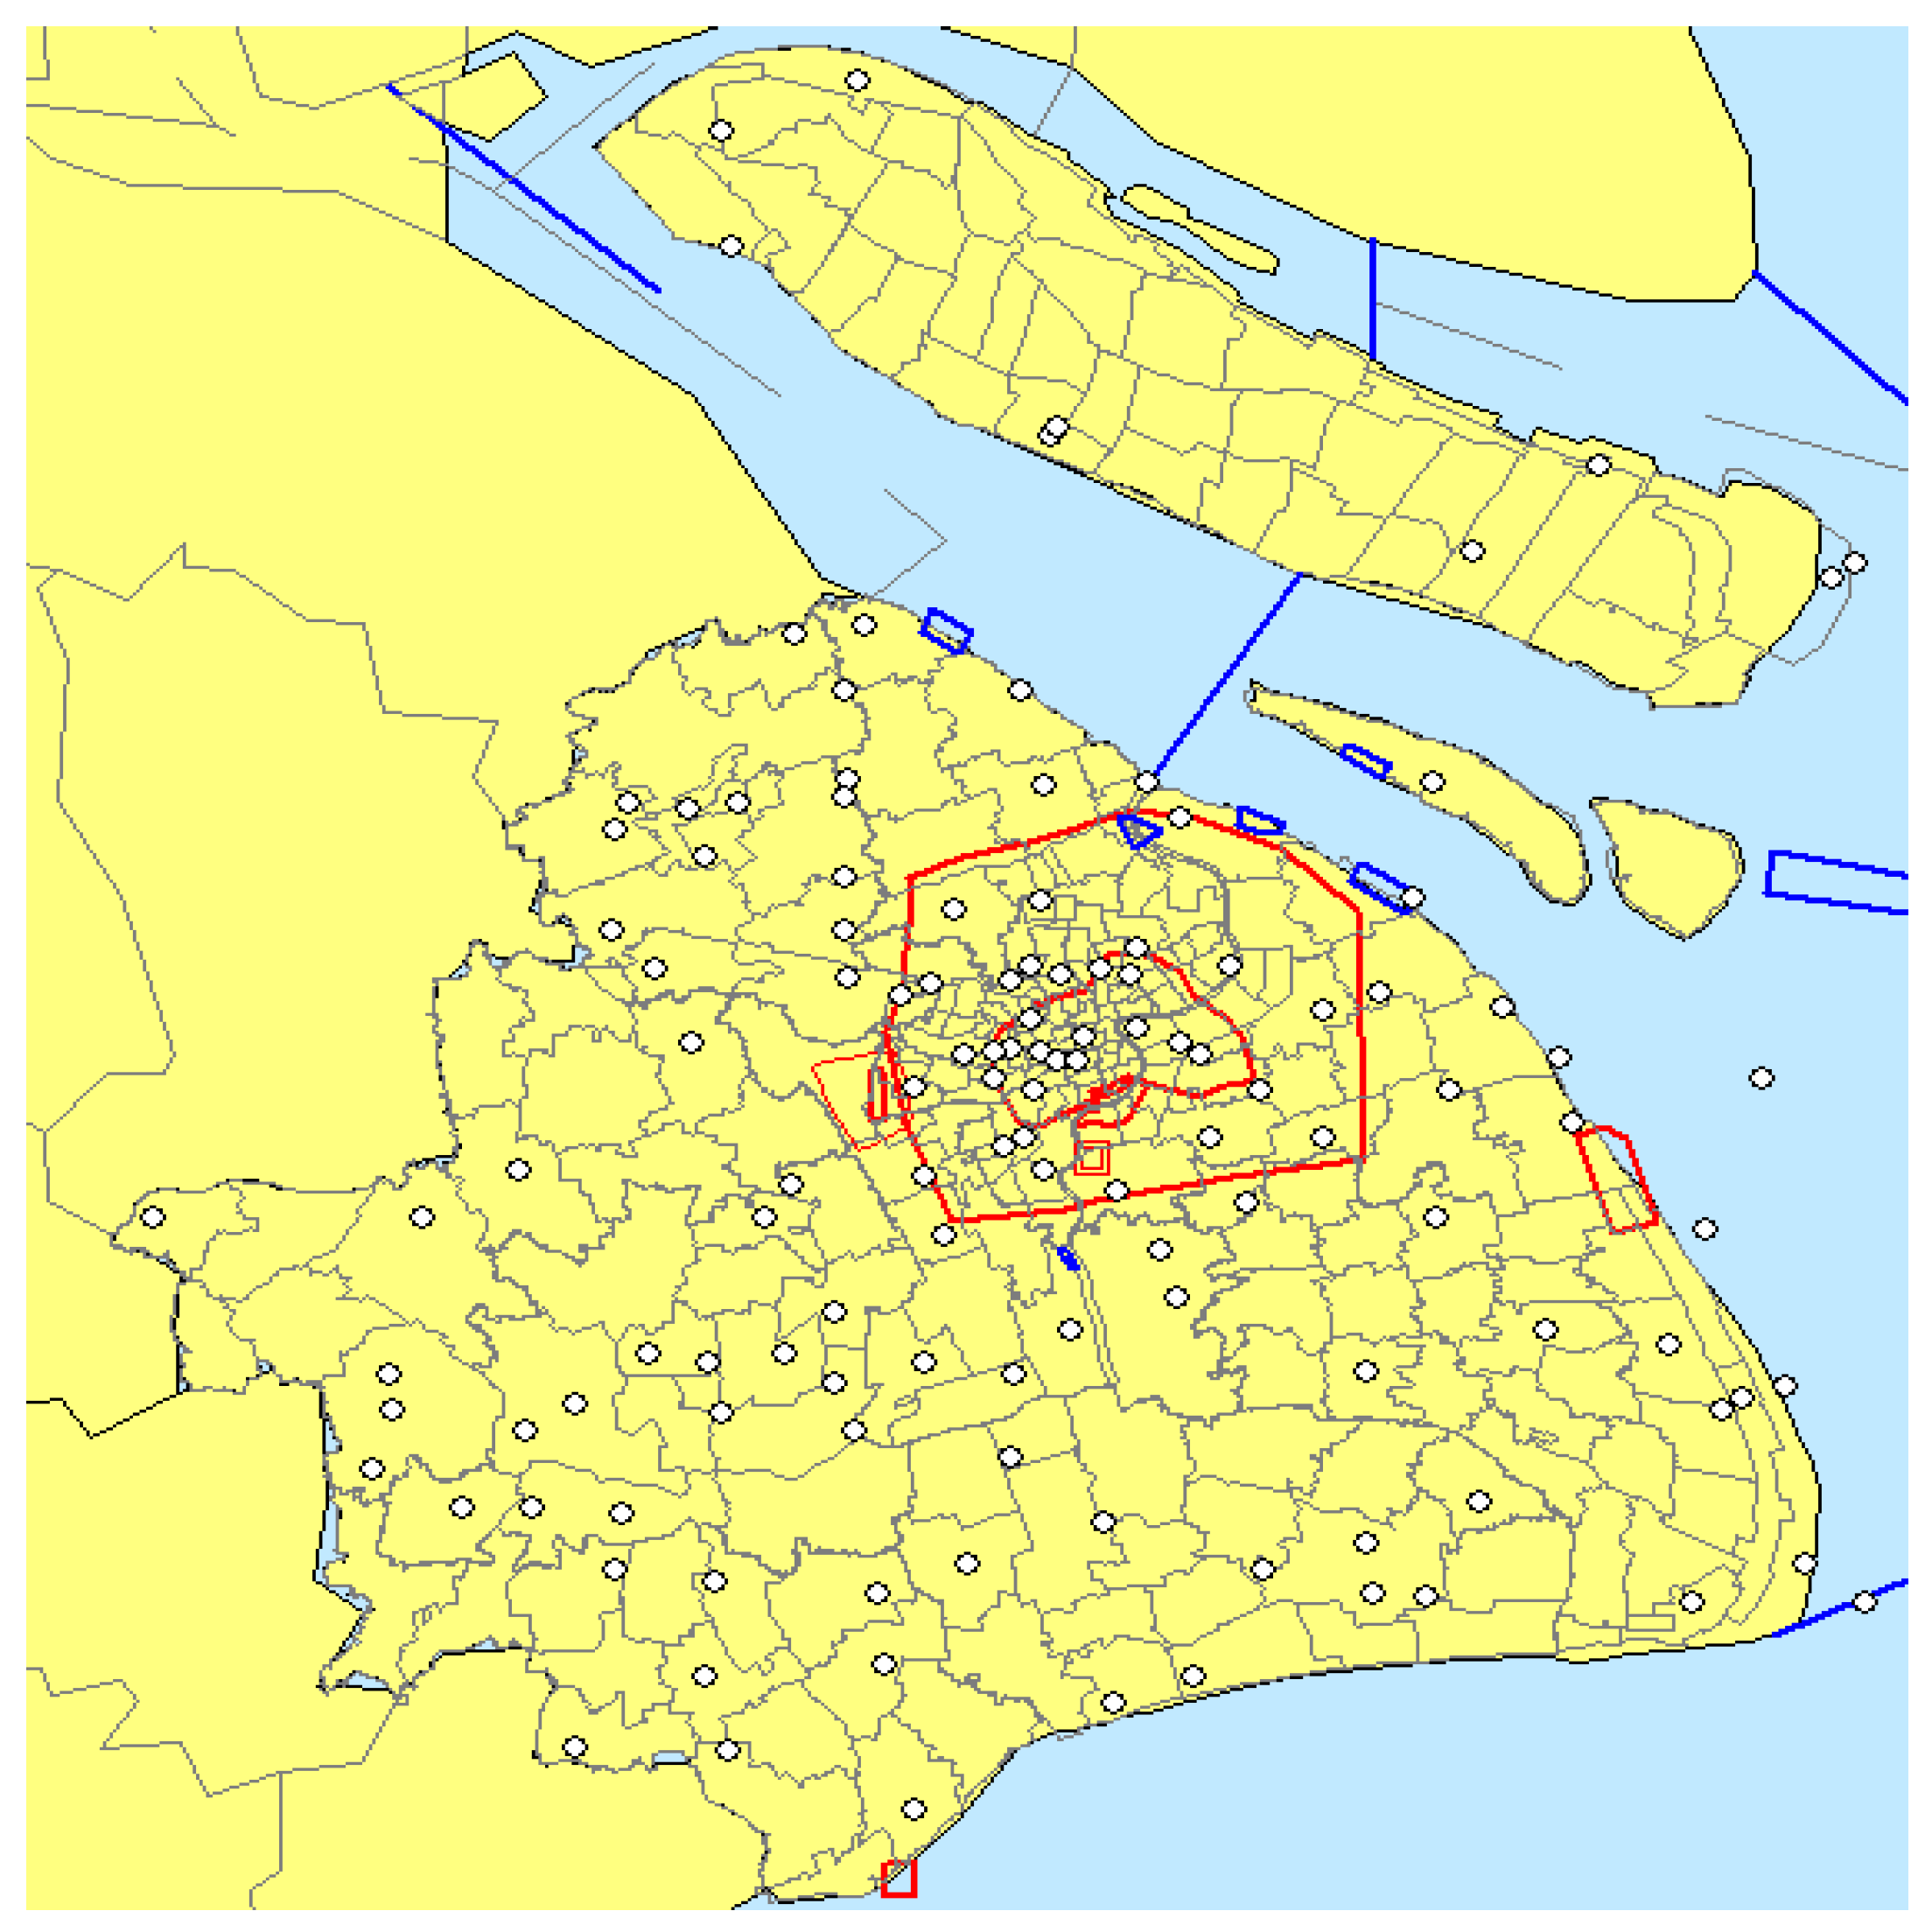
2.2.2. Meteorological Data and Waterlogging Depth Data

The 11 years period (August 2001–May 2011) of the hourly rainfall data from about 200 AWS observations have been acquired from Shanghai Meteorological Services (SMS) of China Meteorological Administration (CMA). AWSs are located all over Shanghai with about 5 km spatial resolution (Figure 4). The historical hourly rainfall data of Shanghai combined with waterlogging depth data are employed for building a regression model of waterlogging.
In this study, the second generation of regional high-resolution numerical forecast service system, SMS WRFADAS Real-time Modeling System (SWARMS V2.0) is chosen as the NWP model, which is widely used in the operational meteorological forecast departments in China. The main part of the system is based on ARPS (Advanced Regional Prediction System) Data Assimilation System and Weather Research and Forecasting (ADAS-WRF), with the National Centers for Environmental Prediction/Global Forecast System (NCEP/GFS) analysis field as the initial guess field [40,41,42]. The ADAS assimilation system is used to achieve the assimilation application of various observation data, including conventional weather observation, ship observation, airport ground report, buoy, aircraft observation, air sounding observation, radar data, infrared and visible channel of FY-2G (FengYun-2G) data. In addition, the use of cloud initialization technology to obtain information about convection (such as cloud and precipitation), and by adjusting the empirical parameters in the cloud analysis scheme, constructs a reasonable cloud field of high impact weather and the corresponding water parameters, including cloud water, cloud ice and so on, eventually forms fine structure of high quality numerical pattern analysis field in small and medium scale weather system [43,44,45]. In view of the fact that Shanghai is located in the East Asian monsoon region, the precipitation process is mostly produced under strong scale forcing conditions, and the physical process of cloud and precipitation in the mode is selected and optimized to improve the effect of the model precipitation. The SWARMS Rapid Refresh (SWARMS-RR) is mainly designed for short-time forecast, which is established based on ADAS-WRF with a horizontal resolution of 3 km after observation assimilation every hour for 24 h. SWARMS-RR starts once a day at 18UTC with the 6 h forecast field as the initial guess from SWARMS 2.0 at 12UTC, and the one hour forecast field of RR system after ADAS assimilation as the rest of the initial guess. SWARMS-RR rainfall data, from June to August of 2011 with the spatial resolution of 3 km, are employed for real-time prediction of waterlogging risk.
In this study, waterlogging depth data with site and occurrence time information are gained from Shanghai Water Authority (SWA) with a period of August 2001 to May 2011 from 14 rain water drainage zones of Shanghai. The data include all the waterlogging event with spatial-temporal consistency in that period.

2.2.3. Pre-Processing of the Historical Data

In terms of spatial distribution, the AWS rainfall data are pre-processed in our research for four parts in accordance to the distribution of waterlogging depth data to investigate their relationship in the same areas. The hourly waterlogging depth data are carefully examined according to rainfall event recorded in AWS in order to ensure the waterlogging event was caused by rain. In the other words, when waterlogging appears but there is no rain, the data are not applied for study. The drainage capacity information of different areas is determined to four levels, which follow the maximum drainage capability with precipitation intensity reaching 27 mm/h, 30 mm/h, 36 mm/h and 50 mm/h corresponding to the above four areas.

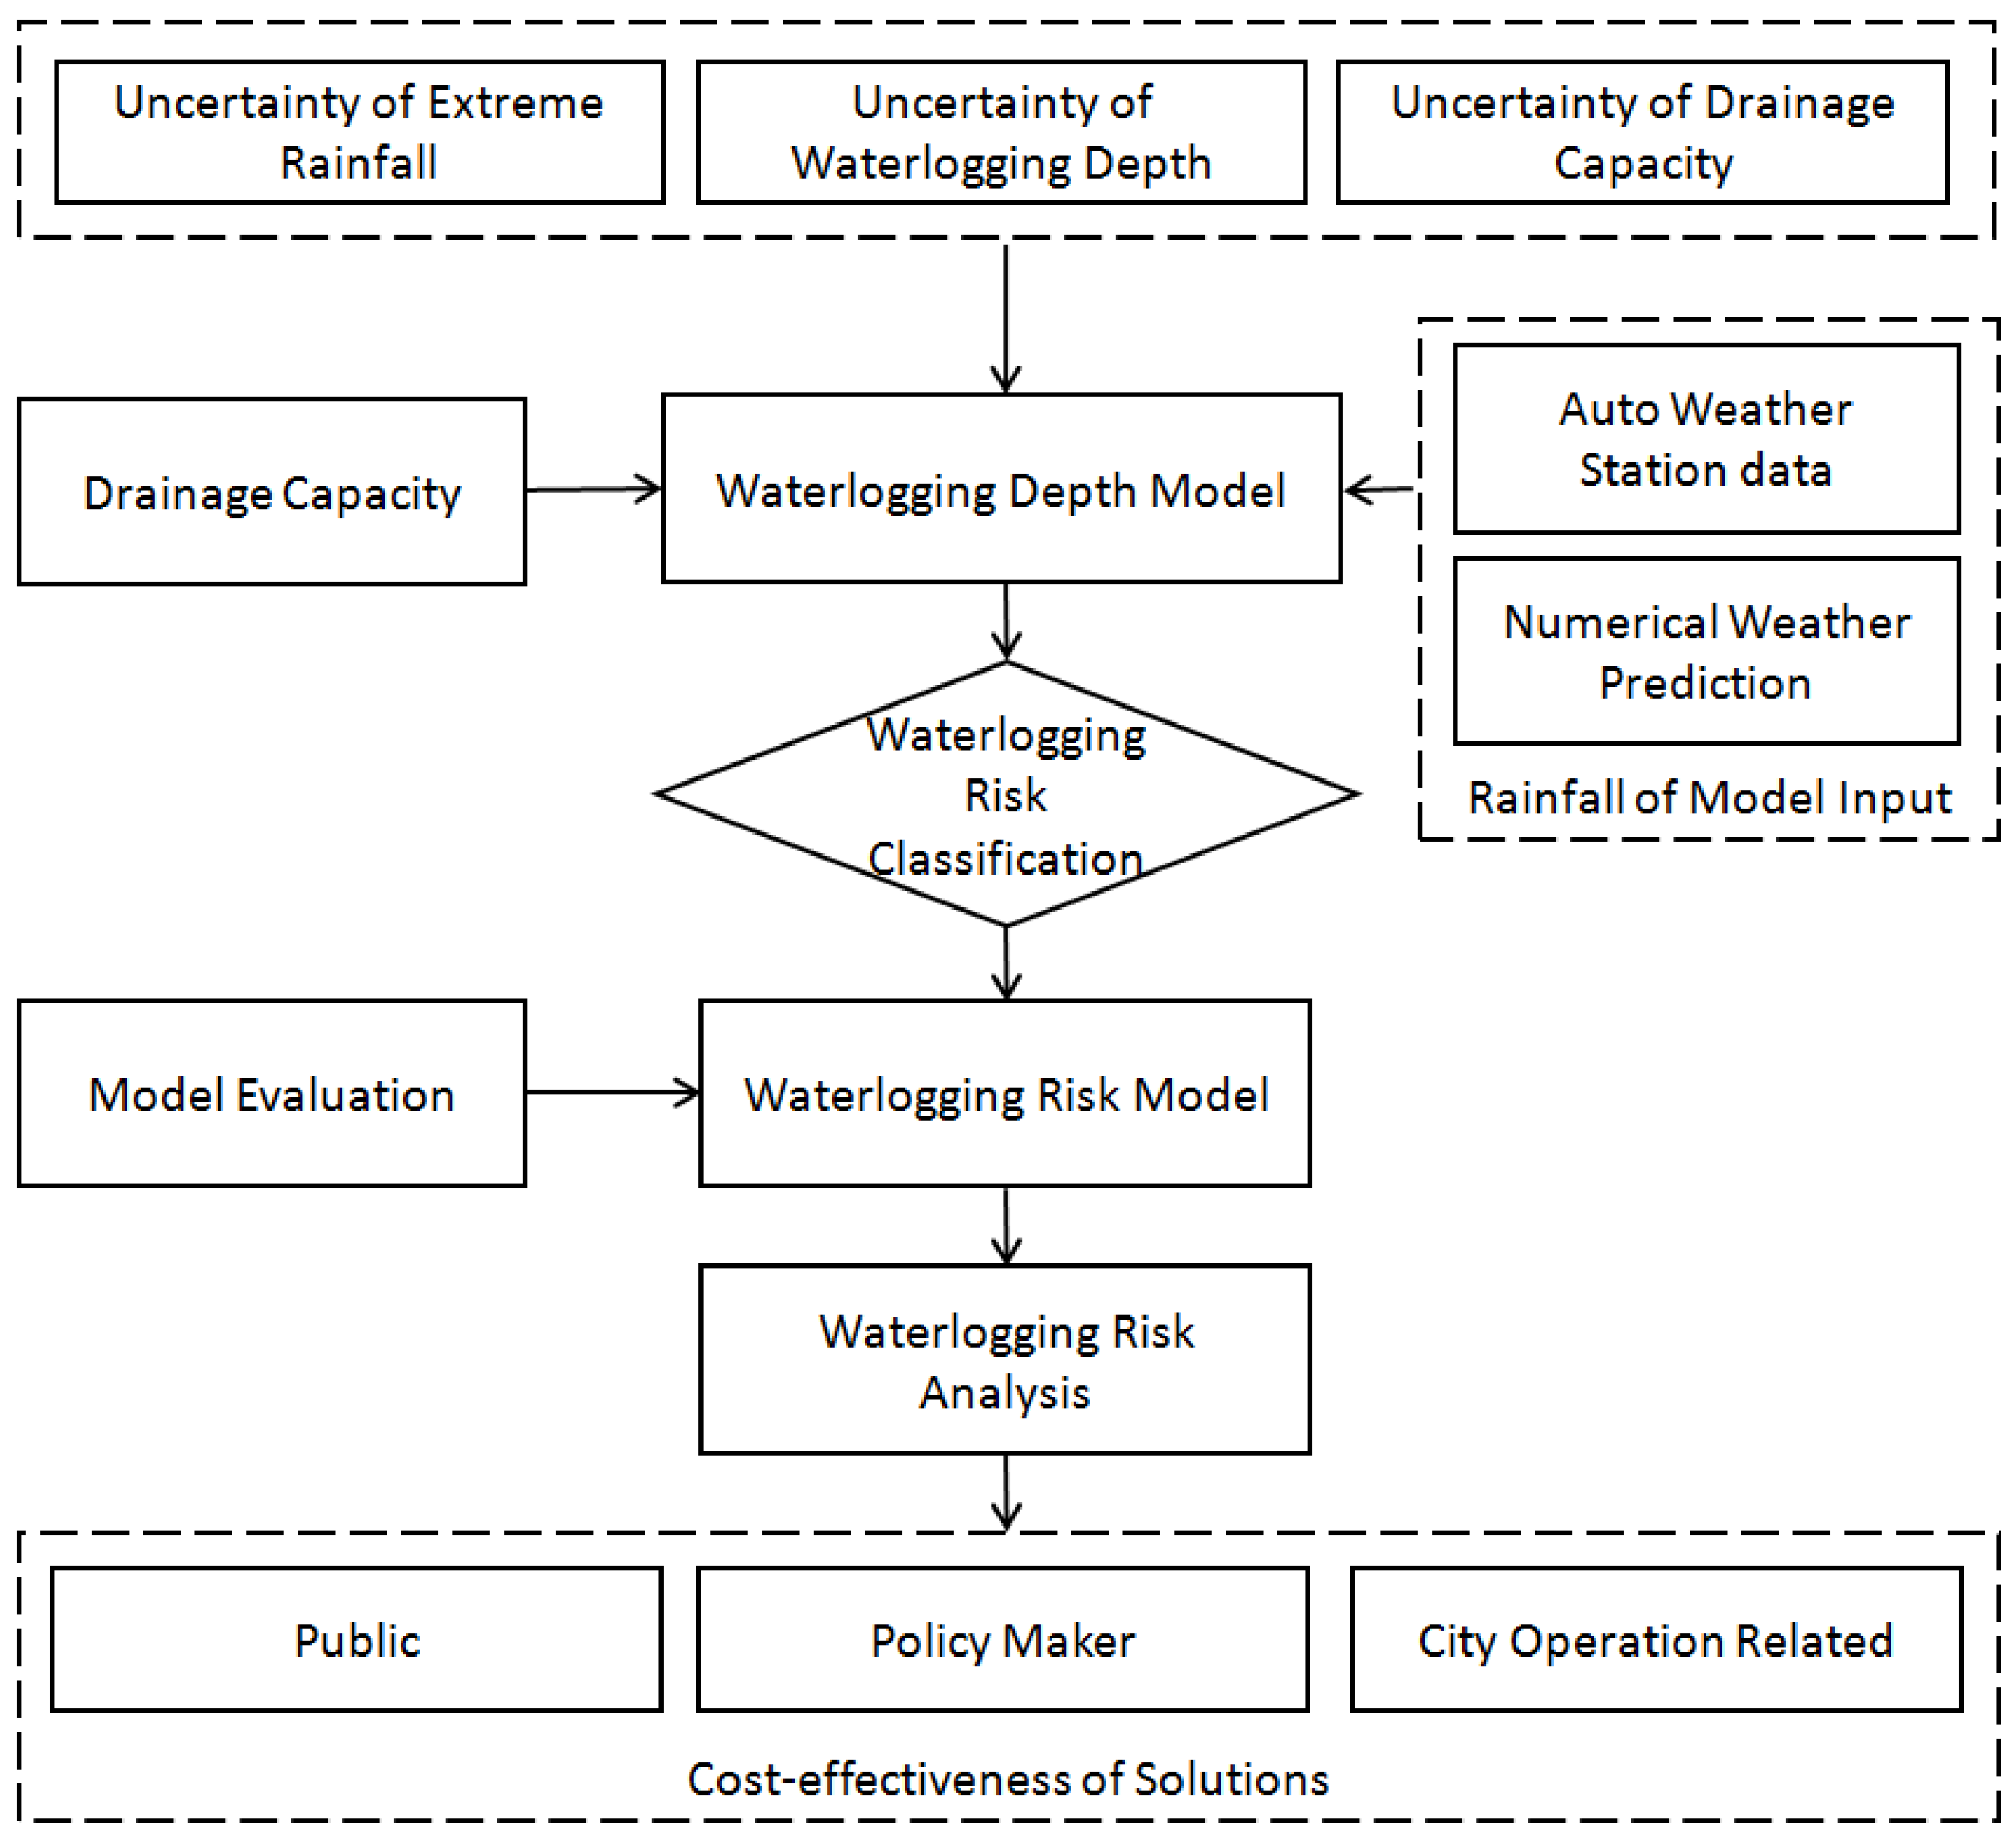
3. Model Setup and Prediction

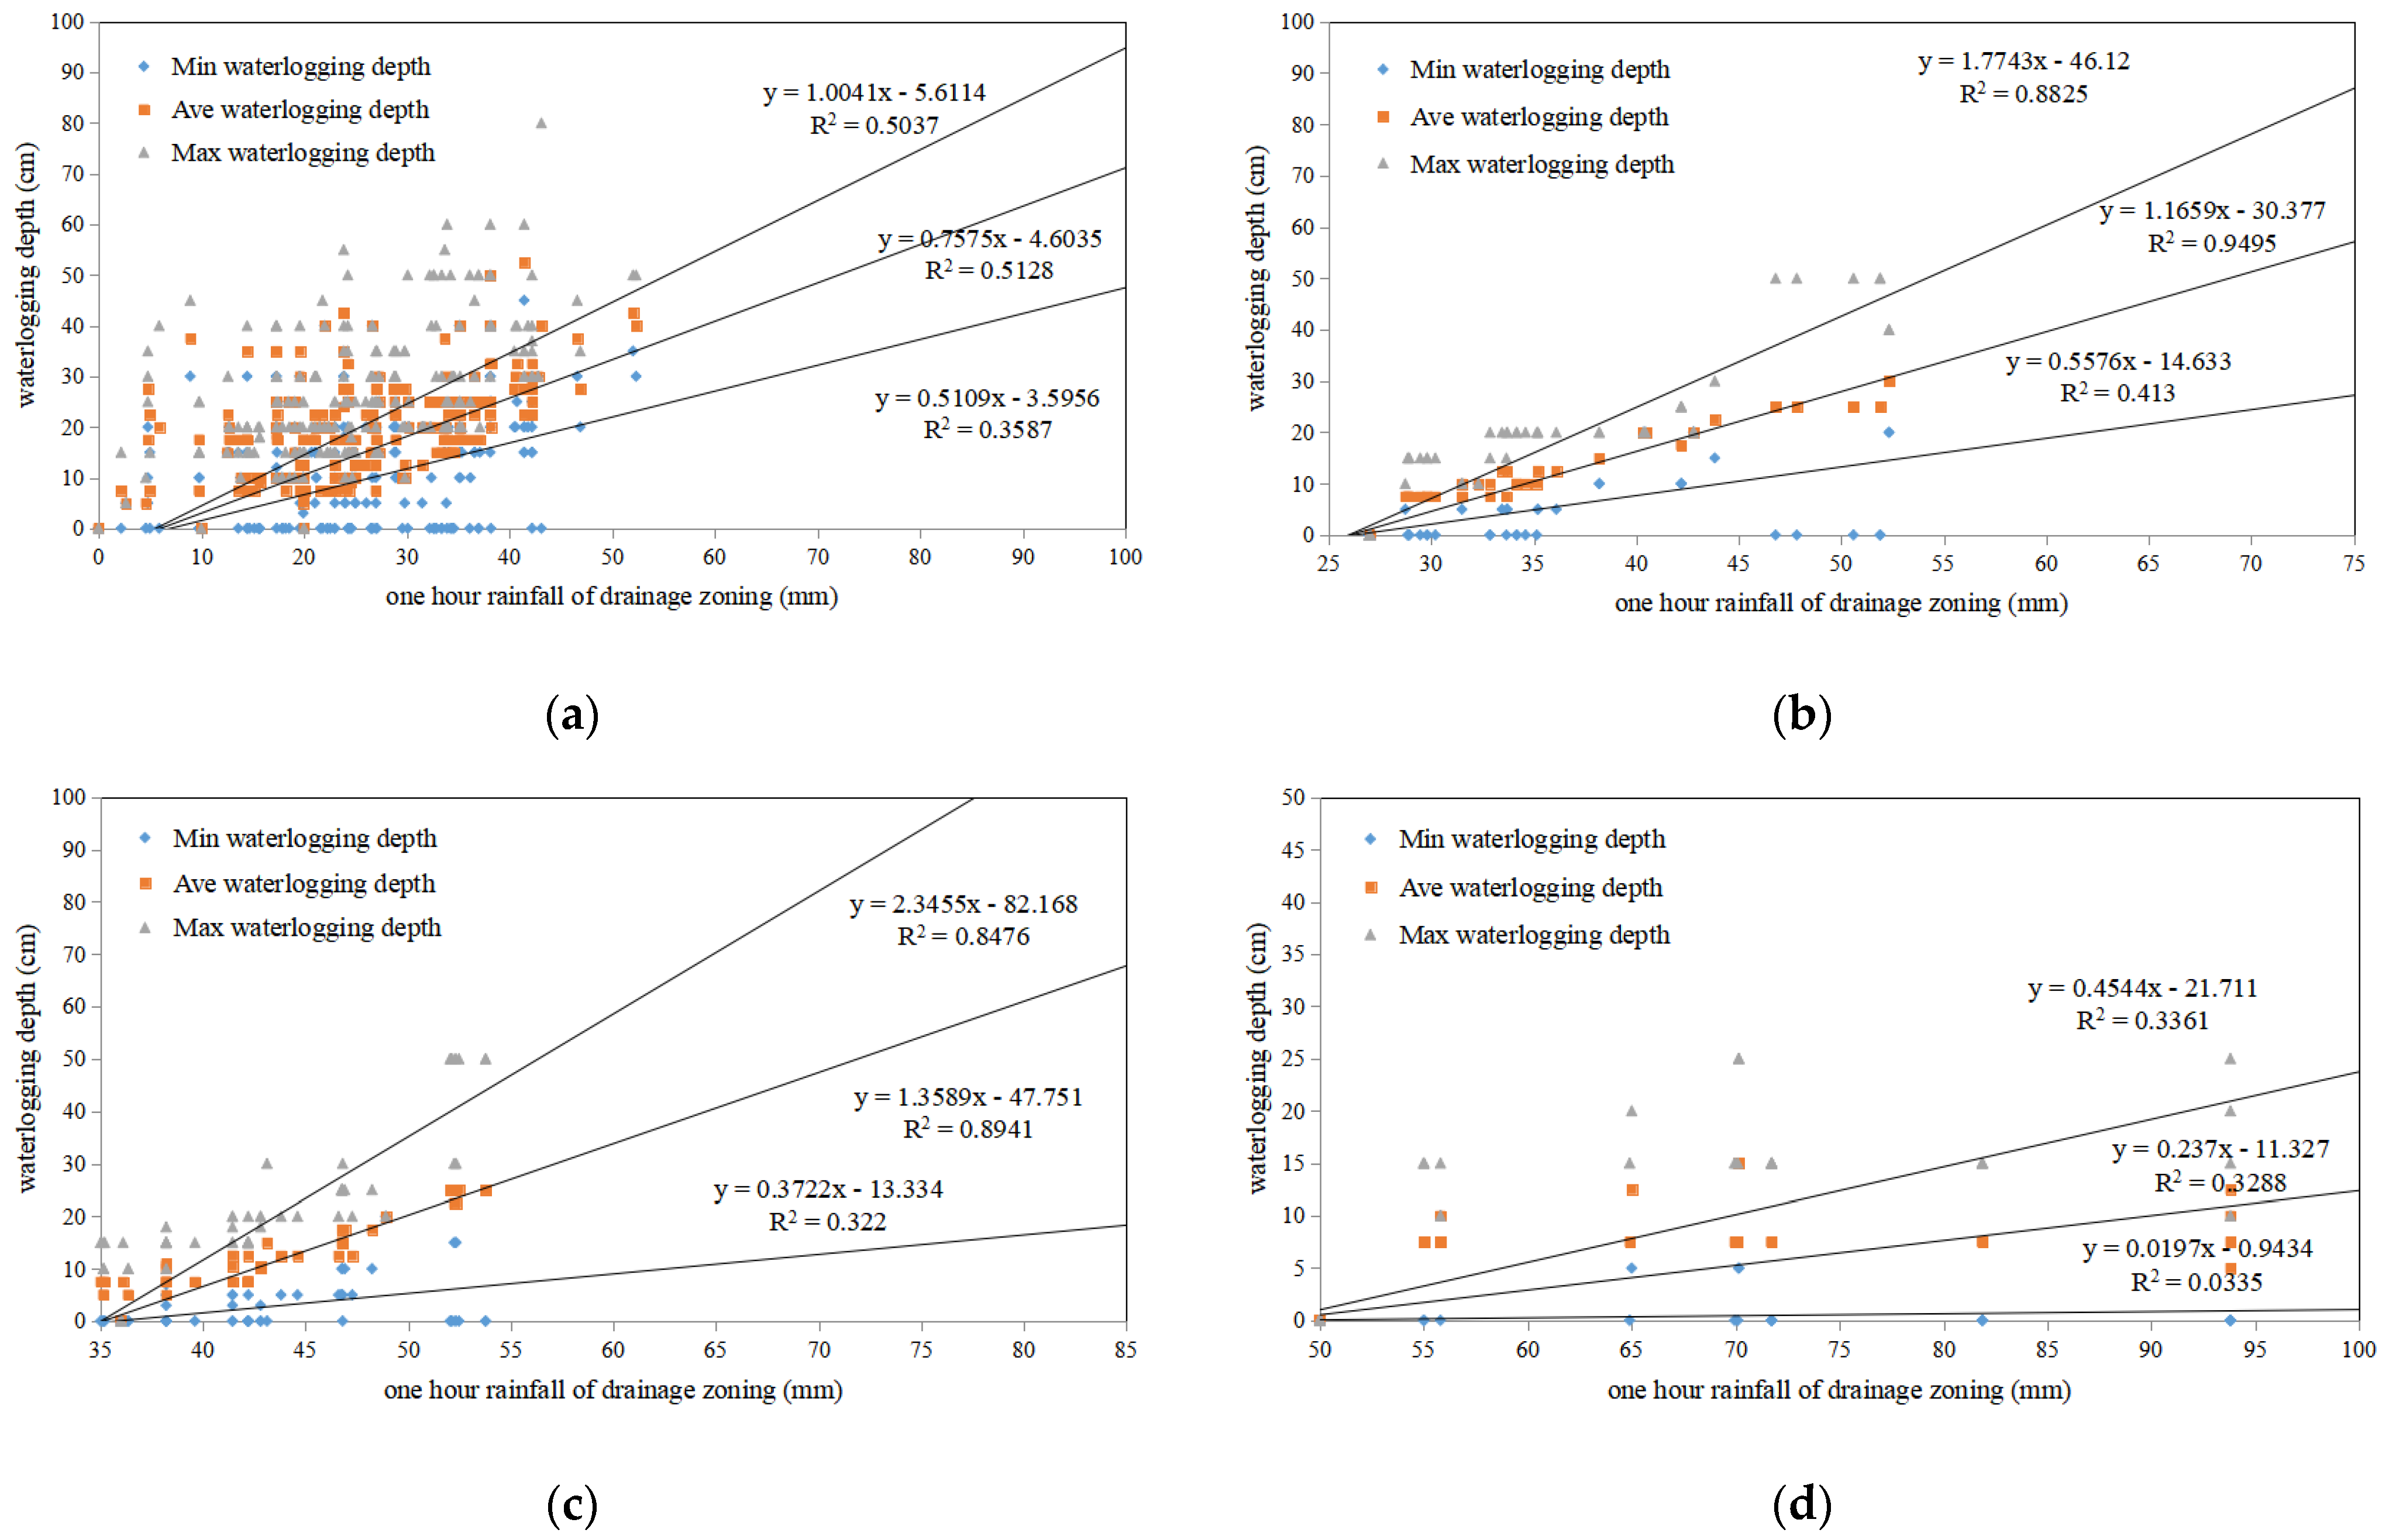
3.1. Waterlogging Depth Model Concerned about Rainfall and Drainage

The study area is located in the central city with a high density of residential and commercial properties. We opted to focus on rain-induced waterlogging risk of four categories for different drainage capacities. In other words, we especially look at the four categories of waterlogging risk so as to examine the direct risk caused by heavy rain. Researches show that the simulation of the drainage pipe network system is crucial for urban waterlogging [46,47]. The water flow conditions of drainage pipes are complex, with circulation, reflux, pressure flow and so on under cement, asphalt surface, dense high buildings and large impervious area, so urban hydrological characteristics are not obvious [48]. But the simulation of these complex conditions require numerous input data, parameter calibration, and expansive computing costs [49,50]. In this paper, the hydrodynamic process is simplified and the drainage capacity is adopted to generalize the complex hydrodynamic action in the grid unit. We take the waterlogging depth based on the following.
waterlogging depth = rain induced waterlogging depth − depth in drainage capacity
The rain-induced waterlogging depth presents the depth directly caused by rain, which is regarded closely related to rainfall intensity, rainfall duration, and rainfall type. Rainfall intensity is the most important factor, so hourly rainfall is used to find the relationship between waterlogging depth and rainfall. Depth in drainage capacity is equal to 27, 30, 36 and 50 for four area categories. Thus, waterlogging depth can be written as the following:
depth = a ∗ rain + b
where rain is one hour rainfall (mm), depth is waterlogging depth (cm) and a, b are the constant parameters.
To find the relationship between rainfall and waterlogging depth, hourly precipitation data of AWS and historical waterlogging depth are applied. Therefore, statistics of the average, maximum and minimum waterlogging depth in areas of four categories with drainage capacity and hourly rainfall data shows their linear relationship can be expressed by some mathematical regression model. Then a, b can be calculated in this regression model by least square method as regression coefficients. The average waterlogging depth is considered as the base line of the area when waterlogging occurs. By using the regression model and calculated a and b in four categories of waterlogging risk area, area I, II, III; and IV respectively have the following average waterlogging depth model in Equations (3)–(6).
depth = 0.7575 ∗ rain − 4.6035
depth = 1.1659 ∗ rain − 30.377
depth = 1.3589 ∗ rain − 47.751
depth = 0.2370 ∗ rain − 11.327
Also, the maximum and minimum waterlogging depth can be expressed as the above formula with different regression coefficients (Figure 5). If depth is negative while calculating with rainfall input, let it be zero.

3.2. Setup of Rain-Induced Urban Waterlogging Risk Model

According to different drainage capability of each areas and rainfall, Rain-induced Urban Waterlogging Risk Model (RUWRM) is setup in different drainage area in the central city of Shanghai based on urban waterlogging depth information and its classification collection. Based on social survey results, waterlogging risk ranks in Shanghai are further established considering the drainage capacities and the impact of different depths of inundated water on roads, streets and buildings. Table 2 shows that the waterlogging risk in Shanghai is categorized to 5 ranks from 1 to 5 from SWA. The 5 ranks of urban waterlogging risk are named as “slight”, “low”, “moderate”, “high” and “severe” in accordance with the colour of “light blue”, “blue”, “yellow”, “orange” and “red”. For example, if the waterlogging depth is greater than 30 cm and not greater than 45 cm, the waterlogging risk is determined to rank 3 with the meaning of “moderate” impact and the colour of “yellow”.

3.3. Waterlogging Risk Prediction

To evaluate the performance of RUWRM, waterlogging risk prediction is done with NWP forecast hourly rainfall data with horizontal resolution of 3 km within 24 h. Based on the forecast rainfall, urban precipitation of drainage area in the central city is provided. Then waterlogging depth can be obtained according to WDM. Afterwards, the 3 km grid waterlogging depth is converted to waterlogging risk, which is meshed into the different drainage units, then different waterlogging risk of each area can be achieved.

4. Results

4.1. Prediction Performance Evaluation

As evaluation of prediction performance, the observed and predicted waterlogging risk are used during June to August in 2011 in Shanghai. Firstly, observed waterlogging depth is converted as “observed” by using the waterlogging risk classification collection. Secondly, real time prediction of NWP is used to calculate predicted waterlogging risk by the waterlogging risk model. At last, “observed” and predicted waterlogging risk are applied to evaluate the model performance. The heavy rainfall event on 12 August 2011 is taken as an example. Affected by the slow-eastward-moving cold vortex in high altitude, the severe convective weather occurred, with the precipitation mainly occurred in the central urban area and the northern part of Shanghai. From 06 to 10 am, the maximum cumulative rainfall in the central city reached 92.9 mm. Beixinjing of Changning district, Wujiaochang of Yangpu district and Huanghe Road of Huangpu district get the observed waterlogging risk rank for 3, 4, 4, either as the predicted. The model predicted values meet the observation well. Table 3 shows the waterlogging risk in some heavy rain events of flood season from June to August in 2011. After careful examining, it is concluded that the most predicted waterlogging risk is totally close with the observed, occasionally, few predicted ones have one rank level difference. Totally, the prediction accuracy is 80%.

4.2. The Performance of a Heavy Rain Case Evaluation

The heavy rainfall event on 4 August 2011 is taken as a case to evaluate the model performance. On that day, due to the influence of the trough on high altitude, severe precipitation occurred in Shanghai, while a rainstorm occurred in the central city. Rainfall values of six automatic stations exceeded 50 mm in one day, with the maximum cumulative rainfall was 68 mm. Figure 6 depicts the NWP rainfall in Shanghai and in the central city, as well as corresponding waterlogging risk product by using waterlogging risk model. On the waterlogging event, the waterlogging depth of Wuzhong Road and Xianxia Road (B) were 48 cm, Xinzhuang (A) exceeded 30 cm, and Middle Ring (C) was near 25 cm (Figure 6b). According to the waterlogging risk ranks, the observed waterlogging risk rank of Wuzhong Road and Xianxia Road was 4, Xinzhuang was 3 and Middle Ring was 2. And for the prediction, the waterlogging risk rank in Wuzhong Road and Xianxia Road was 4, Xinzhuang was 3 and Middle Ring was 2 by the WRM. It is obvious that the predicted results fit the observed closely.
The results show that the distribution and rank of urban waterlogging risk is different because of different rainfall conditions. The greater the rainfall intensity is, the higher the waterlogging risk rank will be. When the hourly rainfall value is above than 25 mm, there is slight risk in some urban areas of imperfect drainage facilities. When the hourly rainfall value is higher than 40 mm, there is low risk in most areas of the central city. When the hourly rainfall value is above 50 mm, it will get moderate or high risk in the areas where the rain falls.

4.3. Practice on Drainage Decision-Making Support by Waterlogging Risk Prediction

The rainstorm event in Shanghai on 14 July 2011 is for discussion about decision-making support on the practice. During this event, the precipitation in the northwest of central city of Shanghai exceeded 100 mm within 24 h. Based on the NWP heavy precipitation forecast, the waterlogging risk prediction is given by using RUWRM. Clearly, severe waterlogging is expected in the northwest of the central city, while moderate or slow waterlogging in the southwest. The real-time operational dispatching control system of Shanghai urban rainwater pipe network in this area is mainly controlled by rainwater pumping stations, which is responsible for the pipeline drainage in one area (Figure 7). For practice, TianLin pumping station and its pipeline control blocks are concerned. According to the arrangement of the dispatching system, the rainfall alarm is conducted, combined with the waterlogging risk prediction, the pumping station load alarm was considered, as well as the drainage arrangement and online personnel dispatching were managed through the alarm system. Benefit from the waterlogging risk prediction, the drainage management personnel conducted the pre-drainage of the drainage pipe network and unblocked the pipe line in this area, increasing the capacity of rainwater absorption, and enhancing the discharge capacity of waterlogging water. At the same time, the rainfall station and water monitoring instrument were used to monitor the rainfall and waterlogging depth, while the alarm messages were sent to the drainage and flood control staff through the decision-making support system, so that they could more accurately know the waterlogging situation for their monitor and disposal.

4.4. Discussions

It is usually regarded that the main factors determining the impact of urban waterlogging are precipitation, drainage system, urban topography, land use, human behavior and so on. For the natural factors, the uncertainty comes from the rainfall. In the urban building concentration areas, while the “heat island effect” is conducive to the development of heat convection over the cities, which easily causes heavy rain. At the meanwhile, the cities discharge a large number of pollutants, forming the “turbid island effect”, which is conducive to the formation of condensation core, leading to the rainfall in the urban part is often more than the surrounding areas. Due to the influence of climate change, the rainstorm process in big cities in China has increased significantly over the past 50 years, manifested in the increasing rainstorm days and total rainstorm rainfall.
Previous studies either focused on proposing complex hydrodynamic models with multi-factor interactions, or focused less on short-term prediction applications of urban waterlogging risk, making it difficult to apply to the operational urban management departments. The contribution of this study is that it presents a quick and less expensive method by focusing on rainfall-induced waterlogging risk given the drainage capacity in different areas with simplification of complex surface condition and hydrological process, so that social impact of waterlogging risk can be well concerned. Therefore, property loss threat caused by waterlogging on roads, buildings and street blocks, as well as live or health threat on residents can be recognized by waterlogging risk ranks easily. Actually, the urban drainage networks are evolving in some sites of the central city in. After examining the current situation, the whole drainage capacity of the central city in Shanghai is not changed so much to certainly need to update the waterlogging risk model. But for predicting the future urban waterlogging, it may need new models considering future constructions and climate scenarios. Additionally, as a way to evaluate the waterlogging induced by rain, the model is valuable. When heavy rainfall is expected but waterlogging has not occur, the rain-induced urban waterlogging risk model presented in this study will help to advance the preparation and response time for waterlogging.

4.5. Policy Recommendations

Shanghai has established flood control agencies at the municipal, district and sub-district levels, which are responsible for the organization, coordination, supervision and guidance of flood control work within its respective administrative regions. In view of the characteristics of rainfall, as well as the large population, crowded buildings and high level urbanization of the city, the ideas of flood control policy in Shanghai focus on avoiding defense collapse, road water, low-lying waterlogging, house collapse, underground space water and so on. For this goal, Shanghai has established an organization and command system, a preplan and early warning system, an information support system and a rescue system. Unified command and hierarchical responsibility, effective risk diversion, material deployment and personnel dispatch plan, sufficient meteorological, hydrological and disaster information, together with powerful rescue materials and personnel team have jointly guaranteed the flood control in Shanghai. In addition, to relieve the population pressure in the crowded central city, Shanghai has issued relevant policies to effectively manage the urban settlement, diverting some of the population to the suburbs, which reduces the pressure of flood control to some extent.
In preparation, with speedy dissemination of waterlogging risk prediction to relevant official departments and organizations by emergency department during flood season, it can be arranged notice and action at the public level to increase awareness. People, such as drivers are generally advised about how to increase their preparedness, including knowing how and when they will go away from the waterlogging areas, how and where they will park their cars, what types of emergency action and help they may need. Various departments of city government can also make preparations and appropriate emergency items to help citizens respond to waterlogging.
In order to minimize loss, damage, and health risks during waterlogging, the relevant departments can rapidly operate their emergency facilities at different parts of the city following the waterlogging risk prediction given in this study. Relief and rehabilitation works are monitored, and emergency instructions are provided to other organizations and service departments, such as the electric supply authority, water supply and sewerage authority, traffic management department, fire service, and so on.
Immediately after a waterlogging strikes, real-time rainfall data can be invoked, and the waterlogging risk model in this study can be used to conduct risk assessment in different regions. A report outlining the estimated work can be send to the relevant departments, along with additional information and comments. It also prepares restoration lists of buildings, houses, and all types of structures, as well as lists of roads and streets that are to be raised above the floodwater level.

5. Conclusions

The present study focused on the setup of the relationship between the urban waterlogging risk, rainfall and drainage capacity in the central city of Shanghai. In this paper, the drainage capacity is adopted to generalize the complex hydrodynamic action and artificial drainage in the urban grid unit. The waterlogging depth model is built between rainfall and drainage capacity by regression method with pre-processed historical data. Waterlogging depth model was created for the calculation of the rainfall associated with the drainage for building relationship based on a period of about 11 years data. What is more, a simplified rainfall-induced urban waterlogging risk model is introduced to expand the use range of waterlogging depth model. Also, predicted waterlogging risk is carried out by NWP forecast rainfall data from some heavy rain events from June to August in 2011, and analysis shows that predicted waterlogging risk is close to observation. Finally, some suggestions are offered to the public, policy makers and relevant departments of urban operation. On the basis of the previous section of results and discussion, the following conclusions were drawn:
(1)
The results show that waterlogging is closely linked with rain and drainage, and waterlogging depth has a linear relationship with rainfall and drainage capacity. That is to say, more rainfall leads to higher waterlogging risk, especially in the central city with imperfect drainage facilities.
(2)
Rain-induced urban waterlogging risk model can rapidly give the waterlogging rank caused by rainfall with a clear classification collection. The results of waterlogging risk prediction indicate that it is confident to get the urban waterlogging risk rank well and truly in advance with more accurate rainfall prediction.
(3)
Information with urban waterlogging risk gives the public, policy makers and relevant departments of urban operation timely adjust their routine and emergent management who are hoping to diminish traffic intensity and personal safety. In urban construction and development processes, more attention to the improvement of drainage capacity will lead to less waterlogging risk.

Author Contributions

Conceptualization, L.Z. and S.W.; Data curation, L.Z. and Q.L.; Formal analysis, L.Z. and Q.L.; Funding acquisition, L.Z. and L.C.; Investigation, L.Z. and Q.L.; Methodology, L.Z. and S.W.; Project administration, L.Z.; Resources, L.Z., Q.L., S.W. and Z.W.; Software, L.Z. and S.W.; Supervision, L.Z., Z.Q. and Z.W.; Validation, L.Z. and S.W.; Visualization, L.Z. and S.W.; Writing—original draft, L.Z. and Q.L.; Writing—review and editing, L.Z., Q.L., S.W., Z.Q. and Z.W. All authors have read and agreed to the published version of the manuscript.

Funding

This research was funded by the Yangtze River Delta Science and Technology Innovation Community Field Project of Shanghai Science and Technology Innovation Action Plan (Grant No. 21002410200) and the National Natural Science Fund of China (Grant No. 42105001).

Data Availability Statement

Not applicable.

Acknowledgments

We acknowledge Shanghai Central Meteorological Observatory and Shanghai Water Authority for providing the data.

Conflicts of Interest

The authors declare no conflict of interest.

References

  1. Liang, P.; Ding, Y. The Long-Term Variation of Extreme Heavy Precipitation and Its Link to Urbanization Effects in Shanghai during 1916–2014. Adv. Atmos. Sci. 2017, 34, 321–334. [Google Scholar] [CrossRef]
  2. Wang, X.; Yin, Z.; Wang, X.; Tian, P.; Huang, Y. A Study on Flooding Scenario Simulation of Future Extreme Precipitation in Shanghai. Front. Earth Sci. 2018, 12, 834–845. [Google Scholar] [CrossRef]
  3. Zhang, H.; Yang, Z.; Cai, Y.; Qiu, J.; Huang, B. Impacts of Climate Change on Urban Drainage Systems by Future Short-Duration Design Rainstorms. Water 2021, 13, 2718. [Google Scholar] [CrossRef]
  4. Yu, H.; Zhao, Y.; Fu, Y.; Li, L. Spatiotemporal Variance Assessment of Urban Rainstorm Waterlogging Affected by Impervious Surface Expansion: A Case Study of Guangzhou, China. Sustainability 2018, 10, 3761. [Google Scholar] [CrossRef] [Green Version]
  5. Quan, R.; Liu, M.; Lu, M.; Zhang, L.; Wang, J.; Xu, S. Waterlogging Risk Assessment Based on Land Use/Cover Change: A Case Study in Pudong New Area, Shanghai. Environ. Earth Sci. 2010, 61, 1113–1121. [Google Scholar] [CrossRef]
  6. Billot, R.; Faouzi, N.; Sau, J.; De Vuyst, F. Integrating the Impact of Rain into Traffic Management: Online Traffic State Estimation Using Sequential Monte Carlo Techniques. Transp. Res. Rec. 2010, 2169, 141–149. [Google Scholar] [CrossRef] [Green Version]
  7. Tran, D.; Xu, D.; Dang, V.; Alwah, A.A.Q. Predicting Urban Waterlogging Risks by Regression Models and Internet Open-Data Sources. Water 2020, 12, 879. [Google Scholar] [CrossRef] [Green Version]
  8. Islam, M.R.; Raja, D.R. Waterlogging Risk Assessment: An Undervalued Disaster Risk in Coastal Urban Community of Chattogram, Bangladesh. Earth 2021, 2, 151–173. [Google Scholar] [CrossRef]
  9. Zhang, Q.; Wu, Z.; Zhang, H.; Dalla Fontana, G.; Tarolli, P. Identifying Dominant Factors of Waterlogging Events in Metropolitan Coastal Cities: The Case Study of Guangzhou, China. J. Environ. Manag. 2020, 271, 110951. [Google Scholar] [CrossRef]
  10. Liang, Y.; Wang, Y.; Zhao, Y.; Lu, Y.; Liu, X. Analysis and Projection of Flood Hazards over China. Water 2019, 11, 1022. [Google Scholar] [CrossRef]
  11. Han, J.; Baik, J.; Lee, H. Urban Impacts on Precipitation. Asia-Pac. J. Atmos. Sci. 2014, 50, 17–30. [Google Scholar] [CrossRef]
  12. Lau, W.; Kim, K.; Ruby Leung, L. Changing Circulation Structure and Precipitation Characteristics in Asian Monsoon Regions: Greenhouse Warming vs. Aerosol Effects. Geosci. Lett. 2017, 4, 28. [Google Scholar] [CrossRef] [PubMed]
  13. Tian, J.; Zhang, Z.; Ahmed, Z.; Zhang, L.; Su, B.; Tao, H.; Jiang, T. Projections of precipitation over China based on CMIP6 models. Stoch. Environ. Res. Risk Assess. 2021, 35, 831–848. [Google Scholar] [CrossRef]
  14. Xu, S.; Wang, J.; Shi, C.; Yan, J. Research of the Natural Disaster Risk on Coastal Cities. Acta Geogr. Sin. 2016, 61, 127–138. [Google Scholar] [CrossRef]
  15. Hu, H. Spatiotemporal Characteristics of Rainstorm-Induced Hazards Modified by Urbanization in Beijing. J. Appl. Meteorol. Climatol. 2015, 54, 1496–1509. [Google Scholar] [CrossRef]
  16. Shi, J.; Cui, L. Characteristics of High Impact Weather and Meteorological Disaster in Shanghai, China. Nat. Hazards 2012, 60, 951–969. [Google Scholar] [CrossRef]
  17. Wu, X.; Yu, D.; Chen, Z.; Wilby, R.L. An Evaluation of the Impacts of Land Surface Modification, Storm Sewer Development, and Rainfall Variation on Waterlogging Risk in Shanghai. Nat. Hazards 2012, 63, 305–323. [Google Scholar] [CrossRef]
  18. Liu, Y.; Liu, Y.; Zheng, J.; Chai, F.; Ren, H. Intelligent Prediction Method for Waterlogging Risk Based on AI and Numerical Model. Water 2022, 14, 2282. [Google Scholar] [CrossRef]
  19. Ma, B.; Wu, Z.; Wang, H.; Guo, Y. Study on the Classification of Urban Waterlogging Rainstorms and Rainfall Thresholds in Cities Lacking Actual Data. Water 2020, 12, 3328. [Google Scholar] [CrossRef]
  20. Liu, F.; Liu, X.; Xu, T.; Yang, G.; Zhao, Y. Driving Factors and Risk Assessment of Rainstorm Waterlogging in Urban Agglomeration Areas: A Case Study of the Guangdong-Hong Kong-Macao Greater Bay Area, China. Water 2021, 13, 770. [Google Scholar] [CrossRef]
  21. Yang, Y.; Pan, C.; Fan, G.; Tian, M.; Wang, J. A New Urban Waterlogging Simulation Method Based on Multi-Factor Correlation. Water 2022, 14, 1421. [Google Scholar] [CrossRef]
  22. Chen, Z.; Li, K.; Du, J.; Chen, Y.; Liu, R.; Wang, Y. Three-Dimensional Simulation of Regional Urban Waterlogging Based on High-Precision DEM Model. Nat. Hazards 2021, 108, 2653–2677. [Google Scholar] [CrossRef]
  23. Liu, J.; Shao, W.; Xiang, C.; Mei, C.; Li, Z. Uncertainties of Urban Flood Modeling: Influence of Parameters for Different Underlying Surfaces. Environ. Res. 2020, 182, 108929. [Google Scholar] [CrossRef] [PubMed]
  24. Jiang, W.; Yu, J. Impact of Rainstorm Patterns on the Urban Flood Process Superimposed by Flash Floods and Urban Waterlogging Based on a Coupled Hydrologic–Hydraulic Model: A Case Study in a Coastal Mountainous River Basin within Southeastern China. Nat. Hazards 2022, 112, 301–326. [Google Scholar] [CrossRef]
  25. Wu, J.; Sha, W.; Zhang, P.; Wang, Z. The Spatial Non-Stationary Effect of Urban Landscape Pattern on Urban Waterlogging: A Case Study of Shenzhen City. Sci. Rep. 2020, 10, 7369. [Google Scholar] [CrossRef] [PubMed]
  26. Fletcher, T.; Andrieu, H.; Hamel, P. Understanding, Management and Modelling of Urban Hydrology and Its Consequences for Receiving Waters: A State of the Art. Adv. Water Resour. 2013, 51, 261–279. [Google Scholar] [CrossRef]
  27. Su, B.; Huang, H.; Li, Y. Integrated Simulation Method for Waterlogging and Traffic Congestion under Urban Rainstorms. Nat. Hazards 2016, 81, 23–40. [Google Scholar] [CrossRef]
  28. Kong, F.; Sun, S.; Lei, T. Understanding China’s Urban Rainstorm Waterlogging and Its Potential Governance. Water 2021, 13, 891. [Google Scholar] [CrossRef]
  29. Gu, L.; Zhao, K.; Zhang, S.; Zheng, X. An AMSR-E Data Unmixing Method for Monitoring Flood and Waterlogging Disaster. Chin. Geogr. Sci. 2011, 21, 666–675. [Google Scholar] [CrossRef]
  30. Zhang, S.; Pan, B. An Urban Storm-Inundation Simulation Method Based on GIS. J. Hydrol. 2014, 517, 260–268. [Google Scholar] [CrossRef]
  31. Cheng, S.; Wang, R. An Approach for Evaluating the Hydrological Effects of Urbanization and Its Application. Hydrol. Process. 2002, 16, 1403–1418. [Google Scholar] [CrossRef]
  32. Liu, P.; Wei, Q.; Lin, Z.; Lv, W. Optimized Schemes of “Infiltration”, “Storage”, and “Drainage” Measures against Urban Waterlogging in Plain River Network Regions. Water 2022, 14, 1381. [Google Scholar] [CrossRef]
  33. Yin, J.; Zhang, Q. A Comparison of Statistical Methods for Benchmarking the Threshold of Daily Precipitation Extremes in the Shanghai Metropolitan Area during 1981–2010. Theor. Appl. Climatol. 2015, 120, 601–607. [Google Scholar] [CrossRef]
  34. Shen, S.; Xu, Y. Numerical Evaluation of Land Subsidence Induced by Groundwater Pumping in Shanghai. Can. Geotech. J. 2011, 48, 1378–1392. [Google Scholar] [CrossRef]
  35. Wu, M.; Wu, Z.; Ge, W.; Wang, H.; Shen, Y.; Jiang, M. Identification of Sensitivity Indicators of Urban Rainstorm Flood Disasters: A Case Study in China. J. Hydrol. 2021, 599, 126393. [Google Scholar] [CrossRef]
  36. Singh, S.K.; Pandey, A.C.; Rathore, V.S.; Nathawat, M.S. Evaluating Factors Responsible for Contrasting Signature of Wasteland Development in Northern and Southern Ganga Plains (Bihar State, India) with Focus on Waterlogging. Arab. J. Geosci. 2014, 7, 4175–4190. [Google Scholar] [CrossRef]
  37. Shi, Y.; Shi, C.; Xu, S.; Sun, A.; Wang, J. Exposure Assessment of Rainstorm Waterlogging on Old-Style Residences in Shanghai Based on Scenario Simulation. Nat. Hazards 2010, 53, 259–272. [Google Scholar] [CrossRef]
  38. Lin, T.; Liu, X.; Song, J.; Zhang, G.; Jia, Y.; Tu, Z.; Zheng, Z.; Liu, C. Urban Waterlogging Risk Assessment Based on Internet Open Data: A Case Study in China. Habitat Int. 2018, 71, 88–96. [Google Scholar] [CrossRef]
  39. Mengjiang, W. Shanghai Flood Control Work Manual; Fudan University Press: Shanghai, China, 2018; pp. 484–486. [Google Scholar]
  40. Zhao, K.; Xue, M. Assimilation of Coastal Doppler Radar Data with the ARPS 3DVAR and Cloud Analysis for the Prediction of Hurricane Ike (2008). Geophys. Res. Lett. 2009, 36, L12803. [Google Scholar] [CrossRef] [Green Version]
  41. Xue, M.; Droegemeier, K.; Wong, V. The Advanced Regional Prediction System (ARPS)—A multi-scale nonhydrostatic atmospheric simulation and prediction model. Part I: Model dynamics and verification. Meteorol. Atmos Phys. 2000, 75, 161–193. [Google Scholar] [CrossRef]
  42. Powers, J.G.; Klemp, J.B.; Skamarock, W.C.; Davis, C.A.; Dudhia, J.; Gill, D.O.; Coen, J.L.; Gochis, D.J.; Ahmadov, R.; Peckham, S.E.; et al. The Weather Research and Forecasting Model: Overview, System Efforts, and Future Directions. Am. Meteorol. Soc. 2017, 98, 1717–1737. [Google Scholar] [CrossRef]
  43. Hong, S.; Dudhia, J.; Chen, S. A Revised Approach to Ice Microphysical Processes for the Bulk Parameterization of Clouds and Precipitation. Mon. Wea. Rev. 2004, 132, 103–120. [Google Scholar] [CrossRef]
  44. Li, J.; Chen, B.; Huang, W.; Zhang, X. Cloud Physics Initialization for Convection-Scale NWP: Scheme Improvements and ACase Study. Acta Meteor. Sinica. 2017, 75, 771–783. [Google Scholar] [CrossRef]
  45. Srivastava, K.; Bhardwaj, R. Assimilation of Doppler Weather Radar Data in WRF Model for Simulation of Tropical Cyclone Aila. Pure Appl. Geophys. 2014, 171, 2043–2072. [Google Scholar] [CrossRef]
  46. Martínez, C.; Sanchez, A.; Toloh, B.; Vojinovic, Z. Multi-Objective Evaluation of Urban Drainage Networks Using a 1D/2D Flood Inundation Model. Water Resour. Manag. 2018, 32, 4329–4343. [Google Scholar] [CrossRef]
  47. Seyedashraf, O.; Bottacin-Busolin, A.; Harou, J.J. Many-Objective Optimization of Sustainable Drainage Systems in Urban Areas with Different Surface Slopes. Water Resour. Manag. 2021, 35, 2449–2464. [Google Scholar] [CrossRef]
  48. Liu, J.; Shao, W. Simulation of Rainfall Runoff in Urban Districts. J. Hydraul. Eng. 2006, 37, 184–188. [Google Scholar] [CrossRef]
  49. Sisay, E.; Halefom, A.; Khare, D.; Singh, L.; Worku, T. Hydrological Modelling of Ungauged Urban Watershed Using SWAT Model. Model. Earth Syst. Environ. 2017, 3, 693–702. [Google Scholar] [CrossRef]
  50. Yan, X.; Xu, K.; Feng, W.; Chen, J. A Rapid Prediction Model of Urban Flood Inundation in a High-Risk Area Coupling Machine Learning and Numerical Simulation Approaches. Int. J. Disaster Risk Sci. 2021, 12, 903–918. [Google Scholar] [CrossRef]
Figure 1. (a,b) Shanghai and the study area.
Water 14 03780 g001
Figure 2. Waterlogging Depth Model, Risk Model and evaluation in city concerns: flow chart.
Water 14 03780 g002
Figure 3. Drainage area zoning and their drainage mode in Shanghai.
Water 14 03780 g003
Figure 4. The distribution of AWSs in Shanghai (The small circles represent the AWSs).
Water 14 03780 g004
Figure 5. Average, maximum and minimum waterlogging depth model for four categories of areas. (a) for area I; (b) for area II; (c) for area III; (d) for area IV.
Water 14 03780 g005
Figure 6. Rain and waterlogging risk evaluation on 4 August 2011. (a) for NWP rainfall in the central city; (b) for predicted waterlogging risk.
Water 14 03780 g006
Figure 7. Rain, waterlogging risk prediction and drainage practice area on 11 July 2011. (a) for rainfall in the central city; (b) for predicted waterlogging risk; (c) for TianLin pumping station and its pipeline control blocks.
Water 14 03780 g007
Table 1. Drainage information of different areas related with the central city of Shanghai.
Zoning NameArea (km2)River or Lake Area (km2)Water Gate NumberPeripheral Pump Station Discharge (m3/s)
Jiabaobei698.854.63459.0
Yunnan173.47.621300.0
Dianbei179.38.827193.6
Diannan186.814.31428.0
Pudong1976.6151.14090.0
Table 2. The waterlogging risk ranks in Shanghai.
RanksWaterlogging DepthRiskColour
10 cm < depth ≤ 15 cmslightlight blue
215 cm < depth ≤ 30 cmlowblue
330 cm < depth ≤ 45 cmmoderateyellow
445 cm < depth ≤ 60 cmhighorange
560 cm < depthseverered
Table 3. Comparison of predicted and observed waterlogging risk.
DateSitesObserved Waterlogging RiskPredicted Waterlogging Risk
17 June 2011Wuzhong Road, the Central city33
Outer Ring Road32
Yishan Road, Xuhui11
31 July 2011The Orient Sports Center, Pudong10
3 August 2011Puxi Road, Xuhui32
Wujiaochang, Yangpu11
Gaoqiao, Pudong22
4 August 2011Xinzhuang, Minhang33
Wuzhong Road44
Xianxia Road44
Middle Ring Road22
12 August 2011Beixinjing, Changning33
Wujiaochang, Yangpu44
Huanghe Road, Huangpu44
13 August 2011The whole central city11
Publisher’s Note: MDPI stays neutral with regard to jurisdictional claims in published maps and institutional affiliations.

