Article

Analysis of the Evolution Pattern and Driving Mechanism of Lakes in the Northern Ningxia Yellow Diversion Irrigation Area

1
Center for River and Lake Affairs of Ningxia, Yinchuan 750001, China
2
China Institute of Water Resources and Hydropower Research, Beijing 100038, China
3
Nanjing Hydraulic Research Institute, Nanjing 210029, China
*
Author to whom correspondence should be addressed.
Water 2022, 14(22), 3658; https://doi.org/10.3390/w14223658
Submission received: 13 October 2022 / Revised: 3 November 2022 / Accepted: 9 November 2022 / Published: 13 November 2022
(This article belongs to the Section Water, Agriculture and Aquaculture)

Abstract

:
In the northern part of the Ningxia Autonomous Region, there are rich lake resources, which are known as the “South of the Seas”. In recent years, the natural evolution of the water system and human activities have caused significant changes in the lake area. In order to fully understand the evolution of lakes in the northern Ningxia Yellow Irrigation Area, Landsat, Sentinel-2 images and ArcGIS were used to extract relevant information, and the cumulative distance level curve and Mann–Kendall trend analysis were used to analyze the trends of each driving factor in depth. The results showed that (1) the lake surface area in the northern Yellow Diversion Irrigation Area showed a significant increasing trend from 1986 to 2019. (2) The annual average temperature in the Ningxia Yellow River Irrigation Area has shown an increasing trend over the past 39 years, and no year has obvious cyclical changes, but in 1998, there was a sudden change in temperature and the temperature began to rise sharply; the annual average precipitation showed an increasing trend with a large variation, and the annual average precipitation from 1980 to 2018 showed a fluctuating increasing trend. (3) There is no significant linear pattern of runoff from upstream during 1986–2015, and it is characterized by fluctuating changes; the precipitation in the Yellow Irrigation Area is much lower than the average level in Ningxia, and it is classified as a typical arid area; the water consumption is all decreasing, but its linear trend is not significant; the most significant impact of the change in the substratum on the water surface is the construction of fields around the lake after 1990, followed by the Lake engineering treatment. (4) The water surface area of the mainstream is significantly and positively correlated with the incoming water from upstream, is significantly and negatively correlated with the area of grassland, and is significantly and positively correlated with the areas of arable land and construction land. The effect of land cover on the water surface area of the mainstream is lower than that on the water surface area other than the mainstream.

1. Introduction

Rivers and lakes are of great significance to the survival and development of human society [1,2]. They are an integral part of the natural water cycle and an important national resource [3,4]. They are also a reservoir of hydraulic resources. The evolution of lakes is closely related to human survival and development, and it has the functions of regulating river runoff, improving the ecological environment, providing water for agriculture and living, reproducing aquatic plants and animals and maintaining biodiversity and so on [4,5]. It plays an important role in maintaining the balance of the regional ecological environment and reducing flooding [5,6,7]. The traditional analysis of lake evolution is mainly conducted through the collection of long time series of historical data, together with long time series of meteorological, hydrological and water quality observations since modern times, plus the remote sensing monitoring of various sources after World War II to carry the study of lake evolution trend patterns either over thousands of years or for recent decades [8,9,10].
Since the reform and opening up, which has been the period of the fastest socioeconomic development in China, there has also been a period of unprecedented increase in the intensity of human activities and the destruction of ecological environments, and the implementation of ecological projects, such as the enclosure of lakes and fields, the return of farmland to grass and forests, and the implementation of water conservancy projects, such as channels and reservoirs, have all had drastic effects on the evolution of rivers and lakes in different historical stages [11]. This study analyzes the changes in the water surface and water cycle elements in the Yellow River Irrigation Area on the basis of historical data of the Ningxia lakes, meteorological and hydrological data collection and remote sensing interpretation to analyze the trend patterns and driving mechanisms of lake evolution in the Yellow River Irrigation Area in northern Ningxia, with a view to provide a reference for the effective protection and rational use of lakes in the whole region of Ningxia [12].

2. Materials and Methods

2.1. Overview of the Study Area

The Yellow Irrigation District in northern Ningxia is one of the four oldest irrigation districts in China, with an irrigation history of more than 2000 years [13]. It is the main grain-, cotton- and oil-producing area in Ningxia and one of the 12 commodity grain bases in China [14]. It is located on the upper reaches of the Yellow River between the two hydrological stations from Haheyan to Shizuishan, with a “J”-shaped distribution along both sides of the Yellow River [15]. It is 320 km long and 40 km wide from east to west, accounting for 25% of the total area of the region, with an irrigated area of 368,700 hm2. The irrigation area is crisscrossed with ditches and lakes [16]. According to records, by the time of the Republic of China, the Ningxia irrigation area was divided into the Hedong District, Hexi District and Zhongwei and Zhongning Districts located upstream of Qingtongxia. According to the information in 1936, there were nearly 3000 branch canals, with a total length of more than 1300 kilomiles of dry canals, irrigating a total of 18,000 hectares of fields. After the founding of New China, with the completion of the Qingtongxia hydro-junction in 1959, the irrigation area in Ningxia developed rapidly again [17]. The Ningxia irrigation area has a continental climate, with little rain, strong evaporation and large dryness [18]. Precipitation increases from the north to the south, varying from 170 to 800 mm, and varies dramatically from year to year, with a multi-year average of 293 mm. Precipitation is distributed unevenly throughout the year, mostly from July to September, with the rainfall from June to September accounting for about 70% of the total annual precipitation during the flood season. The annual surface evaporation capacity of the region is 1254 mm, 4.3 times the precipitation, and its trend of change is the opposite of the precipitation, decreasing from the north to the south with the range of change of 1600 mm~800 mm [19]. As the most densely populated and economically developed area in Ningxia, the water consumption in the Yellow River Irrigation Area accounts for more than 90% of the total water consumption in Ningxia, and the evolution of the rivers and lakes in the Yellow River Irrigation Area basically represents the evolution of the rivers and lakes in all of Ningxia. In terms of administrative division, the Yellow Diversion Irrigation District involves 14 districts and counties, among which the Hongsiabao District covers too small an area, while all the districts and counties in Yinchuan and Shizuishan are located there. The location map of the Ningxia Yellow Diversion and Irrigation District is shown in Figure 1.

2.2. Data Sources

The monitoring and extraction of lake information were mainly conducted through the collection of historical data and the application of 3S technology [20]. The extraction of the water surface information took into account the temporal and spatial resolution of remote sensing images, and Landsat and Sentinel-2 images were selected as the main data sources, and there was cooperation with China’s production of the environmental satellite 1A/B, a resource satellite and high-definition satellite, for auxiliary data for investigation [21,22,23]. The extraction of the river basins was mainly performed using the SWAT(Soil and Water Assessment Tool) model embedded in ArcGIS [24], and the extraction of the river basins and tributary sub-basins was based on the trimmed topographic data; the extraction of the river basins was mainly based on the nested ArcSWAT module in ArcGIS 10.5 [25]. Because the Ningxia Yellow River Irrigation Area is located in the plain, there is a big difference between the generated river network and the actual river network due to the inherent reason of the algorithm of the hydrological module and the accuracy of the topographic data when dividing the river basin, so the generated river network is made to overlap with the actual river network as much as possible by “trenching” the actual river network under the premise of knowing the actual river network. The extraction of the land cover around the river and lake was mainly completed by selecting the training samples through field sampling, using an object-oriented approach, classifying the land cover around the river and lake based on multi-temporal images, and carrying out the work using eCognition Developer 9.0 software [26].
Daily meteorological data (shared data on the website of the National Meteorological Administration) from 10 national meteorological stations throughout northern Ningxia were selected as data sources for studying climate change in the region, with annual series lengths from 1980 to 2018, as well as daily runoff from the two Yellow River hydrological stations in Ningxia (Haheyan and Shizuishan) and irrigation area water consumption (Ningxia Water Resources Bulletin), with annual series lengths from 1980–2018. The historical data were collected mainly by reviewing electronic literature and collecting textual information such as relevant canonical histories.

2.3. Research Methodology

In this study, the trends of the drivers were analyzed using cumulative distance level curves, and the annual series were linearly fitted and tested for spatial significance using Mann–Kendall trend analysis for precipitation, temperature, evapotranspiration, runoff and water consumption [27,28,29,30].
(1)
Cumulative distance level method
The cumulative distance level method is a conventional method to determine the trend of change visually from the curve, and the cumulative distance level of the sequence X at moment t is expressed as:
P a = i = 1 n ( X i 1 n i = 1 n X i )
where the cumulative distance level curve is characterized by significant up and down and is plotted with the cumulative distance level values at n moments, which can directly reflect the evolutionary trend on a long time series and also show the time points where abrupt changes occur.
(2)
Mann–Kendall trend analysis method
The Mann–Kendall trend test method is a non-parametric statistical test method that is widely used in meteorological and hydrological trend test studies. It includes the test of the sudden variability of climate factors, the analysis of precipitation trends and the analysis of runoff trends of hydrological stations. The trend test analysis process is as follows: the original hypothesis H0 indicates that the data samples of dataset X are independently distributed and no trend exists, then the hypothesis H1 indicates that there is a monotonic trend in dataset X. The Mann–Kendall statistical test method is expressed as follows:
S = i = 1 n 1 j = i + 1 n s g n ( x j x i )
where ,   s g n ( x j x i ) = { 1     x j x i > 0 0     x j x i = 0 1     x j x i < 0
where S is a test statistic obeying normal distribution with mean 0 and variance var(S) = n (n − 1) (2 n + 5)/18, and when n > 10, the standard normalization of S yields:
Z = { S 1 v a r ( S )     S > 0 0                           S = 0 S + 1 v a r ( S )     S < 0
In the bilateral trend test, when Z > 0, it means that the series has an upward trend; when Z < 0, it has a downward trend. For a given confidence level ɑ, if Z > Z1−a/2, it means that the time series has a significant trend, otherwise the trend is not significant; Z1−a/2 confidence levels of 90%, 95%, and 99% correspond to 1.65, 1.96, and 2.58, respectively.

3. Results and Analysis

3.1. Analysis of Spatial and Temporal Variation in Lake Water Surface Area

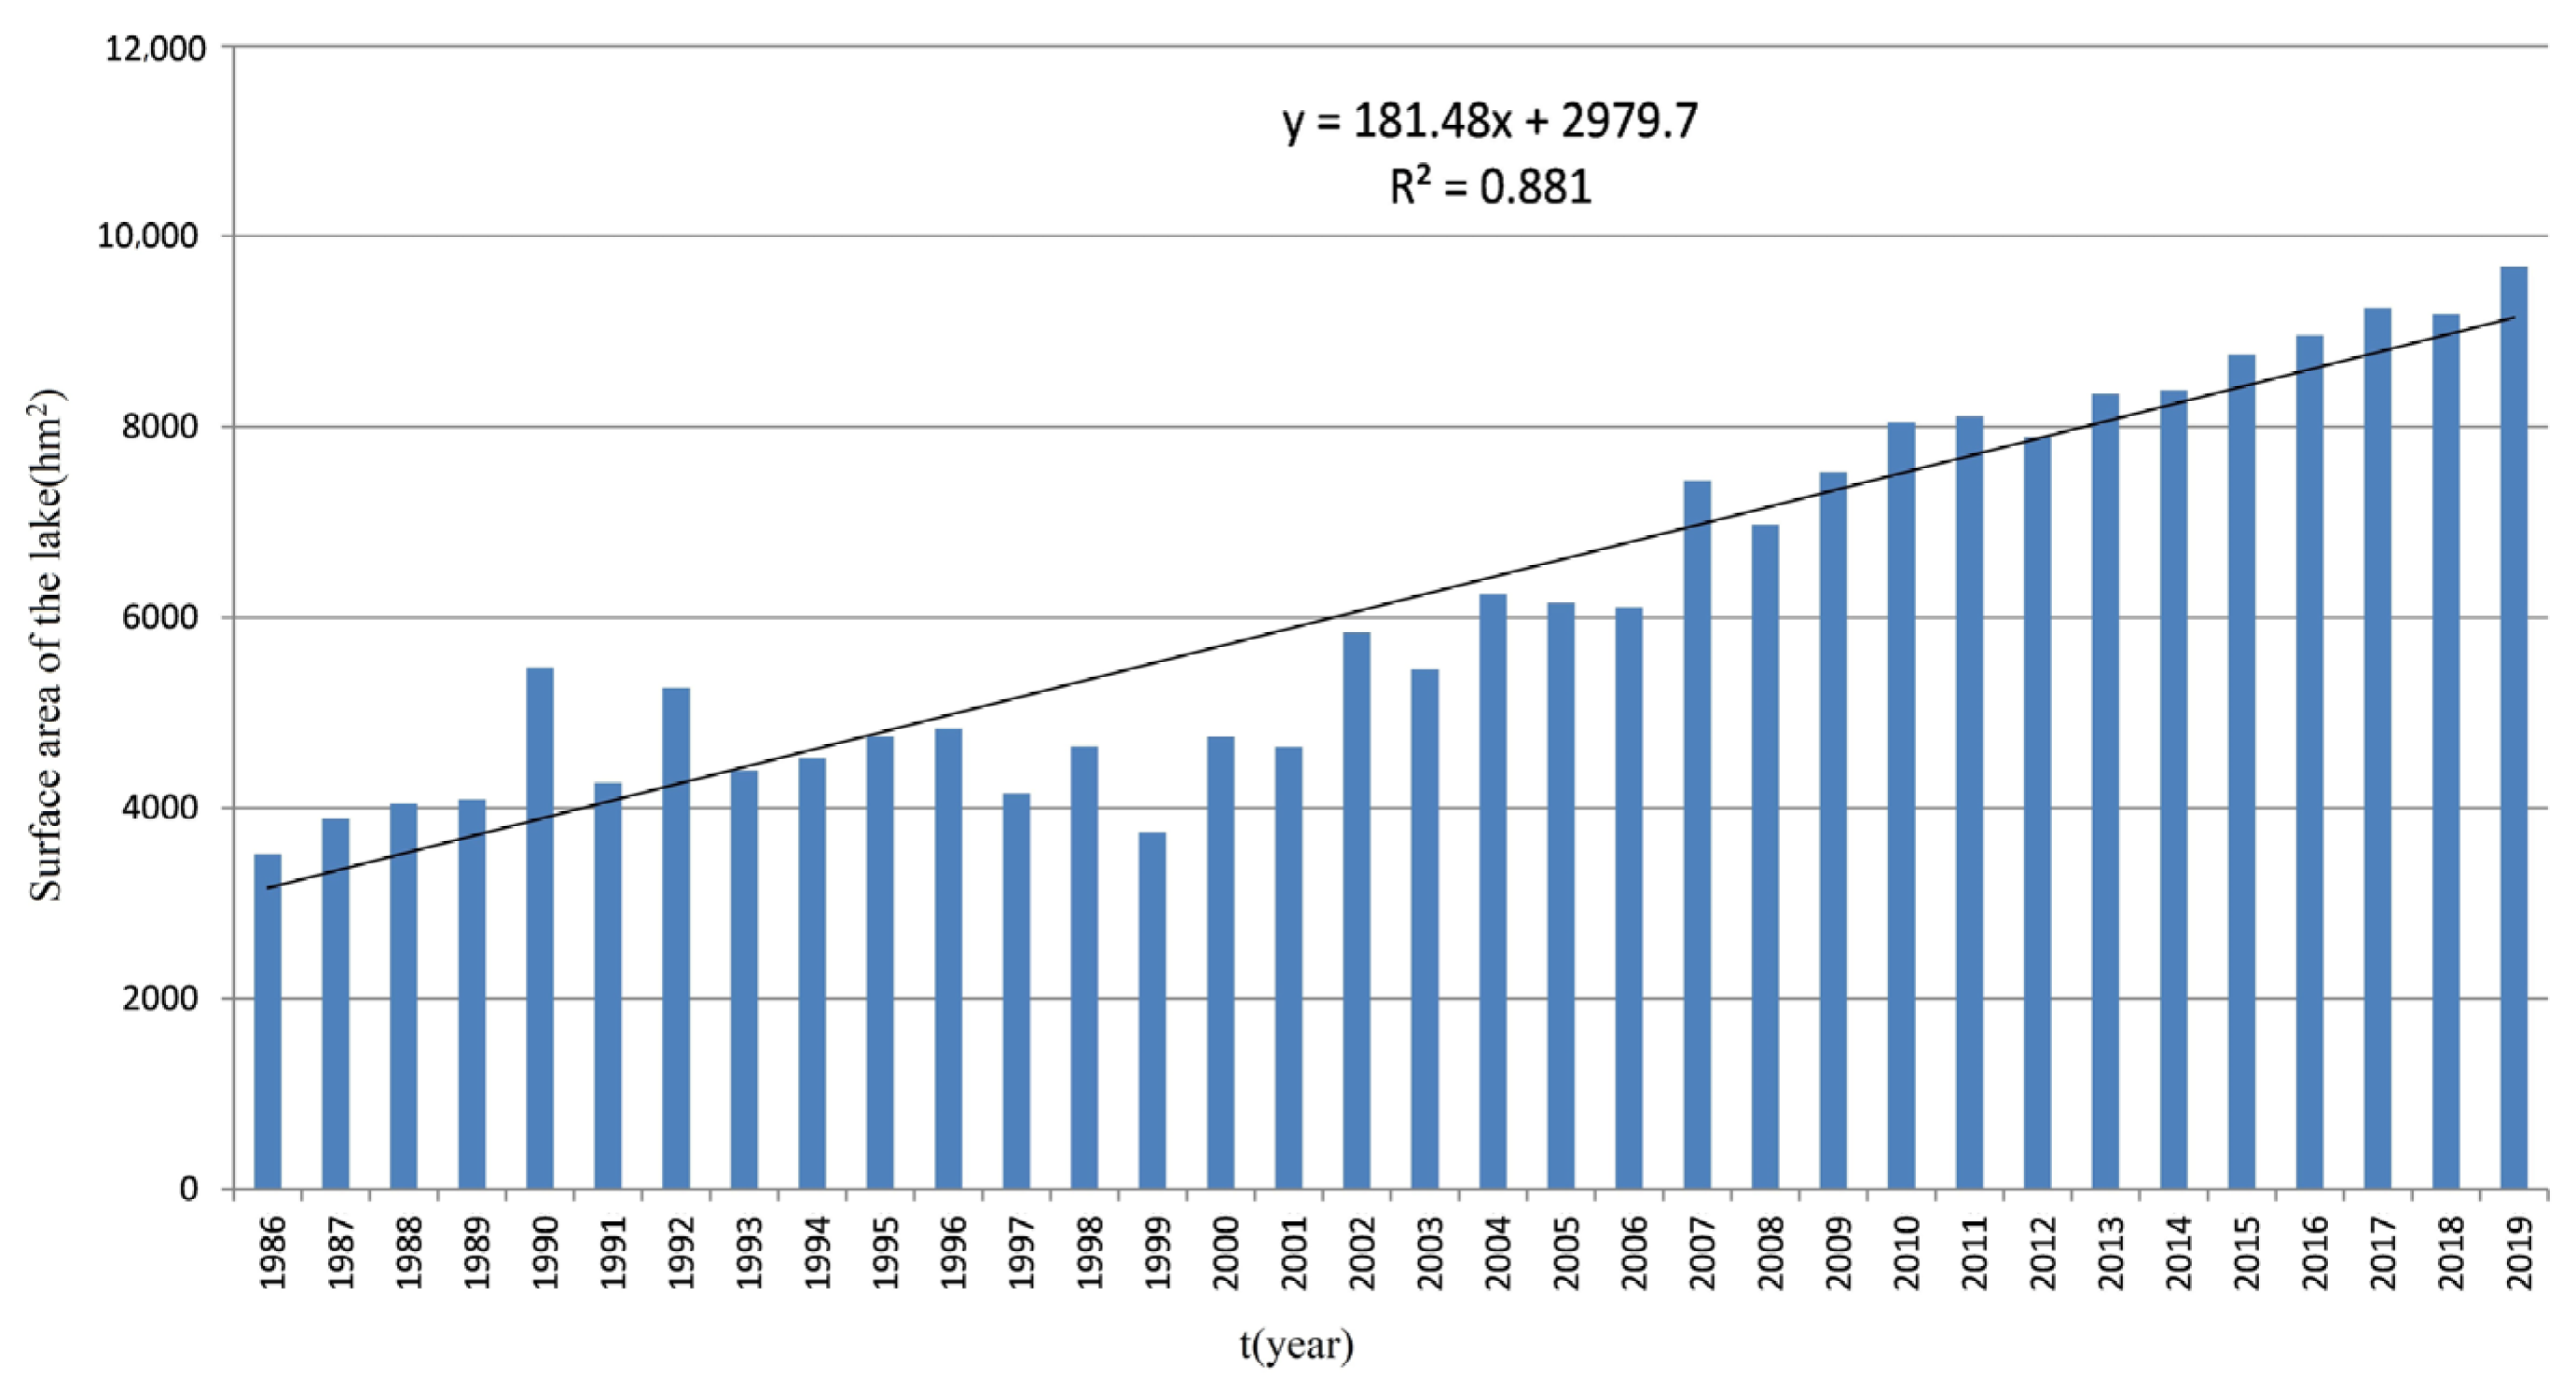
The statistics of the water surface area of 62 lakes in northern Ningxia (Figure 2) indicate that the lake water surface area shows a significant increasing trend from 1986–2019, and overall, since 1988, the lake water surface shows a significant increasing trend with a total area increase rate of 235 hm2/year. From the time interval, the water surface shows an increasing trend in the late 1980s, but in the 1990s, the lake water surface shows a fluctuating decreasing trend, while the growth rate of the lake water surface has significantly accelerated since the new century.
Three lakes with large water surface area in the northern Yellow-intake Irrigation Area were selected as representative lakes for individual analysis, namely Xinghai Lake, Sha Lake and Zhenshuo Lake.
Xinghai Lake is located in Dawukou District, Shizuishan City, and consists of six parts: east, south, west, north, middle, and the new domain, with a dry water level of 1088 m, a rich water level of 1091 m, a flat water level of 1090 m, an average water depth of 1.5 m and a maximum water depth of 4 m. The 2018 Yellow River water recharge was 21.94 million m3, the annual storage was 22 million m3, and the water quality was categorized as inferior category V. The water surface area of Xinghai Lake shows a significant growth trend, but after 2006, the water surface area shows a fluctuating change process and the area expansion stops. According to the results of remote sensing image analysis, the water surface in the northern part of Xinghai Lake increases significantly in 2004 while the overall water surface area increases significantly in 2007. The water surface area shown in the image from July 26, 2019, is significantly larger than that in 2004 and before, which is also reflected in the data of the water surface area change in different years and the construction effect of the Xinghai Lake wetland project that started in 2004.
Sha Lake is located in Pingluo County, Shizuishan City, Qianjin Farm, and is a permanent freshwater lake, where water recharge is comprehensive recharge, mainly comprising Tanglei canal recharge and the extraction of water recharge of three two branch ditches, with a dry water level of 1098 m, a rich water level of 1099.4 m, a maximum water depth of about 3 m, and an average water depth of 2.5 m. The 2018 Yellow River water recharge was 41.89 million m3, with an annual storage of 4793 m2, and the water quality is categorized as inferior category IV. Based on the changes in the water surface area of Shahu Lake and the overall water surface in the year of heavy rainfall in 2002, like the anomalous peak, the water surface area of Shahu Lake is significantly higher than before 2002, but the water surface area fluctuates and changes after 2002. The northeastern sandy area of Shahu Lake gradually transformed into a water surface after 2000, and the water surface area is basically stable after 2010, but the water surface area fluctuates in different years.
Zhenshuo Lake, also located in Pingluo County, mainly takes the flash floods from the area north of Daxifugou and south of Rujigou in the middle section of the eastern foothills of the Helan Mountain and the receding water from the West Trunk Canal and the Second Farm Canal, and it is lightly polluted, as the water source mainly comes from natural runoff and irrigation canals. The average water depth is 2.5 m, and the annual water storage capacity is about 20.5 million m3. In terms of the change trend of the water surface area of Zhenshuo Lake, Zhenshuo Lake is different from the above two lakes in that the lake area shows a significant decreasing trend in the 1990s, but the water surface increases significantly after 2000, and the water surface area shows fluctuating changes in the first 10 years of the 21st century, while the water surface still shows a significant increasing trend after 2010, which may be related to the fact that Zhenshuo Lake was in the construction period of the national wetland park during this period. As can be seen from the image map, the water surface of Zhenshuo Lake increases significantly in 2014.

3.2. Analysis of the Drivers of Lake Evolution

  • Temperature
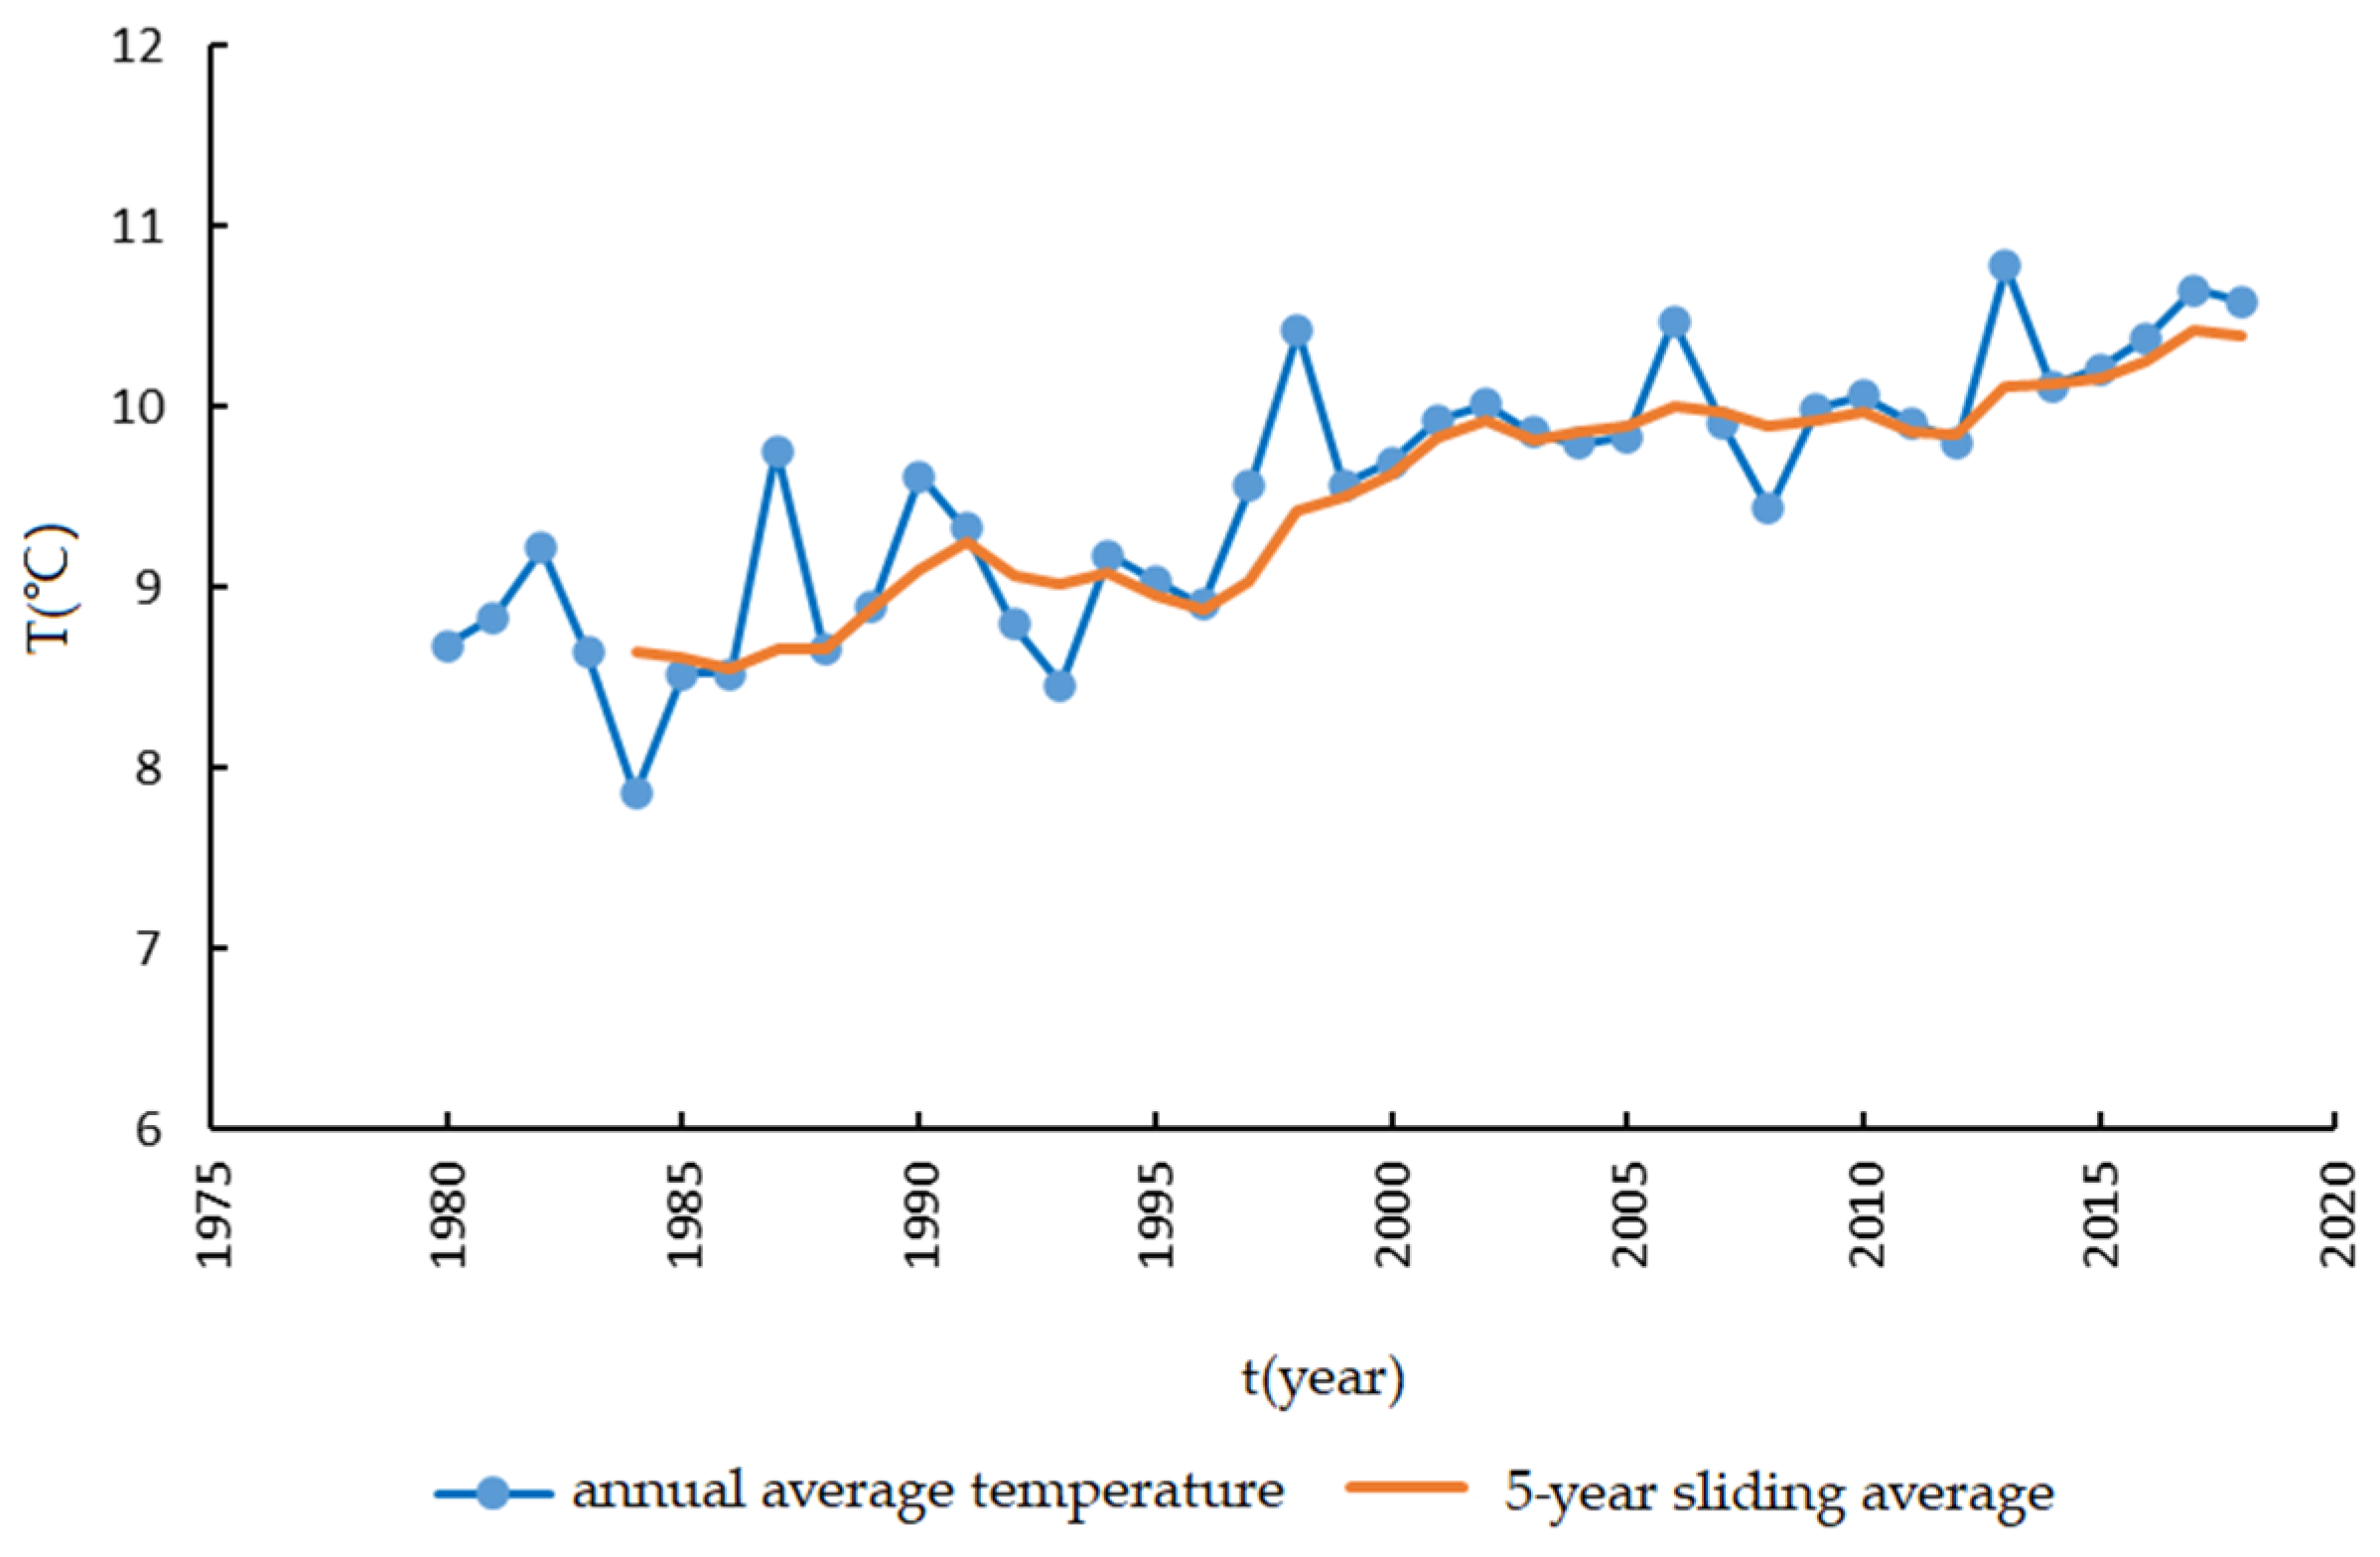
The annual average temperature series of 10 national meteorological stations in the Ningxia Diversion and Irrigation Area from 1980–2018 are shown in Figure 3. The annual average temperature in the Ningxia Diversion and Irrigation Area has shown an increasing trend over the past 39 years, with a multi-year average temperature of 9.6 °C in the northern region and a slow change in the annual average temperature. From the 5-year sliding average curve, it is concluded that there is no obvious cyclical change in the annual average temperature in the northern region for 39 years, with a brief decline in the annual average temperature between 1982 and 1984, followed by an increase to a brief decline again in 1987, an acceleration in the temperature rate from 1992–1998, and a brief decline in the annual average temperature between 2000 and 2003.
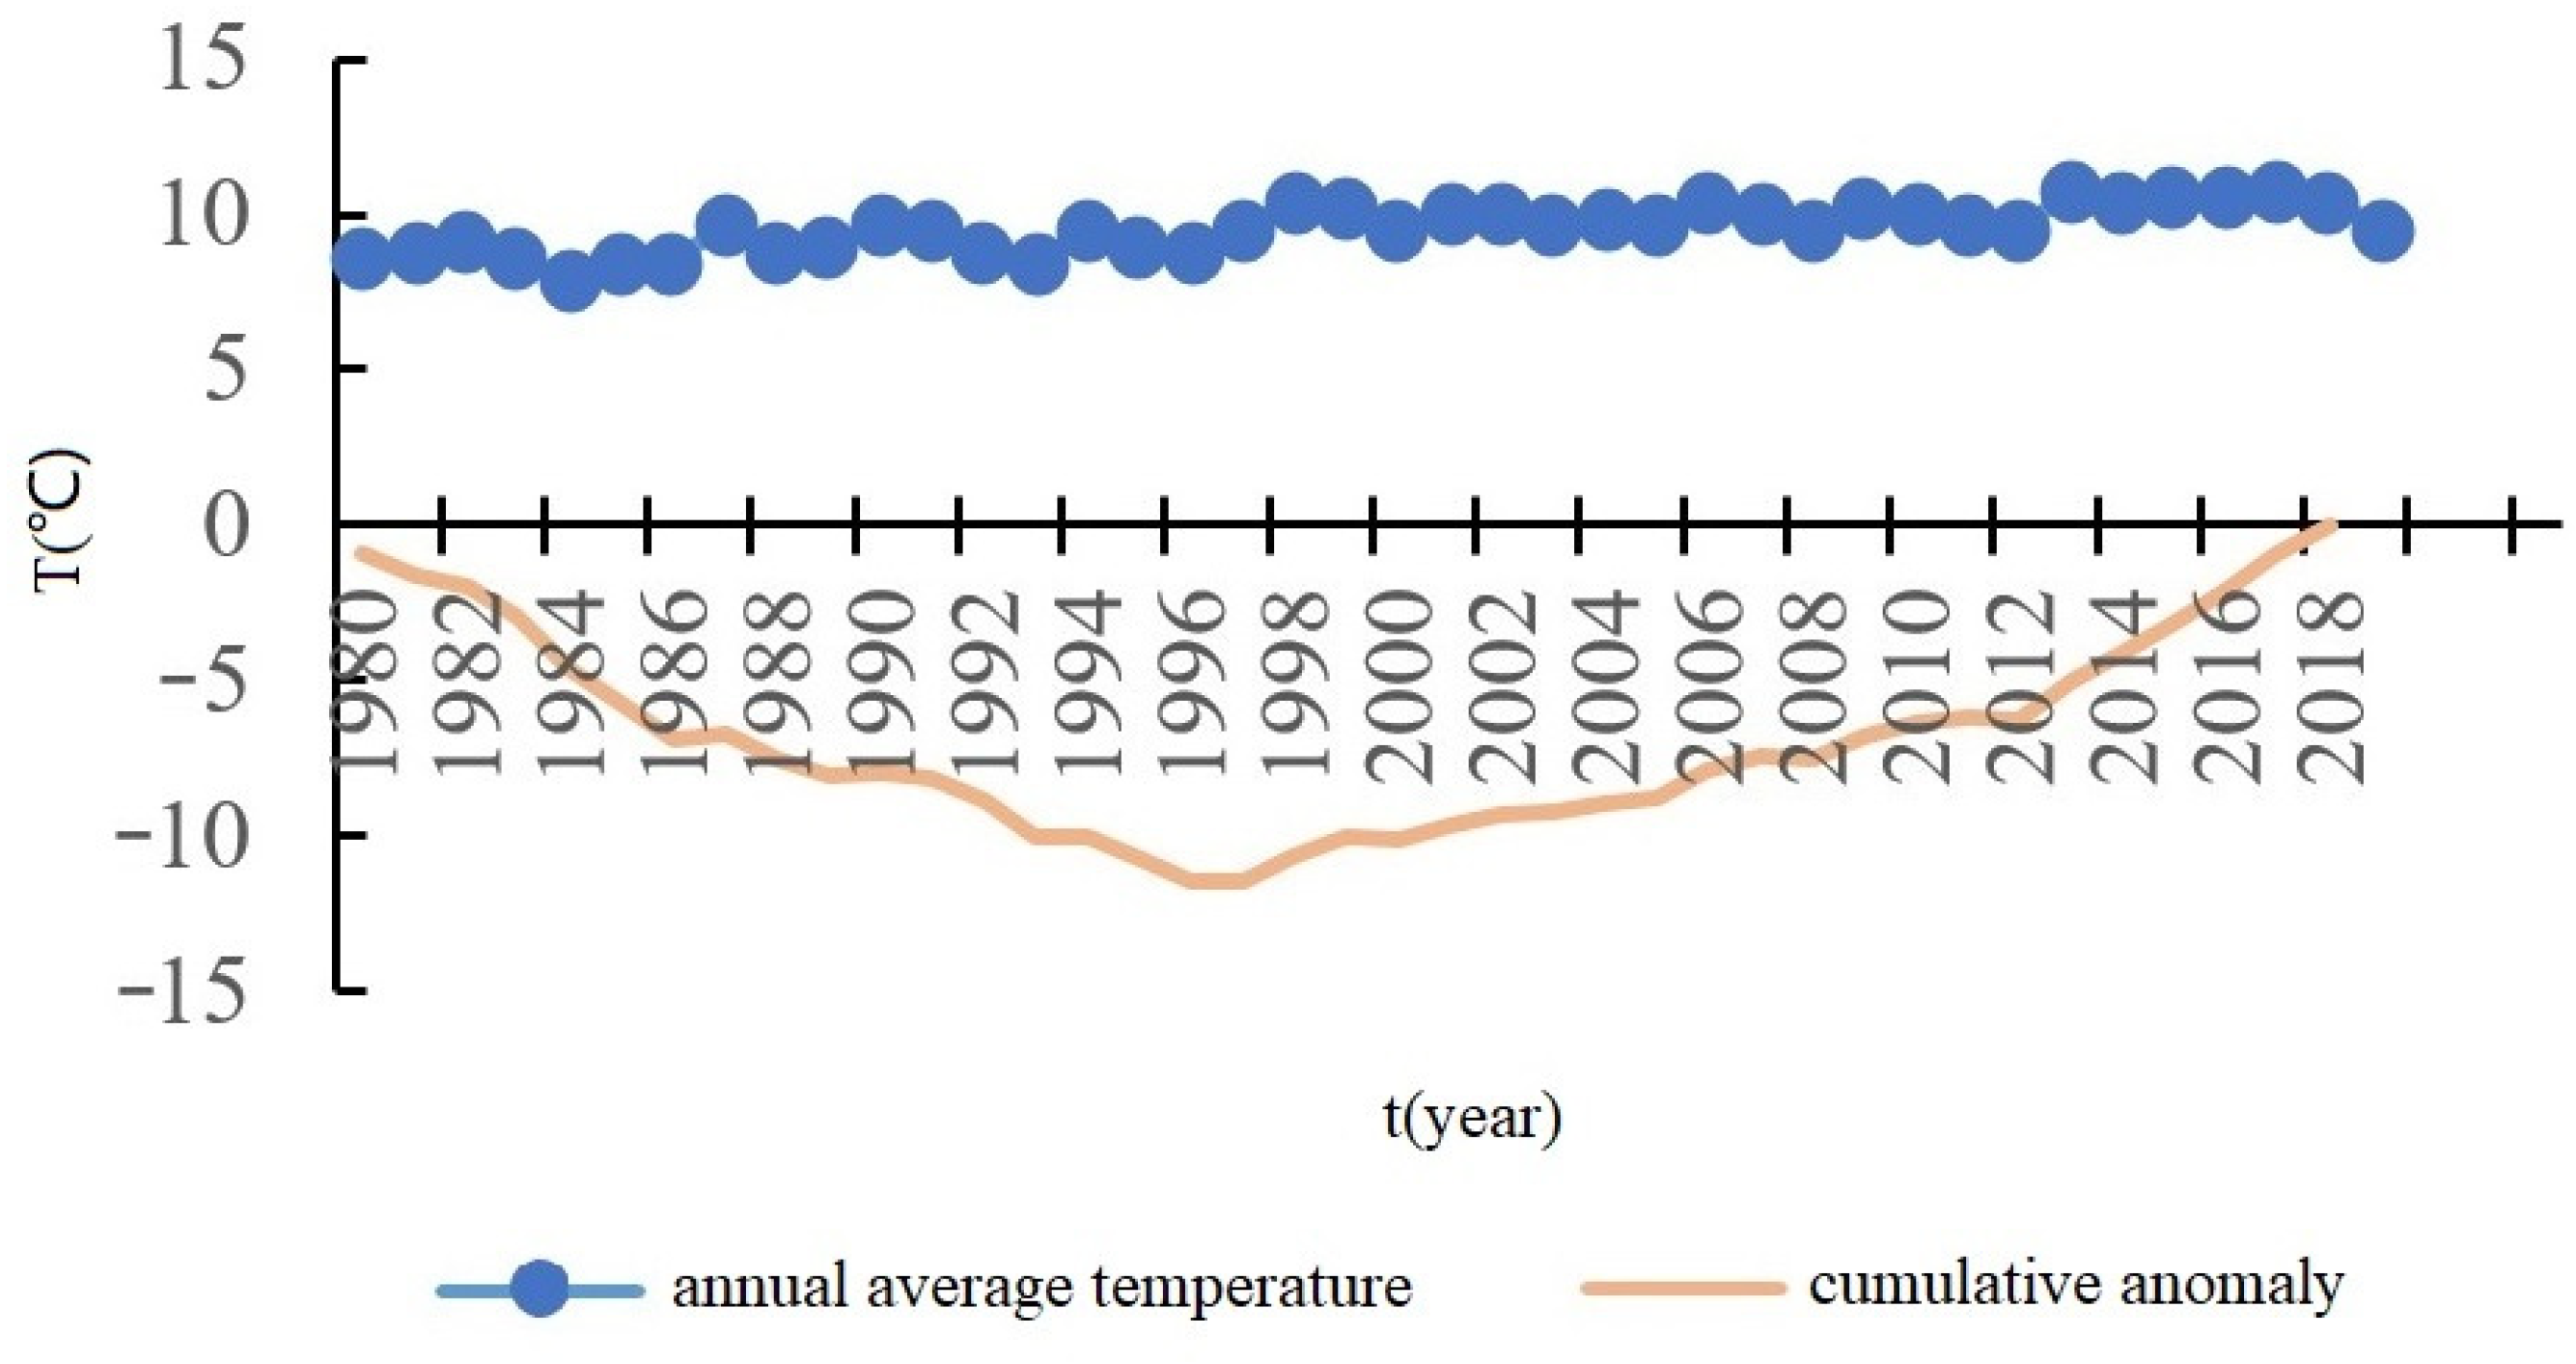
Figure 4 shows the average temperature and cumulative distance level of the northern Ningxia Yellow Diversion Irrigation Area. It can be seen that the annual average temperature of the northern Ningxia area from 1980 to 2018 shows a slow increasing trend. From the cumulative distance level curve of the annual average temperature in the northern Ningxia Yellow Diversion Irrigation Area, it can be seen that the positive distance level is dominant and the temperature increases sharply from 1998 onwards.
From Figure 5, it can be seen that the test statistic Z = 5.3347, calculated with the M–K test, passed the significance test (α = 0.05), and the trend of increasing mean temperature in the northern Ningxia Yellow Diversion Irrigation Area is obvious. From the M-K(Mann–Kendall) statistical curve of the average temperature, it can be seen that the curve UF and the curve UB intersect in 1997 (the UB and UF notations are standard elements of the Mann–Kendall statistics), and the intersection point lies within the critical line (+2) of the 99% significance level, so it can be judged that this average temperature had an abrupt change in 1997, which is consistent with the abrupt change in temperature and the beginning of warming in 1998 derived from the cumulative distance level method earlier, and the majority of the values on the UF curve are greater than 0. Its curve has exceeded the positive critical line (+2), indicating that the temperature series has a significant upward trend at the 99% confidence level.
  • Rainfall
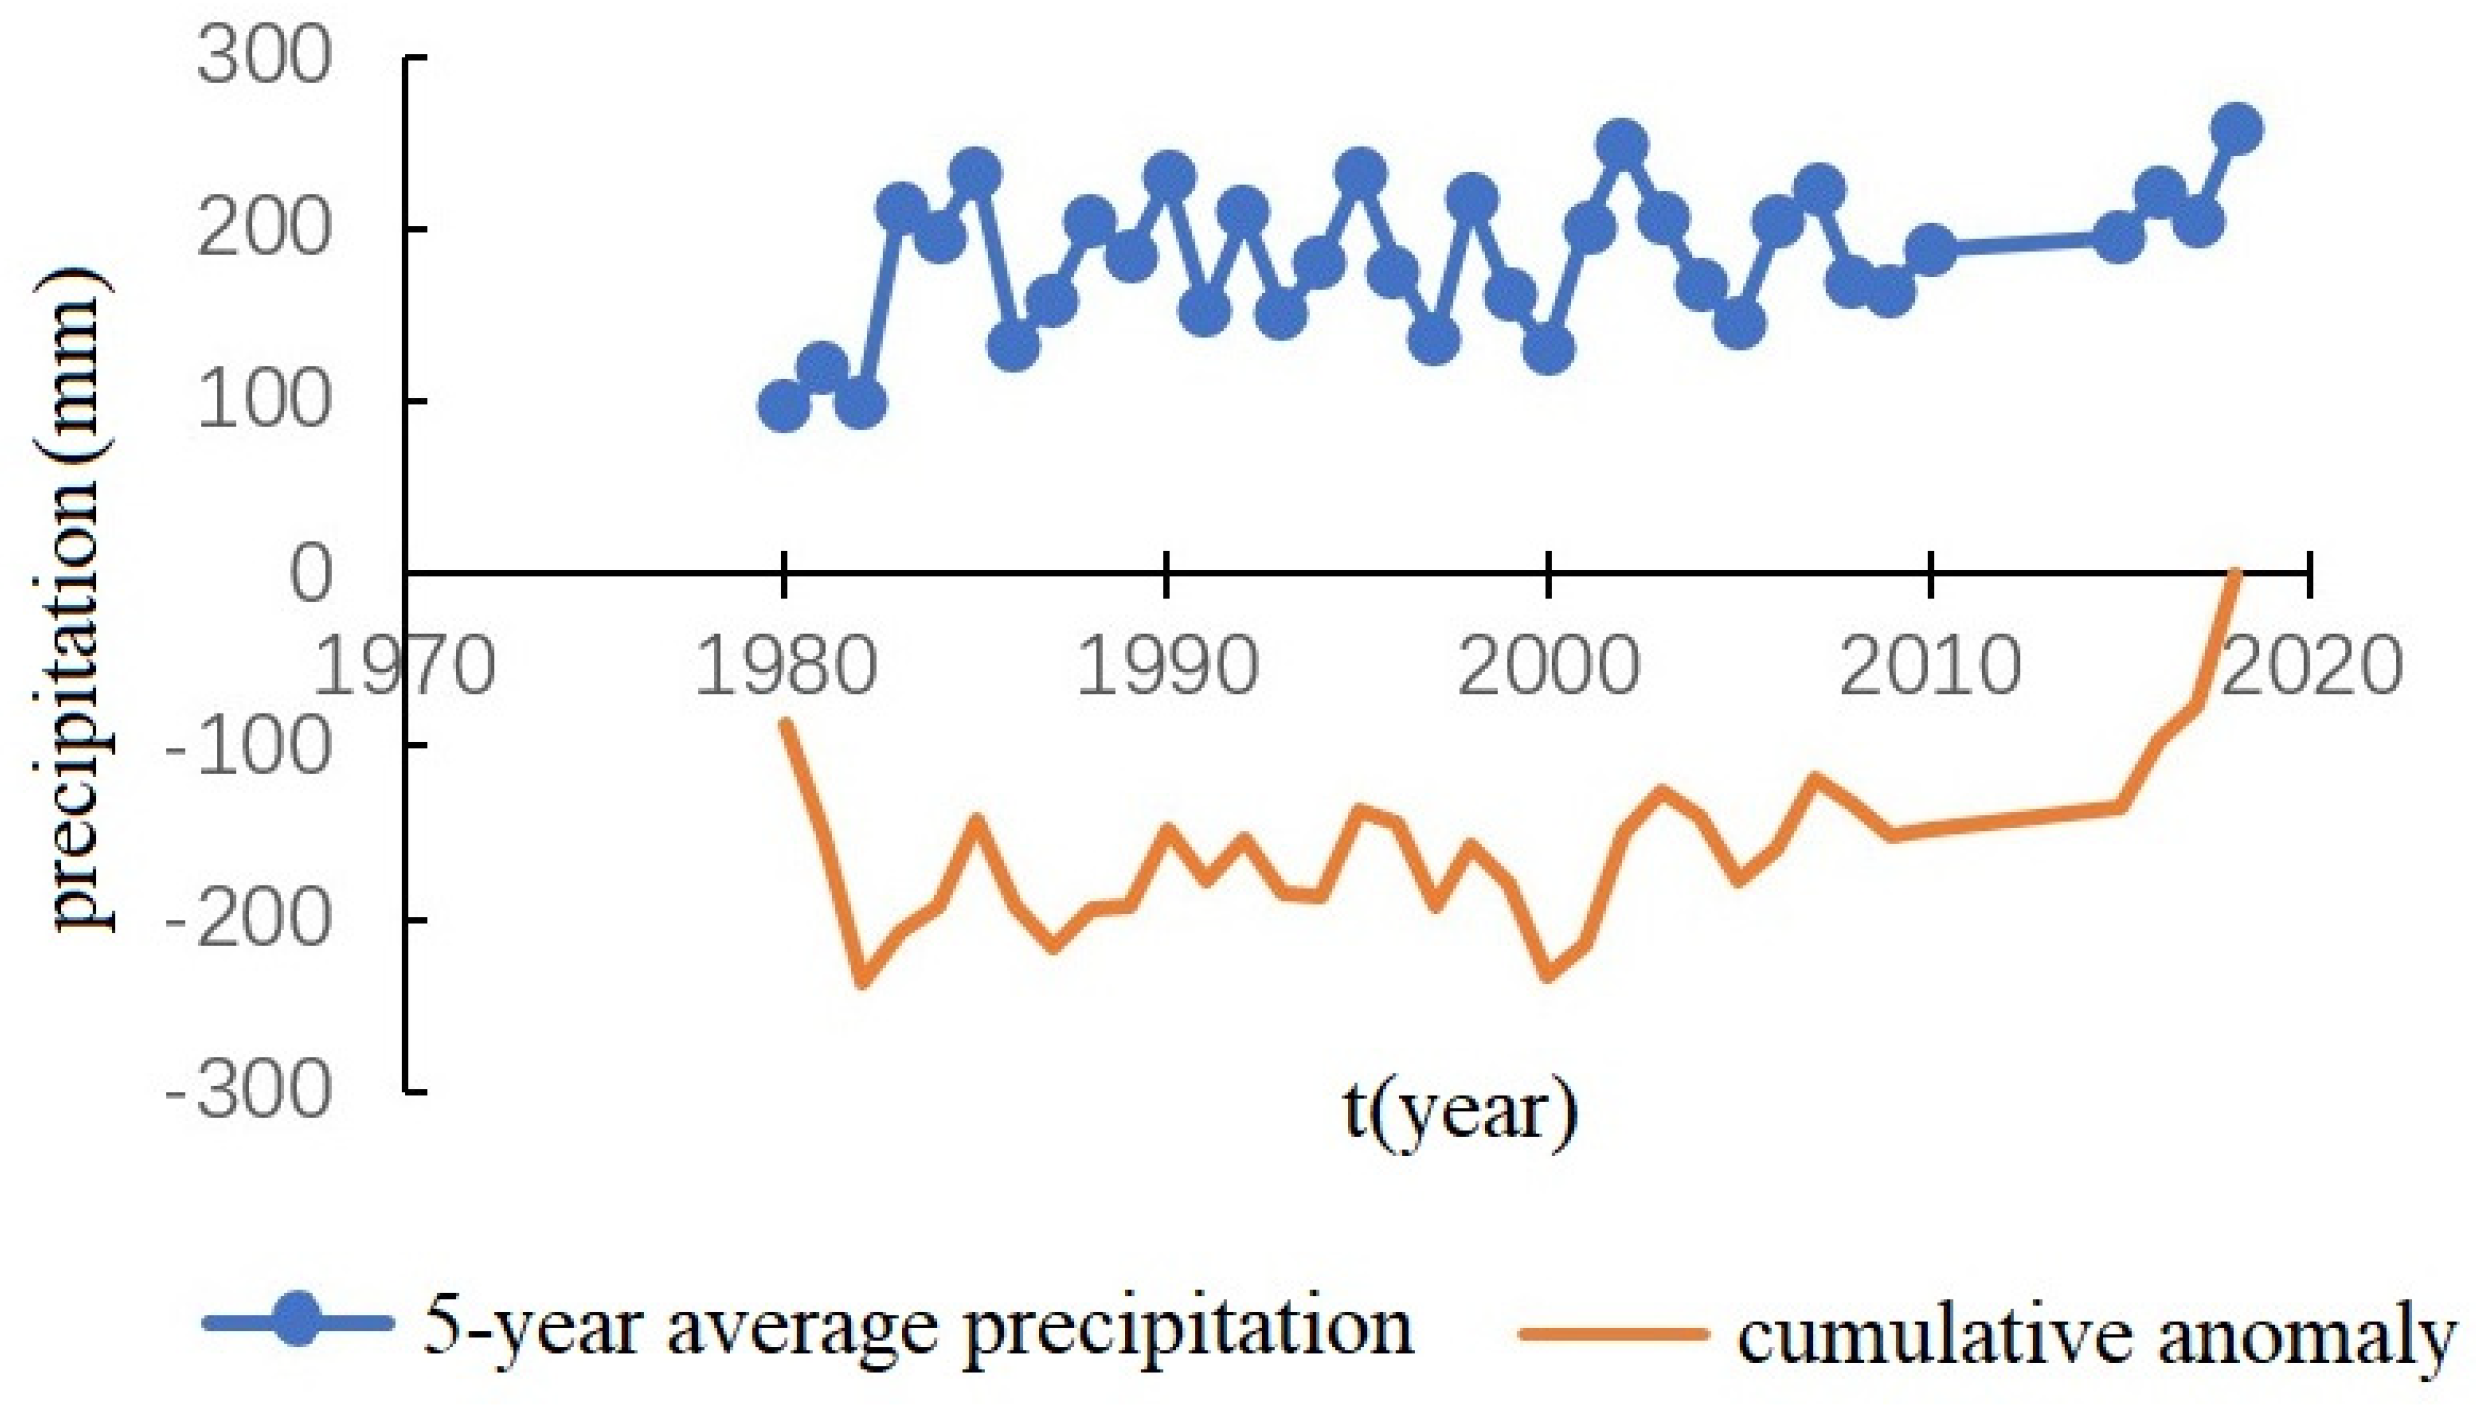
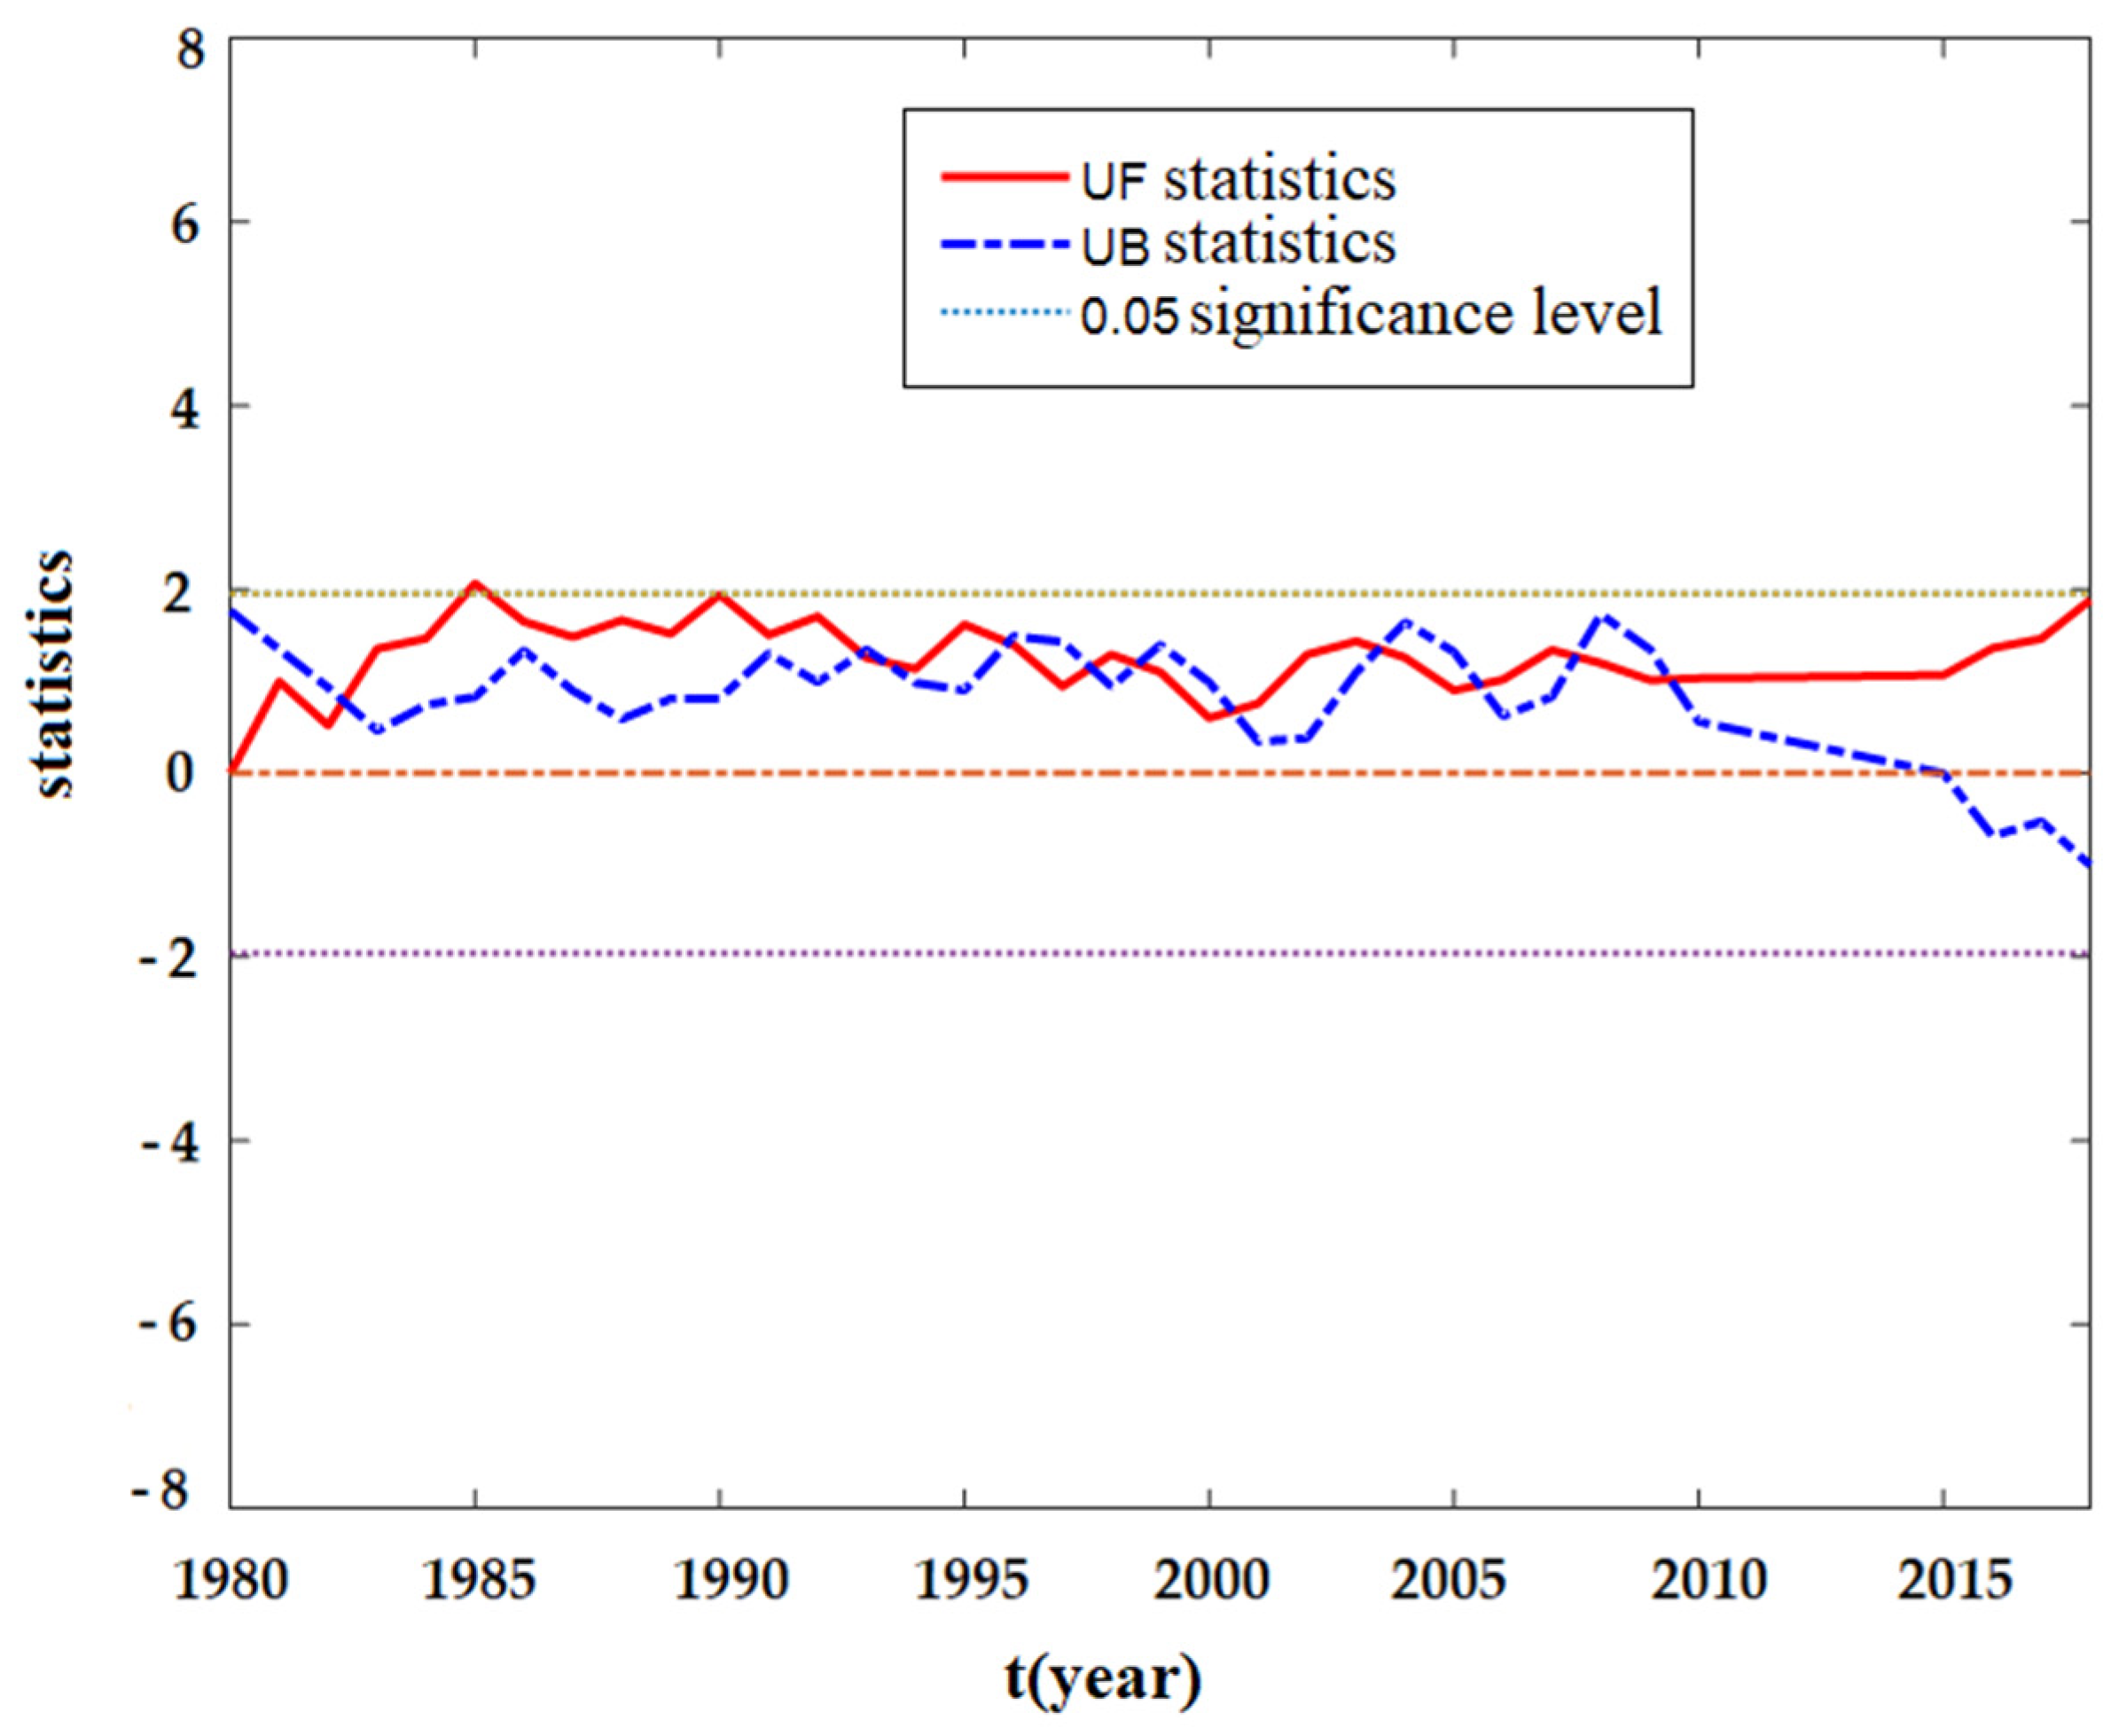
The annual average precipitation series (with no data for 2010–2015) of 10 national meteorological stations in the northern Ningxia Yellow Irrigation Area from 1980 to 2015 were calculated, and it was found that on the time scale, as shown in Figure 6, the annual average precipitation in the northern Ningxia Yellow Irrigation Area over the past 34 years shows an increasing trend, with a large change in the annual average precipitation from 259.08 mm to 96.4 mm and a multi-year average precipitation of 183.39 mm in the Irrigation Area. From the 5-year sliding average curve, it can be seen that there is no obvious cyclical change in the average annual precipitation over 34 years, and after a brief downward trend from 1998 to 2000, it gradually tends to a smooth and slow upward trend. From Figure 7, it can be seen that the annual average precipitation in the northern Ningxia Yellow Diversion Irrigation Area from 1980 to 2018 shows a fluctuating upward trend. As can be seen from Figure 8, the test statistic Z = 1.8888, calculated with the M–K test method, passed the significance test (α = 0.05), and the rising trend in precipitation is obvious. From the M–K statistical curve of average precipitation, it can be seen that the curve UF intersects with the curve UB 11 times, and the intersection point is within the critical line (+2) of the 99% significance level, so it can be judged that the average precipitation series has changed abruptly in these 11 years, which is consistent with the wave variation of precipitation derived from the cumulative distance level method, indicating that the precipitation series has a significant upward trend at the 90% confidence level. The upward trend is significant (and the UB and UF notations are standard elements of the Mann–Kendall statistics).

3.3. Analysis of the Driving Factors for the Evolution of the Yellow Irrigation District

The water surface beyond the mainstream of the Yellow River accounts for between 40% and 70% of the water surface of the entire Yellow River Diversion and Irrigation Area. In the past 10 years, the water surface beyond the mainstream of the Yellow River has almost always been above 60% of the total water surface, indicating that the water surface has been maintained at a high level as the channel cleaning and lake improvement in Ningxia have strengthened the water connectivity.
From the perspective of water source, the largest source of water in the Yellow River Irrigation Area comes from the upstream of the Yellow River, followed by precipitation and rainfall runoff from the combined effects of precipitation and the subsurface. From the perspective of water consumption, the water is mainly water used by human domestic production and evapotranspiration influenced by the subsurface. In this part, we will analyze the changes in upstream incoming water, precipitation, water consumption and subsurface since 1990.
  • Upstream water
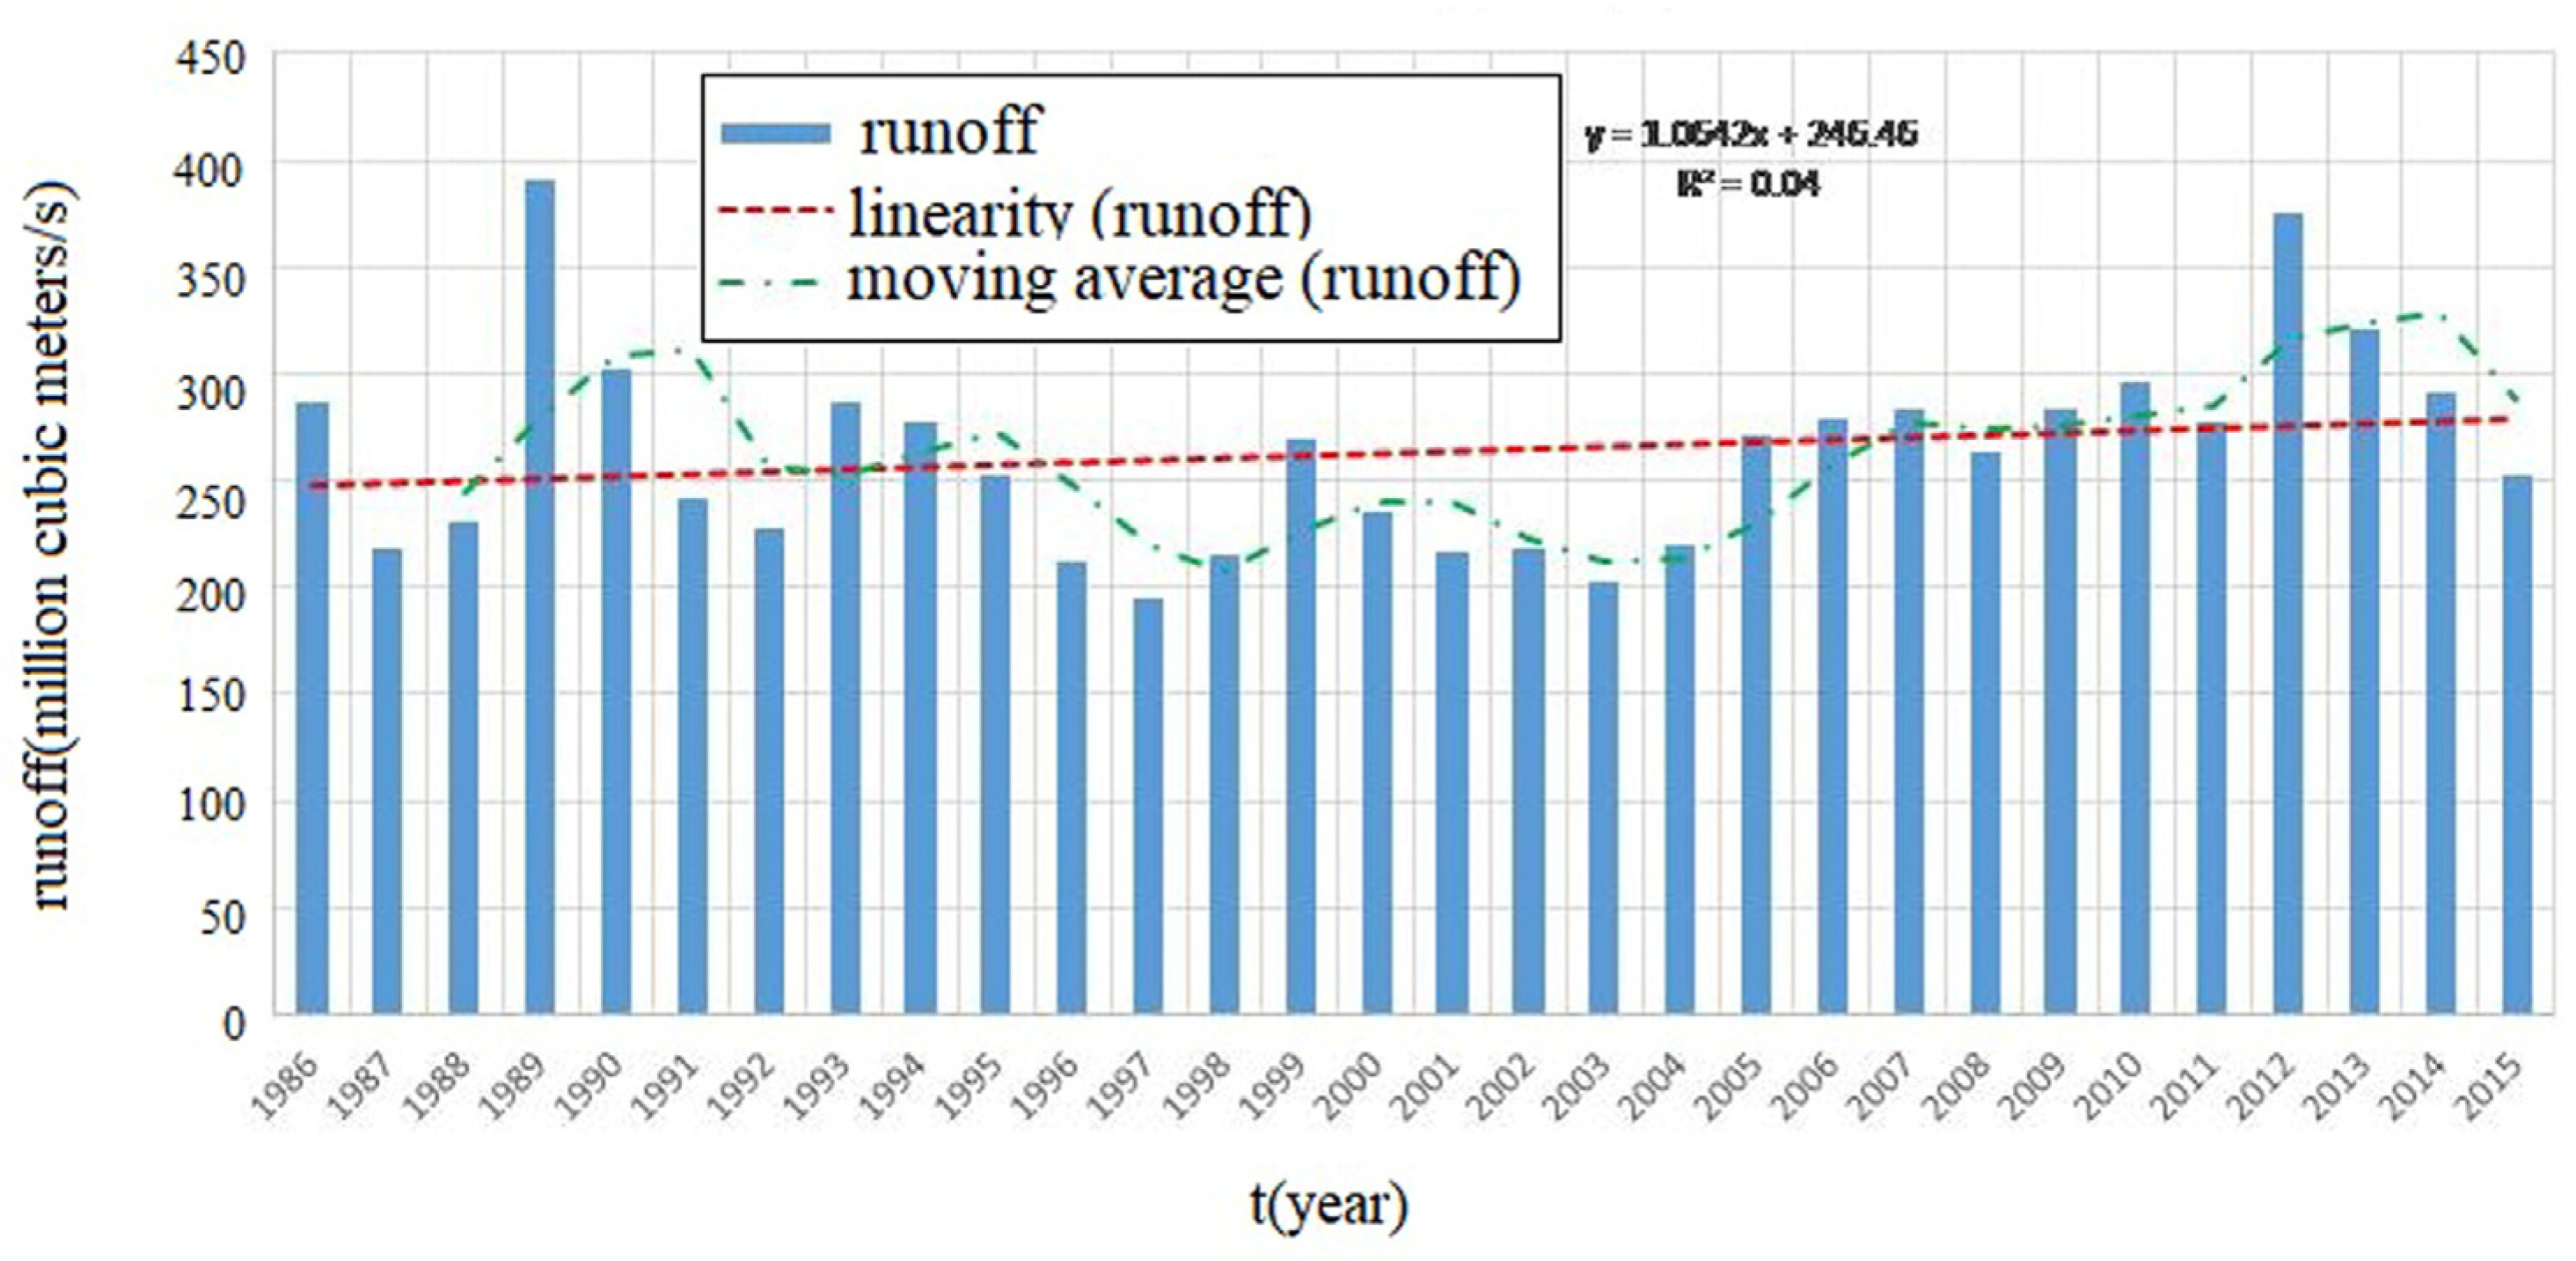
Regarding the runoff from the hydrological monitoring stations along the river in the upstream water of the Yellow Irrigation District, as can be seen from Figure 9, there is no significant linear pattern of runoff between 1986 and 2015, it is characterized by fluctuating changes and the 3-year sliding average curve shows that the upstream water is at a low level between 1997 and 2004, while the upstream water is at a relatively high level between 1989 and 1994 and between 2007 and 2013.
  • Precipitation in the Yellow Irrigation Area
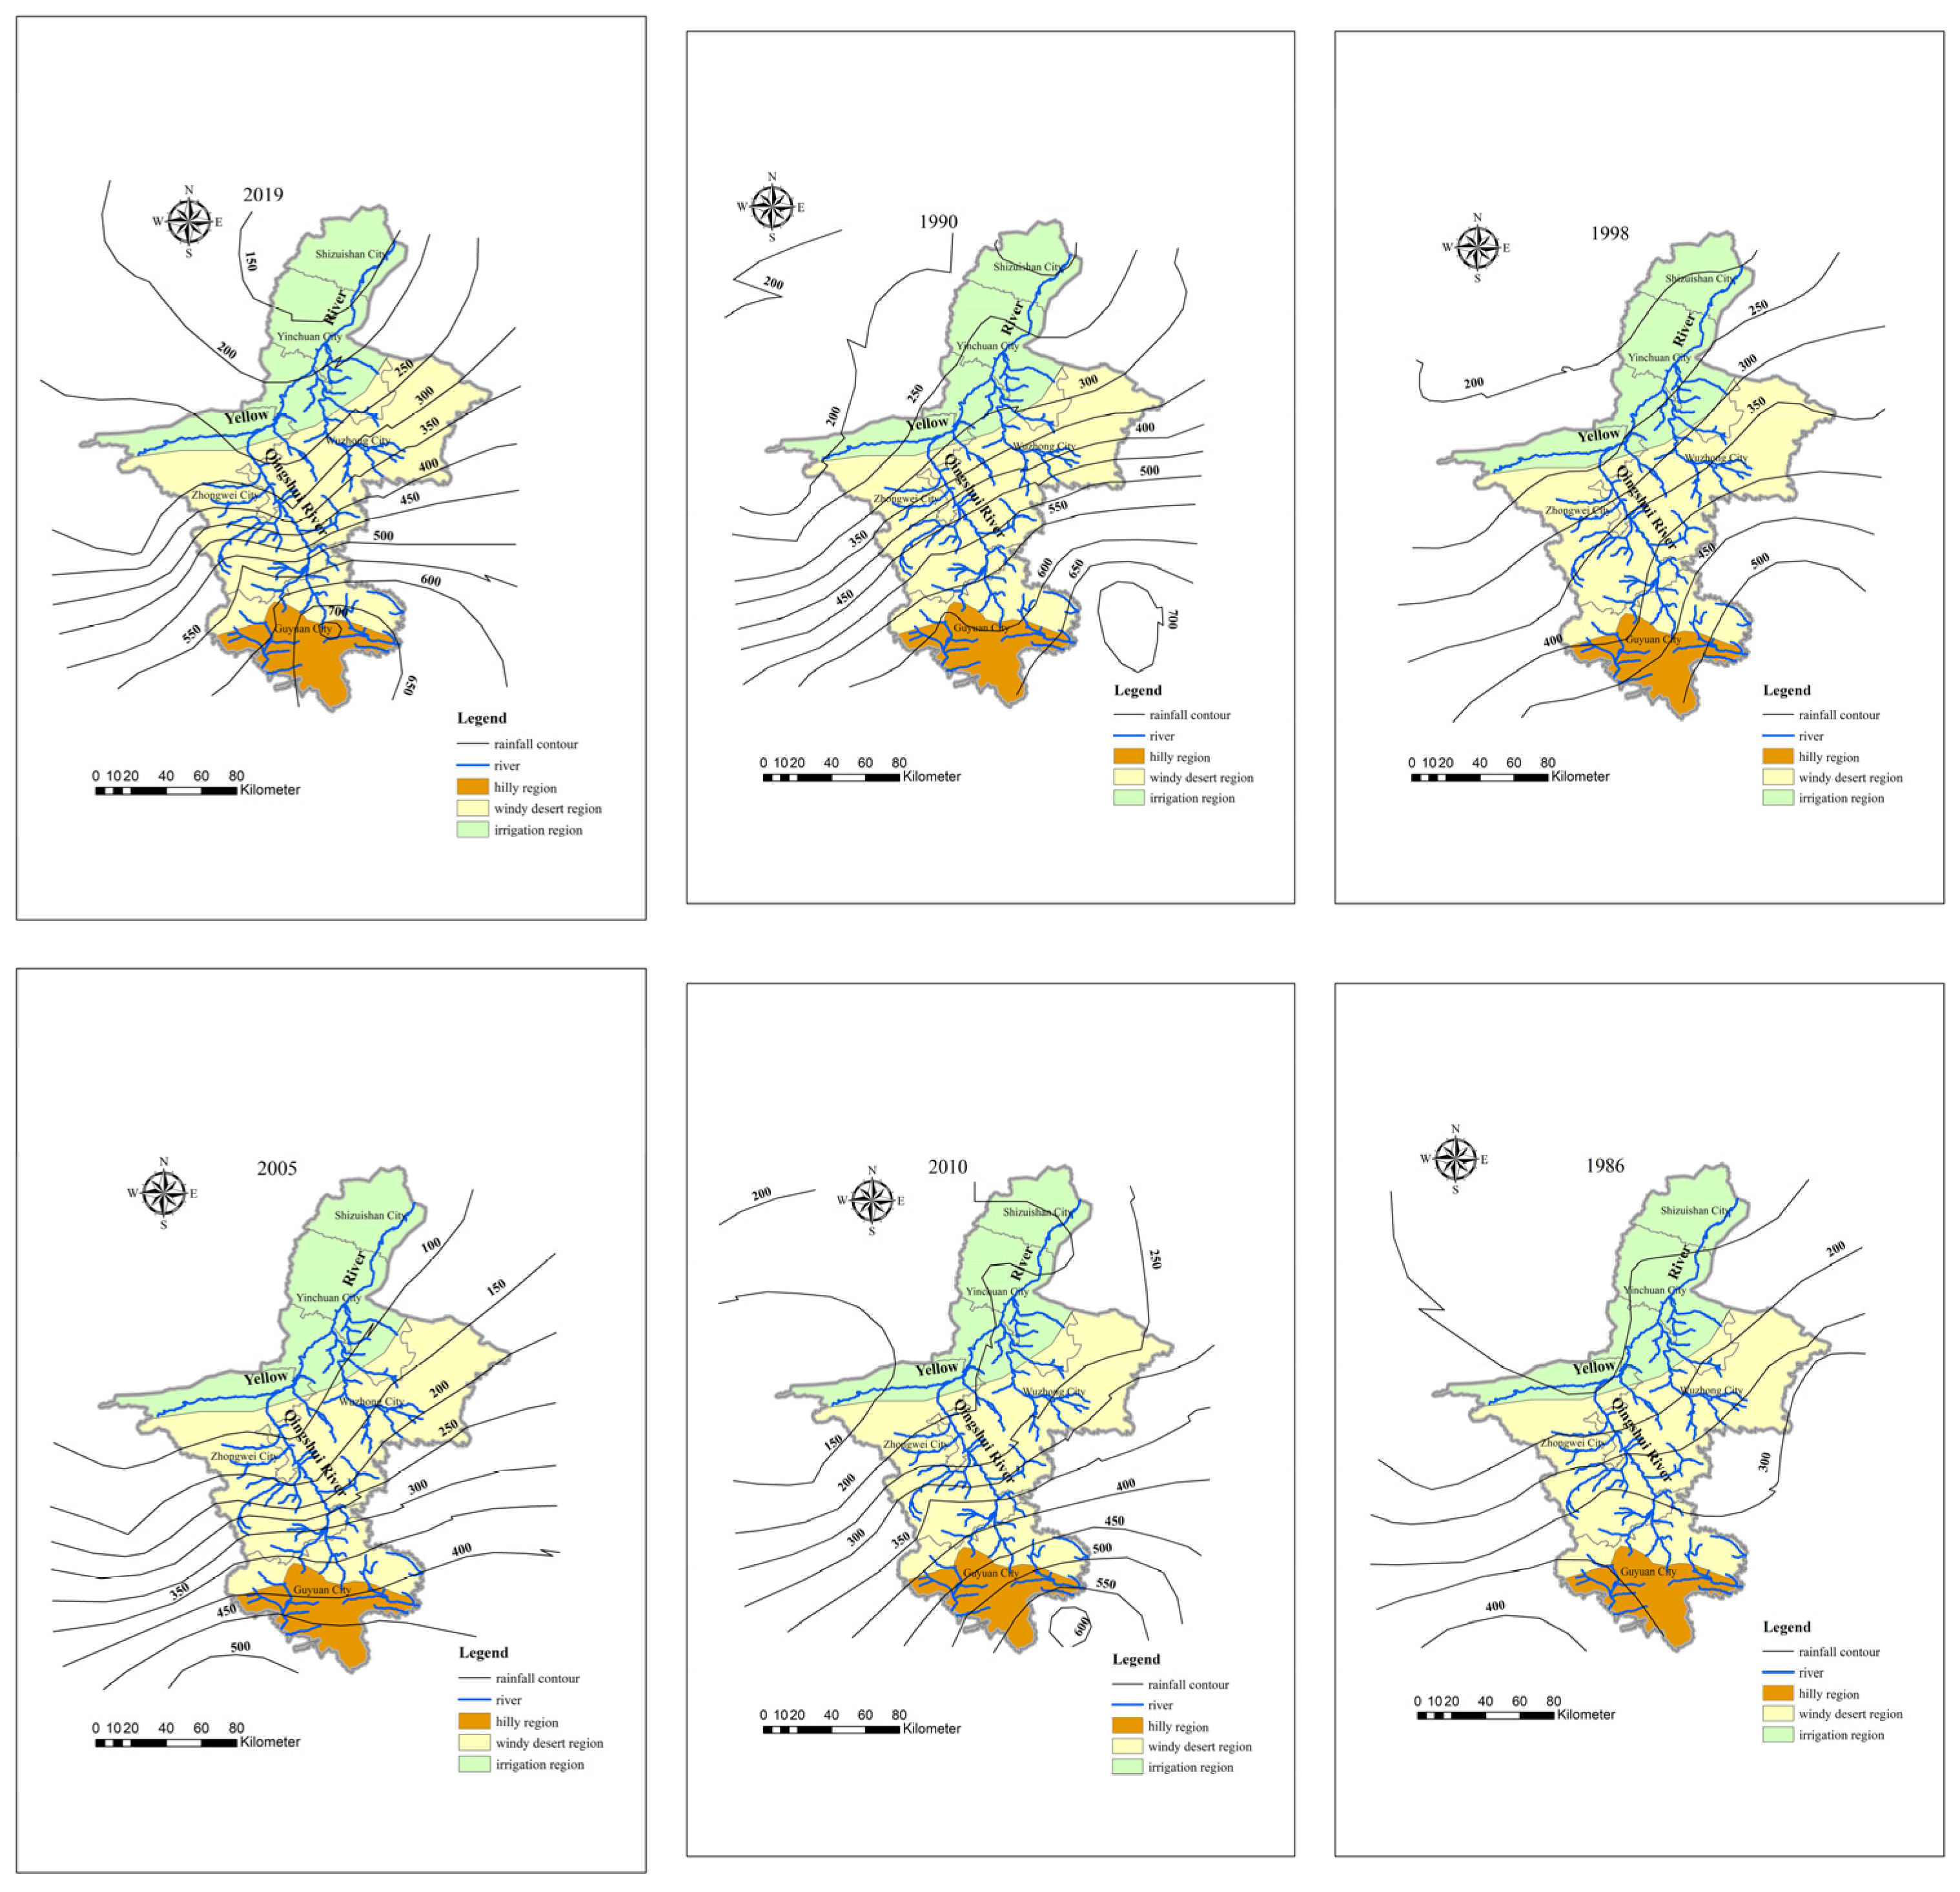
In the distribution of the rainfall contours in different years (Figure 10), the precipitation in the Yellow Irrigation Area is much lower than the average level in Ningxia, and there are large interannual differences.
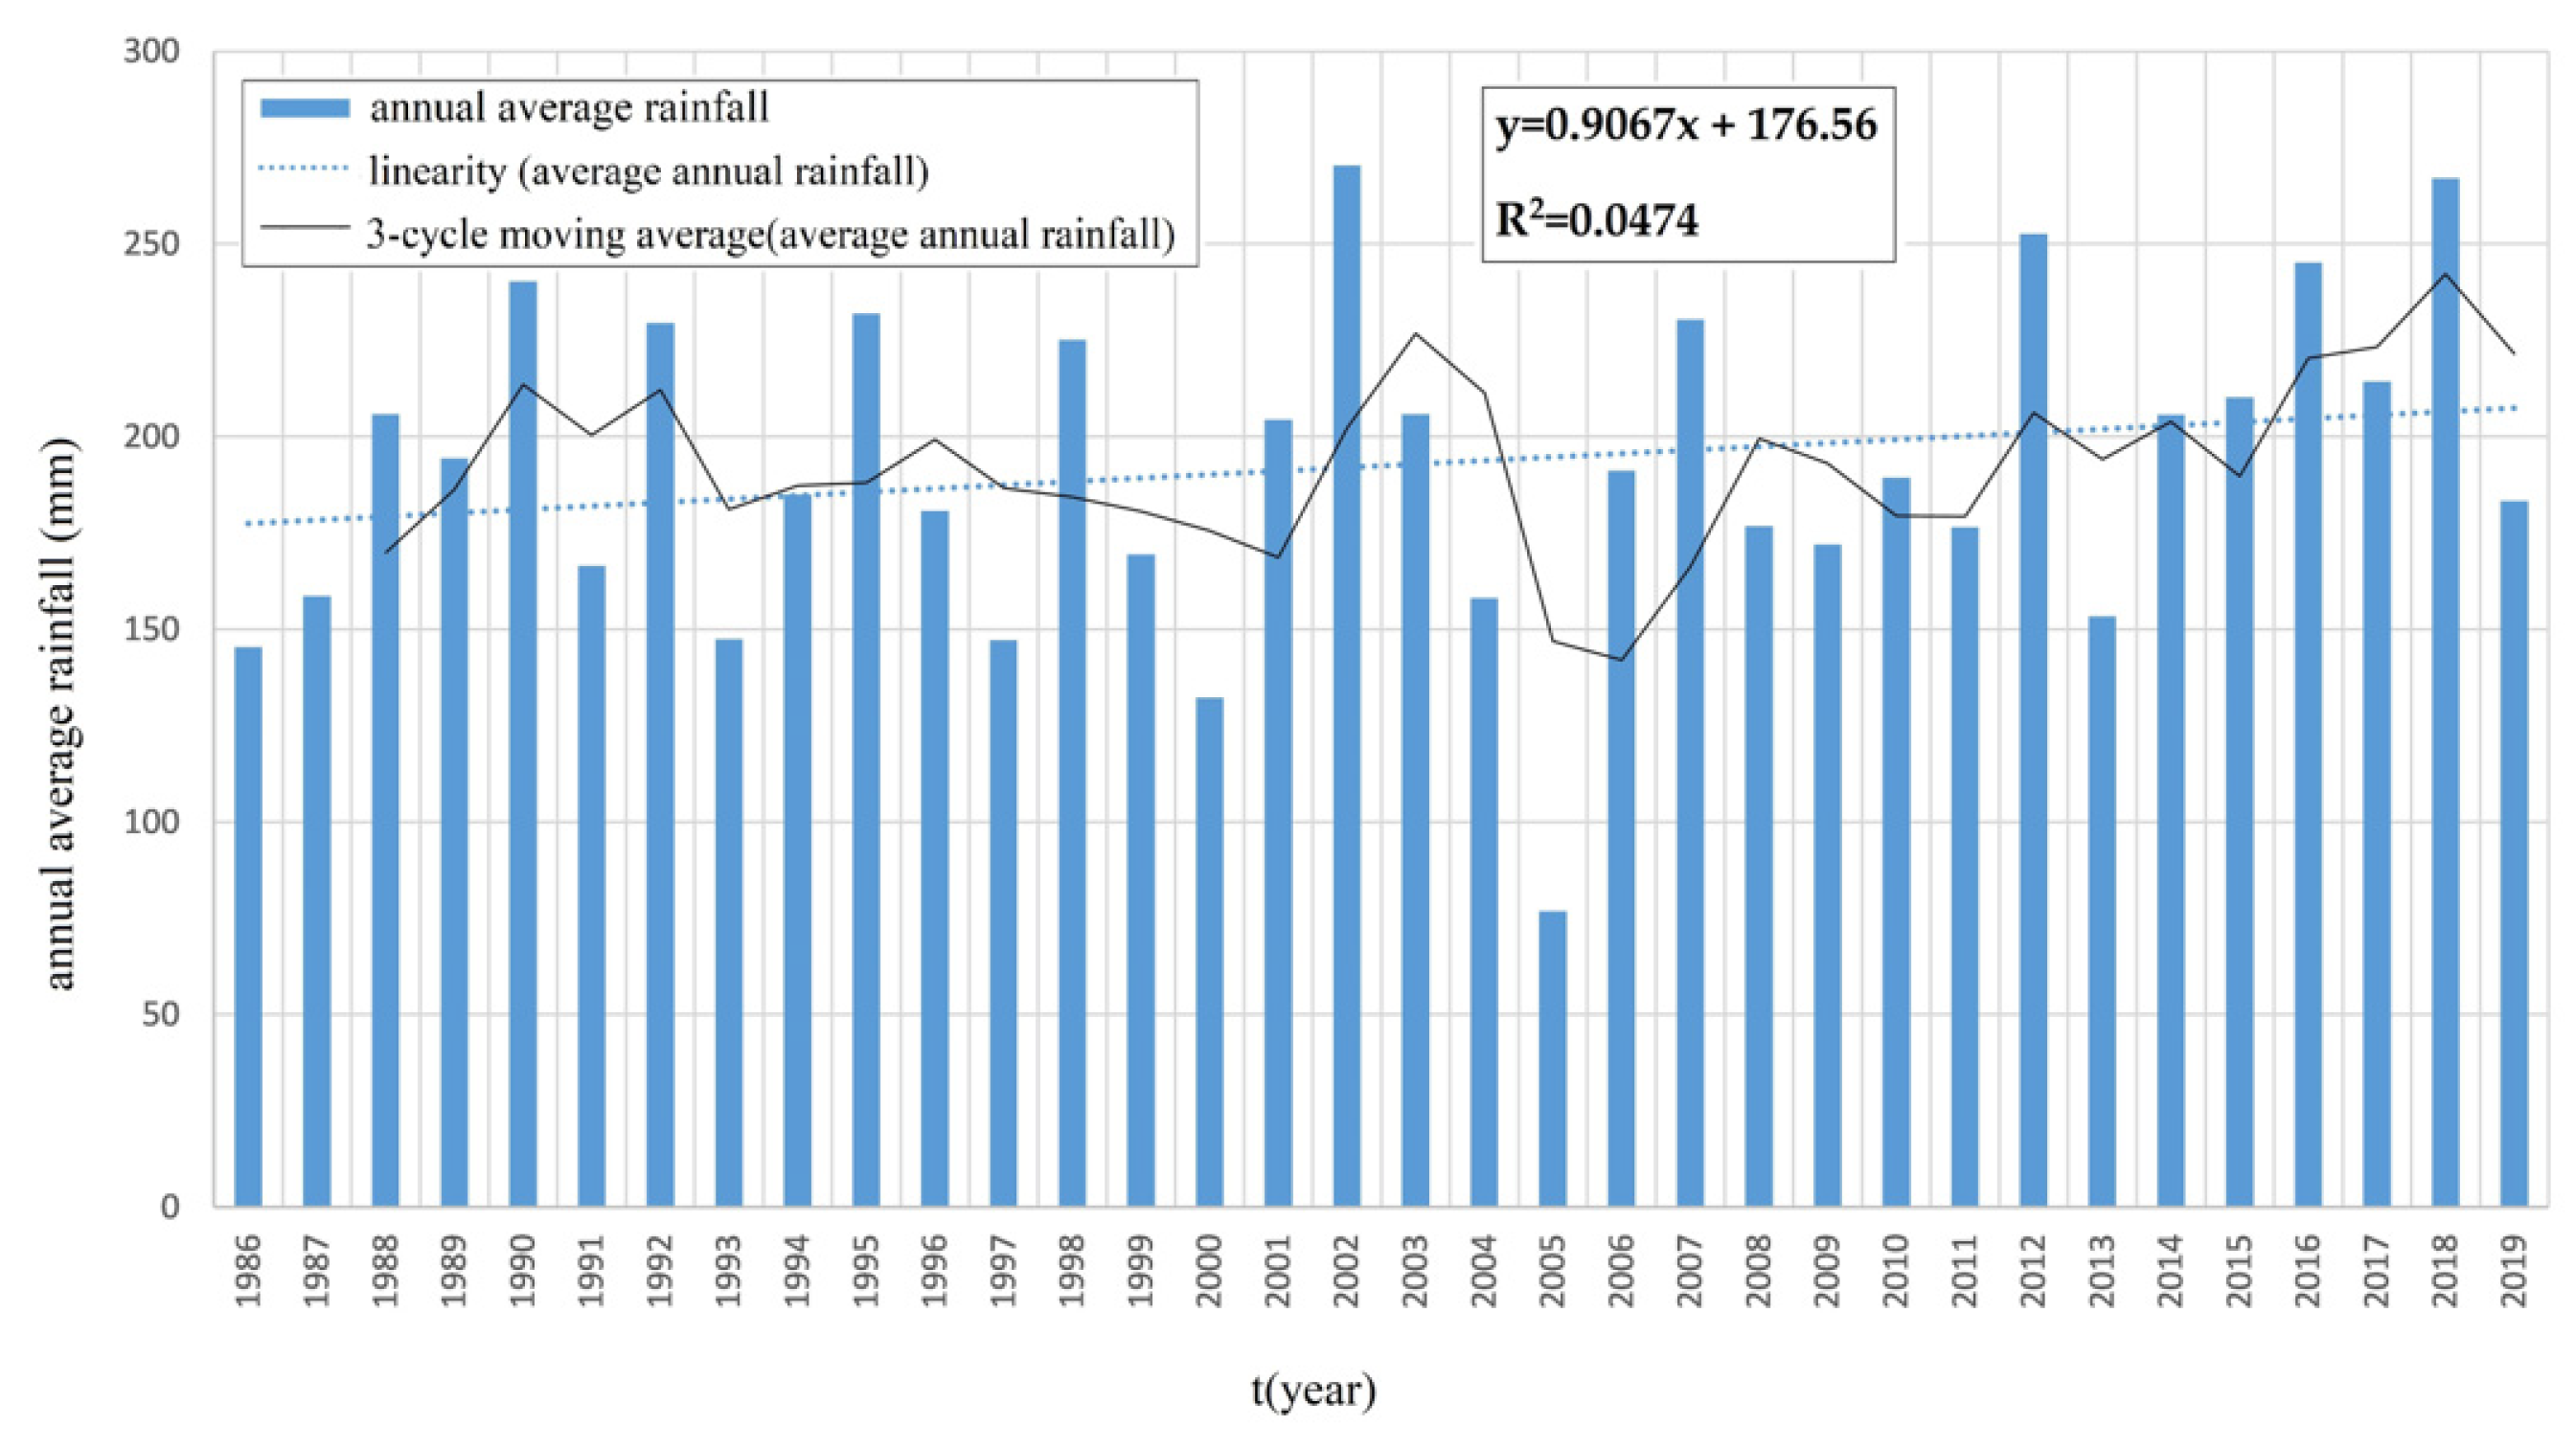
Based on the average value of the interpolated area, the annual average precipitation changes in the Yellow Irrigation Area since 1986 were obtained (Figure 11). For the year-to-year changes, there is no significant linear relationship, and it is characterized by irregular fluctuation changes, with the highest rainfall level being about 270 mm in 2002 and the lowest precipitation being less than 80 mm in 2005, and in general, the Yellow Irrigation Area is still a typical drought area.
  • Water consumption
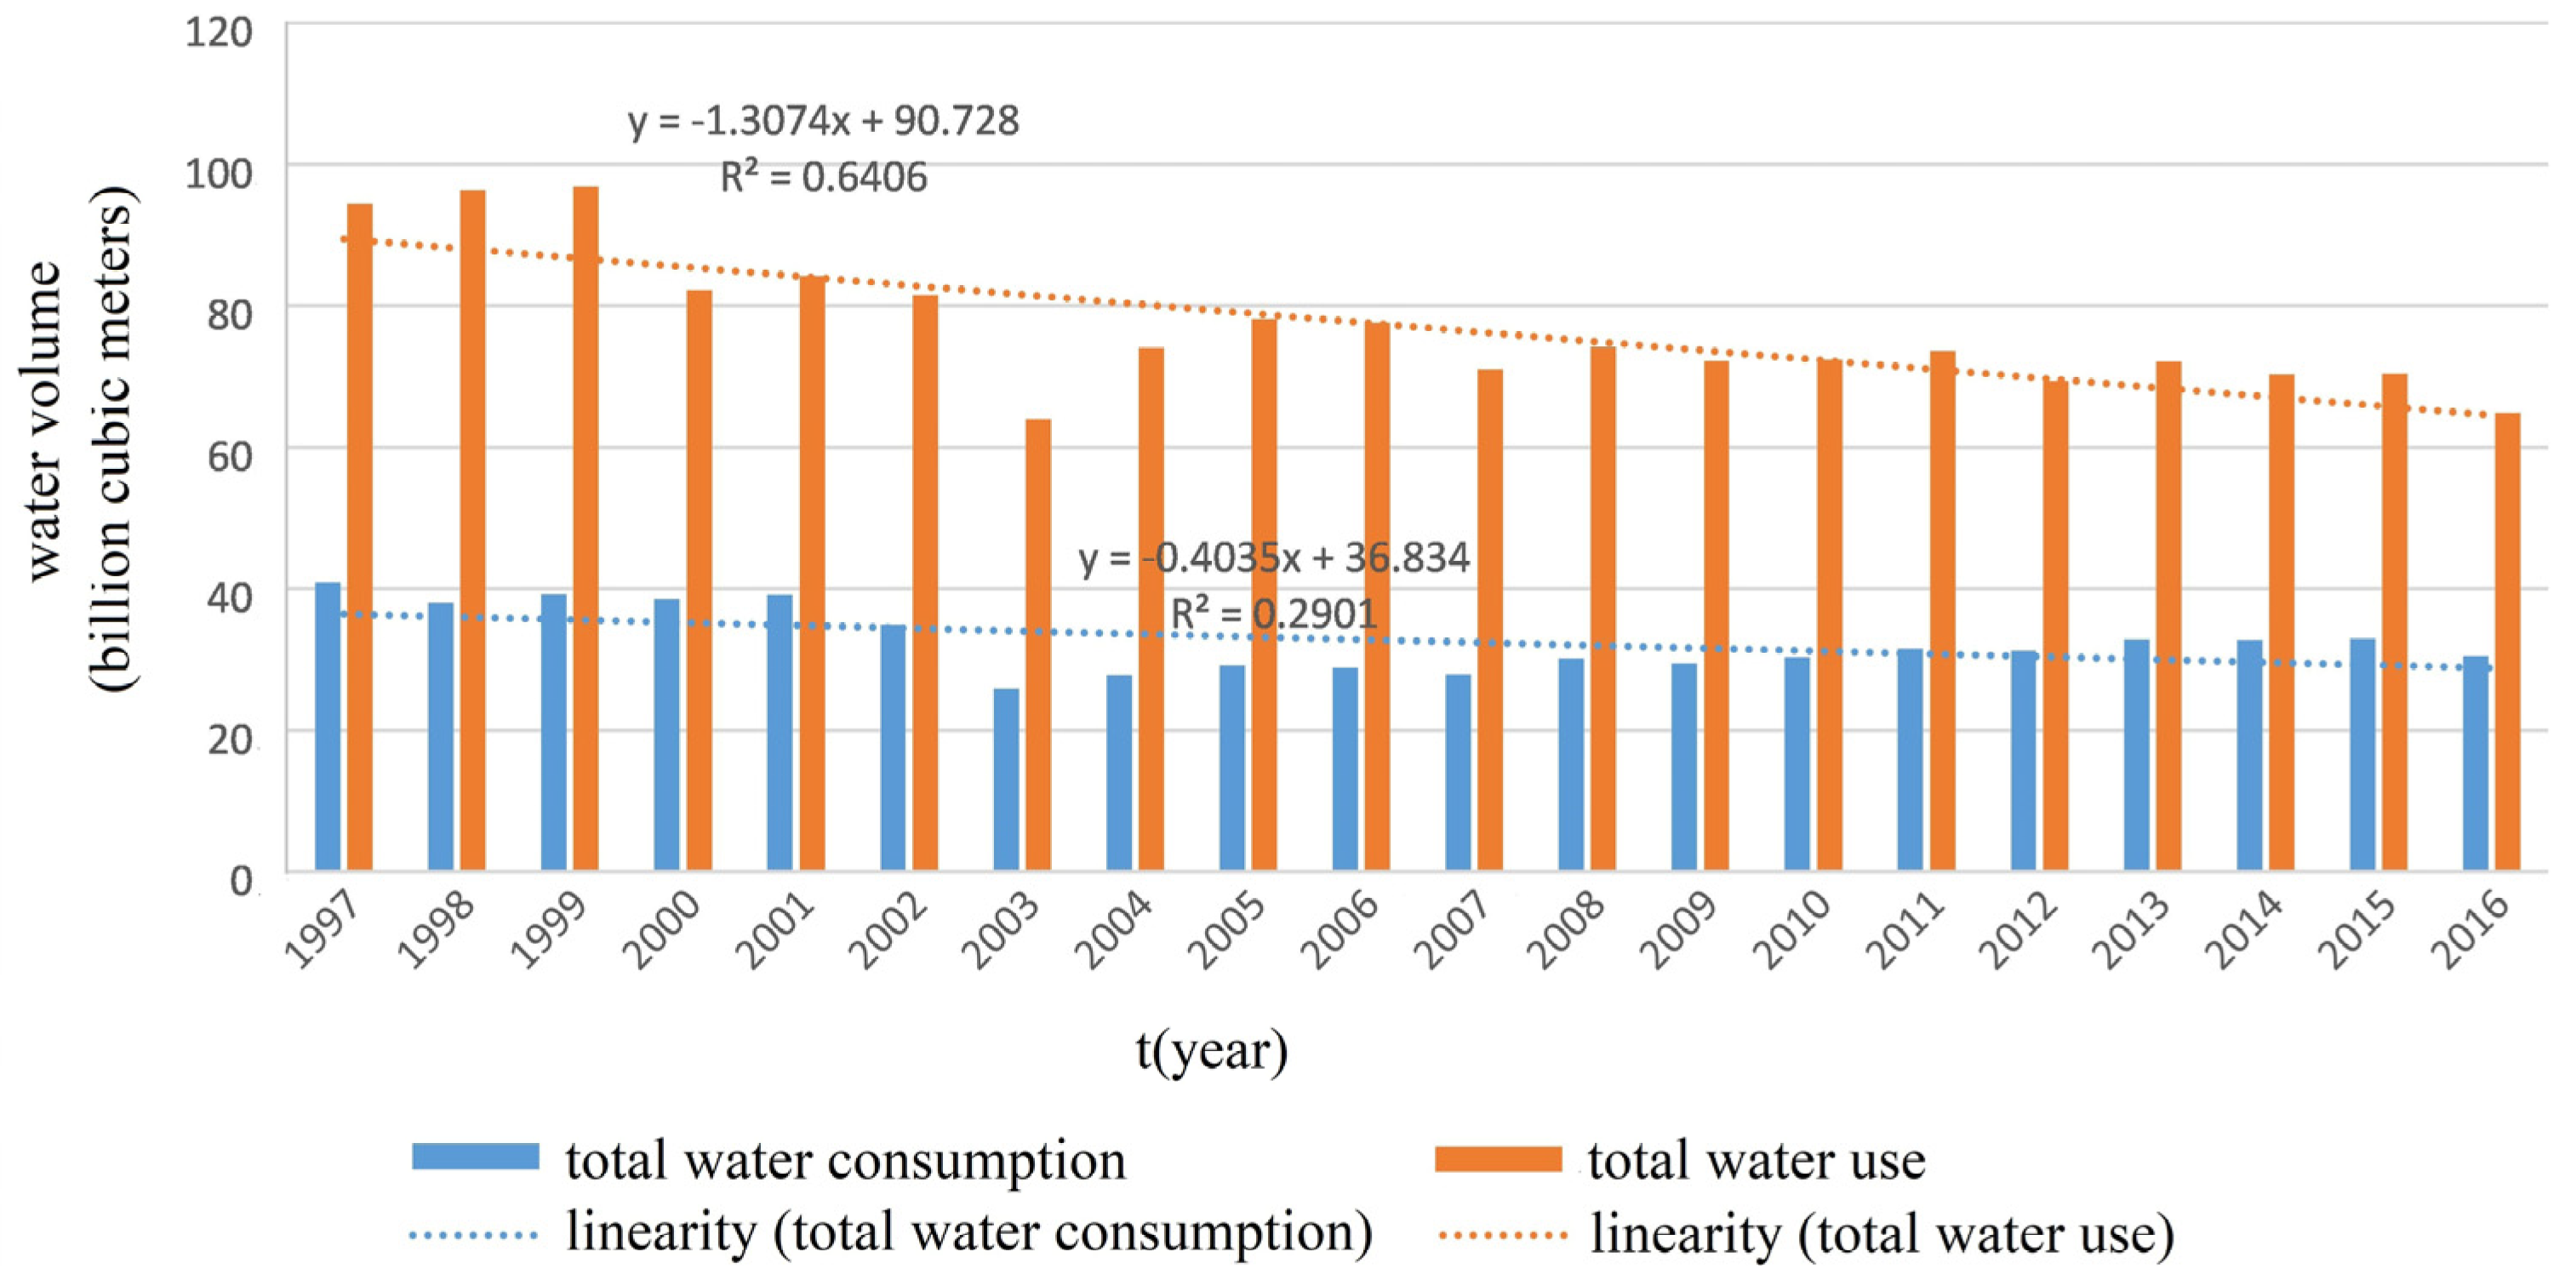
Because more than 90% of the water consumption in Ningxia occurs in the Yellow Irrigation Area, and this study mainly emphasizes the temporal changes in water consumption, according to the water resources bulletin data, the water consumption of the whole region was used instead of the water consumption of the Yellow Irrigation Area. However, the linear change in water consumption is not significant but has some fluctuation (Figure 12).
  • Lower cushion surface
As can be seen from the changes in the subsurface of the Yellow River Diversion and Irrigation Area (Table 1), within the Yellow River Diversion and Irrigation Area, grassland and arable land are dominant, both constituting around 30%, followed by other types of sand and bare land mainly in the upstream area of the tributaries of the left bank of the Yellow River, with a high degree of urbanization in the area. By 2015, artificial surfaces accounted for about 10% of the total area, and water bodies accounted for 3% to 4% of the entire area of the Yellow River Diversion and Irrigation Area.
Looking at the changes in different years (Table 2), the period from 1990 to 2000 was the main time when the Yellow Irrigation Area was surrounded by lakes to create fields, the arable land increased significantly and the forest land and water bodies decreased significantly. In addition, the artificial surface also increased by about 9% between 2000 and 2010, and with the construction of the national project of returning farmland to forest and grass, the forest land in the region increased by 10%. In addition, this stage was also the period when Ningxia invested heavily in the protection and management of lakes and wetlands, including a series of lake renovation projects such as Xinghai Lake, Reading Sea, and Mingcui Lake, which were changed into tourist attractions, and the area of the water bodies grew at a faster rate. In addition, this stage was also the stage of the rapid development of urbanization in the Yellow Irrigation Area, and the artificial surface grew by nearly 30%. In addition, the water surface decreased slightly, and the urbanization process further developed.
The most significant impact of substratum changes on the water surface is the fencing of lakes and fields after 1990, followed by the engineering treatment of the lakes after 2000, including the dredging of rivers to increase water connectivity and wetland landscaping to maintain water quantity.
The total water surface of the Yellow Irrigation Area, the water surface of the mainstream, other than other factors, and the results are shown in Table 3.
From the above table, we can see that the water surface area of the mainstream is mainly significantly and positively correlated with upstream incoming water, is significantly and negatively correlated with the area of grassland and is significantly and positively correlated with the area of cultivated land and construction land, although the runoff coefficient of the cultivated land and construction land is higher than that of the grassland. The correlation coefficient between the water surface area of the mainstream and the land cover is smaller than that between the total water surface area and the water surface area other than the mainstream and the land cover, which indicates that the regional land cover mainly affects the mainstream by influencing other lakes, irrigation channels, drainage ditches and tributary water surfaces in the region, which is also reflected in the fact that the correlation coefficients between water surface area and land cover are the largest for water surface area other than the mainstream. In addition, the water surface area and total water surface area other than the mainstream are not only significantly and positively correlated with upstream water but are also significantly and positively correlated dwith regional rainfall and negatively correlated with regional total water consumption.

4. Conclusions

This paper analyzes and studies the evolution of lakes in the northern Ningxia Yellow Irrigation Area and the driving mechanisms based on the cumulative distance level and Mann–Kendall trend analysis using water resources bulletin and hydrological data from the relevant website of the State Ministry of Water Resources, and the main conclusions obtained are as follows:
(1)
The lake water surface area shows a significant increase from 1986–2019, and overall since 1988, the lake water surface shows a significant increase, with a total area increase rate of 235 hm2/year.
(2)
The annual average temperature in the northern region of Ningxia from 1980 to 2018 shows a slow increasing trend, and the temperature increases sharply from 1998 onwards. The temperature series has a significant upward trend at the 99% confidence level. In the past 39 years, the average annual precipitation in the northern Ningxia Yellow Irrigation Area shows a fluctuating upward trend, and the upward trend of the precipitation series is significant at the 90% confidence level.
(3)
The analysis of the driving factors shows that the water surface area of the mainstream is mainly significantly and positively correlated with the upstream incoming water, is significantly and negatively correlated with the area of grassland and is significantly and positively correlated with the area of arable land and construction land. The effect of land cover on the water surface of the mainstream is lesser than that on the water surface area other than the mainstream, i.e., the change in land cover mainly causes the change in the water surface of other lakes, irrigation channels, drainage ditches and tributaries in the affected area.
The Yellow River is an important source of water for many lakes and major tributaries in Ningxia and plays an important role in maintaining the balanced development of lakes and the healthy development of ecosystems. We expect to strengthen management measures in the following three areas in the future.
(1)
To achieve an optimal allocation of water resources in the basin, it is necessary to further strengthen macrocontrol and gradually reverse the deteriorating trend of lakes and rivers, promote the upgrading and transformation of industrial structures, increase the control of point source and surface source pollution and make deeper efforts to achieve the optimal allocation of water resources in the Yellow River Basin.
(2)
Vigorously conducting river and lake resource monitoring. Find the most suitable local ecological system management methods and apply them to practical work to provide scientific and complete theoretical and technical support for the protection of the Yellow River and its lakes and all ecological resources.
(3)
Strengthening the propaganda and education about river and lake protection. We should conduct education and promote related knowledge more deeply and extensively, and it should be necessary to conduct on-the-spot lectures and propaganda in seriously damaged areas so that people can deeply understand the importance of protecting the integrity of rivers and lakes to protect the ecosystem.

Author Contributions

Conceptualization, X.D. and H.Z.; methodology, H.Z.; software, H.Z.; validation, Z.W., G.S. and Y.H.; formal analysis, H.Z. and Y.H.; investigation, Z.W. and H.L.; resources, X.D.; data curation, X.D. and Z.W.; writing—original draft preparation, X.D.; writing—review and editing, X.D., Z.W. and H.Z.; visualization, Z.W.; supervision, Z.W.; funding acquisition, X.D. and H.Z. All authors have read and agreed to the published version of the manuscript.

Funding

This research was funded by study on regional characteristics of main component factors of river and lake health in typical areas of China, grant number [Y121013]. And the APC was funded by study on regional characteristics of main component factors of river and lake health in typical areas of China, grant number [Y121013].

Data Availability Statement

Not applicable.

Acknowledgments

Appreciation goes to the editors and reviewers for their valuable comments that have helped to improve this paper.

Conflicts of Interest

The authors declare no conflict of interest.

References

  1. Liao, W.; Chen, Y.; Zhao, X.; Wen, X. Analysis of lake and lake shoreline evolution in Hubei province in recent 30 years based on Google Earth Engine. Hubei Agric. Sci. 2021, 60, 46–54. [Google Scholar] [CrossRef]
  2. Chen, F.; Zhang, M.; Tian, B.; Li, Z. Extraction of glacial lake outlines in Tibet Plateau using Landsat 8 imagery and Google Earth Engine. IEEE J. Sel. Top. Appl. Earth Obs. Remote Sens. 2017, 10, 4002–4009. [Google Scholar] [CrossRef]
  3. Wan, W.; Xiao, P.; Feng, X.; Li, H.; Ma, R.; Duan, H.; Zhao, L. Monitoring lake changes of Qinghai-Tibetan plateau over the past 30 years using satellite remote sensing data. Chin. Sci. Bull. 2014, 59, 701–714. (In Chinese) [Google Scholar] [CrossRef]
  4. Chen, G.; Deng, W.; Wang, L. Application of remote sensing technique in urban lakes evolution research. Resour. Dev. Mrk. 2010, 26, 397–399. (In Chinese) [Google Scholar]
  5. Xi, C.; Guo, Y.; He, R.; Mu, B.; Zhang, P.; Li, Y. The use of remote sensing to quantitatively assess the visual effect of urban landscape—A case study of Zhengzhou, China. Remote Sens. 2022, 14, 203. [Google Scholar] [CrossRef]
  6. Ma, R.; Yang, G.; Duan, H.; Jiang, J.; Wang, S.; Feng, X.; Li, A.; Kong, F.; Xue, B.; Wu, J.; et al. China’s lakes at present: Number, area and spatial distribution. Sci. Sin. Terrae 2011, 41, 394–401. (In Chinese) [Google Scholar] [CrossRef]
  7. Shi, J.; Zhang, M.; Zhang, X.; Zhang, K.; Zhao, Z.; Wu, X. Design and implementation of Hubei lake spatial and temporal evolution system Based on Web GIS. Comput. Inf. Technol. 2021, 29, 70–73. [Google Scholar]
  8. Rao, E.; Xiao, Y.; Ouyang, Z. Assessment of flood regulation service of lakes and reservoirs in China. J. Nat. Resour. 2014, 29, 1356–1365. (In Chinese) [Google Scholar]
  9. Duan, H.; Luo, J.; Cao, Z.; Xue, K.; Xiao, Q.; Liu, D. Progress in remote sensing of aquatic environments at the watershed scale. Prog. Geogr. 2019, 38, 1182–1195. (In Chinese) [Google Scholar] [CrossRef] [Green Version]
  10. Wu, B.; Zhu, W.; Zeng, H.; Yan, N.; Chang, S.; Zhao, X. Watershed remote sensing: Definition and prospective. Adv. Water Sci. 2020, 31, 654–673. [Google Scholar]
  11. Zhou, L.; Liu, Y. Review and prospect of ecological construction in China. Acta Ecol. Sin. 2021, 41, 3306–3314. (In Chinese) [Google Scholar]
  12. Yu, Q.; Lu, S.; Cao, S.; Dong, Y.; Li, H.; Liu, Z.; Shi, M.; Yuan, L. Dynamics and driving factors of four plateau lakes in northwest of Yunnan Province, China. J. West China For. Sci. 2015, 44, 1–8. [Google Scholar]
  13. Feng, K. Research on Decision Support System for Optimal Allocation of Water Resources in Ningxia. Master’s Thesis, Ningxia University, Ningxia, China, 2014. (In Chinese). [Google Scholar]
  14. Zhu, H.; Meng, P.; Xu, Z. Regional culture’s influence on the integrated land use planning—A case study of Ningxia Hui autonomous region. J. Anhui Agric. Sci. 2014, 42, 6004–6007. [Google Scholar]
  15. Lou, X.; Niu, J.; Huang, W. Ecological construction status and protection measures in Yellow River irrigation area of Ningxia. Ningxia J. Agric. For. Sci. Technol. 2016, 57, 41–44. (In Chinese) [Google Scholar]
  16. Han, Y.; Ruan, B.; Wang, F. Estimation of suitable ecological water requirement for Yellow River irrigation area in Ningxia Autonomous Region. J. Hydraul. Eng. 2009, 40, 716–723. (In Chinese) [Google Scholar]
  17. Xue, S. Development and objective of the Yellow River irrigation area of Ningxia. Yellow River 2015, 37, 1–3. (In Chinese) [Google Scholar]
  18. Han, Y.; Zhang, J. The Characteristics Analysis of Climatic Change in Yellow River Irrigation Area of Ningxia Region. J. North China Inst. Water Conserv. Hydroelectr. Power 2007, 28, 1–3. Available online: http://qikan.cqvip.com/Qikan/Article/Detail?id=26079071&from=Qikan_Search_Index (accessed on 12 October 2022). [CrossRef]
  19. Wang, J.; Wang, L.; Yan, D.; Ni, H.; Luan, Q.; Chen, G.; Liu, S. Study on water resources allocation of agriculture in the end piece of Yellow River irrigation region in Ningxia. Water Resour. Hydropower Eng. 2017, 48, 65–70. [Google Scholar]
  20. Wang, H.; Ma, M. A review of monitoring change in lake water areas based on remote sensing. Remote Sens. Technol. Appl. 2009, 24, 674–684. (In Chinese) [Google Scholar]
  21. Wang, R.; Xiong, S.; Nie, H.; Liang, S.; Qi, Z.; Yang, J.; Yan, B.; Zhao, F.; Fan, J.; Tong, L.; et al. Remote sensing technology and its application in geological exploration. Acta Geol. Sin. 2011, 85, 1699–1743. (In Chinese) [Google Scholar]
  22. Villa, P.; Giardino, C.; Mantovani, S.; Tapete, D.; Vecoli, A.; Braga, F. Mapping coastal and wetland vegetation communities using multi-temporal sentinel-2 data. Int. Arch. Photogramm. Remote Sens. Spat. Inf. Sci. 2021, XLIII-B3-2021, 639–644. [Google Scholar] [CrossRef]
  23. Loveland, T.R.; Dwyer, J.L. Landsat: Building a strong future. Remote Sens. Environ. 2012, 122, 22–29. [Google Scholar] [CrossRef]
  24. Feng, Z.; Ma, X.; Fan, K.; Li, Z.; Yu, M. Establishment of SWAT model spatial database based on GIS. Yellow River China 2015, 37, 27–30. (In Chinese) [Google Scholar]
  25. Ali, M.F.; Rahman, N.F.A.; Khalid, K.; Liem, N.D. Langat river basin hydrologic model using integrated GIS and arcSWAT interface. Appl. Mech. Mater. 2014, 567, 3228. [Google Scholar] [CrossRef]
  26. Song, Y. A Study on Imagery Interpretation and Accuracy Test of Urban Tree Canopy in Beijing Urban Area Based on Ecognition. Master’s Thesis, Chinese Academy of Forestry, Beijing, China, 2016. (In Chinese). [Google Scholar]
  27. Liu, J.; Fang, S.; Feng, Q.; Wu, Z.; Han, L.; Huang, J.; Bai, X. Analysis of regime shift in Taihu Lake based on Mann-Kendall method. China Environ. Sci. 2015, 35, 3707–3713. [Google Scholar]
  28. Fathian, F.; Dehghan, Z.; Bazrkar, M.H.; Eslamian, S. Trends in hydrological and climatic variables affected by four variations of the Mann-Kendall approach in Urmia Lake basin, Iran. Hydrol. Sci. J. 2016, 61, 892–904. [Google Scholar] [CrossRef] [Green Version]
  29. Liu, Y.; Wu, G.; Zhao, X. Recent declines in China’s largest freshwater lake: Trend or regime shift ? Environ. Res. Lett. 2013, 8, 014010. [Google Scholar] [CrossRef]
  30. Abonyi, A.; Ács, É.; Hidas, A.; Grigorszky, I.; Várbíró, G.; Borics, G.; Kiss, K.T. Functional diversity of phytoplankton highlights long-term gradual regime shift in the middle section of the Danube River due to global warming, human impacts and oligotrophication. Freshw. Biol. 2018, 63, 456–472. [Google Scholar] [CrossRef]
Figure 1. Main partitions of Ningxia topography and landforms.
Water 14 03658 g001
Figure 2. Changes of lake surface area in northern Ningxia.
Water 14 03658 g002
Figure 3. Average temperature trend in the northern Ningxia Yellow Diversion Irrigation Area.
Water 14 03658 g003
Figure 4. Average temperature and cumulative anomaly in the northern Ningxia Yellow Diversion Irrigation Area.
Water 14 03658 g004
Figure 5. Trend of M–K statistics of air temperature.
Water 14 03658 g005
Figure 6. Annual average precipitation trend in the northern Yellow Diversion Irrigation Area.
Water 14 03658 g006
Figure 7. Average annual precipitation and cumulative anomaly curves of the northern Yellow River diversion irrigation area.
Water 14 03658 g007
Figure 8. Trend of M-K statistics of precipitation.
Water 14 03658 g008
Figure 9. Changes in water surface runoff in irrigation areas other than the mainstream of the Yellow River.
Water 14 03658 g009
Figure 10. Distribution of rainfall contours in different years.
Water 14 03658 g010
Figure 11. Changes in average annual precipitation in the Yellow Irrigation District.
Water 14 03658 g011
Figure 12. Changes in water consumption in the Yellow Irrigation District.
Water 14 03658 g012
Table 1. Changes in the subsurface of the Yellow-intake Irrigation Area.
YearWoodlandGrasslandCroplandWaterArtificial SurfaceOther
19907.10%30.77%28.48%4.02%6.33%23.31%
20005.56%29.35%34.40%3.11%6.88%20.71%
20106.13%27.51%33.52%3.69%8.85%20.30%
20156.28%27.38%33.86%3.28%9.54%19.66%
Table 2. Rate of change in different land cover types in the Yellow Diversion Irrigation Area.
YearWoodlandGrasslandCroplandWaterArtificial SurfaceOther
1990–2000−21.71%−4.60%20.77%−22.65%8.65%−11.15%
2000–201010.39%−6.28%−2.56%18.70%28.70%−1.97%
2010–20152.46%−0.45%1.01%−11.13%7.81%−3.17%
Table 3. Correlation results between water surface area and other factors.
Water Surface AreaRainfallUpstreamTotal Water ConsumptionTotal Water UseWoodlandGrasslandCroplandConstruction Land
Yellow River Irrigation Area0.371 *0.461 *−0.675 **0.073−0.171−0.794 **0.501 **0.883 **
Mainstream.0.2310.389 *−0.3640.142−0.216−0.589 **0.445 **0.645 **
Water surface area except for mainstream0.389 *0.445 *−0.696 **0.051−0.145−0.803 **0.484 **0.897 **
* correlation, p < 0.05; ** correlation, p < 0.01.
Publisher’s Note: MDPI stays neutral with regard to jurisdictional claims in published maps and institutional affiliations.