Article

A Joint Impact on Water Vapor Transport over South China during the Pre-Rainy Season by ENSO and PDO

1
Education Information Center, Guangdong Ocean University, Zhanjiang 524088, China
2
College of Ocean and Meteorology, South China Sea Institute of Marine Meteorology, Guangdong Ocean University, Zhanjiang 524088, China
*
Author to whom correspondence should be addressed.
Water 2022, 14(22), 3639; https://doi.org/10.3390/w14223639
Submission received: 29 August 2022 / Revised: 28 October 2022 / Accepted: 7 November 2022 / Published: 11 November 2022

Abstract

:
Based on precipitation data from 60 stations in South China (SC) and NCEP reanalysis data, the Hybrid Single-Particle Lagrangian Integrated Trajectory model (HYSPLIT_4.9) is used to analyze the difference of water vapor transport tracks, water vapor sources, and their precipitation contribution rate to frontal/monsoon precipitation, with four combinations of ENSO and PDO phase for a period of 53 years (1960–2012). The results show that: (1) For the frontal precipitation, in the Pacific Decadal Oscillation positive phase (PDO+), there is a great positive water vapor difference between ENSO+ (the positive ENSO phase) and ENSO− (the negative ENSO phase) over the tropical Indian Ocean (IO), the Bay of Bengal (BOB), the South China Sea (SCS) and the western Pacific (WP), the distribution of the difference is adjusted for PDO− (the negative PDO phase). For monsoon precipitation, when PDO and ENSO are in phase resonance, water vapor gathers over IO-BOB-SCS. (2) For the frontal precipitation, both PDO+ and PDO−, compare with ENSO+, more water vapor from SCS for ENSO−, but the southward water vapor transport anomaly over the western part of BOB-SCS-ocean east of the Philippines, which leads a decline in precipitation contribution rate of SCS water vapor. Both ENSO+ and ENSO−, compare with PDO−, more water vapor comes from IO-BOB for PDO+, but their precipitation contribution rates are lower. (3) For the summer monsoon precipitation, SCS and IO are important rain contributor sources. Regardless of the PDO phase, compared with ENSO+, there is more water vapor from the IO and WP for ENSO−, the easterly anomaly in the south of the stronger subtropical high brings more water vapor from WP to SC, the strong westerly anomalies in the IO-BOB-SCS increases IO water vapor transporting to SC, so water vapor precipitation contribution rates of IO and WP are higher. Both ENSO+ and ENSO−, compare with PDO−, more water vapor comes from SCS and EC for PDO+, but their precipitation contribution rates are lower. (4) The water vapor transport process of precipitation in PFS over SC is jointly affected by ENSO and PDO.

1. Introduction

The water cycle is perhaps the most important element in the climate system; precipitation regulates the regional supply of water [1,2]. South China (SC) is located in the south of China and belongs to the East Asian monsoon region. Compared to other regions of China, SC is the region with the longest flood season and the most abundant precipitation. Over SC, the pre-rainy season (PFS, April–June) precipitation is mainly controlled by atmospheric water vapor transport processes [3,4,5]. The source, transport path, and changes of water vapor directly affect the onset of the rainy season and the advance and retreat of the rain belt. Thus, atmospheric moisture transport and its source in PFS is a focus of attention and research by meteorological experts and scholars [6,7,8]. This study on the differences in water vapor transport trajectories between the two stages of PFS rain is helpful to deeply understand the characteristics of water vapor transport and provide a reference for the prediction and forecast of summer precipitation in SC.
Nevertheless, the typical pathways of water in the atmosphere are less well-known [9]. In recent years, the Lagrangian method has been widely used because its backward air flow trajectories allow an explicit evaluation of likely source regions for the water vapor involved in precipitation [10,11,12,13,14,15].
The Hybrid Single-Particle Lagrangian Integrated Trajectory (HYSPLIT) model [16,17] has been used to explore the moisture sources involved in precipitation over SC [18,19,20,21]. Figure 1 shows that WP, SCS, IO, BOB, and Eurasia land are the main climatological water vapor sources for rain in SC, which is consistent with previous research results [22]. However, it should be noted that synoptic-scale water vapor transport directly associated with precipitation occurs independently of its climatic state, rendering moisture sources of precipitation more complex than previously expected [23,24].
According to the nature of precipitation, the PFS precipitation can be divided into two stages [25,26,27]: frontal precipitation and monsoon precipitation. The former (latter) is before (after) the onset of the South China Sea summer monsoon (SCSSM). Previous studies demonstrated that variations of PFS water vapor transport characteristic are very clear before and after the SCSSM onset [25,28,29].
With global warming, the water cycle intensity has been strengthened, a decadal change of precipitation has been observed [30,31,32], the interannual variability of precipitation has increased, and frequent droughts and floods have been found over SC [33]. These have brought home the dramatic impact that large-scale transport of water vapor can have, given critical meteorological conditions and abnormal levels of precipitable water.
Meanwhile, some scholars [34,35,36] suggested that the Pacific Decadal Oscillation (PDO) has an interdecadal modulation effect on the precipitation. Different “background” PDO conditions (i.e., PDO positive and negative phases) may first affect the ENSO-related SST anomalies and then affect PFS precipitation over SC by modifying the intensity of the subtropical high. Since water vapor transport is one key link of precipitation formation, we speculate that the PDO may modulate interannual variation of water vapor by influencing the ENSO-related SST anomalies and then ultimately contribute to the variation of PFS precipitation over SC.
This speculation motivates us to explore the following questions: Are the ENSO-related water vapor transport anomalies the same in positive and negative phases of the PDO and ENSO? If not, what are the differences? What are the effects of these differences on frontal precipitation and monsoon precipitation, respectively?
The remainder of this paper is organized as follows. The HYSPLIT model and evaporation-precipitation method employed are introduced in Section 2. In Section 3, the effects of ENSO on water vapor transport before and after SCSSM onset with different PDO phases are analyzed, and the joint effects of PDO and ENSO on the PFS water vapor transport process over SC are obtained. In addition, Section 4 provides a summary along with a discussion.

2. Data and Methods

2.1. Data

In this study, China Meteorological Administration (CMA) precipitation data (1960–2012) for the daytime (00-12 UTC) and nighttime (12-24 UTC) drawn from 60 stations over SC (20~26° N, 107~120° E; Figure 1) are used to examine PFS precipitation characteristics. NCEP/NCAR reanalysis data (1960–2012), at 6h intervals (00:00, 06:00, 12:00, and 18:00 UTC) and with a resolution of 2.5° × 2.5°, 17 layers (1000~10 hPa), including temperature, specific humidity, and wind, are used as input data to simulate the tracks of air parcels moving involved in PFS precipitation over SC, and used to quantitatively compute the contribution of each water vapor source. The definitions and data of PDO and Niño 3.4 indicators are from the NOAA website (https://psl.noaa.gov/ accessed on 2 July 2022).

2.2. Methods

The Lagrangian particle dispersion model (HYSPLIT 4.9) is used to simulate the trajectories of air parcels formed during PFS rain events. The air parcels at three levels (1000 m, 1500 m, and 3000 m) over 60 stations are selected. The backward trajectories are integrated 240 h (10 days) backward in time from all starting points (02UTC and 14UTC of the duration of each April–June rain event), the position of the trajectory point is output every hour, and the air block specific humidity at the position is obtained by interpolation, resulting in 716416 tracks [28].
According to the “Evaporation-Precipitation budgets” proposed by Stohl and James [12], the source and sink of water vapor on the water vapor transport tracks are determined. When the specific humidity of the air block along the backward track increases, it indicates that there is water vapor flowing into the air block, and the position of the air block is the source. The specific humidity decrease are linked to sinking. By calculating the cumulative specific humidity variation in each unit along the track within a unit time step, the climatic sources, and sinks of water vapor (1960–2012) are shown in Figure 2. When the air parcels travel toward SC, they uptake water vapor from tropical IO, BOB, SCS, WP, and Eurasia. The Indo-China Peninsula and SC are major sink areas of water vapor. In addition, water vapor sources of PFS precipitation events can be divided into five categories: IO, BOB, East China (EC), WP, and SCS.
The contribution rate of the precipitation over SC from per source region is computed by using a valid areal source-receptor attribution method [15].

2.3. Division of Frontal Precipitation and Monsoon Precipitation in the Pre-Rainy Season over SC

The nature of precipitation will change significantly before and after SCSSM onset [26,37]. According to the definition from Zheng et al. [26], if the 100 hPa zonal wind over the area (20–23° N, 110–120° E) changes from westerly to easterly and lasts for more than 5 days, then the first day is the start date of monsoon precipitation. Based on the NCEP/NCAR reanalysis data, it is calculated that the climatic mean onset date of monsoon precipitation is 16 May (1960–2012) over SC.

3. Results

PDO is the strongest interdecadal signal in the North Pacific, and ENSO is the strongest signal of interannual change in the global climate system. There is a correlation between them, and there is a synergistic effect on the precipitation in PFS over South China [34,35,36,38].

3.1. ENSO Events in the Context of PDO

The monthly PDO index is a 12-year low-pass filtered by the CMA [39]. After filtering, The period of 1960–2012 can be divided into three phases [28]: 1961–1976 (cold), 1977–1998 (warm), and 1999–2012 (cold).
The SST anomaly averaged over the Niño3.4 region of (5° S~5° N, 120~170° W) is taken as an ENSO index. An El Niño (La Niña) event of ENSO is defined as the 3-month running mean of SST anomalies in the Niño3.4 region exceeding 0.5 °C (less than −0.5 °C) for a minimum of five consecutive months. The ENSO events during 1960–2012 are classified, and the list of ENSO positive and negative phase years is given in the context of PDO (Table 1). Based on the PDO and ENSO phases, their phase combinations are divided into four types: (1) PDO+ (the positive PDO phase) & ENSO+ (the positive ENSO phase), (2) PDO+ & ENSO− (the negative ENSO phase), (3) PDO− (the negative PDO phase) & ENSO+, (4) PDO− & ENSO−.

3.2. Impact of ENSO on the Water Vapor Transport Process of Precipitation in PFS over SC with PDO Context

The synergistic effects of PDO and ENSO on the water vapor transport process are introduced from four aspects: water vapor spatial distribution, water vapor transport trajectory, water vapor contribution of precipitation source, and characteristics of atmospheric circulation.

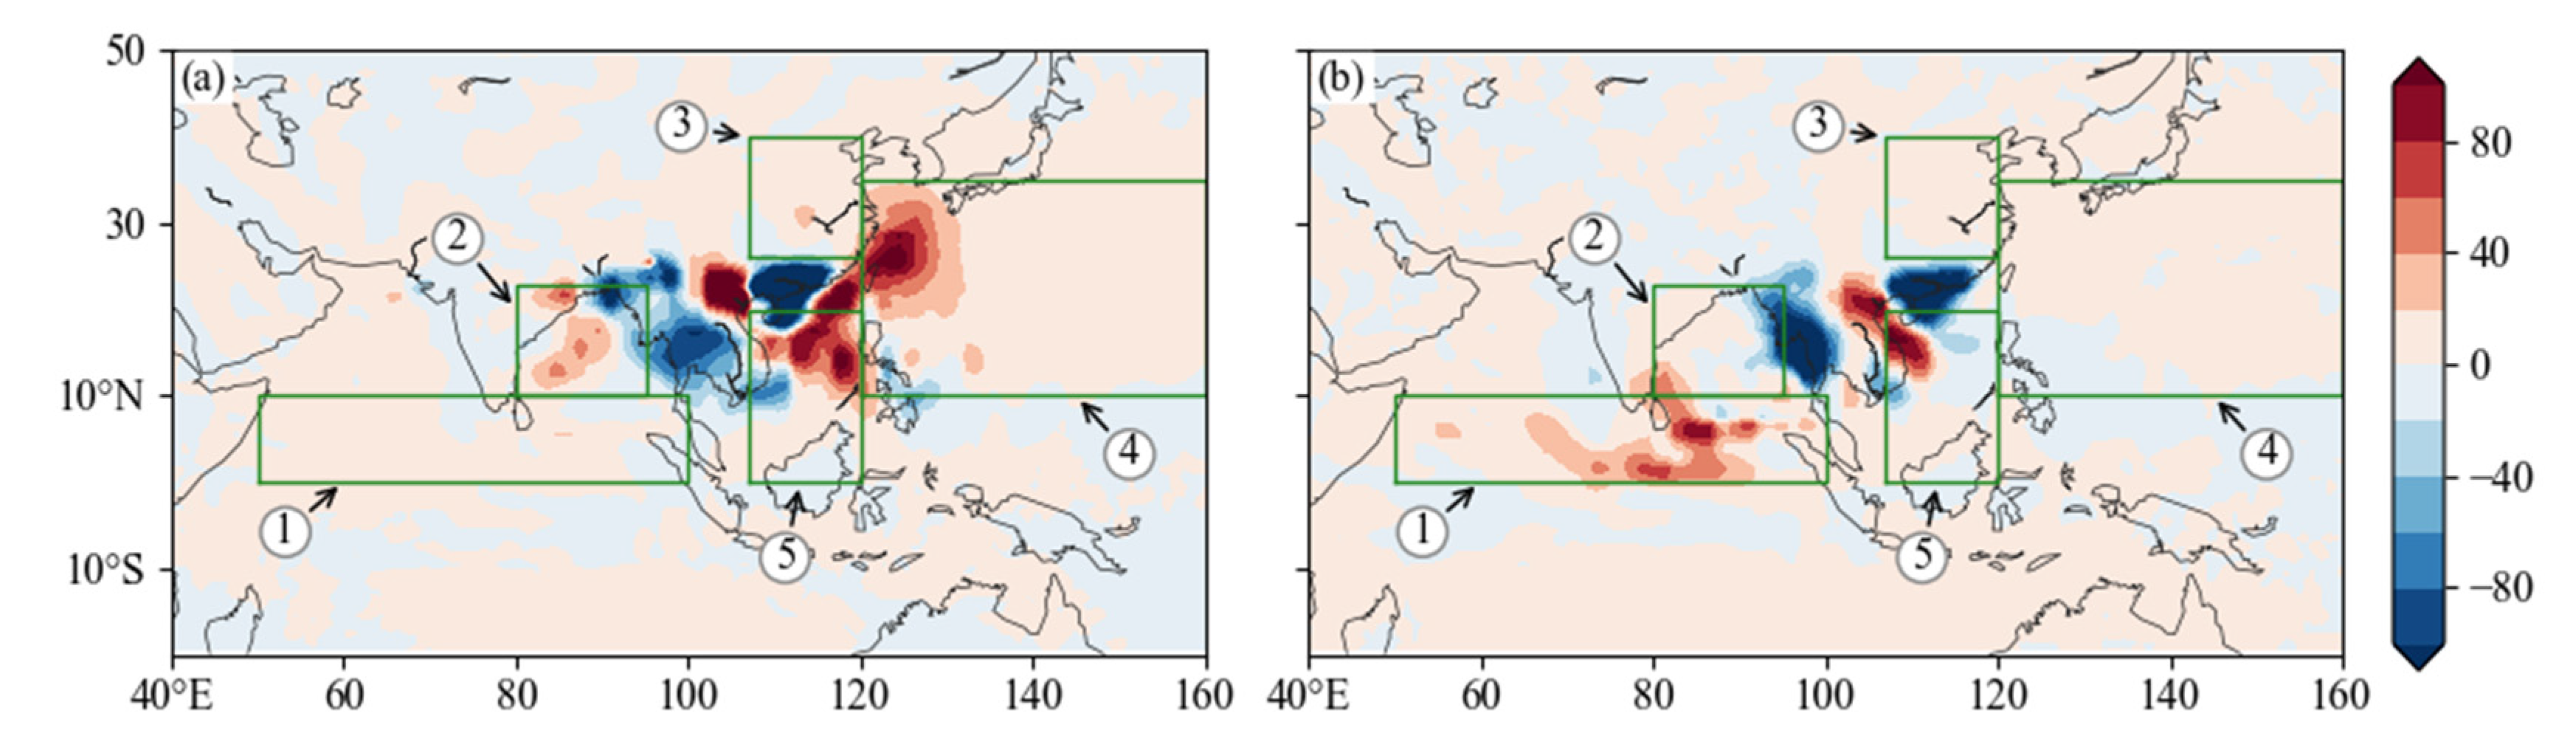
3.2.1. Spatial Distribution of Water Vapor

Figure 3 shows the water vapor difference between ENSO+ and ENSO− for different PDO contexts in water vapor transport processes involved in PFS precipitation cases. For the frontal precipitation (Figure 3a–f), 10 days before the water vapor reaches SC, in PDO+ (Figure 3a), there is more water vapor for the ENSO+ than that of ENSO− over IO, BOB, SCS, and WP. In PDO− (Figure 3d), the strength and coverage of the positive difference being reduced. Even the negative difference appears in WP. Five days ago, the water vapor difference was larger for PDO+ (Figure 3b) than that PDO− (Figure 3e) over BOB-SCS. Two days ago, the different the distribution of water vapor was basically the same, and the difference between PDO+ was greater than that of PDO− over the north of BOB-SCS (Figure 3c,f). For monsoon precipitation, when PDO and ENSO are in phase resonance, water vapor gathers over IO-BOB-SCS (Figure 3g–i). The negative difference over the tropical IO indicates that the water vapor is the most abundant for PDO− & ENSO− (Figure 3j).

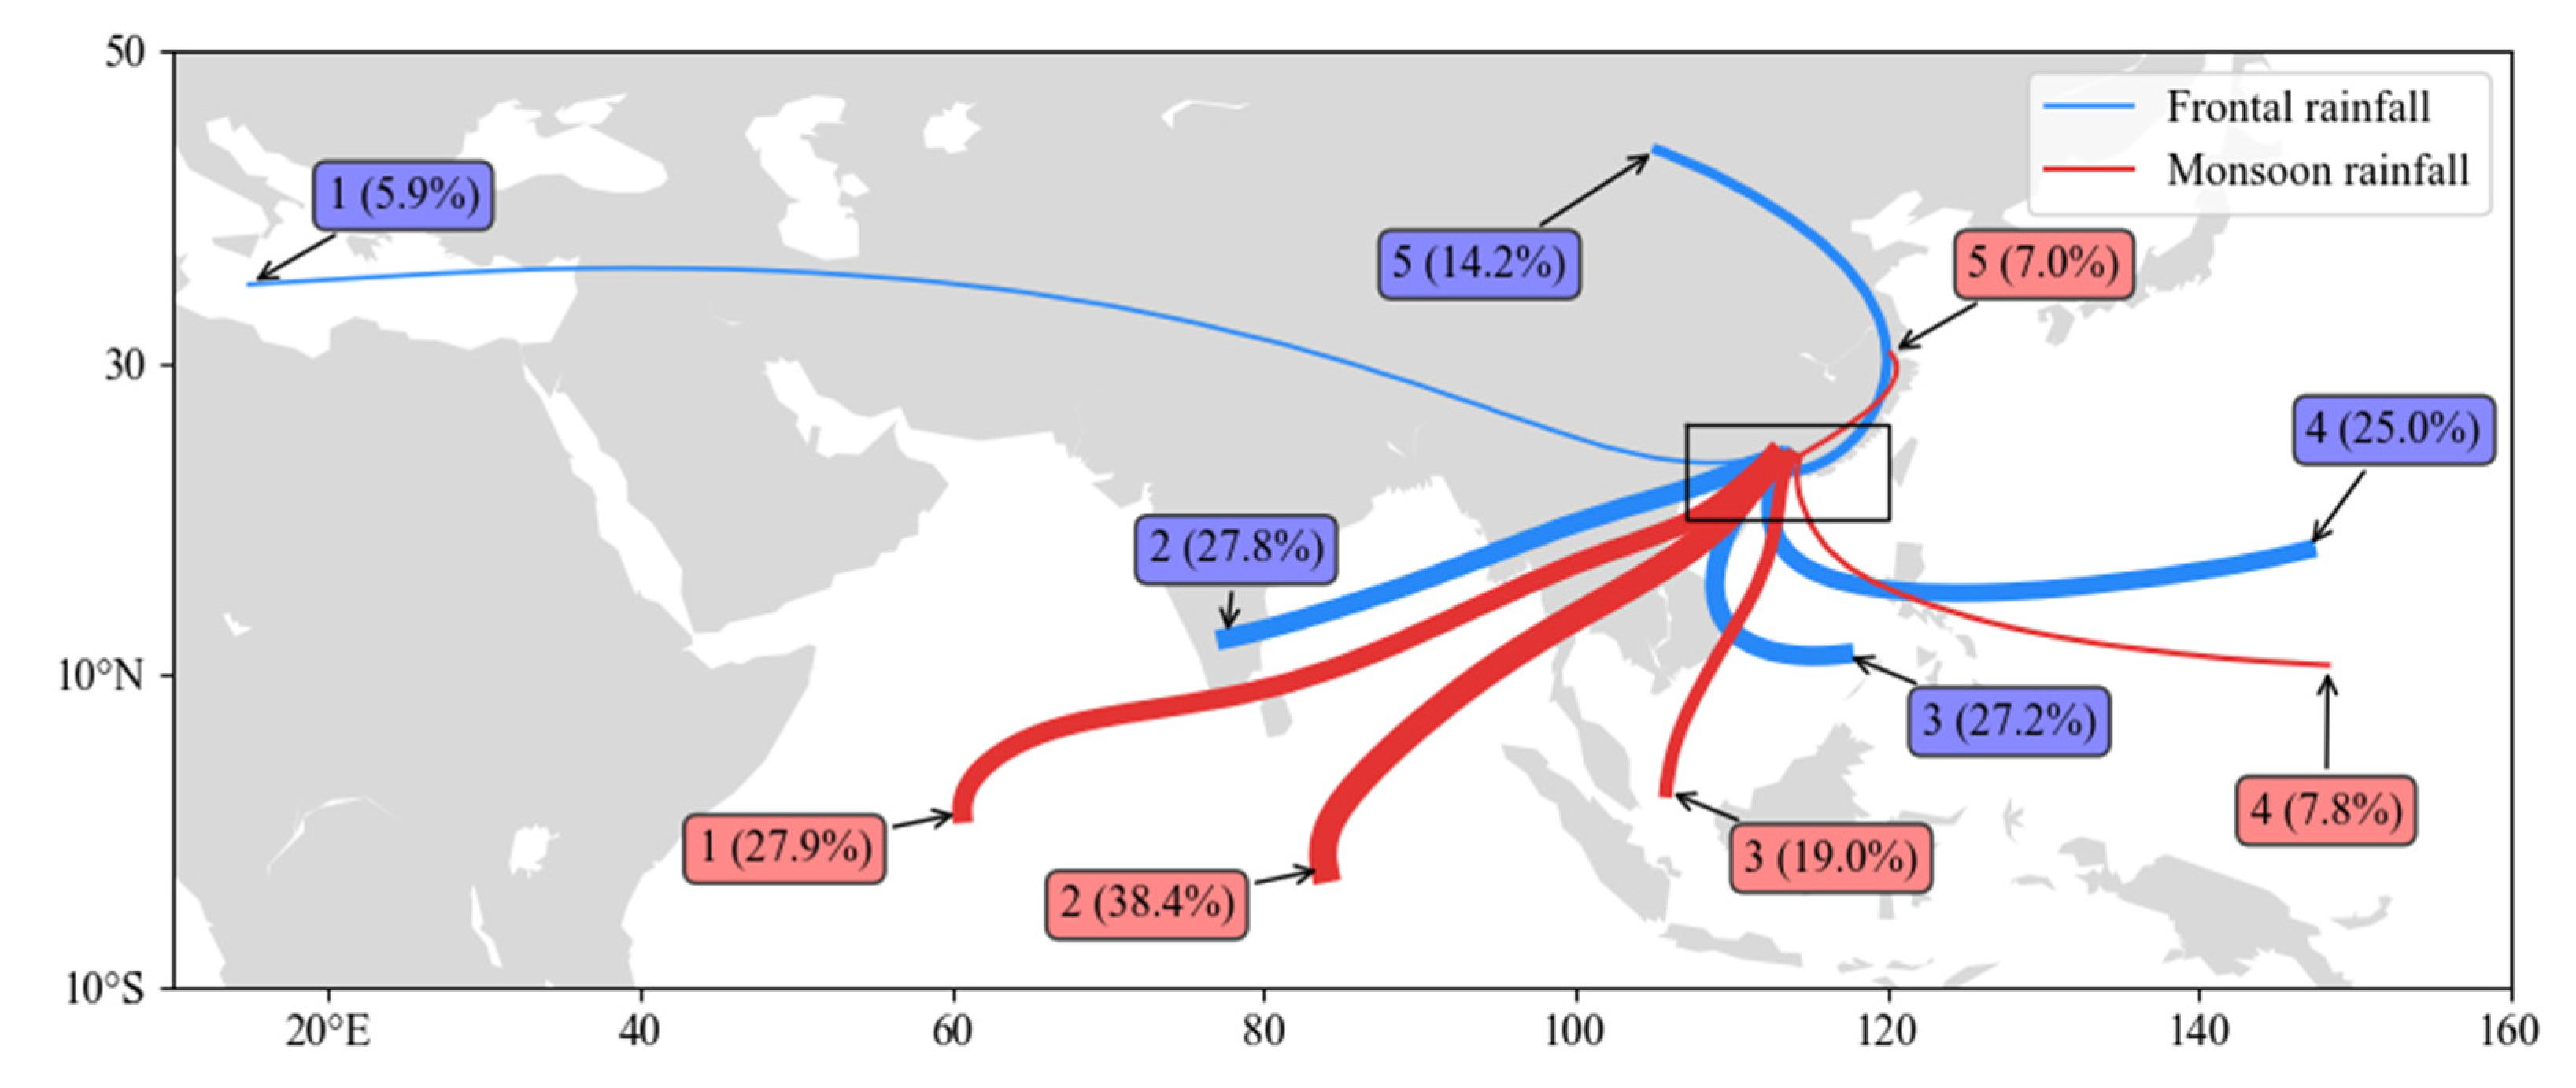
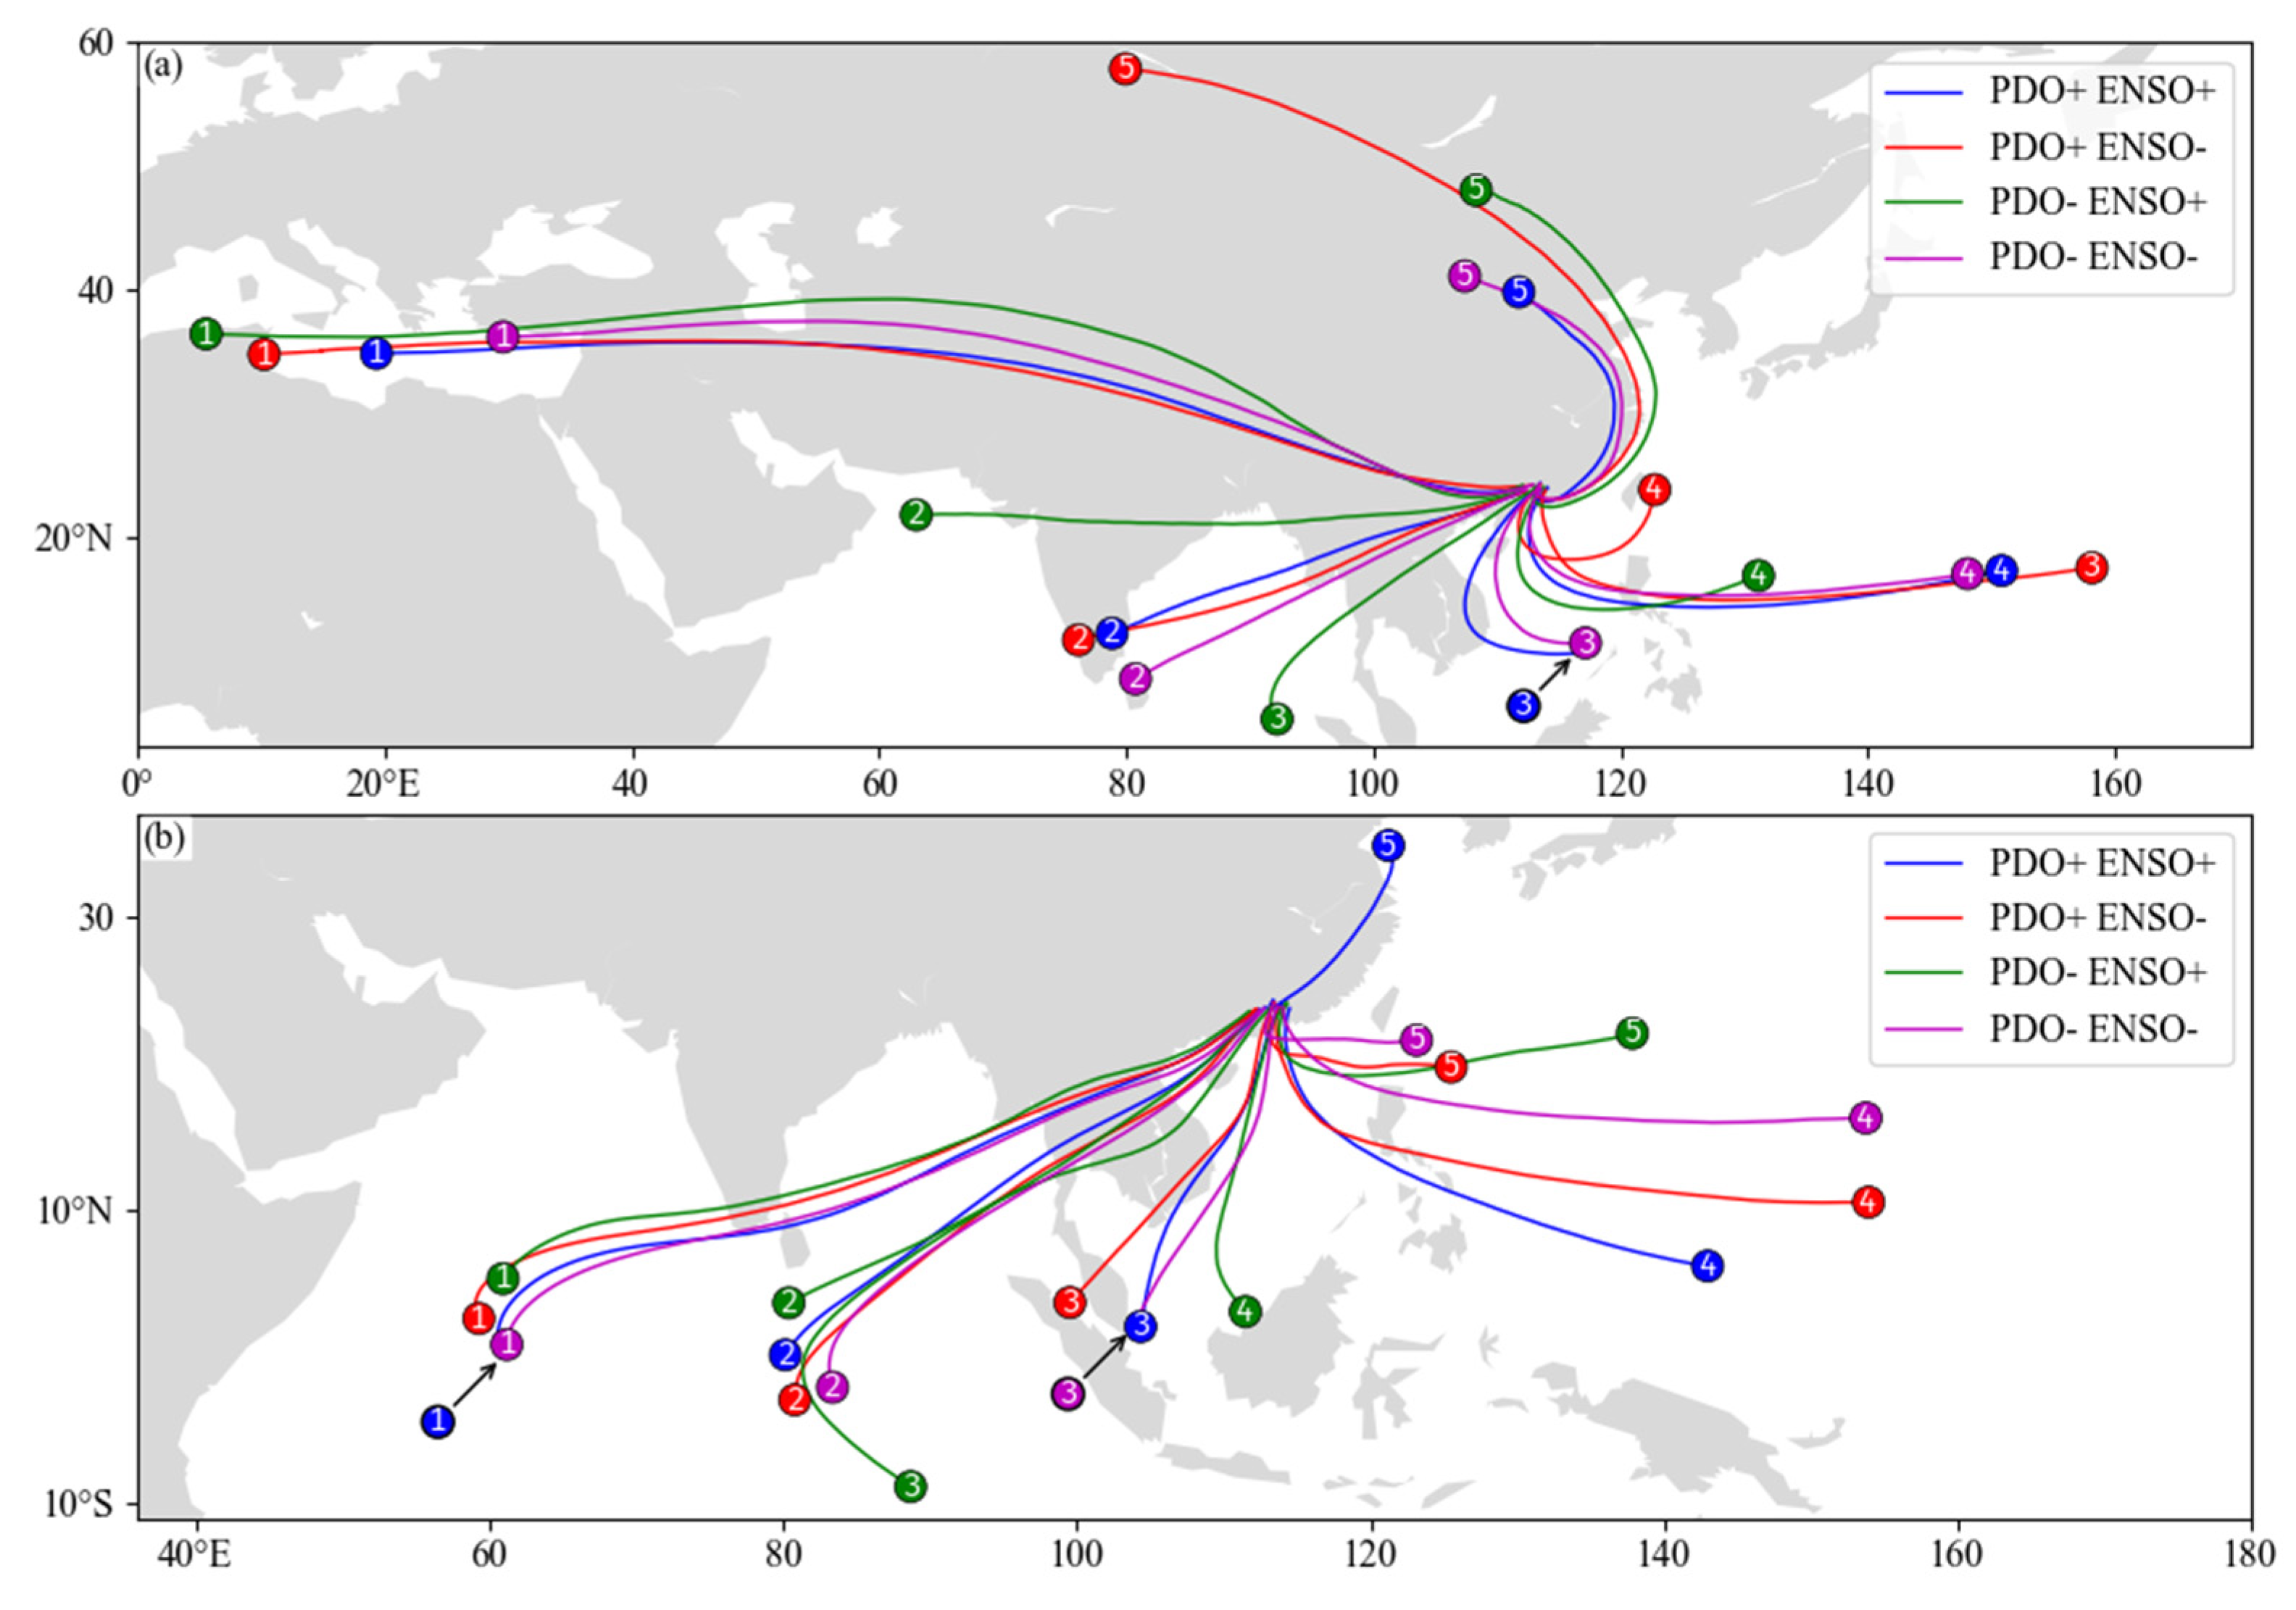
3.2.2. Water Vapor Transport Trajectory

For frontal precipitation (Figure 4a, Table 2), PDO+ & ENSO+ compared with PDO+ & ENSO−, there is less water vapor from the Mediterranean-Eurasia inland and SCS, while more water vapor from IO-BOB, WP, and EC. PDO− & ENSO+ compared with PDO− & ENSO−, there is more water vapor transported by four paths, except the south branch from SCS. The cluster tracks from the Mediterranean-Eurasia inland (tracks labeled 1) are basically consistent. The track of PDO+ & ENSO− (red track 1, with 41.37% track number and 44.67% precipitation efficiency) is the strongest, track of PDO− & ENSO− (purple track 1, with 7.6% track number and 5.74% precipitation efficiency) is the weakest. The southwesterly water vapor transport tracks (IO-BOB-IndoChina Peninsula-SCS-SC), controlled by the Indian summer monsoon (tracks labeled 2), account for 10–30% of the total tracks, track of PDO+ & ENSO+ (blue track 2, with 31.16% track number and 33.8% precipitation efficiency) is the strongest. The southeasterly water vapor transport tracks (SCS-SC), controlled by the SCSSM (track labeled 3), track of PDO− & ENSO+ (green track 3, with 3.64% track number and 1.5% precipitation efficiency), is the weakest. Southeasterly water vapor transport tracks from WP, controlled by the East Asian summer monsoon (track labeled 4), track of PDO− & ENSO+ (green track 4, with 27.73% track number and 32.84% precipitation efficiency) is the shortest and strongest. Among the four tracks from East China, the track of PDO+ & ENSO− (red track 5, with 8.06% track number and 3.85% precipitation efficiency) is the longest and lowest.
For monsoon precipitation (Figure 4b, Table 2), PDO+ & ENSO+ compared with PDO+ & ENSO−, there is less water vapor which from IO, WP, and EC, and water vapor from BOB and SCS is more. PDO− & ENSO+ compared with PDO− & ENSO−, the water vapor from BOB and SCS is more, and the water vapor from the western IO and WP is less.

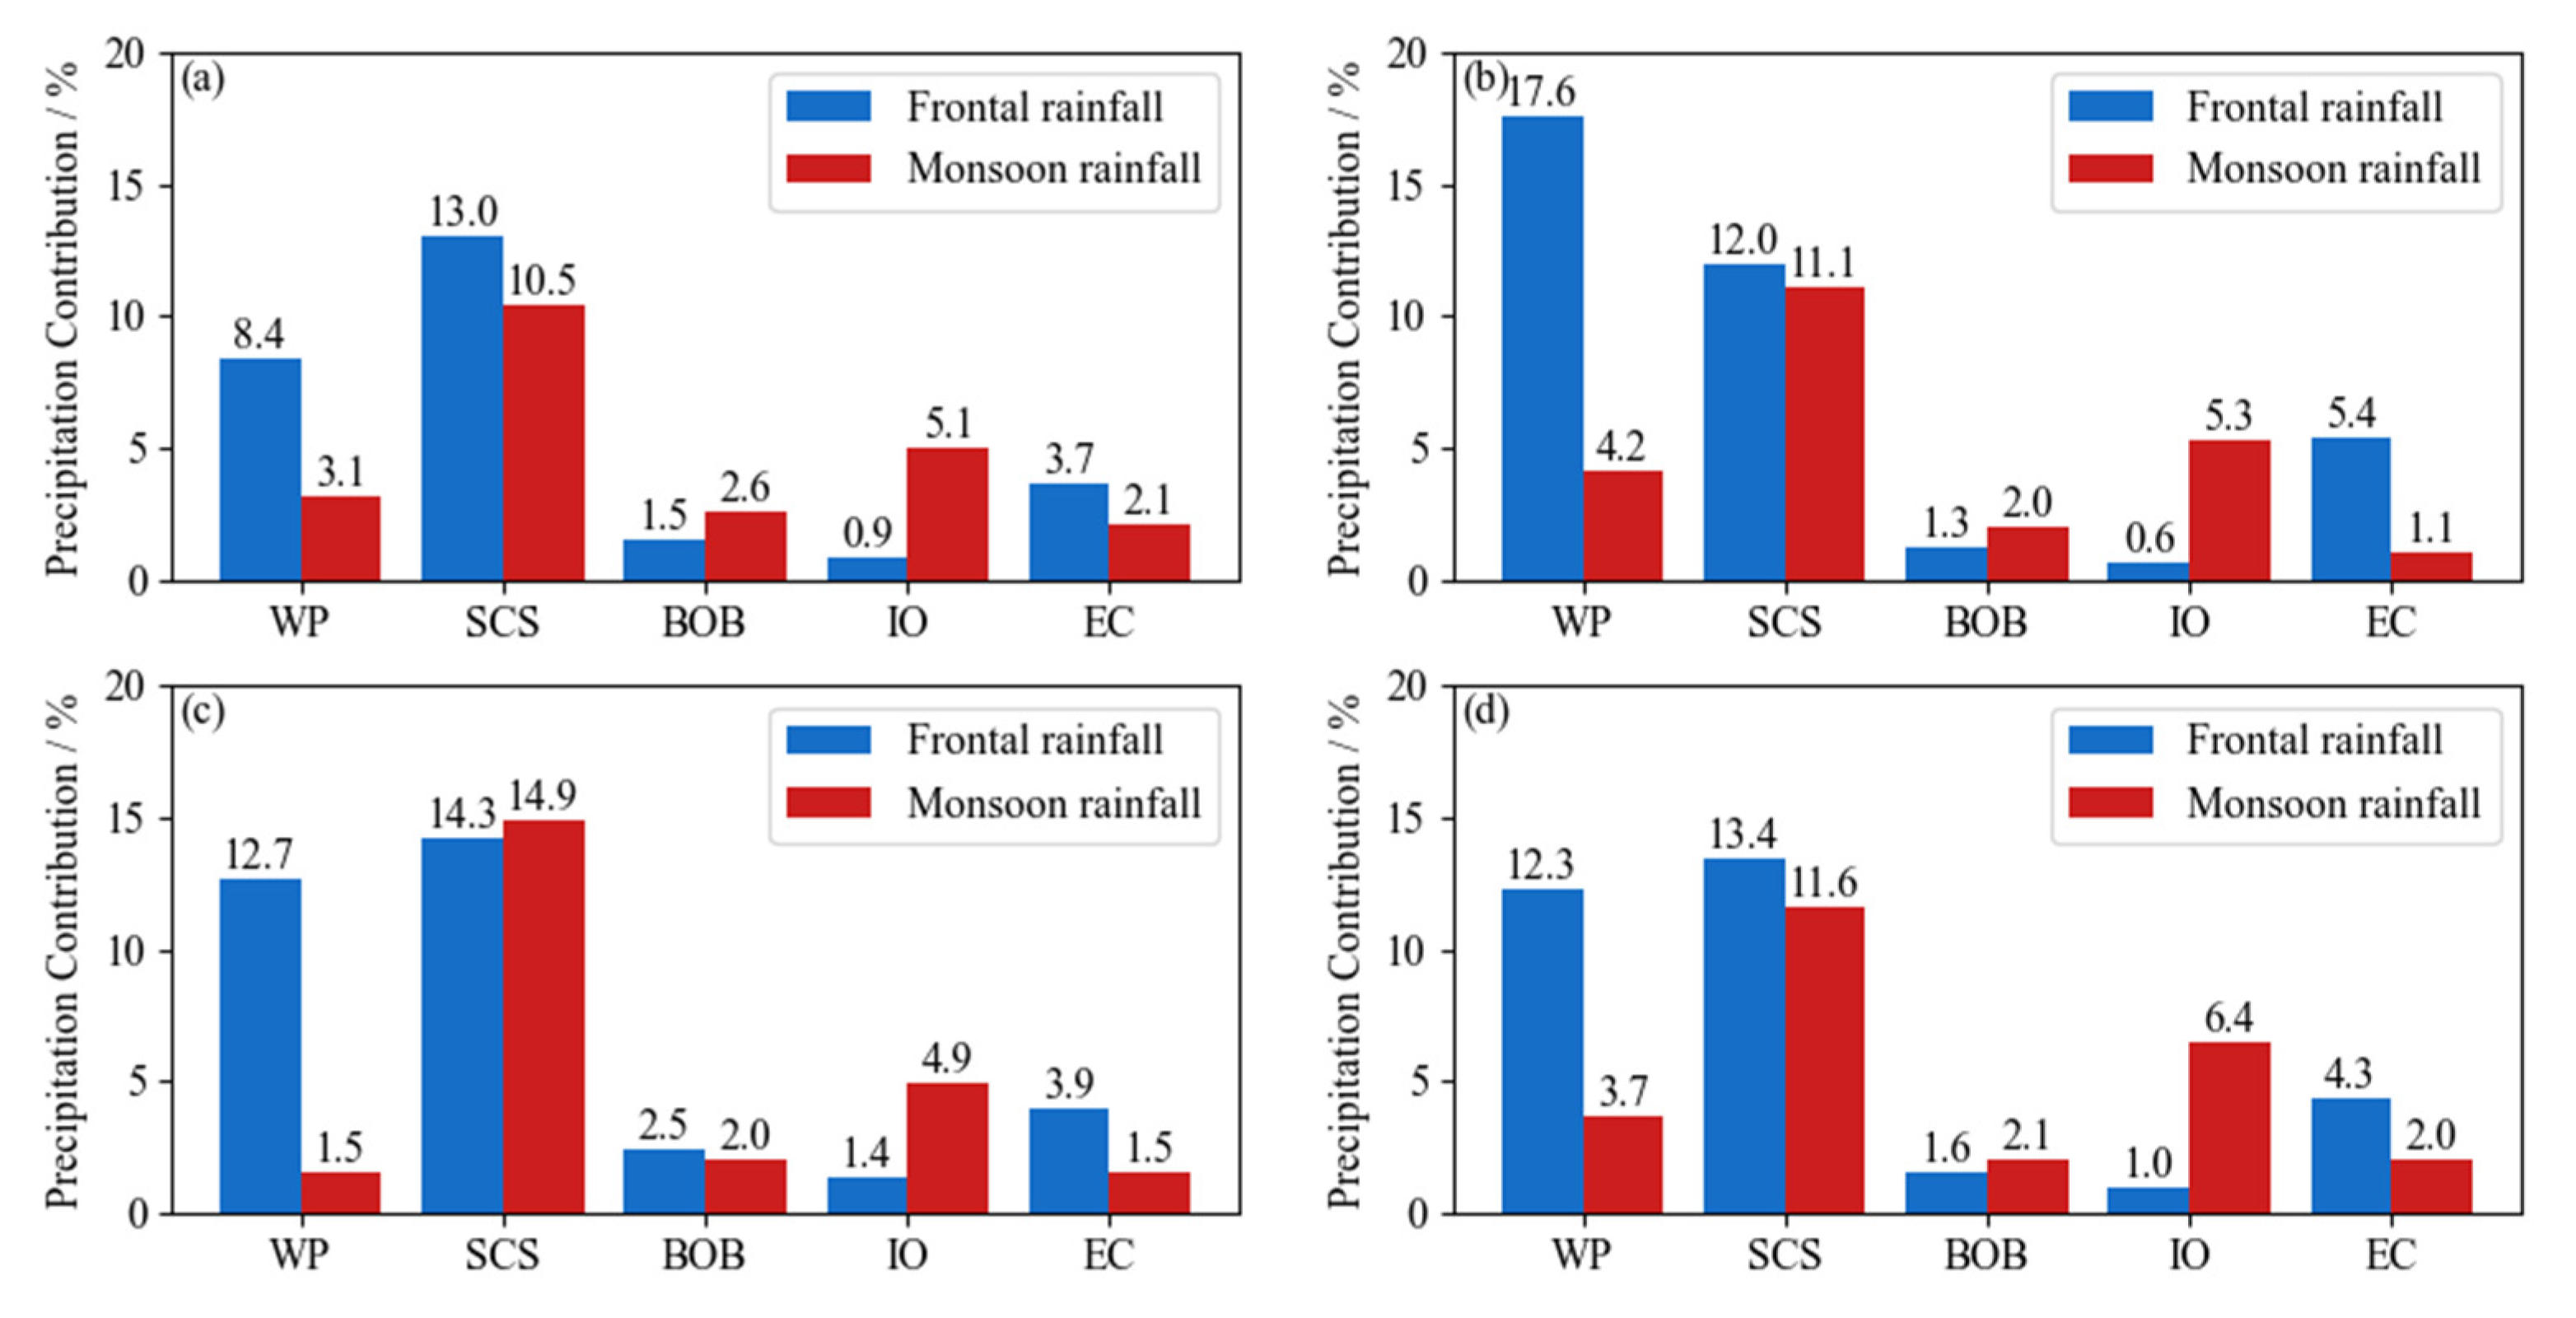
3.2.3. Water Vapor Contribution of PFS Precipitation Sources over SC

Figure 5 shows the precipitation contribution rates of each key area for four PDO & ENSO phase combinations. For frontal precipitation, WP and SCS are two important regions as rain contributors. The contribution rate of water vapor from WP is maximum (17.6%) in PDO+ & ENSO−, and the minimum (8.4%) appears in PDO+ & ENSO+. The contribution rate of water vapor from SCS is relatively stable, and the maximum value (14.3%) appears in PDO− & ENSO+. The contribution of water vapor from BOB, IO, and BOB is relatively small, and its amplitude is small. For monsoon precipitation, SCS and IO are important rain contributor sources. The contribution of water vapor from SCS (10.5%) is the least for PDO+ & ENSO+, and that of PDO− & ENSO+ is the highest (14.9%). The contribution rate of water vapor from IO varies from 4.9% to 6.4%. The contribution rate of water vapor from WP drops to the third (range from 1.5% to 4.2%), and the contribution rate of BOB and EC is still low.

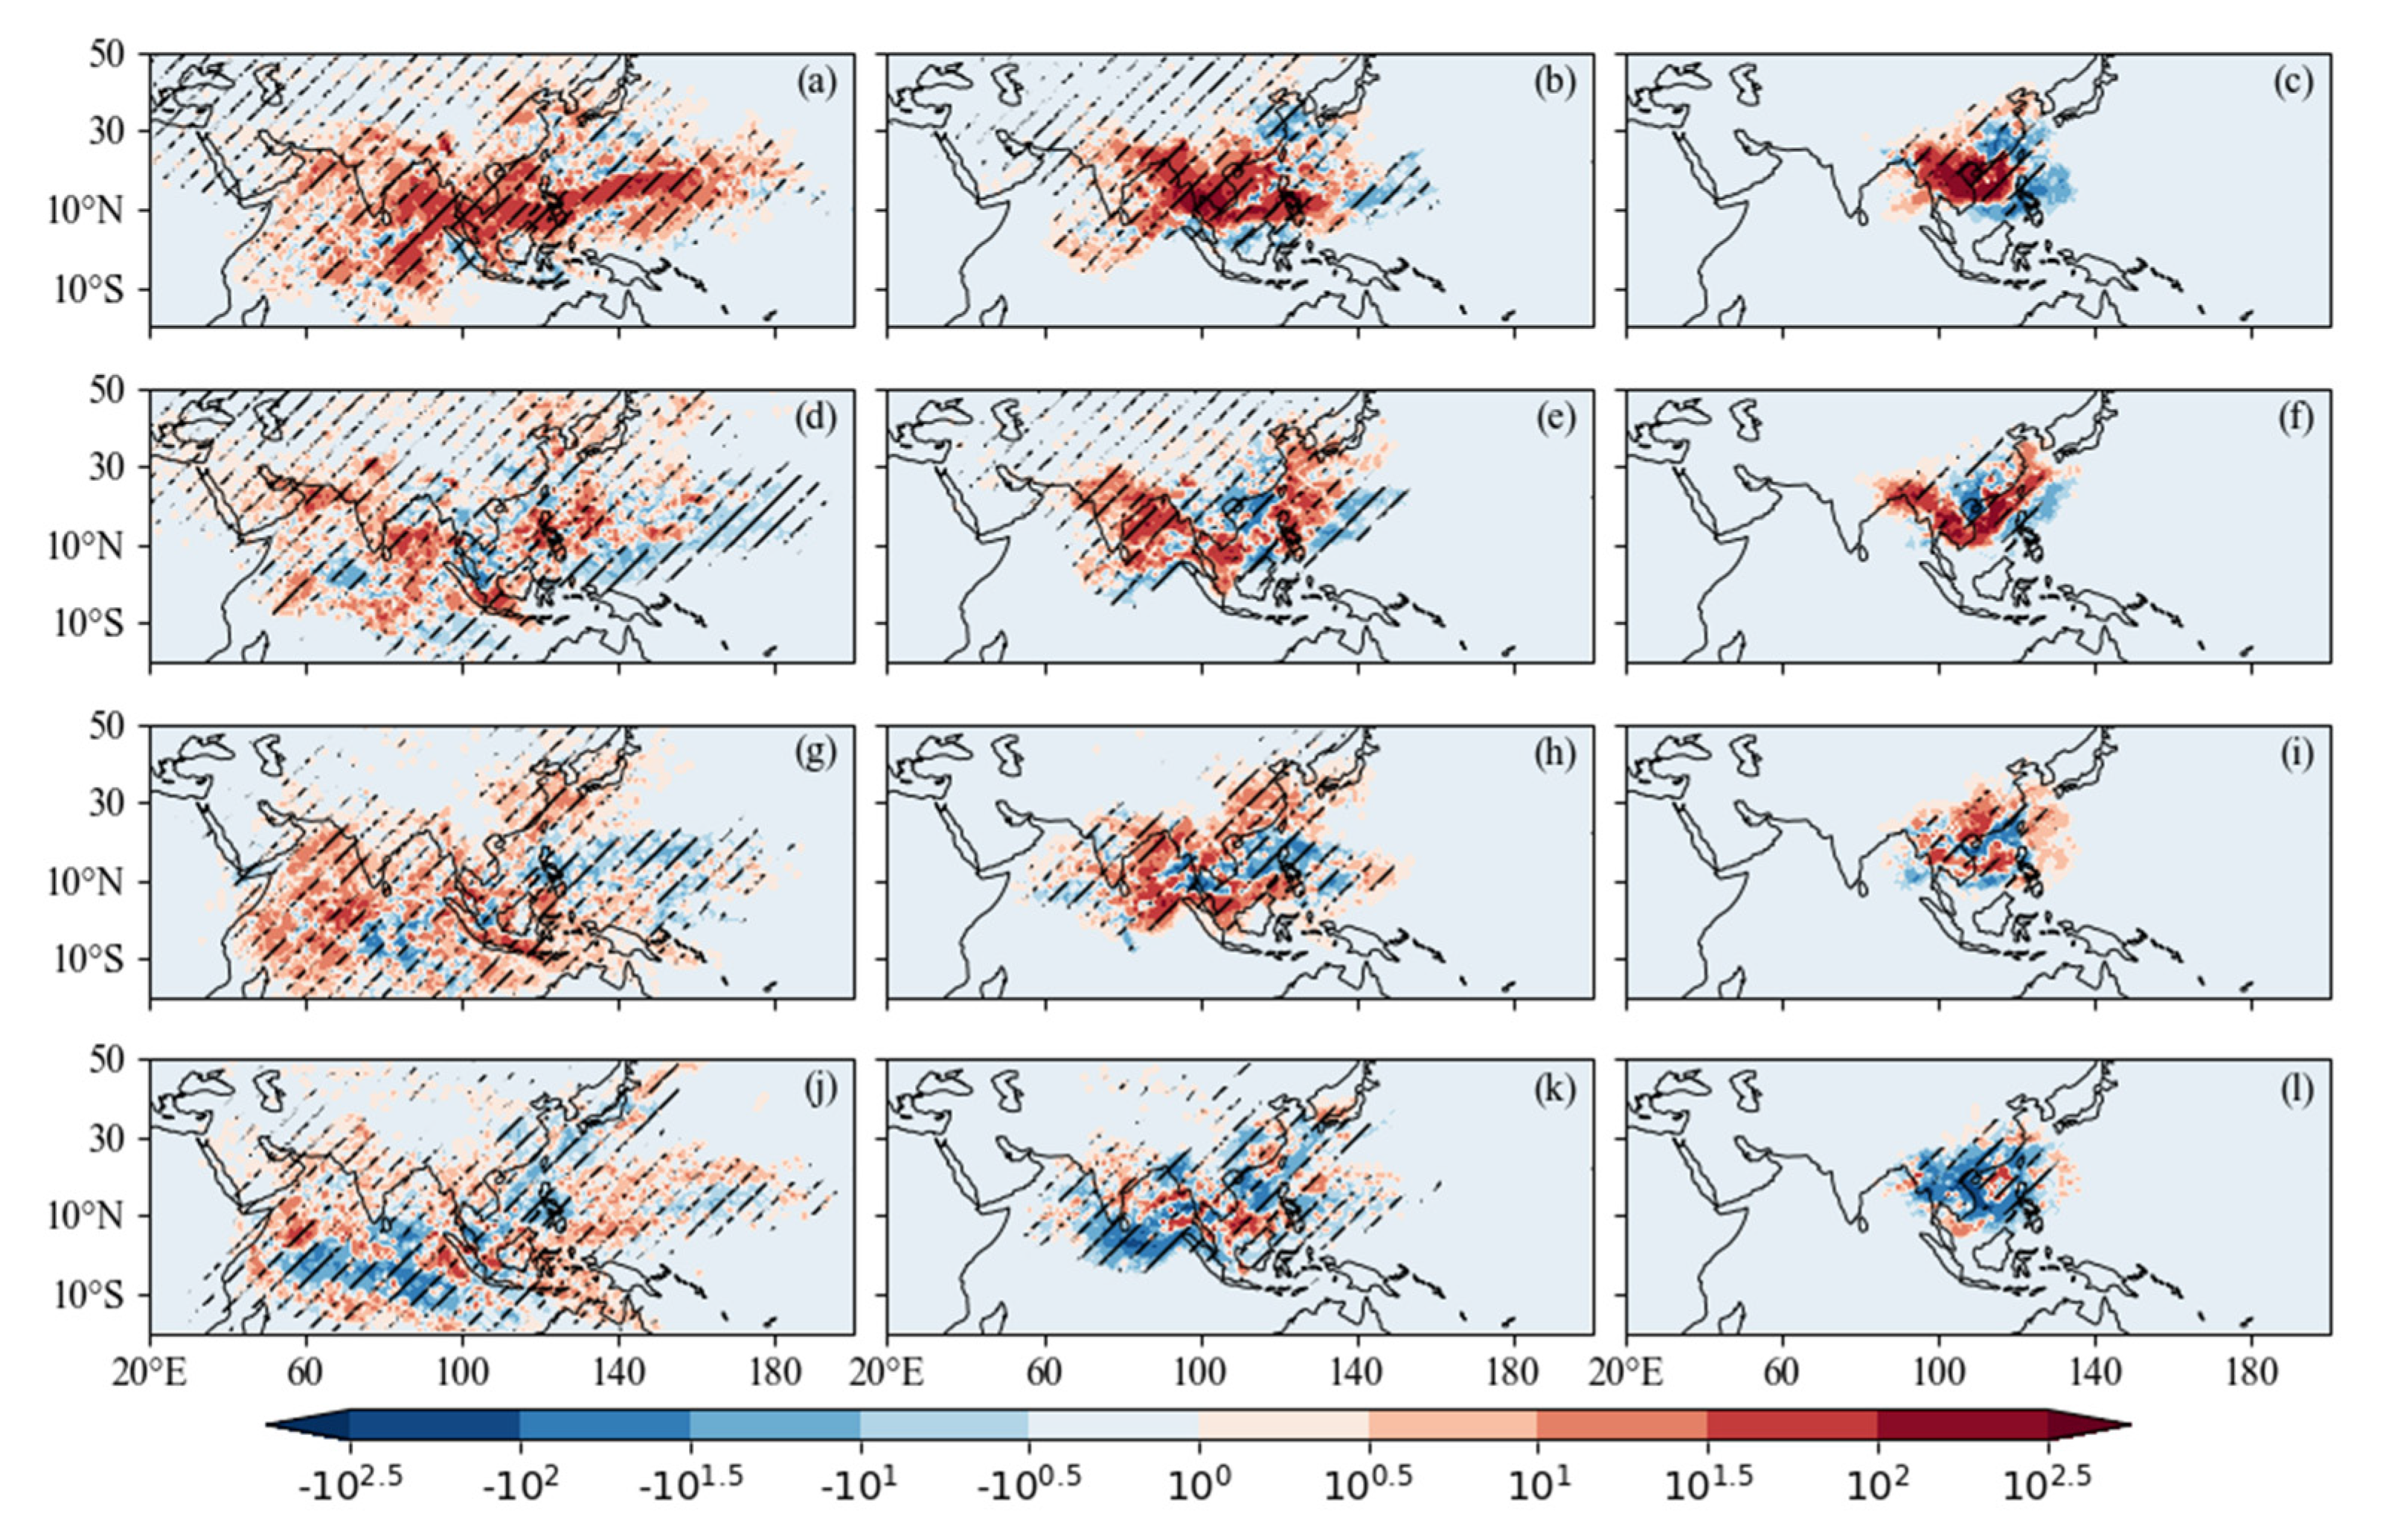
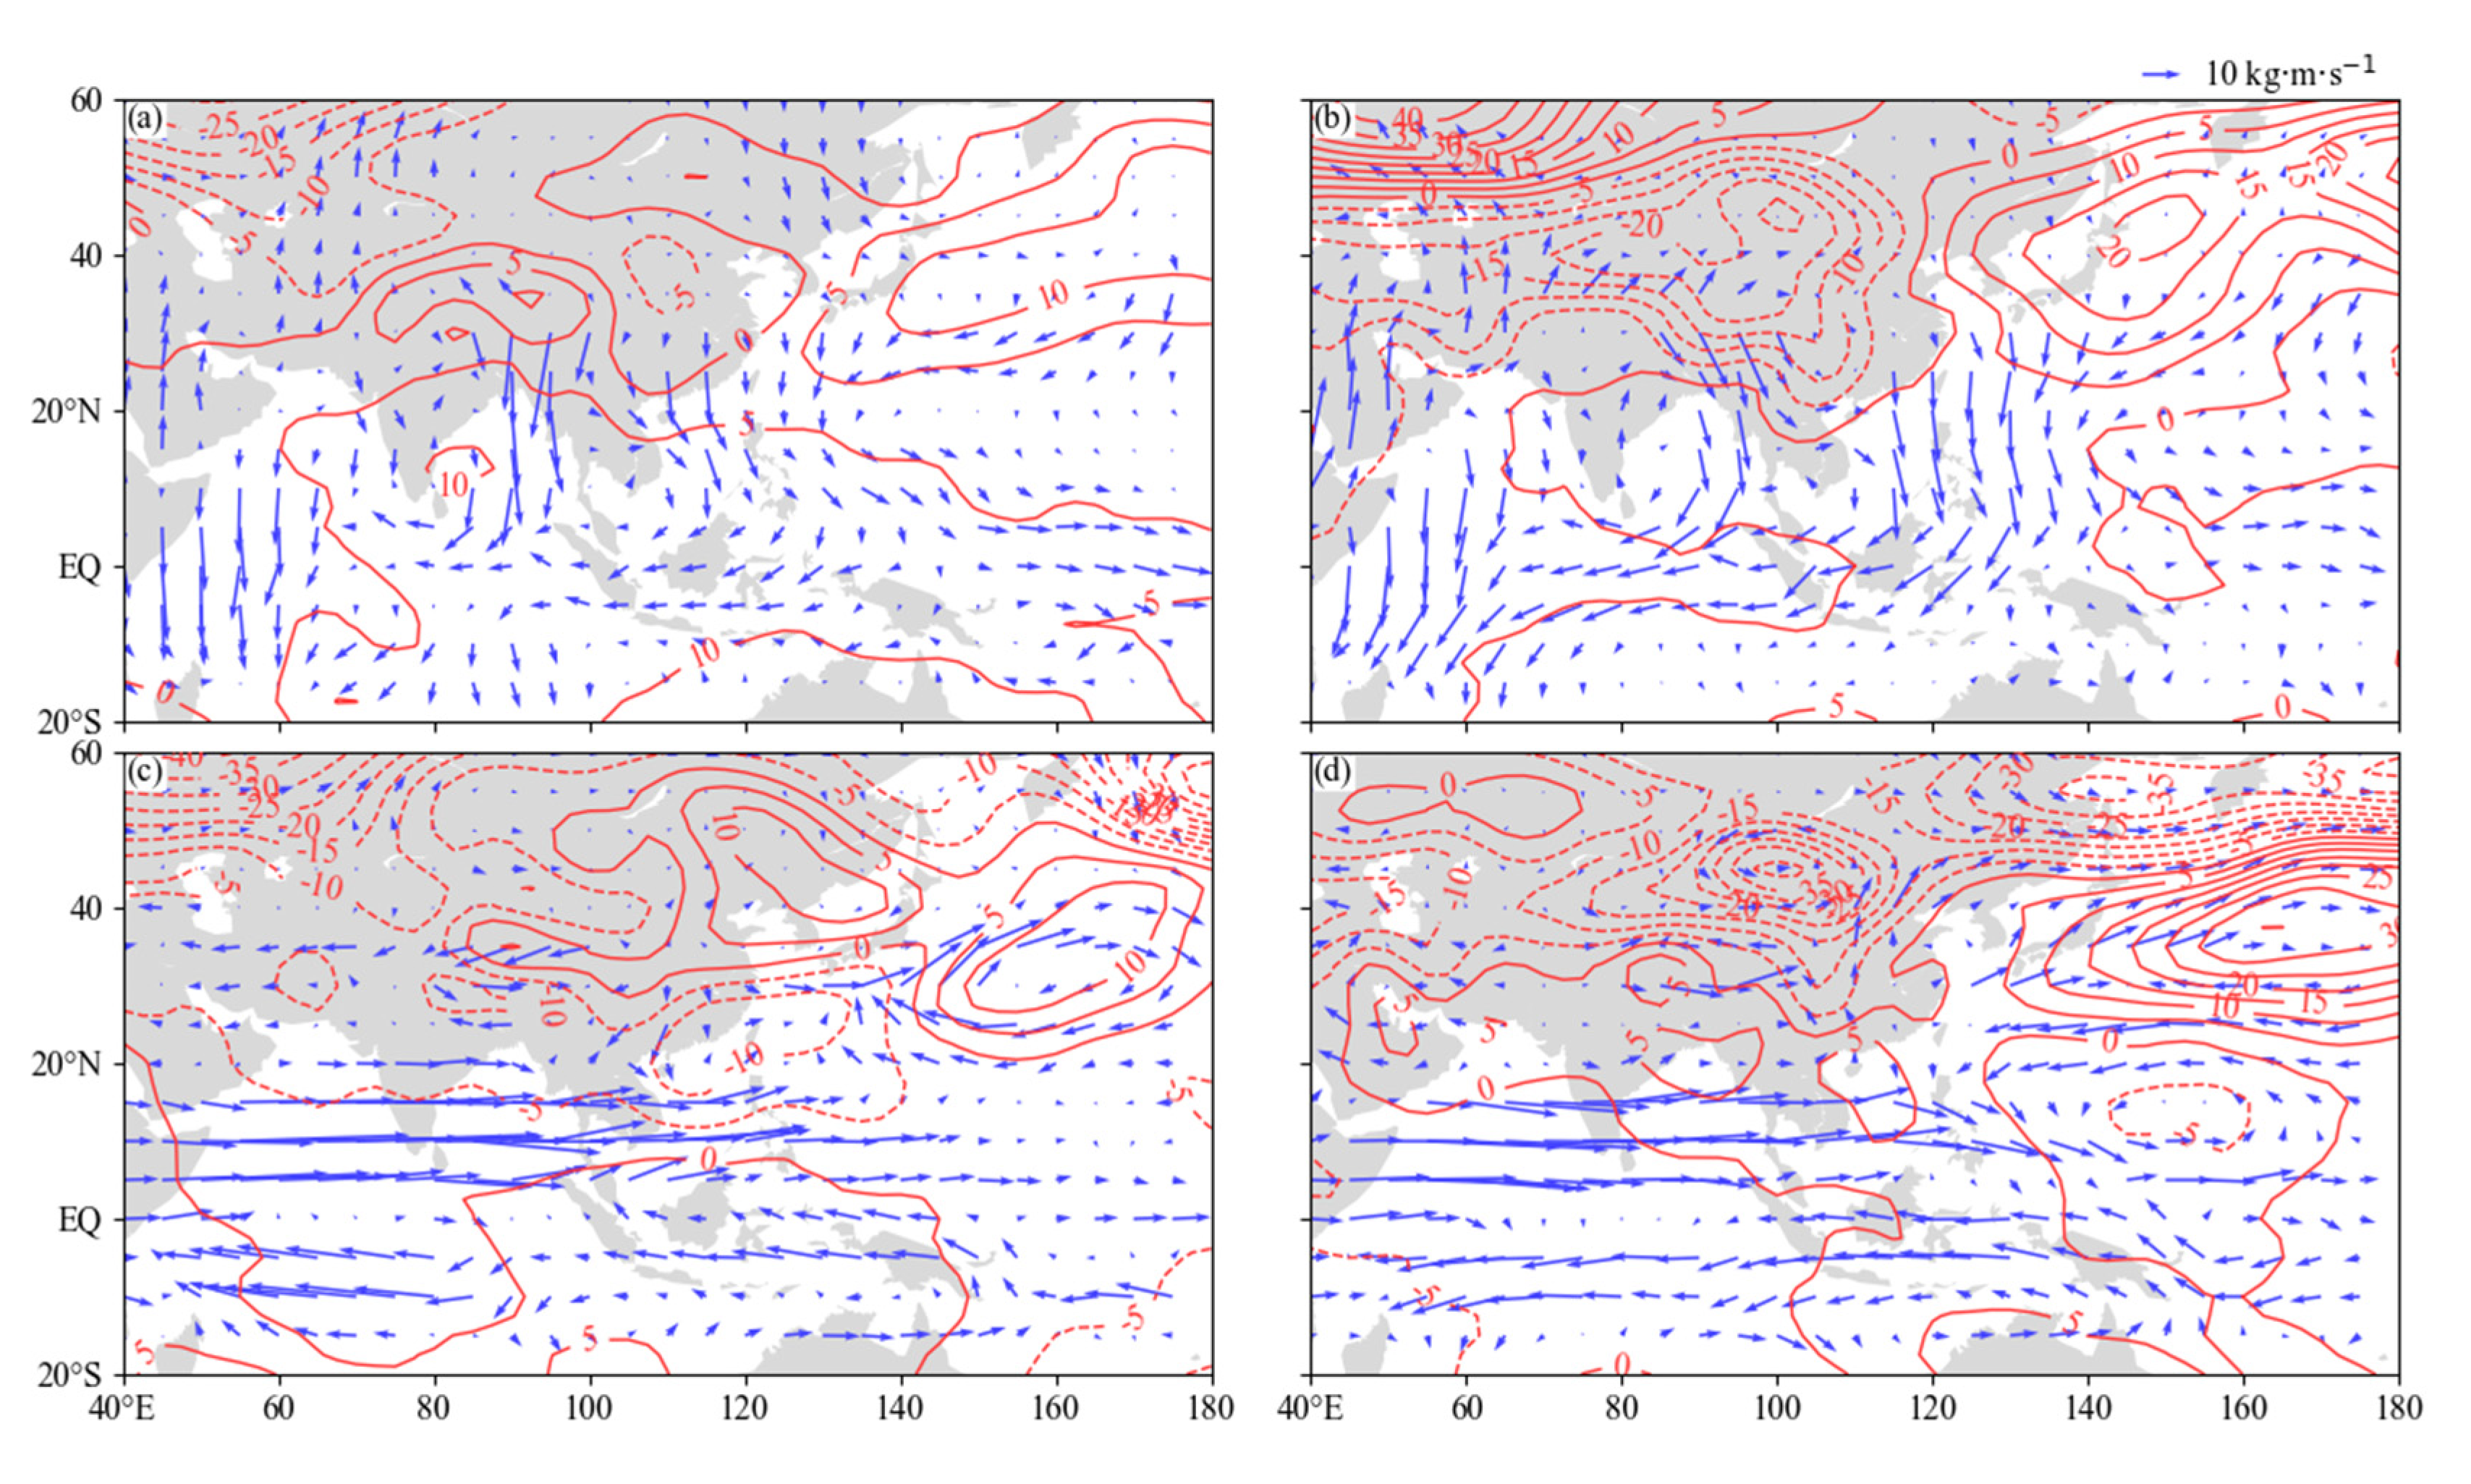
3.2.4. Circulation Characteristics

Figure 6 shows the differences between 850 hPa height field and water vapor flux in the whole layer (ENSO+ minus ENSO−) in PFS over SC with the PDO context. For frontal precipitation (Figure 6a,b), regardless of the phase of PDO, ENSO+ compared with ENSO−, there is a southward water vapor transport anomaly over the western part of BOB-SCS-ocean east of the Philippines, indicating that there is less water vapor transport from these areas to SC. For monsoon precipitation (Figure 6c,d), there is a strong anticyclonic anomaly over the Northwest Pacific, which means that the western Pacific subtropical high is stronger, thus making the easterly anomaly in the south of the subtropical high sends more water vapor from WP to SC. Meanwhile, the strong westerly anomalies in the IO-BOB-SCS increases its water vapor transporting to SC.

4. Conclusions

(1) For the frontal precipitation, in PDO+, there is a great positive water vapor difference (ENSO+ minus ENSO−) over IO, BOB, SCS, and WP (Figure 3a), the distribution of the difference is restructured in PDO−. With the approaching a precipitation event over SC, the large water vapor difference converges to BOB and SCS. For monsoon precipitation, when PDO and ENSO are in phase resonance, water vapor gathers over IO-BOB-SCS (Figure 3g,j).
(2) For the frontal precipitation, both PDO+ and PDO−, compare with ENSO+, more water vapor from SCS for ENSO− (Figure 4a, Table 2), but there is a southward water vapor transport anomaly over the western part of BOB-SCS-ocean east of the Philippines, and resulting a decline in precipitation contribution rate of SCS water vapor (Figure 5, 12.0 < 13.0, 13.4 < 14.3). Both ENSO+ and ENSO−, compare with PDO−, more water vapor comes from IO-BOB for PDO+ (Table 2), but their precipitation contribution rates are lower (Figure 5, 1.5 < 2.5, 0.9 < 1.4, 1.3 < 1.6, 0.6 < 1.0). More water vapor transport from SCS, WP, and EC to SC for PDO− (Table 2), and only the water vapor precipitation contribution rate of SCS is higher (Figure 5, 14.3 > 13.0, 13.4 > 12.0) for its short transport track (Figure 4a, purple tracks 3).
(3) For the summer monsoon precipitation, both PDO+ and PDO−, compare with ENSO+, there is more water vapor from the IO and WP for ENSO−, the easterly anomaly in the south of the stronger subtropical high (Figure 6a,b) brings more water vapor from WP to SC (Figure 4a, Table 2), the strong westerly anomalies in the IO-BOB-SCS increases IO water vapor transporting to SC, so water vapor precipitation contribution rates of IO and WP are higher (Figure 5, 5.3 > 5.1, 6.4 > 4.9, 4.2 > 3.1, 3.7 > 1.5). Both ENSO+ and ENSO−, compared with PDO−, more water vapor comes from SCS and EC for PDO+ (Table 2), but SCS precipitation contribution rates are lower (Figure 5, 10.5 < 14.9, 11.1 < 11.6).
(4) The water vapor transport process of precipitation in PFS over SC is jointly affected by ENSO and PDO. The four combinations of ENSO and PDO phases have different water vapor transport characteristics.

Author Contributions

Conceptualization, L.F.; methodology, G.Z.; software, G.Z.; validation, G.Z. and J.L.; formal analysis, L.F.; investigation, G.Z.; resources, J.L.; data curation, G.Z.; writing—original draft preparation, L.F. and G.Z.; writing—review and editing, L.F.; visualization, G.Z.; supervision, G.Z.; project administration, L.F.; funding acquisition, L.F. All authors have read and agreed to the published version of the manuscript.

Funding

This research was funded by the National Key Research and Development Program of China No.2021YFC3000804 and by Guangdong Provincial College Innovation Team Project No.2019KCXTF021,Project of university innovation team No.060313452101.

Data Availability Statement

Publicly available datasets are analyzed in this study. All data used in this paper is available in the relevant organizations described in the Section 2.1.

Acknowledgments

We would like to acknowledge all data used in this paper, which are available in the relevant organizations described in the Section 2.1.

Conflicts of Interest

The authors declare no conflict of interest.

References

  1. van der Ent, R.J.; Wang-Erlandsson, L.; Keys, P.W.; Savenije, H.H.G. Contrasting roles of interception and transpiration in the hydrological cycle—Part 2: Moisture recycling. Earth Syst. Dyn. 2014, 5, 471–489. [Google Scholar] [CrossRef] [Green Version]
  2. Gimeno, L.; Drumond, A.; Nieto, R.; Trigo, R.M.; Stohl, A. On the origin of continental precipitation. Geophys. Res. Lett. 2010, 37, L13804. [Google Scholar] [CrossRef]
  3. Zhai, P.M.; Eskridge, R.E. Atmospheric water vapor over china. J. Clim. 1997, 10, 2643–2652. [Google Scholar] [CrossRef]
  4. Bao, M.; Huang, R.H. Characteristics of the interdecadal variations of heavy rain over china in the last 40 years. Chin. J. Atmos. Sci. 2006, 30, 1057. [Google Scholar]
  5. Bao, M. The statistical analysis of the persistent heavy rain in the last 50 years over China and their backgrounds on the large scale circulation. Chin. J. Atmos. Sci. 2007, 31, 779–792. [Google Scholar]
  6. Li, X.Z.; Zhou, W.; Li, C.Y.; Song, J. Comparison of the annual cycles of moisture supply over southwest and southeast China. J. Clim. 2013, 26, 10139–10158. [Google Scholar] [CrossRef]
  7. Miao, C.M.; Ding, Y.H.; Guo, P.W.; Shen, H.F.; Fan, G.F. Linkage of the water vapor transport distribution with the rainy season and its precipitation in the southern regions south of the Yangtze River during the early summer. Acta Meteorol. Sin. 2015, 73, 72–83. [Google Scholar]
  8. Zhou, T.J.; Yu, R.C. Atmospheric water vapor transport associated with typical anomalous summer rainfall patterns in china. J. Geophys. Res. Atmos. 2005, 110, D8. [Google Scholar] [CrossRef] [Green Version]
  9. Newell, R.E.; Newell, N.E.; Zhu, Y.; Scott, C. Tropospheric rivers?—A pilot study. Geophys. Res. Lett. 1992, 19, 2401–2404. [Google Scholar] [CrossRef] [Green Version]
  10. Wernli, B.H.; Davies, H.C. A lagrangian-based analysis of extratropical cyclones. I: The method and some applications. Q. J. R. Meteorol. Soc. 1997, 123, 467–489. [Google Scholar] [CrossRef]
  11. Stohl, A.; James, P. A Lagrangian analysis of the atmospheric branch of the global water cycle. Part I: Method description, validation, and demonstration for the August 2002 flooding in central Europe. J. Hydrometeorol. 2004, 5, 656–678. [Google Scholar] [CrossRef]
  12. Stohl, A.; James, P. A Lagrangian analysis of the atmospheric branch of the global water cycle. Part II: Moisture Transports between Earth’s Ocean Basins and River Catchments. J. Hydrometeorol. 2005, 6, 961–984. [Google Scholar] [CrossRef]
  13. Stohl, A.; Forster, C.; Sodemann, H. Remote sources of water vapor forming precipitation on the Norwegian west coast at 600N—A tale of hurricanes and an atmospheric river. J. Geophys. Res. 2008, 113, D05102. [Google Scholar]
  14. Gimeno, L.; Stohl, A.; Trigo, R.M.; Dominguez, F.; Yoshimura, K.; Yu, L.; Drumond, A.; Durán-Quesada, A.M.; Nieto, R. Oceanic and terrestrial sources of continental precipitation. Rev. Geophys. 2012, 50, RG4003. [Google Scholar] [CrossRef] [Green Version]
  15. Sun, B.; Wang, H.J. Moisture sources of semi-arid grassland in China using the Lagrangian Particle Model FLEXPART. J. Clim. 2014, 27, 2457–2474. [Google Scholar] [CrossRef]
  16. Draxler, R.R.; Hess, G.D. Description of the HYSPLIT_4 Modeling System. NOAA Tech. Memo. ERL ARL 1997, 197–199. [Google Scholar]
  17. Draxler, R.R.; Hess, G.D. An overview of the HYSPLIT_4 modeling system of trajectories, dispersion, and deposition. Aust. Meteorol. Mag. 1998, 47, 295–308. [Google Scholar]
  18. Sun, B.; Wang, H.J. Analysis of the major atmospheric moisture sources affecting three sub-regions of east China. Int. J. Climatol. 2015, 35, 2243–2257. [Google Scholar] [CrossRef]
  19. Li, X.Z.; Zhou, W.; Chen, Y.D. Detecting the origins of moisture over southeast China: Seasonal variation and heavy rainfall. Adv. Atmos. Sci. 2016, 33, 319–329. [Google Scholar] [CrossRef] [Green Version]
  20. Huang, W.; He, X.; Yang, Z.; Qiu, T.; Wright, J.S.; Wang, B.; Lin, D. Moisture sources for wintertime extreme precipitation events over South China during 1979–2013. J. Geophys. Res. Atmos. 2018, 123, 6690–6712. [Google Scholar] [CrossRef]
  21. Yang, Z.F.; Huang, W.Y.; Qiu, T.P.; He, X.S.; Wright, J.S.; Wang, B. Interannual variation and regime shift of the evaporative moisture sources for wintertime precipitation over southern China. J. Geophys. Res. Atmos. 2018, 123, 13–168. [Google Scholar] [CrossRef]
  22. Zhou, L.; Cai, R.H.; Lan, M.C.; Yao, R.; Yang, Y.Y. Analysis on the characteristics of low frequency oscillation in precipitation in flood season in Hunan Province. J. Meteorol. Sci. 2019, 39, 644–653. (In Chinese) [Google Scholar] [CrossRef]
  23. Zhou, W.; Chan, J.C.L.; Chen, W.; Ling, J.; Pinto, J.G.; Shao, Y.P. Synoptic-scale controls of persistent low temperature and icy weather over southern China in January 2008. Mon. Weather. Rev. 2009, 137, 3978–3991. [Google Scholar] [CrossRef] [Green Version]
  24. Wang, H.J.; Chen, H.P. Climate control for southeastern China moisture and precipitation: Indian or east asian monsoon? J. Geophys. Res. Atmos. 2012, 117, D12109. [Google Scholar] [CrossRef]
  25. Chen, L.X.; Zhang, B.; Zhang, Y. Progress in research on the East Asian monsoon. J. Appl. Meteorol. Sci. 2006, 17, 711–724. [Google Scholar]
  26. Zheng, B.; Liang, J.Y.; Lin, A.L.; Li, C.H.; Gu, D.J. Frontal Rain and Summer Monsoon Rain During Pre-rainy Season in South China. Part I: Determination of the Division Dates. Chin. J. Atmos. Sci. 2006, 30, 1207–1210. [Google Scholar]
  27. Zhao, H.; Zhang, R.H.; Wen, M. Severe rainfalls in south China during may 2013 and its relation to the onset of the south china sea summer monsoon. Acta Meteorol. Sin. 2015, 73, 442–458. [Google Scholar]
  28. Li, J.; Fan, L.; Zhang, G. Synergistic Effects of PDO and IOD on Water Vapor Transport in the Preflood Season over South China. Water 2022, 14, 722. [Google Scholar] [CrossRef]
  29. Chi, Y.Z.; He, J.H.; Wu, Z.W. Features Analysis of the Different Precipitation Periods in the Pre-flood Season in South China. J. Nanjing Inst. Meteorol. 2005, 28, 163–171. [Google Scholar] [CrossRef]
  30. Nitta, T.; Hu, Z.Z. Summer climate variability in china and its association with 500 hPa height an tropical convection. J. Meteorol. Soc. Jpn. 1996, 74, 425–445. [Google Scholar] [CrossRef] [Green Version]
  31. Ding, Y.H.; Wang, Z.Y.; Sun, Y. Inter-decadal variation of the summer precipitation in east China and its association with decreasing asian summer monsoon. part I: Observed evidences. Int. J. Climatol. 2010, 28, 1139–1161. [Google Scholar] [CrossRef]
  32. Wu, R.G.; Wen, Z.P.; Song, Y.; Li, Y.Q. An interdecadal change in southern China summer rainfall around 1992/93. J. Clim. 2010, 23, 2389–2403. [Google Scholar] [CrossRef]
  33. Chu, Q.C.; Wang, Q.G.; Feng, G.L. Determination of the major moisture sources of cumulative effect of torrential rain events during the preflood season over south China using a Lagrangian particle model. J. Geophys. Res. Atmos. 2017, 122, 8369–8382. [Google Scholar] [CrossRef]
  34. Duan, W.S.; Song, L.Y.; Li, Y.; Mao, J.Y. Modulation of PDO on the predictability of the interannual variability of early summer rainfall over south China. J. Geophys. Res. Atmos. 2013, 118, 13008–13021. [Google Scholar] [CrossRef]
  35. Sun, Z.B.; Xu, Q.Z.; Ni, D.H. Interdecadal variation of spring precipitation in South China and its relationships with atmospheric circulation and SST. Trans. Atmos. Sci. 2017, 40, 433–442. [Google Scholar]
  36. Chan, J.C.L.; Zhou, W. PDO, ENSO and the early summer monsoon rainfall over south China. Geophys. Res. Lett. 2005, 32, L08810. [Google Scholar] [CrossRef]
  37. Jian, M.Q.; Qiao, Y.T.; Luo, H.B. The abrupt change of the circulation in Low-Latitudes during the period from April to June. Clim. Environ. Res. 2000, 5, 356–362. [Google Scholar]
  38. Li, H.Y.; Lin, Z.H.; Chen, H. Characteristics of the interdecadal variability of precipitation in April and May over south China and possible relationship with the mid-west Pacific sst. Clim. Environ. Res. 2012, 17, 481–494. [Google Scholar]
  39. China Meteorological Administration. Available online: http://cmdp.ncc-cma.net/pred/cn_enso.php?product=cn_enso_pdo (accessed on 10 August 2022).
Figure 1. Clustering path of climatological water vapor transport trajectories of precipitation in the pre-rainy season (1960–2012) over South China (blue line: frontal precipitation, red line: monsoon precipitation, the black box represents the area where the precipitation is studied).
Water 14 03639 g001
Figure 2. Climatological pre-rainy season 10-day integrated (E–P) values observed for the period 1960–2012, water vapor source or sink of precipitation over South China in 1° × 1° grid, (a): frontal precipitation; (b): monsoon precipitation; unit: g/kg/grid; green box is the key area of water vapor source, respectively: ① Indian Ocean (IO); ② Bay of Bengal (BOB); ③ East China (EC); ④ Western Pacific (WP); ⑤ South China Sea (SCS).
Water 14 03639 g002
Figure 3. Difference distribution of water vapor of pre-flood season precipitation in South China from 1960 to 2012 for (a,d,g,j) 10 days, (b,e,h,k) 5 days, and (c,f,i,l) 2 days leading up to the day of the vapor reaching South China (ENSO positive phase minus negative phase; units: g/kg/grid; the shaded area is the area passing the 98.8% confidence level): (ac) frontal precipitation stage with PDO positive phase; (df) frontal precipitation stage with PDO negative phase; (gi) monsoon precipitation stage with PDO positive phase; (jl) monsoon precipitation stage with PDO negative phase.
Water 14 03639 g003
Figure 4. Clustering path of water vapor transport tracks of precipitation for four PDO & ENSO phase combinations in the pre-rainy season over SC (1960–2012) (a) frontal precipitation, (b) monsoon precipitation, blue line: clustering trajectories for PDO positive phase and ENSO positive phase, red line: clustering trajectories for PDO positive phase and ENSO negative phase, green line: clustering trajectories for PDO negative phase and ENSO positive phase, purple line: clustering trajectories for PDO negative phase and ENSO positive phase. The number at the start of the trace is the trace number.
Water 14 03639 g004
Figure 5. Precipitation contribution rates of key areas of water vapor sources in the pre-rainy season from 1960 to 2012 (blue: frontal precipitation; red: monsoon precipitation; unit:%). (a): PDO and ENSO positive phase, (b): PDO positive with ENSO negative phase, (c): PDO negative with ENSO positive phase, (d): PDO and ENSO negative phase.
Water 14 03639 g005
Figure 6. Difference of 850 hPa geopotential height field (red contours, unit: gpm), water vapor flux (blue vector, unit: kg·m·s−1) between four ENSO & PDO phase combinations in the pre-rainy season over South China during 1960–2012 ((a,b): frontal precipitation; (c,d): monsoon precipitation; (a,c): PDO+ & ENSO+ minus PDO+ & ENSO−, (b,d): PDO− & ENSO+ minus PDO− & ENSO−).
Water 14 03639 g006
Table 1. Phase combinations of PDO and ENSO.
PDO Positive PhasePDO Negative Phase
ENSO positive phase1977, 1982, 1987, 1992,
1994, 1997, 1998
1963, 1972, 2010
ENSO negative phase1989, 1995, 19961964, 1971, 1974, 1975, 1999,
2006, 2007, 2011, 2012
Note(s): the Pacific Decadal Oscillation (PDO); the El Niño-Southern Oscillation (ENSO).
Table 2. Percentage of track amount and precipitation for clustering path of water vapor transport trajectories of precipitation in the pre-rainy season over SC for phase combinations of ENSO and PDO (1960–2012) (unit: %).
PDO Positive PhasePDO Negative Phase
Track Number1234512345
Frontal precipitationENSO+Track amount15.3831.164.5823.7925.0915.6116.563.6427.7336.47
precipitation11.9933.83.0124.3326.8716.4713.651.532.8435.54
ENSO−Track amount41.3726.7812.9910.88.067.614.3428.2720.7928.99
precipitation44.6728.5816.226.683.855.7410.7429.9722.9930.57
Monsoon precipitationENSO+Track amount7.2720.6335.358.0328.7119.0723.4418.3225.7613.41
precipitation4.517.5239.236.1432.6216.9726.3123.0125.817.9
ENSO−Track amount13.2410.6523.7217.3235.0725.6518.316.637.8411.6
precipitation9.257.9525.8114.8542.1429.3517.064.8839.569.15
Publisher’s Note: MDPI stays neutral with regard to jurisdictional claims in published maps and institutional affiliations.

