Abstract
As a unique landform in the island and reef area, the newborn sandbank is not only the initial stage of island development, but also has a rapid evolution and a complex dynamic mechanism. However, the dynamic geomorphology mechanism of the newborn sandbank is still lacking extensive study and direct evidence of the interaction process between the marine dynamics and the newborn sandbank geomorphology. Therefore, in order to reveal the interaction mechanisms between marine dynamics and newborn sandbanks, a newborn sandbank in the sea area of the Xisha Islands, in the South China Sea, has been selected as the focus of this research. The method of numerical simulation was used to discuss and analyze the wave field characteristics around the newborn sandbank and their impacts on the sandbank’s migration and development. The results show that: (1) The islands and reefs have significant refraction, diffraction, and energy dissipation effects on waves, and the newborn sandbank has the same effect, but with a weaker function. The wave height around the reef islands reduced by approximately 60–67% in dominated and strong wave directions. At the same time, the wave height attenuation in the wave shadow zone, behind the newborn sandbank, can reach approximately 27–33%. (2) Wind is important for the evolution of wave fields; in particular, when the wind speed exceeds grades four and five, the effect of the wind on the waves is particularly significant, causing the winds to control the wave characteristics around the islands and newborn sandbanks. This results in significant seasonal differences in wave fields within the sea area. (3) The wave direction primarily controls the migration direction of the newborn sandbank, and the wave height primarily controls the migration speed and distance. After one month of wave action in the strong wave direction, the maximum eastward deposition length was approximately 50 m. After one month of wave action in the dominated wave direction, the maximum eastward deposition length was approximately 60 m. Therefore, the topography of the newborn sandbank affects the wave propagation, meanwhile, the wave conversely determines migration and development of the newborn sandbank in a short term. The dynamic geomorphology action between the wave and newborn sandbank is a fast two-way process, and occurs not only during storms or the winter monsoon, but also during other, more common, weather events.
1. Introduction
The South China Sea is dotted with islands and reefs, forming many distinctive island and reef groups. Due to the unique geographical location of the South China Sea, these islands and reefs are categorized as coral islands; that is, marine islands, which are mainly composed of the skeletons of marine organisms, corals, and the remains of other marine organisms.
The newborn sandbank is a very unique landform in many of these islands and reefs. It is an important transitional landform that exists prior to the formation of coral islands, and it often evolves under the influence of dynamic environment changes. As these newborn sandbanks are surrounded by the sea and far away from land, their dynamic geomorphological evolution clearly differs from that of continental islands, and they have evolutionary characteristics of coral islands and reefs, which creates great difficulties for studying the internal mechanism of their dynamic geomorphological evolution.
In recent decades, much of the research on the dynamic geomorphology of coral islands, reefs, and sandbanks has focused predominantly on the following three aspects: (1) To emphasize the evolutionary characteristics and laws of longer and wider spatial and temporal scales of islands and sandbanks, in order to analyze and discuss their stability and evolution laws from a macro view [1,2,3,4]; (2) To highlight the importance of the composition and evolution of the environmental factors of islands and sandbanks in order to study and predict the development, degradation, and extinction of the dynamic geomorphology of islands and reefs [5,6,7,8]; (3) To evaluate the composition of fine topographic and geomorphological elements of islands and sandbanks, and then discuss the internal physical mechanism of the evolution, genesis, provenance, and dynamic elements of islands and reefs by reconstructing their underwater topography, sediments, hydrodynamic environment, and other characteristic elements [9,10,11,12,13].
However, as the primary stage of islands and reefs, newborn sandbanks still lack extensive study and their internal mechanisms of dynamic geomorphology have yet to be revealed. In fact, many researchers have also recognized the close relationship between sediment transportation, geomorphology and marine dynamics in tidal currents and waves [14,15]. In particular, the long-period wave may significantly influence the morphology of the coastal zone; this has been extensively discussed regarding harbor oscillations induced by the Bragg reflection and focused transient [16,17]. In addition, it has also been emphasized that the combination of the driving force generated by the waves and the necessary material sources provided by the seabed topography near the shore creates and reshapes the sandbar [18,19,20].
However, in regard to newborn sandbanks, the recent understanding of the internal dynamic mechanism of emergence, evolution, and change is still focused on how the formation of newborn sandbanks is related to storm processes and winter monsoons [12]. These studies are primarily based on phenomenon analysis; therefore, there is still no direct understanding and evidence regarding the dynamic equilibrium relationship between the ocean dynamic effect and the topography of the newborn sandbank.
To this end, the newborn sandbank located in the southeastern margin of Qilianyu reef (Figure 1), in the northern part of the Xisha Islands in the South China Sea, is used in this study for analysis and discussion. Over the last 20 years, it has undergone continuous evolution and change, not only during the storm and winter monsoons period, but also during periods of ordinary weather. So far, it has not fully emerged on land and formed a stable coral island, making it a typical example of the newborn sandbanks found in this sea. Therefore, this paper selects it as the research focus to conduct in-depth research on the dynamic geomorphology interaction between wave propagations and newborn sandbank changes in the islands and reefs sea area for the first time, and to further reveal the dynamic- geomorphology mechanism of newborn sandbanks in the South China Sea.
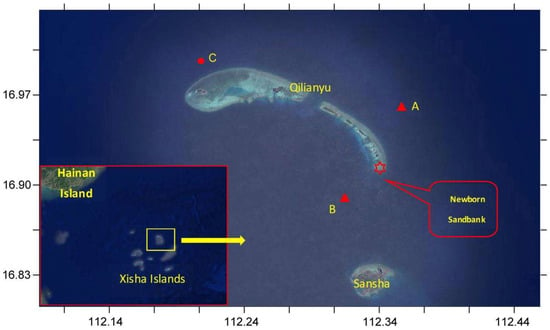
Figure 1.
Scope of numerical model and location of a newborn sandbank in the Xisha Islands.
2. Data and Method
The sediment composition of newborn sandbanks in the Xisha Islands is essentially categorized as fine sand with average median diameter about 0.52 mm. At the same time, the Xisha Islands Sea area typically has open waters and a limited flow velocity around reefs and islands, resulting in larger wave action on these islands and reefs [21]. Therefore, in this paper, the numerical simulation method of sediment movement during wave action is applied to analyze the characteristics of wave and sandbank migration in a typical newborn sandbank sea area of the Xisha Islands.
At the same time, this paper collects and compiles underwater terrain data from the sea area around the Xisha Islands and the newborn sandbank (Figure 1), as well as wave field and wind field hindcast data (ECMWF) from 2016, to establish a numerical model of wave propagation and sediment transport in the study area.
Meanwhile, the newborn sandbank is located in a reef at the southeastern edge of Qilianyu, which shelters this sandbank from wave action. For this reason, the ECMWF wave hindcast data was adopted to select the 2016 annual wave sequence dataset at position A (Figure 1) near the 60 m isobath on the northeast side of the archipelago reef and position B (Figure 1) near the 50 m isobath on the southwest side for statistical analysis. The results are shown in Figure 2 and Figure 3.
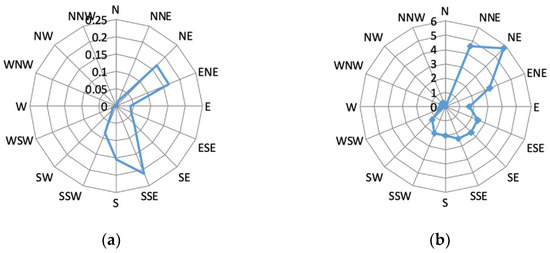
Figure 2.
Wave rose diagram at point A (a) and Wave rose diagram of maximum wave height at point A (b).
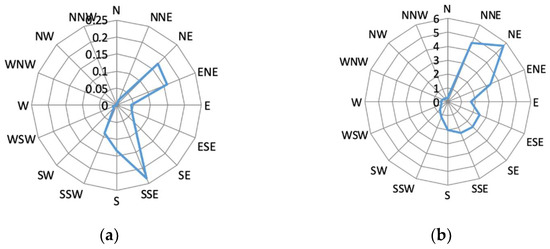
Figure 3.
Wave rose diagram at point B (a) and Wave rose diagram of maximum wave height at point B (b).
Figure 2 and Figure 3 indicate that the dominated wave direction of point A is SSE; the secondary dominated wave directions are ENE and NE; the strong wave direction is NE; and the secondary strong wave direction is NNE. Similarly, the dominated wave direction of point B is also SSE, the secondary dominated wave directions are ENE and NE, the strong wave direction is NE, and the secondary strong wave direction is NNE. Therefore, the dominated wave direction in the sea area is generally SSE, and the strong wave direction is NE.
The study method, ideas and designs are progressively demonstrated as follows:
- (1)
- To reveal differences of wave propagation caused by the islands, reefs and newborn sandbank.
Based on the analysis results of the wave series at position A and position B, the test wave conditions were proposed. Then, the study on propagation of dominated waves and strong waves were carried out by numerical simulation. Later, differences of dominated and strong wave fields were compared and analyzed.
- (2)
- To recognize wind action on wave propagation.
Considering that the study area is located in the monsoon climate zone and is significantly controlled by the monsoon wind, especially in the summer, the typical wind grade 3, 4 and 5 with typical wind direction were added to drive the wave’s propagation in the numerical simulation. Next, wave field characteristics in different seasons were further simulated and analyzed in order to further confirm the importance of wind action on wave evolution around the islands, reefs and newborn sandbank sea area.
- (3)
- To reveal migration characteristics of the newborn sandbank, caused by waves.
By changing the wave action, the migration characteristics of the newborn sandbank were simulated and analyzed. Then, based on differences in migration speed, distance and direction, caused by varied waves, were further discussed to reveal the interaction mechanisms between waves and the newborn sandbank.
3. Model Setup
3.1. Governing Equations
In this paper, the wave-current-sand coupling model (HHU-WENMS V1.0) is implemented to conduct this study. The motion of the current is governed by the 2D shallow water equations, as follows [22,23]:
wherein, the Tij are expressed as follows:
where t is the time; x, y is the Cartesian coordinates; η is the surface elevation; h is the total water depth; u, v are the velocity components in the x and y direction; f is the Coriolis parameter; g is the gravitational acceleration; ρ is the density of water; Sxx, Sxy, Syx and Syy are components of the radiation stress tensor; Pa is the atmospheric pressure; ρ0 is the reference density of water; S is the magnitude of the discharge due to point sources; A is the horizontal eddy viscosity; τsx, τsy, τbx, τby are the x and y components of the surface wind and bottom stresses. All units are uniform international units, as are the following.
The transportation of suspended sediment is governed by equations, as follows [22,23]:
where S is the vertical average sediment concentration; u, v are the velocity components in the x and y direction; ω is the settling velocity; Dx and Dy are the dispersion coefficients in the x and y direction; Fs is the near-bed sediment flux, which is expressed by the unified expression [24]:
Where the bed level change is caused by suspended sediment and bedload transport, then it can be written as:
where γ0 is the dry volume weight of the sediment on the bed; η is the bed level variation due to suspended sediment and bedload transport; Fs is the near-bed sediment flux as above; qx and qy are the bed load flux per unit width (qb) in the x and y direction.
where, qb is expressed as:
where γs is the volume weight of the sediment grain on the bed; γ is the volume weight of the water bodies; ωb is the settling velocity of the bedload; k2 is the coefficient, usual as 0.1; is the bed roughness height; is the mean current velocity vector; is the scaled mean velocity due to the wave motion; is the critical velocity for the sediment erosion, which is expressed as:
where is the steady dry volume weight of the sediment; is the median diameter of the bedload; is the bond coefficient; is the thickness of the particle film water.
Then, the governing equations are discretized by the control volume method in spacial dimension and the Runge Kutta method in temporal dimension [22,23].
Wave fields were simulated by the SWAN (Simulating Waves Nearshore), driven by wind field [25,26]; then, they were coupled with currents and sediments transport simulation.
3.2. Model Setting and Verification
In order to reflect the characteristics of wave propagation in the sea area of the Xisha Islands influenced by reef and newborn sandbanks, and to comprehensively consider the continuous effects of incident waves and wind fields, the model range is set, as shown in Figure 1. Meanwhile, to fully reflect the underwater topographic changes around the islands and reefs near the Xisha Islands and the new sandbanks, the rectangular grid is applied to divide the calculation domain. Moreover, the grid is refined near the study area, whose resolution in the calculation range varies from 10 to 1000 m.
Figure 4 shows the underwater topographic features of the core study area in the Xisha Islands and the new sandbank that is formed after the grid is subdivided. It indicates that the existing grid resolution can effectively reflect the rapid increase of water depth from the islands and reefs to the surrounding water of Qilianyu and the adjacent new sandbank in the northern Xisha Islands.
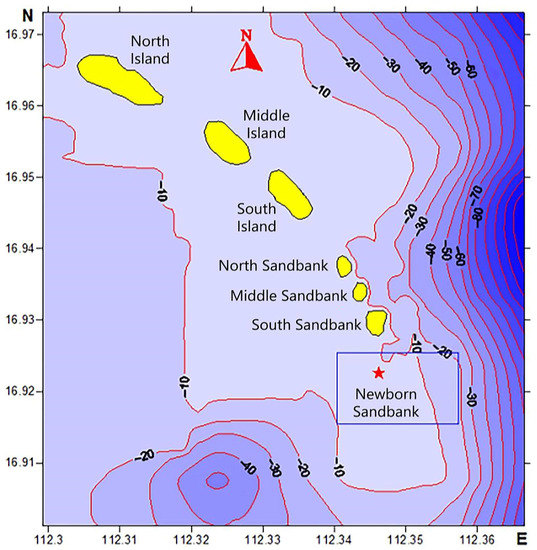
Figure 4.
Underwater topographic features near the Qilianyu sea area and the newborn sandbank in the northern Xisha Islands.
The open boundaries were driven by the waves from ECMWF hindcast database and the predicted tides from Nao99.b tidal model from Japanese NAOTIDE global tide model [27] (https://www.miz.nao.ac.jp/staffs/nao99/index_En.html (accessed on 20 January 2021)). Then, the wave-current-sand numerical simulation was carried out and driven by the ECMWF hindcast wind field database.
The wave simulation result was verified by the adopted data series at position C during January 2019 (Figure 1). Figure 5 shows the verification results on waves.
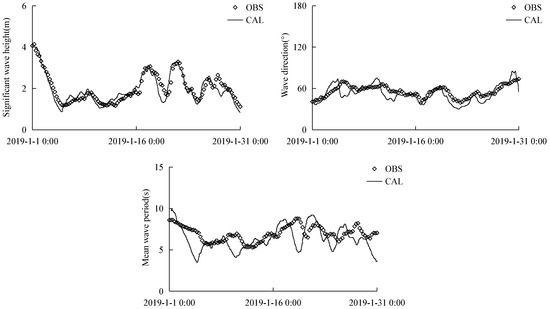
Figure 5.
Verification results of wave series at position C.
As Figure 5 shows, the verification results concerning wave height, direction and period were achieved and satisfying. Wherein, the mean wave period has a certain deviation, however, the variation tendencies are fitted with each other. The analysis suggests that the deviation may be caused by the discrepancies in times between the wave series and topography.
In addition, due to the lack of measured topography data in two different periods around the newborn sandbank sea area, the sediment transportation process cannot be verified. Furthermore, the tide conditions have been inconsistent across different study cases. Therefore, although the model calculation parameters can only be set by referring to literature concerning numerical models in the South China Sea and experiments of sediment motion that are located in the study area [28,29,30], it was still deemed to be feasible and rational to use a model setting that can rationally reflect the sediment transport characteristics of the newborn sandbank.
4. Results and Discussion
4.1. Characteristics of Wave Propagation in the Dominated Wave Direction (SSE)
Figure 5 shows the wave field characteristics around the sea area of the reef flat of the Xisha Islands and the newborn sandbank during wave action in the dominated wave SSE and during a high-water level. In this scenario, the boundary incident wave is applied as a maximum wave height of 2.8 m and a wave period of 5.8 s.
As Figure 6 indicates, the wave height can reach about 1.5 m when the incident wave propagates to the leading edge of the reef (the location of the new sandbank). After the wave enters the reef, its direction gradually deflects to the axis of the island group due to the barrier and wave dissipation effect of the island and reef. Meanwhile, the wave height gradually decreases to less than 1.0 m, and decreases to about 0.5 m at the leading edge of North Island, Middle Island, South Island, North Sandbank, Middle Sandbank, and South Sandbank. Therefore, the wave dissipation effect of the island and reef is significant. Furthermore, compared with the incident wave height at the leading edge of the reef where the islands are located, the wave height around the islands in the reef decreases by nearly 67%.
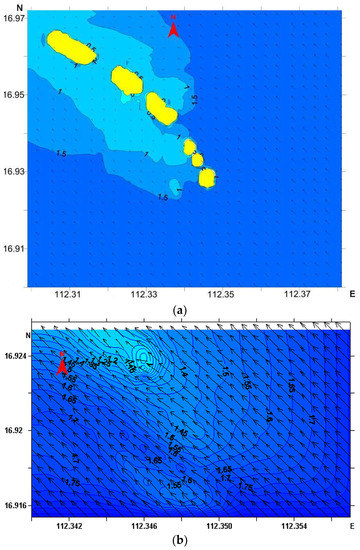
Figure 6.
Wave vector diagram in the dominated wave direction (SSE) around the Qilianyu (a) and Wave vector diagram in the dominated wave direction (SSE) around the newborn sandbank (b).
As Figure 4 shows, the newborn sandbank is located at the southeastern margin of the Qilianyu and close to the South Sandbank. Its top elevation is limited, and as a result, becomes almost entirely submerged in the water during high-water levels. Therefore, it is difficult for the newborn sandbank to induce significant barrier effects as the islands and reeds on the incident wave during periods of high-water levels.
Consequently, the incident wave presents a specific diffraction, but it is mainly through the top of the newborn sandbank. The incident wave height at the leading edge of the newborn sandbank is approximately 1.5 m. The shelter of the newborn sandbank reduces the wave height behind it to below 1.1 m, and the wave height attenuation is approximately 27%.
Therefore, in comparison to the shelter function of the islands and reefs in the Qilianyu, the refraction and diffraction effect of the newborn sandbank on the waves is obviously weaker than that of land-forming island and reef structures, and its wave attenuation function can only reach 40% of that of islands and reefs.
4.2. Characteristics of Wave Propagation in the Strong Wave Direction (NE)
Figure 7 shows the characteristics of the wave field around the reef and the newborn sandbank in the Xisha Islands in the context of strong wave direction (NE) and high-water levels. In this scenario, the boundary incident wave is set as the averaged wave height 4.0 m in the strong wave direction with a period of 6.0 s.
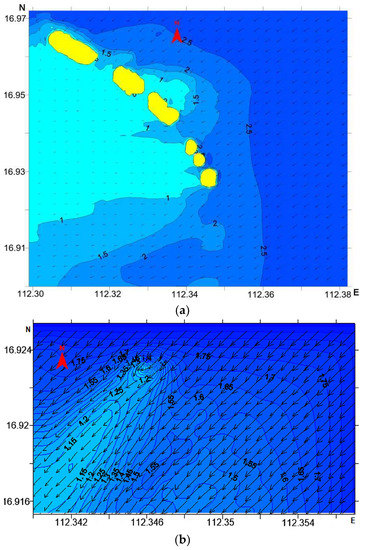
Figure 7.
Wave vector diagram in the strong wave direction (NE) around the Qilianyu (a) and Wave vector diagram in the strong wave direction (NE) around the newborn sandbank (b).
The figure indicates that the incident wave height can reach approximately 2.5 m when the strong wave propagates to the front edge of the northeast side of the reef, where the islands are located. As the wave enters the reef and reaches the outer edge of the islands, its height rapidly drops to approximately 1.0 m. Meanwhile, the incident waves on the southeast and northwest sides of the islands enter the southwest side, based on a diffraction function; then, they converge with the incident waves through the inter-island channel. As a result, the wave direction in the rear sea area on the southwest side is clearly westward, and the wave height drops to below 1.0 m. Therefore, the wave dissipation effect of islands and reefs is significant. Compared with the incident wave on the northeast leading edge of the reef, the wave attenuation in the southwest sea area, behind the reef and islands, is more than 60%.
Similar to the wave field in the dominated wave direction, the newborn sandbank cannot easily form a significant barrier effect on the incident wave in the strong wave direction at a high-water level. Although the incident wave in the strong wave direction shows a certain level of diffraction when passing through the newborn sandbank, it primarily passes through the top of the new sandbar, and the change of wave direction is insignificant. Furthermore, the Nansha Islands block the incident wave height at the leading edge of the newborn sandbank, to reach approximately 1.8 m, while the wave height behind this sandbank drops below 1.2 m, with a wave height attenuation of approximately 33%.
Hence, similarly to the wave field in the dominated wave direction, the wave attenuation effect of the newborn sandbank is also explicitly weaker than that of the landed island and reef, and the proportion is approximately 55%. In addition, it can also be seen that when the wave strengthens, the wave attenuation effect of the island and reef decreases, but that of the newborn sandbank increases. This may indicate that the wave attenuation effect of the refraction and bottom friction is a little bigger than that of the diffraction in the Xisha Islands.
4.3. Seasonal Variation Characteristics of the Wave Field
4.3.1. Effects of the Wind on Wave Propagation
In general, the wind promotes the growth of waves. Taking into consideration that the South China Sea is in a monsoon climate zone, it is strongly affected by monsoons, especially during the summer. Therefore, the typical wave field found in the summer of 2016 is chosen as the background field. In order to examine the wind action on this wave field, wind fields with no wind; grade three wind; grade four wind; and grade five wind, respectively, are considered to assess drive wave propagation, and the results are shown in Figure 8.
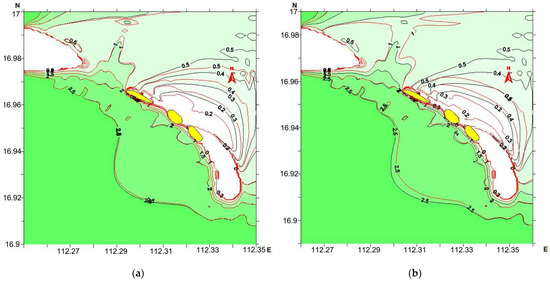
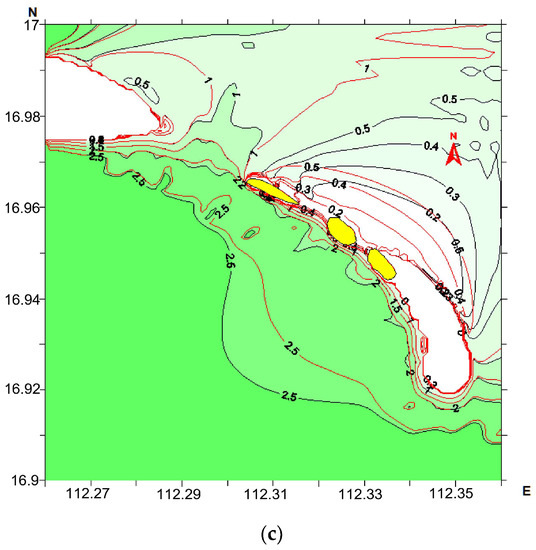
Figure 8.
Effects of wind grade 3(a), 4(b) and 5(c) on wave fields around the islands, reefs and newborn sandbank. (The black lines in the figure are windless, and the red lines are windy).
As Figure 8 shows, the influence of the grade three wind on the wave field is small. Compared with no wind, the wave height of the front wave side of the islands and reefs increases slightly, and the wave height in the wave shadow zone changes more significantly, with the maximum increase of wave height being over 50%. Under the action of the grade four wind, the wave height in the front wave side increases further, and it changes more significantly in the wave shadow zone behind the island. The contour line of the 0.2–0.5 m wave height is close to the outer edge of the islands and reefs, and the wave height can increase by more than 100%. Under the action of the grade five wind, the wave height of the front sea side of the islands increases significantly compared to that without wind. Moreover, the 2.5 m wave height contour advances to the outer edge of the islands, up to approximately 1.0 km. The wave height in the wave shadow zone behind the islands continues to increase significantly. The contour line of the 0.2–1.0 m wave height is close to the outer edge of the islands and reefs, and the wave height increases by more than 150%.
Therefore, the wind in the study area has an important influence on the propagation and evolution of waves. In particular, when the wind speed exceeds grades four and five, the influence of the wind on the waves is extremely significant. This is the reason the wave fields exhibit seasonal variations, not just during storms or winter monsoon weather. As a result, wave elements will also demonstrate characteristics of distinctly seasonal evolution, throughout the different seasons, and are affected by the different types of wind speed and direction.
4.3.2. Seasonal Evolution of Wave Fields
In order to reveal the seasonal variation of wave fields, Figure 9 shows the typical wave field characteristics found throughout spring, summer, autumn, and winter in 2016.
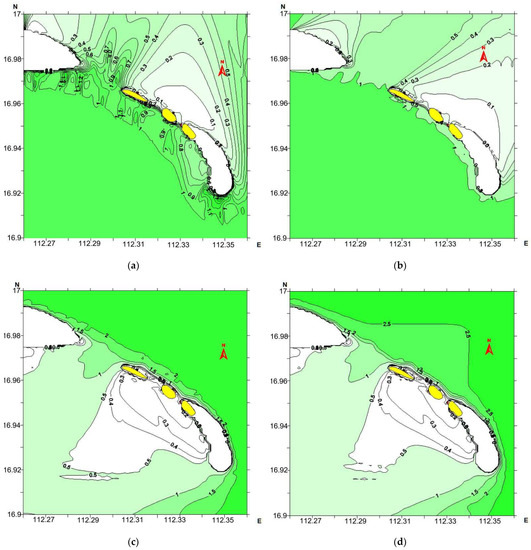
Figure 9.
Seasonal variations of wave fields in islands, reefs and newborn sandbank sea areas. (a) Spring; (b) Summer; (c) Autumn; (d) Winter.
As Figure 9 shows, during spring and summer, the southerly wind effect causes the wave direction to be largely in the south, and the wave height is similar, while the incident wave height can reach about 1.0 m. Meanwhile, the islands and reefs cause the incident wave to primarily diffract through the islands. As the tide level decreases, the water depth near the islands and reefs also decreases. Consequently, the nonlinear effect of the waves in the reefs is strengthened. Therefore, the shelter and dissipation effect of the islands and reefs is very significant, and the wave behind the islands is reduced by up to 90%. In addition, due to the differences between incident wave directions in different seasons, more wave power can pass through the channels between islands, particularly the big channel between the South Island and North Sandbank; thus, the wave attenuation effect of islands and reefs in spring is bigger than in summer.
Furthermore, during the autumn and winter, the northeasterly wind causes NE waves to dominate the islands and reefs sea area, and the wave height during the winter is larger. During the autumn, the incident wave height on the outer edge of the northeast side of the islands and reefs is about 2.0 m. When the incident wave reaches the islands and reefs, diffraction and refraction deformation occur. The maximum wave height behind the islands reduces to less than 0.2 m, and the maximum wave height reduction is more than 90%. During winter, the incident wave at the northeast side of the islands reaches approximately 2.5 m. After refraction and diffraction, the wave at the rear of the islands decreases to below 0.2 m, and the wave height decreases by more than 92%.
Therefore, the NE and southerly winds control the wave characteristics of the archipelago and the newborn sandbank sea area. Moreover, the islands, reefs, and newborn sandbanks have a significant barrier effect. As a result, the refraction and diffraction characteristics of the wave field are closely related to their geographical location. In addition, it can also be seen that the barrier effect of the newborn sandbank is relatively smaller than that of islands and reefs. This confirmed again the results that have been revealed in the dominated and strong wave propagation characteristics.
4.4. The Migration Characteristics of the Newborn Sandbank under the Strong wave (NE) Action
In order to reveal the evolution characteristics of sandbank topography under strong wave action, Figure 10 shows the changes in the underwater topography of the newborn sandbank, after continuous wave action lasting for one month, with an average incident wave height of 4.0 m and a period of 6.0 s in a strong wave direction during 2016.
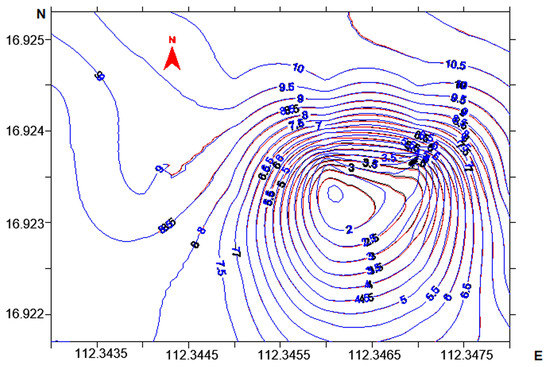
Figure 10.
Underwater topography changes in the newborn sandbank under average wave action in a strong wave direction lasting for 1 month. (The red lines are the initial underwater topography, and the blue lines are the new underwater topography after 1 month of wave action).
As Figure 10 shows, after one month of wave action in a strong wave direction, the underwater topography in the area deeper than the 10 m isobath of the front wave side of the newborn sandbank does not change significantly, while siltation dominated in the area shallower than the 10 m isobath. Moreover, a closer distance to the northeast of the core area of the newborn sandbank indicated that there was a more obvious siltation, with a maximum siltation width of approximately 50 m. Analysis illustrated that, as the northeast of the newborn sandbank was directly adjacent to the South China Sea basin, the slope of the underwater topography in the area shallower than 10 m was gentler than that in the deep-sea area that was deeper than 10 m. As a result, the relative wave height in the deep-sea area was below 0.3, which caused the wave to have a slight effect on the movement of the bed sediment in the deep-sea area. Hence, it is difficult to quickly cause a strong erosion and deposition change in the underwater bank slope. On the other hand, the newborn sandbank is located in the southeastern margin of Qilianyu. Then, under the northeast wave action, the sediment is transported and accumulated from the northwest to the southeast of the newborn sandbank, thus forming a prominent landform in the east.
Meanwhile, the newborn sandbank sheltered the incident wave, which diffracted through the northwest and southeast sides of this sandbank. This caused these sides to show slight erosion in its area shallower than the 7 m isobath. However, the erosion and deposition in the area deeper than 7 m was not obvious. Similarly, a closer distance from the core area of the newborn sandbank involved a greater extent of erosion in its northwest and southeast sides. However, as the wave height gradually decreased to less than 2 m after wave refraction and diffraction, the distance of erosion on both sides was limited to less than 15 m.
In addition, the shelter effect created by the newborn sandbank meant that the underwater topography of the wave shadow zone behind this sandbank remained essentially unchanged, while the erosion-deposition balance was dominant.
4.5. The Migration Characteristics of the Newborn Sandbank under the Dominated Wave (SSE) Action
In order to display the evolution characteristics of the newborn sandbank topography under the dominated wave action, Figure 11 shows the changes of the underwater topography of the newborn sandbank after one month of wave action, with a maximum incident wave height of 2.8 m and a period of 5.8 s in the dominated wave direction during 2016.
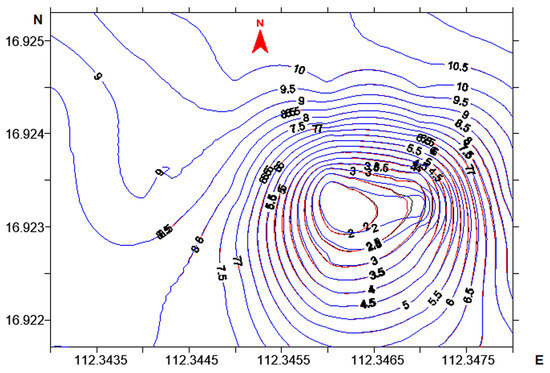
Figure 11.
Underwater topography changes in the newborn sandbank under 1 month of wave action with the maximum wave height in the dominated wave direction. (The red lines are the initial underwater topography, and the blue lines are the new underwater topography after 1 month of wave action).
As Figure 11 shows, after one month of continuous wave action in a dominated wave direction, there is no obvious erosion and deposition of the seabed in the deep-water area, which is deeper than the 8 m isobath in the eastern part of the newborn sandbank. However, the underwater topography in the area shallower than 8 m mainly presented with eastward deposition. Moreover, a closer distance to the core area of the newborn sandbank indicated more obvious deposition, with a maximum deposition width of approximately 60 m. On one hand, analysis indicated that the relative wave height in the deep-sea area, deeper than the 8 m isobath in the eastern part of the newborn sandbank, was below 0.3, which made it difficult for waves to strongly act on the bed load movement in the deep-sea area. On the other hand, the newborn sandbank is located in the southeastern margin of Qilianyu. Under the wave action, in the dominated wave direction, the sediment is transported and accumulated to the east of the newborn sandbank, where it forms a deposit, which differs from that of strong wave action in position and shape.
At the same time, the newborn sandbank sheltered the wave, which diffracted through the west and east side of the newborn sandbank, and then entered its rear. This made the area shallower than the 6 m contour line in this west side and shows slight erosion, while the area deeper than 6 m showed slight erosion and deposition. Similarly, a distance closer to the core area of the newborn sandbank indicates a greater extent of westward erosion, reaching up to 10 m. Although diffracted waves affected the east side of the newborn sandbank, this area still showed a deposition trend due to the continuous accumulation of sediment.
Furthermore, similar to the wave action in the strong wave direction, the underwater topography of the wave shadow zone, behind the newborn sandbank, was essentially unchanged due to its shelter effect, while the overall balance of erosion and deposition was dominant.
In summary, by comparing the geomorphic variation of the newborn sandbank under the wave action in strong wave direction and that under the wave action in the dominated wave direction, it can be found that the migration direction of the newborn sandbank is primarily controlled by the wave direction, and its migration speed and distance are primarily dominated by wave height. Meanwhile, the evolution of the newborn sandbank does not only occur during storms and the winter monsoon, but also occurs during usual weather dynamics.
5. Conclusions
As the initial stage of the coral island, the newborn sandbank generally has a complex internal dynamic geomorphology mechanism. However, although there has been a lot of research on the mechanisms of marine dynamic geomorphology, there are few studies on the dynamic geomorphology mechanisms of the newborn sandbank. At present, the study of newborn sandbanks is primarily based on macroscopic phenomenon analysis and lacks direct process evidence.
Therefore, this paper presents the first discussion on the influence of islands, reefs and newborn sandbanks on incident wave propagation and reveals that the islands and reefs significantly block the wave propagation, whilst the newborn sandbank has difficulty forming a significant barrier effect on the incident wave. At the same time, from the perspective of wind-wave interaction, the importance of wind on wave generation, propagation and development in the Xisha Islands sea area is also emphasized. It is therefore proposed that, when the wind speed exceeds grades four and five, the wind-wave interaction is extremely significant. Furthermore, it is revealed that wind is the fundamental reason for the seasonal variation of waves in the sea area.
In addition, the newborn sandbank migration characteristics under typical waves (dominant waves and strong waves) are revealed from the perspective of the interaction between wave power and newborn sandbank migration. On one hand, this study directly confirms the importance of waves on the development and evolution of newborn sandbanks proposed by former macroscopic researchers. On the other hand, it provides direct process evidence for the study of the short-term rapid migration and evolution mechanism of the newborn sandbank under the action of waves, revealing that the migration direction of the newborn sandbank is primarily controlled by the wave direction, and the migration speed and distance is primarily controlled by the wave height. This provides a necessary research direction for revealing the internal physical mechanism of the dynamic geomorphology of newborn sandbanks in the future.
However, due to the rapid change in the characteristics of the newborn sandbank, and the lack of support of the specific quantity and transport speed data for sand source recharged by islands and reefs, the combined actions between wave action, newborn sandbank migration and sand source recharge by adjacent sea areas still need to be further revealed.
Author Contributions
Conceptualization, methodology, validation, formal analysis, writing—original draft preparation, H.H., X.L. and C.C.; investigation, X.L. and S.L.; writing—review and editing, X.H., Z.L., M.M.S. and M.S.I.S.; supervision and funding acquisition, Z.L. and C.C. All authors have read and agreed to the published version of the manuscript.
Funding
This research was funded by the Natural Science Foundation of Fujian Province, China (grant no. 2020J01696), the Department of Education of Fujian Province, China (grant no. JAT190307), the National Natural Science Foundation of China (grant no. 51979096), the National Natural Science Foundation of China (grant no. U2040203), the Key Laboratory of Coastal Disasters and Defense, Ministry of Education, Hohai University Program (The influence of the Deepwater Channel Regulation Project on saltwater intrusion in the Yangtze River Estuary), the Fundamental Research Funds for the Central Public Welfare Research Institutes, Nanjing Hydraulic Research Institute (grant no. YN912001), the Research Project on Representative Islands Platform for Resources, Ecology, and Sustainable Development (grant no. 2029999, 220005), the high level research and cultivation fund project of transportation engineering discipline of Jimei University (grant no. HHXY2020016), Fujian Provincial Key Laboratory of Coast and Island Management Technology Study (grant no. FJCIMTS2022-03).
Institutional Review Board Statement
Not applicable.
Informed Consent Statement
Not applicable.
Data Availability Statement
Not applicable.
Acknowledgments
The authors thank the anonymous reviewers for their constructive comments.
Conflicts of Interest
The authors declare no conflict of interest.
References
- Duan, Y.; Liu, Y.; Li, M.; Zhou, M.; Yang, Y. Survey of reefs based on Landsat 8 operational land imager (OLI) images in the Nansha Islands, South China Sea. Acta Oceanol. Sin. 2016, 35, 11–19. [Google Scholar] [CrossRef]
- Zhu, H.; Jiang, X.; Meng, X.; Feng, Q.; Cui, S.; Liang, C. A quantitative approach to monitoring new sand cay migration in Nansha Island. Acta Oceanol. Sin. 2016, 35, 102–107. [Google Scholar] [CrossRef]
- Li, X.M.; Ma, Y.; Leng, Z.H.; Zhang, J.; Lu, X.X. High-accuracy remote sensing water depth retrieval for coral islands and reefs based on LSTM neural network. J. Coast. Res. 2020, 102, 21–32. [Google Scholar] [CrossRef]
- Zhou, M.; Liu, Y.; Zhao, S.; Jiang, J.; Duan, Y.; Li, M. Automatic coral island segmentation based on region-based multi-phase level set method: A case study on PattIe Island, South China Sea. In Proceedings of the 2014 22nd International Conference on Geoinformatics, Kaohsiung, Taiwan, 25–27 June 2014; pp. 1–6. [Google Scholar]
- Liu, J.; Huang, R.; Yu, K.; Zou, B. How lime-sand islands in the South China Sea have responded to global warming over the last 30 years: Evidence from satellite remote sensing images. Geomorphology 2020, 371, 107423. [Google Scholar] [CrossRef]
- Yu, K.F.; Zhao, J.X.; Shi, Q.; Chen, T.G.; Wang, P.X.; Collerson, K.D.; Liu, T.S. U-series dating of dead porites corals in the South China Sea: Evidence for episodic coral mortality over the past two centuries. Quat. Geochronol. 2006, 1, 129–141. [Google Scholar] [CrossRef]
- Yu, H.B.; Sun, Z.X. Geomorphic features of upper seaward slope of Yongshu reef, Nansha Islands. Mar. Sci. Bull. 1999, 18, 49–54. [Google Scholar]
- Wu, Z.J.; Wang, D.R.; Tu, Z.G.; Li, Y.C.; Chen, J.R.; Zhang, G.X. The analysis on the reason of hermatypic coral degradation in Xisha. Haiyang Xuebao 2011, 33, 140–146. [Google Scholar]
- He, Q.J.; Liu, G.; Wang, X.M.; Zheng, Z.F.; Duan, K.; Han, X.H.; Sheng, A.S. Submarine geomorphologic features and genetic mechanism in the Xuande atoll, Xisha Islands. Haiyang Xuebao 2021, 43, 81–92. [Google Scholar]
- Xu, J.; Zhao, J.; Li, F.; Wang, L.; Song, D.; Wen, S.; Wang, F.; Gao, N. Object-based image analysis for mapping geomorphic zones of coral reefs in the Xisha Islands, China. Acta Oceanol. Sin. 2016, 35, 19–27. [Google Scholar] [CrossRef]
- Hu, L.; Liu, Z.; Liu, Z.; Hu, C.; He, M.X. Mapping bottom depth and albedo in coastal waters of the South China Sea islands and reefs using Landsat TM and ETM+ data. Int. J. Remote Sens. 2014, 35, 4156–4172. [Google Scholar] [CrossRef]
- Mouying, X.U.; Shu, G.A.; Chendong, G.E.; Huang, M. Characteristics and morphodynamics of newly-formed coral debris deposits on the Niu’e and Ximen Reefs, Jiuzhang Atoll, South China Sea. J. Trop. Oceanogr. 2020, 39, 44–53. [Google Scholar]
- Yin, Y.W.; Tang, D.L.; Liu, Y.P. Remote sensing of spatial-temporal distribution of suspended sediment surrounding islands and reefs in the South China Sea. Remote Sens. Technol. Appl. 2019, 34, 435–444. [Google Scholar]
- Truong, D.D.; Tri, D.Q.; Don, N.C. The impact of waves and tidal currents on the sediment transport at the sea port. Civ. Eng. J. 2020, 7, 1634–1649. [Google Scholar] [CrossRef]
- McCarroll, R.J.; Masselink, G.; Valiente, N.G.; Wiggins, M.; Scott, T.; Conley, D.C.; King, E.V. Impact of a headland-associated sandbank on shoreline dynamics. Geomorphology 2022, 355, 107065. [Google Scholar] [CrossRef]
- Gao, J.; Ma, X.; Dong, G.; Chen, H.; Liu, Q.; Zang, J. Investigation on the effects of Bragg reflection on harbor oscillations. Coast. Eng. 2021, 170, 103977. [Google Scholar] [CrossRef]
- Gao, J.; Ma, X.; Zang, J.; Dong, G.; Ma, X.; Zhu, Y.; Zhou, L. Numerical investigation of harbor oscillations induced by focused transient wave groups. Coast. Eng. 2020, 158, 103670. [Google Scholar] [CrossRef]
- Li, X.M.; Ma, Y.; Zhang, J.; Lv, X.X. Assessing the stability of coral reef sandbanks in the Xisha Islands using high-resolution satellite images. Mar. Environ. Sci. 2022, 41, 48–58. [Google Scholar]
- Kayanne, H.; Aoki, K.; Suzuki, T.; Hongo, C.; Yamano, H.; Ide, Y.; Iwatsuka, Y.; Takahashi, K.; Katayama, H.; Sekimoto, T.; et al. Eco-geomorphic processes that maintain a small coral reef island: Ballast Island in the Ryukyu Islands, Japan. Geomorphology 2016, 271, 84–93. [Google Scholar] [CrossRef]
- Zhou, S.N.; Shi, Q.; Guo, H.Y.; Yang, H.Q.; Yan, H.Q. Evolution of Coral Shingle Cays in the Nansha Islands during 2009–2017. Trop. Geogr. 2020, 40, 694–708. [Google Scholar]
- Ye, H.M.; Zhou, H.; Zhong, X.S. Dynamic environment analysis of a coral sand island in the South China Sea. Soil Eng. Found 2013, 27, 50–52. [Google Scholar]
- JTS/T 231-2-2010; Technical Regulation of Modelling for Tidal Current and Sediment on Coast and Estuary. China Communication Press: Beijing, China, 2010. (In Chinese)
- JTS/T 231-2021; Technical Specification for Water Transport Engineering Simulation Test. China Communication Press: Beijing, China, 2021. (In Chinese)
- Chen, D.; Wang, Y.; Huang, H.; Chen, C.; Yuan, C. A behavior-oriented formula to predict coastal bathymetry evolution caused by coastal engineering. Cont. Shelf Res. 2017, 135, 47–57. [Google Scholar] [CrossRef]
- Booij, N.; Ris, R.C.; Holthuijsen, L.H. A third-generation wave model for coastal regions, Pare I, Model description and validation. J. Geophys. Res. Oceans 1999, 104, 7649–7666. [Google Scholar] [CrossRef]
- Umesh, P.A.; Manasa, R.B. Performance evaluation of input-dissipation parameterizations in WAVEWATCH III and comparison of wave hindcast with nested WAVEWATCH III-SWAN in the Indian Seas. Ocean. Eng. 2020, 202, 106959. [Google Scholar] [CrossRef]
- Matsumoto, K.; Takanezawa, T.; Ooe, M. Ocean Tide Models Developed by Assimilating TOPEX/POSEIDON Altimeter Data into Hydrodynamical Model: A Global Model and a Regional Model around Japan. J. Oceanogr. 2000, 56, 567–581. [Google Scholar] [CrossRef]
- Shi, X.; Liang, B.; Du, S.; Shao, Z.; Li, S. Wave energy assessment in the China East Adjacent Seas based on a 25-year wave-current interaction numerical simulation. Renew. Energy 2022, 199, 1381–1407. [Google Scholar] [CrossRef]
- Wang, Y.H.; Lu, P.D.; Zeng, C.J. Experimental study on motion characteristics of coral sand in Xisha Islands. In Proceedings of the 16th China Ocean (Coastal) Engineering Symposium, Dalian, China, 4 August 2013; pp. 893–897. (In Chinese). [Google Scholar]
- Zhu, L.S.; Song, Y.F.; Qiu, Z.; Chen, X.H.; Mai, B.Q.; Qiu, Y.W.; Song, L.L. Computation of Wave, Tide and Wind Current for the South China Sea Under Tropical Cyclones. China Ocean. Eng. 2003, 4, 505–516. [Google Scholar]
Publisher’s Note: MDPI stays neutral with regard to jurisdictional claims in published maps and institutional affiliations. |
© 2022 by the authors. Licensee MDPI, Basel, Switzerland. This article is an open access article distributed under the terms and conditions of the Creative Commons Attribution (CC BY) license (https://creativecommons.org/licenses/by/4.0/).