Abstract
The Danube Delta, the second-largest wetland in Europe, provides people with multiple ecosystem services, consisting of drinking water, food, flood protection, nutrient recycling, and recreation, as it is a complex social–ecological system. Nowadays, the area faces heavy depopulation due to its failure in achieving an equilibrium between social, economic, and environmental issues. Therefore, its resurgence is the core element of its sustainable development strategy, and particular sectors such as fishing and aquaculture, agriculture, and tourism national strategies deal individually with essential issues without considering the potential conflicts that may arise from a particular sector’s development. This study develops a complex method for decision making concerning the sustainable development of the Danube Delta Biosphere Reserve based on the consultation of both local and higher-level stakeholders in decision making, and the identification of social, economic, and environmental key problems. After their validation by experts, we developed a system dynamics model and ran the identified scenarios together with the stakeholders and recommended policies for the sustainable development of the area. The scenario that combines the transition towards the moderate Intensification of aquaculture with ecological agriculture and slow tourism brings a reduced impact on water quality, but measures to reduce nutrients are still recommended.
1. Introduction
Although used previously without naming it, the current concept of sustainable development is derived mostly from the 1987 Brundtland Commission Report, when it was described as progress that satisfies current desires without impairing the capacity of future generations to satiate their own needs [1,2]. It took almost 30 years to be adopted worldwide (2016) together with the 17 Sustainable Development Goals (SDGs) with 169 associated targets which are integrated and indivisible of the 2030 Agenda for Sustainable Development [3] adopted by all UN countries, including Romania [4]. Unfortunately, there are only eight years left until the deadline, and an intensification of efforts is needed to achieve the proposed targets [5].
Located at the Danube–Black Sea interface, the Danube Delta has gone through various phases of geomorphological [6,7] and socioeconomic development over time, the latter being mostly influenced by Romania’s political regimes—monarchy, socialist republic, the post socialist period, and currently as a member state of the European Union. Being also the largest country in the Danube basin [6,8], many of Romania’s actions have focused on improving water quality, and sustainable development is a concept found in many regional, national, or local government programs in Romania, such as the Regional Development Plan for the South-East Region 2014–2020, National Rural Development Program (NRDP) 2014–2020 [9]. To these are added the development strategies of the different sectors that concern, in general, the underdeveloped components, and less often, the interactions between them and their impact on others [10,11,12]. A simple example in design thinking refers to the decision to solve the congestion created by cars in popular areas by creating roads and parking lots, which finally will attract even more cars without solving the initial problem and creating other issues [13]. Thus, the decision taken on the simple cause-and-effect principle does not apply to complex systems involving the social, economic, and environmental interconnected constituents.
A dual challenge identified by us during stakeholders’ meetings and research, for the sustainable development of the Danube Delta, Europe’s largest water purification system, is the conservation of its ecological assets and the improvement of the quality of life for its residents [8]. Consequently, the sustainable development of the Danube Delta is achieved when the balance between safeguarding the area’s distinctive natural and cultural resources and the residents’ desires to enhance their quality of life and better employment opportunities [8] is reached. As many of the Danube basin’s residents—about 79 million people [14]—the delta inhabitants depend on the Danube’s resources mainly for drinking water, agriculture, fishing and fish farming, leisure, and transport. Except for drinking water, all these activities and uses lead to the degradation of water quality if they develop unilaterally and without environmental protection measures. Thus, the pressures they exert accumulate and lead to a major unevaluated impact, considering that the assessment is required for each activity. Equally, none of the measures provided can be effective unless multiple factors are simultaneously considered.
Therefore, for sustainable development to be achieved, it is crucial to harmonize three core elements: economic growth, social inclusion, and environmental protection. All these factors are vital for the health of individuals and societies, and they are all interconnected. A prerequisite for sustainable development is the eradication of poverty in all its manifestations and dimensions. To achieve this, it is necessary to promote integrated and sustainable management of natural resources and ecosystems, increased opportunities for all, the reduction of inequalities, an increase in the standard of living, and sustainable, inclusive, and equitable economic growth [2].
Over time, development strategies and planning actions did not completely succeed in achieving sustainable development through stabilizing well-balanced relationships inside the complex social–ecological system of the Danube Delta. Currently, we are seeing a depopulation of the area due to the negative demographic increase and labour migration due to the disappearance of tens of thousands of jobs in industry and agriculture aspects, which has also determined a decrease in the economic and social attractiveness of the Danube Delta [8,11,12]. Therefore, the region is economically distraught, with below-average living conditions, high unemployment, population decline, and a significant reliance on natural resources. Hence, there is a persistent risk of unwelcome and unsustainable growth in this vulnerable area. Meanwhile, the management of the Danube Delta strives to implement effective participatory governance within a framework of stakeholder participation and awareness in the territory’s development processes.
Thus, to effectively manage the complex issues facing the region, decision makers and public institutions governing the Delta should be held to a high standard of responsibility. In this regard, they should be tasked with engaging citizens in a joint effort toward participatory governance [8,11,12].
Ultimately, the Danube Delta needs the cooperation of all regional players to manage its area by resolving geopolitical conflicts and promoting increased collaboration for sustainable development [8,15,16,17]. In this way, the link between the scientific community and those who make decisions needs to be more robust and direct in the Delta [8,12]. Science-based planning and policy decisions are the gold standards for the efficient creation of an integrated strategy to address the socioeconomic and ecological concerns in the Delta [15,18]. That is why, considering the complexity of the issue and the real management problems it poses, the decision maker must consider all the relationships between the factors. Otherwise, it risks implementing ineffective policies. It is thus essential to integrate scientific evidence into decision making.
System dynamics modelling has been widely used since the 1950s for problem analysis in applications ranging from planning, control management, engineering, and financial management to public policy [19]. System dynamics modelling is fundamentally problem-driven, and if possible, a system dynamics-based modelling technique is employed to avoid modelling the system “as a whole” [20]. Experts work with “problem owners” to build mental models that define the current issue and how it relates to management or policy indicators and remedies [21,22]. System dynamics simulation has several benefits over traditional simulation, which include: the ease of use of system dynamics simulation applications; the applicability of system dynamics general principles to social, natural, and physical systems; the ability to address how structural changes in one part of a system may affect the behavior of the system as a whole; and combined prediction (predicting the behavior of a system under a given condition) [23,24,25].
Consequently, causal mapping and the creation of computer simulation are both a part of system dynamics, which aims to comprehend system behavior. Then, several policies and scenario alternatives are methodically evaluated to address “what-if” scenarios. This enables policymakers to test their choices before putting them into practice in the real world [26,27,28]. Policymakers learn more about how the system will react to their actions and the possible unintended consequences of policies in this decision-experimentation learning environment.
In this context, our study’s objective was to build up a system dynamics-based planning tool that would assist integrated sectoral development through participative and scientifically based management decisions for the Danube Delta’s sustainable development.
2. Materials and Methods
The study area is the legally defined territory of the Danube Delta Biosphere Reserve (580,000 ha), located Southeast of Romania, and comprises the plain Delta, the Razim-Sinoie Lake Complex, Maritime Danube, Sărături-Murighiol lake, and the Black Sea waters up to the 20 m isobath. The following geographic coordinates describe the reservation’s location: 45°27′ (Chilia arm, km 43) and 44°20′40″ (Capul Midia) north latitude; 28°10′50″ (Cotul Pisicii) and 29°42′45″ (Sulina) east longitude (Figure 1).
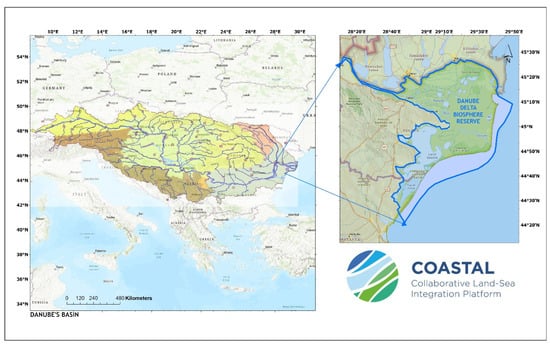
Figure 1.
Map of the region (Danube’s basin) and the studied area (Danube Delta).
Most of the total area (312,440 ha) is made up of the natural aquatic and terrestrial ecosystems that make up the public domain of national interest and are listed (1990) as having universally significant heritage value by the UNESCO Convention on the Preservation of the World’s Cultural and Natural Heritage and RAMSAR site.
The remaining area includes dammed areas for fish farming, agriculture, and forestry (approx. 80,000 ha), including land areas of private or public property of local interest in the urban areas or territories’ villages (approx. 29,000 ha) as well as the marine buffer zone (approx. 103,000 ha).
The Danube Delta Biosphere Reserve is situated in three administrative areas (counties): Tulcea (87.73%), Constanța (12.23%) and Galaţi (0.14%), where 11,576 inhabitants live (2020) [17].
For practical reasons, due to data availability and considering that the activity in the area upstream affects this highly biodiverse area, we included in the model data collected for the entire county of Tulcea.
According to general data management, depending on the variables’ typology (quantitative or qualitative), the role in the model, and the availability of the existing information regarding a certain variable, we used different sources, such as statistical data from the Romanian National Institute of Statistics, literature overview and stakeholders’ recommendations made during the meetings and workshops that took place during the project.
Therefore, we classified the model’s variables according to the data source and the reference topic, as follows:
- -
- Statistical data from the Romanian National Institute of Statistics:
- Aquaculture, accese: fish consumption;
- Tourism: duration of_tourist staying, the initial duration of stay, initial number of tourists, revenues per tourist day, tourism carrying capacity;
- Agriculture: annual precipitation, crop consumption factor, crop price, ecofarm_fertilizer_use, ecofarm production costs, minimal ecofarm yield, minimal_traditional_farm_yield, traditional crop price.
- -
- Literature overview:
- Aquaculture: aquaculture intensification rate, fish farming labor intensity, fish price, initial area in use for intensive aquaculture, initial area in use for normal aquaculture, intensive aquaculture development rate, intensive aquaculture N load, intensive aquaculture productivity, labor costs per employee, maximum area available for aquaculture, subsidies per unit area;
- Tourism: emergency_level, fraction_of_revenues_used_for_marketing, load_N_per_day, initial marketing budget;
- Agriculture: evaporation, FarmToFork_Target, maximum_area_ecofarms, maximum_N_acceptable_concentration, N_crop_uptake, initial area ecofarms, initial area traditional farms, maximum area ecofarms, maximum fertilizer use, maximum_irrigation, maximum N acceptable concentration, specific crop consumption rate, traditional fertilizer use, traditional farm production costs, traditional intensity.
- -
- Stakeholder expertise:
- Aquaculture: production cost rate for intensive aquaculture, production cost rate for normal aquaculture;
- Tourism: decline rate without development, employment factor, time until emergency level is reached;
- Agriculture: agriculture water demand for 1 hectare, eco-crop price, eco-labor_intensity, specific_crop_consumption_rate, water supply per hectare.
Moreover, for several variables, the data are calculated based on causal relations, from equations set within the model:
- Aquaculture: aquaculture intensification, Danube N load, effects of pollution on fish farming, fish production ratio, impact of N load aquaculture on water quality, intensive aquaculture development, intensive aquaculture production, intensive fish farm employment, intensive fish farm revenues, intensive fish farm area, normal fish farm employment, normal fish farm revenues, normal fish farm area, spatial pressure from aquaculture development, total aquaculture N load, total aquaculture production, total area in use for aquaculture, total fish farming employment, total fish farming revenues;
- Tourism: impact of marketing on development, impact on N from tourism on water quality, impact pollution on tourism, impact tourism attractiveness on decline, initial tourist days, marketing, number of tourists, tourism attractiveness, tourism decline, tourism development, tourism employment, tourism N load, tourism pressure, tourism revenues;
- Agriculture: eco farm_employment, ecofarm_conversion, ecofarm income, ecofarm productivity, ecofarm transition rate, ecofarms area(t), forest belts installation year, fraction ecofarms, impact of ecofarm fertilizer use on_yield, impact of N from agriculture on water quality, impact of traditional farm fertilizer use on yield, impact of water supply on yield, irrigation, N runoff, number of years forests belts are present, Runoff rate, total agriculture area, total agriculture employment, total agriculture income, total ecofarm productivity, total traditional farm productivity, total fertilizer use, total production, total traditional farm production, traditional farm employment, traditional farm productivity, traditional farms area.
We used different software for specific purposes as follows: ArcGIS (map), Vensim (Causal Loop Diagrams and model), Excel (graphs) and Canva (graphical abstracts).
Methodology
The methodology (Figure 2) was developed within the Horizon 2020 project, Co-creating evidence-based business roadmaps and policy solutions for enhancing coastal-rural collaboration and synergies (COASTAL) (https://h2020-coastal.eu/, accessed on 13 September 2022) and comprises the following steps (the first three steps were described by [18] and the fourth by [29]) fulfilled during the COASTAL project in 6 Multi-Actor Labs (case studies) spread all over Europe—Belgium, Sweden, Greece, France, Romania, and Spain. In Romania, we proceeded as follows:
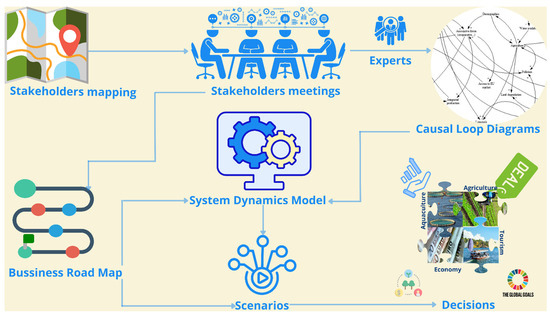
Figure 2.
COASTAL methodology for decision makers on the Danube Delta’s sustainable development.
- Stakeholders mapping—The snowball method, which comprises people from initial, smaller, stakeholder groups finding additional contacts and stakeholders, was used for the stakeholders’ identification [18].
- Stakeholders’ meetings—The participatory approach encouraged stakeholder engagement, allowing them to explore their insights and exchange experiences to better understand the behaviour of the ecosystem [18]. Overall, during the meetings, 97 people with expertise in different fields (agriculture, cross-compliance and ecosystem services, coastal and rural tourism, fisheries and aquaculture, blue growth industry, transport, administration, and rural development of the Danube Delta) participated in six sectoral meetings [18]. The participants were locals (village mayors, NGOs, and business owners) but also representatives of the national authorities in the field. We organized six sectoral workshops with the purpose of bringing together domain experts, policymakers, and business entrepreneurs to explore the land–sea interactions from a coastal or rural perspective. They were urged to think about the drivers and impediments to cross-regional and cross-sectoral collaboration. Additionally, both positive and negative externalities were requested of them. We had a candid chat with them while applying systems-thinking conceptualization techniques. During this process, we discovered the key problems, chances, and barriers to sustainable growth as well as cross-sectoral synergies. To accomplish this, methodological coherence was required. To define the initial drivers of the mental modelling exercise flexibly and objectively, a workshop with facilitators from all project study cases was organized. The following is the final list of drivers selected by the experts and used in each workshop: water, human consumption pattern, regulation/policy, temperature, human migration, pollution, and infrastructure [18].
- Causal Loop Diagrams—The main result of the meetings consists of sector-specific shared mental maps of the land–sea system in the Danube Delta [16] collecting all the relevant aspects of the land–sea interactions identified during the discussion by the participants. The results from the individual sectors were afterwards condensed into causal loop diagrams (CLD) both at a sectoral level and as an overall CLD integrating the individual sectors and answering relevant questions such as “which problems and priorities can be defined?”, “who is affected by the problem, and who may be involved in causing it?”, and “is the problem dynamic in nature?” [18,20].
- Business Road Map—The roadmap’s objective is to put out a collection of commercial and policy options that can assist the region in making the transition to a sustainable future cocreated by local stakeholders from a variety of sectors throughout the entire region. The identification of critical locations for intervention within the coastal–rural system and the simulation of various scenarios to arrive at the desired state are both made possible by the coastal–rural system dynamic model. While identifying and proposing solutions involving fishery and aquaculture, agriculture, and tourism, based on local expertise and national to international best practices, scientists and local stakeholders identify the problem [29].
- Model—The CLDs were quantified in a ‘stock-flow’ model, which allows for the examining of the combined impact of reinforcing and balancing feedback mechanisms on the dynamics of the system. The complexity of stock-flow models is in the feedback structure and interactions between variables, which determines the dynamics of the model and hence the way the model responds to policy and business decisions. Thus, the dynamics of conflicts between stakeholders can be analysed to make the best decision appropriate to the proposed goal, the sustainable development of the Danube Delta [30]. The model is organized from a threefold perspective, that integrates three submodels generated by the main problems identified for the economic activities in the region, namely aquaculture, tourism, and agriculture, resulting in time graphs and data showing the dynamics of the problem over time (2050). Each of these three submodels feeds into a master file addressing the socioeconomic development of the area expressed as the rural income and rural workforce. The goal of the model is to explore alternative scenarios of human activity development with the improvement of the quality of life and sustainability within the Danube Delta Biosphere Reserve and its marine waters (Black Sea), as one of the most impacted areas along the Romanian littoral. Therefore, the aquaculture submodel may serve the area’s sustainable development in the future by predicting the beneficial effects of the onset of such economic activity, while also pointing out the possible side effects that should be considered, with the final goal to help the decision-making actors properly design a development strategy for the sector. The rural tourism submodel intends to answer the question of what level of tourism can be developed in the interested area without harming the environment. Finally, the agriculture model’s central point is the potential reduction of the environmental impact of the increasing conversion rate of conventional agriculture to organic farming.
Therefore, the model combines three of the key economic activities of the region—fish farming, agriculture, and tourism, aiming to evaluate their development over various scenarios and their impact on water quality. Practically, all aspects of the delta’s inhabitants’ lives are related to water in one way or another. For each economic activity, several aspects were considered, such as the offer (area of farms, crop production, fish production, accommodation capacity), the demand (fish consumption, number of tourism), or the environmental pressure (impact of nitrogen from agriculture, fishery, or tourism on water quality). The dynamics of local population income and employed population were also considered.
The model has input variables (Table 1), defined with data from different sources such as statistical data, literature overview, stakeholder’s expertise, results from other research projects, or expert assumptions and output variables, which represent the results obtained from the equations transposed in the Vensim software. In the system dynamics modelling process, we defined the simulation objectives and system’s boundaries, developed stock-flow diagrams, formulated the equations, calibrated, and validated the model, and used it to test different scenarios.

Table 1.
Selection of the system dynamics model variables affected by the external uncertainties—Danube Delta.
Agriculture and tourism have been characterized by an upward trend in their development around Danube Delta, according to published statistics by the National Institute of Statistics. The number of tourists who have chosen the Danube Delta as a holiday destination has increased from year to year, even in the context of the COVID-19 pandemic, and consumer preferences are moving towards local organic products and a more nutritionally balanced lifestyle. Furthermore, intensive aquaculture has become of interest because, according to the national reports [31], domestic fish production in Romania represented less than 20% of the internal consumption (2016–2019), putting production in 18th place in the EU, with 12,798 t (0.93% of total EU production). The rest originated from imports. Thus, for 2019, it is estimated that the national consumption is over 120,000 t, representing approx. EUR 195 million. This shortfall in domestic production compared with fish consumption can be interpreted as a potential for the development of the fisheries sector in Romania (over 100,000 t).
Although from the local economic point of view this development is beneficial, the increase in these economic activities in the current direction entails the deterioration of the environment, and in the long term, due to these environmental pressures, we estimated decreasing revenues at the level of each interest sector. Accordingly, one of the combined model’s feedback structures for the impact of nitrogen load from aquaculture, agriculture, and tourism on water quality considers the interaction between the potential mentioned sectors’ development correlated with the fish farming and ecofarming area and the intensification rate of the process, and with the tourism-carrying capacity development and the duration of tourist stay.
As a system dynamics model, it returns the continuous simulation that uses hypothesized relations across activities and processes and helps us to understand the system’s behaviour [32].
Accordingly, we used the following equations for the mentioned variables:
- N crop uptake (tN/tcrop) = (specific crop consumption rate × total agriculture area)/total production
The agriculture model was built as a one-crop model. We chose wheat crop for our model as it the most cultivated crop in the region. Specific crop consumption rate (0.026 t N/ha) was considered from good agricultural practices code in place at the date of model design (2020).
- N runoff (t/y) = Runoff rate*(total fertilizer use-total production*N crop uptake)
- The annual precipitation data (mm/y) were expressed as average precipitation reported for Tulcea region, with a random function between minimum and maximum reported (400,500 mm/year).
Other nitrogen loadings were calculated as follows:
Total aquaculture N load (ton N/Y) = Normal Fish Farming Area*normal aquaculture N load + Intensive Fish Farming Area*intensive aquaculture N load, where normal aquaculture N load = 0.45 t N(/ha*year) estimated from [33,34,35] and intensive aquaculture N load is double.
- Tourism N load = load N per day*Annual Tourist Days
Load N per day was expressed as 0.0001 ton N/(Tourist Days*Year) as an average of literature data reported on typical values for human nitrogen emissions, including food, housing, transportation, and goods and services estimated from [36,37,38].
- Scenarios—From the first project’s meetings on, we wanted to get as close as possible to the stakeholder’s vision on the area of interest, the Danube Delta. Therefore, we asked them what should change over time for improving their activity and everyday life. With their beliefs, we started to draw scenarios, and we used system dynamics modelling to find out the evolution of the variables connected to these scenarios.
As a common starting point to develop the model-specific scenarios, we used shared socioeconomic pathways (SSP [39]), complemented with insights from the IPCC report ‘Global warming of 1.5 °C’, and the representative concentration pathways (RCPs).
In total, we developed four scenarios for the Danube Delta case. Each of them is rooted in the combination of a certain shared socioeconomic pathway (SSP) with a climate scenario linked to RCP 1.5 (which limits global warming to below 1.5 °C, the aspirational goal of the Paris Agreement [40]). The following overview shows the combinations used during the scenario-building process:
Scenario 1: SSP1 Sustainability—Taking the Green Road (low challenges to mitigation and adaptation) + RCP 1.5:
In this scenario, the development respects perceived environmental boundaries [20]. Thus, equity and ethics are important with an emphasis on human wellbeing and reduced inequality. The Danube Delta’s consumers’ preferences will diversify; they will consume less meat and more locally produced fish, from nonintensive aquaculture. The ecolabel certification schemes will be developed and implemented, for fish and agrifood products. Due to the high degree of education, there is a higher demand for rural and ecological tourism destinations, including the Danube Delta. The local population in the Danube Delta has responsible behaviour in terms of environmental protection, as well as domestic or foreign tourists. Regarding social responsibility, the concept of a united community exists, and ethics are important and applied. Ecological tourism services are provided to European standards and the offer is close to that of more developed countries. Gastronomic tourism is a favourite option for those who visit the Danube Delta; tourists prefer to consume fish, dairy, and other traditional, local dishes from sustainable sources. The strategy of decision makers and local and national administrations is focused on environmental conservation and good practices, and massive promotion of ecotourism. Fewer fossil fuels are being used in local transport both by tourists and locals, and environmental conditions are gradually improving, both for organic agriculture and aquaculture and ecological tourism. Improvements in agricultural productivity are seen through the rapid diffusion of best practices of agroecology. There is a rapid technological change toward environmentally friendly processes, including yield-enhancing technologies. Direct farm payments are replaced by agrienvironmental and less-favoured area payments; therefore, the organic farming cost is decreasing while the traditional is increasing. The capacity to adapt to climate change is high, given the well-educated, rich population, the high degree of good governance, and the high development of technologies.
This scenario was envisaged by one of the stakeholders’ groups in our meetings at the start of the project when the main discussion topic for future development of the Danube Delta and Black Sea coastal area was tourism (generating 90% of the GDP). Their vision was that green-friendly tourism should be approached, by promoting electric transportation and clean technologies (e.g., local wastewater treatment) and preserving the specificity of the zone about traditions, folklore, and gastronomy. Households can function as guesthouses, offering accommodation and catering services, in an authentic traditional environment. Another development direction was promoting different types of tourism activities—sophisticated travellers following belletristic itineraries, routes based on ancient ruins (Greek, Roman) or following literary/cultural routes: multicultural cemetery of Sulina, Lighthouse of Sulina, the houses of the old owners, two wrecks that are very well-preserved. One of the mayors of the villages on the Danube delta upstream envisaged the village as a mini-port for cruises on the Danube and tourists following the neighbouring wine and archaeological routes. Agricultural practices in the area should change from large landowners to smaller surfaces cultivated by locals (pre-emption rights) and the resulting products should be used for their livelihood, marketed in local pensions/hotels, and only the surplus (if any) should be marketed elsewhere.
Scenario 2: SSP2 Middle of the Road (medium challenges to mitigation and adaptation) + RCP 1.5:
In this scenario, urbanization reaches an average level in the hinterland, but its type depends on the specific area. The practice and productivity in the field of organic agriculture reach an average level and the technological trend does not shift markedly from historical patterns [39]. In the Danube Delta, farmers and fish farmers are beginning to take specialization courses, and the quality of the labour force has improved. The agricultural performance, including aquaculture and tourism sectors, has improved by making investments in sanitary, water, and health infrastructure. Although meat consumption is maintained at an average level in the area, the culinary preferences of the inhabitants and tourists have diversified, and the structure of the offer of agrifood products is at the level of the links present on the value chain. Marketing policies are beginning to facilitate the local producers’ access to the market of agrifood products, depending on their production specifics. The environmental policies are focused on reducing pollution, but the impact of these actions is medium in the long term and the Danube Delta’s ecosystems still experience degradation. The promotion of the use of the concept of energy from renewable sources is beginning, at the stakeholders’ level, in the tourism and agriculture industry. At this stage, the challenge identified at the environmental level remains, whilst the constant degradation and organic farming areas are decreasing.
In our opinion, this scenario is in line with the 2030 vision for Danube Delta “An attractive area—with precious biodiversity and vibrant, small/medium scale (artisanal and modern) agriculture and business—where people live in harmony with nature; integrating economies of tourism, farming, and fishery; and supported by urban service centres”.
Scenario 3: SSP4 Inequality—A Road Divided (low challenges to mitigation, high challenges to adaptation) + RCP 1.5:
In this scenario, highly unequal investments in human capital, combined with increasing disparities in economic opportunity and political power, lead to increasing inequalities and stratification across the country [39]. Thus, tourism becomes a practical activity only for people with a high-income level, and the number of those who are working in the tourism field is decreasing, as well as their incomes. The impact of tourism on water quality is lower, but the attention of the policymakers regarding the environmental policy is also lower, being focused on local issues around the middle- and high-income areas. The institution defends the interests of those economic agents with higher incomes and underestimates the importance of economic agents with lower turnovers.
The agricultural productivity is high for large-scale industrial farming and low for small-scale farming, and the fish is obtained from the cheapest sources, even from the supermarket. The lack of environmental concerns leads to disasters. The labour force is cheap even if technology/automation is important.
Scenario 4: SSP5 Fossil-fuelled Development—Taking the Highway (high challenges to mitigation, low challenges to adaptation) + RCP1.5:
In this scenario, there are strong investments in health, education, and institutions to enhance human and social capital [39]. The agricultural sector is modelled according to the global standards in force, the chains of agrifood product capitalization are integrated horizontally and vertically, the aquaculture is intensive, and the fish products industry is growing massively. Local consumerism and the consumers’ preferences for rich diets in meat and fish and industrial products obtained from meat processing, and less in fruits and vegetables, are developed.
The trend of industrial production of conventional agricultural products is constantly growing, and the labour force in the agriculture, aquaculture, and tourism sectors is developing. There is massive use and exploitation of fossil fuels in all the economic activities of interest in the case study area and massive deforestation in the forests of the Danube Delta, but also in Tulcea County in general. The policymakers create a major difference between the made systems made by people and the natural resource systems.
Representative Concentration Pathway, RCP 1.5—Danube River.
There is a high agreement that air temperature is likely to increase in the future with a gradient from northwest to southeast, both annually and in all seasons. For the future period (2021–2050), an increase in annual mean temperature between 0.5 °C in the upper basin parts and up to 4 °C in the lower basin parts of the Danube River Basin (DRB) is projected [41]. Romania is situated in the lower basin, so 1.5 °C is considered appropriate. Since the DRB is in a transition zone between increasing (Northern Europe) and decreasing (Southern Europe) future precipitation, overall small precipitation changes are to be expected. The mean annual precipitation sum is likely to remain almost constant with an intensification in seasonal changes. A strong decrease in summer precipitation and an increase in winter precipitation will be most likely. Particularly in the southeastern parts, a reduction of about 25% and 45% is shown in the scenario results [41]. Accordingly, for RCP1.5, we considered a reduced Danube flow by 10%.
- Decisions—The developed model and scenarios represent a dynamic environment for exploring management measures to support the sustainable development of the Danube Delta. This step will be deepened in the Results and Discussions chapters.
3. Results
According to our stakeholders and experts, expressed as meetings’ conclusions, the governance and excessive bureaucracy are disturbing the economic activity and social areas, avoiding real problems such as depopulation and lack of workforce, the conflict between marine protected areas (and restrictive measures) and the exploitation of resources, or the Danube Delta’s clogged canals and invasive species, which mainly affect the fishery. Agriculture has clear impacts on both inland and coastal water quality, and the locals are not aware of the causes, effects, and impacts of the pollution on the Danube Delta and the Black Sea and even on the surrounding neighbourhood. Agriculture is for subsistence and the area is very poorly developed. On the contrary, due to the Danube Delta protected area, there is an increased pressure downward in the coastal zone for seasonal tourism (only three to four months/year). Thus, there is an artificial population “growth”, which is not sustained by “real” economic development. Additionally, each activity has its national strategy, which is added to the development strategy of the Danube Delta itself. The integration of the impacts that the development of the activity has can be achieved through the COASTAL model. Consequently, in the context of COASTAL, researchers, actors and stakeholders detected the need to develop a systemic planning tool to support integrated sectoral development with science-based management decisions.
3.1. Model and Scenarios
We investigated how changes in the modelled system’s environment, according to different scenarios, impact the functioning of this system, and hence the patterns of key variables. We ran the model under each of the four described scenarios and applied changes in exogenous variables—fish consumption, fish price, labour costs, duration of tourists’ stay, crop cost, farm-to-fork target, etc. (Table 2). The Danube’s Mouths—Black Sea model has also different key performance indicators (KPI) concerning several social, economic, and environmental aspects (Table 2).
Table 2.
Variable changes according to defined scenarios and the model’s KPIs.
3.2. System’s Key Performance Indicators (KPI)
KPI 1: Intensive Fish Farming Area.
The moderate intensive fish farming (4 t/ha) area depends on the aquaculture intensification rate and development according to each SSP. Scenarios 1 and 2 (Supplementary Materials representing data returned by the model regarding the sustainable development of the Danube Delta) show the same pattern with a steady increase, reaching (2050) 11% and 66% of the total surface [42]. Scenarios 3 and 4 (Supplementary Materials) have almost the same endpoint, representing 87% and 97% with a different rate of increase, which is very sharp for scenario 4 when the maximum is reached in the first 5 years (Figure 3).
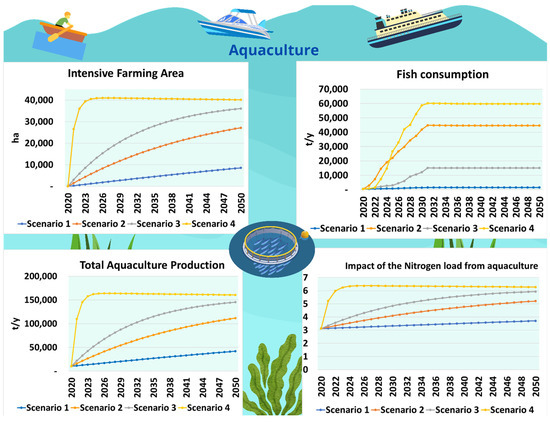
Figure 3.
Aquaculture’s KPI change in different scenarios—Danube Delta.
KPI 2: Total aquaculture production.
The total aquaculture production represents the sum of normal aquaculture and intensive aquaculture production, which directly depends on the area used for normal or intensive aquaculture. Like KPI 1, scenarios 3 and 4 show the highest production. Scenario 4 shows the highest increase rate in the first 5 years, and reached the target, which can be interpreted as a potential for the development of the sector in Romania (over 100,000 t) (Figure 3). However, this analysis was performed only for freshwater aquaculture, so we should consider in future the marine aquaculture potential in the area, which was discussed with the Fishery Local Action Group local representative.
KPI 3: Fish consumption.
In Romania, fish consumption sustainability requires encouraging organizations to assume the responsibility of presenting to customers that aquaculture could be one of the solutions for protecting the environment [42]. Thus, producers, vendors, and distributors can cooperate to present themselves in front of the customers with honest retailing practices, either for captures or aquaculture. Without the organizations assuming the role of sustaining fish consumption based on solutions with low environmental risks, the behaviour of consumers would hardly let itself change [43]. The highest fish consumption, overpassing the European average, is obtained in scenario 4, while the lowest is resulting from scenario 1 (Figure 3).
KPI 4: Impact of nitrogen load from aquaculture on water quality.
One of the submodel key performance indicators according to the COASTAL project’s main objective is the impact of nitrogen load from aquaculture on water quality. The indicator is calculated as “grey water” [44] and depends on the total aquaculture nitrogen load divided by the Danube flow and maximum nitrogen acceptable concentration from today’s national legislation. The strongest impact of nitrogen load from aquaculture resulted in scenario 4, while the lowest was from the “Green Road” scenario (Figure 3).
KPI 5: Annual tourist days.
“Annual tourist days” is defined by the ratio between the number of annual tourists who choose the Danube Delta as a holiday and agreement destination and the average length of their stay. In scenario 2, the average duration of a tourist stay is 2.2 days/tourist. This value is given both by statistical sources and by the stakeholder’s opinions, who participated in the meetings within the project. Thus, the maximum value is reached in scenario 1,while in scenario 3, the annual number of overnight stays reached the minimum (Figure 4). The model also takes into account the critical threshold of the number of tourists who can stay in the Danube Delta area, without endangering the environment.
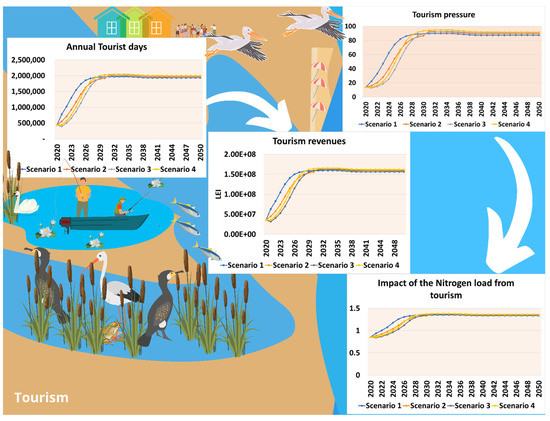
Figure 4.
Tourism’s KPI change in different scenarios—Danube Delta.
KPI 6: Tourism revenues.
“Tourism revenues” are linked to the previous KPI, the “annual tourist days”: the higher the number of tourists in the Danube Delta is, the higher the revenues obtained in this sector will be. On the other hand, it must be taken into account that the prices of the tourist offers are volatile, changing depending on demand. A high tourist demand influences an increase in the prices of tourist services (Figure 4). In 2021, according to the National Institute of Statistics, a tourist accommodation day in the Danube Delta cost around RON 81, which means around EUR 17 (based on the revenue indicator and the calculation of the number of tourist days).
KPI 7: Tourism pressure.
“Tourism pressure” is represented by the ratio between the annual tourist days and the carrying capacity. In scenario 4, the tourism pressure reaches the highest level, and in the “Green Road” scenario, we observe the lowest pressure regarding the Danube Delta environment (Figure 4). However, we note that in all 4 scenarios, tourism harms the environment in different proportions.
KPI 8: Impact of nitrogen from tourism on water quality.
The tourism footprint is reflected through the “impact of nitrogen from tourism on water quality” evolution under different scenarios. As we can observe (Figure 4), tourism has an important impact on water quality in each scenario. The “impact of nitrogen from tourism on water quality” is calculated by dividing the total tourism nitrogen load on the Danube flow and the maximum nitrogen acceptable concentration, regulated by legislation in force. This KPI reaches the highest value in Scenario 4 and Scenario 3, and the lowest value in Scenario 2 (Figure 4).
KPI 9: Ecofarm production.
Ecofarm production is defined by multiplying the registered yield and the ecological agricultural surface at the level of the case study area. Before conventional agriculture production became ecological, traditional farms had to follow a conversion period of at least two years. In scenarios 1 and 2, the ecofarm production reaches the highest level—this value is characterized by a growing trend—and in scenario 4, the lowest ecological production is recorded. We can observe (Figure 5) the symmetry between the increase and the decrease in ecofarming production through all scenarios.
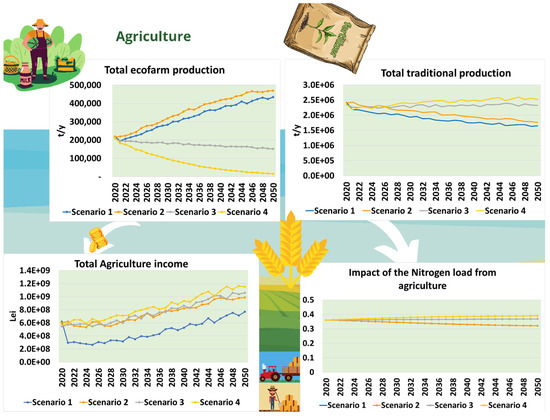
Figure 5.
Agriculture’s KPI change in different scenarios—Danube Delta.
KPI 10: Traditional farm production.
The dynamic of this KPI is influenced by the productivity registered at the traditional farm level and by the traditional farms’ area (Figure 5). It can be observed that in scenario 1 and scenario 2, where the ecofarm conversion rate is at a higher level, the total traditional farms’ production decreases, while in the later scenarios, there is an increase in traditional farms’ production, reaching the highest level in Scenario 4.
KPI 11: Total agriculture income.
The agriculture income is defined by summing up the revenues of the farmers that practice ecofarming and the obtained income of the traditional farmers, considering factors such as both traditional and ecological crop price, production, costs, and surface. We observed (Figure 5) that the total agriculture income achieves the highest point in scenarios 2 and 1. The highest ecofarm production in the Danube Delta leads to the highest level of income in the agriculture field (Figure 5).
KPI 12: Fraction ecofarms.
The “fraction eco farms” is defined by ecofarms’ area divided by the total, both traditional and ecological. We can observe that this KPI reaches the highest value in scenario 1 and scenario 2, and in the last two discussed scenarios, the lowest value (Figure 5). This dynamic is influenced by ecofarms’ transition rate, also considering the “Farm to Fork” target.
KPI 13: Impact of nitrogen load from agriculture.
The “impact of nitrogen load from agriculture” is represented using the same methodology used for the impact of nitrogen from aquaculture or tourism calculations. The lowest impact of the nitrogen load from agriculture is in scenarios 1 and 2, characterized by the highest value of the “Farm to Fork target” variable used in the model (0.30 or 0.25). The highest level of this KPI is reached in scenario 4 (Figure 5).
4. Discussion
The continuous natural development of the Danube Delta is the result of the dynamics between the Black Sea’s level and the sediments and freshwater supply from the Danube River [45,46,47]. Therefore, the deposition areas in the Danube Delta are divided into three regions: (1) the delta plain (approx. 5800 km2), of which the marine area makes up 1800 km2; (2) the delta front, (approx. 1300 km2) divided into the delta front platform (800 km2) and the delta front slope (ca. 500 km2), and extending offshore to a water depth of 30–40 m; and (3) the prodelta, located offshore [45,48]. Apart from the three main branches—Chilia, Sulina, and Sf. Gheorghe—through which the Danube flows into the Black Sea, in the delta plain, there are vast expanses covered with water and vegetation (narrow waterways, lakes, and wetlands) that serve as buffer zones and filtering reservoirs for numerous pollutants and nutrients dissolved or adsorbed onto suspended materials [47,49]. However, due to anthropogenic hydrological changes (e.g., drainage plans, dike construction, impoundments, channels dredging) and land reclamation for agriculture, the capacity of the system to store nutrients and pollutants have been reduced [46]. When the Danube River is at its highest flow, those areas preserve water, and when it is at its lowest, they release it. Thus, the water residence time in these depressions is reported between 2.2 [50] to 3–4 months [51]. As a result, the cycle of nutrients that are taken up by aquatic plants and transformed into biomass so that later, after remineralization, they are deposited in sediments or are drained from lakes in particulate or dissolved form can be disrupted both by excess and by the Danube’s flow being increasingly affected by climate change [41], particularly at high flow rates when nutrient retention is minimal [41,52].
The Danube Delta ecosystem offers people numerous services, including biodiversity conservation, water purification, flood prevention, healthy fisheries, and landscape and culture [53,54,55]. For example, the lakes in the delta are efficient sinks in the warm season when they take on average, net 43% of the external nitrogen supply [47]. By extrapolation, considering that 10% of the Danube waters reach the plain delta, it is estimated that the net impact of the delta in the elimination of nutrients in the warm season is 4.3%. On the other hand, the release of nutrients from the sediments represents an important source of ammonium at the end of the warm season [47].
Therefore, considering the importance of nutrients in the Danube Delta and the discharges into the Black Sea, whose eutrophication reached dramatic impacts in the 80s–90s [56,57,58,59,60], we considered water quality as the central element of sustainable development in the Danube Delta. Thus, the main KPI that links the three submodels cumulating the pressures from different human activities—agriculture, tourism, and aquaculture—representing the introduction of nutrients is water quality. The water quality in the Danube Delta is calculated in our model as the cumulative impact of nitrogen load from agriculture, aquaculture, and tourism. We modelled the nitrogen loads as being, on the one hand, the common element to all three activities’ emissions. On the other hand, nitrogen management in the Danube basin is still deficient, and reductions are needed [61], which is not the case for phosphorus [62].
In turn, these were calculated as a function of the upstream water quality, climate change variable related to the river flow and maximum allowable concentration of nitrogen according to national legislation. The variable is also improved through ecological restoration and management measures taken based on research and monitoring activities. The water quality in the Danube Delta is deteriorated by pollution from different sectors—agriculture, tourism, and urbanization. The water quality is an important input to the increase in biodiversity, which is one of the main ecosystem services of the biosphere reserve. Another important link is with the Black Sea water quality, which is significantly influenced by the river’s outflow, not only due to freshwater but also nutrients and pollutants.
In our study case, the lowest pressure is exerted by agriculture, which is reduced in the wetlands and coastal zone. However, the strategy of changing traditional to ecological farming reduces the impact in scenarios 1 and 2. On the opposite, the transition to intensive fish farming has the biggest impact on the water quality, almost doubling in scenario 4, and in 2050, reaching a 12–16-fold higher level than that of agriculture. One of the most important activities from the Danube Delta and the Black Sea, tourism, has the same impact on water quality in the long term (Figure 6).
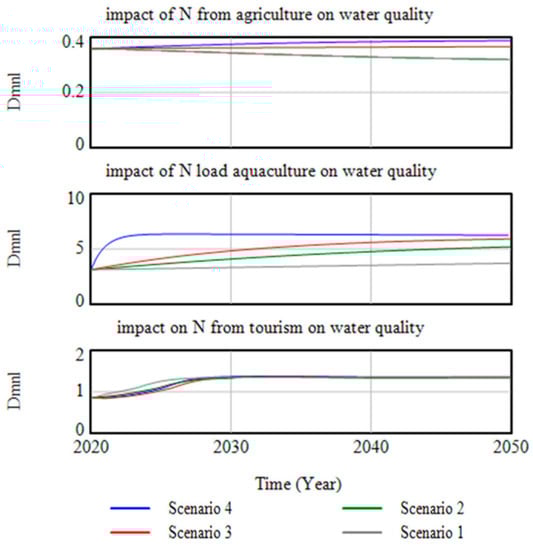
Figure 6.
Impact of nitrogen load from agriculture, aquaculture, and tourism in relation to different scenarios of Danube Delta development (results of the model realized in Vensim software produced by Ventana Systems, Harvard, USA).
The European Green Deal and the Farm to Fork Strategy underline the potential of farmed seafood as a source of protein for food and feed with a low-carbon footprint, which has an important role to build a sustainable food system. The Farm to Fork Strategy also sets specific targets for aquaculture, in particular the reduction in sales of antimicrobials and a significant increase in organic aquaculture [1]. In our case, this approach requires at least two major measures—increasing the area for intensive aquaculture by transitioning from normal but also by allocating areas for aquaculture and intensifying it by using modern food and technologies to contribute to the proposed targets. The implementation of the measures involves actions such as space allocation planning—land and water, coordinated with the marine area of the Danube Delta. Coordinated spatial planning should encompass freshwater as well as land-based aquaculture (recirculating aquaculture systems, RAS) and marine aquaculture, including transitional (brackish) waters, in front of the Danube’s mouths among other activities, while preserving the aquatic ecosystem.
The moderate intensive fish farming (4 t/ha) area depends on the aquaculture intensification rate and development according to different scenarios. Scenarios 1 and 2 show the same pattern with a steady increase, reaching (2050) 11% and 66% of the total surface. Scenarios 3 and 4 have almost the same endpoint, representing 87% and 97% with a different rate of increase, which is very sharp for scenario 4 when the maximum is reached in the first 5 years. Consequently, scenario 2 is considered the most sustainable and robust for the sustainable development of the area.
We explored alternative scenarios to improve the quality of life and sustainability within the Danube Delta Biosphere Reserve and its marine waters (Black Sea) as one of the most impacted areas along the Romanian littoral based on the land–sea interactions identified through separate sector workshops and developed system dynamics model.
As a result, understanding the feedback structure of the corresponding system is necessary for creating coherent actions. Feedback is a series of causal connections that go back to the original cause [19]. For instance, if waste management improvements are planned for the area, this may eventually lead to cleaner villages and waters, which may increase the region’s tourism appeal. Increased attractiveness might result in higher local revenues, which would allow for new investments that could be used to further enhance the area’s waste management, along with an effective tax system and local empowerment. This example features substantial delays, which may need to be considered for an accurate evaluation of the long-term effects of policy decisions. From a systems perspective, numerous such feedback loops interact simultaneously to influence how a region develops.
The water quality degradation in different scenarios requires crucial steps to be taken to lessen the effects of activities that are more detrimental to the environment. The extension of drinking water supplies, wastewater treatment networks, waste management, green energy utilization, and local community participation in the direct management of wetlands and their resources are all examples of measures to be urgently taken to raise the living conditions of the surrounding communities [63,64] (Figure 7).
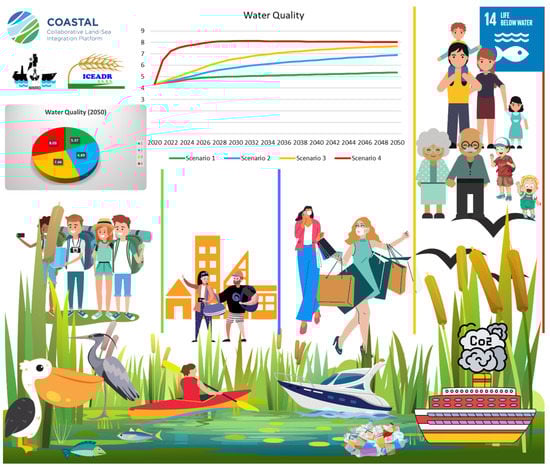
Figure 7.
Water quality evolution in relation to different scenarios of the Danube Delta development.
However, the Danube Delta is supposed to be governed by policies aiming for integrated economic, sociological, cultural, and environmental sustainability under its status as a Biosphere Reserve [65]. Conflicts between management authorities and the local population have frequently resulted from conservation management measures for the distinctive structure of interconnected habitats and ecosystems in the Danube Delta. Disagreement persists in matters such as the regulation of fishing, hunting, and other economic activities, taxation and transport policies, or the establishment of restricted areas within the Delta. Thus, while we are used to anthropic activities leading to important impacts on the natural environment, there are also sectors that can be optimized to become sustainable in the long term [66], such as aquaculture, ecofarming and ecotourism, and small-scale businesses based on traditional activities.
According to our methodology, we found scenario 2 as supporting the sustainable development of the area. This scenario was also envisaged by stakeholders in the form of marine aquaculture’s development in the future, foreseeing the legal settlement of the water body concession issue and the implementation of the shellfish areas’ sanitary–veterinary classification for safe human consumption. For fish farming, on-land recirculating aquaculture systems (RAS) are a solution. In a long-term timeframe, four shellfish farms, one cage fish farm in the open sea, and two RAS fish farms on land were desired. Another potential development direction could be the capitalization of chlorophyll from micro- and macroalgae. Concerning tourism development, the trend of passing from classic tourism to ecotourism is clear. The Danube Delta, a rather expensive destination, will be visited especially by foreign tourists who seek beautiful landscapes and nature, birdwatching, and local traditions. For inland rural areas, the future relies on integrated agriculture, namely that each community should focus on complete production—from cereals, animal farming, and processing units—to deliver finite products. Moreover, lower interest rates for credits and more subsidies are desirable, together with adapting to novel technologies (smart irrigation systems).
5. Conclusions
In this study, we developed a complex method for decision making concerning the sustainable development of the Danube Delta Biosphere Reserve based on the consultation of both local and higher-level stakeholders in decision making, the identification of key problems at the social, economic and environmental levels, and their validation by experts, modelling in system dynamics, and running the identified scenarios together with the stakeholders and recommending policies for the sustainable development of the Danube Delta. Such studies that apply system dynamics to simulate the interrelationships between socioeconomic and environmental factors in different scenarios are not found in the literature regarding the Danube Delta and Black Sea coastal zone.
The method can also be applied in other areas interested in sustainable development or for other sectors of activity using the designated steps such as navigation and related hydrotechnical work, overfishing, reed harvesting and processing, etc. One of the main added values of the presented methodology is that it covers a science–policy niche and can help the debate on the long-term impacts of integrated sectoral activity development and give support for decision-making processes in various national and international environments, such as ministerial thematic groups, European initiatives, and strategic plan design.
However, we consider that the methodology also has some disadvantages. The fact that it is based on information received from stakeholders makes their choice specific to the purpose of modelling, but also to the possibilities of obtaining reliable data for the variables of the model. That is why, the way in which one stays in contact with stakeholders and constantly asks for their opinion, on the course of developing the model, can discourage them from participating in consultations for a longer period. We believe that future research is needed to develop a platform that allows the continuous acquisition of information and data regarding the problems in the study area, which in the current case is the Danube Delta.
Another disadvantage is that modelling is a process that can be carried out by experts with thorough training, even though the use of the model to run the scenarios is not very friendly to a common user. Future research should focus on creating a user-friendly interface that will allow the scenarios to be run by policymakers.
Supplementary Materials
The following supporting information can be downloaded at: https://www.mdpi.com/article/10.3390/w14213484/s1, Excel file representing data returned by the model regarding the sustainable development of the Danube Delta in 4 scenarios.
Author Contributions
Conceptualization, J.-L.D.K.; methodology, R.T., N.D. and J.-L.D.K.; scenarios, N.D.; software, J.-L.D.K. and P.V.; validation, L.L., S.R., R.P. and P.V.; formal analysis, L.L., S.R. and R.P.; investigation, L.L., S.R. and R.P.; resources, L.L., S.R. and R.P.; data curation, J.-L.D.K.; writing—original draft preparation, L.L.; writing—review and editing, L.L. and S.R.; visualization, L.L.; supervision, R.T., J.-L.D.K. and P.V.; project administration, L.L., S.R. and R.P.; funding acquisition, J.-L.D.K. All authors have read and agreed to the published version of the manuscript.
Funding
This research was funded by European Union’s Horizon 2020 research and innovation programme under grant agreement 773782 and The APC was funded by European Union’s Horizon 2020 research and innovation programme under grant agreement 773782.
Data Availability Statement
Not applicable.
Conflicts of Interest
The authors declare no conflict of interest. The funders had no role in the design of the study; in the collection, analyses, or interpretation of data; in the writing of the manuscript; or in the decision to publish the results.
References
- UNESCO. Available online: https://www.unesco.org/en/education/sustainable-development (accessed on 4 July 2022).
- Toprak, Z. Brundtland Report. In Encyclopedia of Corporate Social Responsibility; Idowu, S.O., Capaldi, N., Zu, L., Gupta, A.D., Eds.; Springer: Berlin/Heidelberg, Germany, 2013. [Google Scholar] [CrossRef]
- United Nations. Available online: https://sdgs.un.org/2030agenda (accessed on 4 July 2022).
- Celac, S.; Vadineanu, A. Romania’s SUSTAINABLE DEVELOPMENT Strategy 2030; Editura Paideia: Bucuresti, Romania, 2018; p. 112. [Google Scholar]
- European Environment Agency. Available online: https://www.eea.europa.eu/themes/sustainability-transitions/sustainable-development-goals-and-the/country-profiles/romania-country-profile-sdgs-and (accessed on 6 July 2022).
- Panin, N.; Tiron Duţu, L.; Duţu, F. The Danube Delta—An overview of its Holocene evolution. Mediterranee 2016, 126, 37–54. [Google Scholar] [CrossRef]
- Giosan, L.; Coolen, M.; Kaplan, J.; Constantinescu, S.; Filip, F.; Filipova-Marinova, M.; Kettner, A.J.; Thom, N. Early Anthropogenic Transformation of the Danube-Black Sea System. Sci. Rep. 2012, 2, 582. [Google Scholar] [CrossRef]
- World Bank. Available online: https://www.worldbank.org/content/dam/Worldbank/Feature%20Story/ECA/Romania/Webpage%20-%20Danube%20Delta%20Integrated%20Sustainable%20Development%20Strategy%20NOV-DEC14%20FOR%20PDF.pdf (accessed on 11 July 2022).
- Ministerul Agriculturii si Dezvoltarii Rurale. Available online: https://www.madr.ro/docs/agricultura/strategia-agroalimentara-2020-2030.pdf (accessed on 12 July 2022).
- Programul Operational pentru Pescuit si Afaceri Maritime. Available online: https://www.ampeste.ro/docs/PAP_/PAP_2021-2027/Proiect_PAP_1_feb_2021.pdf (accessed on 12 July 2022).
- World Bank. România, Strategia naţională a României pentru dezvoltarea turismului 2019–2030, VOLUMUL 1: Raport Privind Evaluarea Rapidă a Sectorului Turistic, 2018. Available online: http://b2b-strategy.ro/b2b/wp-content/uploads/Strategia-na%C8%9Bional%C4%83-a-Rom%C3%A2niei-pentru-dezvoltarea-turismului-Volumul-1.pdf (accessed on 6 September 2022).
- World Bank. Strategia de Dezvoltare Turistică a României Volumul 2—Strategia și Planul de Acțiune, 2019. Available online: http://sgg.gov.ro/1/wp-content/uploads/2020/09/Strategia-de-Dezvoltare-Turistic%C4%83-a-Rom%C3%A2niei-volum-2-Strategia-%C8%99i-Planul-de-Ac%C8%9Biune.pdf (accessed on 1 August 2022).
- United Nations. Traffic Congestion the Problem and How to Deal With It; Bull, A., Ed.; United Nations: Santiago, Chile, 2003; pp. 13–18. [Google Scholar]
- ICPDR. River Basin Management Plan for the Danube River Basin District, Further Referred to as Danube River Basin Management Plan (DRBMP), Update 2021; ICPDR—International Commission for the Protection of the Danube River: Vienna, Austria, 2021; p. 290. [Google Scholar]
- Grupul de Actiune Locala Delta Dunarii. STRATEGIA DE DEZVOLTARE LOCALĂ a teritoriului GAL DELTA DUNĂRII din județul TULCEA, 2021. Available online: https://gal-deltadunarii.ro/wp-content/uploads/2022/01/6.-STRATEGIA-DE-DEZVOLTARE-LOCAL%C4%82-aprilie-2021-V7-.pdf (accessed on 4 August 2022).
- Vaidianu, N.; Paraschiv, M.; Saghin, I.; Braghina, C. Social-ecological consequences of planning and development policies in the Danube Delta biosphere reserve, Romania. Carpathian, J. Earth Environ. Sci. 2015, 10, 113–124. [Google Scholar]
- DDBRA. Raportul Privind Starea Mediului în Rezervaţia Biosferei Delta Dunării în Anul 2020. Available online: https://ddbra.ro/wp-content/uploads/2021/10/Starea-Mediului-2020.pdf (accessed on 4 August 2022).
- Tiller, R.; Destouni, G.; Golumbeanu, M.; Kalantari, Z.; Kastanidi, E.; Lazar, L.; Lescot, J.-M.; Maneas, G.; Martínez-López, J.; Notebaert, B.; et al. Understanding Stakeholder Synergies Through System Dynamics: Integrating Multi-Sectoral Stakeholder Narratives Into Quantitative Environmental Models. Front. Sustain. 2021, 2, 701180. [Google Scholar] [CrossRef]
- Sterman, J.D. Business Dynamic Systems Thinking and Modeling for a Complex World; The McGraw-Hill Companies: New York, NY, USA, 2000; p. 981. [Google Scholar]
- Karageorgis, A.; Panagopoulos, Y.; Kastanidi, E.; Destouni, G.; Kalantari, Z.; Seifollahi, S.; Maneas, G.; Lescot, J.-M.; Vernier, F.; Lazar, L.; et al. Deliverable D13 Pilot SD Models for Coastal-Rural Interactions—Case Study Level, 2020. Available online: https://h2020-coastal.eu/assets/content/Deliverables/773782-COASTAL-WP4-D13.pdf (accessed on 3 October 2022).
- Li, F.J.; Dong, S.C.; Li, F. A system dynamics model for analyzing the eco-agriculture system with policy recommendations. Ecol. Model. 2012, 227, 34–45. [Google Scholar] [CrossRef]
- Nguyen, T.; Cook, S.; Ineland, V. Application of System Dynamics to Evaluate the Social and Economic Benefits of Infrastructure Projects. Systems 2017, 5, 29. [Google Scholar] [CrossRef]
- Van den Belt, M. Mediated Modeling: A System Dynamics Approach to Environmental Consensus Building; Island Press: Washington, DC, USA, 2004; p. 328. [Google Scholar]
- Voinov, A. Systems Science and Modeling for Ecological Economics; Elsevier: Amsterdam, The Netherlands, 2008; p. 416. [Google Scholar]
- Amadei, B. A Systems Approach to Modeling Communit Development Projects; Momentum Press Engineering: New York, NY, USA, 2015; p. 295. [Google Scholar]
- Currie, D.J.; Smith, C.; Jagals, P. The application of system dynamics modelling to environmental health decision-making and policy—A scoping review. BMC Public Health 2018, 18, 402. [Google Scholar] [CrossRef]
- Ford, A. Modeling the Environment. An Introduction to System Dynamics Models of Environmental Systems; Island Press: Washington, DC, USA, 1999; p. 401. [Google Scholar]
- EEP, Alterra, Ecologic, PBL and UNEP-WCMC. Scenarios and Models for Exploring Future Trends of Biodiversity and Ecosystem Services Changes; Final report to the European Commission, DG Environment on Contract ENV.G.1/ETU/2008/0090r; Institute for European Environmental Policy, Alterra Wageningen UR, Ecologic, Netherlands Environmental Assessment Agency, United Nations Environment Programme World Conservation Monitoring Centre: Wageningen, The Netherlands, 2009; p. 167. [Google Scholar]
- Guittard, A.; Akinsete, E.; Koundouri, P.; Tiller, R.; Viaene, P. A Systems Approach for the Sustainable Development of Coastal-Rural Regions. Department of International and European economic studies Athens University of Economics and Business Working Paper Series. 2022. Available online: http://wpa.deos.aueb.gr/docs/COASTAL_SystemApproach_OceanCoastalmanagement_Final.pdf (accessed on 16 August 2022).
- EC—EU Strategy for the Danube Region. Available online: https://danube-region.eu/wp-content/uploads/2019/12/EUSDR_Consolidated-Input-Document_AP-Revision_2019.pdf (accessed on 3 August 2022).
- Curtea de Conturi. Performanța Administrării și Exploatării Resurselor Acvatice vii din Habitatele Piscicole Naturale și a Acvaculturii, în Perioada 2016–2019. Available online: https://www.curteadeconturi.ro/uploads/f0298466/9272050b/e2a14f74/4dcddbd7/726d6806/6a5876e0/25c85294/3f685ef9/SINTEZA_Raport_AP_PESCUIT_si_ACVACULTURA_2016-2019.pdf (accessed on 12 July 2022).
- Meadows, D.H.; Randers, J. Limits to Growth; Chelsea Green Publishing: White River Junction, VT, USA, 2013. [Google Scholar]
- Pharino, C.; Sailamai, N.; Kamphaengthong, P.L. Material Flow Analysis of Nitrogen in Maeklong River Basin in Ratcaburi and Samut Songkhram Province, Thailand. Water Conserv. Sci. Eng. 2016, 1, 167–175. [Google Scholar] [CrossRef]
- The Aquaculture Advisory Council. The Provision of Ecosystem Services by European Aquaculture; The Aquaculture Advisory Council: Brussels, Belgium, 2021. [Google Scholar]
- Yeo, S.E.; Binkowski, F.P.; Morris, J.E. Aquaculture Effluents and Waste By-Products Characteristics, Potential Recovery, and Beneficial Reuse; Communications Office UW Sea Grant Institute Goodnight Hall: Madison, Wl, USA, 2004. [Google Scholar]
- Mulder, A. The quest for sustainable nitrogen remo val technologies. Water Sci. Technol. 2003, 48, 67–75. [Google Scholar] [CrossRef]
- Clive, R.G.; Reed, J.B.; Harper, S.J.F.; Kourosh, S.-P.; Deakin, P.J. Essential Surgery: Problems, Diagnosis and Management; Elsevier: Amsterdam, The Netherlands, 2014; p. 673. [Google Scholar]
- Leach, A.M.; Galloway, J.N.; Bleeker, A.; Erisman, J.W.; Kohn, R.; Kitzes, J. A nitrogen footprint model to help consumers understand their role in nitrogen losses to the environment. Environ. Dev. 2012, 1, 40–66. [Google Scholar] [CrossRef]
- Riahi, K.; van Vuuren, D.P.; Kriegler, E.; Edmonds, J.; O’Neill, B.C.; Fujimori, S.; Bauer, N.; Calvin, K.; Dellink, R.; Fricko, O.; et al. The Shared Socioeconomic Pathways and their energy, land use, and greenhouse gas emissions implications: An overview. Glob. Environ. Chang. 2017, 42, 153–168. [Google Scholar] [CrossRef]
- United Nations. Nationally Determined Contributions under the Paris Agreement. Available online: https://unfccc.int/sites/default/files/resource/cma2021_08_adv_1.pdf (accessed on 16 August 2022).
- ICPDR. Revision and Update of The Danube Study “Integrating and Editing New Scientific Results in Climate Change Research and the Resulting Impacts on Water Availability to Revise the Existing Adaptation Strategies in the Danube River Basin”. Available online: https://www.icpdr.org/main/sites/default/files/nodes/documents/danube_climate_adaptation_study_2018.pdf (accessed on 4 July 2022).
- ANPA, Raport de Activitate al Agenției Naționale Pentru Pescuit și Acvacultură in Anul 2021. Available online: http://www.anpa.ro/wp-content/uploads/2022/02/RAPORT-final-de-activitate-ANPA-2021.pdf (accessed on 9 August 2022).
- Roșca, V.; Ignat, R. The sustainability of fish consumption in Romania: Customer behaviour prior and after the country’s adherence to the EU. Amfiteatru Econ. 2014, XVI, 243–257. [Google Scholar]
- Hoekstra, A.; Chapagain, A.K.; Aldaya Mekonnen, M.M. The Water Footprint Assessment Manual; Earthscan: London, UK, 2011; p. 228. [Google Scholar]
- Panin, N. Danube Delta. Genesis, evolution and sedimentology. Révue Roum. Géologie Géophysique Géographie Série Géographie 1989, 33, 25–36. [Google Scholar]
- Giosan, L.; Donnelly, J.; Vespremeanu, E.; Bhattacharya, J.; Olariu, C.; Buonaiuto, F. River delta morphodynamics: Examples from the Danube Delta. River Deltas—Concepts Model. Ex. SEPM Spec. Publ. 2005, 83, 393–411. [Google Scholar]
- Friedrich, J.; Dinkel, C.; Grieder, E.; Radan, S.; Secrieru, D.; Steingruber, S.; Wehrli, B. Nutrient uptake and benthic regeneration in Danube Delta Lakes. Biogeochemistry 2003, 64, 373–398. [Google Scholar] [CrossRef]
- Panin, N.; Overmars, W. The Danube Delta evolution during the Holocene: Reconstruction attempt using geomorphological and geological data, and some of the existing cartographic documents. Geo-Eco-Marina 2012, 18, 75–104. [Google Scholar]
- Cretescu, I.; Kovacs, Z.; Lazar, L.; Burada, A.; Sbarcea, M.; Teodorof, L.; Padure, D.; Soreanu, G. Danube Delta: Water Management on the Sulina Channel in the Frame of Environmental Sustainability. In River Deltas Research—Recent Advances; IntechOpen: Rijeka, Croatia, 2021. [Google Scholar] [CrossRef]
- Gastescu, P. The biodiversity of the Danube Delta Biosphere Reserve reflected in the structure of the ecosystems. In Proceedings of the Water Resources and Wetlands 5th International Hybrid Conference Water Resources and Wetlands, Tulcea, Romania, 8–12 September 2021; p. 235. [Google Scholar]
- Panin, N. The Danube Delta—The mid term of the geo-system Danube river—Danube Delta—Black Sea. Geological setting, sedimentology and holocene to present-day evolution. Rev. Roum. Géologie 2011, 55, 41–82. [Google Scholar]
- Cristofor, S.; Vadineanu, A.; Ignat, G. Importance of flood zones for nitrogen and phosphorus dynamics in the Danube Delta. Hydrobiologia 1993, 251, 143–148. [Google Scholar] [CrossRef]
- Cozzi, S.; Ibáñez, C.; Lazar, L.; Raimbault, P.; Giani, M. Flow Regime and Nutrient-Loading Trends from the Largest South European Watersheds: Implications for the Productivity of Mediterranean and Black Sea’s Coastal Areas. Water 2019, 11, 1. [Google Scholar] [CrossRef]
- Tucker, G.M.; Kettunen, M.; McConville, A.J.; Cottee-Jones, E. Valuing and conserving ecosystem services: A scoping case study in the Danube basin. In Report Prepared for WWF; Institute for European Environmental Policy: London, UK, 2010. [Google Scholar]
- Drost, H.J. Ecological Gradients in the Danube Delta Lakes, 1998. Available online: https://www.researchgate.net/publication/232237509_Ecological_gradients_in_the_Danube_Delta_lakes_Present_state_and_man-induced_changes_Ministry_of_Transport_Public_Works_and_Water_Management (accessed on 5 October 2022).
- Kideys, A.E. Fall and rise of the Black Sea ecosystem. Science 2002, 297, 1482–1483. [Google Scholar] [CrossRef]
- Oguz, T.; Velikova, V. Abrupt transition of the northwestern Black Sea shelf ecosystem from a eutrophic to an alternative pristine state. Mar. Ecol. Prog. Ser. 2010, 405, 231–242. [Google Scholar] [CrossRef]
- Cociasu, A.; Dorogan, L.; Humborg, C.; Popa, L. Long-term ecological changes in Romanian coastal Waters of the Black Sea. Mar. Pollut. Bull. 1996, 32, 32–38. [Google Scholar] [CrossRef]
- Yunev, J.O.A.; Carstensen, J.; Moncheva, S.; Khaliulin, A.; Ærtebjerg, G.; Nixon, S. Nutrient and phytoplankton trends on the western Black Sea shelf in response to cultural eutrophication and climate changes. Estuar. Coast. Shelf Sci. 2007, 74, 63–76. [Google Scholar] [CrossRef]
- Strokal, M.; Kroeze, C. Nitrogen and phosphorus inputs to the Black Sea in 1970–2050. Reg. Environ. Chang. 2013, 13, 179–192. [Google Scholar] [CrossRef]
- ICPDR. Danube Watch, 2015. Available online: https://www.icpdr.org/main/publications/nitrogen-pollution-danube-basin (accessed on 6 October 2022).
- ICPDR. Available online: https://www.icpdr.org/main/issues/phosphorus (accessed on 6 October 2022).
- Collste, D.; Pedercini, M.; Cornell, S.E. Policy coherence to achieve the SDGs: Using integrated simulation models to assess effective policies. Sustain. Sci. 2017, 12, 921–931. [Google Scholar] [CrossRef]
- Baboianu, G. Danube Delta: The Transboundary Wetlands (Romania and Ukraine). In The Wetland Book II: Distribution, Description, and Conservation; Springer: Dordrecht, The Netherlands, 2016. [Google Scholar]
- Petrişor, A.-I. Assessment of the long-term effects of global changes within the Romanian natural protected areas. Int. J. Conserv. Sci. 2016, 7, 759–770. [Google Scholar]
- Sbarcea, M.; Petrişor, A.-I.; Petrişor, L.-E. Mapping Potential Environmental Conflicts in the Danube Delta Biosphere Reserve. Sci. Ann. Danub. Delta Inst. 2019, 24, 175–182. [Google Scholar]


Publisher’s Note: MDPI stays neutral with regard to jurisdictional claims in published maps and institutional affiliations. |
© 2022 by the authors. Licensee MDPI, Basel, Switzerland. This article is an open access article distributed under the terms and conditions of the Creative Commons Attribution (CC BY) license (https://creativecommons.org/licenses/by/4.0/).