Spatial-Temporal Variations of Active Accumulated Temperature and Its Impact on Vegetation NDVI in the Source Region of China’s Yellow River
Abstract
1. Introduction
2. Materials and Methods
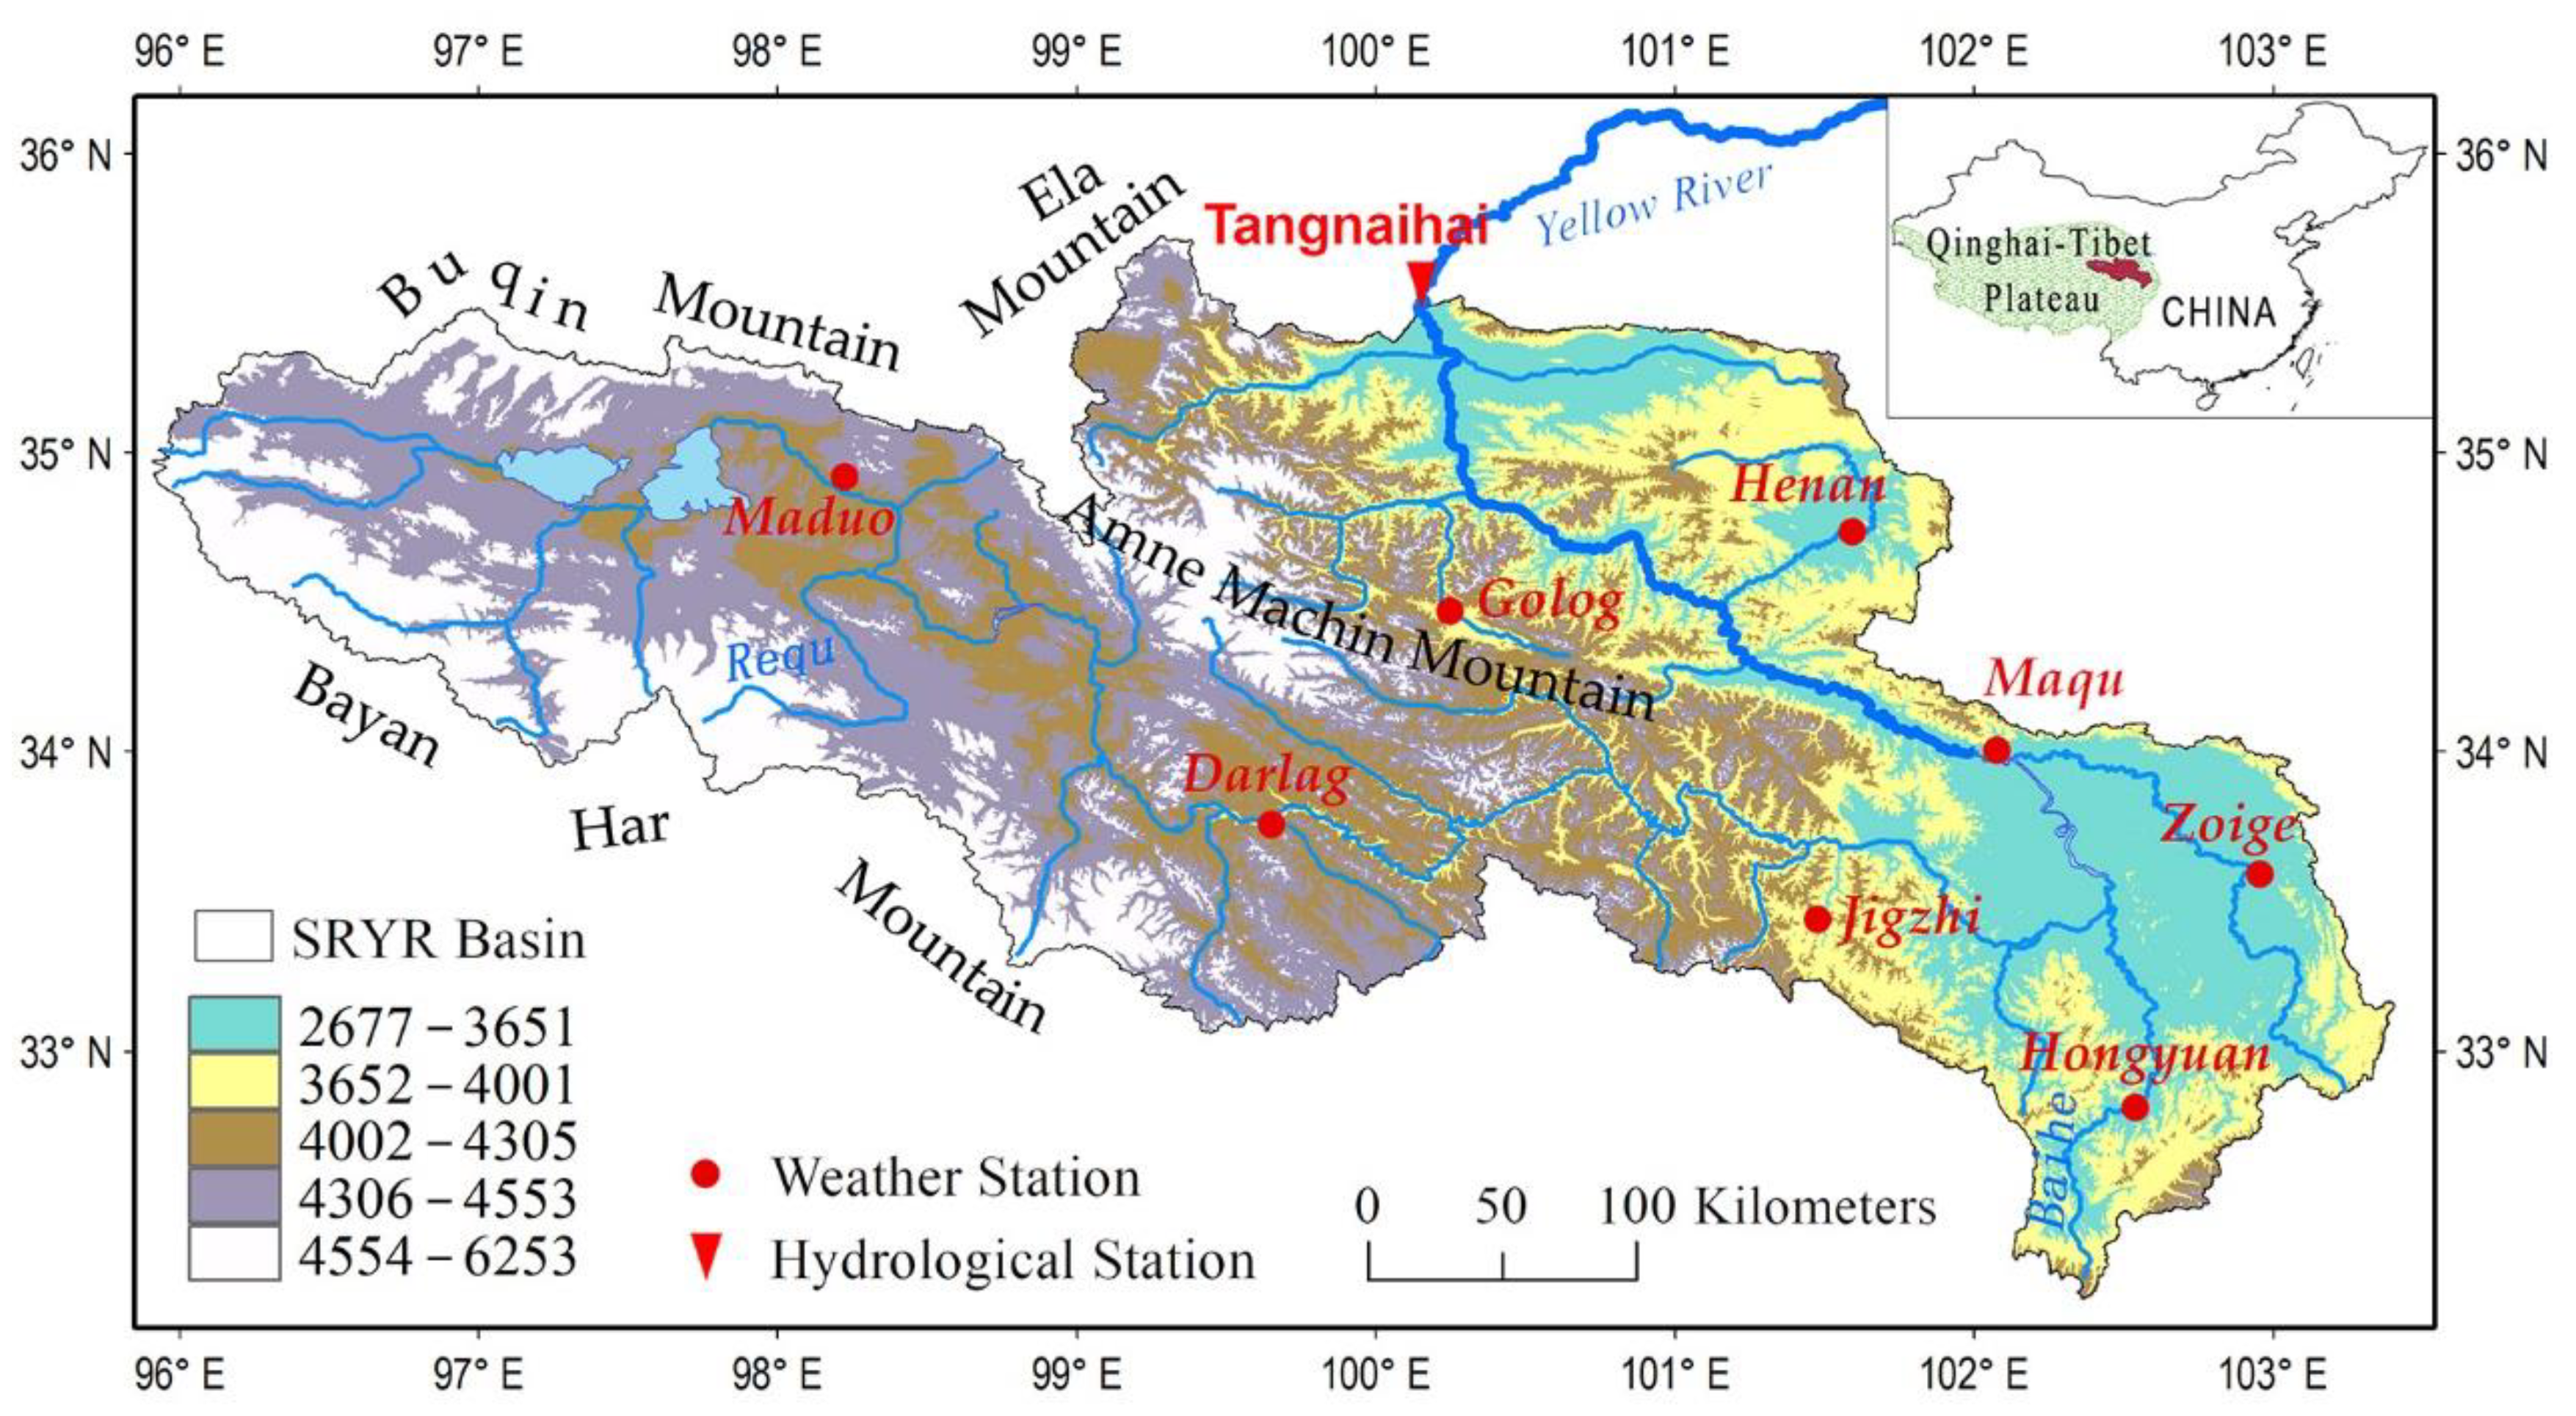
2.1. Study Area
2.2. Datasets
2.3. Accumulated Temperature Calculation
2.4. Correlation Analysis
3. Results
3.1. Spatial Distribution
3.1.1. Distribution of AAT
3.1.2. Distribution of LDT
3.2. Variation Trends
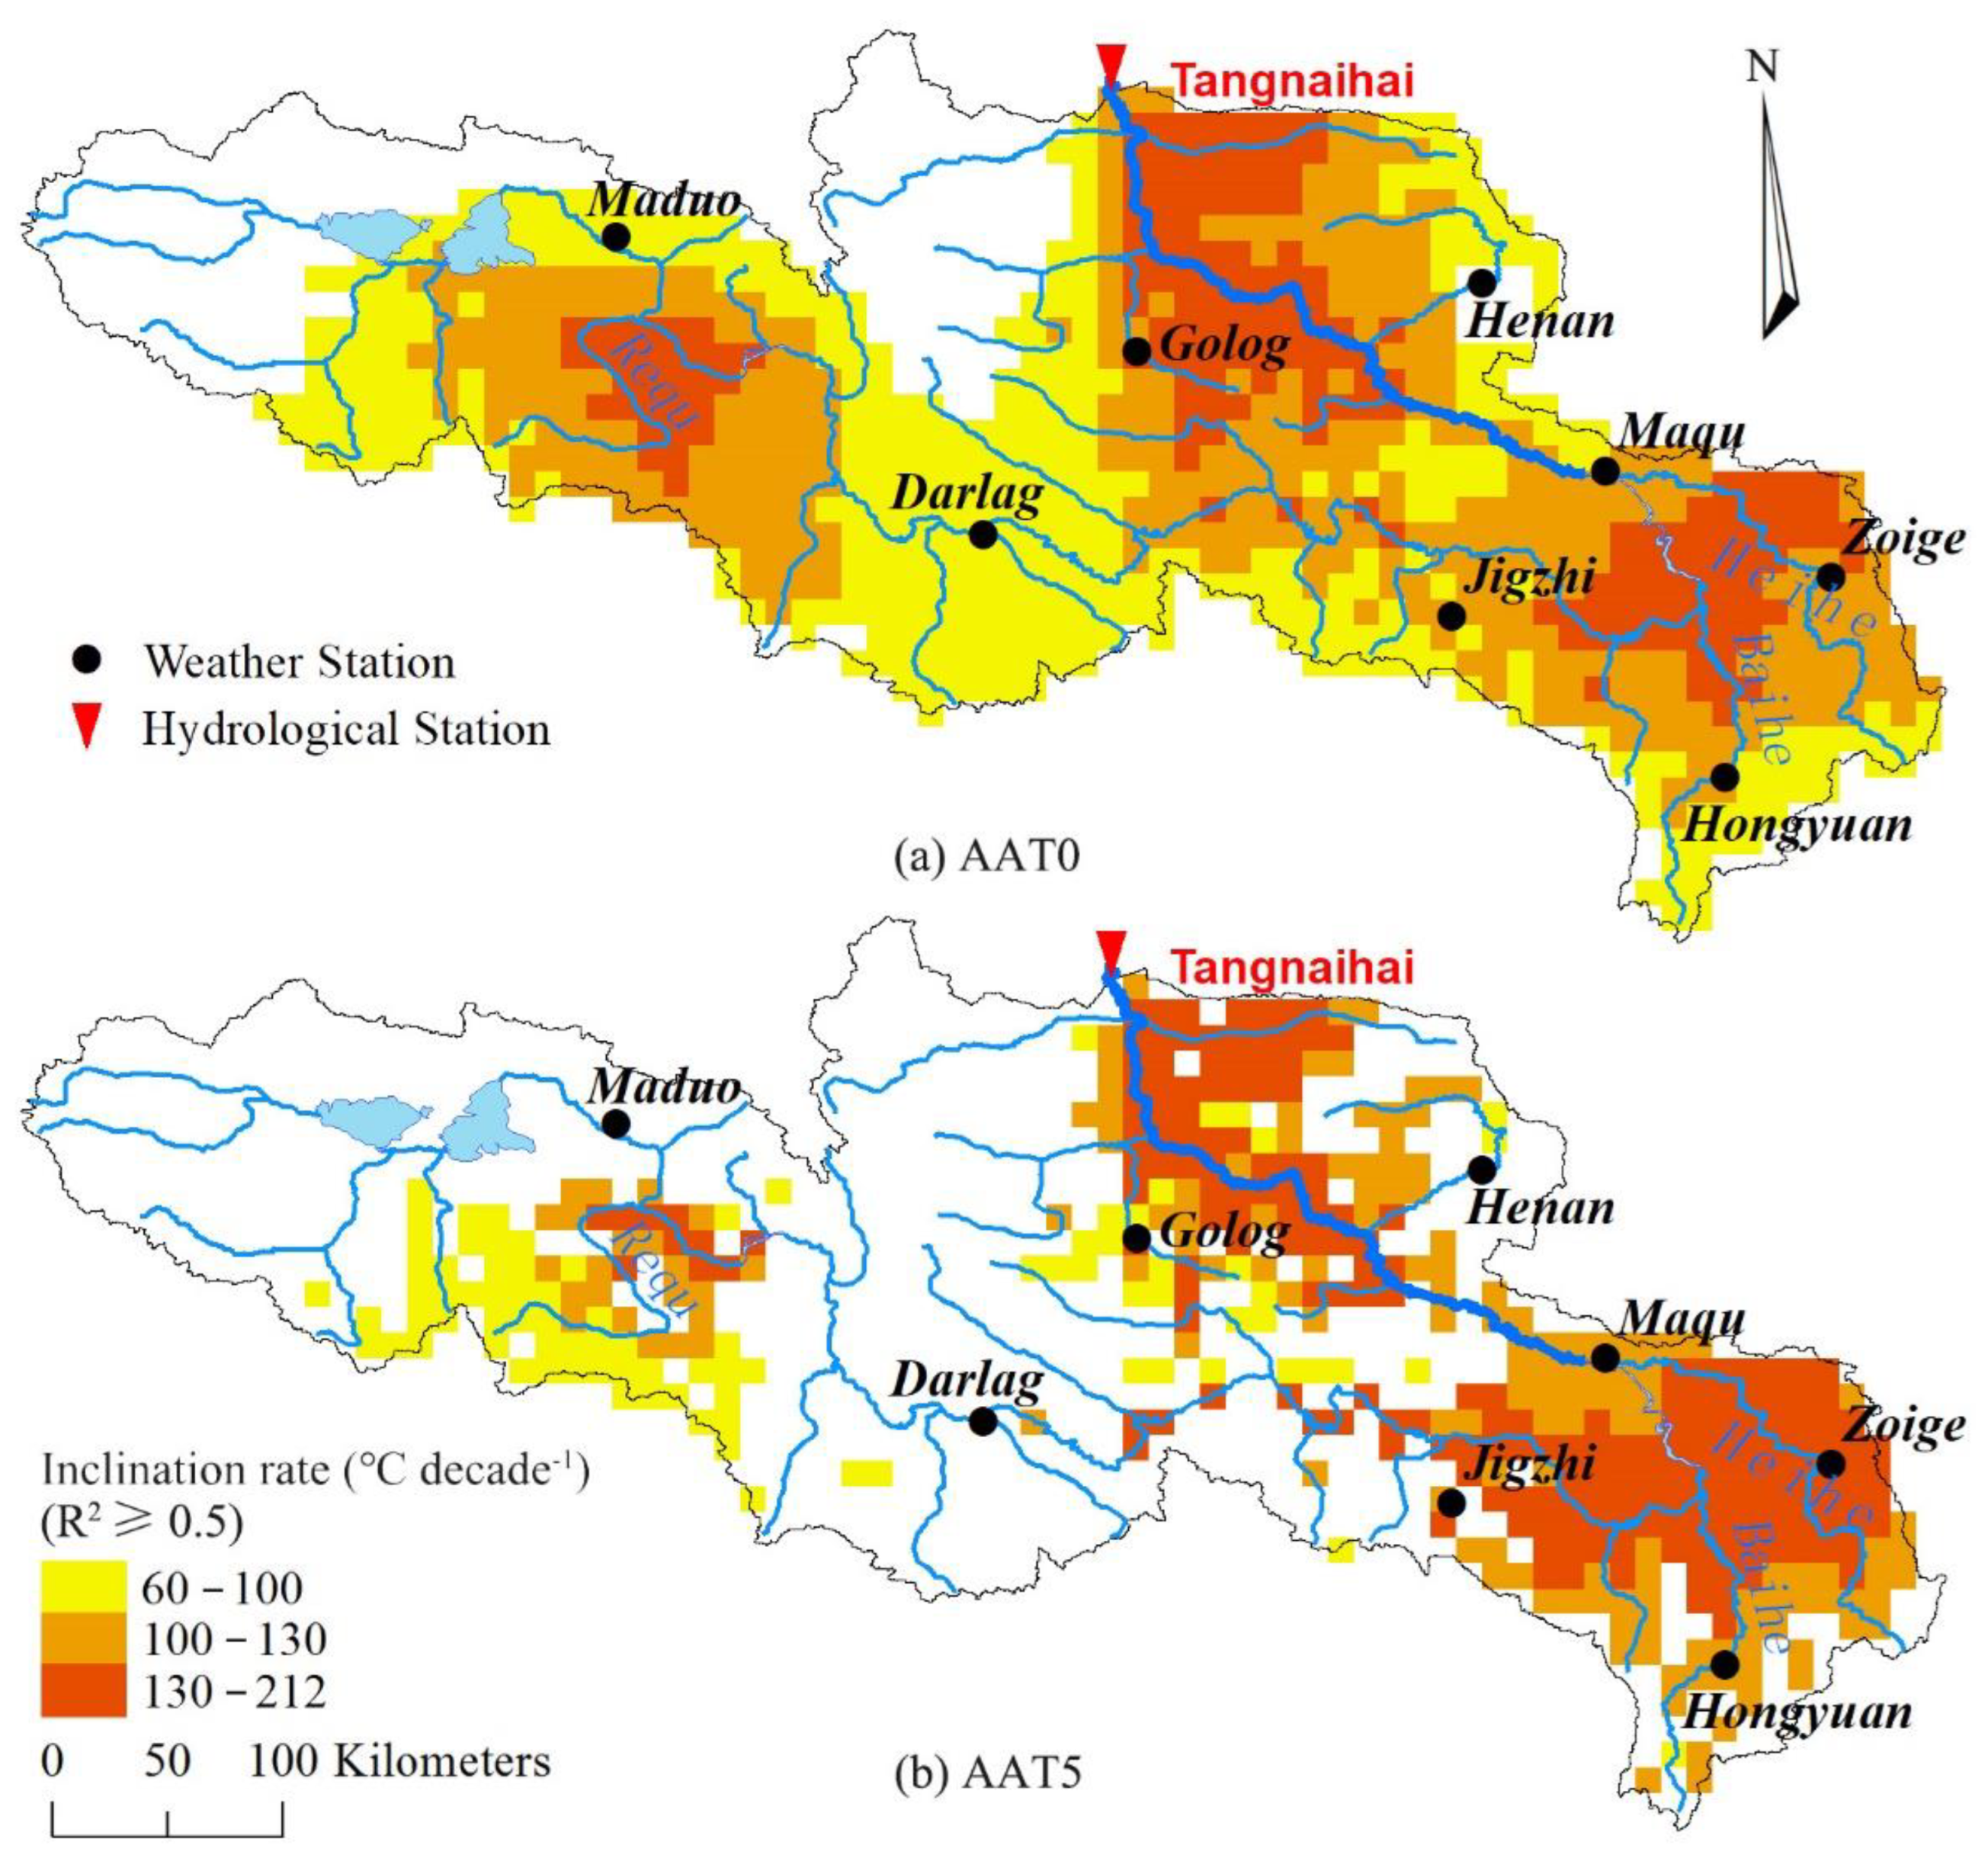
3.2.1. Trends of AAT
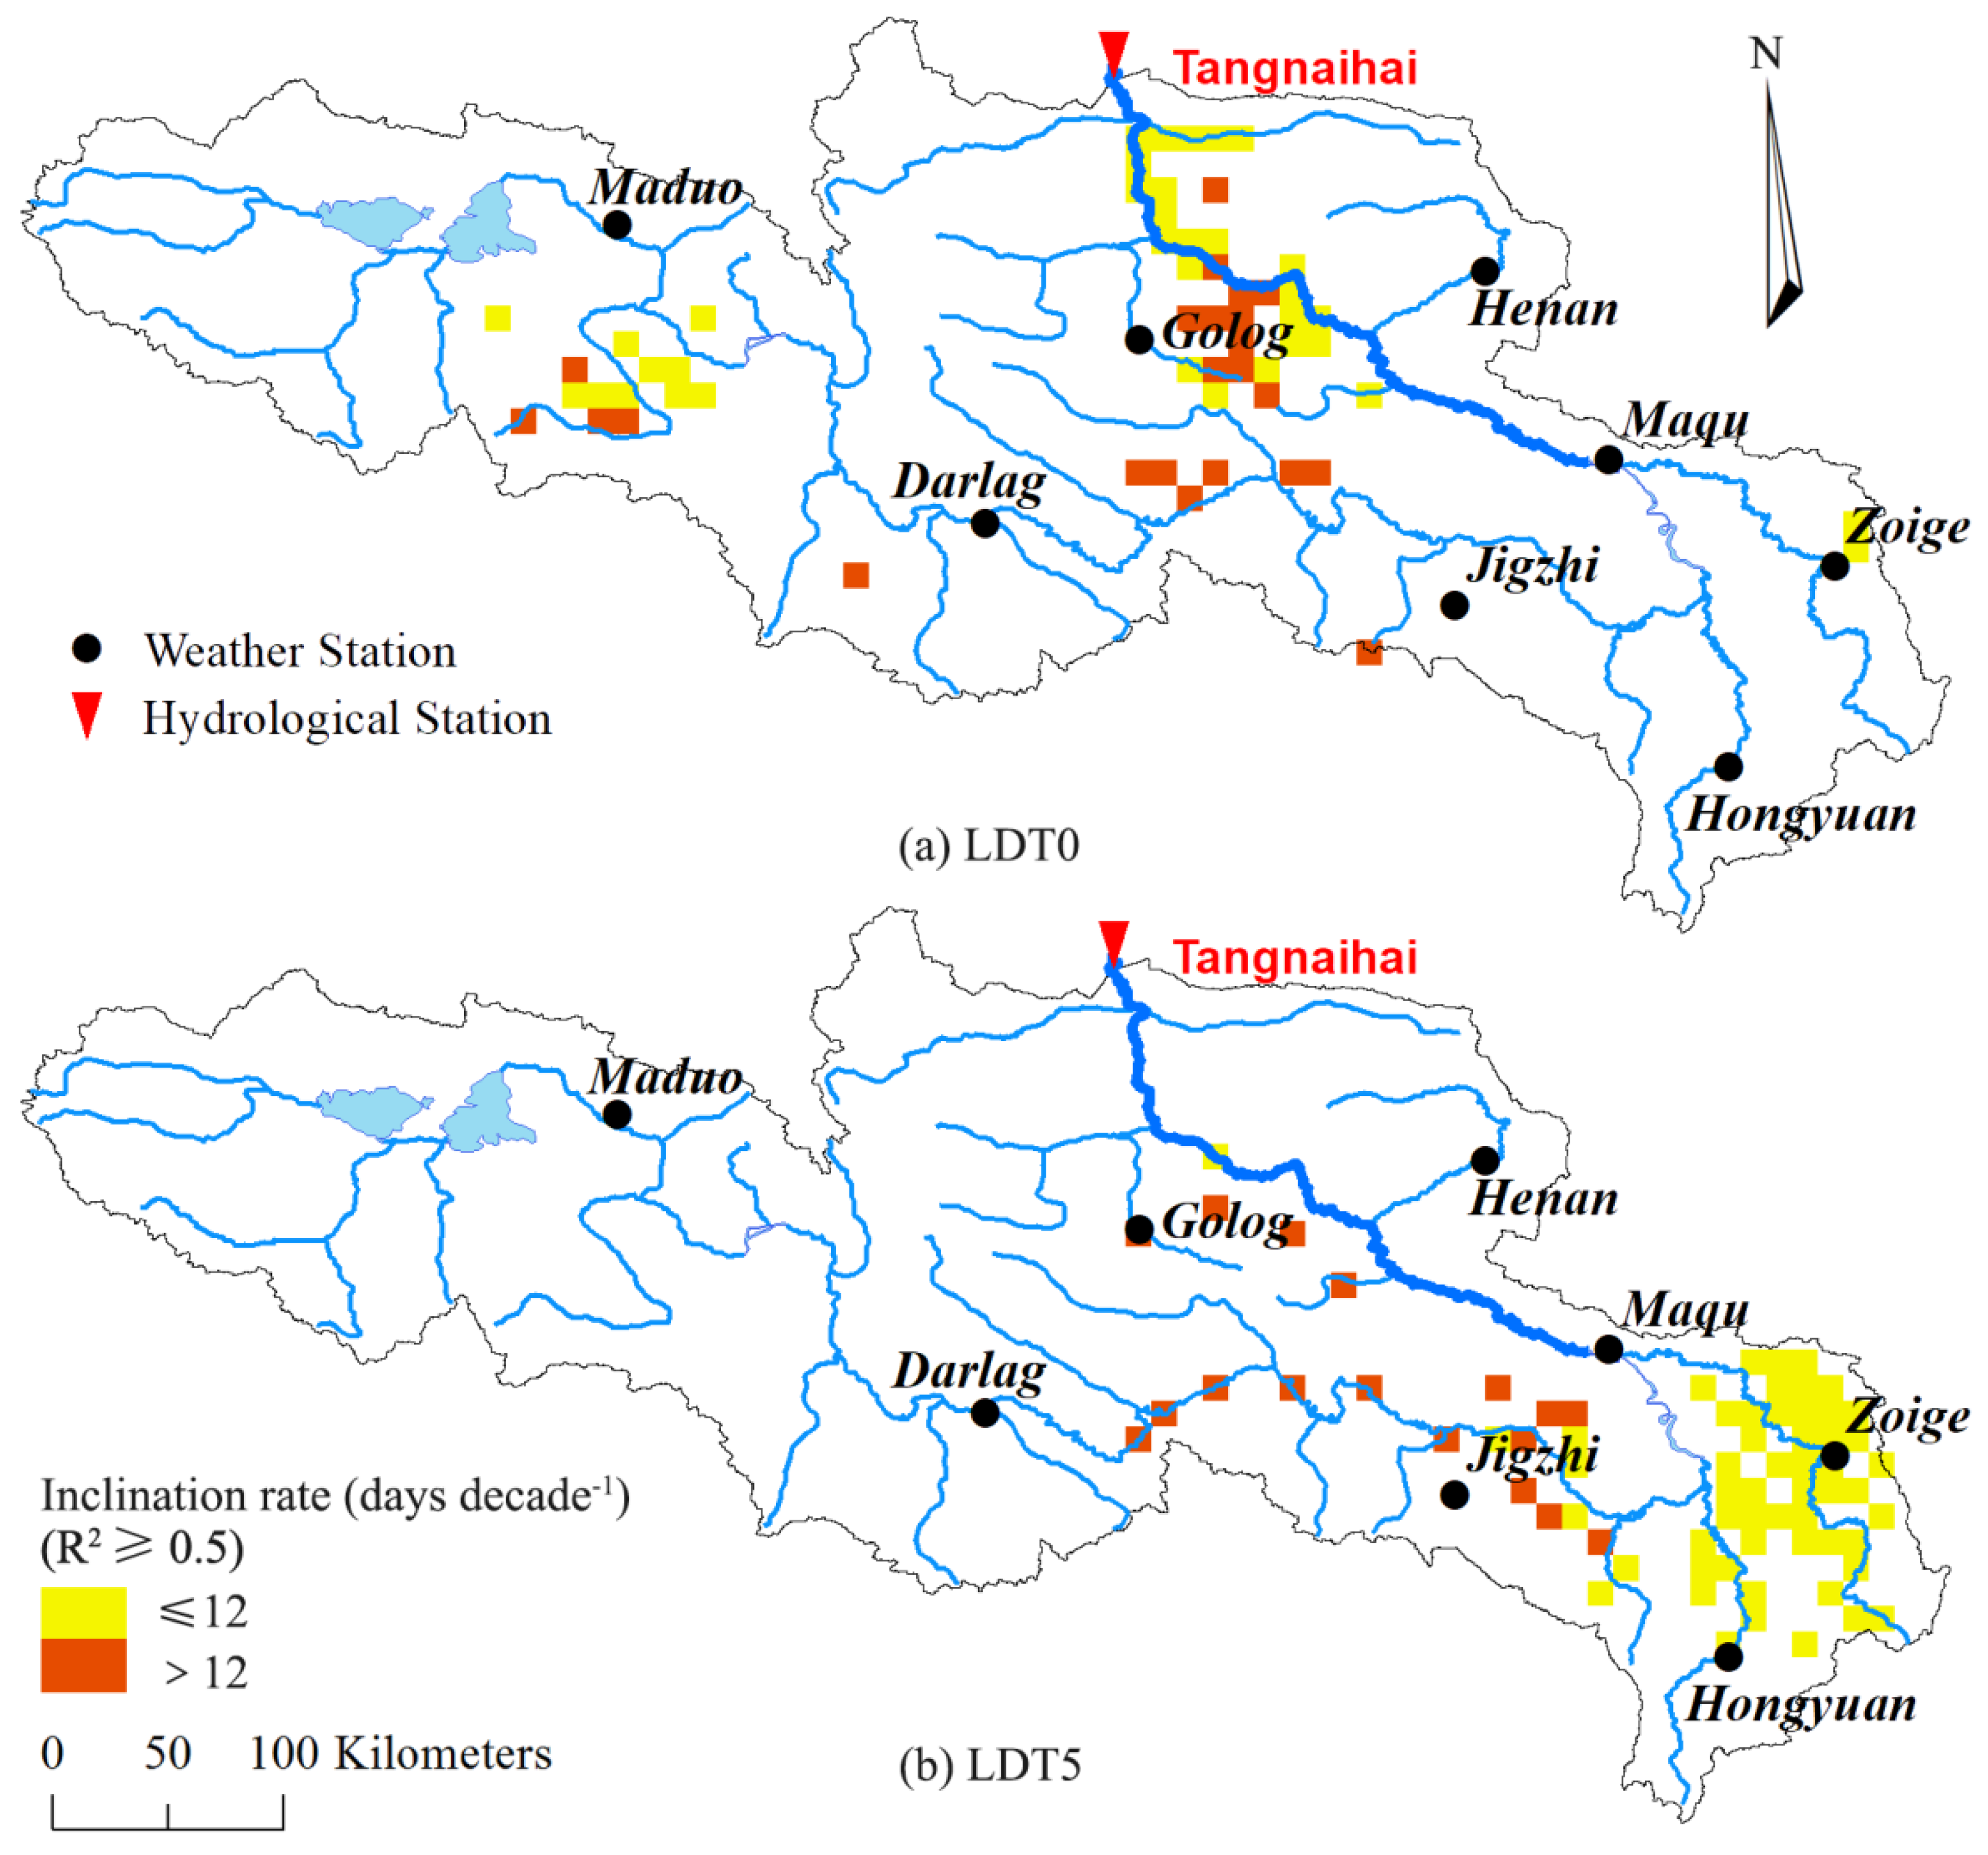
3.2.2. Trends of LDT
3.3. Spatiotemporal Variation
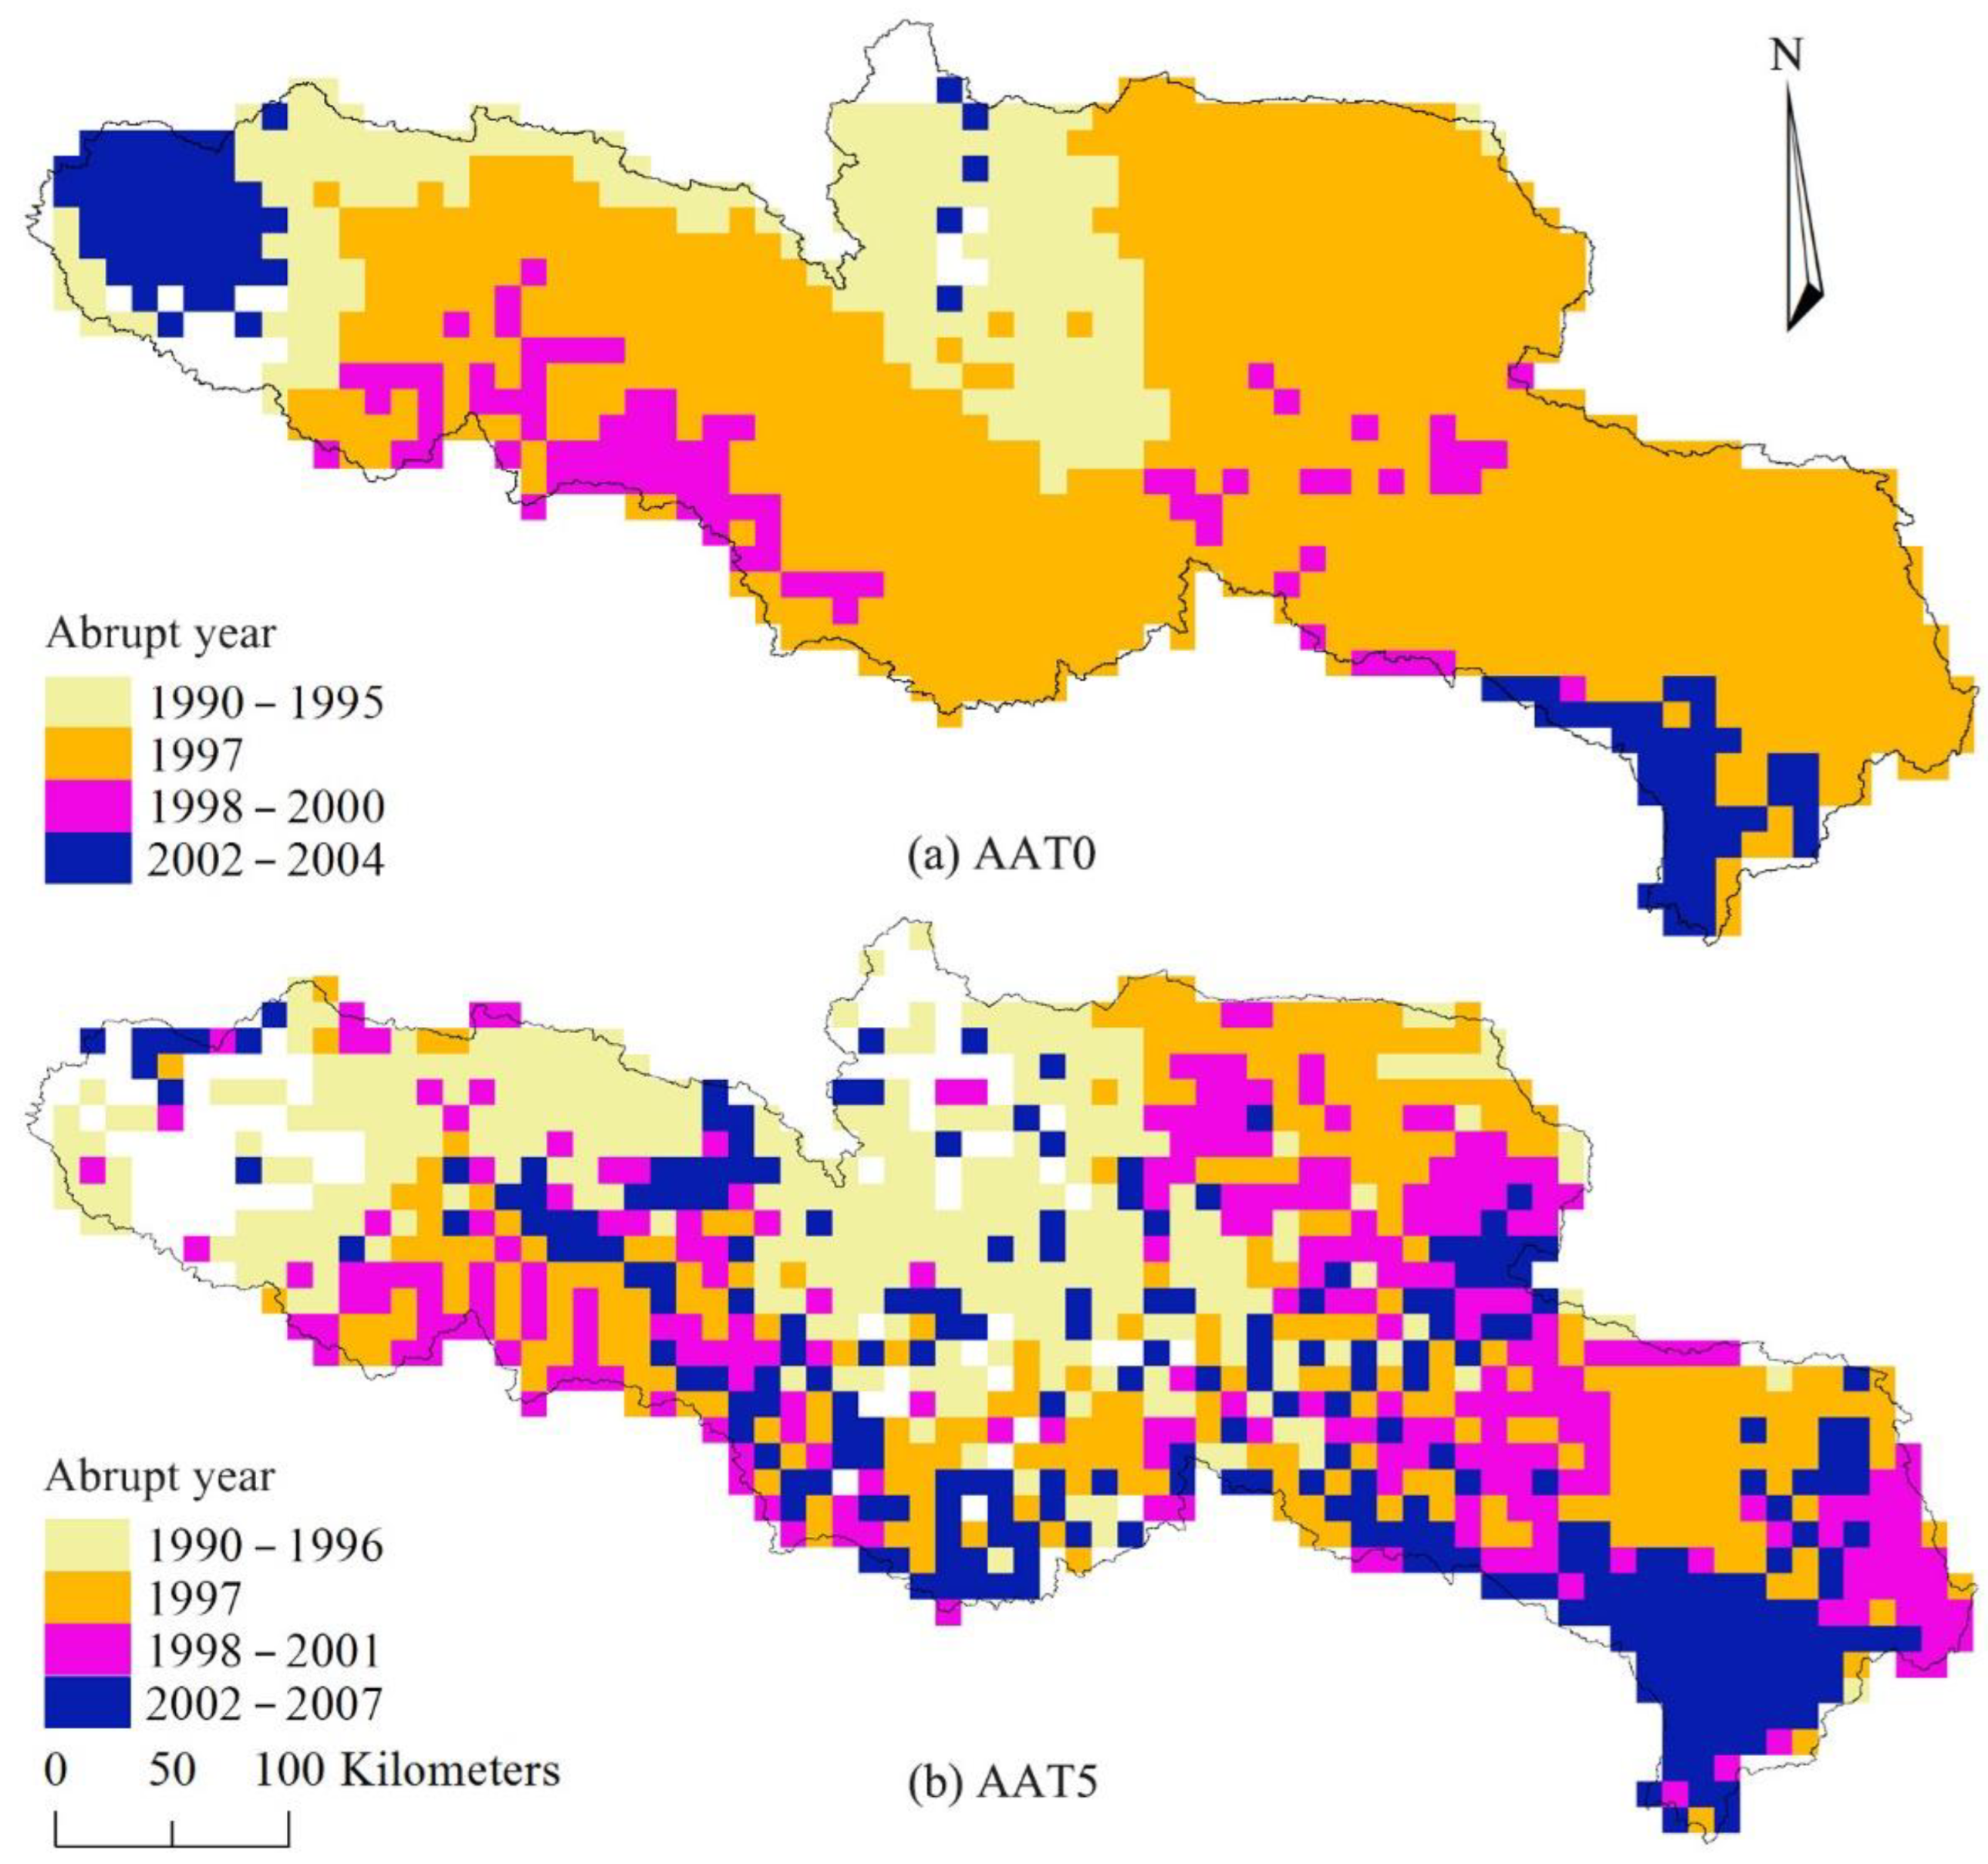
3.3.1. Abrupt Change Analysis
3.3.2. Variation between Divided Stages
3.4. Correlation with NDVI
3.4.1. Temporal Analysis
3.4.2. Spatial Analysis
4. Discussion
5. Conclusions
Author Contributions
Funding
Conflicts of Interest
References
- Masson-Delmotte, V.; Zhai, P.; Pirani, A.; Connors, S.L.; Péan, C.; Berger, S.; Caud, N.; Chen, Y.; Goldfarb, L.; Gomis, M.I.; et al. Summary for Policymakers. In Climate Change 2021: The Physical Science Basis; Yu, R., Zhou, B., Eds.; Cambridge University Press: Cambridge, UK; New York, NY, USA, 2021. [Google Scholar] [CrossRef]
- Elmendorf, S.; Henry, G.; Hollister, R.; Björk, R.; Bjorkman, A.; Callaghan, T.; Siegwart Collier, L.; Cooper, E.; Cornelissen, J.; Day, T.; et al. Global assessment of experimental climate warming on tundra vegetation: Heterogeneity over space and time. Ecol. Lett. 2012, 15, 164–175. [Google Scholar] [CrossRef] [PubMed]
- Suseela, V.; Conant, R.T.; Wallenstein, M.D.; Dukes, J.S. Effects of soil moisture on the temperature sensitivity of heterotrophic respiration vary seasonally in an old-field climate change experiment. Glob. Change Biol. 2012, 18, 336–348. [Google Scholar] [CrossRef]
- Bond-Lamberty, B.; Thomson, A. Temperature-associated increases in the global soil respiration record. Nature 2010, 464, 579–582. [Google Scholar] [CrossRef] [PubMed]
- Zhang, T.; Zhang, Y.; Xu, M.; Xi, Y.; Zhu, J.; Zhang, X.; Wang, Y.; Li, Y.; Shi, P.; Yu, G.; et al. Ecosystem response more than climate variability drives the inter-annual variability of carbon fluxes in three Chinese grasslands. Agric. For. Meteorol. 2016, 225, 48–56. [Google Scholar] [CrossRef]
- Zhao, D.; Wu, S. Spatial and temporal variability of key bio-temperature indicators on the Qinghai–Tibetan Plateau for the period 1961–2013. Int. J. Climatol. 2016, 36, 2083–2092. [Google Scholar] [CrossRef]
- Steinbauer, M.J.; Grytnes, J.-A.; Jurasinski, G.; Kulonen, A.; Lenoir, J.; Pauli, H.; Rixen, C.; Winkler, M.; Bardy-Durchhalter, M.; Barni, E.; et al. Accelerated increase in plant species richness on mountain summits is linked to warming. Nature 2018, 556, 231–234. [Google Scholar] [CrossRef]
- Zhang, L.; Lv, W.; Cui, S.; Jiang, L.; Li, B.; Liu, P.; Wang, Q.; Zhou, Y.; Hong, H.; Wang, A.; et al. Effect of warming and degradation on phenophases of Kobresia pygmaea and Potentilla multifida on the Tibetan Plateau. Agric. Ecosyst. Environ. 2020, 300, 106998. [Google Scholar] [CrossRef]
- Yang, J.; Ding, Y.; Chen, R. Climatic causes of ecological and environmental variations in the source regions of the Yangtze and Yellow Rivers of China. Environ. Geol. 2007, 53, 113–121. [Google Scholar] [CrossRef]
- Li, L.; Yang, S.; Wang, Z.; Zhu, X.; Tang, H. Evidence of Warming and Wetting Climate over the Qinghai-Tibet Plateau. Arct. Antarct. Alp. Res. 2010, 42, 449–457. [Google Scholar] [CrossRef]
- Wang, Y.; Ren, F.; Zhang, X. Spatial and temporal variations of regional high temperature events in China. Int. J. Climatol. 2014, 34, 3054–3065. [Google Scholar] [CrossRef]
- Huang, X.; Zhu, W.; Wang, X.; Zhan, P.; Liu, Q.; Li, X.; Sun, L. A Method for Monitoring and Forecasting the Heading and Flowering Dates of Winter Wheat Combining Satellite-Derived Green-Up Dates and Accumulated Temperature. Remote Sens. 2020, 12, 3536. [Google Scholar] [CrossRef]
- Fernández-Long, M.E.; Müller, G.V.; Beltrán-Przekurat, A.; Scarpati, O.E. Long-term and recent changes in temperature-based agroclimatic indices in Argentina. Int. J. Climatol. 2013, 33, 1673–1686. [Google Scholar] [CrossRef]
- Yan, M.; Liu, X.; Zhang, W.; Li, X.; Liu, S. Spatio-temporal changes of ≥10 °C accumulated temperature in northeastern China since 1961. Chin. Geogr. Sci. 2011, 21, 17–26. [Google Scholar] [CrossRef]
- Jiang, X.; Zhou, X.; Zhang, J.; Xu, Y.; Yang, J.; Niu, Q. The Spatiotemporal Change of Active Accumulated Temperature ≥10 °C in the Guizhou Plateau from 1961 to 2015. Earth Environ. 2019, 47, 121–130. [Google Scholar]
- Li, R.; Guo, J.; Song, Y. Optimizing parameters of a non-linear accumulated temperature model and method to calculate linear accumulated temperature for spring maize in Northeast China. Theor. Appl. Climatol. 2020, 141, 1629–1644. [Google Scholar] [CrossRef]
- Kumari, N.; Srivastava, A.; Dumka, U.C. A Long-Term Spatiotemporal Analysis of Vegetation Greenness over the Himalayan Region Using Google Earth Engine. Climate 2021, 9, 109. [Google Scholar] [CrossRef]
- Bai, Y. Analysis of vegetation dynamics in the Qinling-Daba Mountains region from MODIS time series data. Ecol. Indic. 2021, 129, 108029. [Google Scholar] [CrossRef]
- Wen, Y.; Liu, X.; Xin, Q.; Wu, J.; Xu, X.; Pei, F.; Li, X.; Du, G.; Cai, Y.; Lin, K.; et al. Cumulative Effects of Climatic Factors on Terrestrial Vegetation Growth. J. Geophys. Res. Biogeosciences 2019, 124, 789–806. [Google Scholar] [CrossRef]
- Feng, J.; Dong, B.; Qin, T.; Liu, S.; Zhang, J.; Gong, X. Temporal and Spatial Variation Characteristics of NDVI and Its Relationship with Environmental Factors in Huangshui River Basin from 2000 to 2018. Pol. J. Environ. Stud. 2021, 30, 3043–3063. [Google Scholar] [CrossRef]
- Pei, F.; Zhou, Y.; Xia, Y. Application of Normalized Difference Vegetation Index (NDVI) for the Detection of Extreme Precipitation Change. Forests 2021, 12, 594. [Google Scholar] [CrossRef]
- Li, X.; Guo, W.; Chen, J.; Ni, X.; Wei, X. Responses of vegetation green-up date to temperature variation in alpine grassland on the Tibetan Plateau. Ecol. Indic. 2019, 104, 390–397. [Google Scholar] [CrossRef]
- Xu, H.-J.; Wang, X.-P.; Zhang, X.-X. Impacts of climate change and human activities on the aboveground production in alpine grasslands: A case study of the source region of the Yellow River, China. Arab. J. Geosci. 2017, 10, 17. [Google Scholar] [CrossRef]
- Wang, C. A remote sensing perspective of alpine grasslands on the Tibetan Plateau: Better or worse under “Tibet Warming”? Remote Sens. Appl. Soc. Environ. 2016, 3, 36–44. [Google Scholar] [CrossRef]
- He, J.; Yang, K. China Meteorological Forcing Dataset. Cold Arid. Reg. Sci. Data Cent. Lanzhou 2011. [Google Scholar] [CrossRef]
- Chen, Y.; Yang, K.; Jie, H.; Qin, J.; Shi, J.; Du, J.; He, Q. Improving land surface temperature modeling for dry land of China. J. Geophys. Res. Atmos. 2011, 116, D20104. [Google Scholar] [CrossRef]
- Fang, Y.H.; Zhang, X.; Corbari, C.; Mancini, M.; Zeng, W. Improving the Xin’anjiang hydrological model based on mass—Energy balance. Hydrol. Earth Syst. Sci. 2017, 21, 3359–3375. [Google Scholar] [CrossRef]
- Gu, H.; Yu, Z.; Li, G.; Luo, J.; Ju, Q.; Huang, Y.; Fu, X. Entropy-Based Research on Precipitation Variability in the Source Region of China’s Yellow River. Water 2020, 12, 2486. [Google Scholar] [CrossRef]
- Gdem, A. ASTER Global Digital Elevation Model; USGS Earth Resources Observation and Science (EROS) Center: Sioux Falls, SC, USA, 2011. [Google Scholar]
- NASA. MODIS 0.05 NDVI of Global (2011–2016); National Tibetan Plateau Data Center: Beijing, China, 2018. [Google Scholar]
- Linderholm, H.W. Growing season changes in the last century. Agric. For. Meteorol. 2006, 137, 1–14. [Google Scholar] [CrossRef]
- Xu, M.; Li, Z. Accumulated temperature changes in desert region and surrounding area during 1960–2013: A case study in the Alxa Plateau, Northwest China. Environ. Earth Sci. 2016, 75, 1276. [Google Scholar] [CrossRef]
- Cong, N.; Shen, M.; Yang, W.; Yang, Z.; Zhang, G.; Piao, S. Varying responses of vegetation activity to climate changes on the Tibetan Plateau grassland. Int. J. Biometeorol. 2017, 61, 1433–1444. [Google Scholar] [CrossRef]
- Qin, Y.; Yang, D.; Gao, B.; Wang, T.; Chen, J.; Chen, Y.; Wang, Y.; Zheng, G. Impacts of climate warming on the frozen ground and eco-hydrology in the Yellow River source region, China. Sci. Total Environ. 2017, 605–606, 830–841. [Google Scholar] [CrossRef] [PubMed]



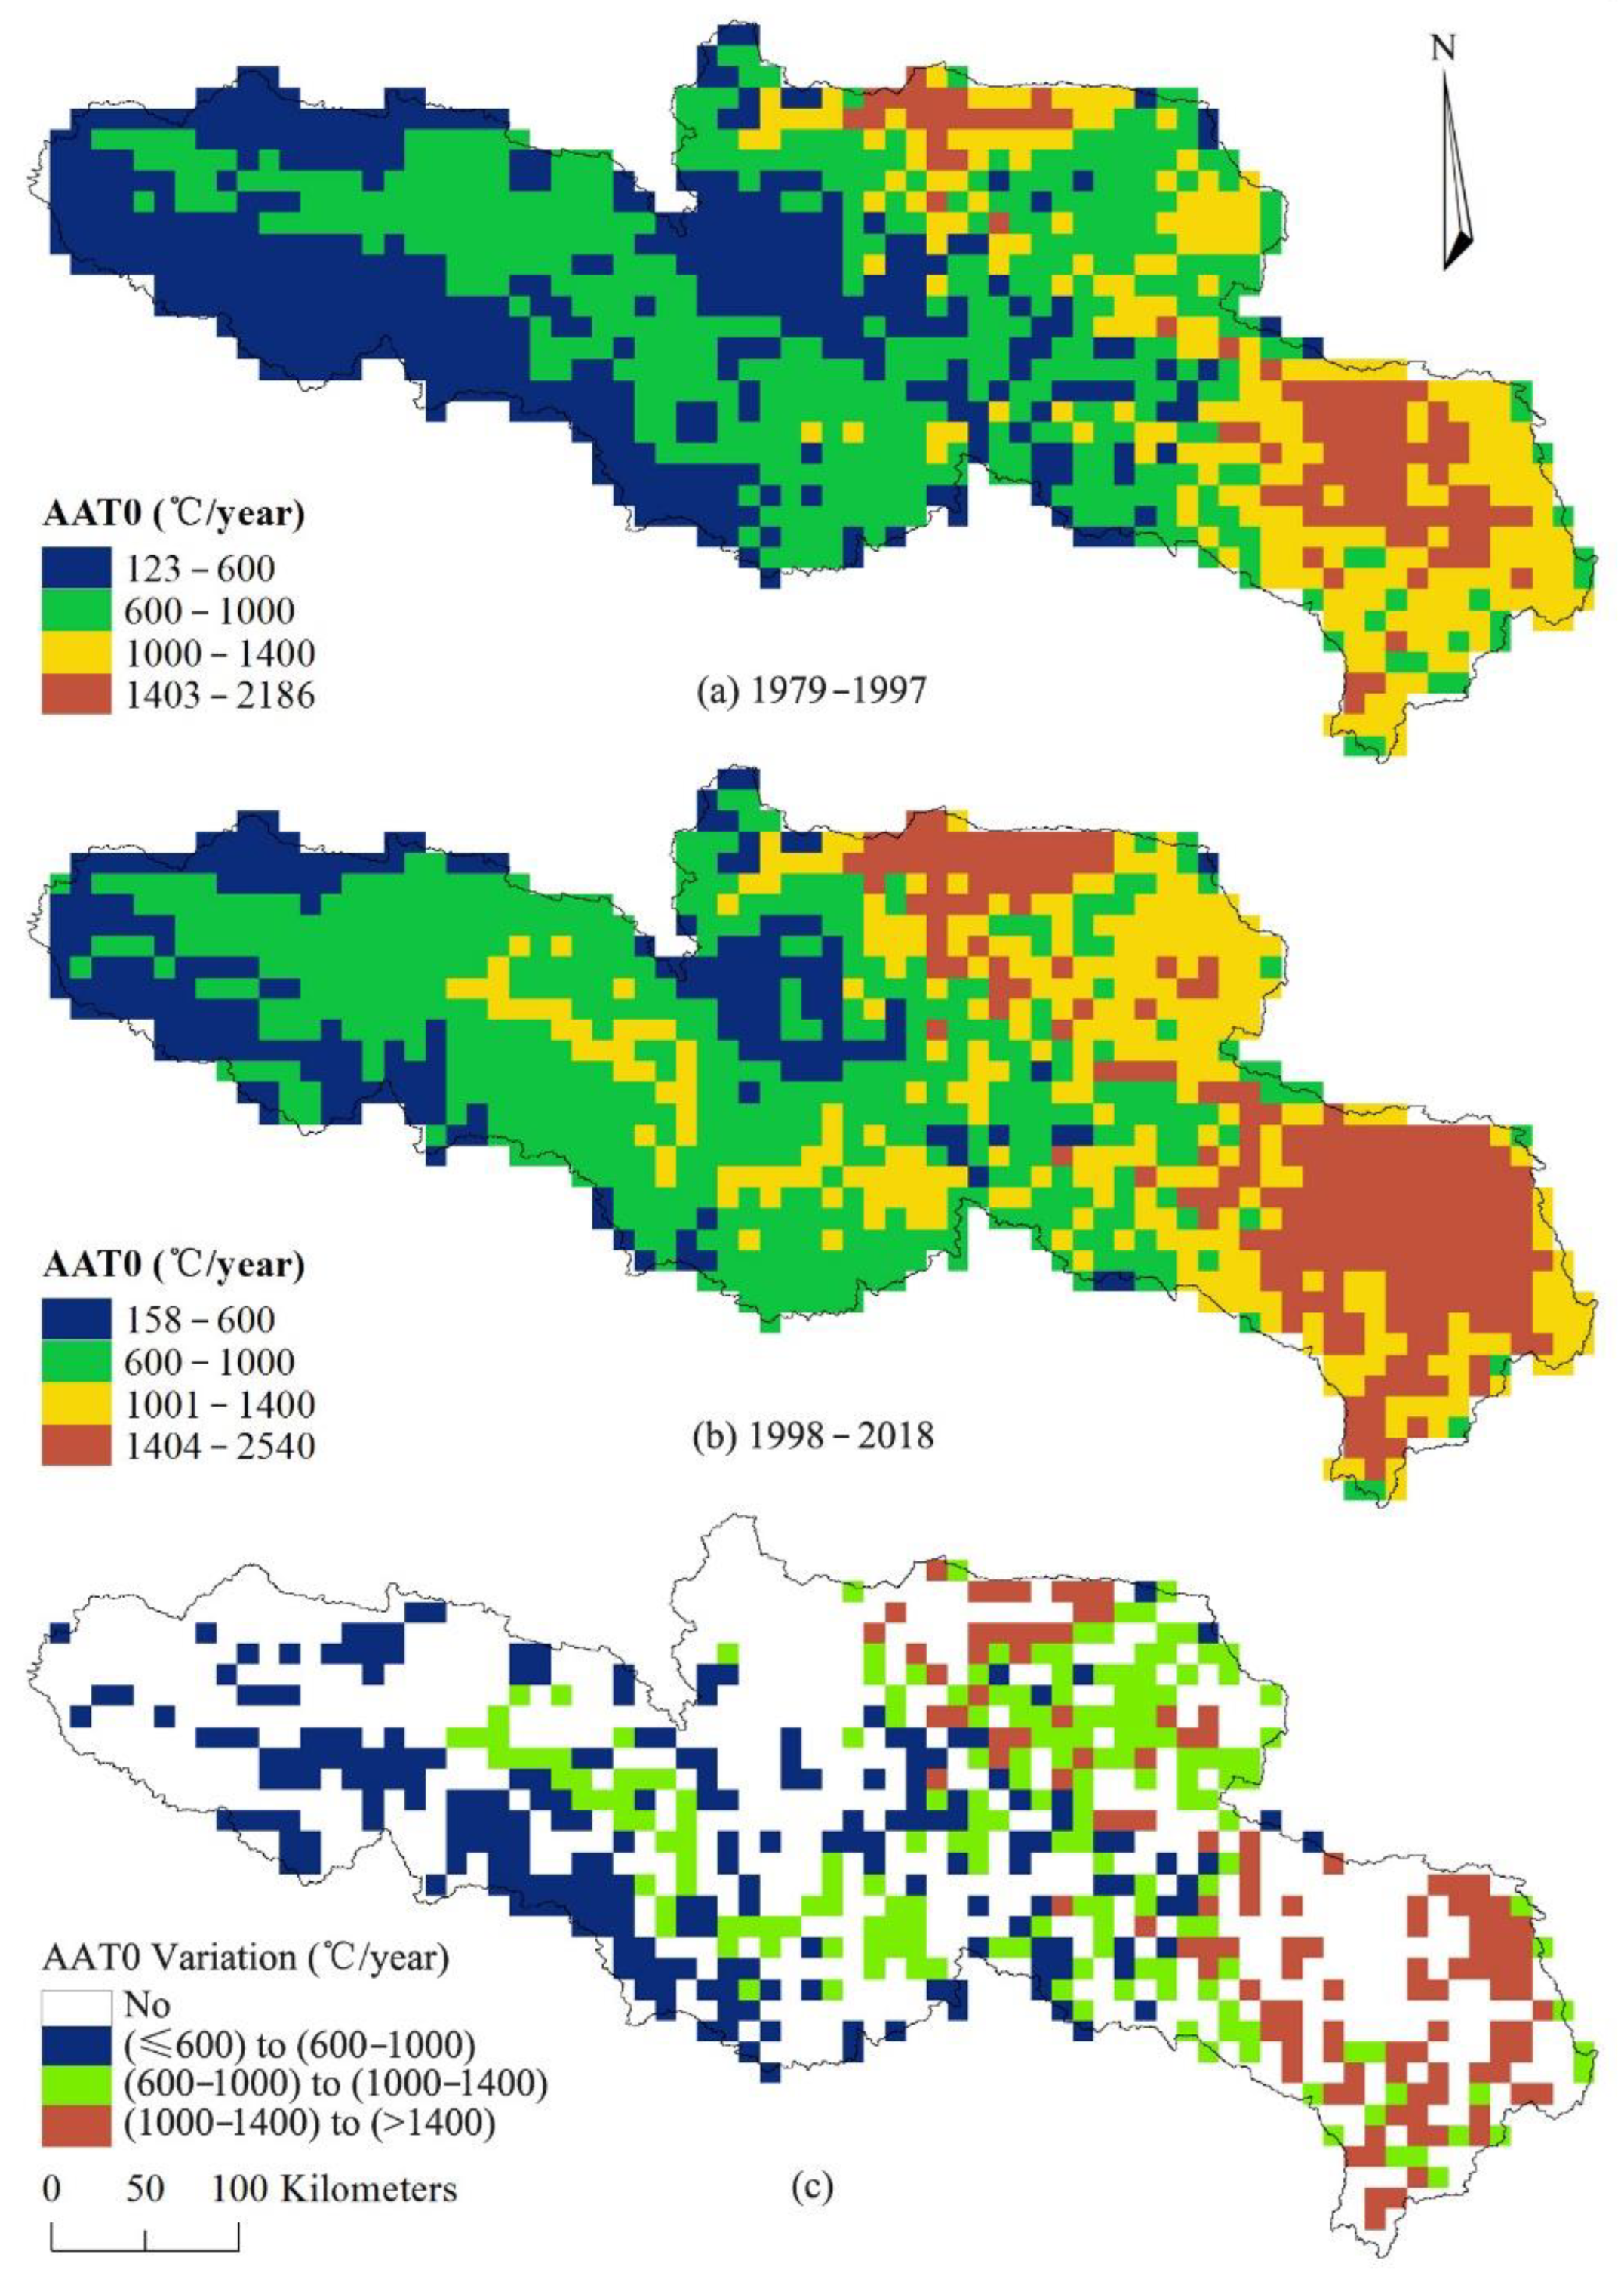
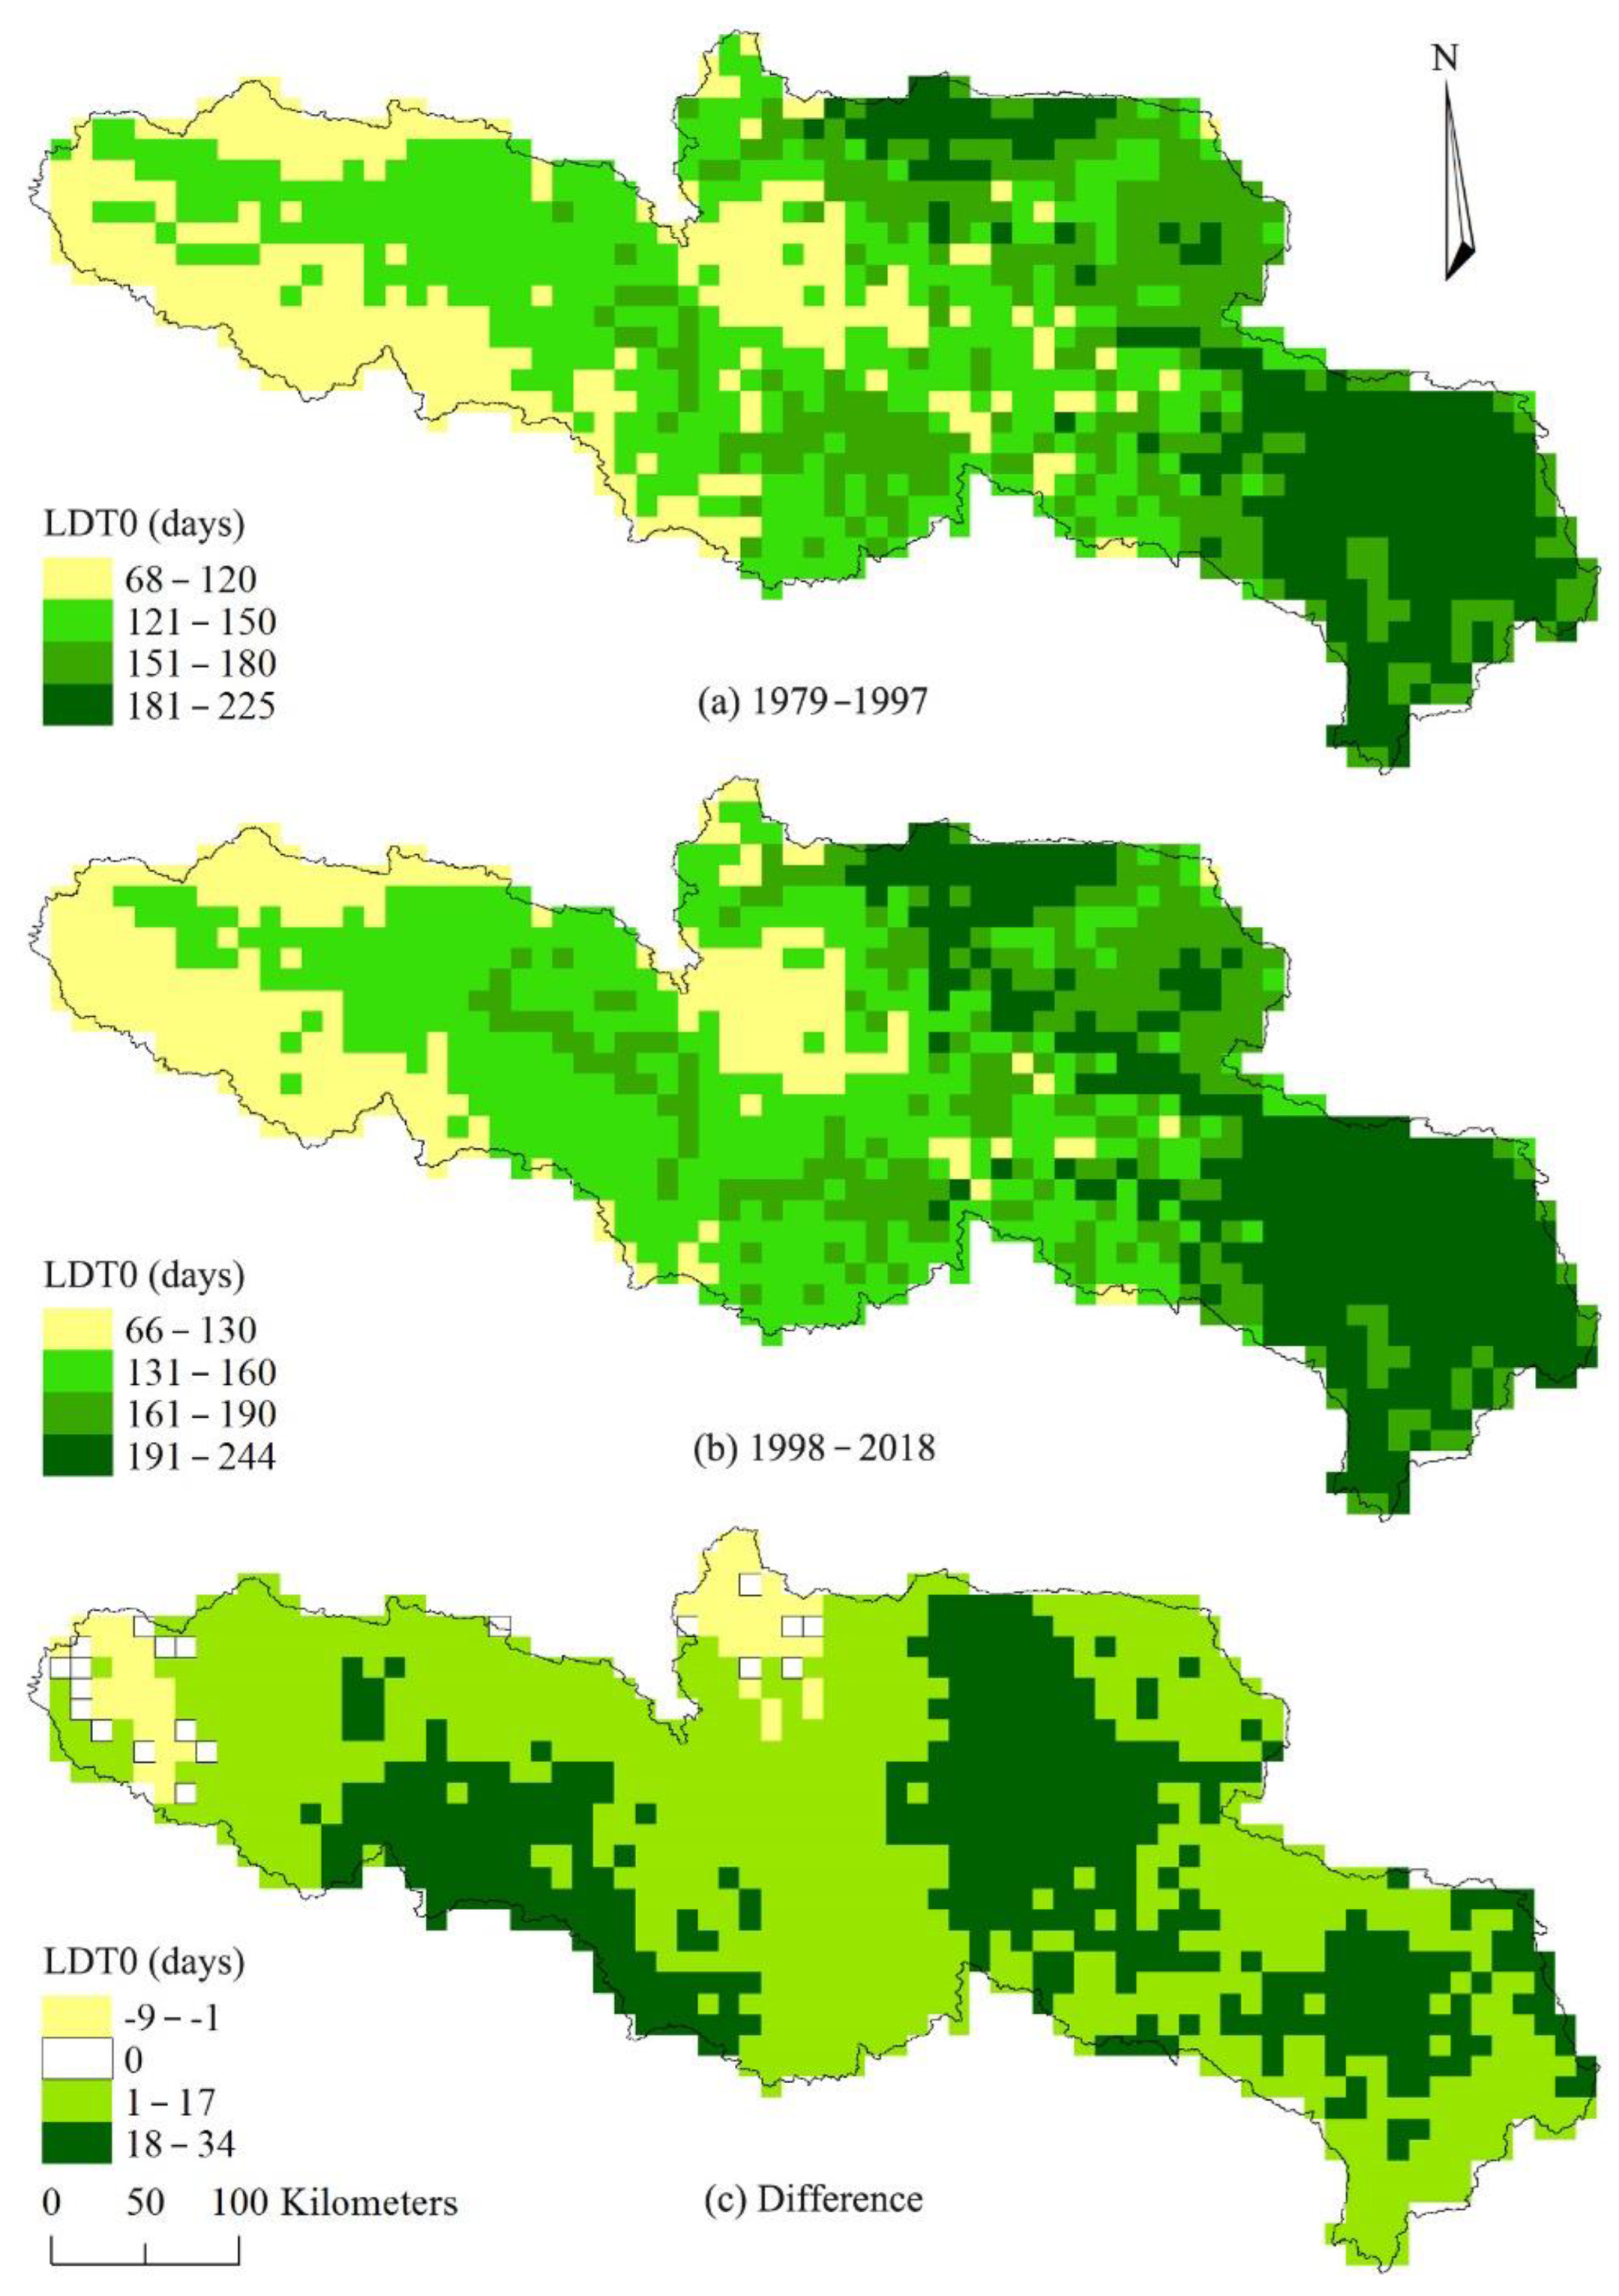
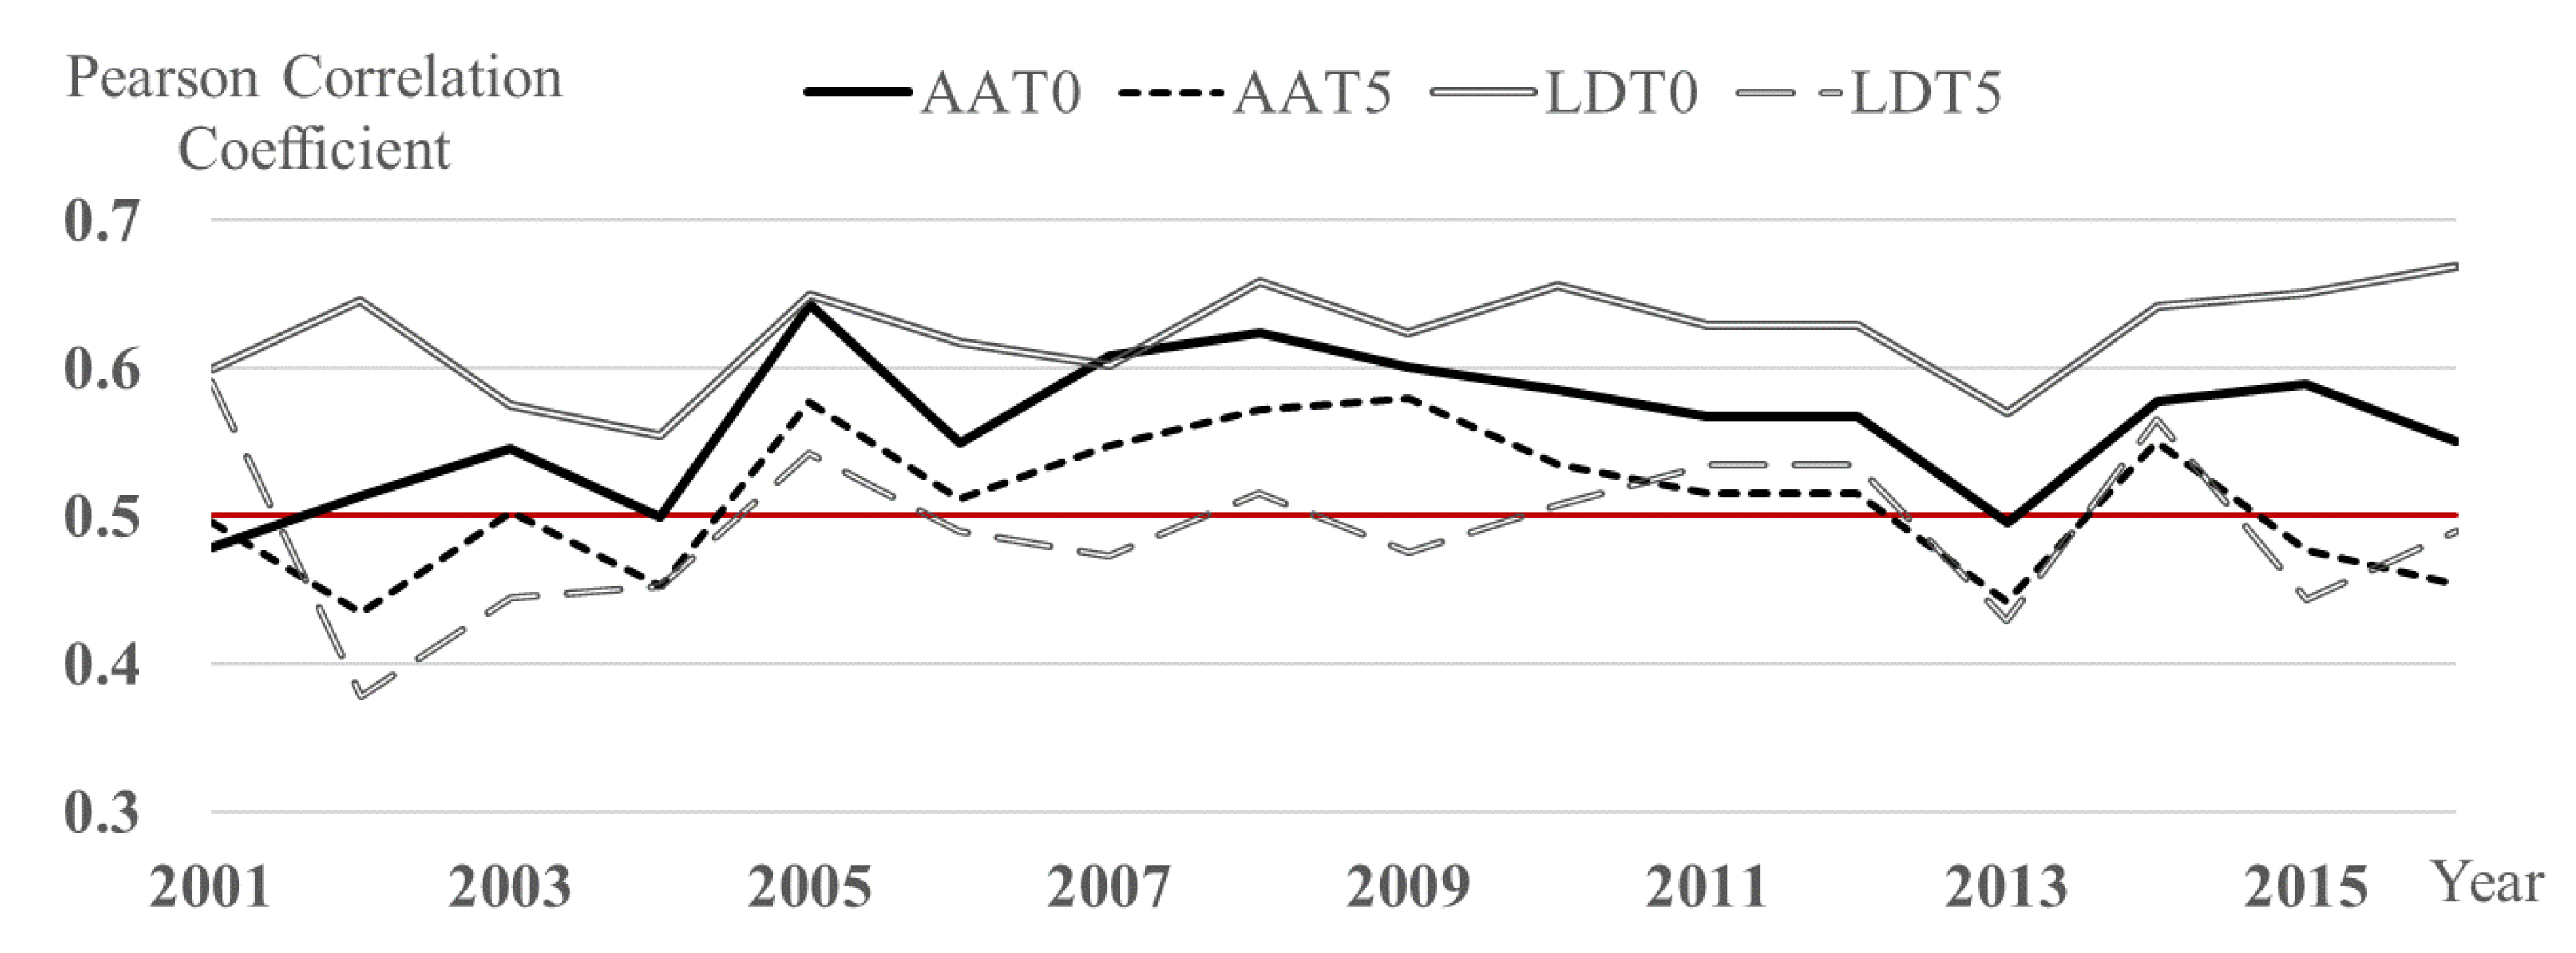


| ID | Name | Longitude (°E) | Latitude (°N) | Altitude (m) | Period (Year) |
|---|---|---|---|---|---|
| 56033 | Maduo | 98.22 | 34.92 | 4272 | 1953– |
| 56043 | Golog | 100.25 | 34.47 | 3719 | 1991– |
| 56046 | Darlag | 99.65 | 33.75 | 3968 | 1956– |
| 56065 | Henan | 101.60 | 34.73 | 3500 | 1959– |
| 56067 | Jigzhi | 101.48 | 33.43 | 3629 | 1958– |
| 56074 | Maqu | 102.08 | 34.00 | 3471 | 1967– |
| 56079 | Zoige | 102.97 | 33.58 | 3440 | 1957– |
| 56173 | Hongyuan | 102.55 | 32.80 | 3492 | 1960– |
| Data | Source | Resolution | Period (Year) |
|---|---|---|---|
| Mean daily temperature | CMFD (China Meteorological Forcing Dataset) | 0.1° | 1979–2018 |
| DEM | ASTER Global Digital Elevation Model. Version 2 | 30 m | 2011 |
| NDVI | MODIS NDVI. Version 6 | 0.05° | 2001–2016 |
| Indicator | Belt | Area (104 km2) | Elevation Feature (m) | |
|---|---|---|---|---|
| Mean | Range | |||
| AAT0 | ≤600 | 2.9 | 4566 | 4122–4970 |
| 600–1000 | 5.2 | 4260 | 3703–4731 | |
| 1000–1400 | 2.5 | 3790 | 3497–4241 | |
| >1400 | 1.7 | 3493 | 2953–3858 | |
| AAT5 | ≤400 | 3.8 | 4514 | 3924–4970 |
| 400–700 | 4.5 | 4235 | 3687–4619 | |
| 700–1000 | 1.9 | 3798 | 3535–4241 | |
| >1000 | 2.1 | 3525 | 2953–4003 | |
| Indicator | Zone (Days) | Area (104 km2) | Elevation Feature (m) | |
|---|---|---|---|---|
| Mean | Range | |||
| LDT0 | ≤125 | 2.8 | 4578 | 4160–4970 |
| 125–155 | 4.2 | 4302 | 3726–4731 | |
| 155–185 | 2.7 | 3947 | 3535–4407 | |
| >185 | 2.6 | 3574 | 2953–4108 | |
| LDT5 | ≤80 | 7.5 | 4387 | 3726–4970 |
| 80–110 | 2.4 | 3893 | 3535–4467 | |
| >110 | 2.3 | 3547 | 2953–4003 | |
| Indicator | Inclination Rate (°C Decade−1) | Area (104 km2) | Elevation Feature (m) | |
|---|---|---|---|---|
| Mean | Range | |||
| AAT0 | 60–100 | 4.0 | 4234 | 3252–4872 |
| 100–130 | 3.8 | 4007 | 3022–4747 | |
| 130–212 | 1.9 | 3749 | 2953–4467 | |
| AAT5 | 60–100 | 0.9 | 4444 | 3571–4872 |
| 100–130 | 1.6 | 3831 | 3337–4588 | |
| 130–210 | 2.1 | 3628 | 2953–4363 | |
| Indicator | Inclination Rate (Days Decade−1) | Area (103 km2) | Elevation Feature (m) | |
|---|---|---|---|---|
| Mean | Range | |||
| LDT0 | ≤12 | 3.6 | 3835 | 3132–4585 |
| >12 | 2.4 | 4193 | 3540–4704 | |
| LDT5 | ≤12 | 5.7 | 3524 | 3429–3745 |
| >12 | 1.7 | 3828 | 3582–4108 | |
| Indicator | Trend | Area (104 km2) | Elevation Feature (m) | |
|---|---|---|---|---|
| Mean | Range | |||
| LDT0 | significant increasing | 9.9 | 4061 | 2953–4872 |
| non-significant increasing | 2.0 | 4391 | 3567–4970 | |
| non-significant decreasing | 0.4 | 4345 | 3899–4964 | |
| LDT5 | significant increasing | 5.3 | 3837 | 2953–4938 |
| non-significant increasing | 5.4 | 4332 | 3252–4970 | |
| non-significant decreasing | 1.6 | 4354 | 3900–4731 | |
| Indicator | Overlap State | SDT | LDT | EDT |
|---|---|---|---|---|
| ≥0 °C | Single | 6.4 | 9.9 | 10.1 |
| Double | 6.4 | 9.4 | ||
| Triple | 6.3 | |||
| ≥5 °C | Single | 3.2 | 5.3 | 5.1 |
| Double | 3.2 | 4.4 | ||
| Triple | 2.8 | |||
| Indicator | Abrupt Year | Area (104 km2) | Elevation Feature (m) | |
|---|---|---|---|---|
| Mean | Range | |||
| AAT0 | 1990–1995 | 2.1 | 4396 | 3567–4829 |
| 1997 | 8.1 | 3995 | 2953–4872 | |
| 1998–2004 | 1.9 | 4325 | 3569–4826 | |
| AAT5 | 1990–1996 | 3.1 | 4323 | 3337–4938 |
| 1997 | 3.0 | 3956 | 2953–4747 | |
| 1998–2007 | 5.2 | 4038 | 3438–4964 | |
| Indicator | Changed Belt (AAT0)/ Difference (Days) (LDT0) | Area (104 km2) | Elevation Feature (m) | |
|---|---|---|---|---|
| Mean | Range | |||
| AAT0 | ≤600 to 600–1000 | 2.2 | 4423 | 3924–4747 |
| 600–1000 to 1000–1400 | 1.9 | 3998 | 3539–4407 | |
| 1000–1400 to >1400 | 1.2 | 3606 | 3410–3977 | |
| LDT0 | <0 | 0.5 | 4474 | 4054–4970 |
| 0 | 0.2 | 4501 | 3899–4701 | |
| 1–17 | 7.3 | 4247 | 3022–4938 | |
| 18–34 | 4.2 | 4040 | 2953–4855 | |
| Indicator | Coefficient | Mean | Range | Std Dev |
|---|---|---|---|---|
| AAT0 | Pearson’s γ | 0.56 | 0.48–0.64 | 0.05 |
| Spearman’s ρ | 0.67 | 0.60–0.74 | 0.04 | |
| Kendall’s τ | 0.48 | 0.41–0.55 | 0.04 | |
| LDT0 | Pearson’s γ | 0.62 | 0.55–0.67 | 0.04 |
| Spearman’s ρ | 0.71 | 0.60–0.81 | 0.05 | |
| Kendall’s τ | 0.52 | 0.44–0.62 | 0.04 | |
| AAT5 | Pearson’s γ | 0.51 | 0.43–0.58 | 0.05 |
| Spearman’s ρ | 0.63 | 0.52–0.70 | 0.06 | |
| Kendall’s τ | 0.44 | 0.36–0.50 | 0.05 | |
| LDT5 | Pearson’s γ | 0.49 | 0.38–0.59 | 0.06 |
| Spearman’s ρ | 0.58 | 0.47–0.66 | 0.06 | |
| Kendall’s τ | 0.41 | 0.33–0.47 | 0.04 |
| Indicator | Pearson’s γ | Spearman’s ρ | Kendall’s τ |
|---|---|---|---|
| AAT0 | 373 | 369 | 373 |
| LDT0 | 278 | 291 | 280 |
| AAT5 | 58 | 64 | 60 |
| LDT5 | 94 | 119 | 104 |
Publisher’s Note: MDPI stays neutral with regard to jurisdictional claims in published maps and institutional affiliations. |
© 2022 by the authors. Licensee MDPI, Basel, Switzerland. This article is an open access article distributed under the terms and conditions of the Creative Commons Attribution (CC BY) license (https://creativecommons.org/licenses/by/4.0/).
Share and Cite
Gu, H.; Luo, J.; Li, G.; Yao, Y.; Huang, Y.; Huang, D. Spatial-Temporal Variations of Active Accumulated Temperature and Its Impact on Vegetation NDVI in the Source Region of China’s Yellow River. Water 2022, 14, 3458. https://doi.org/10.3390/w14213458
Gu H, Luo J, Li G, Yao Y, Huang Y, Huang D. Spatial-Temporal Variations of Active Accumulated Temperature and Its Impact on Vegetation NDVI in the Source Region of China’s Yellow River. Water. 2022; 14(21):3458. https://doi.org/10.3390/w14213458
Chicago/Turabian StyleGu, Henan, Jian Luo, Guofang Li, Yueling Yao, Yan Huang, and Dongjing Huang. 2022. "Spatial-Temporal Variations of Active Accumulated Temperature and Its Impact on Vegetation NDVI in the Source Region of China’s Yellow River" Water 14, no. 21: 3458. https://doi.org/10.3390/w14213458
APA StyleGu, H., Luo, J., Li, G., Yao, Y., Huang, Y., & Huang, D. (2022). Spatial-Temporal Variations of Active Accumulated Temperature and Its Impact on Vegetation NDVI in the Source Region of China’s Yellow River. Water, 14(21), 3458. https://doi.org/10.3390/w14213458


