
Seasonal Dynamics and Heavy Rain Effects on the Diversity of Microeukaryome in the Nakdonggang River

 ,
,  ,
, 
Abstract
1. Introduction
2. Materials and Methods
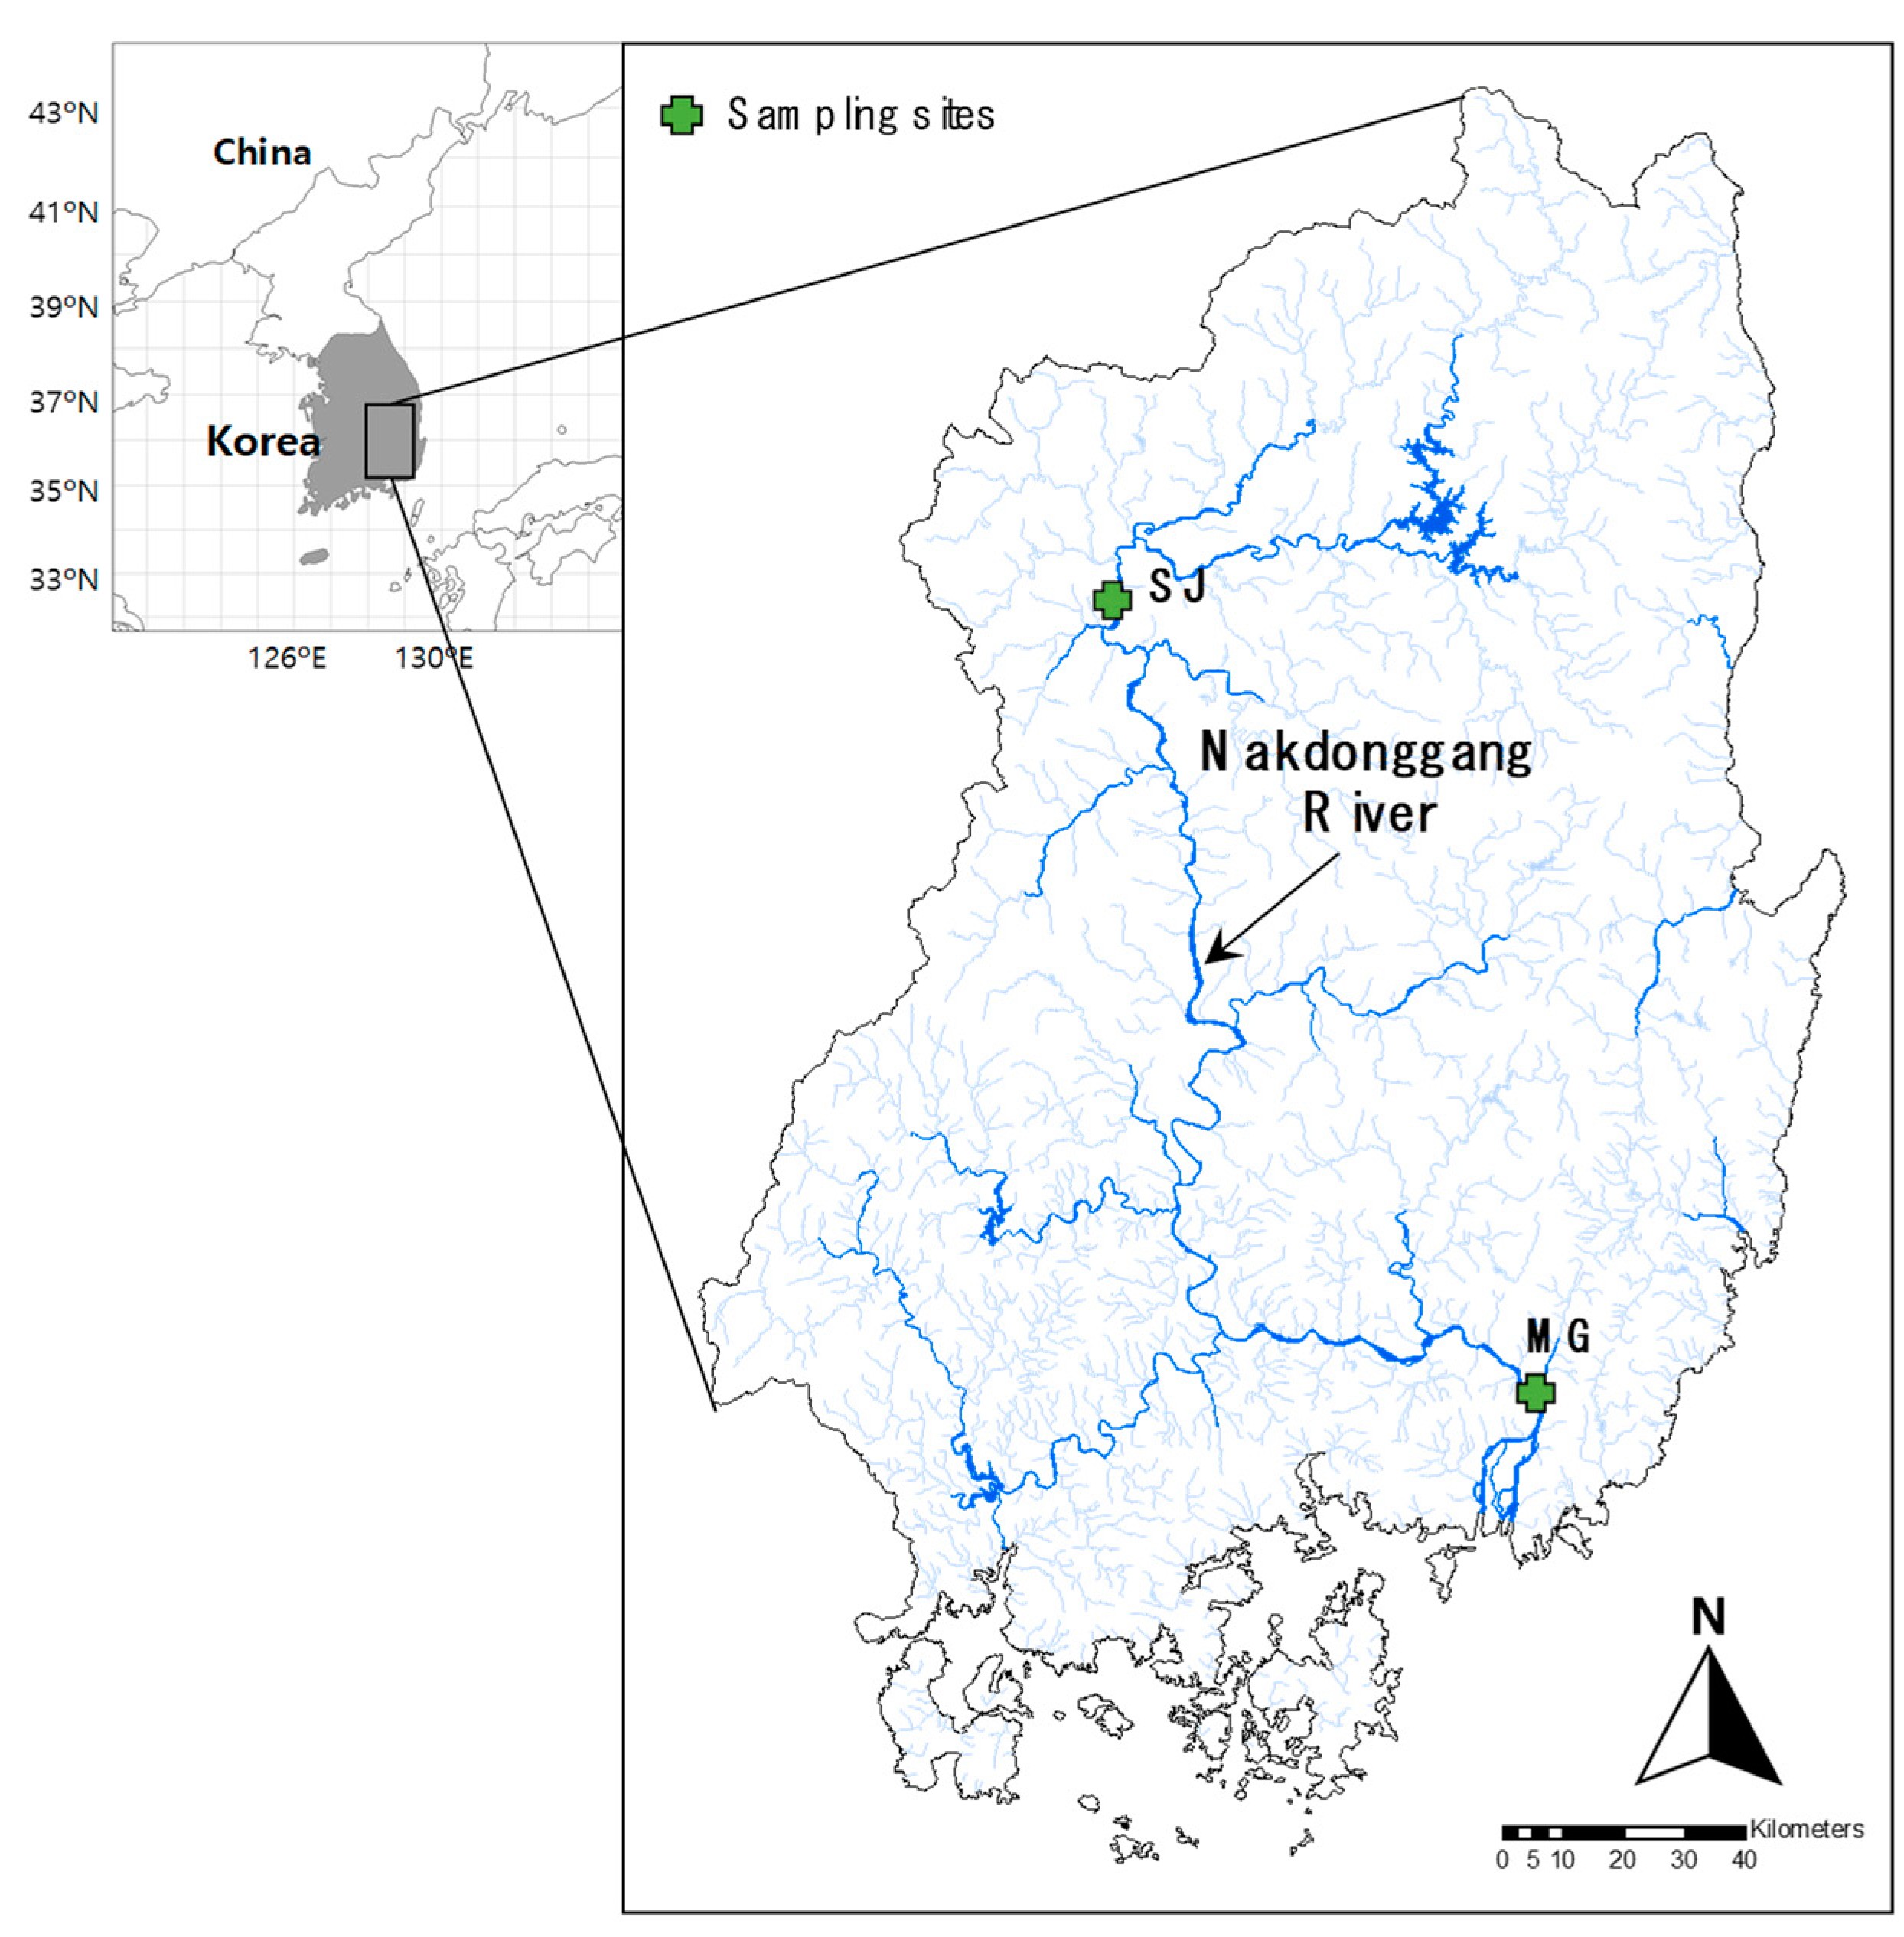
2.1. Study Area
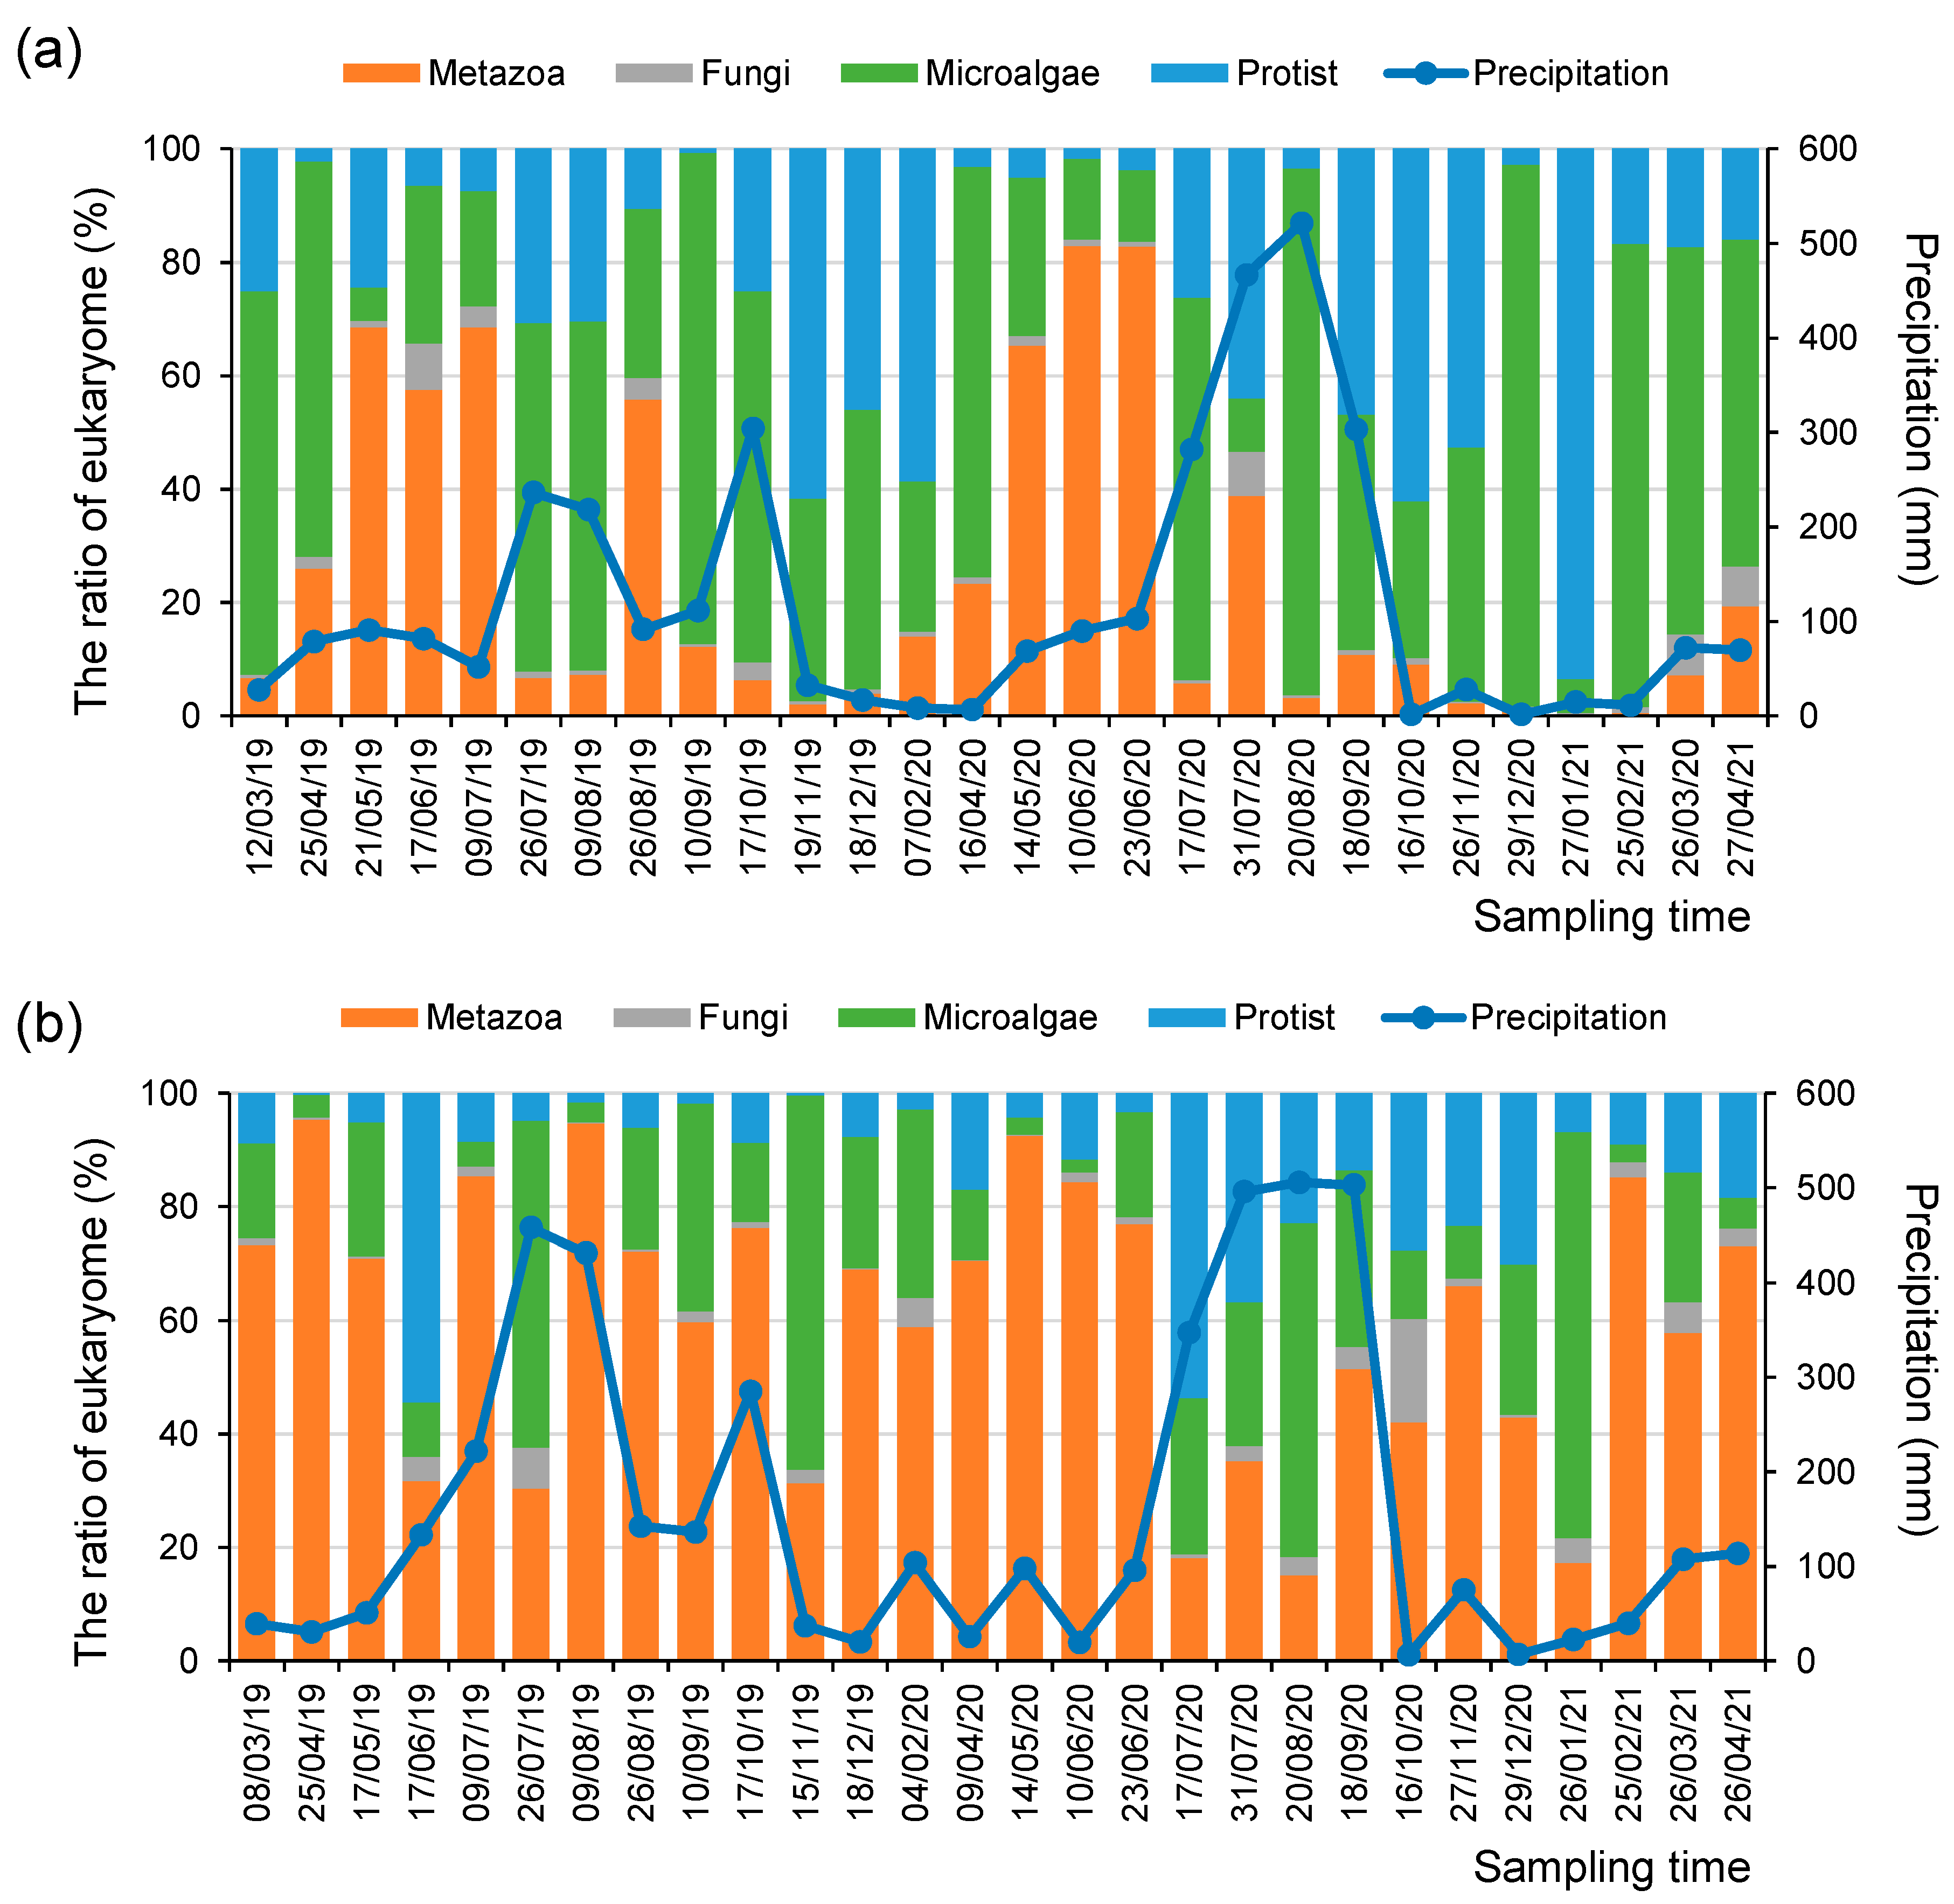
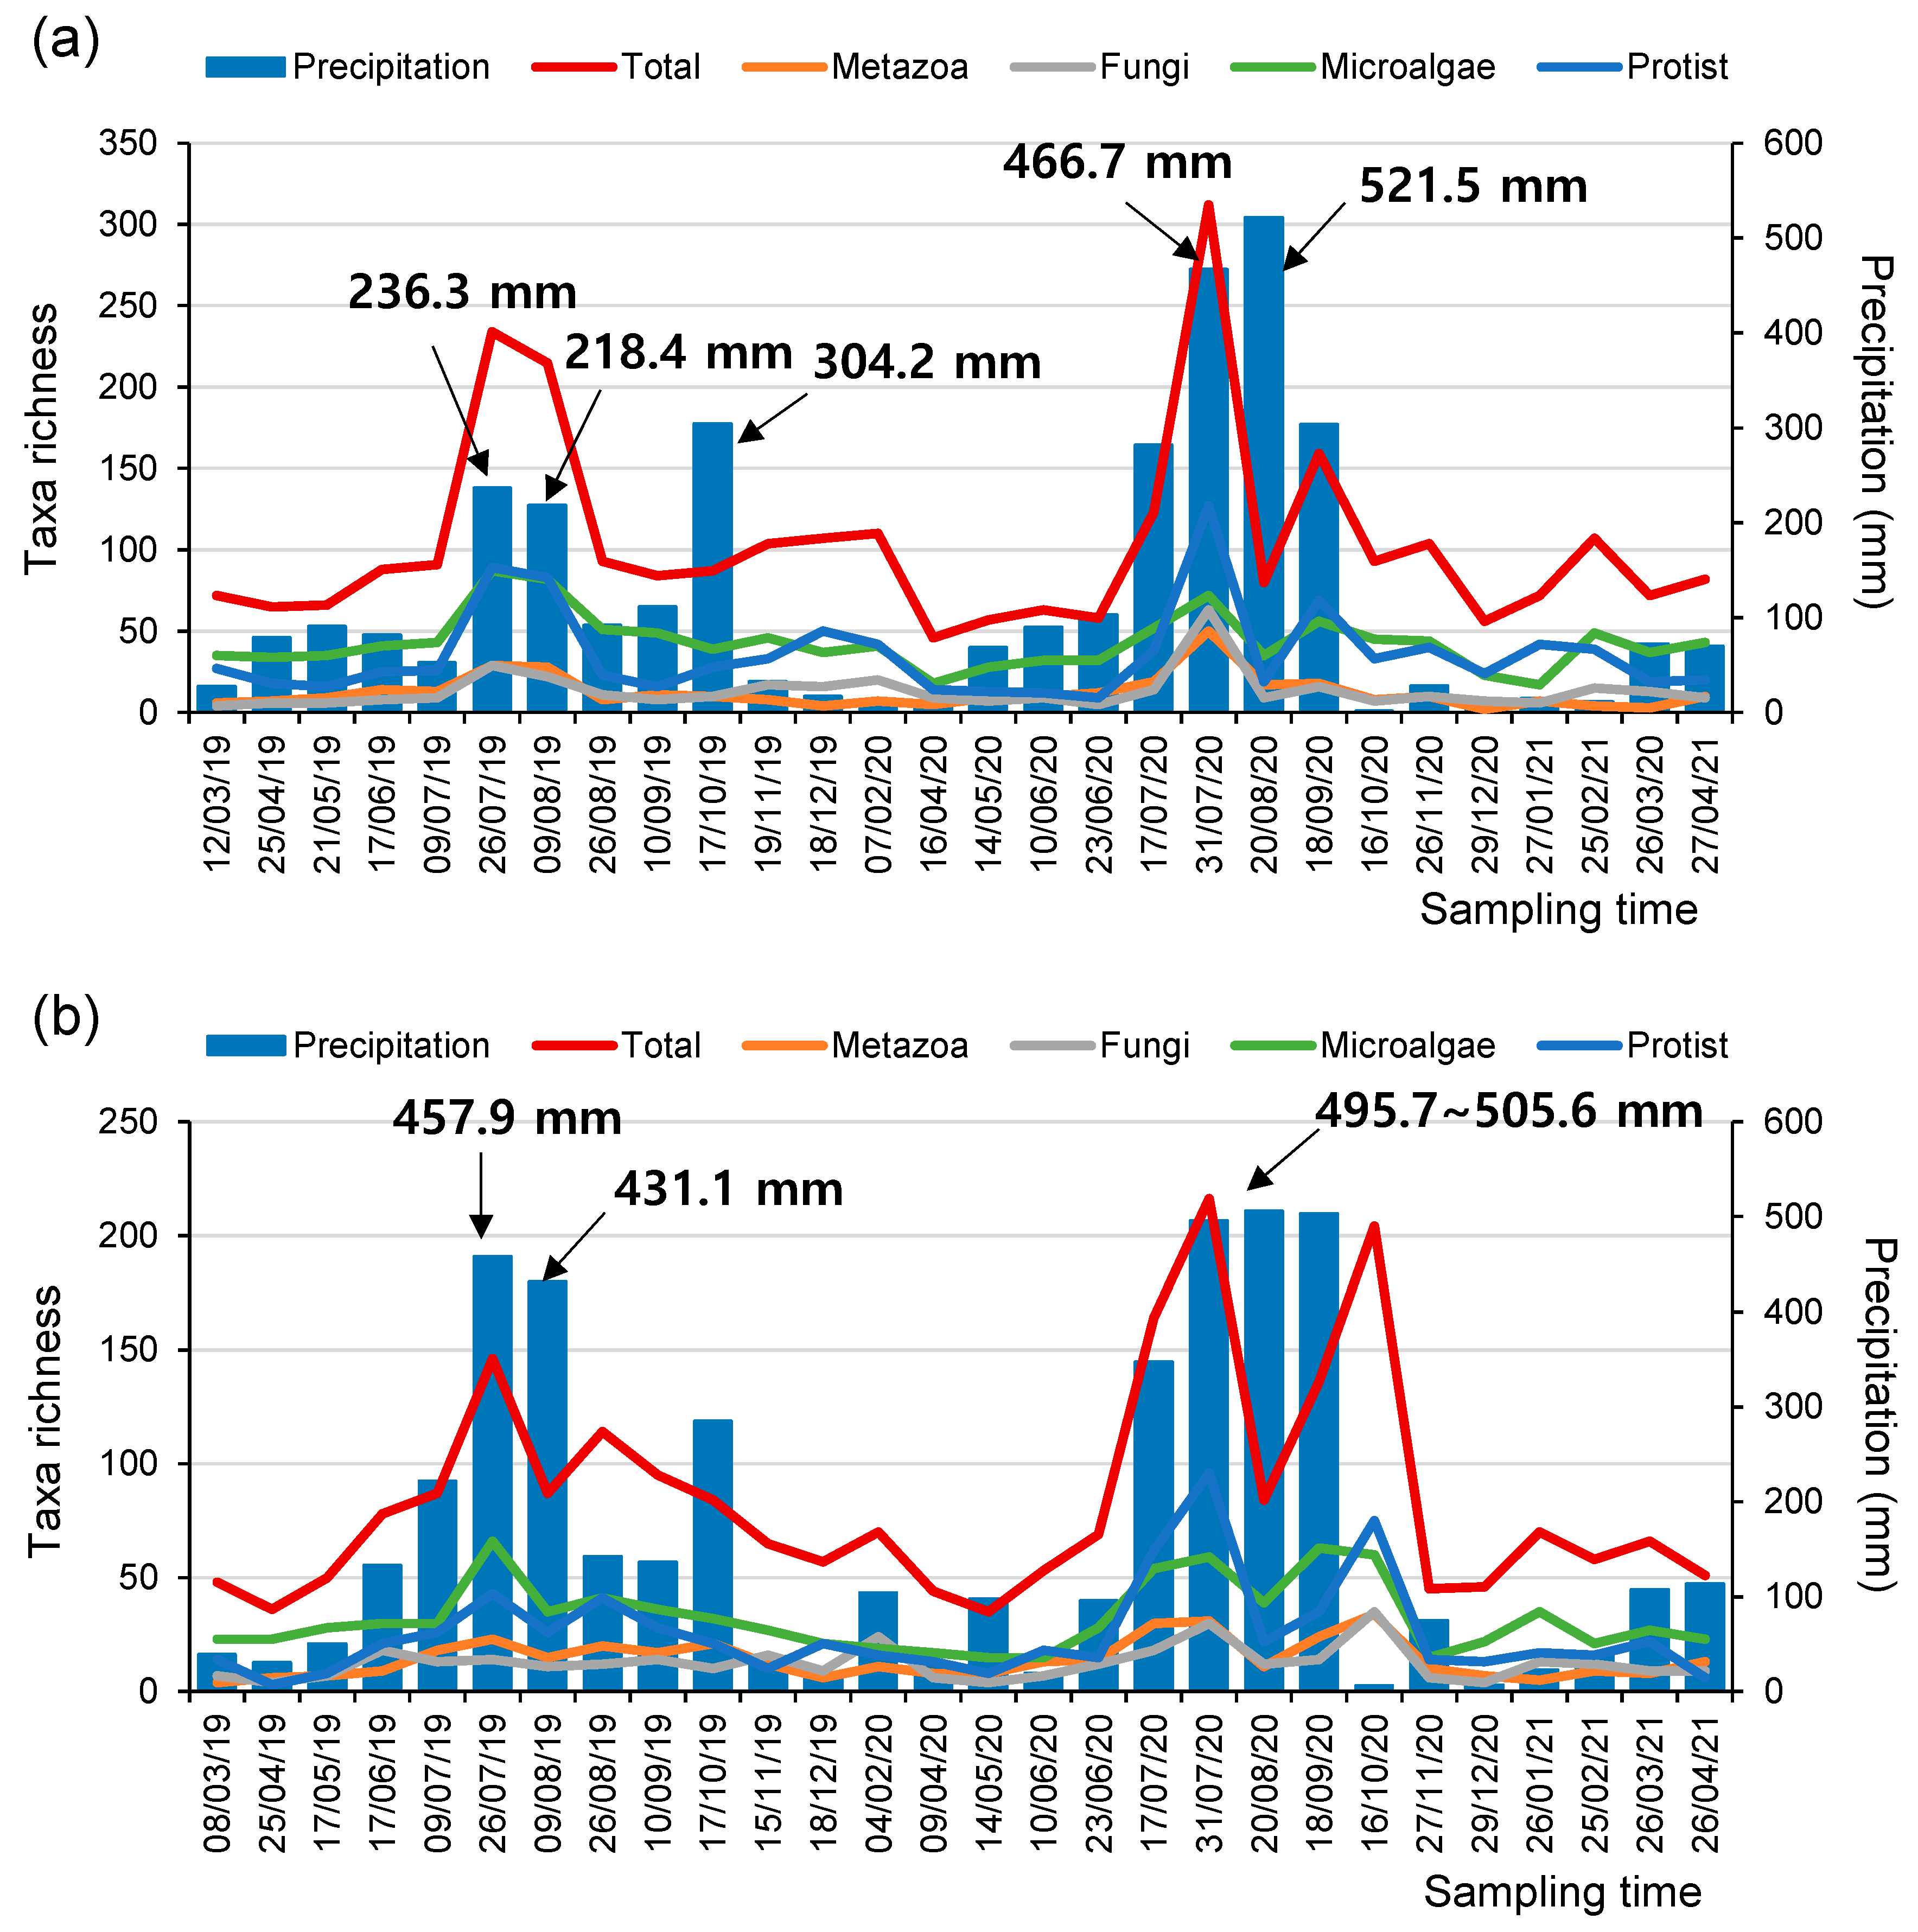
2.2. Sampling and Ecological Data
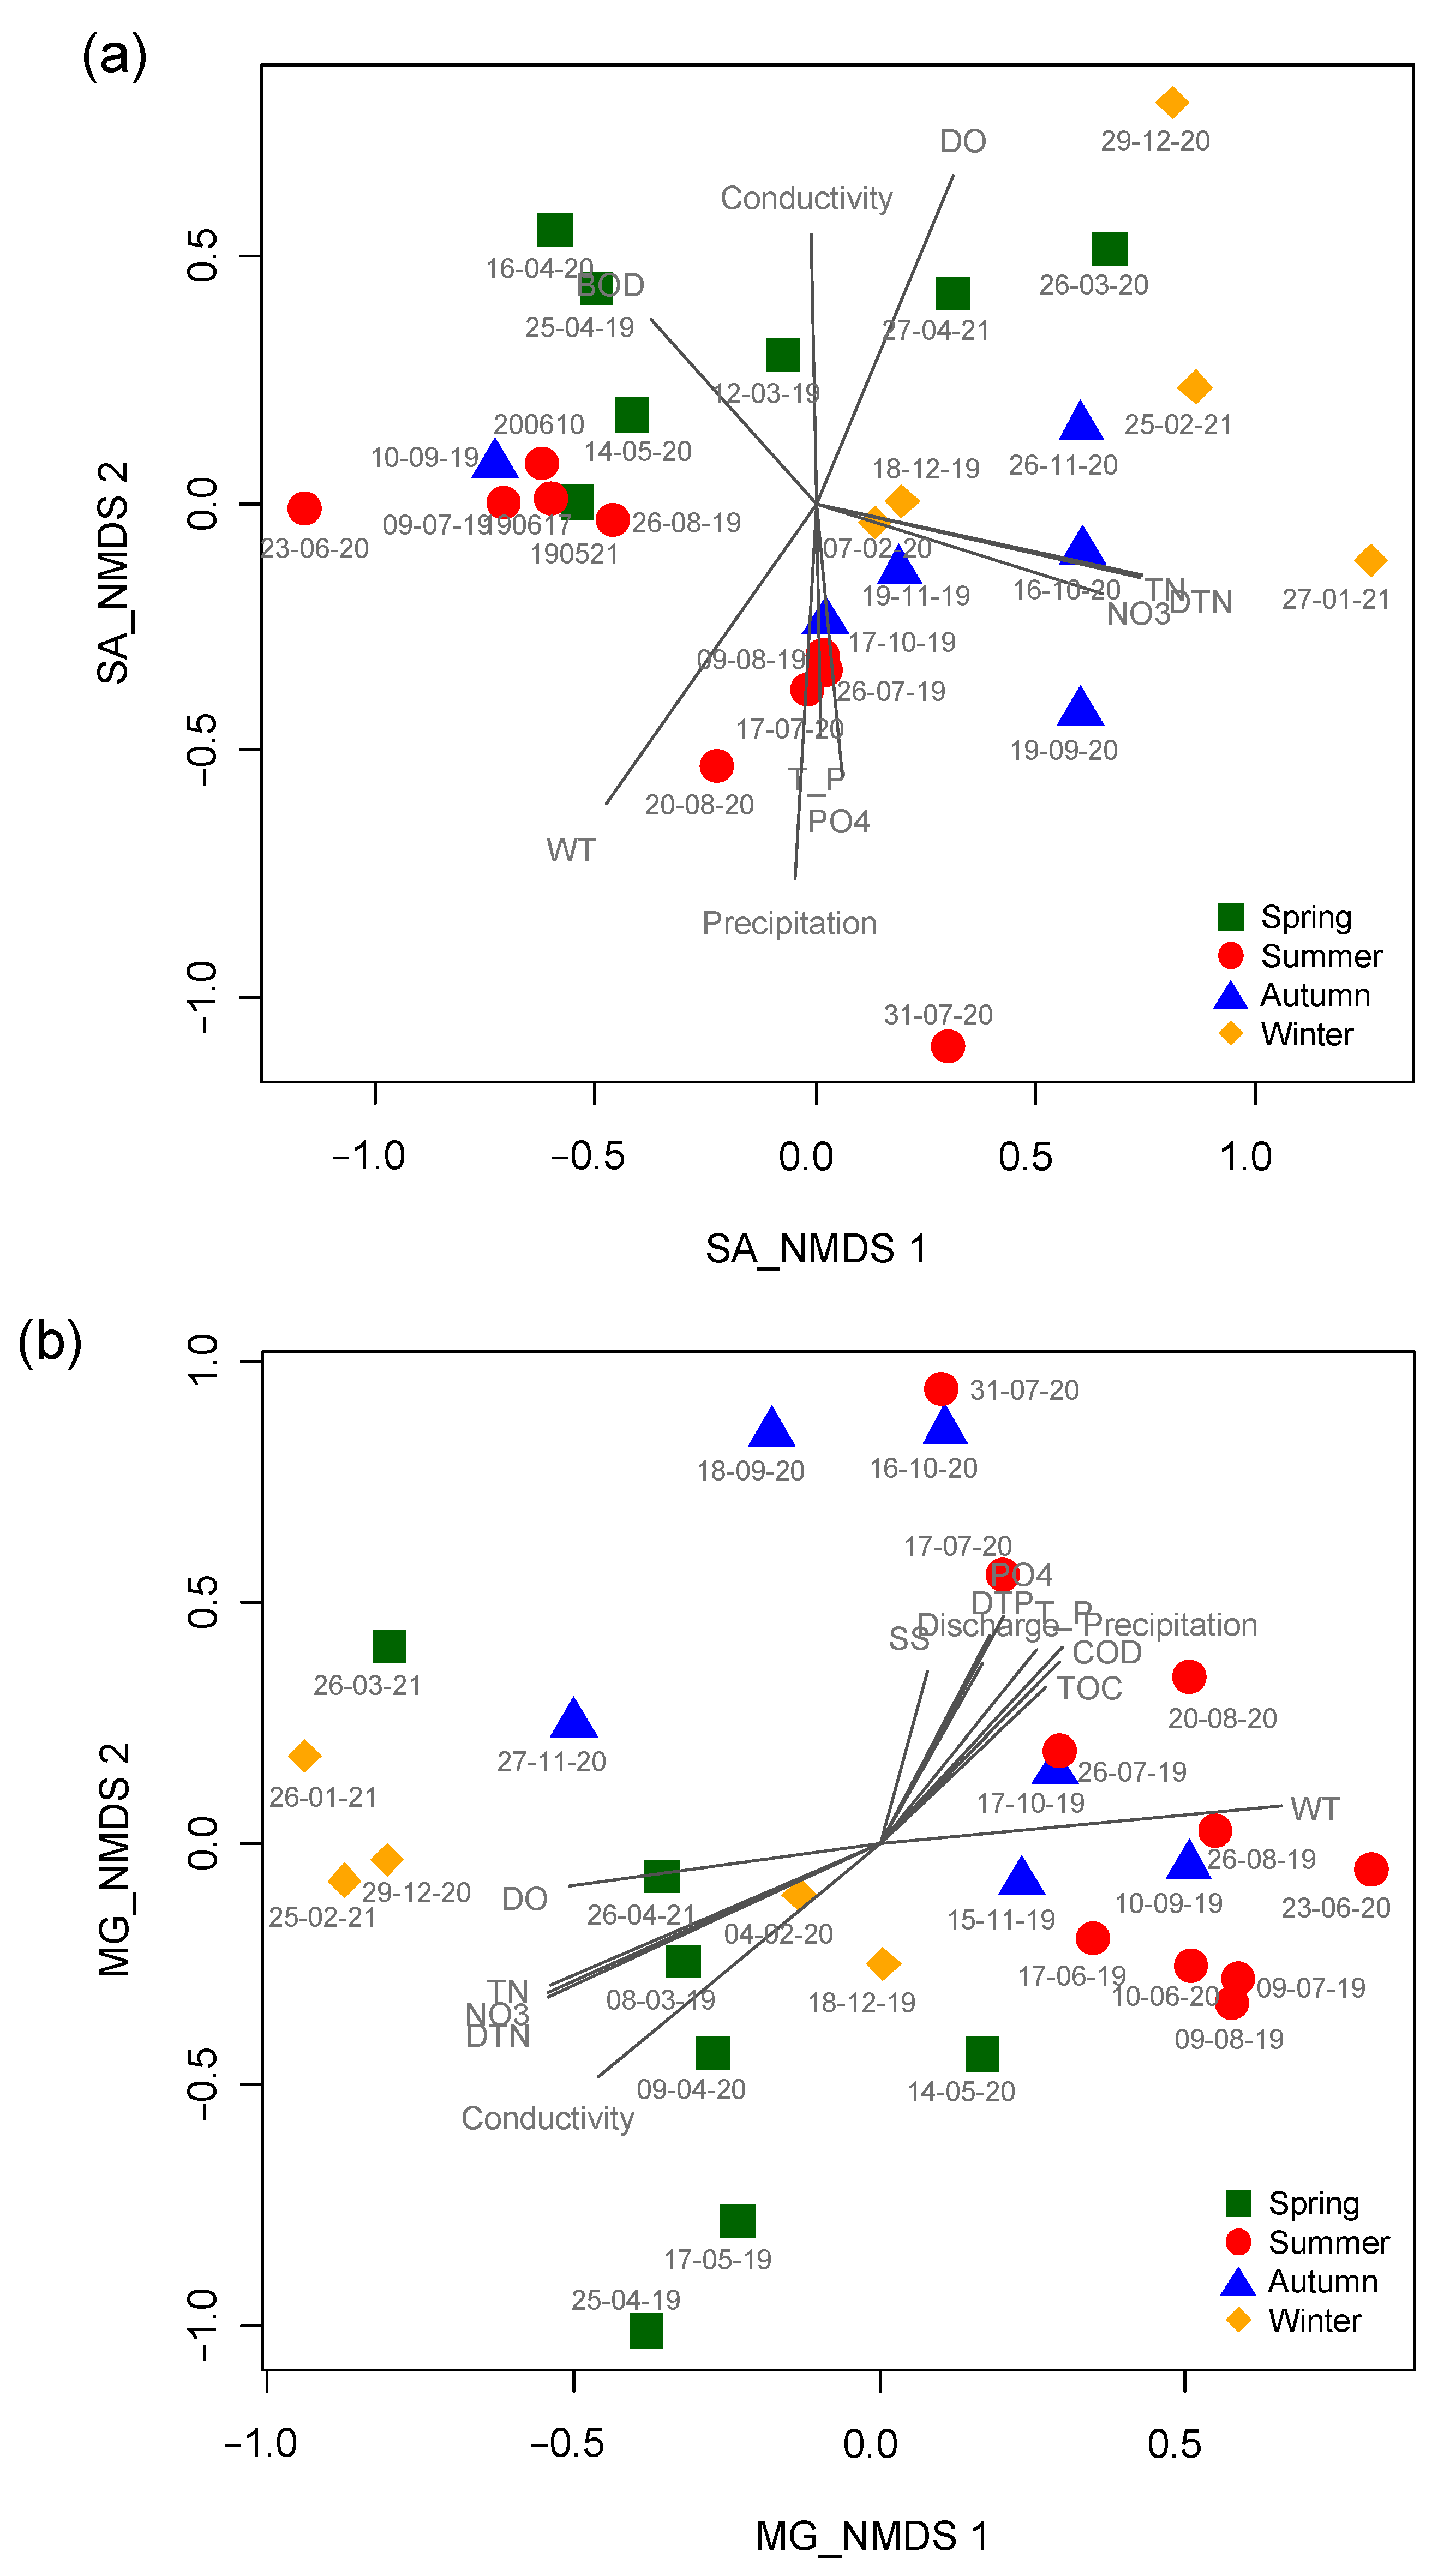
2.3. Data Analysis
3. Results and Discussion
4. Conclusions
Supplementary Materials
Author Contributions
Funding
Data Availability Statement
Conflicts of Interest
References
- Miller, A.M.; Golladay, S.W. Effects of spates and drying on macroinvertebrate assemblages of an intermittent and a perennial prairie stream. J. N. Am. Benthol. Soc. 1996, 15, 670–689. [Google Scholar] [CrossRef]
- Bae, M.J.; Park, Y.S. Evaluation of precipitation impacts on benthic macroinvertebrate communities at three different stream types. Ecol. Indic. 2019, 102, 446–456. [Google Scholar] [CrossRef]
- Carpenter, S.R.; Caraco, N.F.; Correll, D.L.; Howarth, R.W.; Sharpley, A.N.; Smith, V.H. Nonpoint pollution of surface waters with phosphorus and nitrogen. Ecol. Appl. 1998, 8, 559–568. [Google Scholar] [CrossRef]
- Ma, X.; Li, Y.; Zhang, M.; Zheng, F.; Du, S. Assessment and analysis of non-point source nitrogen and phosphorus loads in the Three Gorges Reservoir Area of Hubei Province, China. Sci. Total Environ. 2011, 412–413, 154–161. [Google Scholar] [CrossRef] [PubMed]
- Chen, X.; Liu, X.; Peng, W.; Dong, F.; Huang, Z.; Wang, R. Non-point source nitrogen and phosphorus assessment and management plan with an improved method in data-poor regions. Water 2017, 10, 17. [Google Scholar] [CrossRef]
- Bucak, T.; Trolle, D.; Tavşanoğlu, Ü.N.; Çakıroğlu, A.İ.; Özen, A.; Jeppesen, E.; Beklioğlu, M. Modeling the effects of climatic and land use changes on phytoplankton and water quality of the largest Turkish freshwater lake: Lake Beyşehir. Sci Total Environ. 2018, 621, 802–816. [Google Scholar] [CrossRef]
- Donnert, D.; Salecker, M. Elimination of phosphorus from municipal and industrial waste water. Water Sci. Technol. 1999, 40, 195–202. [Google Scholar] [CrossRef]
- Seitzinger, S.P.; Sanders, R.W. Contribution of dissolved organic nitrogen from rivers to estuarine eutrophication. Mar. Ecol. Prog. Ser. 1997, 159, 1–12. [Google Scholar] [CrossRef]
- Brookfield, A.E.; Hansen, A.T.; Sullivan, P.L.; Czuba, J.A.; Kirk, M.F.; Li, L.; Newcomer, M.E.; Wilkinson, G. Predicting algal blooms: Are we overlooking groundwater? Sci. Total Environ. 2021, 769, 144442. [Google Scholar] [CrossRef] [PubMed]
- Wymore, A.S.; Johnes, P.J.; Bernal, S.; Brookshire, E.J.; Fazekas, H.M.; Helton, A.M.; Argerich, A.; Barnes, R.T.; Coble, A.A.; Dodds, W.K.; et al. Gradients of anthropogenic nutrient enrichment alter N composition and DOM stoichiometry in freshwater ecosystems. Glob. Biogeochem. Cycles 2021, 35, e2021GB006953. [Google Scholar] [CrossRef]
- Brannock, P.M.; Ortmann, A.C.; Moss, A.G.; Halanych, K.M. Metabarcoding reveals environmental factors influencing spatio-temporal variation in pelagic micro-eukaryotes. Mol. Ecol. 2016, 25, 3593–3604. [Google Scholar] [CrossRef] [PubMed]
- Liao, K.; Bai, Y.; Huo, Y.; Jian, Z.; Hu, W.; Zhao, C.; Qu, J. Integrating microbial biomass, composition and function to discern the level of anthropogenic activity in a river ecosystem. Environ. Int. 2018, 116, 147–155. [Google Scholar] [CrossRef]
- Ruppert, K.M.; Kline, R.J.; Rahman, M.S. Past, present, and future perspectives of environmental DNA (eDNA) metabarcoding: A systematic review in methods, monitoring, and applications of global eDNA. Glob. Ecol. Conserv. 2019, 17, e00547. [Google Scholar] [CrossRef]
- Salmaso, N.; Boscaini, A.; Pindo, M. Unraveling the diversity of eukaryotic microplankton in a large and deep perialpine lake using a high throughput sequencing approach. Front. Microbiol. 2020, 11, 789. [Google Scholar] [CrossRef]
- Babaei, M.; Tayemeh, M.B.; Jo, M.S.; Yu, I.J.; Johari, S.A. Trophic transfer and toxicity of silver nanoparticles along a phytoplankton-zooplankton-fish food chain. Sci. Total Environ. 2022, 842, 156807. [Google Scholar] [CrossRef]
- Rees, H.C.; Maddison, B.C.; Middleditch, D.J.; Patmore, J.R.; Gough, K.C. The detection of aquatic animal species using environmental DNA–a review of eDNA as a survey tool in ecology. J. Appl. Ecol. 2014, 51, 1450–1459. [Google Scholar] [CrossRef]
- Mächler, E.; Little, C.J.; Wüthrich, R.; Alther, R.; Fronhofer, E.A.; Gounand, I.; Harvey, E.; Hürlemann, S.; Walser, J.C.; Altermatt, F. Assessing different components of diversity across a river network using eDNA. Environ. DNA 2019, 1, 290–301. [Google Scholar] [CrossRef]
- Thomsen, P.F.; Willerslev, E. Environmental DNA-An emerging tool in conservation for monitoring past and present biodiversity. Biol. Conserv. 2015, 183, 4–18. [Google Scholar] [CrossRef]
- Harrison, J.B.; Sunday, J.M.; Rogers, S.M. Predicting the fate of eDNA in the environment and implications for studying biodiversity. Proc. R. Soc. B 2019, 286, 20191409. [Google Scholar] [CrossRef] [PubMed]
- Coble, A.A.; Flinders, C.A.; Homyack, J.A.; Penaluna, B.E.; Cronn, R.C.; Weitemier, K. eDNA as a tool for identifying freshwater species in sustainable forestry: A critical review and potential future applications. Sci. Total Environ. 2019, 649, 1157–1170. [Google Scholar] [CrossRef] [PubMed]
- Li, Y.; Miao, Y.; Zhang, W.; Yang, N.; Niu, L.; Zhang, H.; Wang, L. Sertraline inhibits top-down forces (predation) in microbial food web and promotes nitrification in sediment. Environ. Pollut. 2020, 267, 115580. [Google Scholar] [CrossRef] [PubMed]
- Sengupta, M.E.; Hellström, M.; Kariuki, H.C.; Olsen, A.; Thomsen, P.F.; Mejer, H.; Willerslev, E.; Mwanje, M.T.; Madsen, H.; Kristensen, T.K.; et al. Environmental DNA for improved detection and environmental surveillance of schistosomiasis. Proc. Natl. Acad. Sci. USA 2019, 116, 8931–8940. [Google Scholar] [CrossRef] [PubMed]
- Bae, M.J.; Chon, T.S.; Park, Y.S. Characterizing differential responses of benthic macroinvertebrate communities to floods and droughts in three different stream types using a Self-Organizing Map. Ecohydrology 2014, 7, 115–126. [Google Scholar] [CrossRef]
- Zhan, A.; Hulák, M.; Sylvester, F.; Huang, X.; Adebayo, A.A.; Abbott, C.L.; Adamowicz, S.J.; Heath, D.D.; Cristescu, M.E.; MacIsaac, H.J. High sensitivity of 454 pyrosequencing for detection of rare species in aquatic communities. Methods Ecol. Evol. 2013, 4, 558–565. [Google Scholar] [CrossRef]
- Fernández, S.; Rodríguez, S.; Martínez, J.L.; Borrell, Y.J.; Ardura, A.; García-Vázquez, E. Evaluating freshwater macroinvertebrates from eDNA metabarcoding: A river Nalón case study. PLoS ONE 2018, 13, e0201741. [Google Scholar] [CrossRef] [PubMed]
- Baird, R.B.; Rice, E.W.; Eaton, A.D. Standard Methods for the Examination of Water and Wastewater, 23rd ed.; American Public Health Association, American Water Works Association, and Water Environment Federation: Washington, DC, USA, 2017. [Google Scholar]
- Petersen, W.T.; Keister, J.E. Interannual variability in copepod community composition at a coastal station in the northern California Current: A multivariate approach. Deep. Sea Res. Part II Top. Stud. Oceanogr. 2003, 50, 2499–2517. [Google Scholar] [CrossRef]
- Roberts, D.W. Labdsv: Ordination and Multivariate Analysis for Ecology. R Package Version 1.4–1. 2010. Available online: https://cran.r-project.org/ (accessed on 12 December 2021).
- Baker, M.E.; King, R.S. A new method for detecting and interpreting biodiversity and ecological community thresholds. Methods Ecol. Evol. 2010, 1, 25–37. [Google Scholar] [CrossRef]
- Firmiano, K.R.; Ligeiro, R.; Macedo, D.R.; Juen, L.; Hughes, R.M.; Callisto, M. Mayfly bioindicator thresholds for several anthropogenic disturbances in neotropical savanna streams. Ecol. Indic. 2017, 74, 276–284. [Google Scholar] [CrossRef]
- Porter-Goff, E.R.; Frost, P.C.; Xenopoulos, M.A. Changes in riverine benthic diatom community structure along a chloride gradient. Ecol. Indic. 2013, 32, 97–106. [Google Scholar] [CrossRef]
- Schröder, M.; Sondermann, M.; Sures, B.; Hering, D. Effects of salinity gradients on benthic invertebrate and diatom communities in a German lowland river. Ecol. Indic. 2015, 57, 236–248. [Google Scholar] [CrossRef]
- King, R.S.; Scoggins, M.; Porras, A. Stream biodiversity is disproportionately lost to urbanization when flow permanence declines: Evidence from southwestern North America. Freshw. Sci. 2016, 35, 340–352. [Google Scholar] [CrossRef]
- King, R.S.; Richardson, C.J. Integrating bioassessment and ecological risk assessment: An approach to developing numerical water-quality criteria. Environ. Manag. 2003, 31, 795–809. [Google Scholar] [CrossRef] [PubMed]
- Kail, J.; Arle, J.; Jähnig, S.C. Limiting factors and thresholds for macroinvertebrate assemblages in European rivers: Empirical evidence from three datasets on water quality, catchment urbanization, and river restoration. Ecol. Indic. 2012, 18, 63–72. [Google Scholar] [CrossRef]
- Zhao, Q.; Guo, F.; Zhang, Y.; Ma, S.; Jia, X.; Meng, W. How sulfate-rich mine drainage affected aquatic ecosystem degradation in northeastern China, and potential ecological risk. Sci. Total Environ. 2017, 609, 1093–1102. [Google Scholar] [CrossRef]
- Bálint, M.; Pfenninger, M.; Grossart, H.P.; Taberlet, P.; Vellend, M.; Leibold, M.A.; Englund, G.; Bowler, D. Environmental DNA time series in ecology. Trends Ecol. Evol. 2018, 33, 945–957. [Google Scholar] [CrossRef] [PubMed]
- Gad, M.; Hou, L.; Li, J.; Wu, Y.; Rashid, A.; Chen, N.; Hu, A. Distinct mechanisms underlying the assembly of microeukaryotic generalists and specialists in an anthropogenically impacted river. Sci. Total Environ. 2020, 748, 141434. [Google Scholar] [CrossRef]
- Bai, X.; Shen, W.; Wang, P.; Chen, X.; He, Y. Response of non-point source pollution loads to land use change under different precipitation scenarios from a future perspective. Water Resour. Manag. 2020, 34, 3987–4002. [Google Scholar] [CrossRef]
- Leempoel, K.; Hebert, T.; Hadly, E.A. A comparison of eDNA to camera trapping for assessment of terrestrial mammal diversity. Proc. R. Soc. B Biol. Sci. 2020, 287, 20192353. [Google Scholar] [CrossRef]
- Elbrecht, V.; Vamos, E.E.; Meissner, K.; Aroviita, J.; Leese, F. Assessing strengths and weaknesses of DNA metabarcoding-based macroinvertebrate identification for routine stream monitoring. Methods Ecol. Evol. 2017, 8, 1265–1275. [Google Scholar] [CrossRef]
- Lyet, A.; Pellissier, L.; Valentini, A.; Dejean, T.; Hehmeyer, A.; Naidoo, R. eDNA sampled from stream networks correlates with camera trap detection rates of terrestrial mammals. Sci. Rep. 2021, 11, 11362. [Google Scholar] [CrossRef]
- Hao, Z.; Gao, Y.; Green, S.M.; Wen, X.; Yang, J.; Xiong, B.; Quine, T.A.; He, N. Chemical characteristics of flow driven by rainfall and associated impacts on shallow groundwater quality in a Karst watershed, Southwest China. Environ. Process. 2021, 8, 615–636. [Google Scholar] [CrossRef]
- Cannon, M.V.; Hester, J.; Shalkhauser, A.; Chan, E.R.; Logue, K.; Small, S.T.; Serre, D. In silico assessment of primers for eDNA studies using PrimerTree and application to characterize the biodiversity surrounding the Cuyahoga River. Sci. Rep. 2016, 6, 22908. [Google Scholar] [CrossRef] [PubMed]
- Buxton, A.S.; Groombridge, J.J.; Zakaria, N.B.; Griffiths, R.A. Seasonal variation in environmental DNA in relation to population size and environmental factors. Sci. Rep. 2017, 7, 46294. [Google Scholar] [CrossRef] [PubMed]
- Curtis, A.N.; Tiemann, J.S.; Douglass, S.A.; Davis, M.A.; Larson, E.R. High stream flows dilute environmental DNA (eDNA) concentrations and reduce detectability. Divers. Distrib. 2021, 27, 1918–1931. [Google Scholar] [CrossRef]
- Van Bochove, K.; Bakker, F.T.; Beentjes, K.K.; Hemerik, L.; Vos, R.A.; Gravendeel, B. Organic matter reduces the amount of detectable environmental DNA in freshwater. Ecol. Evol. 2020, 10, 36447–43654. [Google Scholar] [CrossRef]
- Lee, K.L.; Choi, J.S.; Lee, J.H.; Jung, K.Y.; Kim, H.S. Response of epilithic diatom assemblages to weir construction on the Nakdong River, Republic of Korea. Ecol. Indic. 2021, 126, 107711. [Google Scholar] [CrossRef]
- Sales, N.G.; Wangensteen, O.S.; Carvalho, D.C.; Deiner, K.; Præbel, K.; Coscia, I.; McDevitt, A.D.; Mariani, S. Space-time dynamics in monitoring neotropical fish communities using eDNA metabarcoding. Sci. Total Environ. 2021, 754, 142096. [Google Scholar] [CrossRef]
- Pace, M.L.; Carepenter, S.R.; Cole, J.J. With and without warning: Managing ecosystems in a changing world. Front. Ecol. Environ. 2015, 13, 460–467. [Google Scholar] [CrossRef]
- Sugihara, G.; May, R.; Ye, H.; Hsieh, C.H.; Deyle, E.; Fogarty, M.; Munch, S. Detecting causality in complex ecosystems. Science 2012, 338, 496–500. [Google Scholar] [CrossRef]
- Dornelas, M.; Magurran, A.E.; Buckland, S.T.; Chao, A.; Chazdon, R.L.; Colwell, R.K.; Curtis, T.; Gaston, K.J.; Gotelli, N.J.; Kosnik, M.A.; et al. Quantifying temporal change in biodiversity: Challenges and opportunities. Proc. Biol. Sci. 2013, 280, 20121931. [Google Scholar] [CrossRef]
- Carraro, L.; Mächler, E.; Wüthrich, R.; Altermatt, F. Environmental DNA allows upscaling spatial patterns of biodiversity in freshwater ecosystems. Nat. Commun. 2020, 11, 3585. [Google Scholar] [CrossRef] [PubMed]
- Bae, M.J.; Ham, S.N.; Lee, Y.K.; Kim, E.J. Evaluation of benthic macroinvertebrate diversity in a stream of abandoned mine land based on environmental DNA (eDNA) approach. Korean J. Ecol. Environ. 2021, 54, 221–228. [Google Scholar] [CrossRef]
- Tzafesta, E.; Zangaro, F.; Specchia, V.; Pinna, M. An overview of DNA-based applications for the assessment of benthic macroinvertebrates biodiversity in mediterranean aquatic ecosystems. Diversity 2021, 13, 112. [Google Scholar] [CrossRef]
- Dowle, E.J.; Pochon, X.C.; Banks, J.; Shearer, K.; Wood, S.A. Targeted gene enrichment and high-throughput sequencing for environmental biomonitoring: A case study using freshwater macroinvertebrates. Mol. Ecol. Resour. 2016, 16, 1240–1254. [Google Scholar] [CrossRef] [PubMed]
- Pereira-da-Conceicoa, L.; Elbrecht, V.; Hall, A.; Briscoe, A.; Barber-James, H.; Price., B. Metabarcoding unsorted kick-samples facilitates macroinvertebrate-based biomonitoring with increased taxonomic resolution, while outperforming environmental DNA. Environ. DNA 2021, 3, 353–371. [Google Scholar] [CrossRef]


| Environmental Factors | Abbreviation | SJ | MG |
|---|---|---|---|
| Water temperature (°C) | WT | 16.53 (7.32) | 18.93 (7.77) |
| Dissolved oxygen (mg/L) | DO | 10.09 (2.32) | 10.38 (2.24) |
| Biochemical oxygen demand (mg/L) | BOD | 1.45 (0.58) | 1.85 (0.57) |
| Chemical oxygen demand (mg/L) | COD | 5.06 (0.90) | 6.13 (1.29) |
| Suspended solid | SS | 8.30 (5.96) | 12.84 (24.55) |
| Total nitrogen (mg/L) | TN | 2.16 (0.54) | 2.54 (0.67) |
| Total Phosphorus (mg/L) | TP | 0.034 (0.017) | 0.040 (0.021) |
| Total organic carbon | TOC | 3.96 (0.60) | 4.48 (0.81) |
| pH | - | 7.79 (0.56) | 7.98 (0.43) |
| Electric conductivity (µS/cm) | Conductivity | 220.96 (24.91) | 290.11 (110.34) |
| Dissolved total nitrogen (mg/L) | DTN | 2.09 (0.56) | 2.40 (0.69) |
| Ammonia (mg/L) | NH3 | 0.04 (0.02) | 0.06 (0.03) |
| Nitrate (mg/L) | NO3– | 1.69 (0.49) | 1.87 (0.65) |
| Dissolved total phosphorus (mg/L) | DTP | 0.030 (0.015) | 0.030 (0.019) |
| Orthophosphate (mg/L) | PO43– | 0.011 (0.015) | 0.014 (0.019) |
| Chlorophyll-a (mg/L) | Chla | 15.35 (10.57) | 23.8 (16.46) |
| Precipitation (mm) | - | 121.18 (139.83) | 162.47 (170.78) |
| SJ | NMDS1 | NMDS2 | R2 | p | MG | NMDS1 | NMDS2 | R2 | p |
|---|---|---|---|---|---|---|---|---|---|
| WT | −0.61 | −0.79 | 0.61 | 0.001 | WT | 0.99 | 0.12 | 0.71 | 0.001 |
| DO | 0.43 | 0.90 | 0.55 | 0.001 | DO | −0.98 | −0.18 | 0.43 | 0.002 |
| BOD | −0.71 | 0.71 | 0.28 | 0.02 | BOD | 0.77 | 0.64 | 0.03 | 0.672 |
| COD | −0.26 | −0.97 | 0.05 | 0.553 | COD | 0.62 | 0.79 | 0.37 | 0.004 |
| SS | 0.44 | −0.90 | 0.13 | 0.171 | SS | 0.22 | 0.98 | 0.22 | 0.028 |
| TN | 0.98 | −0.20 | 0.58 | 0.001 | TN | −0.87 | −0.50 | 0.63 | 0.001 |
| TP | 0.03 | −1.00 | 0.23 | 0.048 | TP | 0.54 | 0.84 | 0.37 | 0.005 |
| TOC | −0.25 | −0.97 | 0.05 | 0.492 | TOC | 0.64 | 0.77 | 0.29 | 0.017 |
| pH | −0.08 | 1.00 | 0.16 | 0.108 | pH | 0.69 | −0.73 | 0.03 | 0.731 |
| Conductivity | −0.02 | 1.00 | 0.30 | 0.015 | Conductivity | −0.69 | −0.72 | 0.73 | 0.001 |
| DTN | 0.98 | −0.19 | 0.59 | 0.001 | DTN | −0.86 | −0.51 | 0.64 | 0.001 |
| NH3 | 0.52 | −0.85 | 0.04 | 0.637 | NH3 | 1.00 | −0.06 | 0.01 | 0.925 |
| NO3- | 0.96 | −0.27 | 0.47 | 0.002 | NO3- | −0.87 | −0.49 | 0.61 | 0.001 |
| DTP | −0.05 | −1.00 | 0.21 | 0.056 | DTP | 0.38 | 0.92 | 0.35 | 0.003 |
| PO43– | 0.11 | −0.99 | 0.31 | 0.014 | PO43− | 0.40 | 0.92 | 0.42 | 0.003 |
| Chla | −0.11 | 0.99 | 0.11 | 0.216 | Chla | −0.11 | 0.99 | 0.12 | 0.2 |
| Precipitation | −0.06 | −1.00 | 0.60 | 0.001 | Precipitation | 0.59 | 0.81 | 0.41 | 0.005 |
| Group | Taxonomic Group | Phylum | Class | Genus | IndVal | p-Value |
|---|---|---|---|---|---|---|
| 2 | Fungi | Chytridiomycota | Lobulomycetaceae | Alogomyces | 0.50 | 0.018 |
| 2 | Fungi | Chytridiomycota | Aquamycetaceae | Aquamyces | 0.47 | 0.022 |
| 2 | Fungi | Chytridiomycota | Undefined | Delfinachytrium | 0.40 | 0.046 |
| 2 | Fungi | Oomycota | Lagenidiaceae | Lagenidium | 0.87 | 0.002 |
| 2 | Metazoa | Rotifera | Brachionidae | Keratella | 0.69 | 0.001 |
| 2 | Metazoa | Rotifera | Filinidae | Filinia | 0.40 | 0.021 |
| 2 | Microalgae | Chlorophyta | Sphaeropleaceae | Atractomorpha | 0.98 | 0.001 |
| 2 | Microalgae | Chlorophyta | Dunaliellaceae | Hafniomonas | 0.93 | 0.001 |
| 2 | Microalgae | Chlorophyta | Golenkiniaceae | Golenkinia | 0.80 | 0.025 |
| 2 | Microalgae | Chlorophyta | Haematococcaceae | Gungnir | 0.76 | 0.002 |
| 2 | Microalgae | Chlorophyta | Chlamydomonadaceae | Gloeomonas | 0.52 | 0.018 |
| 2 | Microalgae | Chlorophyta | Bracteacoccaceae | Bracteacoccus | 0.47 | 0.033 |
| 2 | Protist | Cercozoa | Undefined | Gymnophrys | 0.40 | 0.034 |
| 2 | Protist | Ciliophora | Urostylidae | Perisincirra | 0.80 | 0.001 |
| 2 | Protist | Ciliophora | Bryometopidae | Bryometopus | 0.56 | 0.036 |
| 2 | Protist | Ciliophora | Spirofilidae | Hypotrichidium | 0.44 | 0.016 |
| 3 | Microalgae | Bacillariophyta | Acanthocerataceae | Acanthoceras | 0.75 | 0.016 |
| 3 | Microalgae | Bacillariophyta | Stephanodiscaceae | Cyclostephanos | 0.50 | 0.012 |
| 3 | Microalgae | Bacillariophyta | Thalassiosiraceae | Thalassiosiraceae_F | 0.50 | 0.013 |
| 3 | Microalgae | Bacillariophyta | Thalassiosiraceae | Stephanocyclus | 0.44 | 0.037 |
| 3 | Microalgae | Chlorophyta | Dunaliellaceae | Dunaliellaceae_F | 0.65 | 0.005 |
| 3 | Microalgae | Chlorophyta | Chlamydomonadaceae | Dangeardinia | 0.50 | 0.007 |
| 3 | Microalgae | Chlorophyta | Volvocaceae | Gonium | 0.50 | 0.006 |
| 3 | Protist | Ciliophora | Spathidiidae | Epispathidium | 0.47 | 0.02 |
| 3 | Protist | Haptista | Raphidiophryidae | Raphidiophrys | 0.48 | 0.014 |
| 4 | Fungi | Basidiomycota | Mrakiaceae | Udeniomyces | 0.57 | 0.006 |
| 4 | Fungi | Chytridiomycota | Spizellomycetaceae | Gaertneriomyces | 0.72 | 0.001 |
| 4 | Microalgae | Chlorophyta | Chlorococcaceae | Spongiococcum | 0.40 | 0.03 |
| 4 | Microalgae | Chlorophyta | Chlorellaceae | Carolibrandtia | 0.40 | 0.029 |
| 4 | Microalgae | Chlorophyta | Undefined | Fernandinella | 0.40 | 0.027 |
| 4 | Microalgae | Streptophyta | Closteriaceae | Closterium | 0.46 | 0.027 |
| 4 | Protist | Cercozoa | Undefined | Glissomonadida_O | 0.68 | 0.031 |
| 4 | Protist | Ciliophora | Nassulidae | Obertrumia | 0.74 | 0.004 |
| 4 | Protist | Ciliophora | Climacostomidae | Climacostomum | 0.40 | 0.029 |
| 4 | Protist | Ciliophora | Trachelophyllidae | Enchelyodon | 0.40 | 0.017 |
| 4 | Protist | Ciliophora | Orchitophryidae | Orchitophryidae_F | 0.40 | 0.028 |
| 4 | Protist | Ciliophora | Undefined | Stichotrichida_O | 0.40 | 0.03 |
| 4 | Protist | Imbricatea | Undefined | Thaumatomonadida_O | 0.91 | 0.003 |
| Group | Taxonomic Group | Phylum | Class | Genus | IndVal | p-Value |
|---|---|---|---|---|---|---|
| 1 | Metazoa | Arthropoda | Hexanauplia | Thermocyclops | 0.60 | 0.01 |
| 2 | Fungi | Chytridiomycota | Chytridiomycetes | Chytriomycetaceae_F | 0.60 | 0.008 |
| 2 | Fungi | Chytridiomycota | Chytridiomycetes | Aquamyces | 0.44 | 0.049 |
| 2 | Fungi | Chytridiomycota | Chytridiomycetes | Staurastromyces | 0.40 | 0.05 |
| 2 | Fungi | Oomycota | Undefined | Lagenidium | 0.60 | 0.027 |
| 2 | Metazoa | Arthropoda | Hexanauplia | Mesocyclops | 0.66 | 0.016 |
| 2 | Metazoa | Mollusca | Bivalvia | Aculamprotula | 0.59 | 0.029 |
| 2 | Metazoa | Platyhelminthes | Rhabditophora | Mesostoma | 0.40 | 0.037 |
| 2 | Microalgae | Chlorophyta | Chlorophyceae | Chlamydopodium | 0.87 | 0.001 |
| 2 | Microalgae | Chlorophyta | Chlorophyceae | Golenkinia | 0.67 | 0.005 |
| 2 | Microalgae | Chlorophyta | Chlorophyceae | Planktosphaeria | 0.56 | 0.042 |
| 2 | Microalgae | Chlorophyta | Chlorophyceae | Chlorococcaceae_F | 0.40 | 0.05 |
| 2 | Protist | Cercozoa | Undefined | Bodomorpha | 0.53 | 0.017 |
| 2 | Protist | Cercozoa | Undefined | Paracercomonas | 0.50 | 0.041 |
| 2 | Protist | Ciliophora | Nassophorea | Obertrumia | 0.67 | 0.015 |
| 2 | Protist | Ciliophora | Oligohymenophorea | Ichthyophthirius | 0.67 | 0.018 |
| 2 | Protist | Ciliophora | Spirotrichea | Perisincirra | 0.60 | 0.01 |
| 2 | Protist | Ciliophora | Colpodea | Cyrtolophosis | 0.58 | 0.031 |
| 2 | Protist | Ciliophora | Oligohymenophorea | Ophryoglena | 0.50 | 0.015 |
| 2 | Protist | Ciliophora | Heterotrichea | Stentor | 0.47 | 0.029 |
| 2 | Protist | Haptista | Centroplasthelida | Choanocystis | 0.43 | 0.048 |
| 2 | Protist | Tubulinea | Echinamoebida | Echinamoeba | 0.68 | 0.002 |
| 3 | Fungi | Chytridiomycota | Chytridiomycetes | Pendulichytrium | 0.67 | 0.009 |
| 3 | Fungi | Chytridiomycota | Chytridiomycetes | Uebelmesseromyces | 0.59 | 0.004 |
| 3 | Fungi | Chytridiomycota | Chytridiomycetes | Dangeardia | 0.48 | 0.029 |
| 3 | Metazoa | Arthropoda | Hexanauplia | Microcyclops | 0.73 | 0.004 |
| 3 | Metazoa | Arthropoda | Hexanauplia | Eucyclops | 0.48 | 0.038 |
| 3 | Metazoa | Mollusca | Bivalvia | Corbicula | 0.53 | 0.037 |
| 3 | Metazoa | Rotifera | Eurotatoria | Trichocerca | 0.63 | 0.025 |
| 3 | Metazoa | Rotifera | Eurotatoria | Ascomorpha | 0.49 | 0.042 |
| 3 | Metazoa | Rotifera | Eurotatoria | Collotheca | 0.47 | 0.05 |
| 3 | Microalgae | Streptophyta | Zygnemophyceae | Closterium | 0.73 | 0.004 |
| 3 | Protist | Cercozoa | Undefined | Cercomonadida_O | 0.41 | 0.034 |
| 4 | Fungi | Chytridiomycota | Chytridiomycetes | Gaertneriomyces | 0.60 | 0.003 |
| 4 | Fungi | Chytridiomycota | Chytridiomycetes | Rhopalophlyctis | 0.49 | 0.03 |
| 4 | Metazoa | Rotifera | Eurotatoria | Notholca | 0.40 | 0.045 |
| 4 | Microalgae | Bacillariophyta | Fragilariophyceae | Ulnaria | 0.87 | 0.004 |
| 4 | Microalgae | Bacillariophyta | Fragilariophyceae | Asterionella | 0.79 | 0.016 |
| 4 | Microalgae | Bacillariophyta | Fragilariophyceae | Tabellaria | 0.33 | 0.033 |
| 4 | Microalgae | Chlorophyta | Chlorophyceae | Microglena | 0.76 | 0.005 |
| 4 | Microalgae | Chlorophyta | Chlorophyceae | Dangeardinia | 0.40 | 0.038 |
| 4 | Microalgae | Chlorophyta | Chlorophyceae | Basichlamys | 0.39 | 0.033 |
| 4 | Microalgae | Streptophyta | Zygnemophyceae | Tortitaenia | 0.48 | 0.047 |
| 4 | Protist | Imbricatea | Undefined | Esquamula | 0.40 | 0.031 |
| Sites | Sum (z) | CP | 0.05 | 0.1 | 0.5 | 0.9 | 0.95 |
|---|---|---|---|---|---|---|---|
| SJ | sum (z−) | 75.6 | 27.89 | 30.3 | 75.6 | 77.05 | 81.15 |
| sum (z+) | 80.35 | 77.05 | 80.35 | 91.25 | 164.95 | 173.9 | |
| MG | sum (z−) | 123.3 | 100.75 | 102.65 | 123.3 | 127.95 | 137.88 |
| sum (z+) | 139.3 | 121.9 | 124.9 | 136.3 | 253.3 | 284.35 |
Publisher’s Note: MDPI stays neutral with regard to jurisdictional claims in published maps and institutional affiliations. |
© 2022 by the authors. Licensee MDPI, Basel, Switzerland. This article is an open access article distributed under the terms and conditions of the Creative Commons Attribution (CC BY) license (https://creativecommons.org/licenses/by/4.0/).
Share and Cite
Bae, M.-J.; Yang, T.; Cho, J.-Y.; Baek, K.; Choi, A.; Lee, C.S.; Kim, E.-J. Seasonal Dynamics and Heavy Rain Effects on the Diversity of Microeukaryome in the Nakdonggang River. Water 2022, 14, 3407. https://doi.org/10.3390/w14213407
Bae M-J, Yang T, Cho J-Y, Baek K, Choi A, Lee CS, Kim E-J. Seasonal Dynamics and Heavy Rain Effects on the Diversity of Microeukaryome in the Nakdonggang River. Water. 2022; 14(21):3407. https://doi.org/10.3390/w14213407
Chicago/Turabian StyleBae, Mi-Jung, Taehui Yang, Ja-Young Cho, Kiwoon Baek, Ahyoung Choi, Chang Soo Lee, and Eui-Jin Kim. 2022. "Seasonal Dynamics and Heavy Rain Effects on the Diversity of Microeukaryome in the Nakdonggang River" Water 14, no. 21: 3407. https://doi.org/10.3390/w14213407
APA StyleBae, M.-J., Yang, T., Cho, J.-Y., Baek, K., Choi, A., Lee, C. S., & Kim, E.-J. (2022). Seasonal Dynamics and Heavy Rain Effects on the Diversity of Microeukaryome in the Nakdonggang River. Water, 14(21), 3407. https://doi.org/10.3390/w14213407