Abstract
Rapid and cost-effective eDNA-based approaches are valuable for understanding biological communities and monitoring the biodiversity of inaccessible areas, such as large rivers and lakes. To determine temporal dynamics and precipitation effects on micro-eukaryotic assemblages, we monitored upstream (SJ) and downstream (MG) sites of the Nakdonggang River, monthly or bimonthly, from March 2019 to April 2021 using an eDNA metabarcoding technique. We observed 775 unique operational taxonomic units during the entire sampling period using the V4 region of the 18S rRNA gene as a marker. In the cluster analysis and non-metric multidimensional scaling analysis based on the relative abundance ratio of the micro-eukaryotic assemblages at the SJ and MG sites, respectively, both regions were classified by four seasons, with dominant taxa for each season being different. Whereas Chlorophyta was relatively abundant in the MG site during summer, diatoms were most abundant at the SJ site during winter. Further, metazoan taxa were relatively abundant at the MG site. Total detection of metazoa, protozoa, and microalgae taxa significantly increased with heavy rainfall. In addition, the indicator taxa representative for heavy rainfall and tolerance ranges of the amount of precipitation were predicted at both sites. As the frequency of drought and heavy rain is expected to increase owing to climate change, efforts to standardize the relation between precipitation and eDNA analysis are required.
1. Introduction
The structure and distribution of biological communities in freshwater ecosystems are highly influenced by combined or interacting factors related to natural (e.g., heavy rain and drought) and anthropogenic (e.g., land use change and eutrophication) disturbances. Changes in hydrological regimes caused by heavy rain generally decrease species richness in freshwater habitats, such as streams, rivers, and lakes, because the species that are especially vulnerable to flow rate changes could flow downstream from their own habitats [1]. However, heavy rain can occasionally increase species richness by introducing new species from upstream or riparian areas via drift or inflow [2]. The influx of nitrogenous or phosphorus compounds from nonpoint source inputs is also a major factor driving changes in freshwater biodiversity [3,4,5]. The increase in the influx of nitrogenous or phosphorus compounds from the external environment due to land use change (e.g., agriculture, urbanization, etc.) near freshwater ecosystems [6] or precipitation sludge [7] could affect freshwater biodiversity by causing harmful algal blooms and hypoxic conditions [8,9,10].
The ecological community of micro-eukaryotic organisms, comprised of phytoplankton, microzooplankton, fungi, and even tiny metazoan taxa, plays a crucial role in maintaining the structural and functional diversity of freshwater ecosystems as the central linkages for energy flow and material circulation [11]. Some eukaryotic freshwater species, such as benthic macroinvertebrates, microzooplankton, and phytoplankton, have also been used as bioindicators to evaluate water quality and ecosystem health. Moreover, the importance of these indicator species has gradually been emphasized in various studies to investigate and predict changes in biodiversity due to natural or anthropogenic disturbances [12,13]. The composition of micro-eukaryotic assemblages has been reported to fluctuate according to variations in environmental factors, which are highly correlated with seasonal dynamics [14]. Phytoplanktons are the most fundamental producers in the aquatic food chain and closely related to heterotrophic organisms (e.g., zooplankton and invertebrates) through organic and inorganic material transfer [14,15]. Moreover, phytoplankton and heterotroph communities are usually repositioned or changed during seasonal variations, because conditions of their growth are strongly associated with environmental factors (i.e., the inflow of nitrogenous and phosphorus compounds, changes in discharge, etc.) of freshwater systems.
Field survey procedures for multiple taxa require taxon-specific sample collection methods (e.g., Surber net for macroinvertebrates, plankton net for microzooplankton and phytoplankton). However, these time-consuming processes can be surmountable by using environmental DNA (eDNA) metabarcoding techniques, in which genetic materials derived from multiple taxa can be extracted from an environmental sample (e.g., water or sediment) at once [16]. Thus, the eDNA-based metabarcoding approach to determine micro-eukaryotic assemblages is attracting attention as a convenient method for evaluating the current status of freshwater ecosystems [17]. This technique has the advantage of relatively rapid and easy sampling and minimizing habitat destruction compared to the traditional field survey method employing morphology classification [18,19,20]. This technology is expected to expand in the future owing to its high applicability to several pending ecological issues (e.g., biodiversity assessment and detection of endangered or invasive species), especially for micro-eukaryotic organisms that are not easily detected based on morphology-based methods and are related to issues such as food web and material circulations [21]. In addition, it is expected that high-frequency sampling (e.g., monthly, weekly, daily, real-time) of micro-eukaryotic assemblages in freshwater ecosystems will become more feasible with the development of this rapid and cost-effective investigation technique [22].
To understand the seasonal dynamics and precipitation effects on micro-eukaryotic assemblages in freshwater ecosystems, we monitored the upstream and downstream sites of the Nakdonggang River monthly (or bimonthly) from March 2019 to April 2021 using an eDNA metabarcoding technique. We performed three major studies using eDNA assessment. First, we examined the relationship between the micro-eukaryotic assemblages and the amount of precipitation. Second, we attempted to determine whether seasonal differences occur in the micro-eukaryotic assemblages. Lastly, we observed the effect of heavy rainfall on eDNA signals for each taxon. We expected that our results can be applied to establish management policies for streams. As eDNA metabarcoding has many advantages, it is necessary to improve the analytical procedure in the future by accumulating data obtained under various environmental conditions. Finally, we tried to select indicator species for each season and analyze the relationship between the appearance of indicator species and precipitation level. Therefore, we examined whether these indicator species could change according to the variations in precipitation patterns in response to climate change.
2. Materials and Methods
2.1. Study Area
The study sites were located in the Nakdonggang River, which is the longest river (510.4 km) in South Korea. The watershed area of the Nakdonggang River is approximately 23,609.3 km2, which accounts for one-fourth of the entire area of South Korea (The Ministry of Environment in Korea; https://www.me.go.kr/, accessed on 15 April 2021). Eight multifunctional weirs (Sangju, Nakdan, Gumi, Chilgok, Gangjeong-Goryeong, Dalseong, Hapcheon-Changnyeong, and Changnyeong-Haman) have been constructed and are currently operational.
The average annual precipitation of the study area for 10 years (2009~2018) was 1156.7 (800.3–1563.7 mm) and 1510.1 mm (720.5–1892.5 mm) at the upstream of Sangju Weir (SJ) and downstream of Changnyeong-Haman Weir (MG), respectively (Korea Meteorological Administration, http://www.kma.go.kr, accessed on 28 May 2021). More than 50% of the annual precipitation (631.3 mm and 774.3 mm) occurs from July to September, whereas less than 7% of the precipitation (78.1 mm and 109.6 mm) occurs during the winter season (December to February) [23]. The SJ site is located in a relatively upstream region (i.e., 37.2°N latitude) of the Nakdonggang River, whereas the MG site is located in the downstream area (i.e., 35.1° N latitude). In addition, regional differences (e.g., land use) between the two sites can affect the differences in the micro-eukaryotic assemblage composition. The relative ratio of land use in the riparian area between the SJ and MG sites is highly distinct (Figure S1). At the SJ site, the proportion of the forest was the highest at 44.69%, followed by that of agriculture (24.53%), bareland (22.82%), wetland (2.29%), and grassland (10.03%), whereas at the MG site, the proportion of agriculture was the most dominant at 71.70%, followed by that of forest (18.14%), bareland (1.26%), and grassland (0.66%).
2.2. Sampling and Ecological Data
We collected water samples, monthly or bimonthly, for conducting eDNA metabarcoding analysis at two sampling sites (i.e., the upstream of Sangju Weir: SJ, and the downstream of Changnyeong-Haman Weir: MG) in the Nakdonggang River from March 2019 to April 2021 (Figure 1).
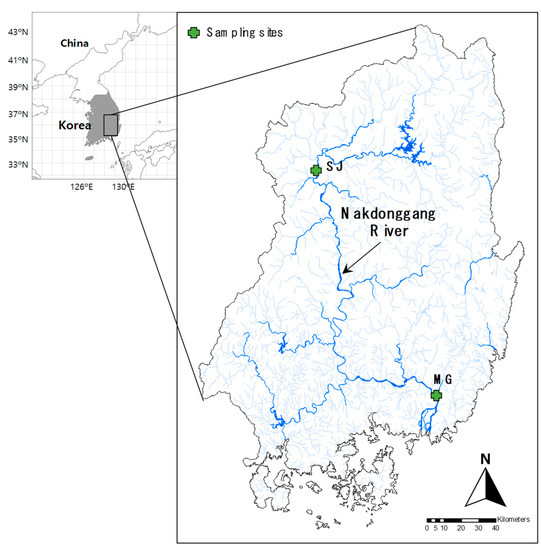
Figure 1.
Location of the sampling sites (upstream of Sangju Weir, SJ; downstream of Changnyeong-Haman Weir, MG) in the Nakdonggang River, Korea.
Using sterile bottles at each site, we collected 6 L of water samples from the river. The water samples were vacuum filtered immediately using a Supor® 200 Membrane Filter (pore size: 0.2 μm; Pall Corporation, Ann Arbor, MI, USA), and then the filters were kept at –80 °C until DNA extraction. Total environmental DNA was extracted from the resulting filters using a PowerWater® DNA Isolation Kit (Qiagen, Hilden, Germany) according to the manufacturer’s instructions. Subsequently, the V4 region of the 18S rRNA gene (small ribosomal subunit) was PCR-amplified with the universal primer sets, Uni18SF and Uni18SR [24], to examine the microeukaryome, comprising metazoa, fungi, microalgae (i.e., autotrophic microeukaryotes), and protists. Sequencing analysis was conducted using Illumina MiSeq (Illumina, San Diego, CA, USA), and bioinformatic analysis was performed as described previously [25].
Eighteen environmental factors, such as water quality variables, discharge, and the amount of precipitation, were obtained from the open database of the Water Environment Information System supported by the Ministry of Environment and the National Institute of Environmental Research (http://water.nier.go.kr/, accessed on 20 June 2021) and the Korea Meteorological Administration (http://www.kma.go.kr, accessed on 28 May 2021) in South Korea (Table 1). Water temperature, dissolved oxygen, pH, and electric conductivity were measured during the field survey using YSI ProDSS (ESRI, Redlands, CA, USA). Other physicochemical factors such as biological oxygen demand (BOD), chemical oxygen demand (COD), suspended solids (SS), total nitrogen (TN), total phosphorus (TP), and total organic carbon (TOC) were measured in the laboratory using the method described by the American Public Health Association [26].

Table 1.
Average values and standard deviation of the environmental variables at the sampling sites.
2.3. Data Analysis
First, as descriptive measures, we compared the relationships between taxon richness and the amount of precipitation. Second, we characterized the temporal variation in micro-eukaryotic assemblages using non-metric multidimensional scaling (NMDS) with the Bray–Curtis distance measure. We applied multi-response permutation procedures to evaluate the significant differences among the four seasons (A = 0.01, p < 0.05). We used the ‘metaMDS’ and ‘envfit’ functions in the R program to find the lowest stress value (i.e., the best solution) and figure out the relationship between the axes of NMDS and environmental factors, respectively. Third, indicator species analysis was performed to identify the representative taxa in each season at the SJ and MG sites. In this analysis, we computed the indicator values (IndVal) of each taxon based on the relative abundance and occurrence frequency in the defined group (here, each season). The IndVal range from 0 (no indication) to 100 (all individuals of taxa are only observed in one group) [27]. The indicator taxa were determined if IndVal was higher than 25% and showed a significant difference (p < 0.05). We used a Monte Carlo permutation (9999 random permutations) to determine the significance of IndVal for each taxon. Indicator species analysis was performed using the function “indval” in the Labdsv package [28]. Lastly, Threshold Indicator Taxa Analysis (TITAN) [29], which has largely been used to evaluate the tolerance range according to the degree of natural disturbances [2] and anthropogenic disturbances [30,31,32,33], was applied to detect the change points in the response of eukaryote assemblages according to the precipitation gradient. Here, TITAN computes the thresholds based on the changing point along with the amount of precipitation for each taxon of micro-eukaryote [29,34,35,36]. TITAN discriminates between negative (z−) and positive (z+) species responses at change points in response to the amount of precipitation. To confirm the thresholds of the amount of precipitation for each taxon, we measured the purity (i.e., the matching proportion between the observed value and resampling value at changing points) and reliability (i.e., the proportion of significant p-values in the indicator values computed from resampling) based on the bootstrap technique (i.e., 500 resamples with replacement). The assemblage-level threshold (i.e., the coincident changing point of the entire assemblage structure [sum(z)]) was also computed after identifying the indicator species. We only used the taxa observed in more than three samples, based on the recommendations of Baker and King (2010). The TITAN was performed using the TITAN2 package [29] in R.
3. Results and Discussion
Through 18S rRNA gene-based meta-amplicon sequencing analysis, 775 unique operational taxonomic units (OTUs) were observed during the entire sampling period, ranging from 35 OTUs (May 2019 in the MG site) to 313 OTUs (July 2020 in the SJ site). Seasonal changes (i.e., spring, summer, autumn, and winter), as well as spatial differences in the micro-eukaryotic assemblages based on eDNA (e.g., the changes in relative abundances between the SJ and MG sites), were clearly noticeable in the Nakdonggang River basin between the SJ and MG sites. When comparing the cumulative values over the 2 years, at the SJ site, the relative ratio of microalgae was the highest at 47.43%, followed by that of protists (25.86%), metazoans (24.61%), and fungi (2.10%). However, at the MG site, the ratio of metazoans was the highest at 59.95%, followed by that of microalgae (22.97%), protists (14.38%), and fungi (2.70%).
Environmental DNA signals can reflect changes in the relative abundance of the micro-eukaryotic assemblages in response to climate factors, including seasonal variation and precipitation amount [37]. For example, up to 71% of the total annual precipitation from March 2019 to April 2021 was concentrated from summer to early autumn (i.e., from July to September). During these rainy seasons, the relative abundance of Chlorophyta in phytoplankton increased at both the SJ and MG sites (Figure 2). In contrast, during the winter season (i.e., from December to February), diatoms were highly abundant among the phytoplankton at the SJ site. Moreover, the relative abundance of metazoan taxa was higher in most seasons at the MG site than at the SJ site (Figure 2).
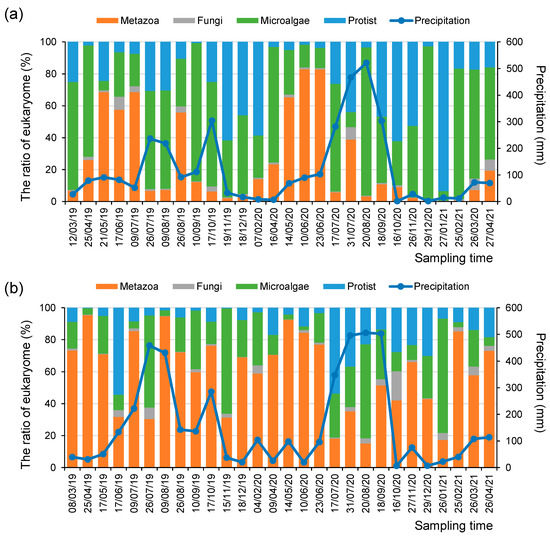
Figure 2.
Relative abundance ratios of micro-eukaryotic assemblages and the amount of monthly precipitation (mm) at the (a) SJ and (b) MG sites during the research periods.
Physicochemical factors are generally considered to be one of the primary causes of compositional changes in micro-eukaryotic assemblages in freshwater ecosystems [38]. Particularly, at both the SJ and MG sites, the concentrations of total phosphorus (TP) increased drastically to 0.067 mg/L (hypereutrophic) and 0.051 mg/L (eutrophic concentration), respectively, when the level of accumulated precipitation within 30 days became higher (i.e., more than 100 mm) during the rainy seasons (Figure S2). These observations suggest that phosphorus components in the soil around riparian areas could penetrate as nonpoint source input into the river water during the rainy seasons with high precipitation [39]. In contrast, total nitrogen (TN) showed no significant correlation with precipitation at the SJ site, whereas TN showed a tendency to be inversely proportional at the MG site (Figure S2). This indicated that the nitrogen sources were continuously accumulated in river water rather than being rapidly introduced by rainfall, as in the case of phosphorus, so that the concentration of TN in river water could be diluted when precipitation is concentrated over short periods.
Interestingly, at both the SJ and MG sites, the number of taxa determined using the eDNA metabarcoding assessments increased significantly with the increment in monthly precipitation (i.e., the accumulated precipitation within 30 days before the sampling time), irrespective of the taxonomic groups assessed (i.e., metazoan, fungi, microalgae, and protozoa) (Figure 3, Figure S3 and Figure S4). In particular, the number of detectable taxa was especially elevated when the monthly precipitation was higher than 200 mm. These results could be attributed to various reasons during the rainy season. First, heavy rainfall can induce the inflow of a higher quantity of eDNA from riparian areas, including soil-based eDNA, into rivers or catastrophic drift of organisms. Therefore, more diverse taxa could be detected through meta-barcoding analyses of the sampled water [40,41,42]. Second, heavy rainfall abruptly changes water discharge and depth; therefore, even the eDNA derived from benthic species could be more easily detectable in the sampled water [43].
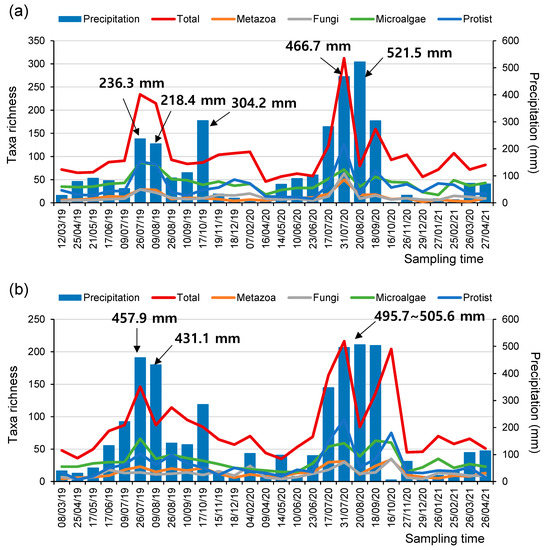
Figure 3.
The number of taxa in microeukaryome groups and the amount of monthly precipitation (mm) at the (a) SJ and (b) MG sites during the study periods.
At both the SJ and MK sites, the micro-eukaryotic assemblages were related to water temperature and the concentration of nitrogenous compounds, such as nitrate (Table 2). In addition, it also showed a higher significance with the amount of precipitation and concentration of orthophosphate.
Table 2.
Relationships between environmental factors and the non-metric multidimensional scaling (NMDS) ordination of micro-eukaryotic assemblages from eDNA metabarcoding. The meaning of abbreviations for the environmental variables is presented in Table 1.
NMDS based on data from the micro-eukaryotic assemblages at the SJ and MG sites highly reflected the seasonal differences (Figure 4). In the NMDS ordination from the SJ site, the first two axes (stress value = 10.4) had the strongest relationship with water temperature (R2 = 0.61, p < 0.001), followed by the amount of precipitation (R2 = 0.60, p < 0.001), DTN (R2 = 0.59, p < 0.001), TN (R2 = 0.58, p < 0.001), and DO (R2 = 0.55, p < 0.001) (Table 2). Most of the samples surveyed in autumn and winter were ordinated on the right side of NMDS1 with high values of TN, DTN, and nitrate (NO3−), whereas samples from summer with high values of precipitation, water temperature, TP, and orthophosphate (PO43−) were mainly ordinated on the lower part of NMDS2. In the NMDS ordination from the MG site, the first two axes (stress value = 12.2) had the strongest relationship with conductivity (R2 = 0.72, p < 0.001), followed by water temperature (R2 = 0.71, p < 0.001), DTN (R2 = 0.64, p < 0.001), TN (R2 = 0.63, p < 0.001), and nitrate (R2 = 0.61, p < 0.001). Samplings in spring and winter with high values of TN, nitrate, DTN, and conductivity were ordinated in the left and lower left parts of NMDS1 and NMDS2, respectively. In contrast, the samples from summer with high values of precipitation, orthophosphate, DTP, discharge, and TP were mainly ordinated in the right and upper-right parts of NMDS1 and NMDS2, respectively.
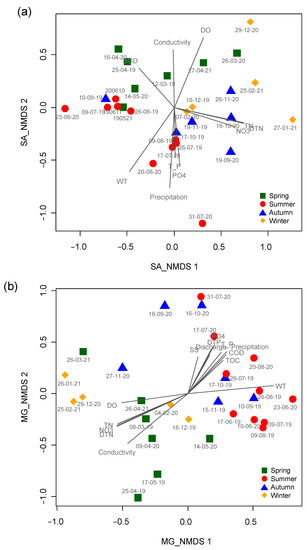
Figure 4.
Patterning the temporal changes in micro-eukaryotic assemblages using non-metric multidimensional scaling ordination. (a) SJ and (b) MG sites. Different colored symbols represent different seasons. Spring: green square; summer: red circle; autumn: blue triangle; and winter: yellow diamond. The gray lines correspond to environmental factors significantly related to assemblage composition. The longer the length, the higher the correlation magnitude (R). The meaning of abbreviations for the environmental variables is presented in Table 1.
Thirty-eight taxa from the SJ site and forty-four taxa from the MG site were selected as indicator species representative of the four different seasonal groups based on IndVal (p < 0.05) (Table 3 and Table 4, respectively). At the MG site, a downstream area of the Nakdonggang River, some OTUs in the metazoan phyla, including Arthropoda, Mollusca, Platyhelminthes, and Rotifera, were observed as indicator species. This result is distinct from that at the SJ site, where only an OTU belonging to the phylum Rotifera was included as an indicator species among the metazoan taxa. Because the predators higher in the food web could be relatively abundant in the downstream regions of the large river than in the upstream regions (Table 3 and Table 4), they may act as indicator species to represent seasonal variations and responses to ecological conversion due to climate change. In particular, the highest number of indicator species was selected from the summer group at both the SJ (16 taxa) and MG sites (21 taxa).
Table 3.
Results of the indicator species analysis in four groups (i.e., seasons) at the SJ site. Only taxa with significant values are shown (2: summer, 3: autumn and 4: winter).
Table 4.
Results of the indicator species analysis in four groups (i.e., seasons) at the MG site. Only taxa with significant values are shown (1: spring, 2: summer, 3: autumn, and 4: winter).
Detected OTUs may vary depending on the frequency and intensity of rain. For example, detected eDNA can be decreased with large amounts of precipitation because eDNA may be washed away into the downstream area with a high frequency of precipitation (e.g., [44,45]). High river flow from heavy rain may dilute eDNA concentration and reduce the detectability of some species as well [46]. These results suggest that rainwater could dilute the genetic material of species (e.g., fish); therefore, even common species that were commonly detected in the past could be undetected due to dilution of eDNA concentration [46,47]. However, the dilution effect also could be compensated by the increased influx of genetic material entering the riparian water and flowing into the rivers [44]. For example, the MG site could represent a cumulative list of taxa from upstream and/or the bottom area of rivers especially during the rainy season. Because their large frustules are frequently washed away from their bottom habitats, the diatoms (e.g., Nitzschia) included in phytobenthos, were even found in MG sites where its discharge was over 600 cubic meters [48]. In addition, Sales et al. (2021) showed that biodiversity decreased through the second rainfall that followed rather than the first heavy rain, because the second rainfall can reduce the detectability of some species such as rare, low-abundance, and endangered species [49]. In the present study, many OTUs were detected during the rainy seasons. A large amount of precipitation may initially increase the number of OTUs due to the influx of organisms (or genetic materials) from the riparian and upstream regions. However, there were turning points when the detected OTU decreased as the rainy periods are prolonged. For example, in most cases, rainfall increased the number of OTUs detected, but on 20 August 2020, after it had rained continuously for two months, the detected OTU in both the SM and MG sites showed a tendency to decrease.
To determine the taxa influenced by changes in precipitation, we applied TITAN to the micro-eukaryotic assemblages (Figure 5 and Table 5). It was found that 55 of the 334 OTUs (i.e., the taxa observed in more than three samples) showed a robust response (purity and reliability > 0.95). At the SJ site, the changing point was 42.4 mm/month for the sum (z−) (i.e., the taxa decreased with the increase in precipitation), whereas it was 164.95 mm/month for the sum (z+) (i.e., the taxa increased with decrease in precipitation). In contrast, at the MG site, the changing points were 23.95 and 316.05 mm/month for the sum (z−) and (z+), respectively. Because the total number of detected taxa showed a tendency to increase in the context of an increase in the precipitation level, it would be necessary to cross-check the taxa that showed a positive correlation with heavy rainfall, particularly through the traditional field survey, for further study.
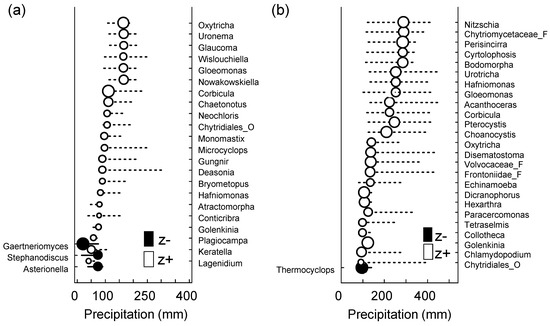
Figure 5.
Threshold Indicator Taxa Analysis (TITAN) of micro-eukaryotic assemblage response to the amount of precipitation (mm). Change point (black and white circles) and 95% confidence limits (horizontal lines) of significant indicator species at (a) SJ (n = 13, p < 0.05, purity > 0.95, and reliability > 0.95 for 500 bootstrap replicates) and (b) MG (n = 14, p < 0.05, purity > 0.95, and reliability > 0.95 for 500 bootstrap replicates) sites. Black and white circles indicate the change points. Circle diameter is proportional to the magnitude of the response (z scores). z−: Negatively associated taxa (z−) with increased precipitation and z+: Positively associated taxa (z+) with increased precipitation.
Table 5.
TITAN assemblage-level thresholds estimated from the response of micro-eukaryotes to the amount of precipitation (mm). Sum(z−) and sum(z+) indicate a decrease (−) or increase (+) along the gradient of the precipitation; CP indicates the assemblage change point; 5, 10, 50, 90, and 95% are bootstrap quantile intervals.
The annual compositions of micro-eukaryotic assemblages, determined using an eDNA metabarcoding technique (i.e., via meta-amplicon sequencing tools), were clearly affected by seasonal changes in the freshwater ecosystem. Originally, the rainy season in the area (Nakdonggang River basin) ranged from the end of June to July, and more than half of the total precipitation was concentrated from June to August. However, during the study period, there was heavy rainfall even in early autumn, and approximately 71% of the total precipitation was concentrated from July to September. Thus, owing to the variance, we speculate that the clear fluctuations in temperature and precipitation levels in the area could be two major environmental factors that induce significant changes in the composition of microeukaryomes.
Temporal study is crucial for predicting biodiversity patterns and upcoming changes. The time-based fluctuations in population, assemblage, and genetic structure can provide warning signals for species at a high risk of extinction and the potential for sudden changes in ecosystem function [50]. Because temporal data are unidirectional, they may provide the best way to identify causal relationships between environmental changes (e.g., climate change and disturbances) and ecological dynamics. [51,52]. Studies based on eDNA metabarcoding can provide persistent temporal results on biodiversity over long periods for a wider range of taxonomic units and broader geographic coverage than most other temporal data sources [37]. Thus, the eDNA technology enables the time-series analysis of species in different trophic levels and functional groups of organisms with species-level resolution [18,37]. However, to realize a more accurate monitoring procedure for micro-eukaryotic assemblages, the behavioral properties (i.e., migration and degradation) of eDNA in freshwater ecosystems have to be considered [53,54]. Despite the many advantages and substantial potential of eDNA technology in assessing freshwater biodiversity, several research topics such as analyzing hydrological factors that can affect the spatial rearrangement of eDNA [53], calculating the quantitative decay kinetics (half-life) of eDNA materials [55], as well as normalizing the abundance of sensed signals to real population (or biomass) [56,57] need to be researched further.
4. Conclusions
As a result of analyzing and categorizing micro-eukaryotic assemblages for 2 years at the upstream and downstream sites of the Nakdonggang River, the biota of each site were clearly classified according to the seasonal variations. At the two sites, environmental factors (e.g., water quality) fluctuated according to seasonal differences, and these major environmental factors and changes in micro-eukaryotic biota were highly correlated. In addition, we observed the statistically significant increment in the number of taxa of all taxonomic groups analyzed using eDNA metabarcoding with heavy precipitation during the rainy season. Finally, lists of taxa that can be an indicator among seasonally typed organisms were derived, and the taxa highly influenced by responding to increases and decreases in precipitation level were presented through TITAN analysis. As the frequency of drought and heavy rain is expected to increase in the future due to climate change, efforts to standardize the relation between precipitation and eDNA analysis could be obviously required. Because micro-eukaryotes play a central role in food webs and material circulation, it is necessary to conduct further long-term monitoring to carefully investigate the changes in the micro-eukaryotic assemblages according to the alteration in environmental conditions caused by climate change.
Supplementary Materials
The following are available online at https://www.mdpi.com/article/10.3390/w14213407/s1, Figure S1. The differences of land use between SJ and MG. Figure S2. The relationships between TN or TP and the amount of precipitation (mm) in (a,c) SJ, and (b,d) MG. Figure S3. The relationship between species richness and the amount of precipitation (mm) in SJ. Taxa richness of (a) Total, (b) Metazoa, (c) Fungi, (d) Microalgae, and (e) Protist. Figure S4. The relationship between species richness and the amount of precipitation (mm) in MG. Taxa richness of (a) Total, (b) Metazoa, (c) Fungi, (d) Microalgae, and (e) Protist.
Author Contributions
Conceptualization: M.-J.B. and E.-J.K.; Field survey: M.-J.B., T.Y., J.-Y.C., K.B., A.C., C.S.L. and E.-J.K.; Data analysis: M.-J.B. and E.-J.K.; Writing, Review, and Editing, M.-J.B. and E.-J.K. All authors have read and agreed to the published version of the manuscript.
Funding
This work was supported by a grant (Grant No. NNIBR202201103) from the Nakdonggang Na-tional Institute of Biological Resources (NNIBR), funded by the Ministry of Environment (MOE), Republic of Korea, and by a National Research Foundation of Korea (NRF) grant funded by the Korean government (MSIT) (Grant No. 2019R1A2C2089870).
Data Availability Statement
All data generated or analyzed during this study are included in this article and its Supplementary Data.
Conflicts of Interest
The authors declare that they have no known competing financial interests or personal relationships that could have influenced the work reported in this study.
References
- Miller, A.M.; Golladay, S.W. Effects of spates and drying on macroinvertebrate assemblages of an intermittent and a perennial prairie stream. J. N. Am. Benthol. Soc. 1996, 15, 670–689. [Google Scholar] [CrossRef]
- Bae, M.J.; Park, Y.S. Evaluation of precipitation impacts on benthic macroinvertebrate communities at three different stream types. Ecol. Indic. 2019, 102, 446–456. [Google Scholar] [CrossRef]
- Carpenter, S.R.; Caraco, N.F.; Correll, D.L.; Howarth, R.W.; Sharpley, A.N.; Smith, V.H. Nonpoint pollution of surface waters with phosphorus and nitrogen. Ecol. Appl. 1998, 8, 559–568. [Google Scholar] [CrossRef]
- Ma, X.; Li, Y.; Zhang, M.; Zheng, F.; Du, S. Assessment and analysis of non-point source nitrogen and phosphorus loads in the Three Gorges Reservoir Area of Hubei Province, China. Sci. Total Environ. 2011, 412–413, 154–161. [Google Scholar] [CrossRef] [PubMed]
- Chen, X.; Liu, X.; Peng, W.; Dong, F.; Huang, Z.; Wang, R. Non-point source nitrogen and phosphorus assessment and management plan with an improved method in data-poor regions. Water 2017, 10, 17. [Google Scholar] [CrossRef]
- Bucak, T.; Trolle, D.; Tavşanoğlu, Ü.N.; Çakıroğlu, A.İ.; Özen, A.; Jeppesen, E.; Beklioğlu, M. Modeling the effects of climatic and land use changes on phytoplankton and water quality of the largest Turkish freshwater lake: Lake Beyşehir. Sci Total Environ. 2018, 621, 802–816. [Google Scholar] [CrossRef]
- Donnert, D.; Salecker, M. Elimination of phosphorus from municipal and industrial waste water. Water Sci. Technol. 1999, 40, 195–202. [Google Scholar] [CrossRef]
- Seitzinger, S.P.; Sanders, R.W. Contribution of dissolved organic nitrogen from rivers to estuarine eutrophication. Mar. Ecol. Prog. Ser. 1997, 159, 1–12. [Google Scholar] [CrossRef]
- Brookfield, A.E.; Hansen, A.T.; Sullivan, P.L.; Czuba, J.A.; Kirk, M.F.; Li, L.; Newcomer, M.E.; Wilkinson, G. Predicting algal blooms: Are we overlooking groundwater? Sci. Total Environ. 2021, 769, 144442. [Google Scholar] [CrossRef] [PubMed]
- Wymore, A.S.; Johnes, P.J.; Bernal, S.; Brookshire, E.J.; Fazekas, H.M.; Helton, A.M.; Argerich, A.; Barnes, R.T.; Coble, A.A.; Dodds, W.K.; et al. Gradients of anthropogenic nutrient enrichment alter N composition and DOM stoichiometry in freshwater ecosystems. Glob. Biogeochem. Cycles 2021, 35, e2021GB006953. [Google Scholar] [CrossRef]
- Brannock, P.M.; Ortmann, A.C.; Moss, A.G.; Halanych, K.M. Metabarcoding reveals environmental factors influencing spatio-temporal variation in pelagic micro-eukaryotes. Mol. Ecol. 2016, 25, 3593–3604. [Google Scholar] [CrossRef] [PubMed]
- Liao, K.; Bai, Y.; Huo, Y.; Jian, Z.; Hu, W.; Zhao, C.; Qu, J. Integrating microbial biomass, composition and function to discern the level of anthropogenic activity in a river ecosystem. Environ. Int. 2018, 116, 147–155. [Google Scholar] [CrossRef]
- Ruppert, K.M.; Kline, R.J.; Rahman, M.S. Past, present, and future perspectives of environmental DNA (eDNA) metabarcoding: A systematic review in methods, monitoring, and applications of global eDNA. Glob. Ecol. Conserv. 2019, 17, e00547. [Google Scholar] [CrossRef]
- Salmaso, N.; Boscaini, A.; Pindo, M. Unraveling the diversity of eukaryotic microplankton in a large and deep perialpine lake using a high throughput sequencing approach. Front. Microbiol. 2020, 11, 789. [Google Scholar] [CrossRef]
- Babaei, M.; Tayemeh, M.B.; Jo, M.S.; Yu, I.J.; Johari, S.A. Trophic transfer and toxicity of silver nanoparticles along a phytoplankton-zooplankton-fish food chain. Sci. Total Environ. 2022, 842, 156807. [Google Scholar] [CrossRef]
- Rees, H.C.; Maddison, B.C.; Middleditch, D.J.; Patmore, J.R.; Gough, K.C. The detection of aquatic animal species using environmental DNA–a review of eDNA as a survey tool in ecology. J. Appl. Ecol. 2014, 51, 1450–1459. [Google Scholar] [CrossRef]
- Mächler, E.; Little, C.J.; Wüthrich, R.; Alther, R.; Fronhofer, E.A.; Gounand, I.; Harvey, E.; Hürlemann, S.; Walser, J.C.; Altermatt, F. Assessing different components of diversity across a river network using eDNA. Environ. DNA 2019, 1, 290–301. [Google Scholar] [CrossRef]
- Thomsen, P.F.; Willerslev, E. Environmental DNA-An emerging tool in conservation for monitoring past and present biodiversity. Biol. Conserv. 2015, 183, 4–18. [Google Scholar] [CrossRef]
- Harrison, J.B.; Sunday, J.M.; Rogers, S.M. Predicting the fate of eDNA in the environment and implications for studying biodiversity. Proc. R. Soc. B 2019, 286, 20191409. [Google Scholar] [CrossRef] [PubMed]
- Coble, A.A.; Flinders, C.A.; Homyack, J.A.; Penaluna, B.E.; Cronn, R.C.; Weitemier, K. eDNA as a tool for identifying freshwater species in sustainable forestry: A critical review and potential future applications. Sci. Total Environ. 2019, 649, 1157–1170. [Google Scholar] [CrossRef] [PubMed]
- Li, Y.; Miao, Y.; Zhang, W.; Yang, N.; Niu, L.; Zhang, H.; Wang, L. Sertraline inhibits top-down forces (predation) in microbial food web and promotes nitrification in sediment. Environ. Pollut. 2020, 267, 115580. [Google Scholar] [CrossRef] [PubMed]
- Sengupta, M.E.; Hellström, M.; Kariuki, H.C.; Olsen, A.; Thomsen, P.F.; Mejer, H.; Willerslev, E.; Mwanje, M.T.; Madsen, H.; Kristensen, T.K.; et al. Environmental DNA for improved detection and environmental surveillance of schistosomiasis. Proc. Natl. Acad. Sci. USA 2019, 116, 8931–8940. [Google Scholar] [CrossRef] [PubMed]
- Bae, M.J.; Chon, T.S.; Park, Y.S. Characterizing differential responses of benthic macroinvertebrate communities to floods and droughts in three different stream types using a Self-Organizing Map. Ecohydrology 2014, 7, 115–126. [Google Scholar] [CrossRef]
- Zhan, A.; Hulák, M.; Sylvester, F.; Huang, X.; Adebayo, A.A.; Abbott, C.L.; Adamowicz, S.J.; Heath, D.D.; Cristescu, M.E.; MacIsaac, H.J. High sensitivity of 454 pyrosequencing for detection of rare species in aquatic communities. Methods Ecol. Evol. 2013, 4, 558–565. [Google Scholar] [CrossRef]
- Fernández, S.; Rodríguez, S.; Martínez, J.L.; Borrell, Y.J.; Ardura, A.; García-Vázquez, E. Evaluating freshwater macroinvertebrates from eDNA metabarcoding: A river Nalón case study. PLoS ONE 2018, 13, e0201741. [Google Scholar] [CrossRef] [PubMed]
- Baird, R.B.; Rice, E.W.; Eaton, A.D. Standard Methods for the Examination of Water and Wastewater, 23rd ed.; American Public Health Association, American Water Works Association, and Water Environment Federation: Washington, DC, USA, 2017. [Google Scholar]
- Petersen, W.T.; Keister, J.E. Interannual variability in copepod community composition at a coastal station in the northern California Current: A multivariate approach. Deep. Sea Res. Part II Top. Stud. Oceanogr. 2003, 50, 2499–2517. [Google Scholar] [CrossRef]
- Roberts, D.W. Labdsv: Ordination and Multivariate Analysis for Ecology. R Package Version 1.4–1. 2010. Available online: https://cran.r-project.org/ (accessed on 12 December 2021).
- Baker, M.E.; King, R.S. A new method for detecting and interpreting biodiversity and ecological community thresholds. Methods Ecol. Evol. 2010, 1, 25–37. [Google Scholar] [CrossRef]
- Firmiano, K.R.; Ligeiro, R.; Macedo, D.R.; Juen, L.; Hughes, R.M.; Callisto, M. Mayfly bioindicator thresholds for several anthropogenic disturbances in neotropical savanna streams. Ecol. Indic. 2017, 74, 276–284. [Google Scholar] [CrossRef]
- Porter-Goff, E.R.; Frost, P.C.; Xenopoulos, M.A. Changes in riverine benthic diatom community structure along a chloride gradient. Ecol. Indic. 2013, 32, 97–106. [Google Scholar] [CrossRef]
- Schröder, M.; Sondermann, M.; Sures, B.; Hering, D. Effects of salinity gradients on benthic invertebrate and diatom communities in a German lowland river. Ecol. Indic. 2015, 57, 236–248. [Google Scholar] [CrossRef]
- King, R.S.; Scoggins, M.; Porras, A. Stream biodiversity is disproportionately lost to urbanization when flow permanence declines: Evidence from southwestern North America. Freshw. Sci. 2016, 35, 340–352. [Google Scholar] [CrossRef]
- King, R.S.; Richardson, C.J. Integrating bioassessment and ecological risk assessment: An approach to developing numerical water-quality criteria. Environ. Manag. 2003, 31, 795–809. [Google Scholar] [CrossRef] [PubMed]
- Kail, J.; Arle, J.; Jähnig, S.C. Limiting factors and thresholds for macroinvertebrate assemblages in European rivers: Empirical evidence from three datasets on water quality, catchment urbanization, and river restoration. Ecol. Indic. 2012, 18, 63–72. [Google Scholar] [CrossRef]
- Zhao, Q.; Guo, F.; Zhang, Y.; Ma, S.; Jia, X.; Meng, W. How sulfate-rich mine drainage affected aquatic ecosystem degradation in northeastern China, and potential ecological risk. Sci. Total Environ. 2017, 609, 1093–1102. [Google Scholar] [CrossRef]
- Bálint, M.; Pfenninger, M.; Grossart, H.P.; Taberlet, P.; Vellend, M.; Leibold, M.A.; Englund, G.; Bowler, D. Environmental DNA time series in ecology. Trends Ecol. Evol. 2018, 33, 945–957. [Google Scholar] [CrossRef] [PubMed]
- Gad, M.; Hou, L.; Li, J.; Wu, Y.; Rashid, A.; Chen, N.; Hu, A. Distinct mechanisms underlying the assembly of microeukaryotic generalists and specialists in an anthropogenically impacted river. Sci. Total Environ. 2020, 748, 141434. [Google Scholar] [CrossRef]
- Bai, X.; Shen, W.; Wang, P.; Chen, X.; He, Y. Response of non-point source pollution loads to land use change under different precipitation scenarios from a future perspective. Water Resour. Manag. 2020, 34, 3987–4002. [Google Scholar] [CrossRef]
- Leempoel, K.; Hebert, T.; Hadly, E.A. A comparison of eDNA to camera trapping for assessment of terrestrial mammal diversity. Proc. R. Soc. B Biol. Sci. 2020, 287, 20192353. [Google Scholar] [CrossRef]
- Elbrecht, V.; Vamos, E.E.; Meissner, K.; Aroviita, J.; Leese, F. Assessing strengths and weaknesses of DNA metabarcoding-based macroinvertebrate identification for routine stream monitoring. Methods Ecol. Evol. 2017, 8, 1265–1275. [Google Scholar] [CrossRef]
- Lyet, A.; Pellissier, L.; Valentini, A.; Dejean, T.; Hehmeyer, A.; Naidoo, R. eDNA sampled from stream networks correlates with camera trap detection rates of terrestrial mammals. Sci. Rep. 2021, 11, 11362. [Google Scholar] [CrossRef]
- Hao, Z.; Gao, Y.; Green, S.M.; Wen, X.; Yang, J.; Xiong, B.; Quine, T.A.; He, N. Chemical characteristics of flow driven by rainfall and associated impacts on shallow groundwater quality in a Karst watershed, Southwest China. Environ. Process. 2021, 8, 615–636. [Google Scholar] [CrossRef]
- Cannon, M.V.; Hester, J.; Shalkhauser, A.; Chan, E.R.; Logue, K.; Small, S.T.; Serre, D. In silico assessment of primers for eDNA studies using PrimerTree and application to characterize the biodiversity surrounding the Cuyahoga River. Sci. Rep. 2016, 6, 22908. [Google Scholar] [CrossRef] [PubMed]
- Buxton, A.S.; Groombridge, J.J.; Zakaria, N.B.; Griffiths, R.A. Seasonal variation in environmental DNA in relation to population size and environmental factors. Sci. Rep. 2017, 7, 46294. [Google Scholar] [CrossRef] [PubMed]
- Curtis, A.N.; Tiemann, J.S.; Douglass, S.A.; Davis, M.A.; Larson, E.R. High stream flows dilute environmental DNA (eDNA) concentrations and reduce detectability. Divers. Distrib. 2021, 27, 1918–1931. [Google Scholar] [CrossRef]
- Van Bochove, K.; Bakker, F.T.; Beentjes, K.K.; Hemerik, L.; Vos, R.A.; Gravendeel, B. Organic matter reduces the amount of detectable environmental DNA in freshwater. Ecol. Evol. 2020, 10, 36447–43654. [Google Scholar] [CrossRef]
- Lee, K.L.; Choi, J.S.; Lee, J.H.; Jung, K.Y.; Kim, H.S. Response of epilithic diatom assemblages to weir construction on the Nakdong River, Republic of Korea. Ecol. Indic. 2021, 126, 107711. [Google Scholar] [CrossRef]
- Sales, N.G.; Wangensteen, O.S.; Carvalho, D.C.; Deiner, K.; Præbel, K.; Coscia, I.; McDevitt, A.D.; Mariani, S. Space-time dynamics in monitoring neotropical fish communities using eDNA metabarcoding. Sci. Total Environ. 2021, 754, 142096. [Google Scholar] [CrossRef]
- Pace, M.L.; Carepenter, S.R.; Cole, J.J. With and without warning: Managing ecosystems in a changing world. Front. Ecol. Environ. 2015, 13, 460–467. [Google Scholar] [CrossRef]
- Sugihara, G.; May, R.; Ye, H.; Hsieh, C.H.; Deyle, E.; Fogarty, M.; Munch, S. Detecting causality in complex ecosystems. Science 2012, 338, 496–500. [Google Scholar] [CrossRef]
- Dornelas, M.; Magurran, A.E.; Buckland, S.T.; Chao, A.; Chazdon, R.L.; Colwell, R.K.; Curtis, T.; Gaston, K.J.; Gotelli, N.J.; Kosnik, M.A.; et al. Quantifying temporal change in biodiversity: Challenges and opportunities. Proc. Biol. Sci. 2013, 280, 20121931. [Google Scholar] [CrossRef]
- Carraro, L.; Mächler, E.; Wüthrich, R.; Altermatt, F. Environmental DNA allows upscaling spatial patterns of biodiversity in freshwater ecosystems. Nat. Commun. 2020, 11, 3585. [Google Scholar] [CrossRef] [PubMed]
- Bae, M.J.; Ham, S.N.; Lee, Y.K.; Kim, E.J. Evaluation of benthic macroinvertebrate diversity in a stream of abandoned mine land based on environmental DNA (eDNA) approach. Korean J. Ecol. Environ. 2021, 54, 221–228. [Google Scholar] [CrossRef]
- Tzafesta, E.; Zangaro, F.; Specchia, V.; Pinna, M. An overview of DNA-based applications for the assessment of benthic macroinvertebrates biodiversity in mediterranean aquatic ecosystems. Diversity 2021, 13, 112. [Google Scholar] [CrossRef]
- Dowle, E.J.; Pochon, X.C.; Banks, J.; Shearer, K.; Wood, S.A. Targeted gene enrichment and high-throughput sequencing for environmental biomonitoring: A case study using freshwater macroinvertebrates. Mol. Ecol. Resour. 2016, 16, 1240–1254. [Google Scholar] [CrossRef] [PubMed]
- Pereira-da-Conceicoa, L.; Elbrecht, V.; Hall, A.; Briscoe, A.; Barber-James, H.; Price., B. Metabarcoding unsorted kick-samples facilitates macroinvertebrate-based biomonitoring with increased taxonomic resolution, while outperforming environmental DNA. Environ. DNA 2021, 3, 353–371. [Google Scholar] [CrossRef]


Publisher’s Note: MDPI stays neutral with regard to jurisdictional claims in published maps and institutional affiliations. |
© 2022 by the authors. Licensee MDPI, Basel, Switzerland. This article is an open access article distributed under the terms and conditions of the Creative Commons Attribution (CC BY) license (https://creativecommons.org/licenses/by/4.0/).