Article

Establishing a Data Fusion Water Resources Risk Map Based on Aggregating Drinking Water Quality and Human Health Risk Indices

by
Ata Allah Nadiri
1,2,3,4,*,
Zahra Sedghi
1,
Rahim Barzegar
5,6,7 and
Mohammad Reza Nikoo
8
1
Department of Earth Sciences, Faculty of Natural Sciences, University of Tabriz, Tabriz 5166616471, Iran
2
Institute of Environment, University of Tabriz, Tabriz 5166616471, Iran
3
Traditional Medicine and Hydrotherapy Research Center, Ardabil University of Medical Sciences, Ardabil 8599156189, Iran
4
Environmental Geology and Environmental Research Center, University of Tabriz, Tabriz 5166616471, Iran
5
Department of Bioresource Engineering, McGill University, 21111 Lakeshore, Ste Anne de Bellevue, Quebec, QC H9X 3V9, Canada
6
Department of Geography & Environmental Studies, Wilfrid Laurier University, Waterloo, ON N2L 3G1, Canada
7
Ecohydrology Research Group, Department of Earth and Environmental Sciences and The Water Institute, University of Waterloo, Waterloo, ON N2L 3G1, Canada
8
Department of Civil and Architectural Engineering, Sultan Qaboos University, Muscat P.O. Box 50, Oman
*
Author to whom correspondence should be addressed.
Water 2022, 14(21), 3390; https://doi.org/10.3390/w14213390
Submission received: 8 August 2022 / Revised: 3 October 2022 / Accepted: 19 October 2022 / Published: 26 October 2022

Abstract

:
The Drinking Water Quality Index (DWQI) and the Human Health Risk Index (HHRI) are two of the most promising tools for assessing the health impact of water quality on humans. Each of these indices has its own ability to determine a specific level of safety for drinking, and their results may vary. This study aims to develop an aggregated index to identify vulnerable areas in relation to safe drinking water and, subsequently, risk areas for human health, particularly non-cancerous diseases, in the Maku–Bazargan–Poldasht area in NW Iran through the use of a data fusion technique. Nitrate (NO3) and fluoride (F) are the predominant contaminants that threaten the local population’s health. The DWQI revealed that the majority of the study sites had poor to improper quality for drinking water class. Health risk assessments showed an excessive potential for non-carcinogenic health risks because of high NO3 and F exposure through drinking water. Children are at a higher risk for non-carcinogenic changes than adults, according to the total hazard index (THI; NO3 and F), suggesting that locals have faced a lifetime risk of non-cancer changes as a consequence of their exposure to these pollutants. Using data fusion techniques can assist in developing a comprehensive water resources risk map for decision-making.

1. Introduction

The problem of water shortage and health issues associated with drinking water has become widespread worldwide. In the context of water quality, fluoride (F) and nitrate (NO3) concentrations are of particular importance because of the significant health impact they have on humans. In most developing countries, including Ghana, parts of eastern and southern Africa, Turkey, and Iran, high F and NO3 concentrations have been reported in groundwater [1,2,3,4]. It is well known that excessive F exposure can damage teeth, bones, and, in some cases, the kidneys. As a result of the inadvertent consumption of F by children, adverse effects are known to occur when inadequate F amounts are consumed [5]. Moreover, the lack of adequate intake of F can lead to an increased risk of dental caries in children, especially in cases where the F concentration is lower than 0.5 mg/L in drinking water [6]. Similarly, excessive amounts of NO3 in drinking water have the potential to negatively affect human health since they reduce the blood’s ability to carry oxygen throughout the body [7,8].
Over the past few years, different water quality indices have been utilized for water quality assessments. The Human Health Risk Index (HHRI) and Drinking Water Quality Index (DWQI) are two indicators that have gained popularity as tools for quantifying groundwater quality and assessing the magnitude of health risks posed to populations exposed to toxic chemicals in the groundwater [9]. However, these indices have undergone some changes in recent years. The major change can be attributed to both the method of interpretation and the calculation procedure [10]. Numerous studies have imitated these methods despite their drawbacks, such as their output classification. Most water quality studies are conducted based on classifications without any rationale as to whether they should be used for drinking purposes, and as a consequence, decisions about drinking water can endanger human health. Therefore, an aggregated method that can combine different water quality indices is needed. In this study, we propose a data fusion method for this purpose. Data fusion has been used in several different settings to resolve the disagreement between information. In general, it refers to using parameters or data in combination to improve the quality of analysis, decrease uncertainty, or obtain new information. See and Abrahart [11], describe information fusion as a method of combining information that comes from a number of different resources, a practice that is generally used in the electrical engineering field.
The groundwater quality assessment is not just concerned with the level of contamination and the potential risk of exposure but also with determining and quantifying the distribution of contamination sources [12,13,14,15]. Statistical methods such as correlation and factor analysis have been frequently employed to address the contamination origin when dealing with multivariate data. Correlation analysis helps us to understand how hydrochemical parameters are related to one another, allowing us to identify their likely origins. The factor analysis method does not necessitate an understanding of the numeral of sources or features of contaminants but instead provides a method for identifying potential hydrogeochemical processes as well as influencing factors (e.g., geogenic and anthropogenic processes).
Asghari Moghaddam and Fijani [16], conducted research in West Azerbaijan, NW Iran, and showed that the F contamination of the water is common in the study area because of the presence of basaltic lavas at a significant depth, which affects the Sari Su river with the release of F [17]. Besides F contamination, there are high levels of NO3 in many parts of the West Azerbaijan Province. However, it has not been explored in the Maku–Bazargan–Poldasht area. Therefore, it is necessary to determine the F and NO3 concentrations in the drinking water resources of Maku–Bazargan–Poldasht, West Azerbaijan province, in order to determine the quality of water and assess human health risks. This study aims to identify areas where high-F and -NO3 waters formed and then calculate the non-carcinogenic disease risk of inhabitants exposed to NO3 and F through water supplies using the United State Environmental Protection Agency’s approach. Previous studies have revealed a number of major gaps, including (1) NO3 contamination has not been detected in water in the Maku–Bazargan–Poldasht, (2) water quality indices have not been classified arbitrarily, and (3) data fusion has not been used to develop a comprehensive risk map for water resources. The current study tries to address these gaps using the proposed methodology.
The novelty of this study is the development of classifications for drinking water quality indices and the enhancement of these classifications over conventional methods of classification, as well as the development of a comprehensive risk map based on a fusion of different types of information. The aim of this study is to develop an aggregated index with data fusion techniques by identifying vulnerable areas in the discussion of safe drinking water and consequently risk areas in terms of human health, with special emphasis on non-cancerous diseases, by: (i) investigating the geochemical features of water quality samples; (ii) identifying the sources of contaminants; (iii) determining the DWQI and the potential cumulative health risks of contaminated water through multiple exposure pathways (e.g., dermal and oral) for both children and adults; (iv) improving DWQI classification for drinking purposes; (v) developing a new data-fusion-based combined system with aims regarding the health of people in the study area; and (vi) providing a comprehensive health risk map (Figure 1).
A key aspect of this study is the contribution of information about the issue of F and NO3 contamination in water resources of the study area, as well as valuable evidence that may have a significant impact on the way local authorities manage their risk to reduce the adverse effects of toxic elements on citizens’ health. It should be noted that the aspects of the hazard aggregation problem have been discussed at fluctuating points by different authors (e.g., [15,18,19]), but in general, these functions are still in their beginning, especially those that address the last three dimensions. Table 1 lists the selected cases of techniques used in DWQI and HHRI applications.

2. Material and Techniques

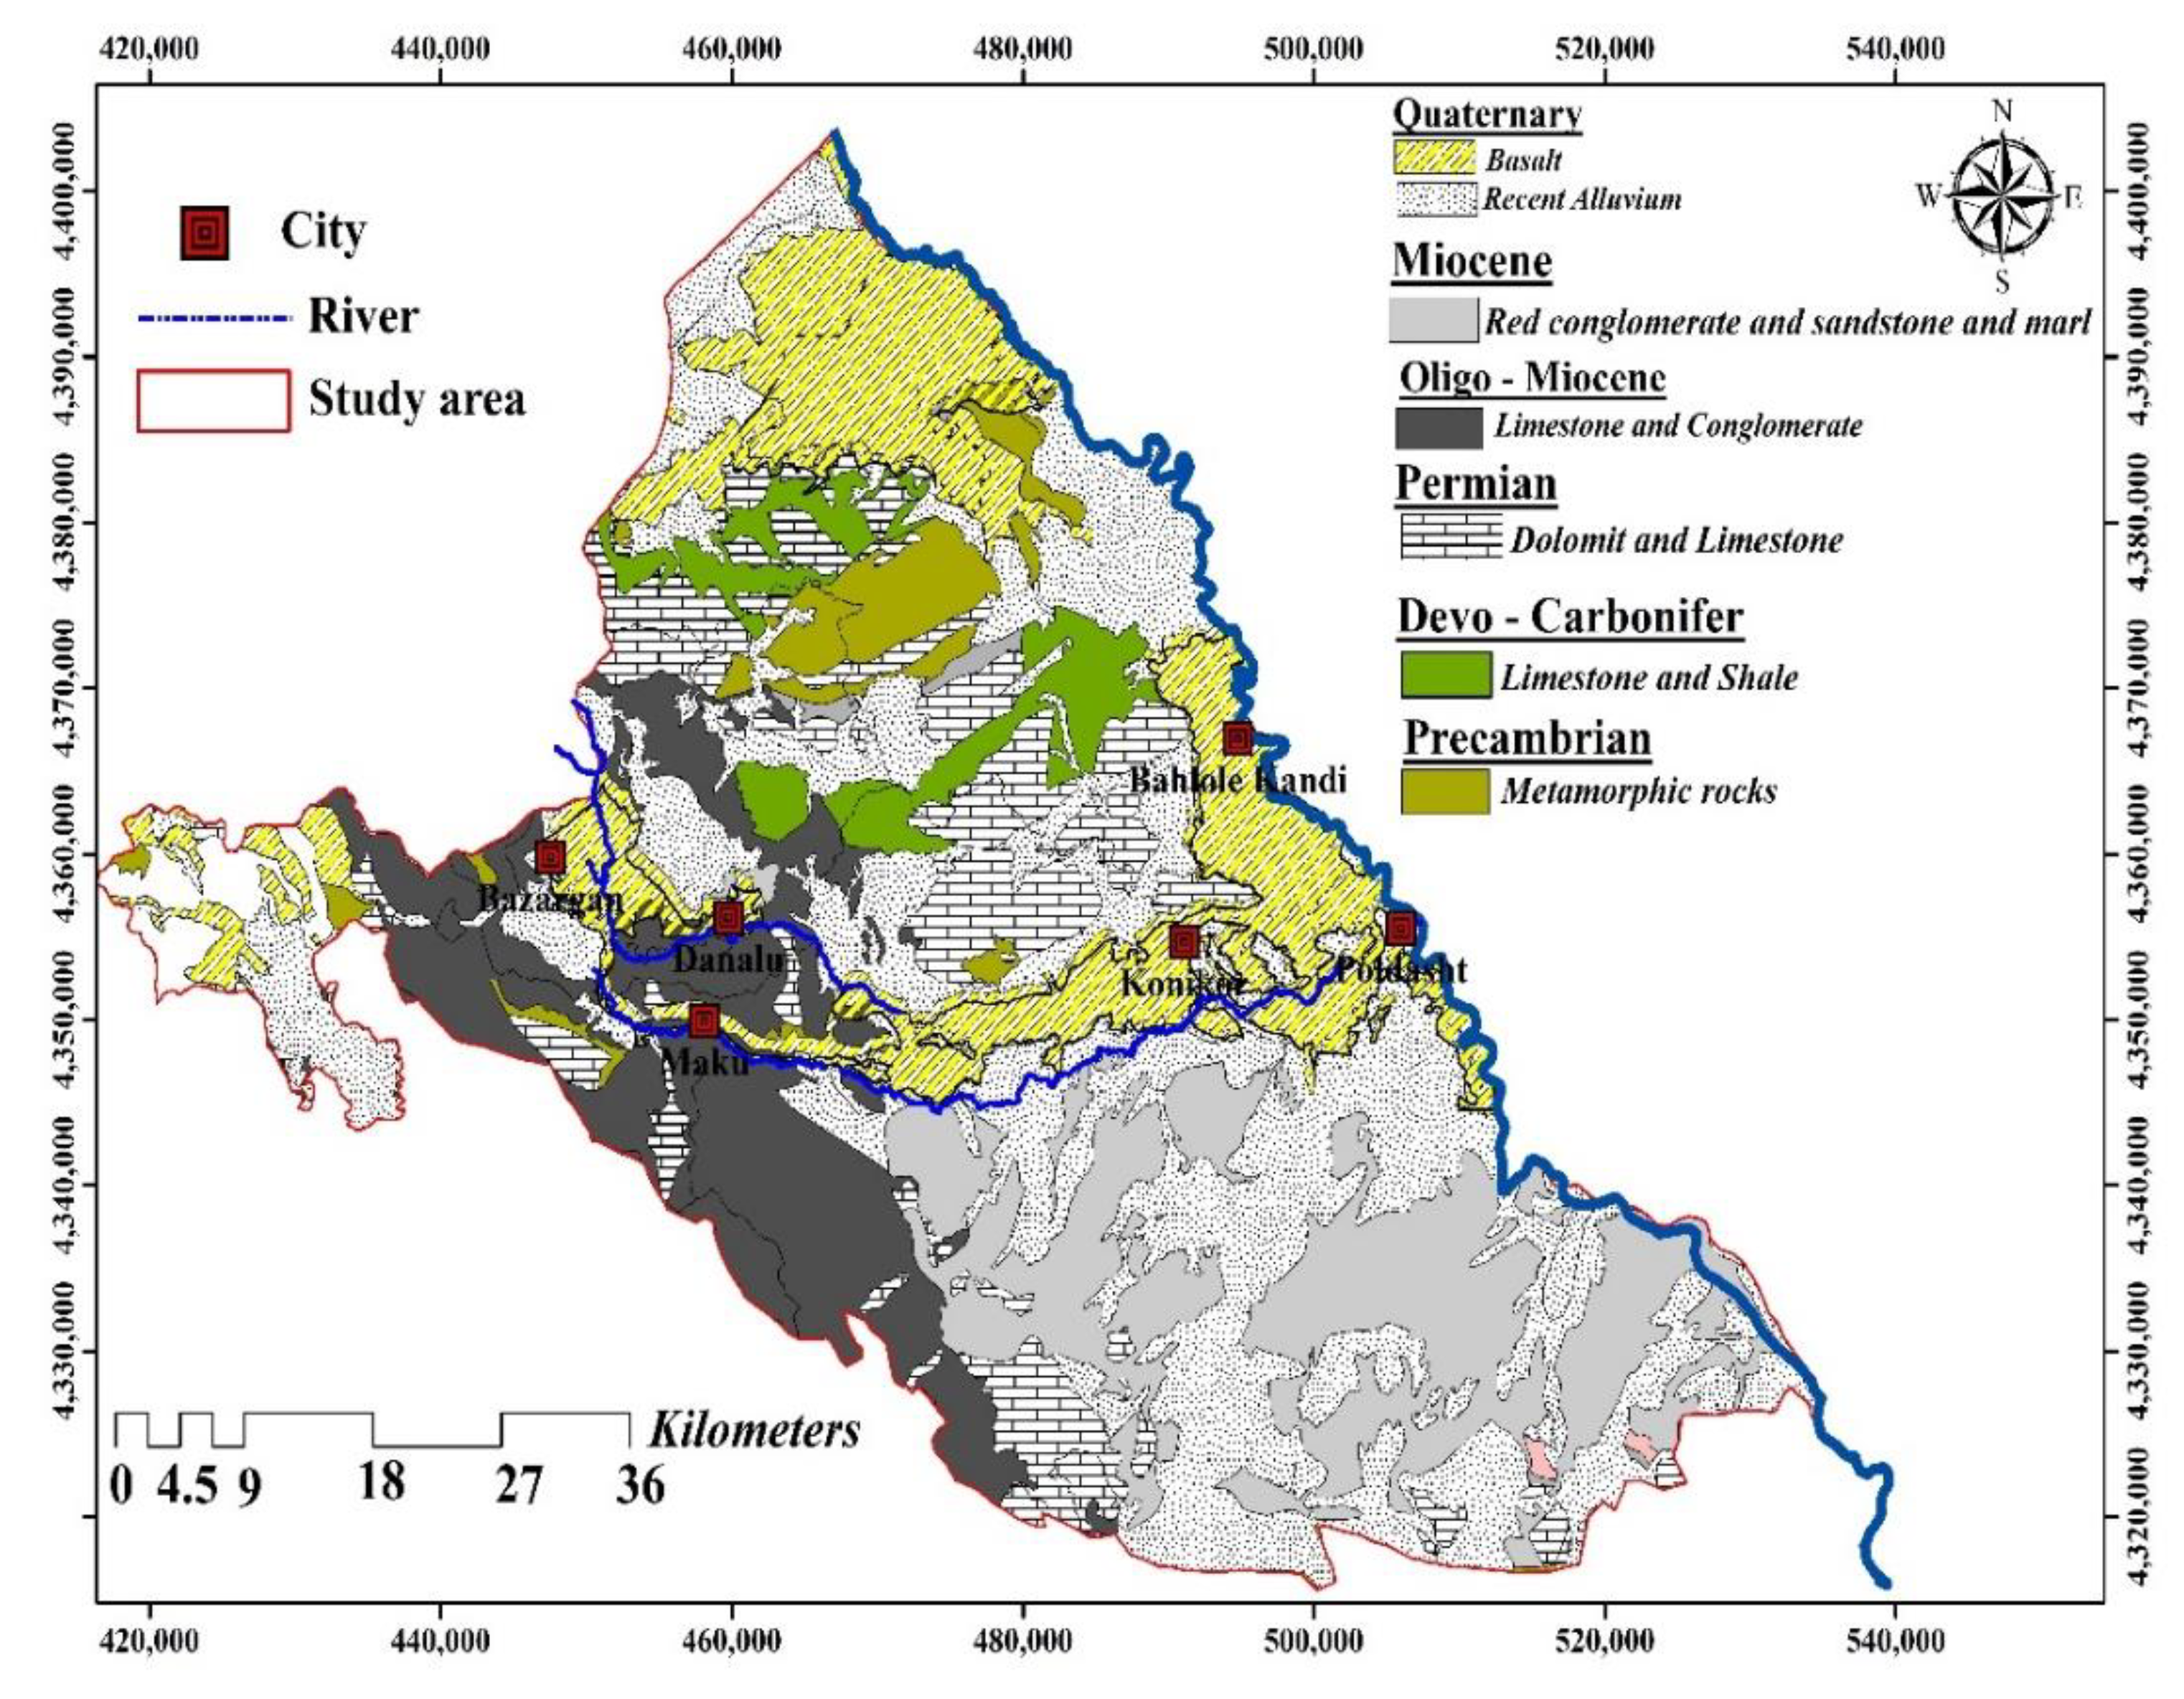
2.1. Description of the Maku–Bazargan–Poldasht

The Maku–Bazargan–Poldasht is in West Azerbaijan, Iran, at the Ararat Mountain range’s foothills, in the province’s north (Figure 2). The Maku–Bazargan–Poldasht is located between longitudes 44°21′ and 45°10′ and between latitudes 39°13′ and 39°34′. In the west, it is bordered by Turkey, whereas in the east, it is bordered by the Aras River. The Maku–Bazargan–Poldasht covers nearly 1600 km2, of which up to one-fourth is covered with basaltic lavas. This area has three main cities: Maku, Poldasht, and Bazargan. With an average temperature range of −16.2 to 35.1 °C and annual mean precipitation of 300 mm, the least and highest precipitation occurred in September and May, respectively. During a typical year, there is approximately 1500 mm of evaporation, three times more than the amount of precipitation expected. The Sari Su and Zangmar rivers are the two main rivers flowing through the study area.
The Maku–Bazargan–Poldasht area is mainly supplied by water resources, which are used for agriculture, drinking, and industry. In addition, 12 large-scale springs and several withdrawal wells discharge groundwater [12]. According to geoelectrical surveying conducted within the Bazargan Plain area, the basalt-alluvium aquifer’s thickness is estimated to be about 150 m [12]. Most of the high F water resources are found in rock formations formed by basaltic magma(Figure 3). The Maku–Bazargan–Poldasht is predominantly underlain by non-basaltic and basaltic aquifers. Prior reports have indicated a high F concentration in the Maku–Bazargan–Poldasht complex aquifers. The presence of F in some areas (called the mixing zone) is caused by the mixing of groundwater from basaltic and non-basaltic origins. Phyllite–schist and gneiss, which are the main water-bearing rocks in the region, have small amounts of primary porosity. The secondary porosity of these formations, which is found in the form of fissures or fractures, enables groundwater to be actively transported through the rocky formation, thus acting as a groundwater reservoir. The majority of these zones can be found in basaltic aquifers and some of them can be found in non-basaltic aquifers. As a result of drinking water from basalt springs and wells, residents in the region suffer from dental fluorosis [12].

2.2. Water Sampling and Analysis

Sixty samples were gathered from springs, rivers, and wells in January 2021. These resources provide a large volume of water for consumption and irrigation. Electrical conductivity (EC) and pH were measured directly in the field during sample collection. Potassium (K+) and sodium (Na+) were measured with a flame photometer. A UV single-beam spectrophotometer (UV-1200, Labman Scientific Instruments Pvt. Ltd, Chennai, India) was used for Sulphate (SO42−), NO3, nitrite (NO2), ammonium (NH4+), and bromine (Br). Bicarbonate (HCO3), carbonate (CO32−), chloride (Cl), magnesium (Mg2+), and calcium (Ca2+) were analyzed using the titration approaches [29]. The F concentration was calculated by utilizing an ion-selective electrode. Chemical analysis was validated using an ion balance. The sum of cations and anions must be equal according to the principle of neutrality. A cation–anion balance error [30], was calculated as follows:
C B E % = z . m c z . m a z . m c + z . m a × 100
where A and C are the concentrations of HCO3 + Cl + SO42− and Ca2+ + Mg2+ + Na+ + K+, respectively, in meq/L. Additionally, charge balance is the ratio of the ionic balance error. The accuracy of ionic measurements was measured through the Charge Balance Error percentage (CBE%). A CBE% within the range of ±5% is accepted as a good analysis measure [31].

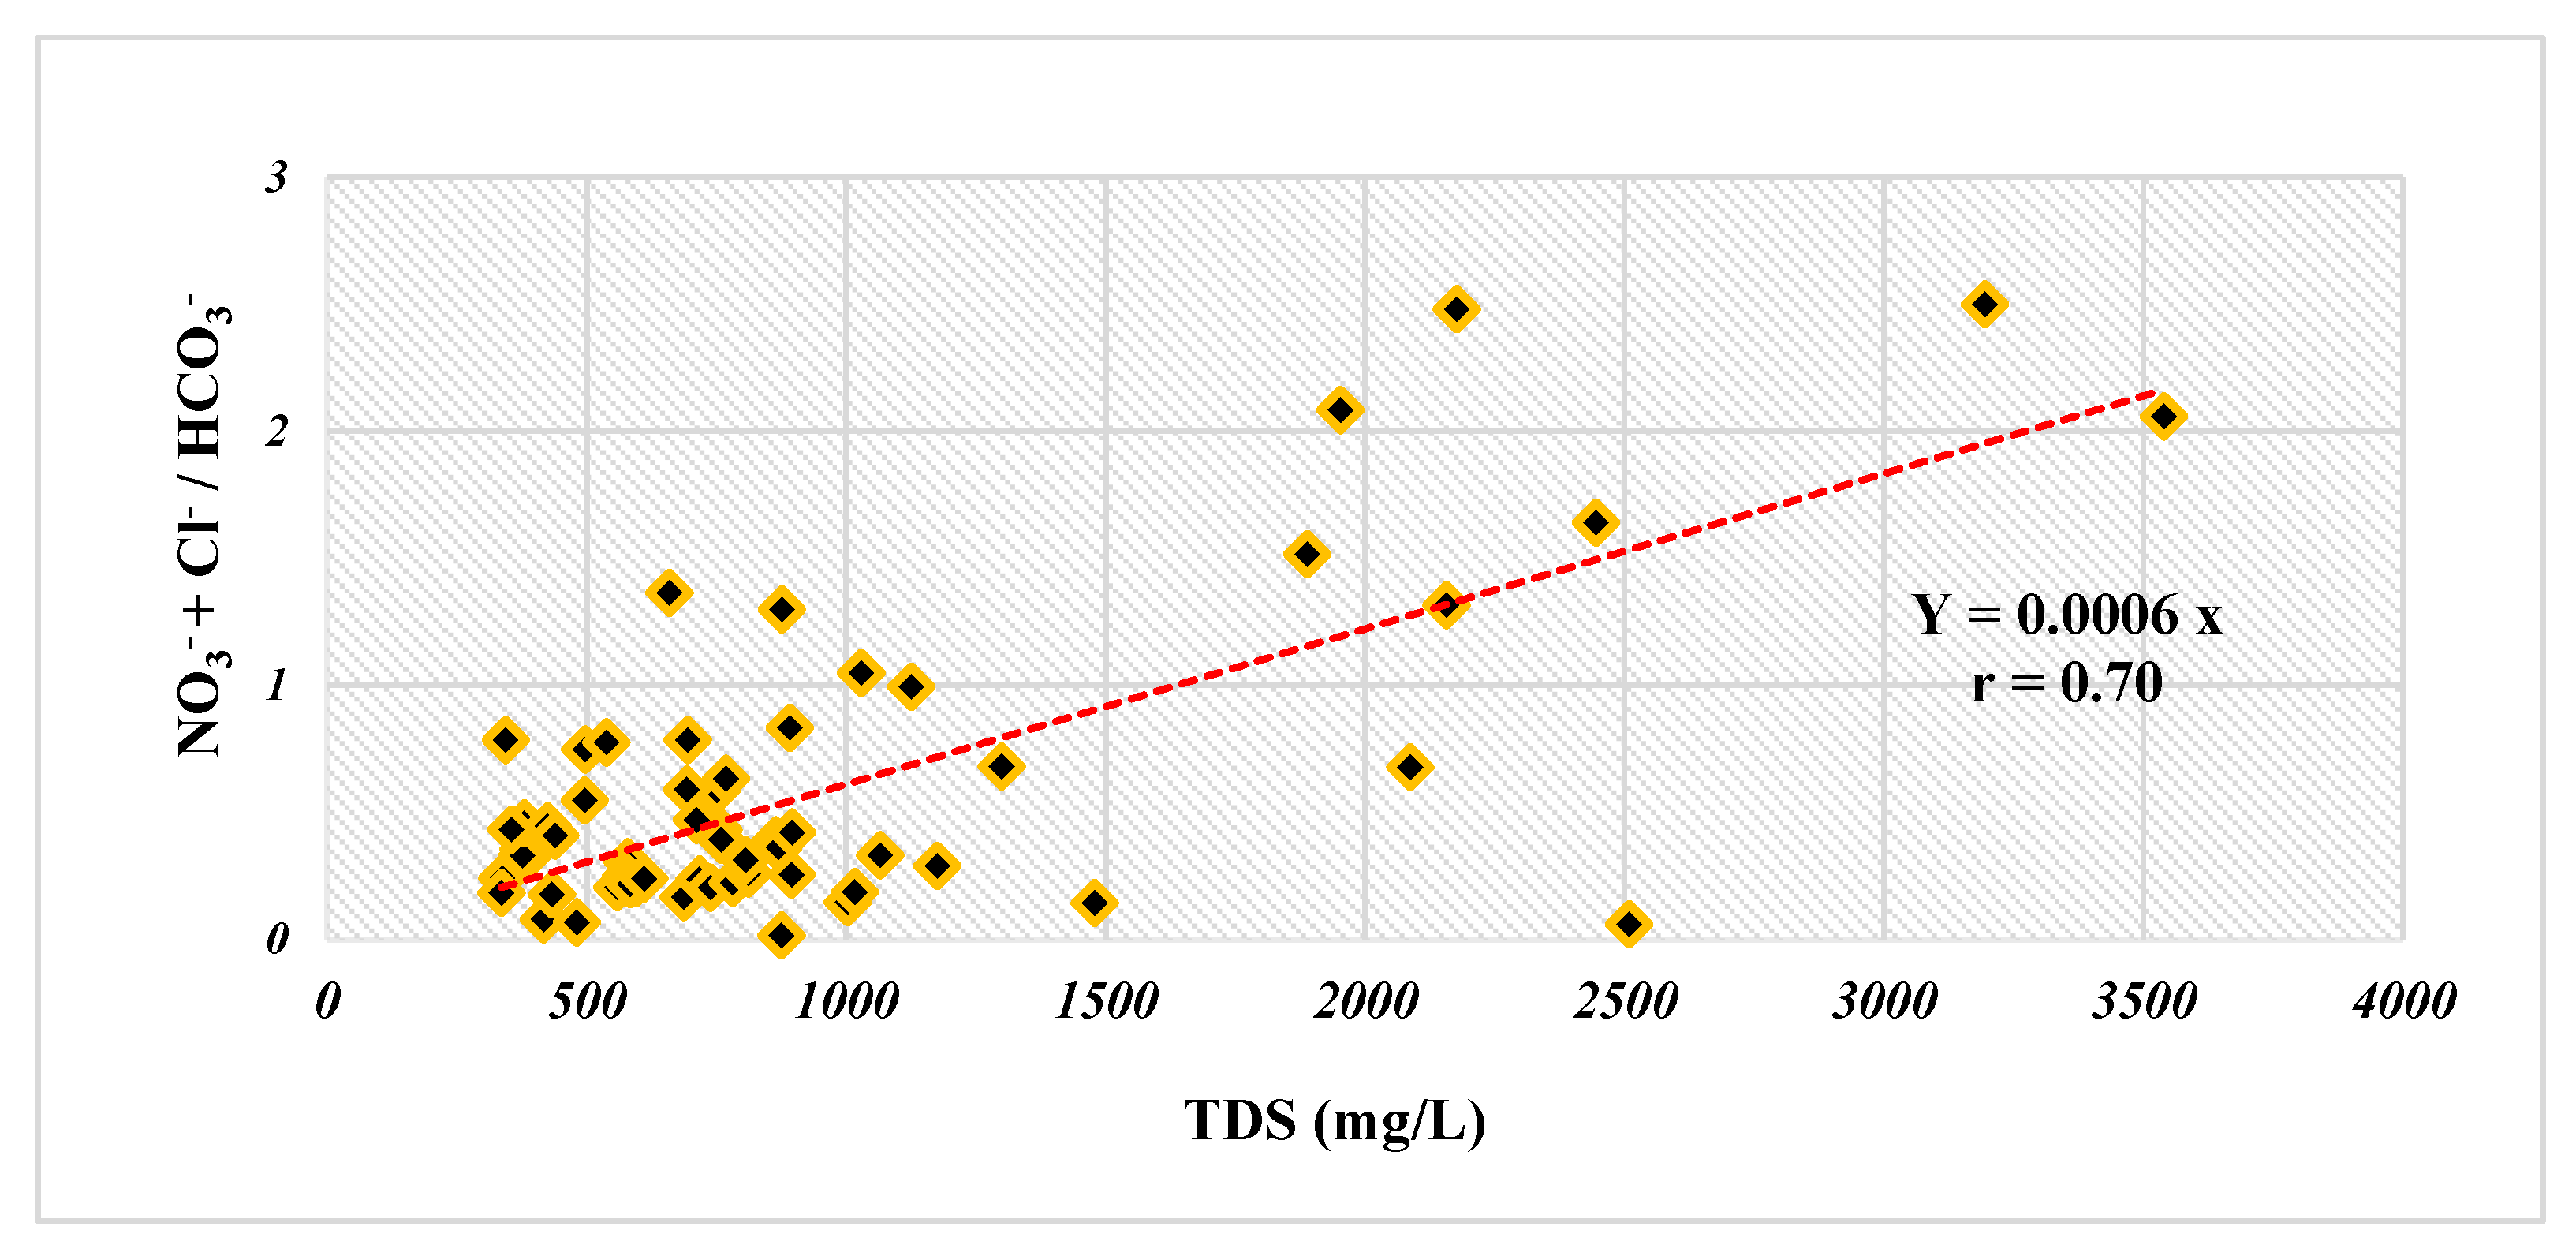
2.3. Physicochemical Characteristics of Water Resources

A statistical investigation of the physicochemical parameters of water resources measured in the field and the laboratory are presented in Table 2. There was a major difference between the median and maximum values of Na+, Ca2+, Cl, SO42−, NO3, NO2, and CO32−, and the maximum values were more than five times the median values, implying the presence of some external contaminants in the groundwater [32]. The EC value varied between 525 and 5530 μS/cm, with an average value of 1503 μS/cm. It was found that 65% of the samples were freshwater, 20% were brackish, and 15% were saline, according to the EC classification for water samples (i.e., fresh: 1500 S/cm; brackish: 1500–3000 S/cm; saline: >3000 S/cm). The pH values of the water samples in the Maku–Bazargan–Poldasht area ranged from 7.37 to 8.3, indicating a slightly acidic to a slightly alkaline environment. According to the US EPA, all samples fell within acceptable limits regarding the pH parameter. Na+ concentrations ranged between 16 and 1001 mg/L, with an average value of 221 mg/L. According to EPA standards [33], the maximum allowable concentration of Na+ for drinking water was 200 mg/L. Table 2 shows that 24 sampling sites exceeded the standard threshold for drinking purposes. In total, 10% of the samples contained Ca2+ concentrations that ranged between 32 and 518 mg/L, with a mean concentration of 102 mg/L, which was larger than the acceptable limit (i.e., 100 mg/L). Mg2+ and K+ concentrations varied between 11–245 mg/L and 3–70 mg/L, with 65 and 12 mg/L mean values, respectively. In total, 95% of the samples violated the standard threshold of 30 mg/L. In the Maku–Bazargan–Poldasht area, the Cl concentration in the water resources varied from 4 to 769 mg/L with a mean of 132 mg/L. According to the results, about 15% of them exceeded the 250 mg/L drinking water guideline [33]. Additionally, HCO3 and CO32− concentrations showed a wide range of 107–536.5 mg/L and 0–80.6 mg/L, respectively. On the other hand, there was no recommended value for either one. The SO42− content ranged from 5.5 to 9079 mg/L with an average of 1263 mg/L, and the greater part of the samples (80%) were within the acceptable drinking limit of 250 mg/L. In this area, the presence of high levels of SO42− may be attributed to little rain and strong evaporation as well as an aquifer medium abundant in sulfate. The concentration of SO42− in the water was also affected by the contact between the water and the rock as well as evaporation-induced enrichment. NO2 concentrations in the samples ranged from 0 to 4.79 mg/L, with about 95% having NO2 concentrations more than the standard limit of 1 mg/L [33]. In summary, the average concentration of major cations was in the order of Na+ > Ca2+ > Mg2+ ≫ K+. A correlation analysis was conducted to determine whether there was a consistent relationship between the hydrochemical parameters. It was determined through SPSS that the data were normally distributed to determine which correlation analysis approach (i.e., parametric or nonparametric) should be used in order to determine the most appropriate correlation analysis approach. As a result of the non-normal distribution of the hydrochemical data, Kendall’s correlation test, a method of nonparametric correlation analysis, was applied to the hydrochemical data.

2.4. Multivariate Statistic

Pre-processing of the data (i.e., normalization, log transformation) was performed to standardize the measured water quality parameters and remove the impact of their diverse units on the multivariate statistics. Then, the Pearson correlation analysis of the water quality parameters was calculated to decipher the relationship between the parameters. Significance (p value) and strength (r) were essential factors when determining the significance of relationships. The higher the r value, the stronger the relationship, and in this study, r > 0.7 was considered to be a strong relationship, while 0.5 < r < 0.7 and r < 0.5 were deemed to be average and weak relationships, respectively. Factor analysis (FA) is usually utilized to determine the hidden dimension, which may not be described by direct analysis. In total, 14 water quality parameters, including pH, EC, Ca2+, Mg2+, Na+, K+, HCO3, SO42−, Cl, NO3, F, NO2, Br, and NH4+, were considered when carrying out the FA. The Kaiser’s criterion and varimax rotation technique [34], were used to improve factor loadings, achieve a simple structure, and find factors with eigenvalues greater than 1. Consequently, factor loadings greater than 0.75 were well thought-out as high, whereas factor loadings between 0.50 and 0.75 were considered medium [35]. As mentioned above, NO3 contamination was severe in the Maku–Bazargan–Poldasht area. The oxidative conditions of the water resources in the Maku–Bazargan–Poldasht area facilitates the conversion of NO2 and NH4+ contaminants to NO3 as a result of the nitrification process [36]. According to the linear correlation between TDS and NO3 + Cl/HCO3 [37], a positive correlation coefficient of 0.7 was determined (Figure 4), indicating that the water resource under study was contaminated by anthropogenic activities.
The NO3 in water resources can result from anthropogenic and geogenic inputs. It is common for water resources to contain nitrogen concentrations below 10 mg/L, and those above this limit are considered anthropogenic. Figure 5 shows that most samples in the Maku–Bazargan–Poldasht area had NO3 concentrations exceeding the standards limit of 10 mg/L [33], suggesting that the anthropogenic NO3 contamination affected water quality in the study area. Fluorosis is a prevalent disease in tropical climates, but this is not entirely the case. Water with high F concentrations in wide geographical belts are related to: (i) sediments with marine sources in the mountainous regions; (ii) igneous rocks; and (iii) gneissic and granitic rocks. A classic example of the first reason covers Iran and Iraq through Turkey and Syria to the Mediterranean region, from Algeria to Morocco [38]. The F contamination was as severe as the NO3 contamination in the study area. Approximately 50% of the sampling sites revealed F and NO3 concentrations higher than the recommendations given by [33] (Figure 5). Studies have shown that approximately 90% of F in drinking water is absorbed in the digestive system, while only 30–60% of F is absorbed in food [33]. Therefore, there is a risk of skeletal fluorosis and dental fluorosis with excessive F concentrations, e.g., between 1.5 and 5.0 mg/L. High levels of F in drinking water can cause more diseases, such as hypertension, neurologic disorders, Alzheimer’s disease, etc., posing a serious threat to human health [39]. According to studies conducted by the Poldasht Health Center, available data and information confirm the prevalence of bone fluorosis [40].
F concentrations are often relative to the level of water–rock contact because F mainly originates from geology [41,42]. The study region is primarily occupied by basalts, which contain a large amount of F-bearing minerals [43]. The F concentration likely increased because of this in the study area. Compared to NO3 contamination, F contamination was highly severe in the study area. The NO3 concentration in the Maku–Bazargan–Poldasht water resources ranged from 0.23 to 167 mg/L with a mean of 32.2 mg/L. The threshold of public health standards on NO3 in drinking water set by the US EPA is 10 mg/L. Overall, 75% of the samples had NO3 concentrations that exceeded the US EPA standard of 10 mg/L (Table 2). In natural water resources, the higher concentrations of NO3 can have anthropogenic origins such as unsuitable surplus disposal, severe agriculture practices, and animal surplus [18,19,43]. Figure 5 shows a bar chart that shows the NO3 and F values of the study region relative to the US EPA. A wide variation in F concentrations are observed (Table 2), varying between 0.39 and 9.89 mg/L, with a mean of 2.94 mg/L. On the other hand, in most samples (54%), the F concentration exceeds its maximum allowable threshold (1.5 mg/L) for drinking water [33].

2.5. Drinking Water Quality Index (DWQI)

The Drinking Water Quality Index (DWQI) exposes the general quality of drinking water. This index can be determined by standardizing each hydrogeochemical parameter [44]. The DWQI switches the samples’ water quality parameters into a sole code and the analysis of water quality information is compared with data from the World Health Organization to check their appropriateness for drinking in Appendix A (Table A1). The DWQI calculation is based on three steps. First, each of the 14 parameters (EC, pH, major and minor ions, and nutrients) receives a weight (Wi) depending on its relative importance on the general water quality for drinking in Appendix A (Table A1). The steps for calculating the DWQI are estimated using Equations (2)–(5):
  • Consider the weights, W i , for each element (i) of drinking water constituents; these weights can be changed from 1 (minimum value) to 5 (maximum value) and are assigned based on expert opinion. The corresponding weights utilized in this study are presented in Appendix A (Table A1).
  • Determine the relative weight, W i , considering the number of elements (n):
    W i = w i i n w i
  • Calculate the quality rating scale ( q i ) of each parameter [45]:
    q i = c i s i × 100  
    where ci is the ith chemical concentration in the considered water sample (mg/L); according to WHO standards, the sub-index of the ith parameter ( S I i ) can be determined as follows (mg/L):
    S I i = W i × q i
  • By calculating the S I i for each parameter, the DWQI is determined using the following equation [46]:
    D W Q I i = i n S I i

2.6. Human Health Risk Index (HHRI)

The health impact of water contaminated with toxic chemicals is checked based on the model developed by the US Environmental Protection Agency [33]. In this regard, risk assessment map of water resources might include important data to better address both qualitative and quantitative issues [47,48]. An HHRI describes the nature and likelihood of adverse health effects resulting from chemicals found in contaminated environmental media, which may be harmful to humans [49]. In general, there is a great deal of risk associated with oral exposure to the dermal and inhalation pathways of exposure. Accordingly, a non-carcinogenic pollutants health risk evaluation (e.g., NO3 and F) is carried out [50,51]. The US EPA provides a “Regional Screening Levels (RSLs) for Chemical Contaminants” online calculator [13]. HQ values greater than 1 suggest an increased risk of developing non-carcinogenic consequences throughout life. The exposure to F and NO3 in these groups is estimated using Equations (6) to (10) [33]:
C D I O r a l = C W × I R × E F × E D B W × A T
H Q O r a l = C D I R f D O r a l
C D I D e r m a l = C W × C A × K p × E T × E F × E D × C F B W × A T
H Q D e r m a l = C D I R f D e r m a l
H I T o t a l = i = 1 n H Q i
where CDI is the chronic daily intake through the oral pathway [mg/(kg × day)]; C represents the contaminant concentration (i.e., F and NO3) in the water resources (mg/L); IR is the ingestion rate (L/day, IR = 2.5 L/day for adults, 0.78 L/day for Child); EF and ED are Exposure Frequencies (365 days/year) and Exposure Duration (standard exposure in the literature is suggested to be 30 years for adults and 12 years for children), respectively; BW and AT are the average body weight (Kg, BW = 57.5 Kg and 18.7 Kg for adults and children, respectively) and the average exposure time (days, AT = 23,360 days and 4380 days for adults and children, respectively), respectively; and finally, H Q i and RfD are the hazard quotient of ith pollutant and reference dose for non-carcinogenic contaminants, respectively. The RfD values for F and NO3 are 0.04 and 1.6 mg/(Kg × day), respectively [33]. HI is a hazard index that indicates the total non-carcinogenic risk. Non-carcinogenic risk values above 1 indicate health risks, while those below 1 indicate no health risks from drinking water containing toxic elements [33]. A detailed list of non-carcinogenic health risks can be found in Appendix A (Table A2 and Table A3) Water resources containing high levels of NO3 and F may pose high health risks to humans if consumed for long periods as drinking and bathing water sources [13,52]. Thus, these two contaminants were considered in assessing non-carcinogenic risk for children and adults (i.e., Females and Males). More than 90% of the study region’s population consumes untreated water resources for drinking. It was found that 55.81% and 65% of sampling points exceeded the prescribed levels of NO3 and F, respectively. Therefore, the consumption of such water in the region posed health risks to people of all ages.
According to Table 3, most samples fell within the F concentration range of 1–3 mg/L (38.33%), followed by 3–4 mg/L (6.6%). The number of samples greater than 4 also had a higher percentage (33%) in the Maku–Bazargan–Poldasht region, which may cause dental fluorosis and joint stiffness and brittleness in the region. NO3 concentrations of the samples showed that 21.6% of them were below the permissible limit, 25% were within the safe limit (NO3 < 10 mg/L), 58% were at health risk (NO3: 10–50 mg/L), and 8.33% were at a high health risk (NO3: 50–100 mg/L). Therefore, there was a very high health risk of NO3 (>100 mg/L) in 8.33% of samples, which causes methemoglobinemia in children (6 months old) and abortion in pregnant women [53].

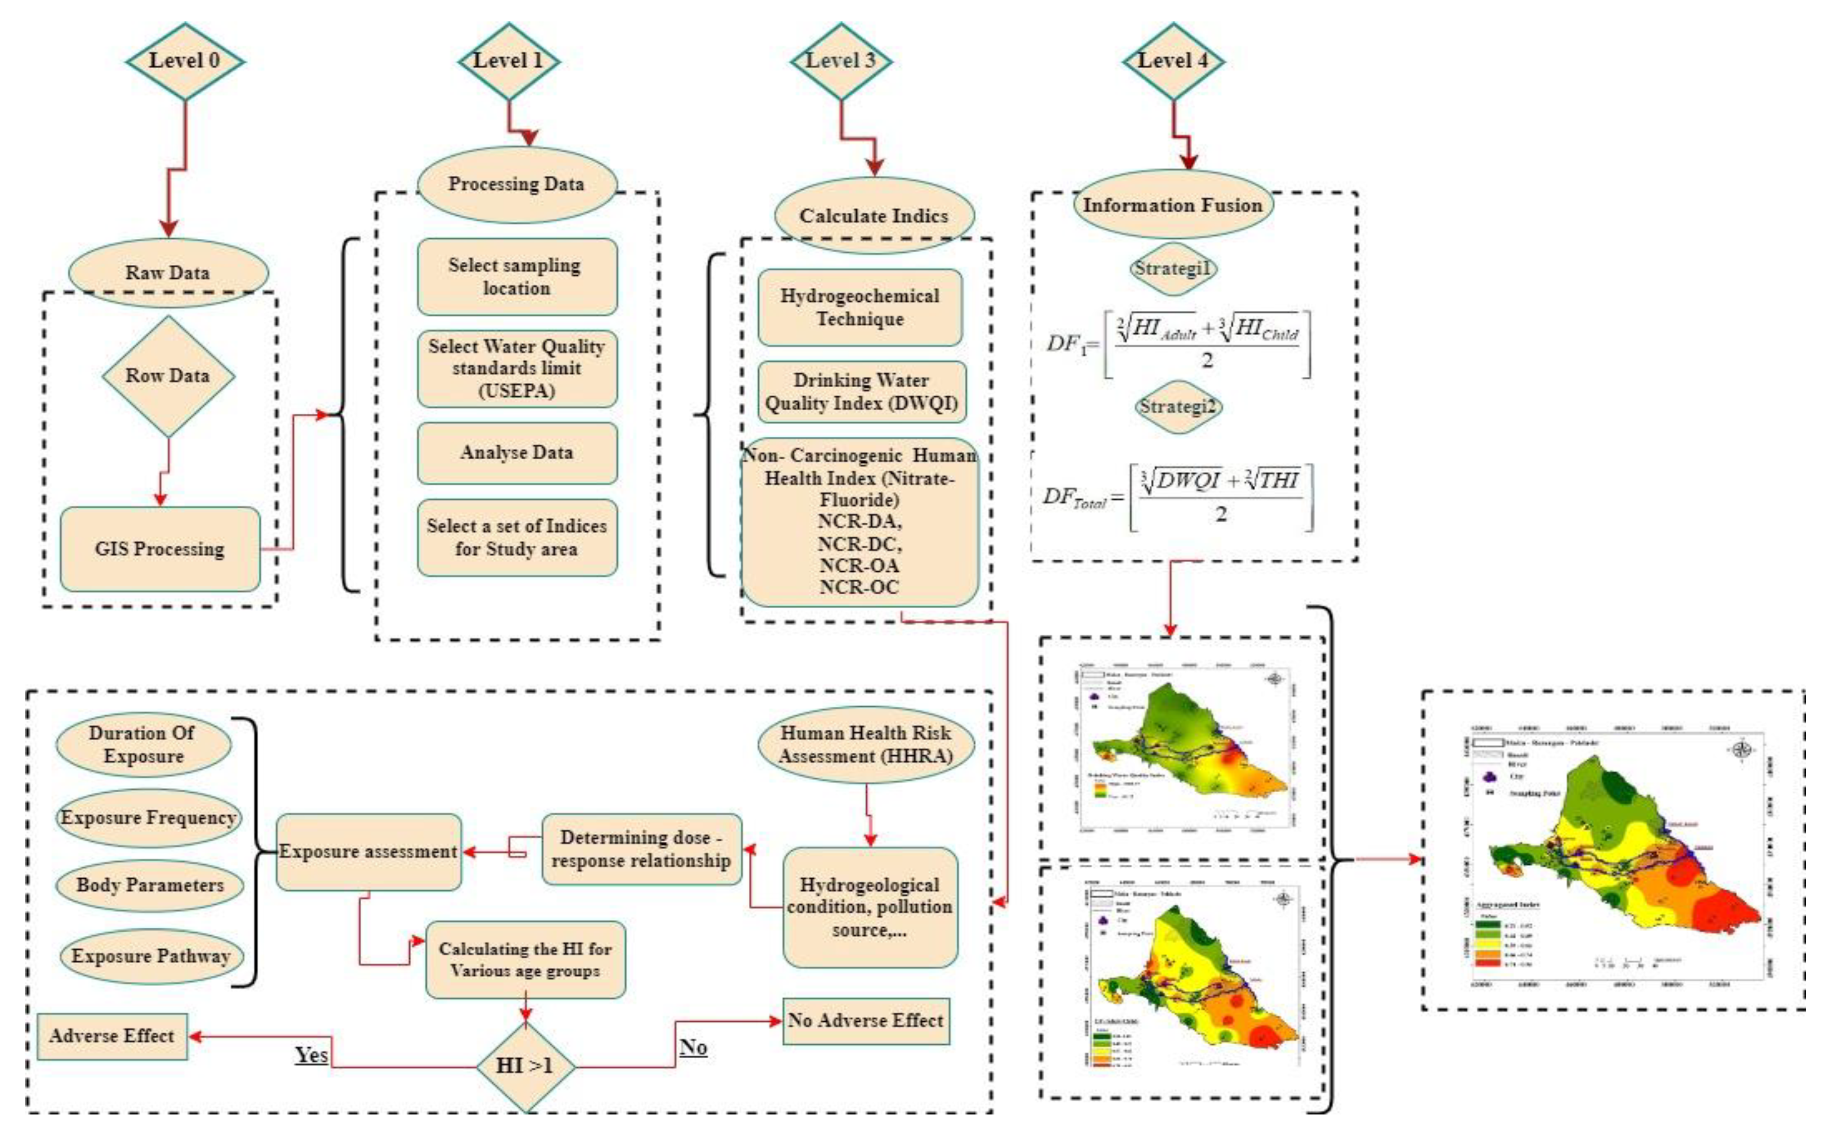
2.7. Information- Fusion

In accordance with Esteban et al. [54], it is essential to formulate a strategy in advance of engaging in any undertaking of information fusion to assist in solving the problem efficiently and robustly. Data fusion architecture is a platform that connects databases with the help of data fusion techniques to create an integrated system. It is a mathematical model that functions as the basis for merging data from several sources into one. This methodology is based on goals and combines low- and high-level information. This term refers to a variety of methods and approaches used to combine information to enhance quality, reduce uncertainty, or uncover novel knowledge or characters from the collected data. Theoretically, information fusion combines data from a number of diverse data sources [11]. Typically, it can be characterized at the signal level, the pixel level, the feature level, or the Top level [55], each with its own definitions and associated procedures. There is also another way of categorizing fusion in terms of top-level, medium-level, and high-level fusions [56]. Several techniques support information fusion, including statistical matching, grey relational analysis, moving average filters, and Bayesian inference [2,57].

3. Results and Discussion

3.1. Statistical Analysis

Table 2 gives a comprehensive statistical summary of the various physicochemical parameters (EC, pH, Ca2+, Mg2+, Na+, K+, NH4+, Cl, Br, SO42−, NO2, NO3, and F) as well as their comparison with the drinking water quality limits set by US EPA for 60 water samples. The main factors contributing to the significant F concentration in water resources are low velocity, rock chemistry, long water–rock interactions [58], and high HCO3 and Na+ concentrations. There was a positive correlation between F concentrations and the values of HCO3, Na+, and K+ concentrations, according to the correlation analysis (Table 4). Groundwater with dominant HCO3, Na+, and K+ concentrations originated from igneous rocks [59], so the correlation indicates that excessive F ion concentrations may have resulted from fluorine-bearing minerals associated with the source volcanic rocks as well as the application of fertilizers and pesticides on the field [60,61]. Generally, most ions were positively correlated with Cl, and particularly Na+, Mg2+, and SO42− showed a strong correlation with Cl, suggesting that they came from the same origin of saline water [62], meaning they are furthermore representative of a high occurrence of chemical weathering and the subsequent leaching of secondary salts. Chemical weathering, anthropogenic impacts, and salt leaching were the main factors contributing to the Cl contamination in the study area. The correlation of F and the other ions showed that it is poorly correlated with Ca2+ and Mg2+ and positively correlated with Na+, K+, and HCO3. It can therefore be concluded that high F concentrations exist in water with low Ca2+ and Mg2+ levels, as well as in water with high Na+ levels. Low Ca2+ resulted from the intense cation exchange reaction between Na+ and Ca2+. The presence of a high HCO3 and an alkaline pH in the samples resulted in the precipitation of Mg2+ as Dolomite and Ca2+ as Calcite. According to Sarma and Rao [63], this process leads to a higher concentration of Na+ in water resources. It is evident that HCO3 is highly correlated with F, indicating that volcanic rock weathering is the major cause of F formation [60]. Low levels of Ca2+ and Mg2+ in the groundwater within the area may be contributing to high concentrations of F in the water resources.

3.2. Factor Analysis (FA)
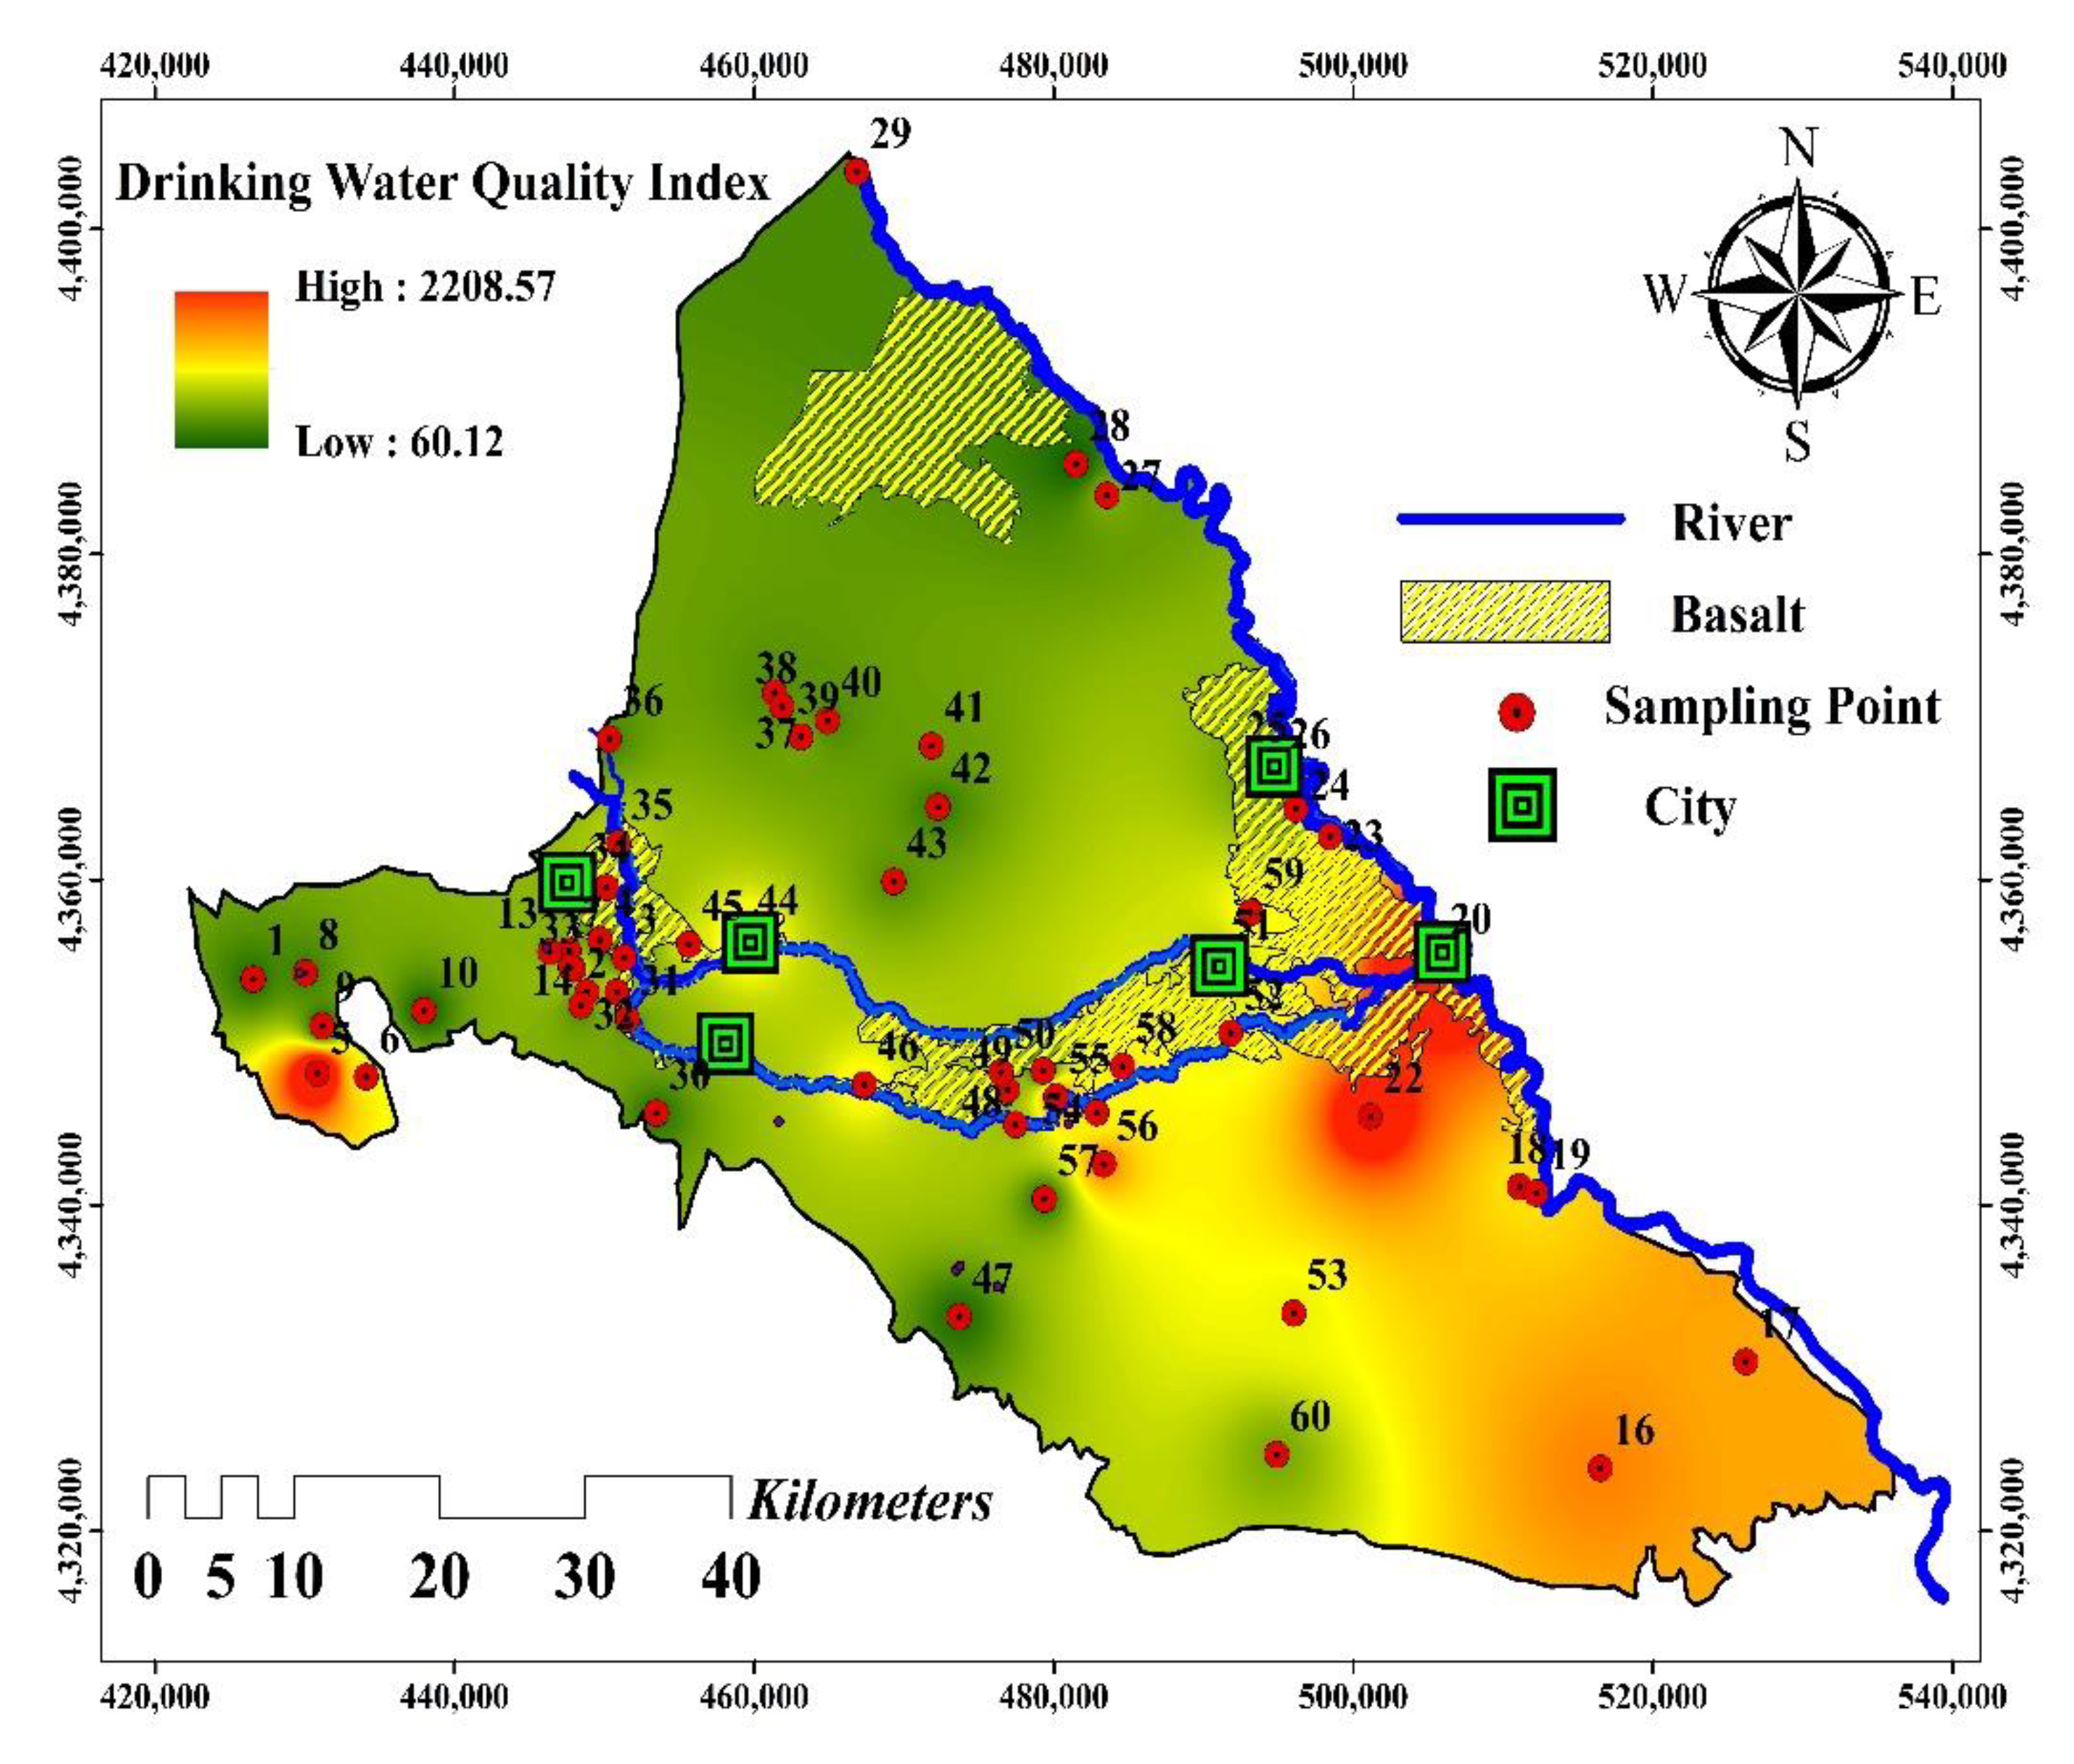
Factor analysis (FA) is a method that has been successfully used by different authors for the assessment of water quality and chemistry [64], since it helps in the distribution analysis as well as in tracing the source(s) of the chemical components in water [65]. The factor analysis for the physicochemical parameters in the water resources of the Maku–Bazargan–Poldasht region is given in Table 5. A total of four components were extracted based on the results of the FA analysis, which accounted for 81.83% of the variance in the data. A rotating factor matrix for the parameters studied can be found in Table 5. The interpretability of the factor loads without rotation is difficult, so in order to make the factors more interpretable, the factors were rotated. The results showed that the FA1 described 35.86%, the FA2 described 18.07%, the FA3 described 10.45%, and the FA4 described 7.51% of the total variance. With a variance of 35.86%, FA1 was positively and considerably related to EC, Na+, K+, Ca2+, Mg2+, Cl, and SO42− concentrations. These associations indicated: (i) the interaction between water and rocks in the study area; and (ii) the general trend of dissolution in waters within the study area. This interaction was unlimited to one site, but rather the flow through the aquifer encouraged the tendency for further interactions and the dissolution process to occur in the future. With a total variance of 18.07%, FA2 can be associated with the concentration of F and HCO3, and F anomalies resulted predominantly from geogenic processes. The F concentration in the samples with a high HCO3 concentration was higher than those with a low HCO3 concentration. The FA3, with a total variance of 10.4%, correlated well with pH and Br- concentrations, and the existence of NO3 with negative loading indicated anoxic conditions in the study area [66], and denitrification and NO3 reduction are related geochemically [67]. A major source of anthropogenic NO3 and nitrite is artificial fertilizers, and various industrial processes also produce NO3 in their waste streams. In this study, the spatial distributions of nitrate, nitrite, and ammonium were investigated. High-NO3, low-NO2, and high-NH4+ water resources were observed. The proportions of high-NO3 and high-NH4+ water resources in urbanized areas were nearly or more than twice those in non-urbanized areas (Figure 6). High NO3 levels in the Maku–Bazargan–Poldasht aquifers probably originated mainly from industrialization accompanied by wastewater leakage. Urbanization accompanied by the leakage of domestic sewage, is likely to be another main driving force for high NO3 levels in the water resources. The high loading of NO3 ions indicated that there was anthropogenic input to the system via the leaching of fertilizers from farming regions, which is linked to the interaction of surface water with the geological formations in the area. The element Br- can originate from old rivers and seas, as well as from animal waste, which can have a profound impact on water supply quality and create contaminations that are mainly caused by the impact of human activities related to farming, with slight influences from domestic sewage. The total variance of 7.51% can be attributed to the FA4, which is related to the concentration of NO2.

3.3. DWQI

The DWQI was employed to assess the status of the water resource quality for drinking water objects in the Maku–Bazargan–Poldasht area. Unlike previous studies on water quality, which used a common classification for drinking purposes, this study determined the ranges between excellent and unsuitable water quality based on a rational classification. As a result, the DWQI was classified as belonging to the excellent water quality class if it was smaller than the minimum data utilized to calculate the Drinking Water Quality Index; the good water quality class if it was among US EPA standards and the average of the data used; the poor quality class if it ranged from the safe limit to the average data; and the unsuitable class if the results of calculating the drinking water index were between the average to maximum data. The calculated DWQI ranged from 51.19 to 2200, with a mean of 502.71. In total, 28 samples (46%) were classified as poor and 22 samples (36%) as unsuitable in terms of their quality, while the remaining 10 samples were classified as good for drinking (Table 6). The water samples were analyzed for F and NO3 concentrations and then the rational (i.e., proposed classification) and conventional DWQI values were calculated as follows: (i) classify the concentrations of NO3 and F into three categories: safe (<10 mg/L), health risk (10–50 mg/L), and high health risk (>50 mg/L), and safe (<1 mg/L), dental fluorosis (1–4 mg/L), and defects in knees—crippling fluorosis (>4 mg/L), respectively; (ii) classify the DWQI (conventional–rational) into “Good”, “Poor”, and “Unsuitable” bands; (iii) assign a ‘3′ to a given index performance at the samples if the difference in the categories of F-NO3 concentration and the DWQI value is 0 but assign scores of two or one when the differences are one or two, respectively; and (iv) add the scores for the DWQI and calculate their Correlation Index (CI). Consider the following example for obtaining the CI for the prediction rational (proposed classification) DWQI. The results showed that there were 38 and 30 samples for the same class, 19 and 24 samples with a difference of one in the categories of the F-DWQI and nitrate-DWQI values, respectively, and 3 and 6 with a difference of two in the categories of the F-DWQI and nitrate-DWQI values, respectively. A higher CI means a higher correlation. The coincidence of the water samples (the F-NO3 concentration) and the predicted DWQI categories are presented in Table 6. Ultimately, this indicated that a higher percentage of the water samples from the study region were unsuitable in terms of quality. The spatial distribution of the DWQI (Figure 7) showed that the east and southeast of the area had a high DWQI compared to the north and west of the Maku–Bazargan–Poldasht area. The water quality along the Zangmar and Sari Su rivers has deteriorated in recent years, and the worst quality for drinking occurred at the confluence of the two rivers with the Aras River.

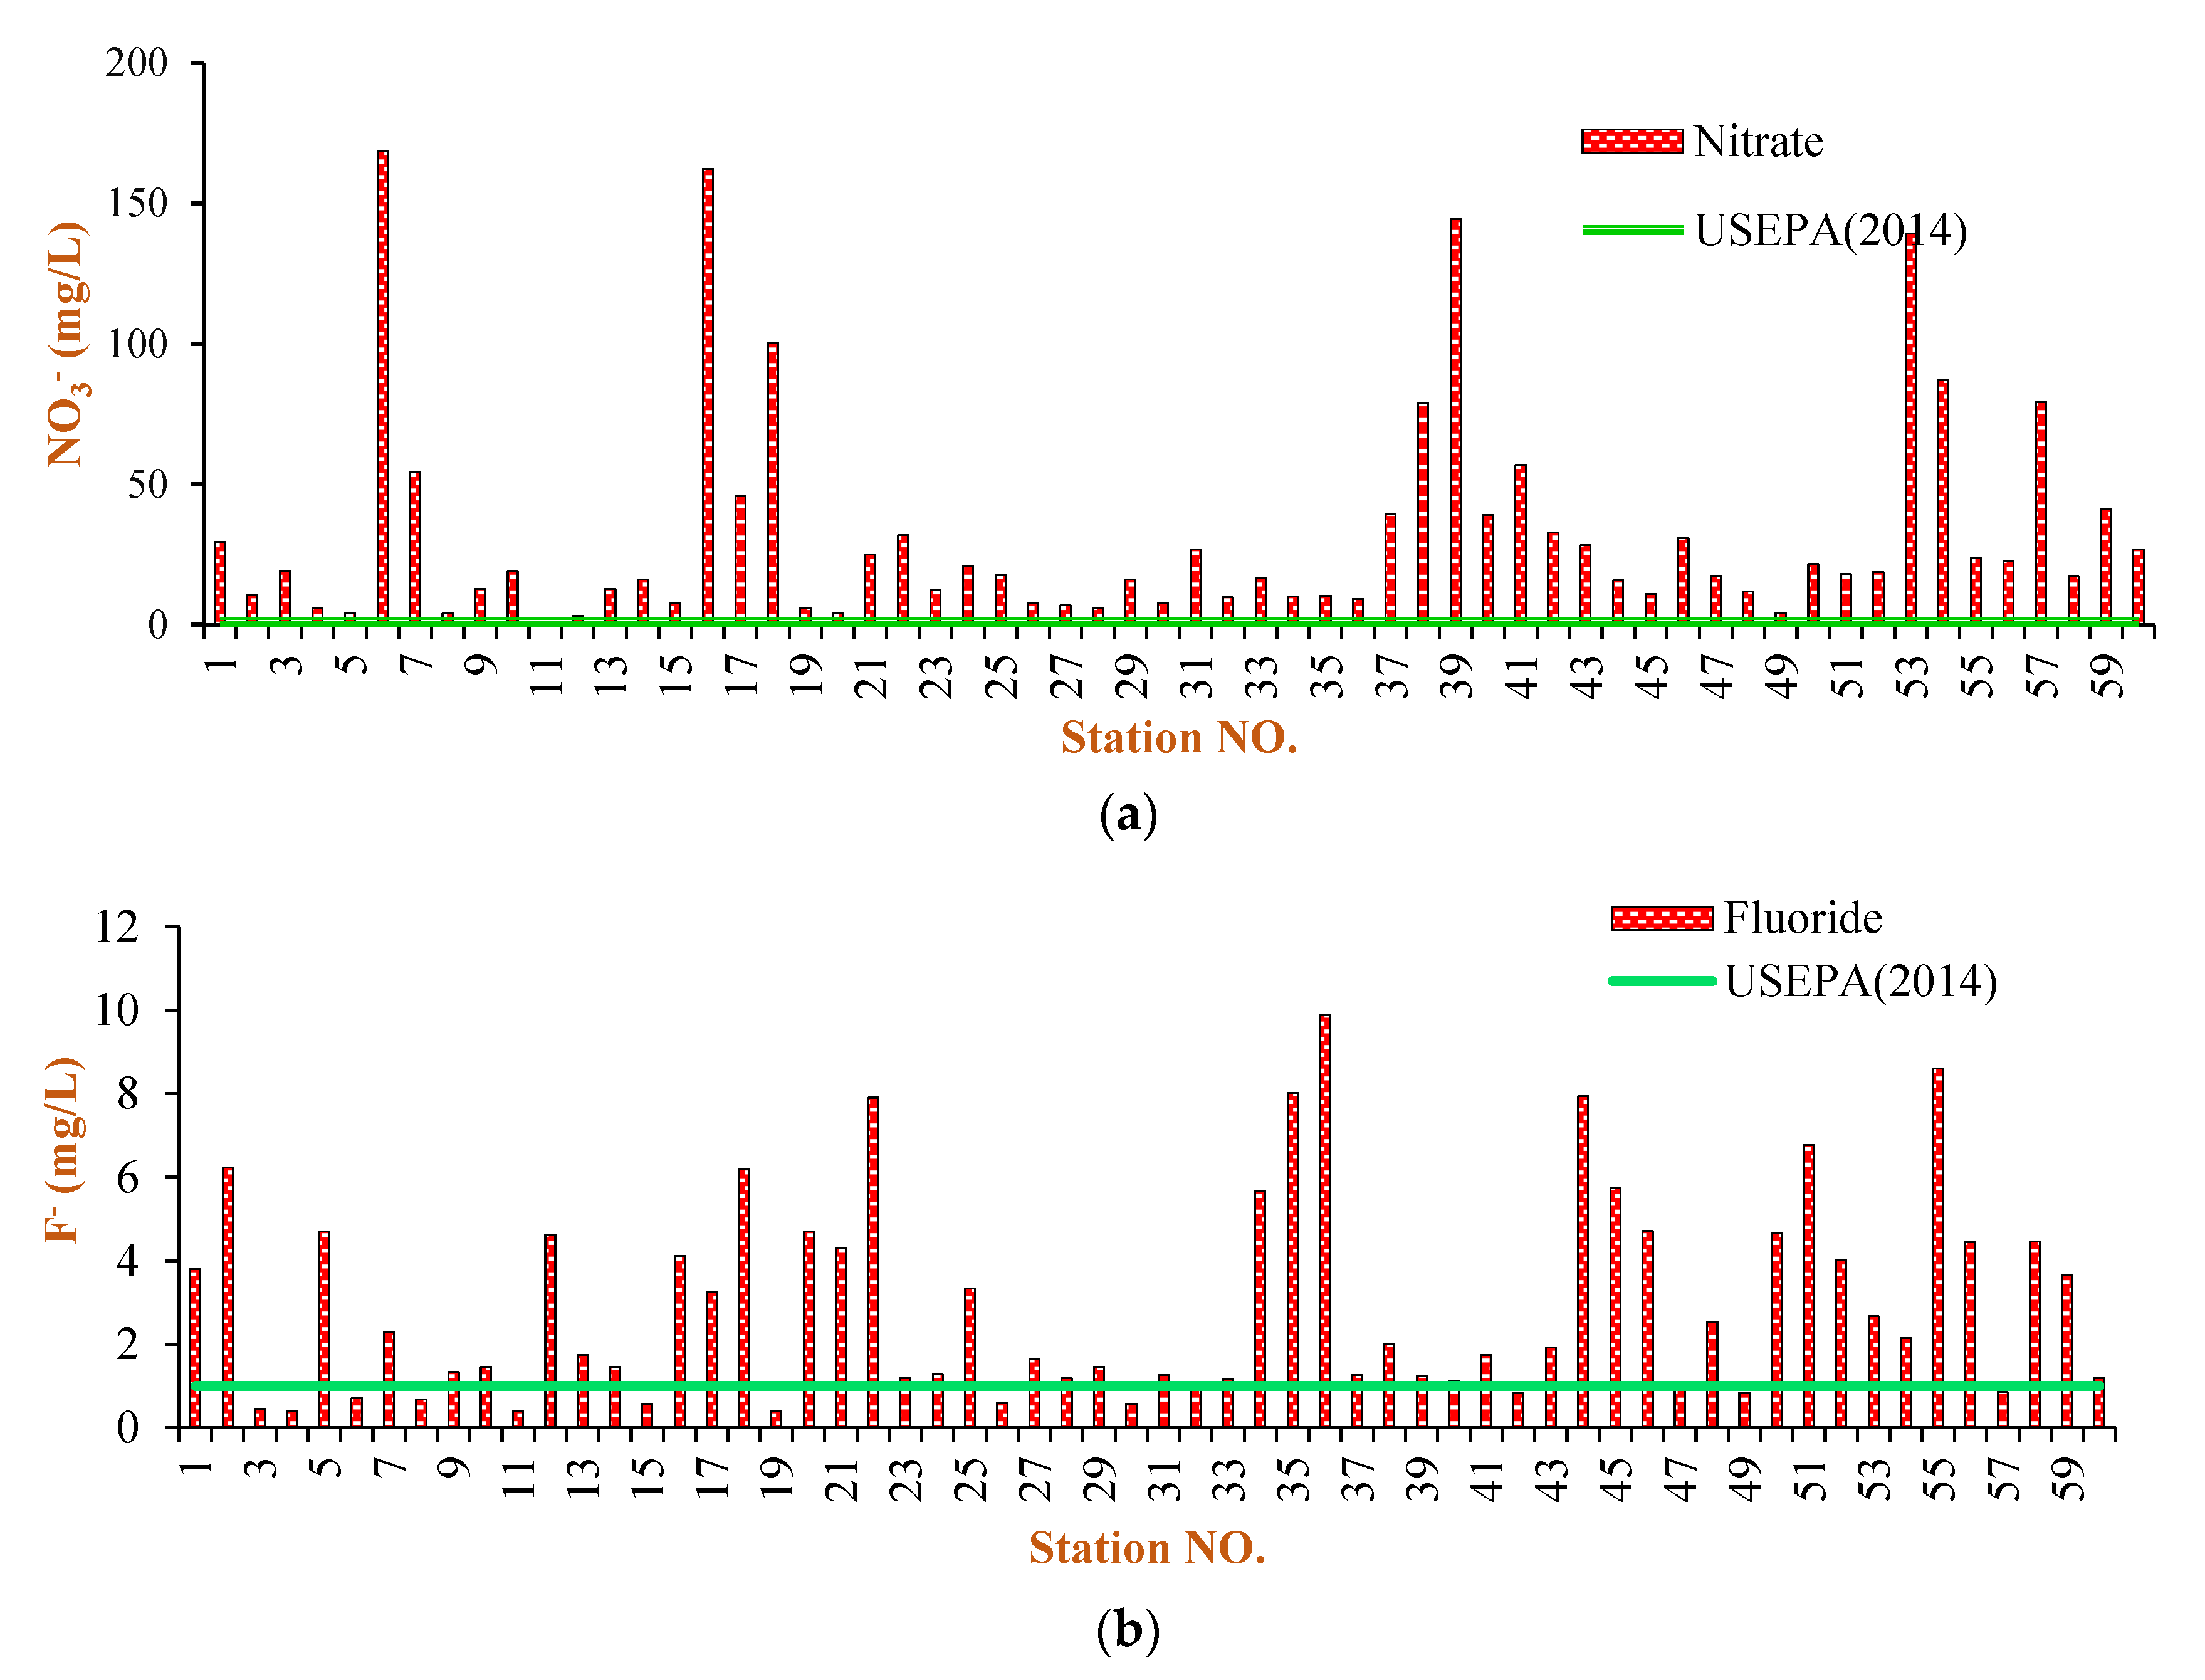
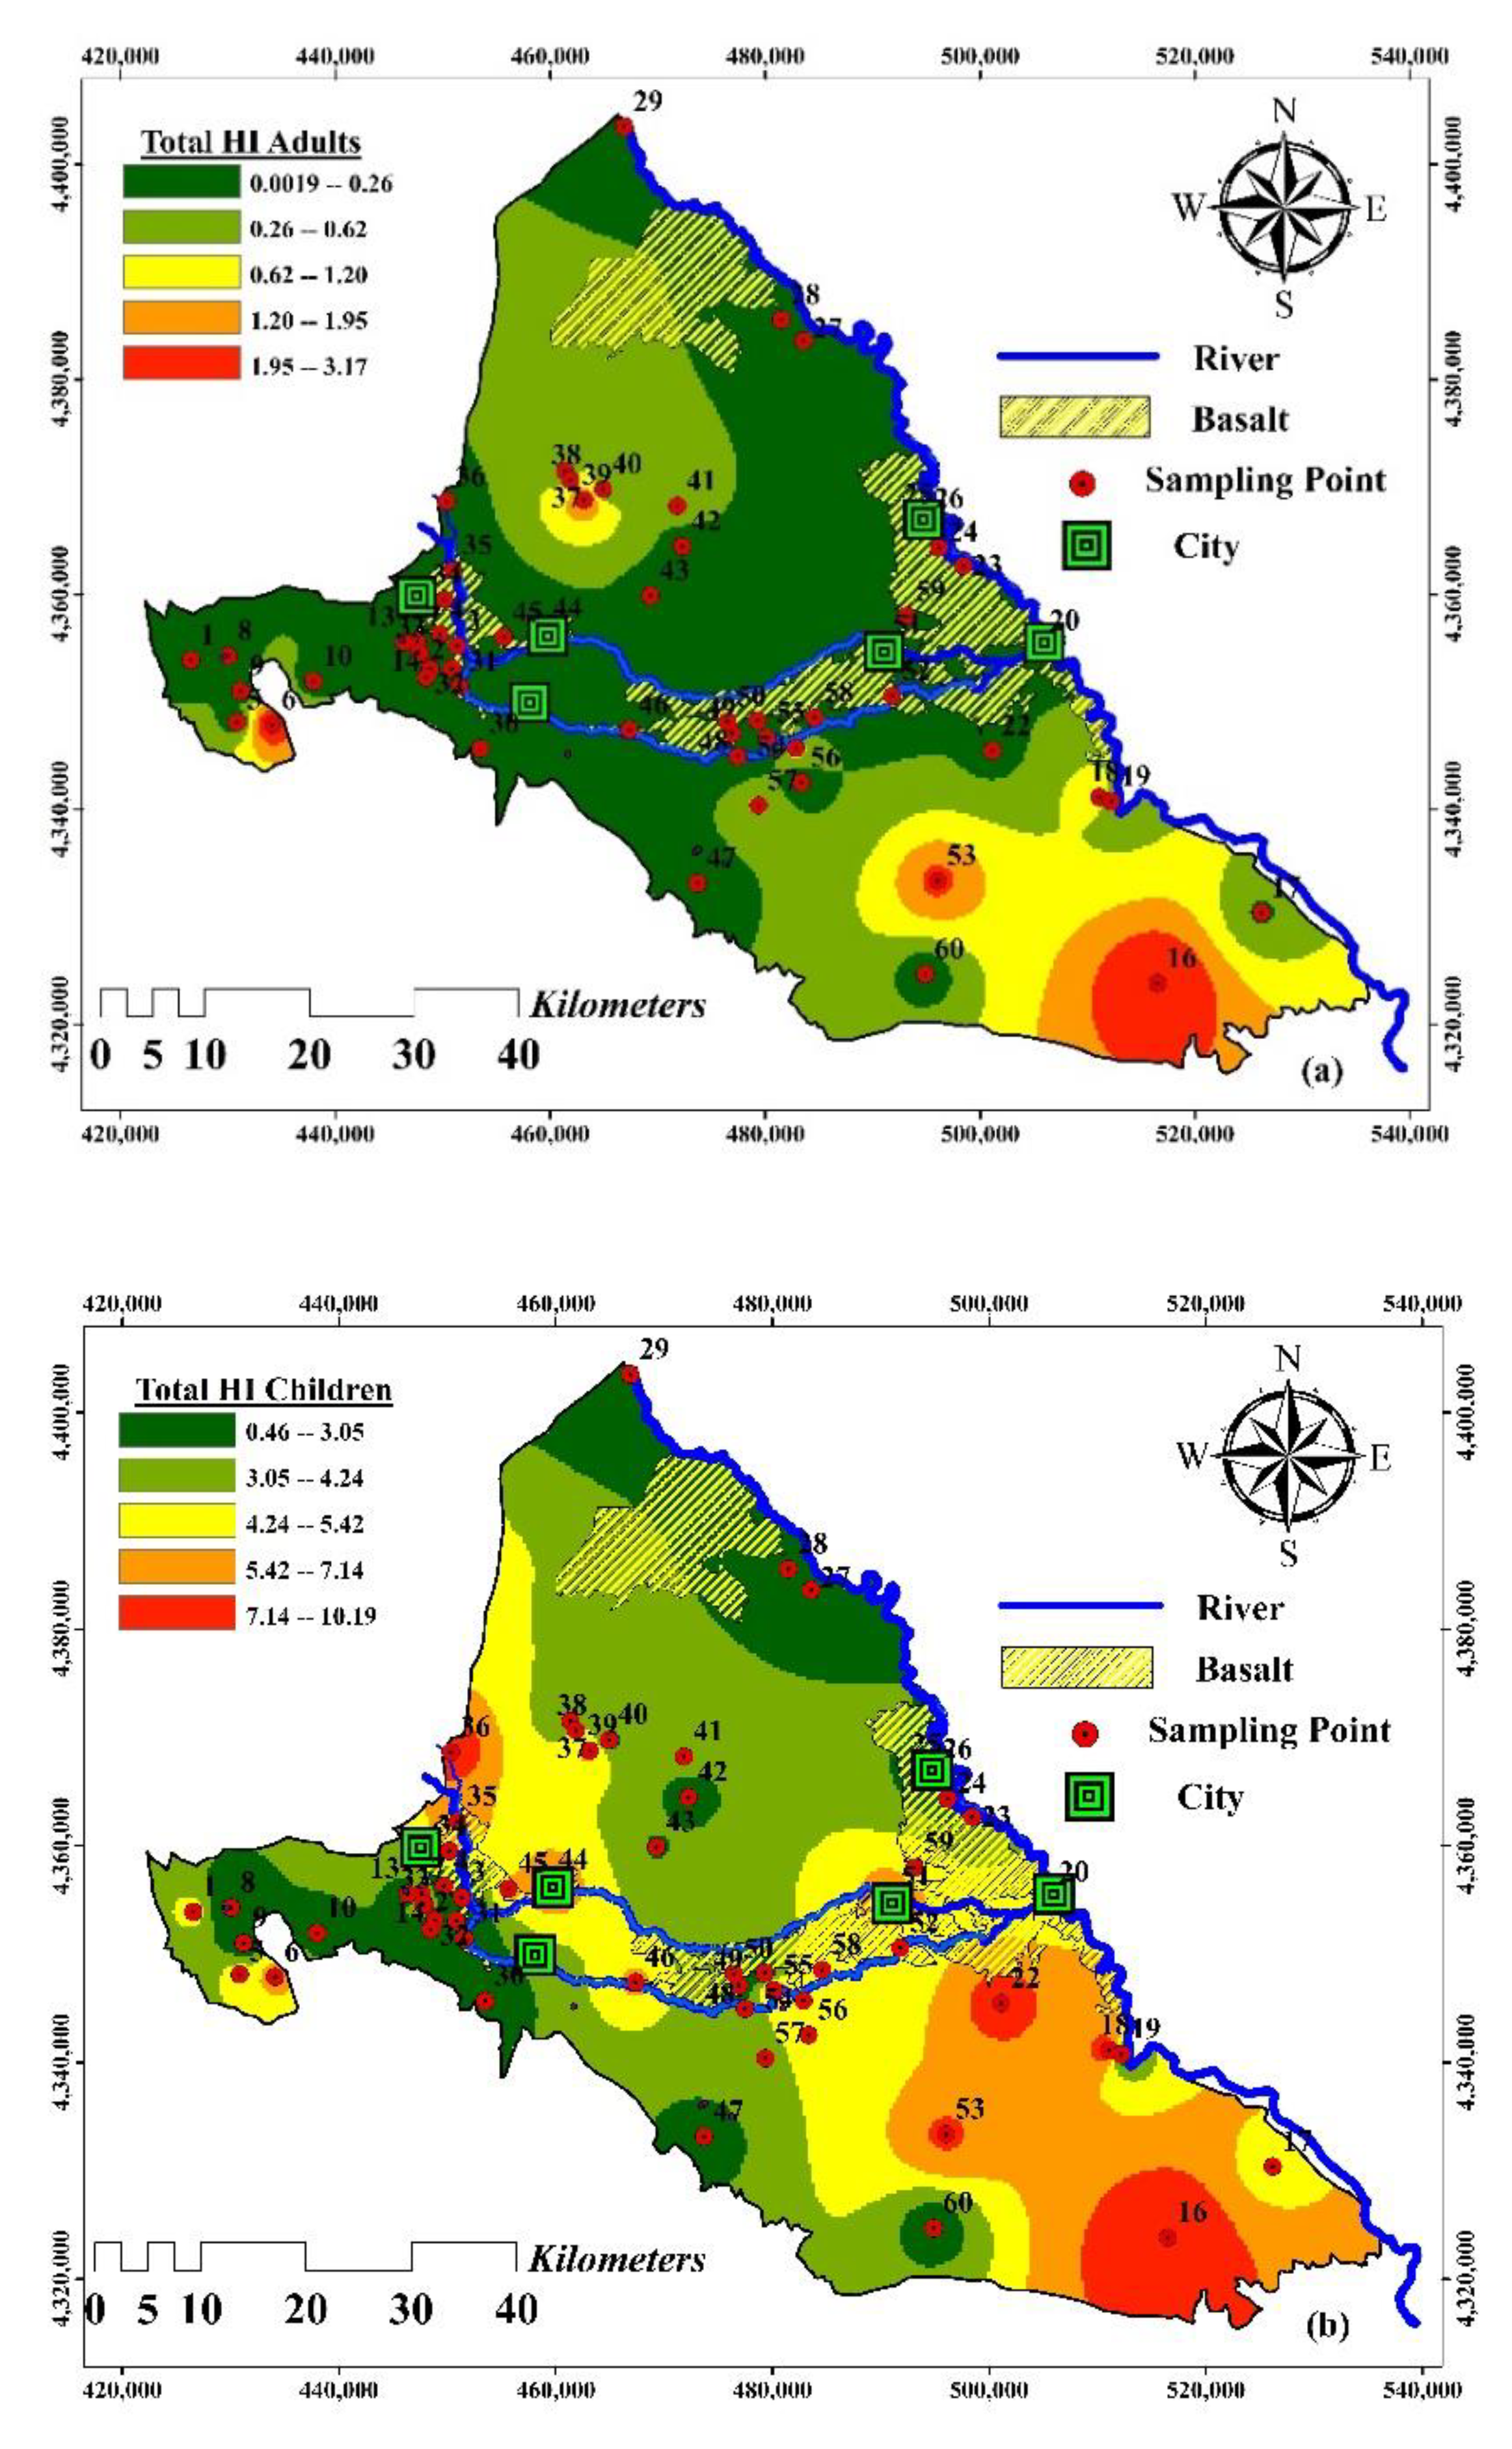
3.4. Non-Carcinogenic Health Risk Assessment
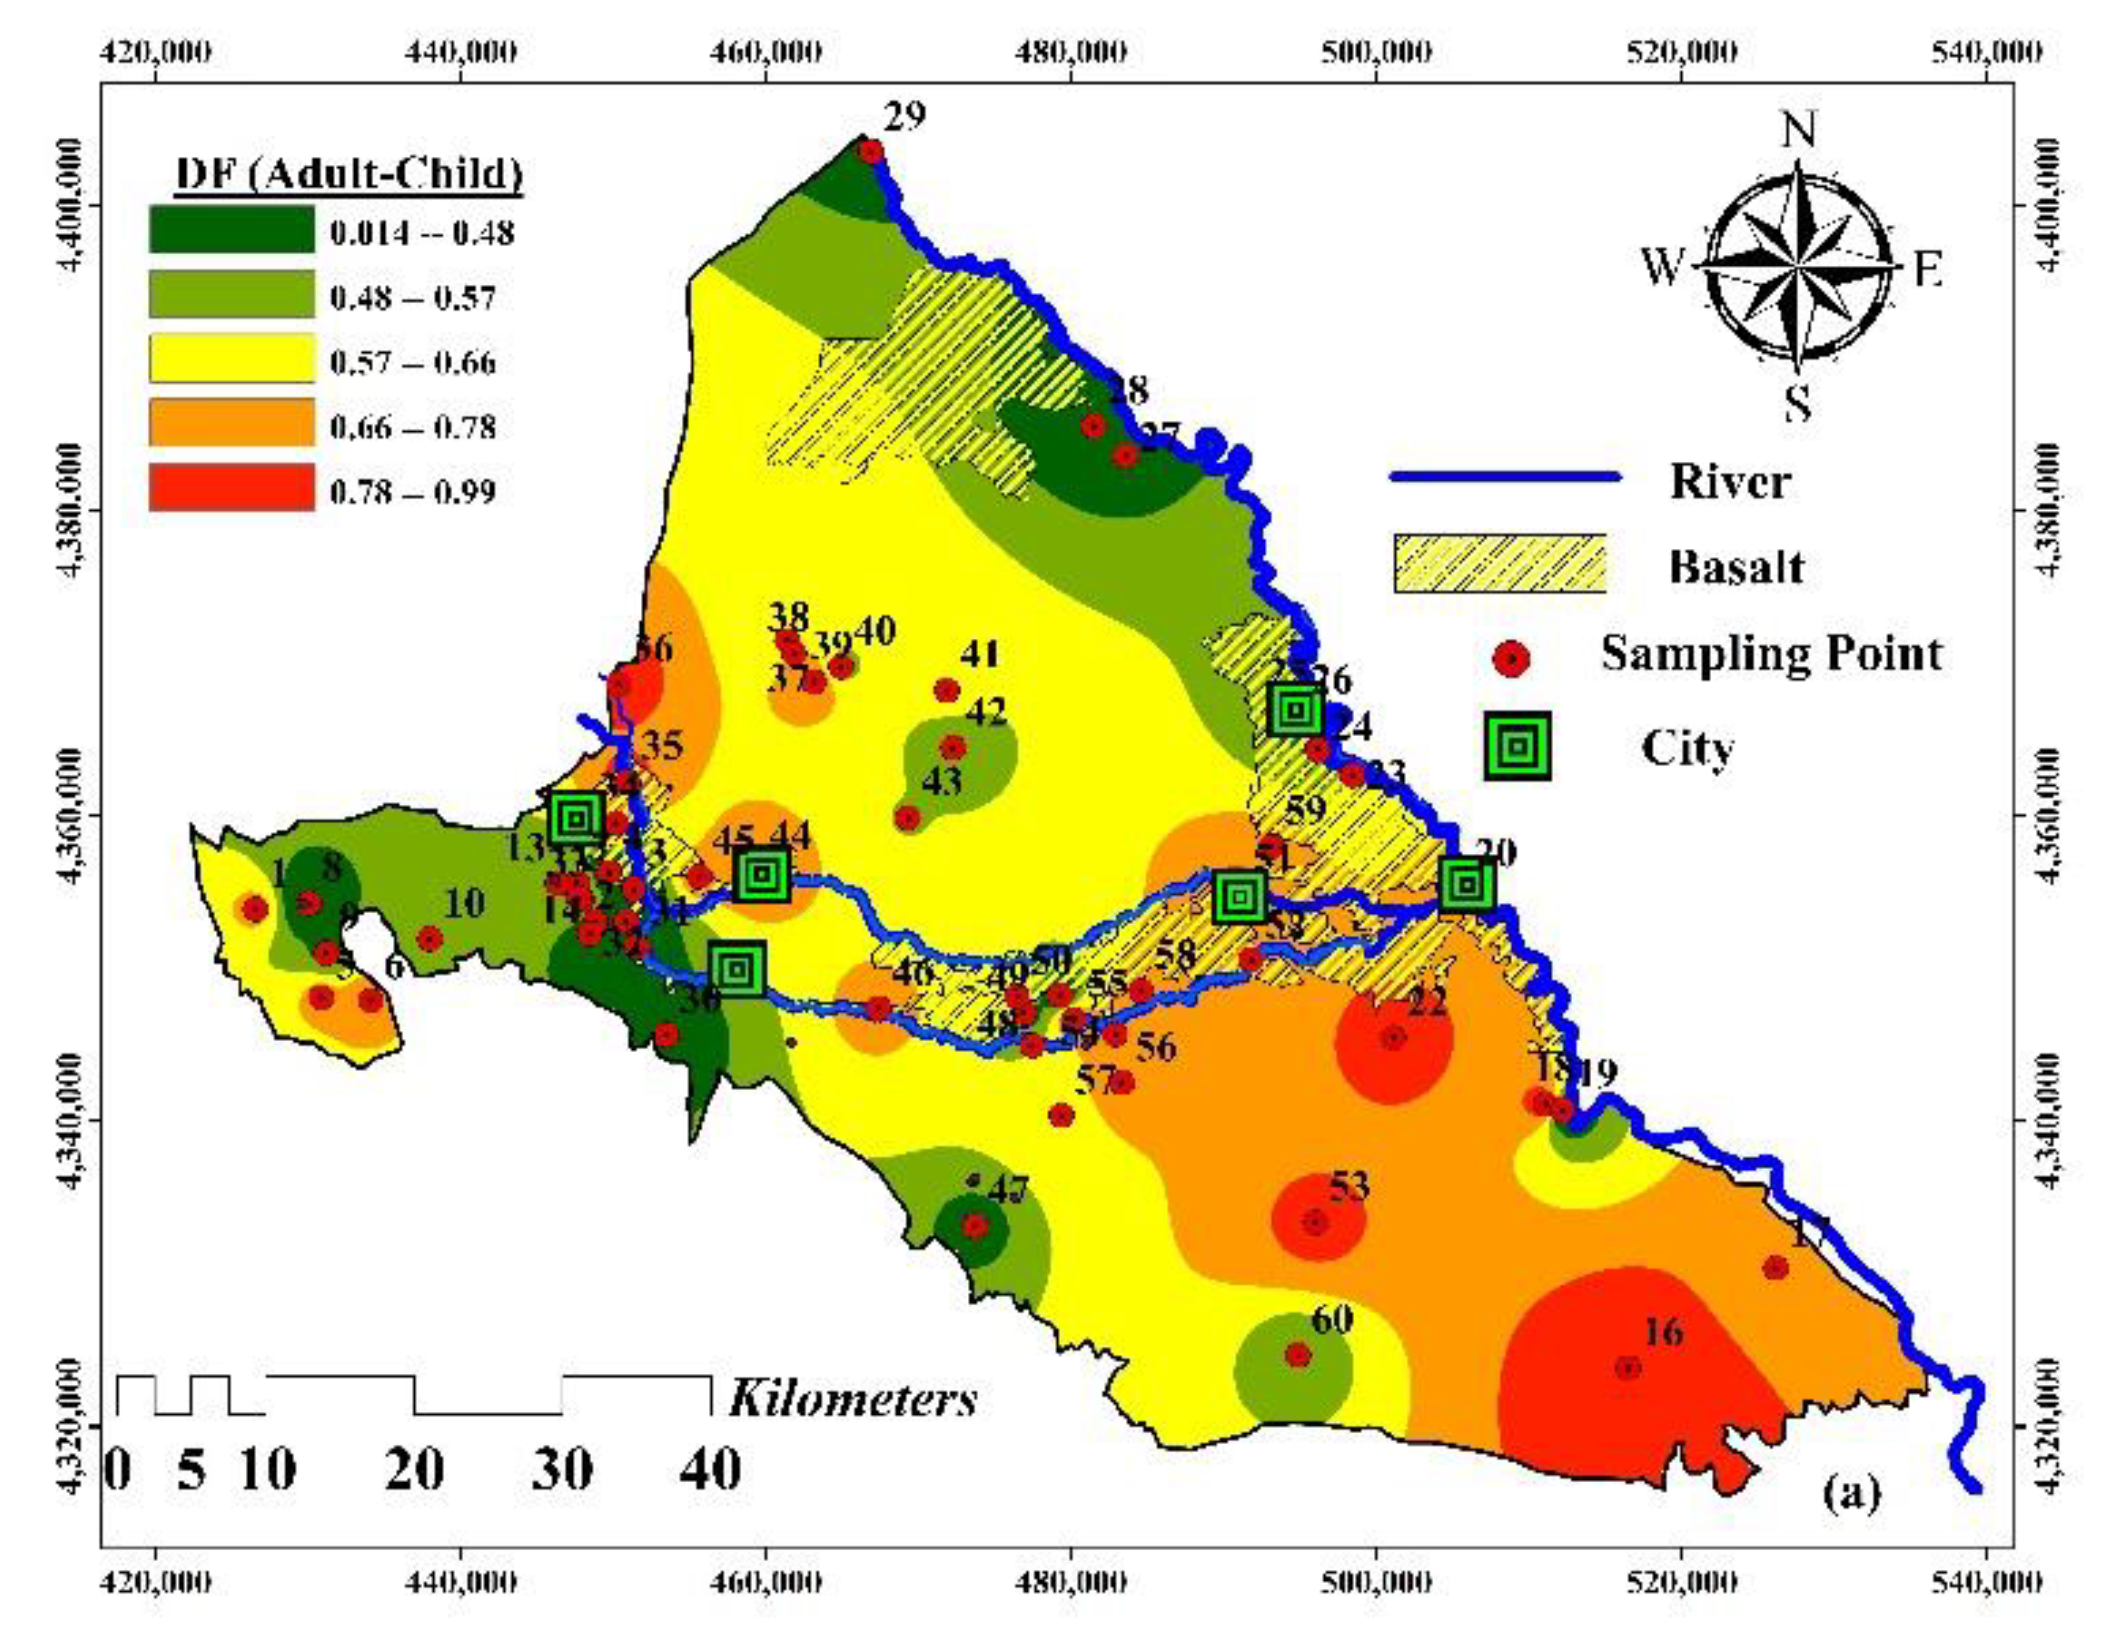
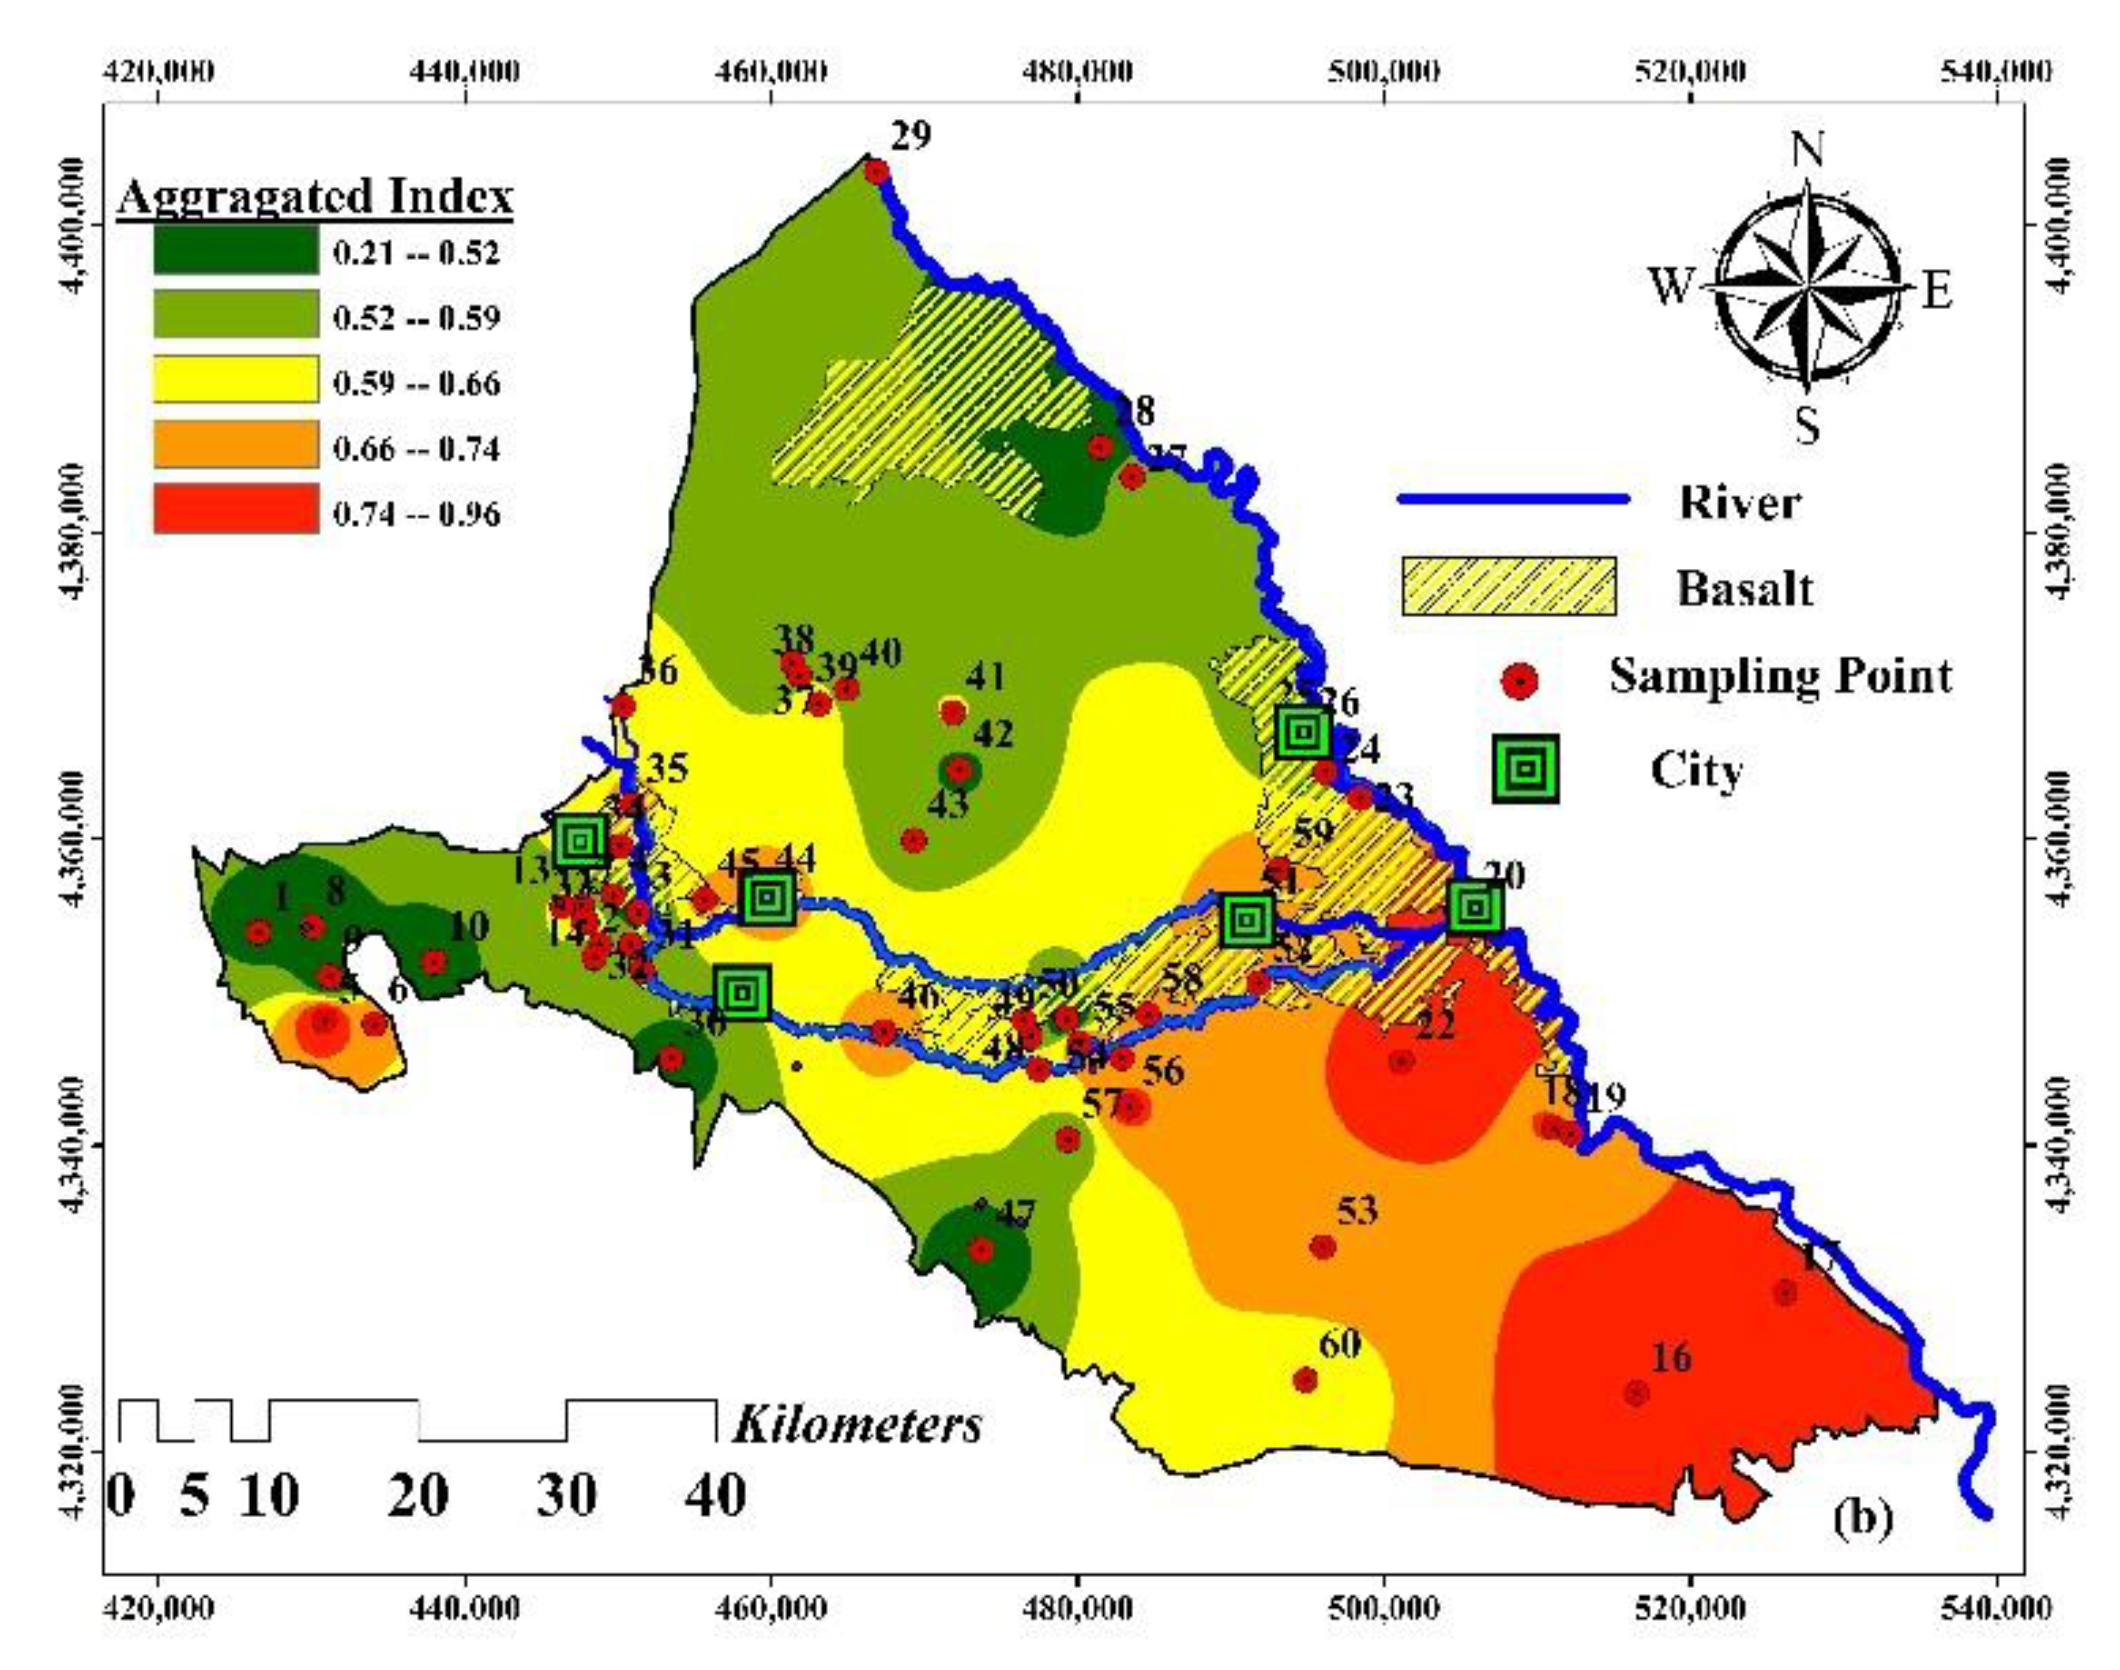
A non-carcinogenic hazard is mainly associated with the consumption of portable water and contact with the skin. Three factors influence the CDI values: the concentration of the contaminants, the rate at which the water is ingested, and the individual’s body weight. The CDI values in children are comparatively higher than those in adults. The child’s HQ oral intake values range from 0.27 to 6.82, and the adult’s HQ oral intake ranges from 0.31 to 7.95 (with an average of 2.94). In the case of children, the dermal intake ranges from 0.002 to 1.7, and in the case of adults, the oral intake ranges from 0.001 to 0.96 (with an average of 0.18). The spatial distribution of human health risk for both children and adults (Figure 8) along the study area indicates that high HI values (i.e., high HHR) prevail in the southeast and patches in the west.
Health risks were assessed using the model developed by the US EPA to assess the health risks related to this study area. A summary of the calculated results of the non-carcinogenic health risks posed by NO3 and F contaminations through the pathways of drinking water contamination for adults and children is explicitly presented in Table 6 and Figure 9. It summarizes both the oral intake and dermal intake of each of the different groups of inhabitants in the studied region, as well as the total hazard index (THI) corresponding to each group of inhabitants. In children and adults, the HQ values ranged from 0.002 to 1.7 and 0.0013 to 3.2, respectively, depending on the dermal pathway. The mean dermal contact values for children and adults were 0.32 and 0.18, respectively. The hazard index values for children and adults (HQOral + HQDermal = HI) ranged from 0.000014 to 7.2 for children and from 0.0000062 to 3.2 for adults. The body weight of a child is lower than that of an adult. The estimated hazard quotient for children is higher than for adults. Non-carcinogenic risks to children in this region were higher than those for adults. The mean values for all the groups of people (i.e., children and adults) were, however, within the allowable limits (HI < 1) [53]. Since most samples present a high level of non-carcinogenic risks, they are not suitable for direct consumption. According to the results, the majority of the samples were not fit for human consumption, as they posed unacceptable health risks to both adults and children alike. Children are at an increased risk when compared to adults. Through the ingestion pathway, infants are the most vulnerable group of people. It is evident from the hazard index that the majority of the samples (i.e., 72% and 60%) may pose a risk to adults and children, respectively. There is a need to take immediate remedial steps in this region to prevent the residents from being exposed to NO3 and F through ingestion. Moreover, the results of the total risk via ingestion and dermal contact showed that ingestion was the predominant pathway. Different strategies can be used to reduce the risk of dental fluorosis, including (a) the use of alternative water sources, (b) improving nutrition, and (c) the defluoridation of water. The defluoridation methods can be divided into adsorption ([68,69,70,71,72]), participation/coagulation [73], electrocoagulation [74,75,76,77,78], nanofiltration [79,80]), and nanofiltration [81]. In addition, F-resistant bacteria play a crucial role in the bioremediation and biotransformation of anions in order to convert them into less available and less harmful forms.

3.5. Data Fusion

The main data integration objectives in this research are: (i) refining data and improving data quality; (ii) inventing additional inferences and rising advantage from data; (iii) improving understanding and decisions. To incorporate datasets from numerous sources, specialized data fusion techniques can be incorporated into the HHRI framework recommended earlier by the National Academy of Sciences [82]. In this study, information fusion was performed in order to combine index values by DWQI and HHRI indicators to produce a comprehensive risk map, a scheme depicted in and outlined below [83],
D F 1 = H I A d u l t 2 + H I C h i l d 3 2
D F T o t a l = D W Q I 3 + T H I 2 2
The data-fused HI (i.e., aggregating HI for both children and adults) values ranged between 0.01 and 0.99 in the Maku–Bazargan–Poldasht area. The spatial distribution of the fused Health Index (Figure 9a) shows that the water resources of the southeast regions had a greater health hazard, followed by the west of the area.
Total data-fused HI values varied from 0.21 to 0.96. Based on the aggregated HI (i.e., combining the DWQI and data-fused HI at Strategy 1), the southeast of the area bore the highest risk to the people consuming water. On the other hand, it was observed that aggregating the DWQI to HI may decrease the health risk in the central parts of the Maku–Bazargan–Poldasht area, even though there is a greater risk in Strategy 1 than in Strategy 2. The aggregated index was compiled from the information from Strategy 1 by implementing an unsupervised learning plan, which is shown to capture information on the adverse water quality and health risks associated with water of poor quality.

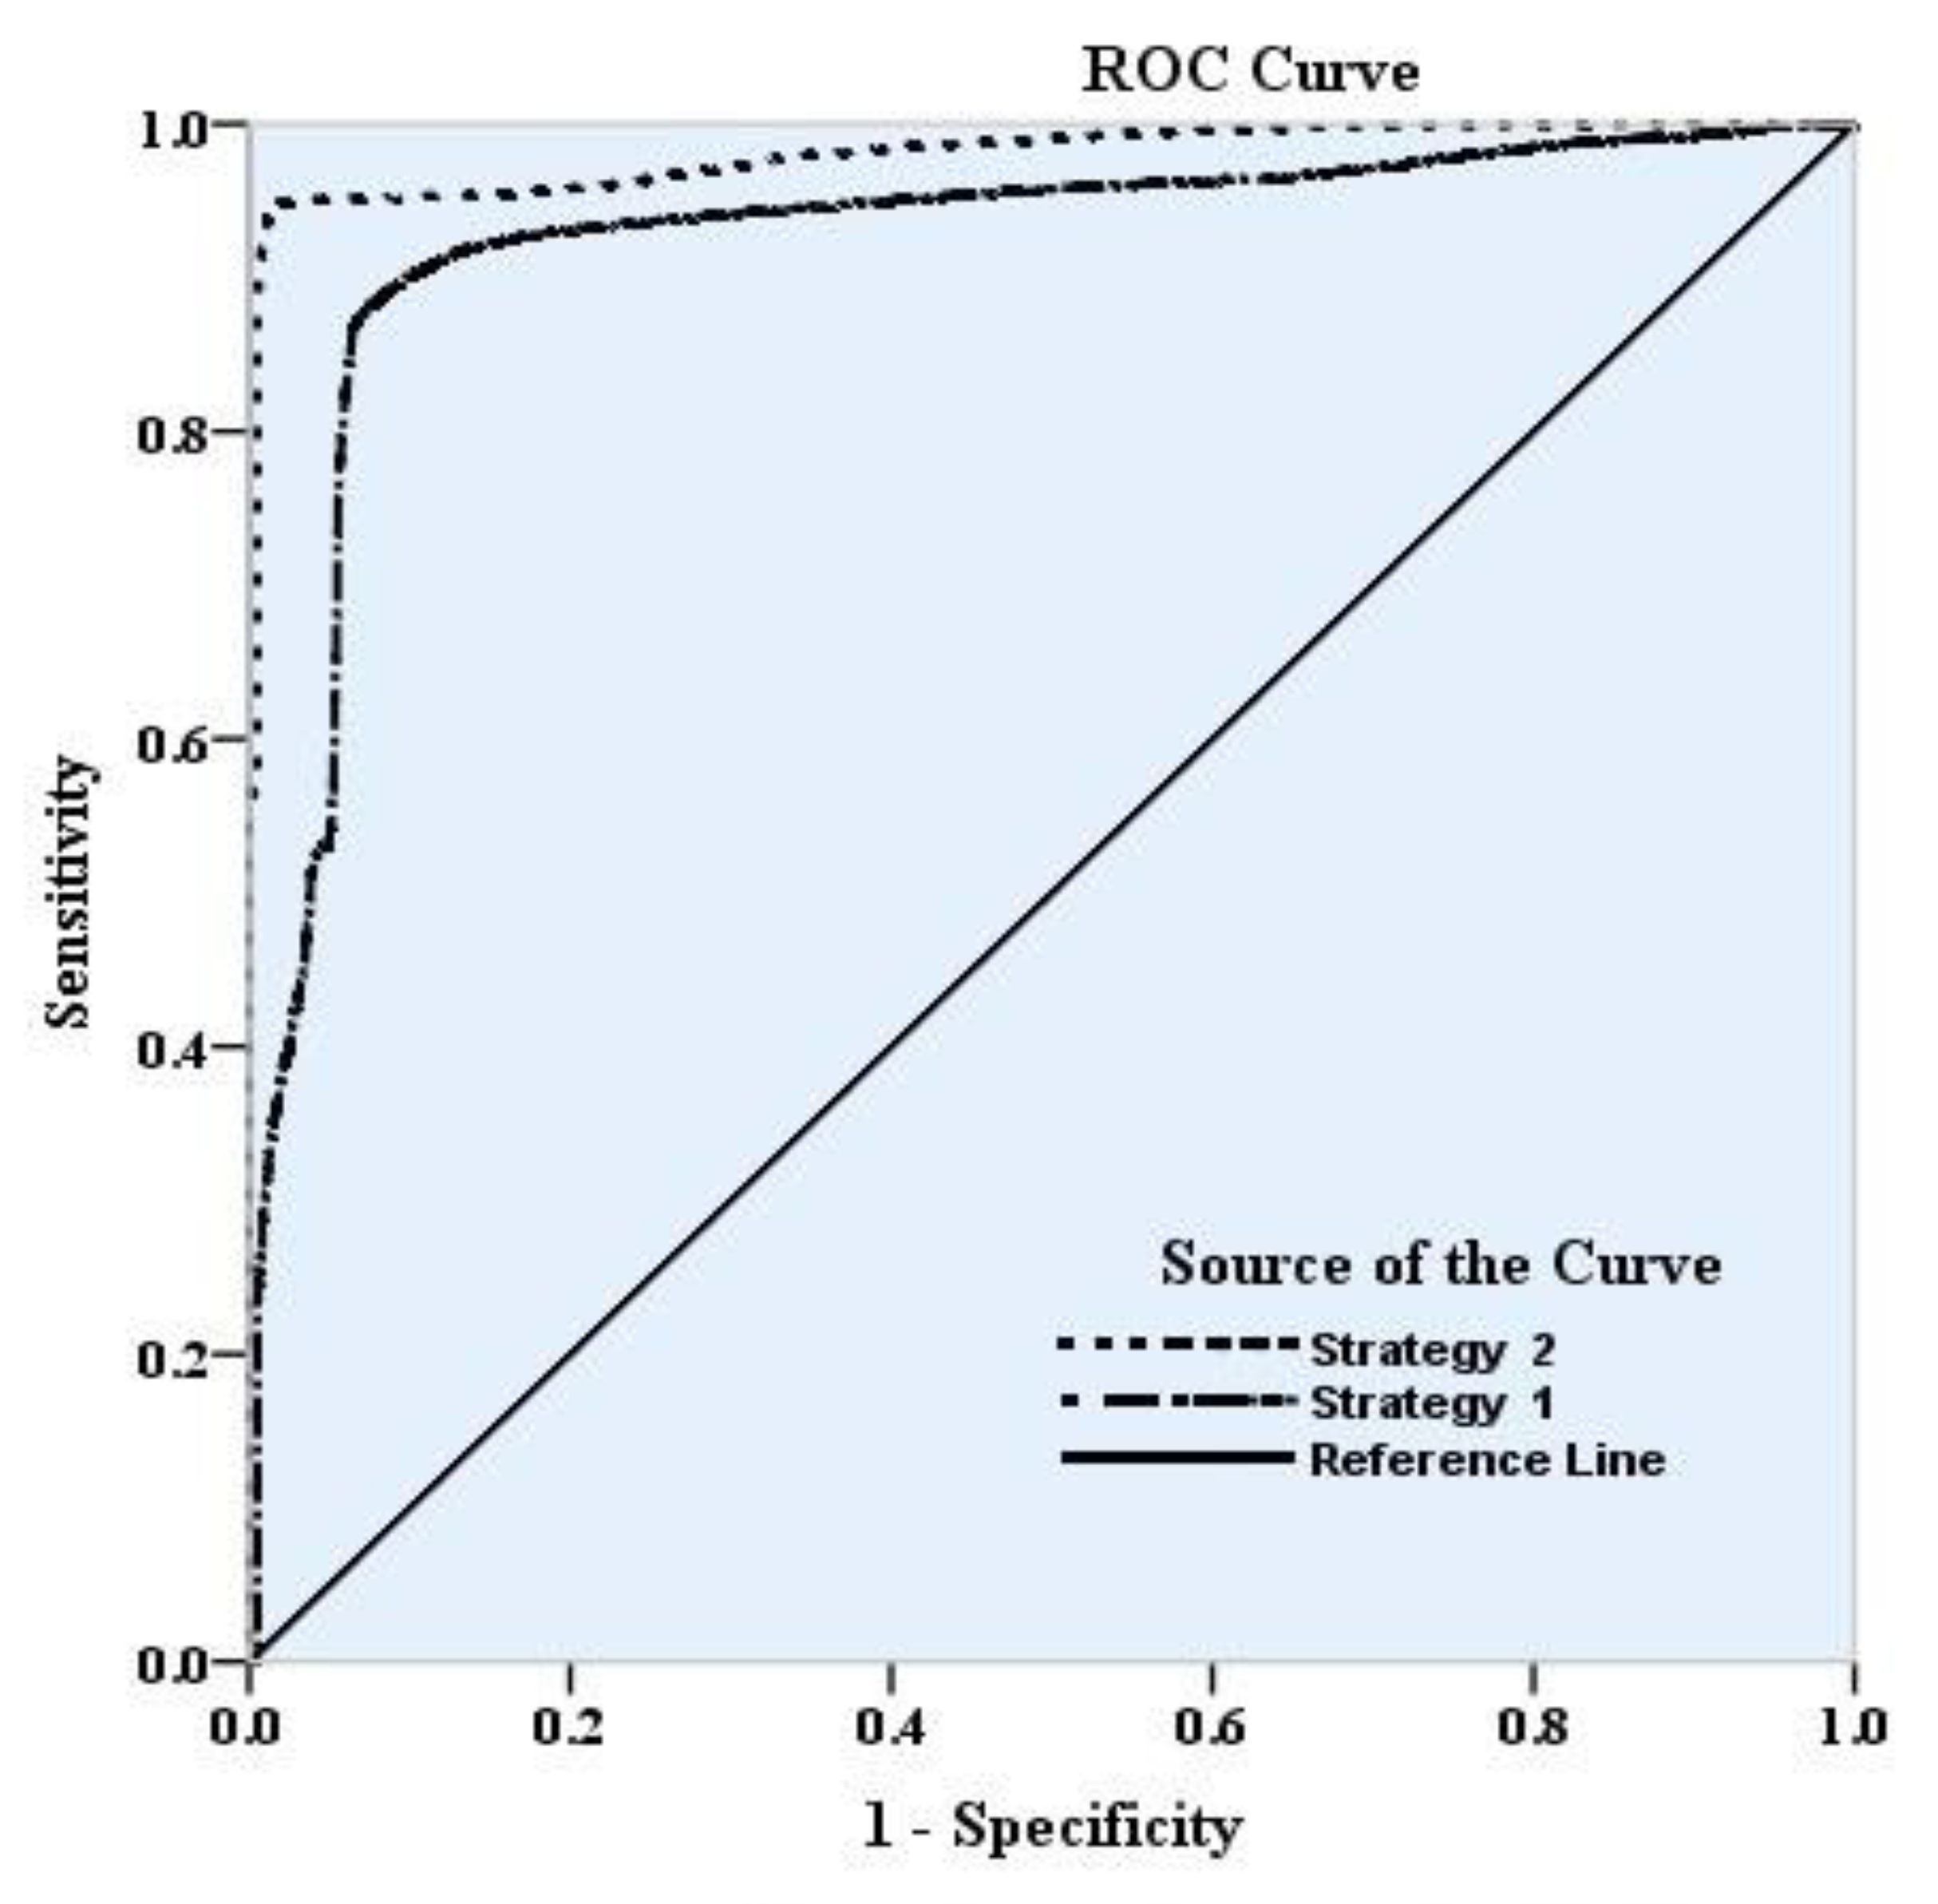
4. Performance Metrics

The Area Under Curve (AUC) and Receiver Operating Characteristic (ROC) curve can be utilized to measure the accuracy of a diagnostic system [84]. They were recently used to evaluate a groundwater vulnerability map accuracy by [18]. The events related to diagnosis can be clustered into four groups, including True Positive (TP), False Positive (FP), True Negative (TN), and False Negative (FN). The ROC curve plots of FP versus TP show that desirable performance has a deviation towards the upper left corner of this curve. The AUC quantifies this as the ratio of the area under the ROC curve to the whole area that varies between 0.5 to 1. The AUC values 0.5 and 1 mean poor and perfect performance, respectively. The area under the curve is used as one of the error estimation methods; whenever the AUC is close to one, the model has high accuracy. Table 7 presents the AUC values of both Strategy 1 and Strategy 2. The AUC value is improved from Strategy 1 (0.92) to Strategy 2 (0.98). Figure 10 shows the ROC curves for both strategies obtained by drawing TPR (sensitivity) versus FPR (one—specificity). As shown in Figure 10, Strategy 2 has the highest level under the curve and has the highest accuracy. These results provide evidence of the feasibility of aggregated indices.

5. Conclusions

This study evaluated water quality and human health risks, considering the hydrogeological and hydrochemical properties of Maku–Bazargan–Poldasht, Iran. The water quality analysis showed that F and NO3 concentrations were higher than the permissible level for drinking. A multivariate analysis combining factor analysis and correlations revealed that both geogenic and anthropogenic agents significantly impacted the quality of the water resources in the study area. Using the US EPA water quality standards for elements in drinking water, this study modified the water quality index classes for the first time. The DWQI results indicated that most of the study area fell within poor or inopportune drinking water conditions. Based on the calculation of the CI and the comparison of the assessment of drinking water quality as well as the accurate determination of suitable and unsuitable areas with the rational (proposed classification) and conventional classification, the results indicated that rational classifications for drinking water quality indicators and the definition of drinking water quality categories were more accurate than conventional classifications. Health risk results demonstrated a considerable non-carcinogenic health risk due to high NO3 and F exposure through drinking water. Children were found more defenseless than adults in the age categories. A fusion model based on the DWQI and HHRI was developed for fast safety control of residues related to water quality and health. The northwest, southeast and central portions of Maku–Bazargan–Poldasht were considered to be the most unsafe regions in the study area. A high level of NO3 and NH4+ pollution occurred in the study area, and since there is no effective control and treatment in such a rapidly urbanized region, this process is bound to get worse in the future. For newly and old-urbanized areas, especially in developing countries, there is a need for the long-term monitoring of NO3 and NH4+ in the area’s water resources. These results suggest that the governing bodies require immediate intervention in these areas. Furthermore, the obtained results showed that alternate preparations should be made for drinking water sources, and people must be aware of the water quality they consume in the affected areas.

Author Contributions

Conceptualization, A.A.N.; methodology, R.B.; software, Z.S.; validation, A.A.N. and M.R.N.; formal analysis, Z.S.; investigation, and resources, R.B.; data curation, Z.S.; writing—original draft preparation, Z.S.; writing—review and editing, M.R.N.; visualization, M.R.N.; supervision, A.A.N.; project administration, M.R.N.; funding acquisition, A.A.N. All authors have read and agreed to the published version of the manuscript.

Funding

This research received no external funding.

Data Availability Statement

The study did not report any data.

Acknowledgments

The authors would like to thank the Center for International Scientific Studies and Collaboration (CISSC), Ministry of Science, Research and Technology, for their support with this research.

Conflicts of Interest

The authors declare no conflict of interest.

Appendix A

Table A1. Weight and relative weight of each parameter compared with US EPA standard.
ParameterUnitUS EPAWeight w i Weight for DWQI
EC(µS/cm)100030.068
pH-7.530.068
Na+(mg/L)20030.068
NH4+(mg/L)0.0540.09
K+(mg/L)1220.045
Ca2+(mg/L)20020.045
Mg2+(mg/L)3020.045
F(mg/L)1.550.11
Cl(mg/L)25030.068
NO2(mg/L)340.09
Br(mg/L)0.130.068
NO3(mg/L)1050.11
SO42−(mg/L)25030.068
HCO3(mg/L)30020.045
Total Weight 441
Table A2. Definitions, symbols, units, and values associated with equations used for health risk assessment.
PMeaningUnitOral ValuesDermal ValuesReferences
(Adults)(Children)(Adults)(Children)
ATAverage exposure time for ingestionDays25,5503650Non-carcinogenic effects = ED × 365 = 10950 (Adults). Carcinogenic effects
AT = 70 × 365 = 25,550
2190 (Child). Carcinogenic effects
AT = 70 × 365 = 25,550
[33,85]
BWAverage body Weight of a population groupKg70257025[33]
CFConversion factorL/cm3 1.1000 [85]
CDIChronic daily intakeµg/kg/day----[85]
CWConcentration in waterµg/L----Study data
EDExposure Duration through ingestionyear7010306[33]
EFDermal exposure frequencydays/year365350[33]
ETExposure time in the showerh/event--0.581[33]
IRDaily groundwater ingestion rateL/day2.21--[85]
KpDermal permeability coefficientcm/h Al(0.001), As(0.001), Cr(0.003), Cu(0.001), Fe(0.001), Mn(0.001), Ni(0.004), Pb(0.001), Zn(0.0006), Cd(0.001)[33]
SAExposed skin area during bathingcm2--18,0006600[33]
Table A3. Dermal permeability coefficient, reference dose, slope factor, and gastrointestinal absorption coefficient for each element.
ElementsUnitsNon-CarcinogenCarcinogen
Oral RfD (μg/Kg/day)Dermal RfD (μg/Kg/day)SF (kg × day/mg)
F(μg/L)0.04 [33]60 [33]Not Determined
NO3(μg/L)1.6 [33]0.025 [33]Not Determined

References

  1. Yeşilnacar, İ.M.; Yetiş, A.D.; Dülgergil, C.T.; Kumral, M.; Atasoy, A.D.; Rastgeldi Doğan, T.; Tekiner, İ.S.; Bayhan, I.; Aydoğdu, M. Geomedical assessment of an area having high-fluoride groundwater in southeastern Turkey. Environ. Earth Sci. 2016, 75, 162. [Google Scholar] [CrossRef]
  2. Li, C.; Gao, X.; Wang, Y. Hydrogeochemistry of high-fluoride groundwater at Yuncheng Basin, northern China. Sci. Total Environ. 2015, 508, 155–165. [Google Scholar] [CrossRef] [PubMed]
  3. Ganyaglo, S.Y.; Gibrilla, A.; Teye, E.M.; Owusu-Ansah, E.D.-G.J.; Tettey, S.; Diabene, P.Y.; Asimah, S. Groundwater fluoride contamination and probabilistic health risk assessment in fluoride endemic areas of the Upper East Region, Ghana. Chemosphere 2019, 233, 862–872. [Google Scholar] [CrossRef]
  4. Elumalai, V.; Nwabisa, D.P.; Rajmohan, N. Evaluation of high fluoride contaminated fractured rock aquifer in South Africa—Geochemical and chemometric approaches. Chemosphere 2019, 235, 1–11. [Google Scholar] [CrossRef] [PubMed]
  5. Harvard. Fluoride-Childrens-Health-Grandjean-Choi. Available online: http://www.hsph.harvard.edu/news/features/ (accessed on 4 February 2015).
  6. Aslani, H.; Zarei, M.; Taghipour, H.; Khashabi, E.; Ghanbari, H.; Ejlali, A. Monitoring, mapping and health risk assessment of Fluoride in drinking water supplies in rural areas of Maku and Poldasht, Iran. Environ. Geochem. Health 2019, 41, 2281–2294. [Google Scholar] [CrossRef]
  7. Chen, J.; Wu, H.; Qian, H.; Gao, Y. Assessing nitrate and Fluoride contaminants in drinking water and their health risk of rural residents living in a semiarid region of northwest china. Expo. Health 2017, 9, 183–195. [Google Scholar] [CrossRef]
  8. Adimalla, N. Controlling factors and mechanism of groundwater quality variation in semiarid region of South India: An approach of water quality index (WQI) and health risk assessment (HRA). Environ. Geochem. Health 2020, 42, 1725–1752. [Google Scholar] [CrossRef] [PubMed]
  9. Nieuwenhuijsen, M.; Paustenbach, D.; Duarte-Davidson, R. New developments in exposure assessment: The impact on the practice of health risk assessment and epidemiological studies. Environ. Int. 2006, 32, 996–1009. [Google Scholar] [CrossRef] [PubMed]
  10. Dyck, R.; Islam, M.S.; Zargar, A.; Mohapatra, A.; Sadiq, R. Application of data fusion in human health risk assessment for hydrocarbon mixtures on contaminated sites. Toxicology 2013, 313, 160–173. [Google Scholar] [CrossRef]
  11. See, L.; Abrahart, R. Multi-model data fusion for hydrological forecasting. Comput. Geosci. 2001, 27, 987–994. [Google Scholar] [CrossRef]
  12. Nadiri, A.A.; Fijani, E.; Tsai, F.T.-C.; Moghaddam, A.A. Supervised committee machine with artificial intelligence for prediction of fluoride concentration. J. Hydroinform. 2013, 15, 1474–1490. [Google Scholar] [CrossRef]
  13. Yousefi, M.; Ghoochani, M.; Mahvi, A.H. Health risk assessment to Fluoride in drinking water of rural residents living in the Poldasht city, Northwest of Iran. Ecotoxicol. Environ. Saf. 2018, 148, 426–430. [Google Scholar] [CrossRef] [PubMed]
  14. Li, P.; He, X.; Guo, W. Spatial groundwater quality and potential health risks due to nitrate ingestion through drinking water: A case study in Yan’an City on the Loess Plateau of northwest China. Hum. Ecol. Risk Assess. 2019, 25, 11–31. [Google Scholar] [CrossRef]
  15. Nadiri, A.A.; Sedghi, Z.; Khatibi, R. Qualitative risk aggregation problems for the safety of multiple aquifers exposed to nitrate, fluoride and arsenic contaminants by a ‘Total Information Management’ framework. J. Hydrol. 2021, 595, 126011. [Google Scholar] [CrossRef]
  16. Asghari Moghaddam, A.; Fijani, E. Hydrogeologic framework of the Maku area basalts, northwestern Iran. Hydrogeol. J. 2009, 17, 949–959. [Google Scholar] [CrossRef]
  17. Mahvi, A.H.; Ghanbarian, M.; Ghanbarian, M.; Khosravi, A.; Ghanbarian, M. Determination of Fluoride concentrationin powdered milk in Iran 2010. Br. J. Nutr. 2010, 107, 1077–1079. [Google Scholar] [CrossRef] [Green Version]
  18. Nadiri, A.A.; Sedghi, Z.; Khatibi, R.; Gharekhani, M. Mapping vulnerability of multiple aquifers using multiple models and fuzzy logic to objectively derive model structures. Sci. Total Environ. 2017, 593–594, 75–90. [Google Scholar] [CrossRef]
  19. Nadiri, A.A.; Sedghi, Z.; Khatibi, R.; Sadeghfam, S. Mapping specific vulnerability of multiple confined and unconfined aquifers by using artificial intelligence to learn from multiple DRASTIC frameworks. J. Environ. Manag. 2018, 227, 415–428. [Google Scholar] [CrossRef]
  20. Kamarehie, B.; Jafari, A.; Zarei, A.; Fakhri, Y.; Ghaderpoori1, M.; Alinejad, A. Non-carcinogenic health risk assessment of nitrate in bottled drinking waters sold in Iranian markets: A Monte Carlo simulation. Accredit. Qual. Assur. 2019, 24, 417–426. [Google Scholar] [CrossRef]
  21. Adimalla, N.; Qian, H. Groundwater chemistry, distribution and potential health risk appraisal of nitrate enriched groundwater: A case study from the semi-urban region of South India. Ecotoxicol. Environ. Saf. 2021, 207, 111277. [Google Scholar] [CrossRef]
  22. Ravindra, K.; Thind, P.S.; Mor, S.; Singh, T.; Mor, S. Evaluation of groundwater contamination in Chandigarh: Source identification and health risk assessment. Environ. Pollut. 2019, 255, 113062. [Google Scholar] [CrossRef] [PubMed]
  23. Jha, M.K.; Shekhar, A.; Jenifer, M.A. Assessing groundwater quality for drinking water supply using hybrid fuzzy-GIS-based water quality index. Water Res. 2020, 179, 115867. [Google Scholar] [CrossRef]
  24. Kaur, L.; Rishi, M.S.; Siddiqui, A.U. Deterministic and probabilistic health risk assessment techniques to evaluate non-carcinogenic human health risk (NHHR) due to fluoride and nitrate in groundwater of Panipat, Haryana, India. Environ. Pollut. 2020, 259, 113711. [Google Scholar] [CrossRef] [PubMed]
  25. Zhang, Q.; Qian, H.; Xu, P.; Hou, K.; Yang, F. Groundwater quality assessment using a new integrated-weight water quality index (IWQI) and driver analysis in the Jiaokou Irrigation District, China. Ecotoxicol. Environ. Saf. 2021, 212, 111992. [Google Scholar] [CrossRef] [PubMed]
  26. Mohanta, V.L.; Singh, S.; Mishra, B.K. Human health risk assessment of fluoride-rich groundwater using fuzzy-analytical process over the conventional technique. Groundw. Sustain. Dev. 2020, 10, 100291. [Google Scholar] [CrossRef]
  27. Wang, Y.; Li, P. Appraisal of shallow groundwater quality with human health risk assessment in different seasons in rural areas of the Guanzhong Plain (China). Environ. Res. 2022, 207, 112210. [Google Scholar] [CrossRef]
  28. Qasemi, M.; Darvishian, M.; Nadimi, H.; Gholamzadeh, M.; Afsharnia, M.; Farhang, M.; Allahdadi, M.; Darvishian, M.; Zarei, A. Characteristics, water quality index and human health risk from nitrate and fluoride in Kakhk city and its rural areas, Iran. J. Food Compos. Anal. 2023, 115, 104870. [Google Scholar] [CrossRef]
  29. APHA. Standard Methods for the Examination of Water and Wastewater, 21st ed.; American Public Health Association/American Water Works Association/Water Environment Federation: Washington, DC, USA, 2005. [Google Scholar]
  30. Deutsch, W.J. Groundwater Geochemistry Fundamentals and Application to Contamination; Lewis Publishers: Boca Raton, FL, USA, 1997. [Google Scholar]
  31. Kant, N.; Singh, P.K.; Kumar, B. Hydrogeochemical characterization and groundwater quality of Jamshedpur urban agglomeration in Precambrian Terrain, Eastern India. J. Geol. Soc. India 2018, 92, 67–75. [Google Scholar] [CrossRef]
  32. Jiang, Y.; Wu, Y.; Yuan, D. Human impacts on karst groundwater contamination deduced by coupled nitrogen with strontium isotopes in the Nandong Underground River System in Yunan, China. Environ. Sci. Technol. 2019, 15, 7676–7683. [Google Scholar] [CrossRef]
  33. U.S. Environmental Protection Agency. A Risk Assessment Multi-Way Exposure Spreadsheet Calculation Tool; United States Environmental Protection Agency: Washington, DC, USA, 2014.
  34. Kaiser, H.F. The application of electronic computers to factor analysis. Educ. Psychol. Meas. 1960, 20, 141–151. [Google Scholar] [CrossRef]
  35. Barzegar, R.; Asghari Moghaddam, A.; Tziritis, E.; Fakhri, M.S.; Soltani, S. Identification of hydrogeochemical processes and pollution sources of groundwater resources in the Marand plain, northwest of Iran. Environ. Earth Sci. 2017, 76, 297. [Google Scholar] [CrossRef]
  36. Elisante, E.; Muzuka, A.N.N. Assessment of sources and transformation of nitrate in groundwater on the slopes of Mount Meru, Tanzania. Environ. Earth Sci. 2016, 75, 277. [Google Scholar] [CrossRef]
  37. Luo, Y.; Xiao, Y.; Hao, Q.; Zhang, Y.; Zhao, Z.; Wang, S.; Dong, G. Groundwater geochemical signatures and implication for sustainable development in a typical endorheic watershed on Tibetan plateau. Environ. Sci. Pollut. Res. 2021, 28, 48312–48329. [Google Scholar] [CrossRef] [PubMed]
  38. World Health Organization. Guidance for Immunotoxicity Risk Assessment for Chemicals; IPCS Harmonization Project Document No. 10; World Health Organization: Geneva, Switzerland, 2011. [Google Scholar]
  39. Yuan, L.; Fei, W.; Jia, F.; Jun-pong, L.; Qi, L.; Fang-ru, N.; Xu-dong, L.; Shu-lian, X. Health risk in children to fluoride exposure in a typical endemic fluorosis area on Loess Plateau, north China, in the last decade. Chemosphere 2020, 243, 125451. [Google Scholar] [CrossRef] [PubMed]
  40. Mohammadi, A.A.; Yousefi, M.; Yaseri, M.; Jalilzadeh, M.; Mahvi, A.H. Skeletal fluorosis in relation to drinking water in rural areas of West Azerbaijan, Iran. Sci. Rep. 2017, 7, 17300. [Google Scholar] [CrossRef] [PubMed] [Green Version]
  41. Gizaw, B. The origin of high bicarbonate and Fluoride concentration in waters of the Main Ethiopian Rift Valley, East African Rift system. J. Afr. Earth Sci. 1996, 22, 391–402. [Google Scholar] [CrossRef]
  42. Banks, D.; Reimann, C.; Røyset, O.; Skarphagen, H.; Sæther, O.M. Natural concentrations of major and trace elements in some Norwegian bedrock groundwaters. Appl. Geochem. 1995, 10, 1–16. [Google Scholar] [CrossRef]
  43. Adimalla, N.; Li, P. Occurrence, health risks, and geochemical mechanisms of Fluoride and nitrate in groundwater of the rock-dominant semi-arid region, Telangana State, India. Hum. Ecol. Risk Assess. Int. J. 2019, 25, 81–103. [Google Scholar] [CrossRef]
  44. WHO. Guidelines for Drinking-Water Quality, 4th ed.; Incorporating First Addendum; World Health Organization: Geneva, Switzerland, 2017; Available online: https://www.who.int/publications/i/item/9789241549950 (accessed on 14 January 2021).
  45. Karunanidhi, D.; Subramani, T.; Roy, P.D.; Li, H. Impact of groundwater contamination on human health. Geochem. Health 2021, 43, 643–647. [Google Scholar] [CrossRef]
  46. Khan, R.; Jhariya, D.C. Groundwater quality assessment for drinking purpose in Raipur city, Chhattisgarh using water quality index and geographic information system. J. Geol. Soc. India 2017, 90, 69–76. [Google Scholar] [CrossRef]
  47. Jafari, S.M.; Nikoo, M.R. Developing a fuzzy optimization model for groundwater risk assessment based on improved DRASTIC method. Environ. Earth Sci. 2019, 78, 109. [Google Scholar] [CrossRef]
  48. Jafari, S.M.; Nikoo, M.R. Groundwater risk assessment based on optimization framework using DRASTIC method. Arab. J. Geosci. 2016, 9, 742. [Google Scholar] [CrossRef]
  49. Jafari, A.; Kamarehie, B.; Ghaderpoori, M.; Khoshnamvand, N.; Birjandi, M. The concentration data of heavy metals in Iranian grown and imported rice and human health hazard assessment. Data Brief. 2018, 16, 453–459. [Google Scholar] [CrossRef]
  50. Aravinthasamy, P.; Karunanidhi, D.; Subramani, T.; Srinivasamoorthy, K.; Anand, B. Geochemical evaluation of Fluoride contamination in groundwater from Shanmuganadhi River basin, South India: Implication on human health. Environ. Geochem. Health 2019, 42, 1937–1963. [Google Scholar] [CrossRef]
  51. He, S.; Wu, J. Relationships of groundwater quality and associated health risks with land use/land cover patterns: A case study in a loess area, Northwest China. Hum. Ecol. Risk Assess. 2019, 25, 354–373. [Google Scholar] [CrossRef]
  52. Ahada, C.P.S.; Suthar, S. Assessment of Human Health Risk Associated with High Groundwater Fluoride Intake in Southern Districts of Punjab, India. Expo. Health 2019, 11, 267–275. [Google Scholar] [CrossRef]
  53. Karunanidhi, D.; Aravinthasamy, P.; Subramani, T.; Roy, P.D.; Srinivasamoorthy, K. Risk of Fluoride-rich groundwater on human health: Remediation through managed aquifer recharge in a hard rock terrain, South India. Nat. Resour. Res. 2019, 29, 2369–2395. [Google Scholar] [CrossRef]
  54. Esteban, J.; Starr, A.; Willetts, R.; Hannah, P.; Bryanston, P. A Review of data fusion models and architectures: Towards engineering guidelines. Neural Comput. Appl. 2005, 14, 273–281. [Google Scholar] [CrossRef] [Green Version]
  55. Huang, Z.-H.; Li, W.-J.; Wang, J.; Zhang, T. Face recognition based on pixel-level and feature-level fusion of the top-level’s wavelet sub-bands. Inf. Fusion 2015, 22, 95–104. [Google Scholar] [CrossRef]
  56. AbdelGawad, A.M.; Bayoumi, M.A. Remote Measuring for Sand in Pipelines Using Wireless Sensor Network. IEEE Trans. Instrum. Meas. 2011, 60, 1443–1452. [Google Scholar] [CrossRef]
  57. Pandey, V.; Giri, V.K. High frequency noise removal from ECG using moving average filters. In Proceedings of the 2016 International Conference on Emerging Trends in Electrical Electronics & Sustainable Energy Systems (ICETEESES), Sultanpur, India, 11–12 March 2016. [Google Scholar] [CrossRef]
  58. Carrillo-Rivera, J.J.; Cardona, A.; Edmunds, W.M. Use of abstraction regime and knowledge of hydrogeological conditions to control high-fluoride concentration in abstracted groundwater: San Luis Potosí basin, Mexico. J. Hydrol. 2002, 261, 24–47. [Google Scholar] [CrossRef]
  59. Hounslow, A. Water Quality Data: Analysis and Interpretation; CRC Pubication LLD.: Boca Raton, FL, USA, 1995; p. 381. [Google Scholar]
  60. Asghari Moghaddam, A.; Fijani, E. Distribution of fluoride in groundwater of Maku area, northwest of Iran. Environ. Geol. 2008, 56, 281–287. [Google Scholar] [CrossRef]
  61. Tekle-Haimanot, R.; Melaku, Z.; Kloos, H.; Reimann, C.; Fantaye, W.; Zerihun, L.; Bjorvatn, K. The geographic distribution of fluoride in surface and groundwater in Ethiopia with an emphasis on the Rift Valley. Sci. Total Environ. 2006, 367, 182–190. [Google Scholar] [CrossRef] [PubMed]
  62. Gopinath, S.; Srinivasamoorthy, K.; Saravanan, K.; Suma, C.S.; Prakash, R.; Senthinathan, D.; Sarma, V.S. Vertical electrical sounding for mapping saline water intrusion in coastal aquifers of Nagapattinam and Karaikal, South India. Sustain. Water Resour. Manag. 2018, 4, 833–841. [Google Scholar] [CrossRef]
  63. Sarma, D.R.R.; Rao, S.L.N. Fluoride concentrations in groundwaters of Visakhapatnam, India. J. Environ. Contam. Toxicol. 1997, 58. [Google Scholar]
  64. Egbueri, J.C.; Mgbenu, C.N.; Chukwu, C.N. Investigating the hydrogeochemical processes and quality of water resources in Ojoto and environs using integrated classical methods. Model. Earth Syst. Environ. 2019, 5, 1443–1461. [Google Scholar] [CrossRef]
  65. Mgbenu, C.N.; Egbueri, J.C. The hydrogeochemical signatures, quality indices and health risk assessment of water resources in Umunya district, southeast Nigeria. Appl. Water Sci. 2019, 9, 1–19. [Google Scholar] [CrossRef] [Green Version]
  66. Anawar, H.M.; Akai, J.; Komaki, K.; Terao, H.; Yoshioka, T.; Ishizuka, T.; Safiullah, S.; Kato, K. Geochemical occurrence of arsenic in groundwater of Bangladesh: Sources and mobilization processes. J. Geochem. Explor. 2003, 77, 109–131. [Google Scholar] [CrossRef]
  67. Levins, I.; Gosk, E. Trace elements in groundwater as indicators of anthropogenic impact. Environ. Geol. 2008, 55, 285–290. [Google Scholar] [CrossRef]
  68. Tomar, V.; Prasad, S.; Kumar, D. Adsorptive removal of fluoride from aqueous media using Citrus limonum (lemon) leaf. Microchem. J. 2014, 112, 97–103. [Google Scholar] [CrossRef]
  69. Yadav, A.K.; Abbassi, R.; Gupta, A.; Dadashzadeh, M. Removal of fluoride from aqueous solution and groundwater by wheat straw, sawdust and activated bagasse carbon of sugarcane. Ecol. Eng. 2013, 52, 211–218. [Google Scholar] [CrossRef]
  70. Yadav, K.K.; Singh, J.K.; Gupta, N.; Kumar, V. A review of nanobioremediation technologies for environmental cleanup: A novel biological approach. J. Mater. Environ. Sci. 2017, 8, 740–757. [Google Scholar]
  71. Jorfi, S.; Rezaei Kalantary, R.; Mohseni Bandpi, A.; Jaafarzadeh Haghighifard, N.; Esrafili, A.; Alaei, L. Fluoride removal from water by adsorption using bagasse, modified bagasse and chitosan. Iran. J. Health Environ. 2011, 4, 35–48. [Google Scholar]
  72. Asgari, G.; Roshani, B.; Ghanizadeh, G. The investigation of kinetic and isotherm of fluoride adsorption onto functionalize pumice stone. J. Hazard Mater. 2012, 217, 123–132. [Google Scholar] [CrossRef] [PubMed]
  73. Rahmani, A.; Nouri, J.; Ghadiri, S.K.; Mahvi, A.H.; ZareM, R. Adsorption of fluoride from water by Al3+ and Fe3+ pretreated natural Iranian zeolites. Int. J. Environ. Res. 2010, 4, 607–614. [Google Scholar]
  74. Khatibikamal, V.; Torabian, A.; Janpoor, F.; Hoshyaripour, G. Fluoride removal from industrial wastewater using electrocoagulation and its adsorption kinetics. J. Hazard Mater. 2010, 179, 276–280. [Google Scholar] [CrossRef]
  75. Malakootian, M.; Yousefi, N.; Fatehizadeh, A. Survey efficiency of electrocoagulation on nitrate removal from aqueous solution. Int. J. Environ. Sci. Technol. 2011, 8, 107–114. [Google Scholar] [CrossRef]
  76. Behbahani, M.; Moghaddam, M.A.; Arami, M. Techno-economical evaluation of fluoride removal by electrocoagulation process: Optimization through response surface methodology. Desalination 2011, 271, 209–218. [Google Scholar] [CrossRef]
  77. Emamjomeh, M.M.; Sivakumar, M. An empirical model for defluoridation by batch monopolar electrocoagulation/flotation (ECF) process. J. Hazard Mater. 2006, 131, 118–125. [Google Scholar] [CrossRef]
  78. Bazrafshan, E.; Ownagh, K.A.; Mahv, A.H. Application of electrocoagulation process using iron and aluminum electrodes for fluoride removal from aqueous environment. J. Chem. 2012, 9, 2297–2308. [Google Scholar] [CrossRef] [Green Version]
  79. Poursaberi, T.; Hassanisadi, M.; Torkestani, K.; Zare, M. Development of zirconium (IV)-metalloporphyrin grafted Fe3O4 nanoparticles for efficient fluoride removal. Chem. Eng. J. 2012, 189, 117–125. [Google Scholar] [CrossRef]
  80. Hosseini, M.; Fazelian, N.; Fakhri, A.; Kamyab, H.; Yadav, K.K.; Chelliapan, S. Preparation, and structural of new NiS-SiO2 and Cr2S3-TiO2 nano-catalyst: Photocatalytic and antimicrobial studies. J. Photochem. Photobiol. B 2019, 194, 128–134. [Google Scholar] [CrossRef] [PubMed]
  81. Samatya, S.; Yüksel, Ü.; Yüksel, M.; Kabay, N. Removal of fluoride from water by metal ions (Al3+, La3+ and ZrO2+) loaded natural zeolite. Separ. Sci. Technol. 2007, 42, 2033–2047. [Google Scholar] [CrossRef]
  82. National Academy of Sciences (NAS). Science and Decisions: Advancing Risk Assessment; National Academy Press: Washington, DC, USA, 2009. [Google Scholar]
  83. Sedghi, Z.; Rostami, A.A.; Khatibi, R.; Nadiri, A.A.; Sadeghfam, S.; Abdoallahi, A. Chapter 11—Mapping and aggregating groundwater quality indices for aquifer management using Inclusive Multiple Modeling practices. In Risk, Reliability and Sustainable Remediation in the Field of Civil and Environmental Engineering; Elsevier: Amsterdam, The Netherlands, 2022; pp. 155–182. [Google Scholar] [CrossRef]
  84. Huang, J.; Ling, C. Using AUC and accuracy in evaluating learning algorithms. IEEE Trans. Knowl. Data Eng. 2005, 17, 299–310. [Google Scholar] [CrossRef]
  85. ASTEE (Association Scientifique et Technique de l’Eau et de l’Environnement). Guide Pour L’evaluation du Risque Sanitaire Dans le Cadre de L’etude D’impact D’une UIOM, 2003; 60p. Available online: https://temis.documentation.developpement-durable.gouv.fr/docs/Temis/0070/Temis-0070209/18437.pdf (accessed on 30 September 2022).
Figure 1. Flowchart of the planned information fusion-based human health risk assessment framework.
Water 14 03390 g001
Figure 2. Situation map of the Maku–Bazargan–Poldasht area, drainage system, and sampling locations.
Water 14 03390 g002
Figure 3. Geological map of the Maku–Bazargan–Poldasht area.
Water 14 03390 g003
Figure 4. Bivariate plot to check the relation between TDS and NO3 + Cl/HCO3.
Water 14 03390 g004
Figure 5. Excessive contaminants (non-carcinogenic) at the sampled water resources ((a): Nitrate; (b): Fluoride) [33].
Water 14 03390 g005
Figure 6. Spatial distribution of factors scores for the Maku–Bazargan–Poldasht area: (a) Factor 1 (FA1), (b) Factor 2 (FA2), (c) Factor 3 (FA3), (d) Factor 4 (FA4).
Water 14 03390 g006
Figure 7. Drinking Water Quality Index map of the Maku–Bazargan–Poldasht area.
Water 14 03390 g007
Figure 8. Spatial distribution of non-carcinogenic HHRA for (a) adults and (b) children.
Water 14 03390 g008
Figure 9. Spatial distribution (a) data fusion of HHRI results (Strategy 1); (b) comprehensive risk maps (Strategy 2).
Water 14 03390 g009aWater 14 03390 g009b
Figure 10. The ROC curves for Strategies.
Water 14 03390 g010
Table 1. Examples of different techniques used in HHRI and WQI.
Name of IndexSourcesElementsMethodsRational Classification (Proposed Classification) for Drinking WaterApplication Areas
Major IonsMinor IonsPropertiesDWQIHRAInformation Fusion
HHRI[20]*** * Non-carcinogenic health risk assessment of nitrate in bottled drinking water sold
GIS Base[21]*** * Calculated HR from NO3 in drinking water using the Water Quality Index
GIS, mathematical base[22]*** * Assessed hazard index, water resources quality, and hydrochemical analysis using a multivariate method
GQI/FGQI[23]** * Proposed a new hybrid framework combining GQI with Fuzzy Logic to examine groundwater quality and its spatial variability.
HHRI[24] * Examined heavy metal contents and evaluated HHRI
HHRI/WQI[25]*** * Evaluated based on carcinogenic and non-carcinogenic aspects.
FHI[26]*** * Studied trace elements’ health risk in drinking water based on the Water Quality Index
HHRI/EWQI[27]***** Evaluated the HHRI of F concentration in groundwater resources based on fuzzy logic approach
WQI/HHR[28]***** Water quality index and human health risk from NO3 and fluoride
Information-Fused TechniqueCurrent study*******Water resources contamination; NO3 contamination; water quality distribution; health risk
Note: *: Shows the applied methods.
Table 2. Statistical analysis of the measured water parameters compared to US EPA standard (2014).
ParameterUnitsRangeMeanStandard DeviationUS EPAType of ProblemSamples Exceeded
US EPA Limit
October 2021
Institute measurements
ECμS/cm525–55301503.91099.271000 62%
pH-6.7–8.377.370.377.5 28%
Major Elements
Na+mg/L16–1001221.39217.63200 40%
K+mg/L3–7012.4410.1512 45%
Ca2+mg/L32–518102.7082.68200 9%
Mg+mg/L11–24565.6851.5630 81%
Clmg/L4–770132.02162.25250 17%
SO42−mg/L6–9079479.211263.94250 20%
HCO3-107–537265.59109.48300 -
Fmg/L0.39–102.942.431.5Caused fluorosis48.33%
Brmg/L0–12.784.740.1 83.3%
Nutrients
NO3mg/L0.23–16932.2239.0410Methemoglobinemia75%
NO2mg/L0–50.320.863 4%
NH4+mg/L0–41.051.050.05 76.6%
Table 3. Classification of water resources based on F and NO3 (mg/L) HHRI.
Corresponding Effects on
Human Health Risk Assessment
Concentration (mg/L)Station No.% of the
Samples
FSafe limit<13, 4, 6, 8, 11, 15, 19, 26, 30, 32, 42, 49, 5721.6%
Dental Fluorosis1–37, 9, 10, 13, 14, 23, 24, 27, 28, 29, 31, 33, 37, 38, 39, 40, 41, 43, 47, 48, 53, 54, 6038.3%
Stiff and fragile Bones/Joints3–41, 17, 25, 596.6%
Defects in knees; crippling fluorosis; bones conclusively paralyzed resulting in incapability to walk or stand straight>42, 5, 12, 16, 18, 20, 21, 22, 34, 35, 36, 44, 45, 46, 50, 51, 52, 55, 56, 5833%
NO3Safe limit<104, 5, 8, 11, 12, 15, 19, 20, 26, 27, 28, 30, 32, 36, 4925%
Health risk10–501, 2, 3, 9, 10, 13, 14, 17, 21, 22, 23, 24, 25, 29, 31, 33, 34, 35, 37, 40, 42, 43, 44, 45, 46, 47, 48, 50, 51, 52, 55, 56, 58, 59, 6058%
High health risk50–1007, 38, 41, 54, 578.3%
Very high health risk>1006, 16, 18, 39, 538.3%
Table 4. Correlation matrix between the hydrochemical variables in the Maku–Bazargan–Poldasht area.
ECpHNa+NH4+K+Ca2+Mg2+FClNO2BrNO3SO42−HCO3
EC1
pH−0.271
Na+0.95 **−0.29 *1
NH4+0.45 **−0.23 *0.56 **1
K+0.66 **−0.29 *0.73 **0.221
Ca2+0.87 **−0.31 *0.76 **0.250.63 **1
Mg2+0.91 **−0.250.82 **0.330.56 **0.85 **1
F0.38 **−0.160.52 **0.41 **0.46 **0.180.161
Cl0.75 **−0.44 **0.72 **0.33 *0.44 **0.71 *0.65 **0.40 **1
NO2−0.09−0.04−0.09−0.006−0.07−0.11 *−0.060.04−0.081
Br0.33 **−0.080.39 **0.250.27 *0.130.180.35 **0.15−0.071
NO30.26 *−0.30 *0.17−0.160.220.26 *0.35 **−0.060.34 **−0.003−0.041
SO42−0.30 *−0.0090.25 *0.020.190.34 **0.31 *0.040.31 *−0.07−0.010.051
HCO30.25 *−0.35 **0.37 **0.26 *0.36 **0.050.040.71 **0.35 **−0.090.17−0.05−0.071
Notes: ** Correlation = significant at the level 0.01 (2-tailed). * Correlation = significant at the level 0.05 (2-tailed).
Table 5. Results of factor loading based on factor analysis of the samples in the Maku–Bazargan–Poldasht area.
ParametersFactor 1Factor 2Factor 3Factor 4
EC0.940.230.0320.026
pH−0.2−0.440.62−0.22
Na+0.870.420.120.046
NH4+0.380.410.370.3
K+0.640.40−0.05−0.10
Ca2+0.910.023−0.13−0.03
Mg2+0.93−0.006−0.0810.049
F0.220.820.23−0.02
Cl0.740.34−0.23−0.003
NO2−0.08−0.11−0.060.87
Br0.280.270.55−0.07
NO30.32−0.06−0.67−0.08
SO42−0.50−0.230.068−0.23
HCO30.0290.90−0.058−0.085
% of Variance35.8618.0710.457.51
Cumulative %35.8653.9364.3971.9
Table 6. Non-carcinogenic HR for adults and children as well as DWQI and corresponding water quality classification of the samples and Correlation Index (CI) between Drinking Water Quality Indices (conventional–rational) and F-NO3 levels at the water samples.
SamplesNon-CarcinogenicDWQI ClassifySamplesNon-CarcinogenicDWQI
AdultsChildValueConventionalRational (Proposed Classification)AdultsChildValueConventionalRational (Proposed Classification)
13.733.57102.2PoorPoor311.671.78209.2UnsuitablePoor
25.174.541057.5UnsuitableUnsuitable320.960.9167.3PoorPoor
30.840.97100.8PoorGood331.331.35235.2UnsuitablePoor
40.470.48150.1PoorPoor344.724.14506.9UnsuitablePoor
53.793.271812.9UnsuitableUnsuitable356.565.71518UnsuitablePoor
64.836.39636.2UnsuitableUnsuitable368.016.92213UnsuitablePoor
73.163.42268.7UnsuitablePoor371.992.23211.9UnsuitablePoor
80.640.60104.5PoorGood383.574.10263.8UnsuitablePoor
91.371.3464.9GoodGood394.635.90343.9UnsuitablePoor
101.621.6369.6GoodGood401.872.12205.06UnsuitablePoor
110.310.26695.7UnsuitableUnsuitable412.813.16296UnsuitablePoor
123.723.201576.7UnsuitableUnsuitable421.491.71160.6PoorPoor
131.691.61335.5UnsuitablePoor432.222.27245.6UnsuitablePoor
141.551.54252.7UnsuitablePoor446.645.85877.1UnsuitableUnsuitable
150.650.6651.1GoodGood454.804.22578.5UnsuitableUnsuitable
167.358.44971.8UnsuitableUnsuitable464.494.23679.7UnsuitableUnsuitable
173.713.78871.9UnsuitableUnsuitable471.261.30109PoorGood
187.417.65707.14UnsuitableUnsuitable482.292.11392.8UnsuitablePoor
190.470.48714.7UnsuitableUnsuitable490.760.71330.5UnsuitablePoor
203.793.272211.3UnsuitableUnsuitable504.203.86513.4UnsuitablePoor
214.013.751171.6UnsuitableUnsuitable515.795.16443.7UnsuitablePoor
227.016.381475.2UnsuitableUnsuitable523.633.34579.8UnsuitableUnsuitable
231.241.23352.8UnsuitablePoor535.626.67588.4UnsuitableUnsuitable
241.521.57233UnsuitablePoor543.904.50627.4UnsuitableUnsuitable
253.072.85332.6UnsuitablePoor557.366.5724.05UnsuitableUnsuitable
260.650.65105.3PoorGood564.073.77987.5UnsuitableUnsuitable
271.471.34354.3UnsuitablePoor572.673.35109.8PoorGood
281.081.0065GoodGood583.943.57695.6UnsuitableUnsuitable
291.551.54221.2UnsuitablePoor593.923.89655.4UnsuitableUnsuitable
300.650.66101.3PoorGood601.611.73338.8UnsuitablePoor
IndexClassNO3 concentrationCIF concentrationCI
Safe (<10 mg/L)Health Risk (10–50 mg/L)High Health Risk (>50 mg/L)Safe (<1 mg/L)Florsis (Dental–Bones) (1–4 mg/L)Defects in knees; crippling fluorosis (>4 mg/L)
Rational (proposed classification)Good355144463155
Poor421114194
Unsuitable1460515
ConventionalGood24794184139
Poor25293222
Unsuitable01100020
Note: # HR: Health Risk.
Table 7. Performance metrics to evaluate different water quality assessment strategies.
Test Result Variable(s)AreaStd. Error aAsymptotic Sig. b95% Confidence Interval
Lower BoundUpper Bound
Strategy 10.920.0030.000.920.93
Strategy 20.980.0010.000.970.98
Notes: the test result variable(s): Strategy 1 and Strategy 2 have at least one tie between the positive and negative actual state group. Statistics may be biased. a Under the nonparametric assumption. b Null hypothesis: true area = 0.5.
Publisher’s Note: MDPI stays neutral with regard to jurisdictional claims in published maps and institutional affiliations.

