
Active Pharmaceutical Ingredients Sequestrated from Water Using Novel Mesoporous Activated Carbon Optimally Prepared from Cassava Peels


Abstract
:1. Introduction
2. Materials and Methods
2.1. Activated Carbon Preparation
2.1.1. Pre-Leaching and Characterization for the Optimization Experiment
2.1.2. Experiment Design
2.1.3. Empirical Model Development, Optimization, and Validation
2.1.4. Chemical Activation under Optimal Pyrolysis
2.2. Preparation and Standardization of the Test Solutions
2.3. Adsorption Experiment Setup
2.4. Isotherm Experiments
2.5. Chemical Analyses
2.6. Morphology Analysis of the Spent CPAC
3. Results and Discussion
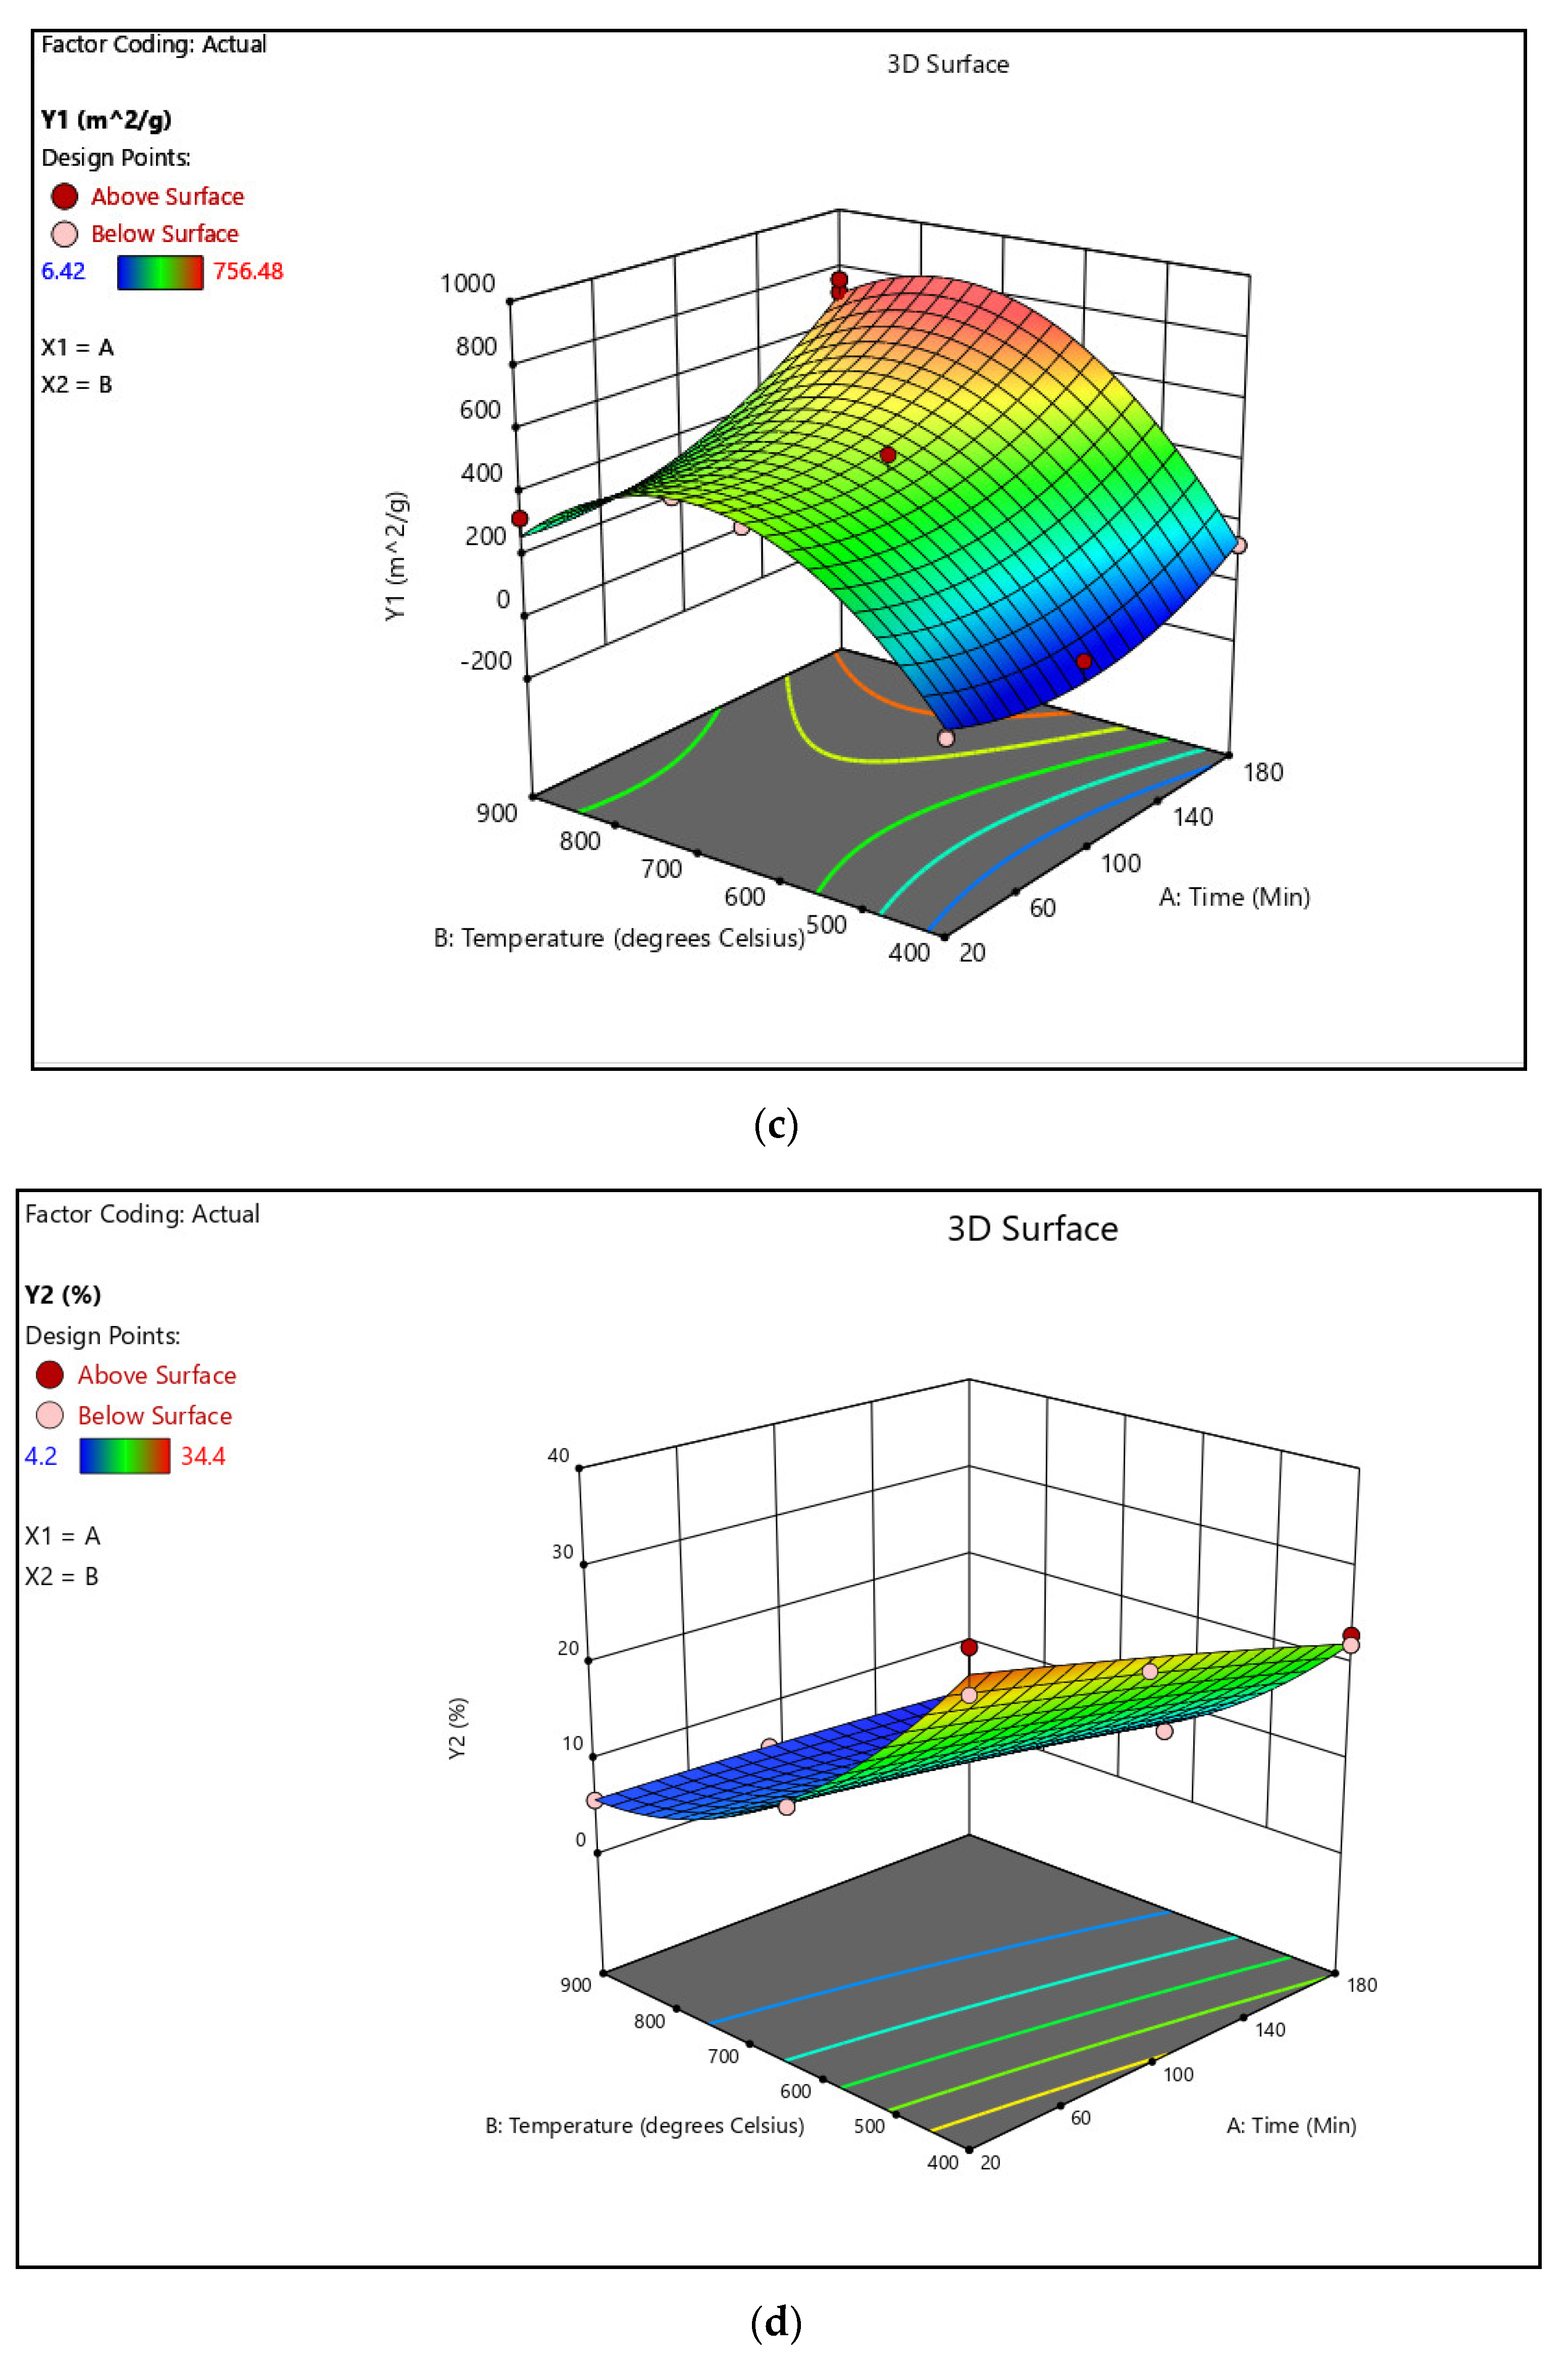
3.1. Optimization of Pyrolysis Conditions and Activated Carbon Characterization
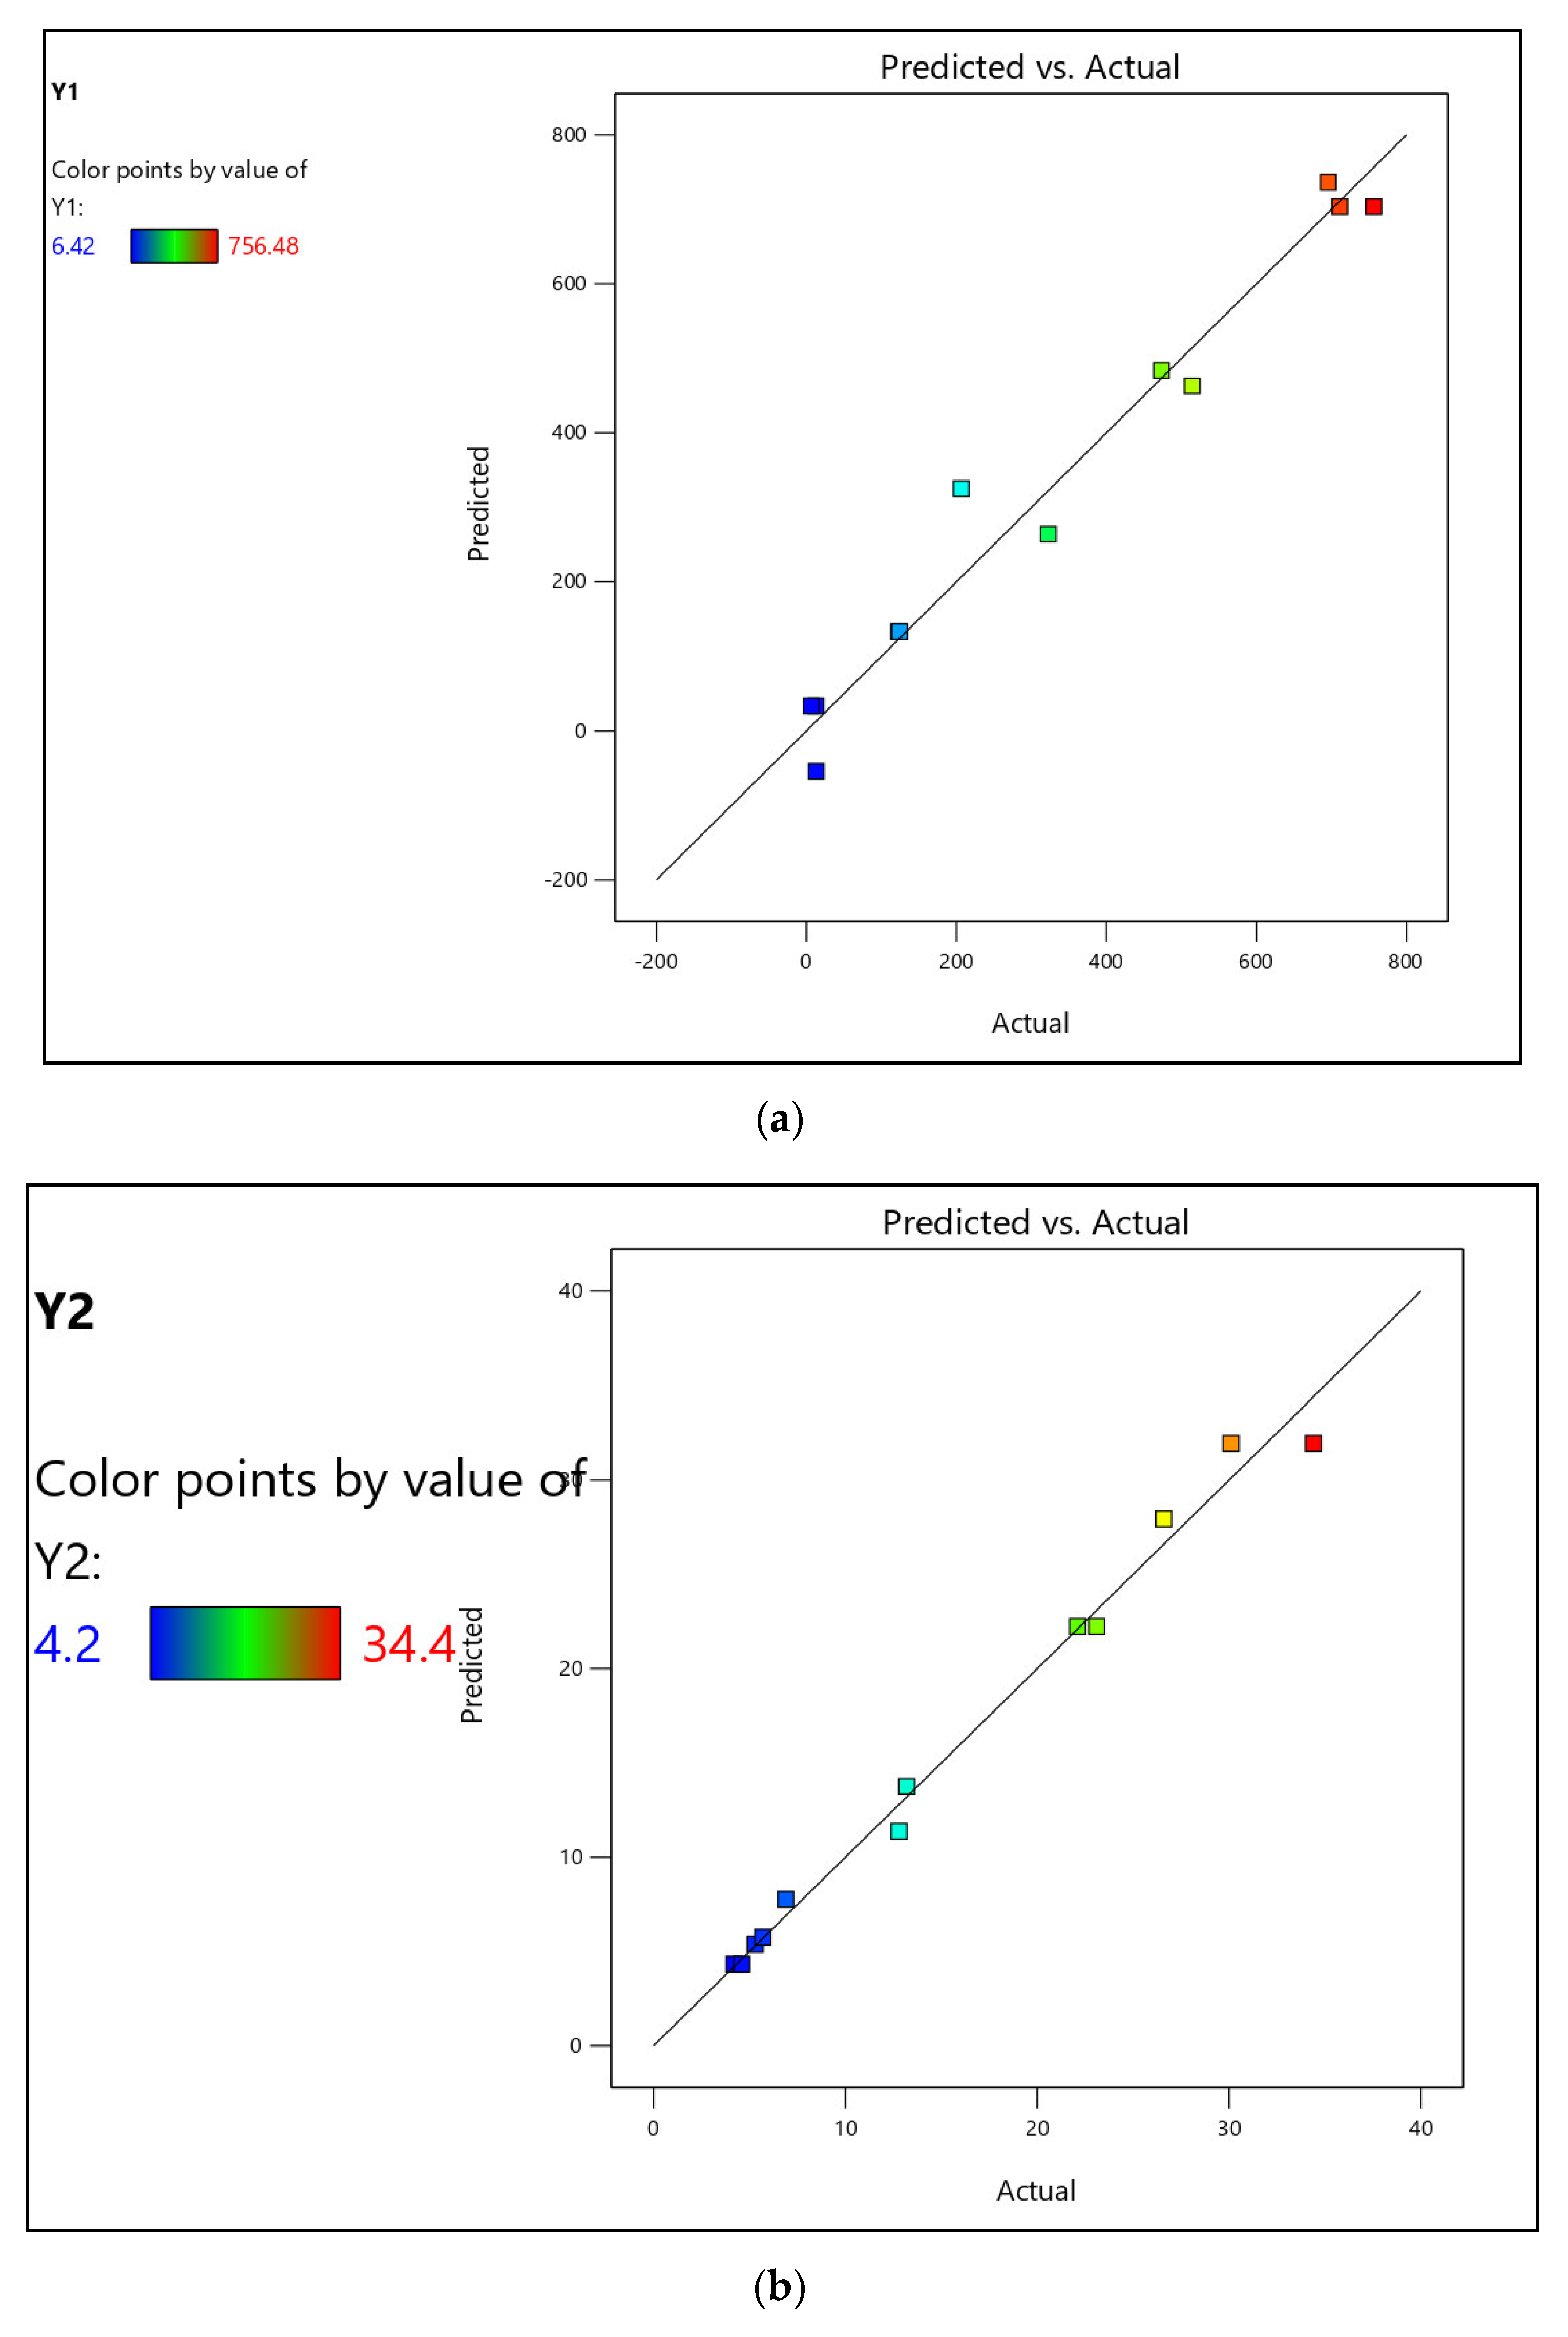
3.1.1. Formulation of Model Equations
3.1.2. Analysis of Variance
3.1.3. Process Optimization and Validation
3.1.4. Characteristics of Chemically Activated Carbon Pyrolyzed under Optimal Conditions
3.2. Competitive Removal of APIs by CPAC
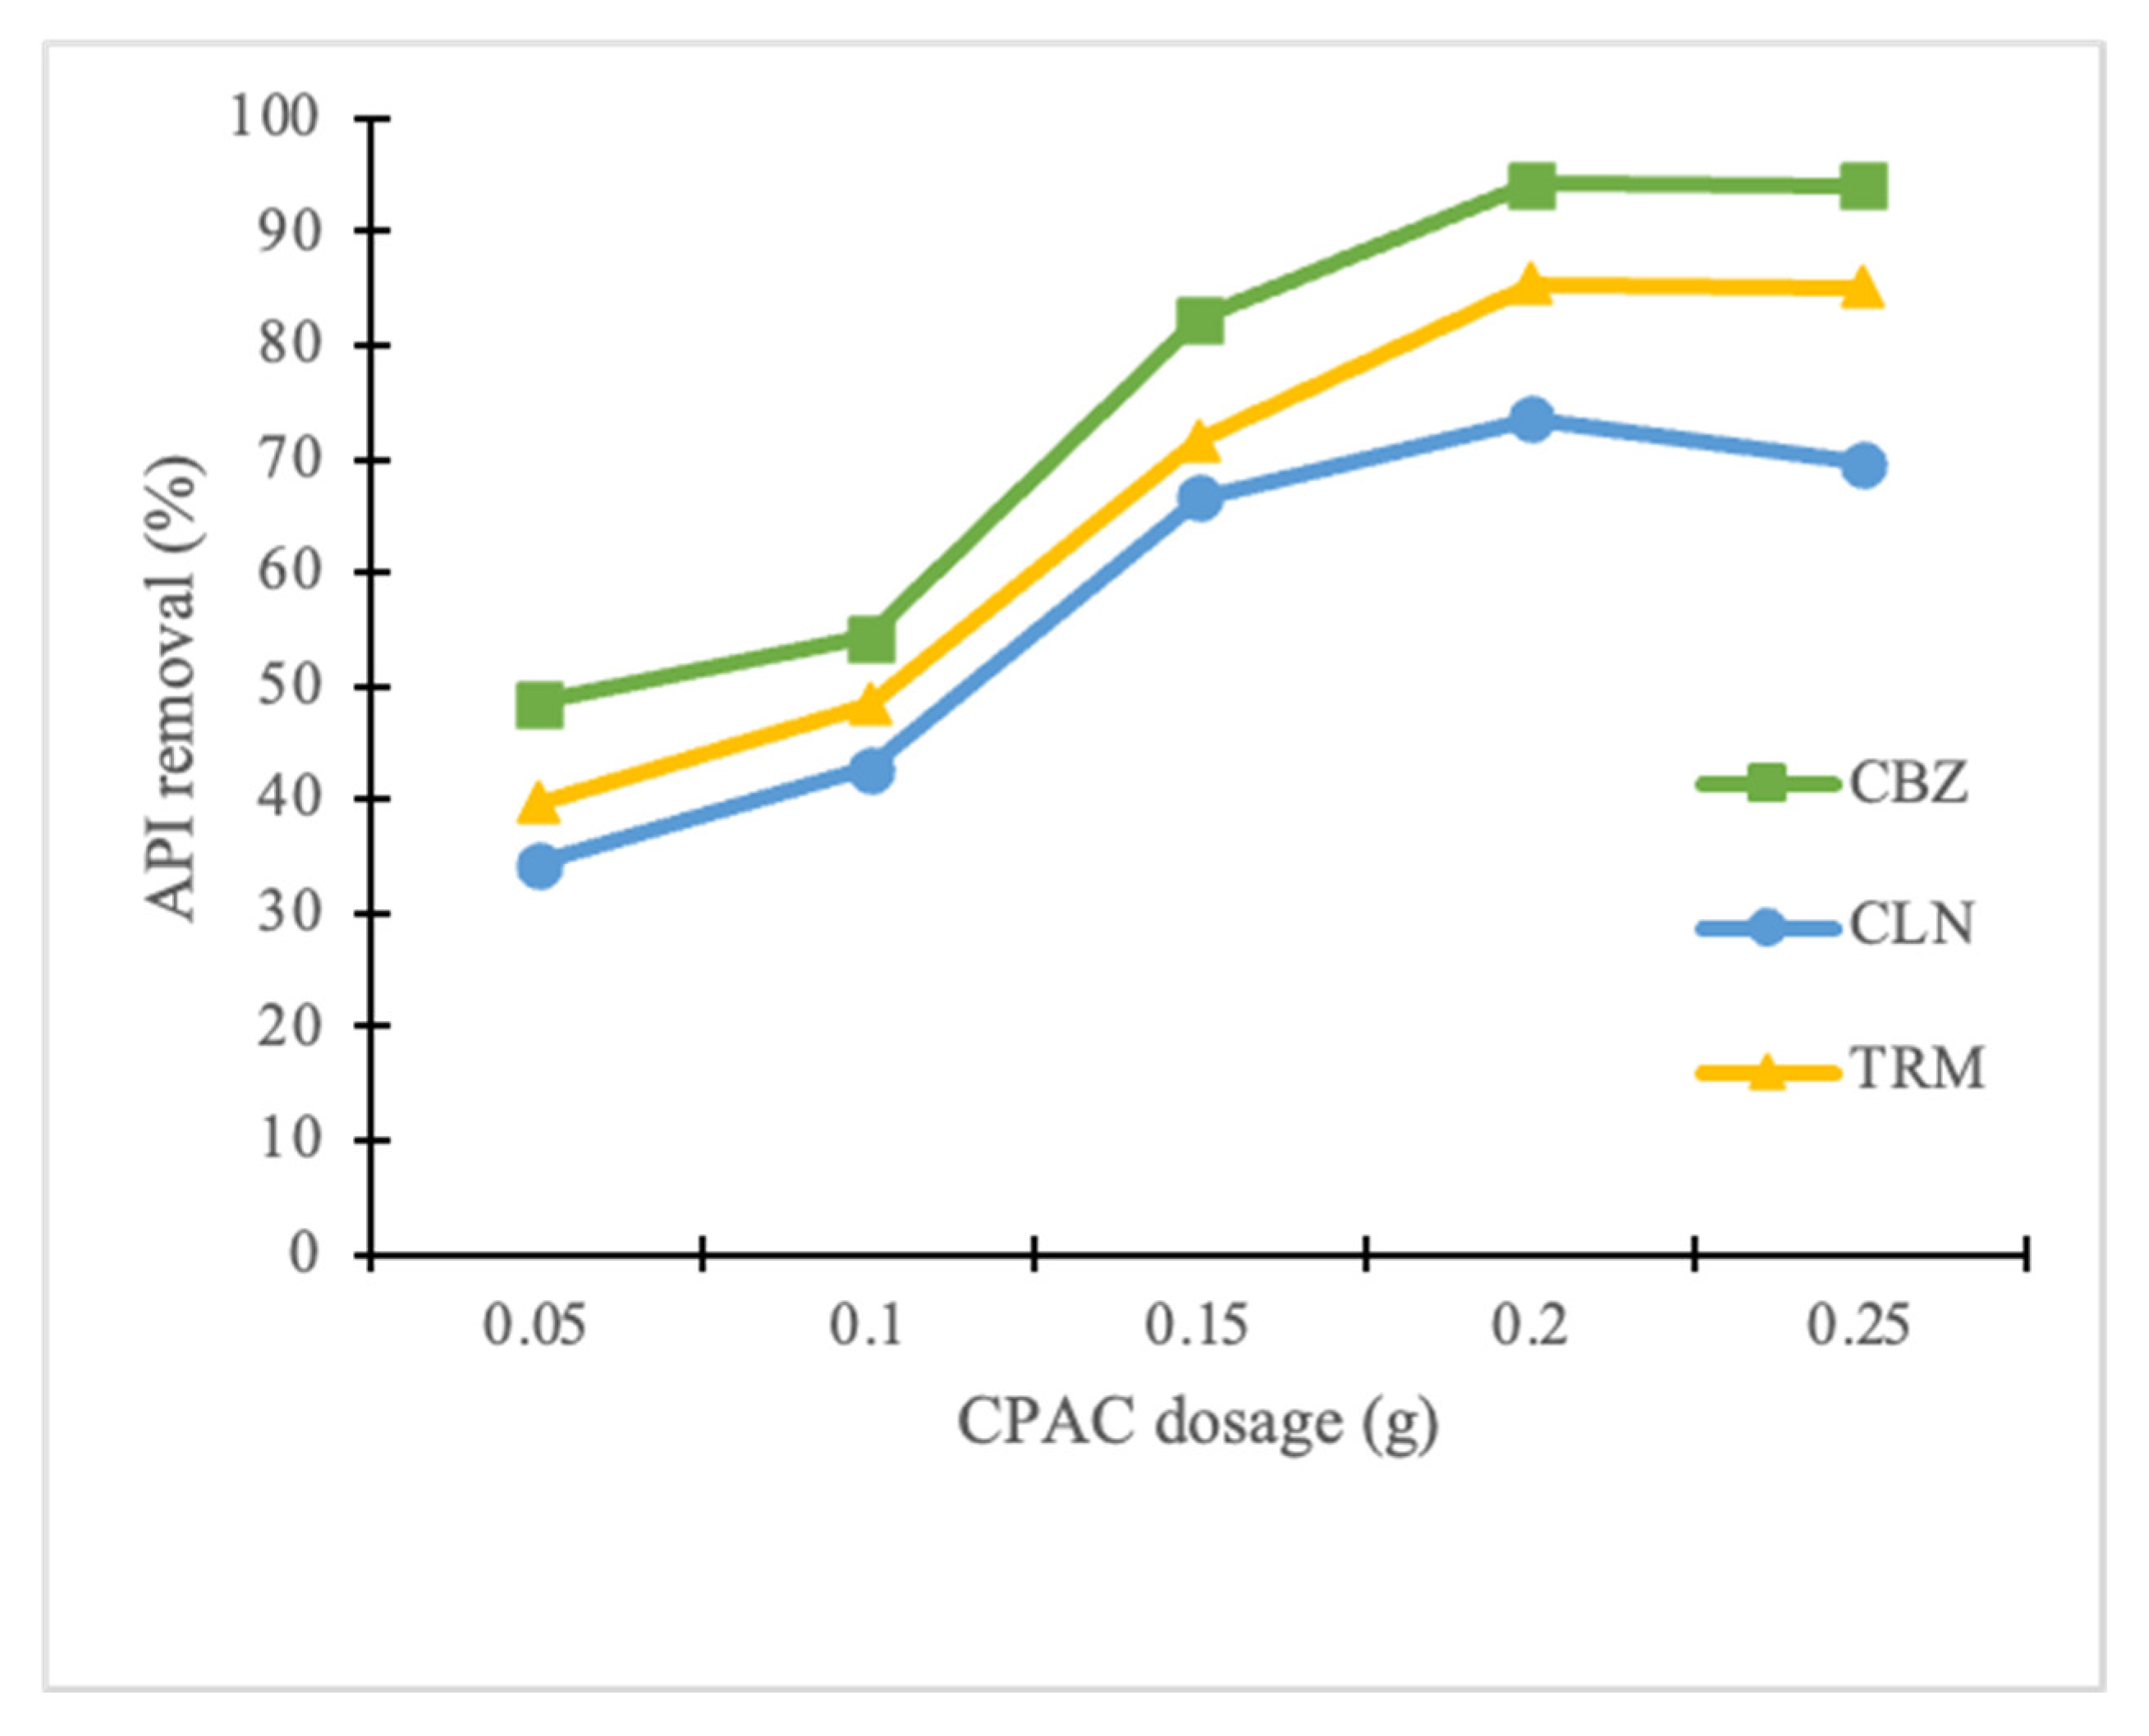
3.2.1. Effect of CPAC Dosage
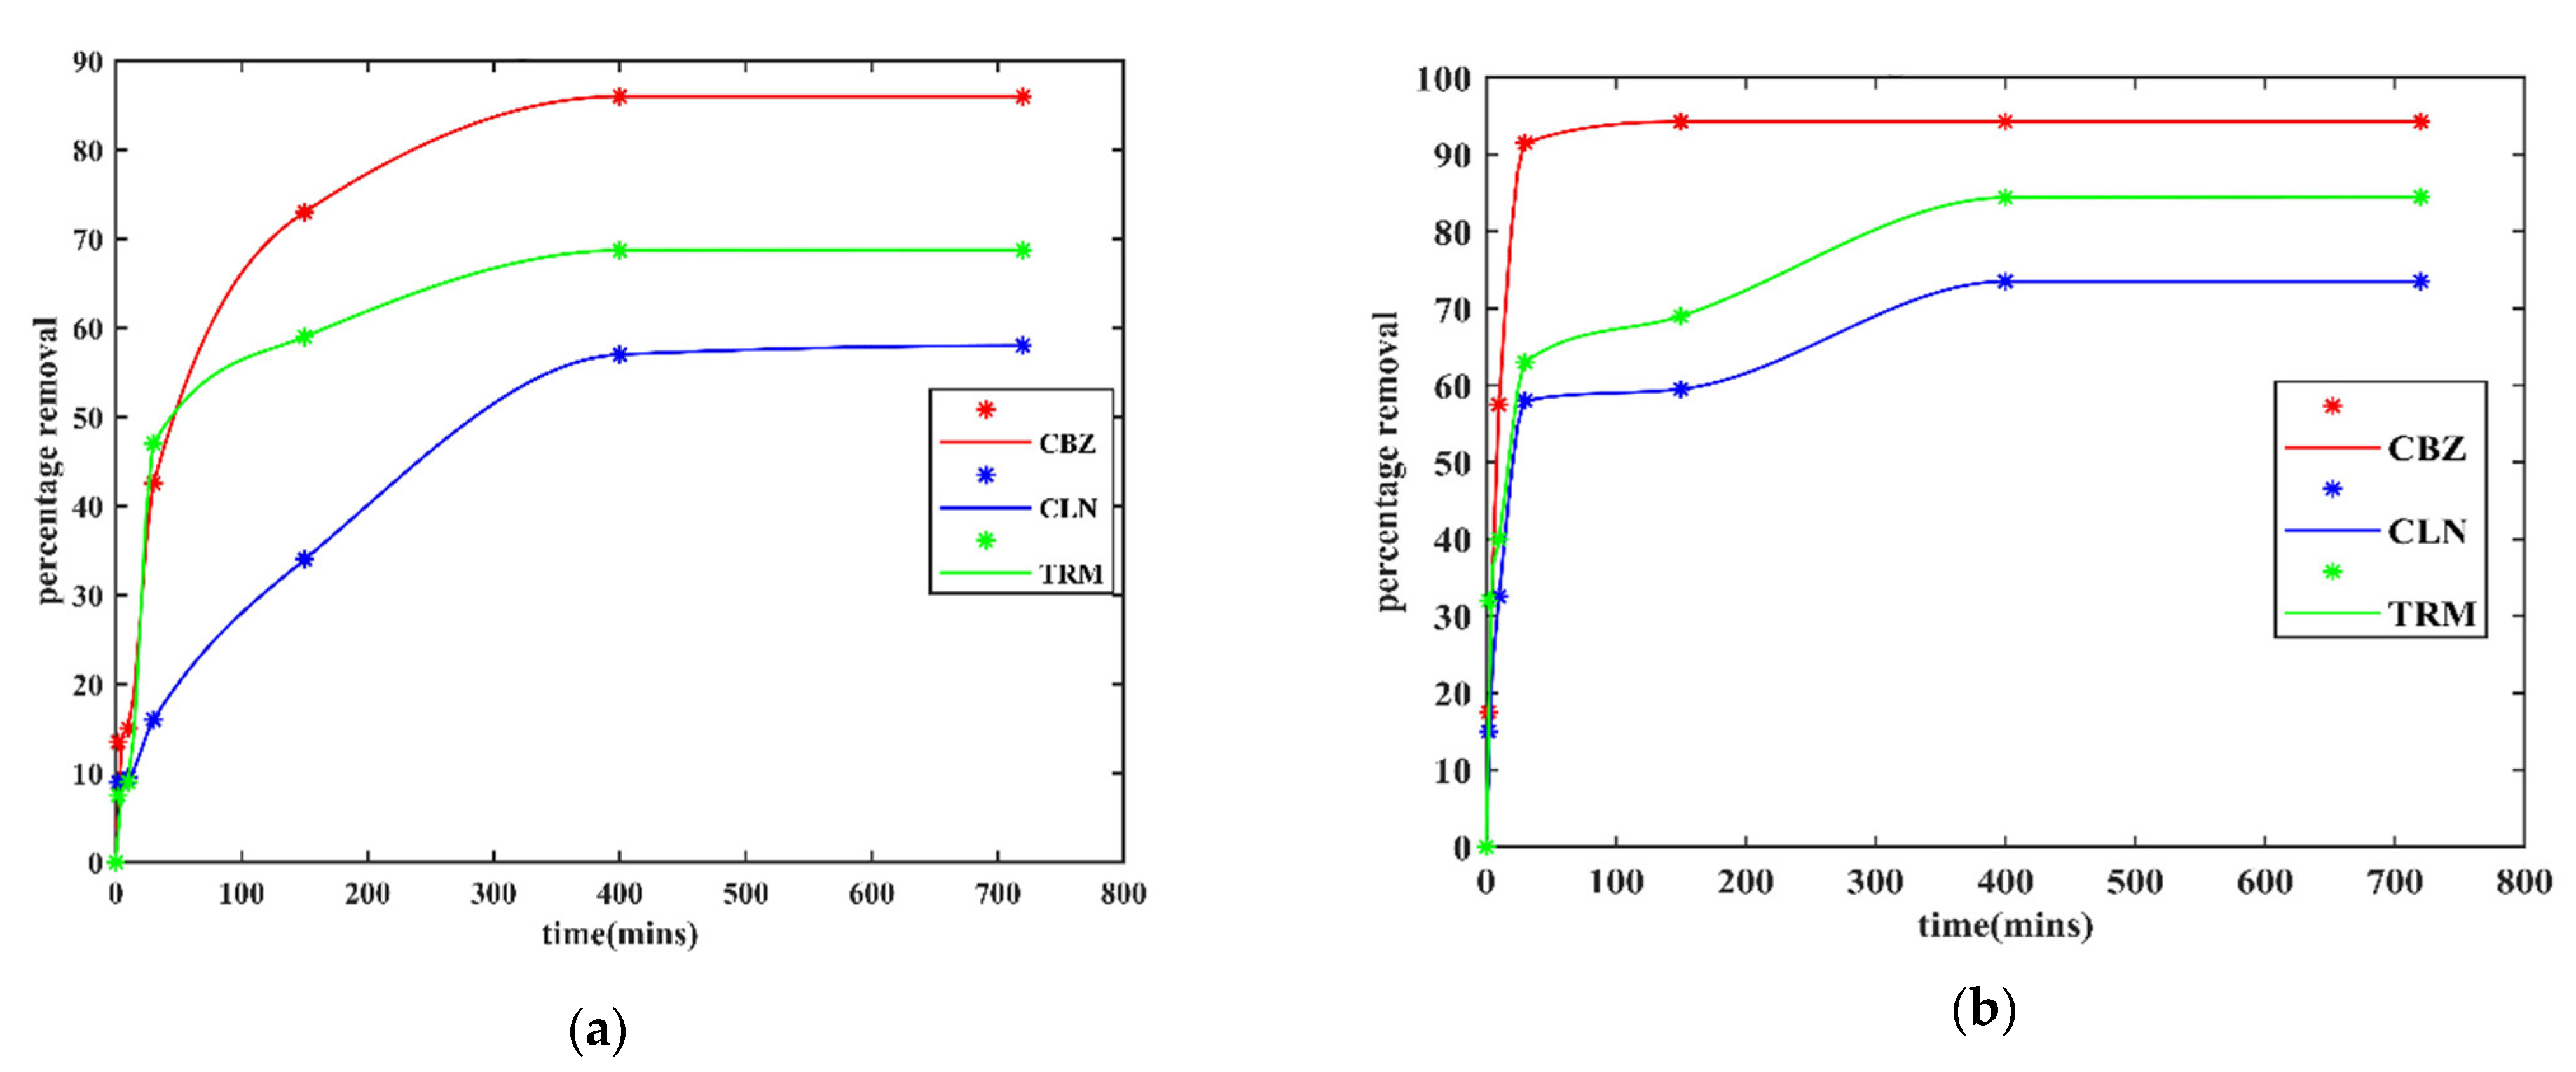
3.2.2. Effect of Contact Time
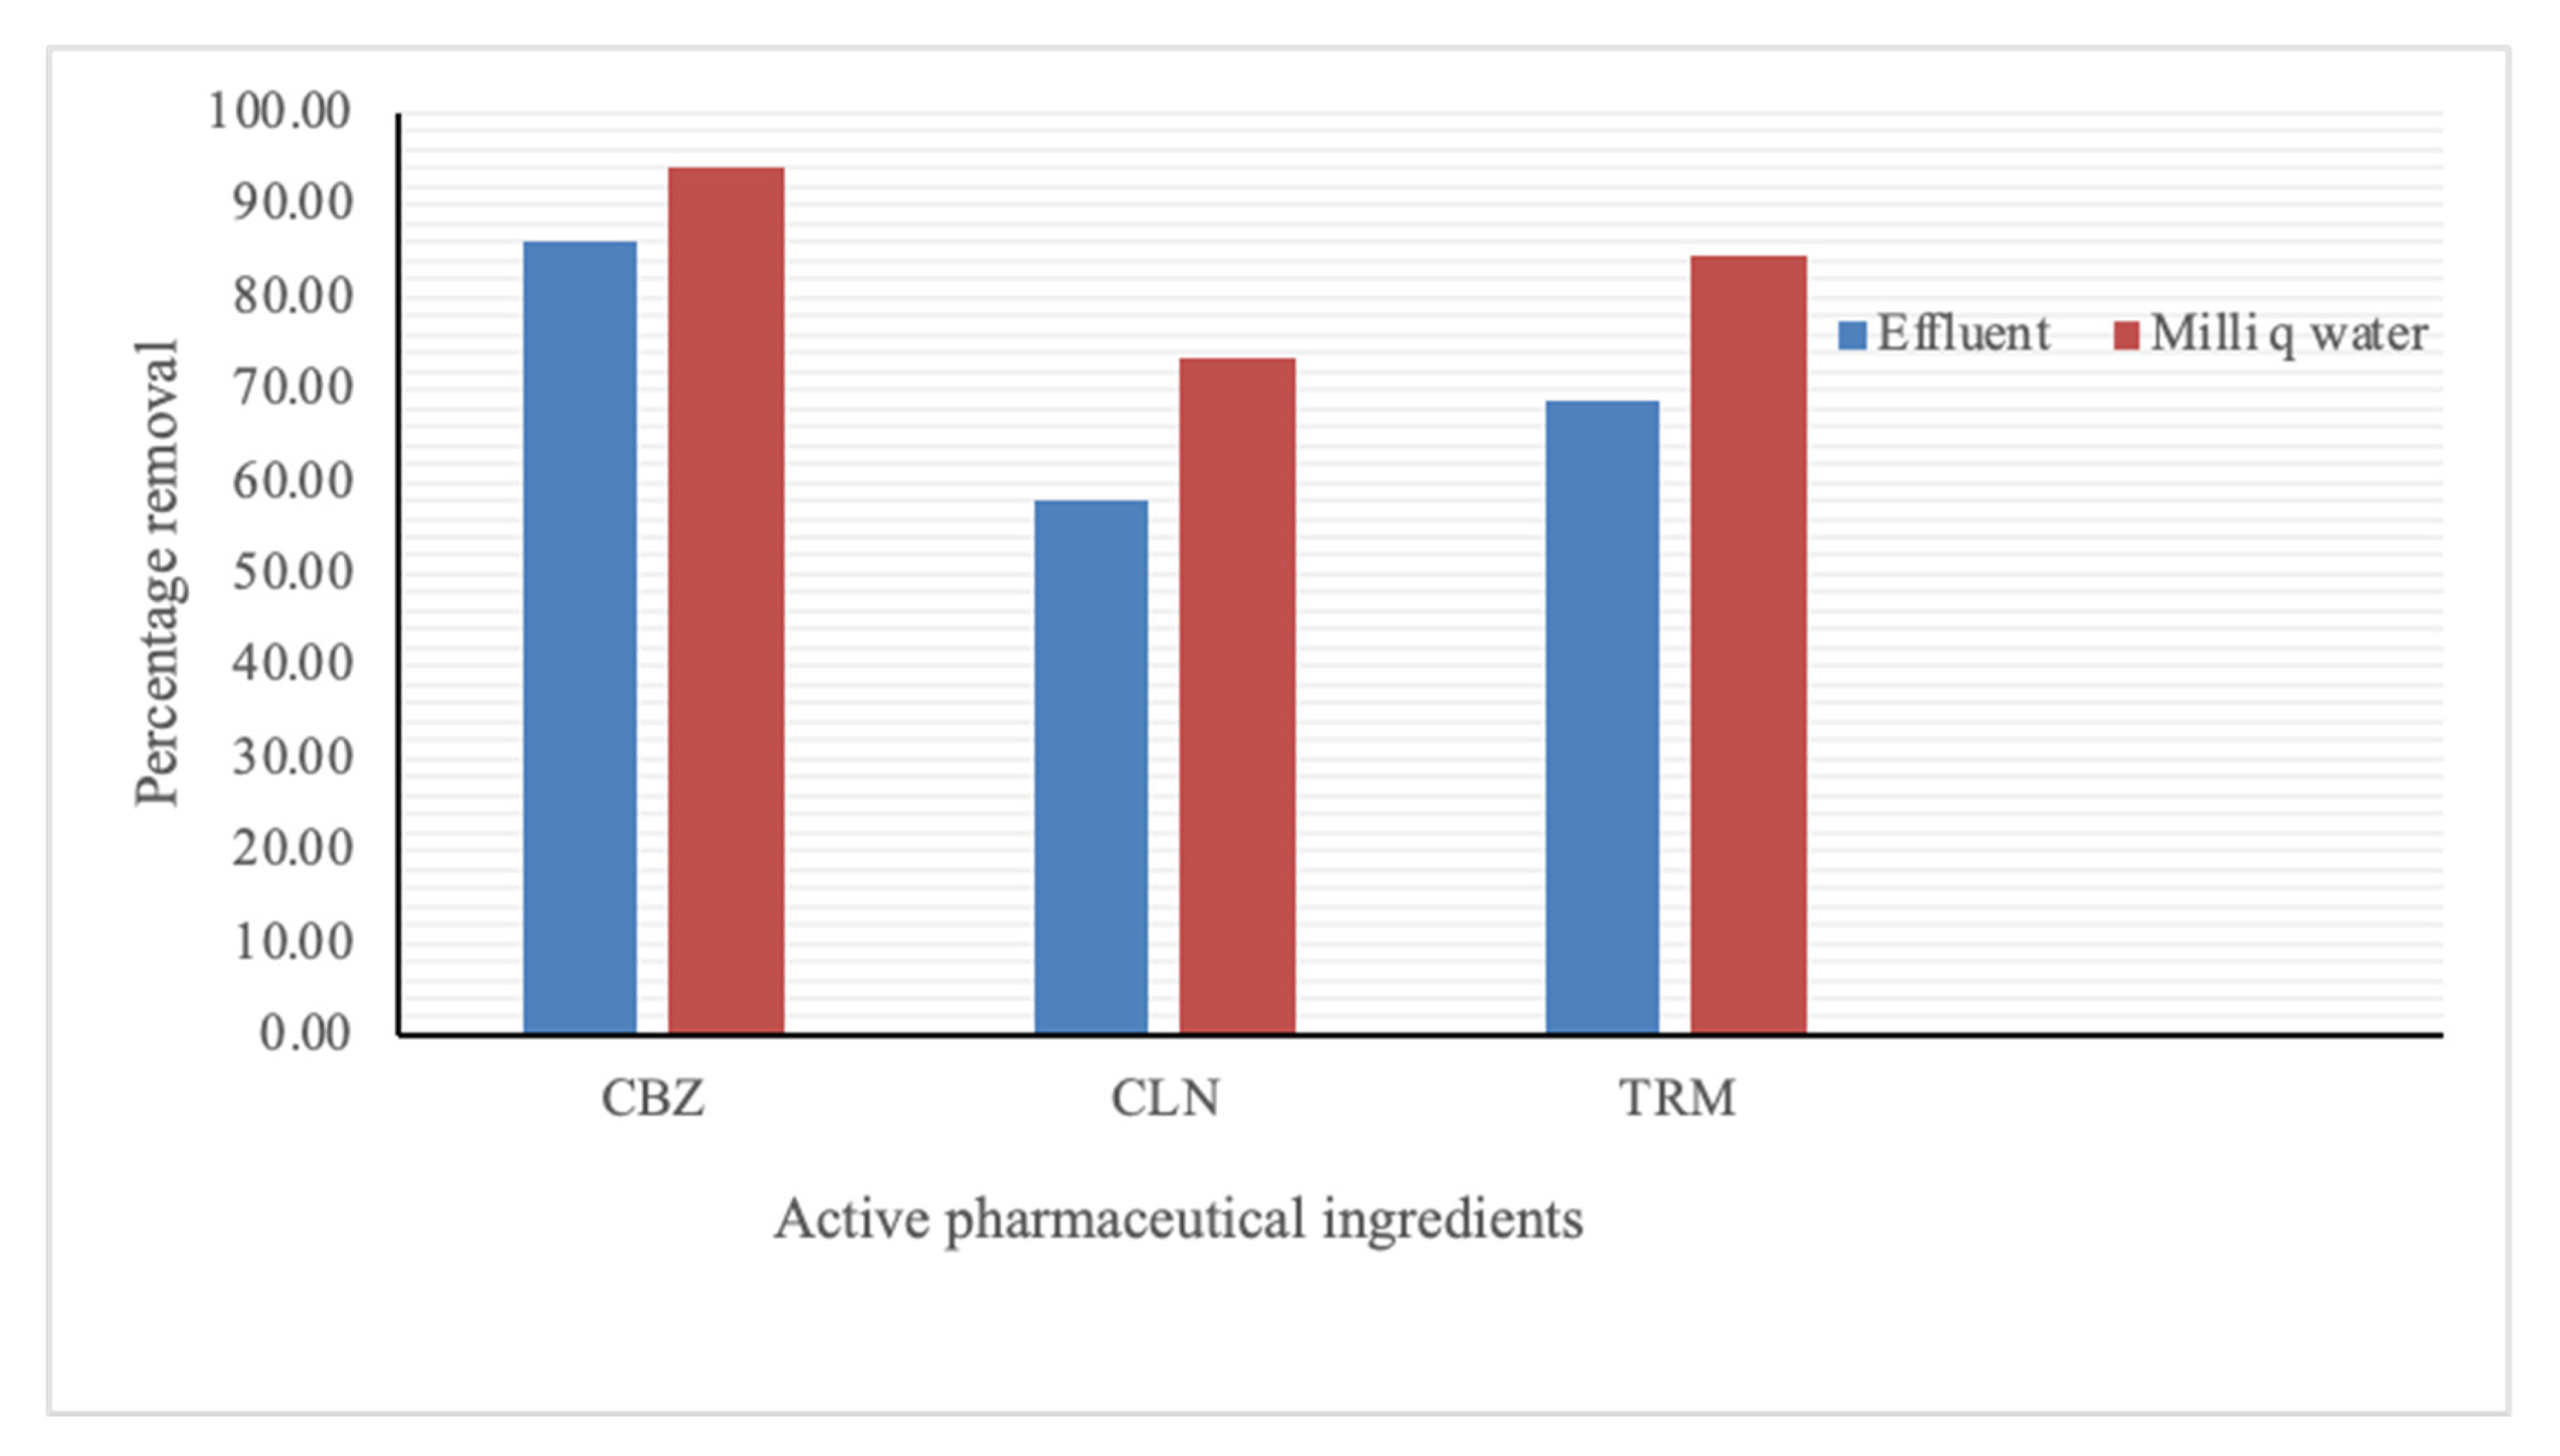
3.2.3. Effect of Background Organic Matter on API Adsorption by CPAC
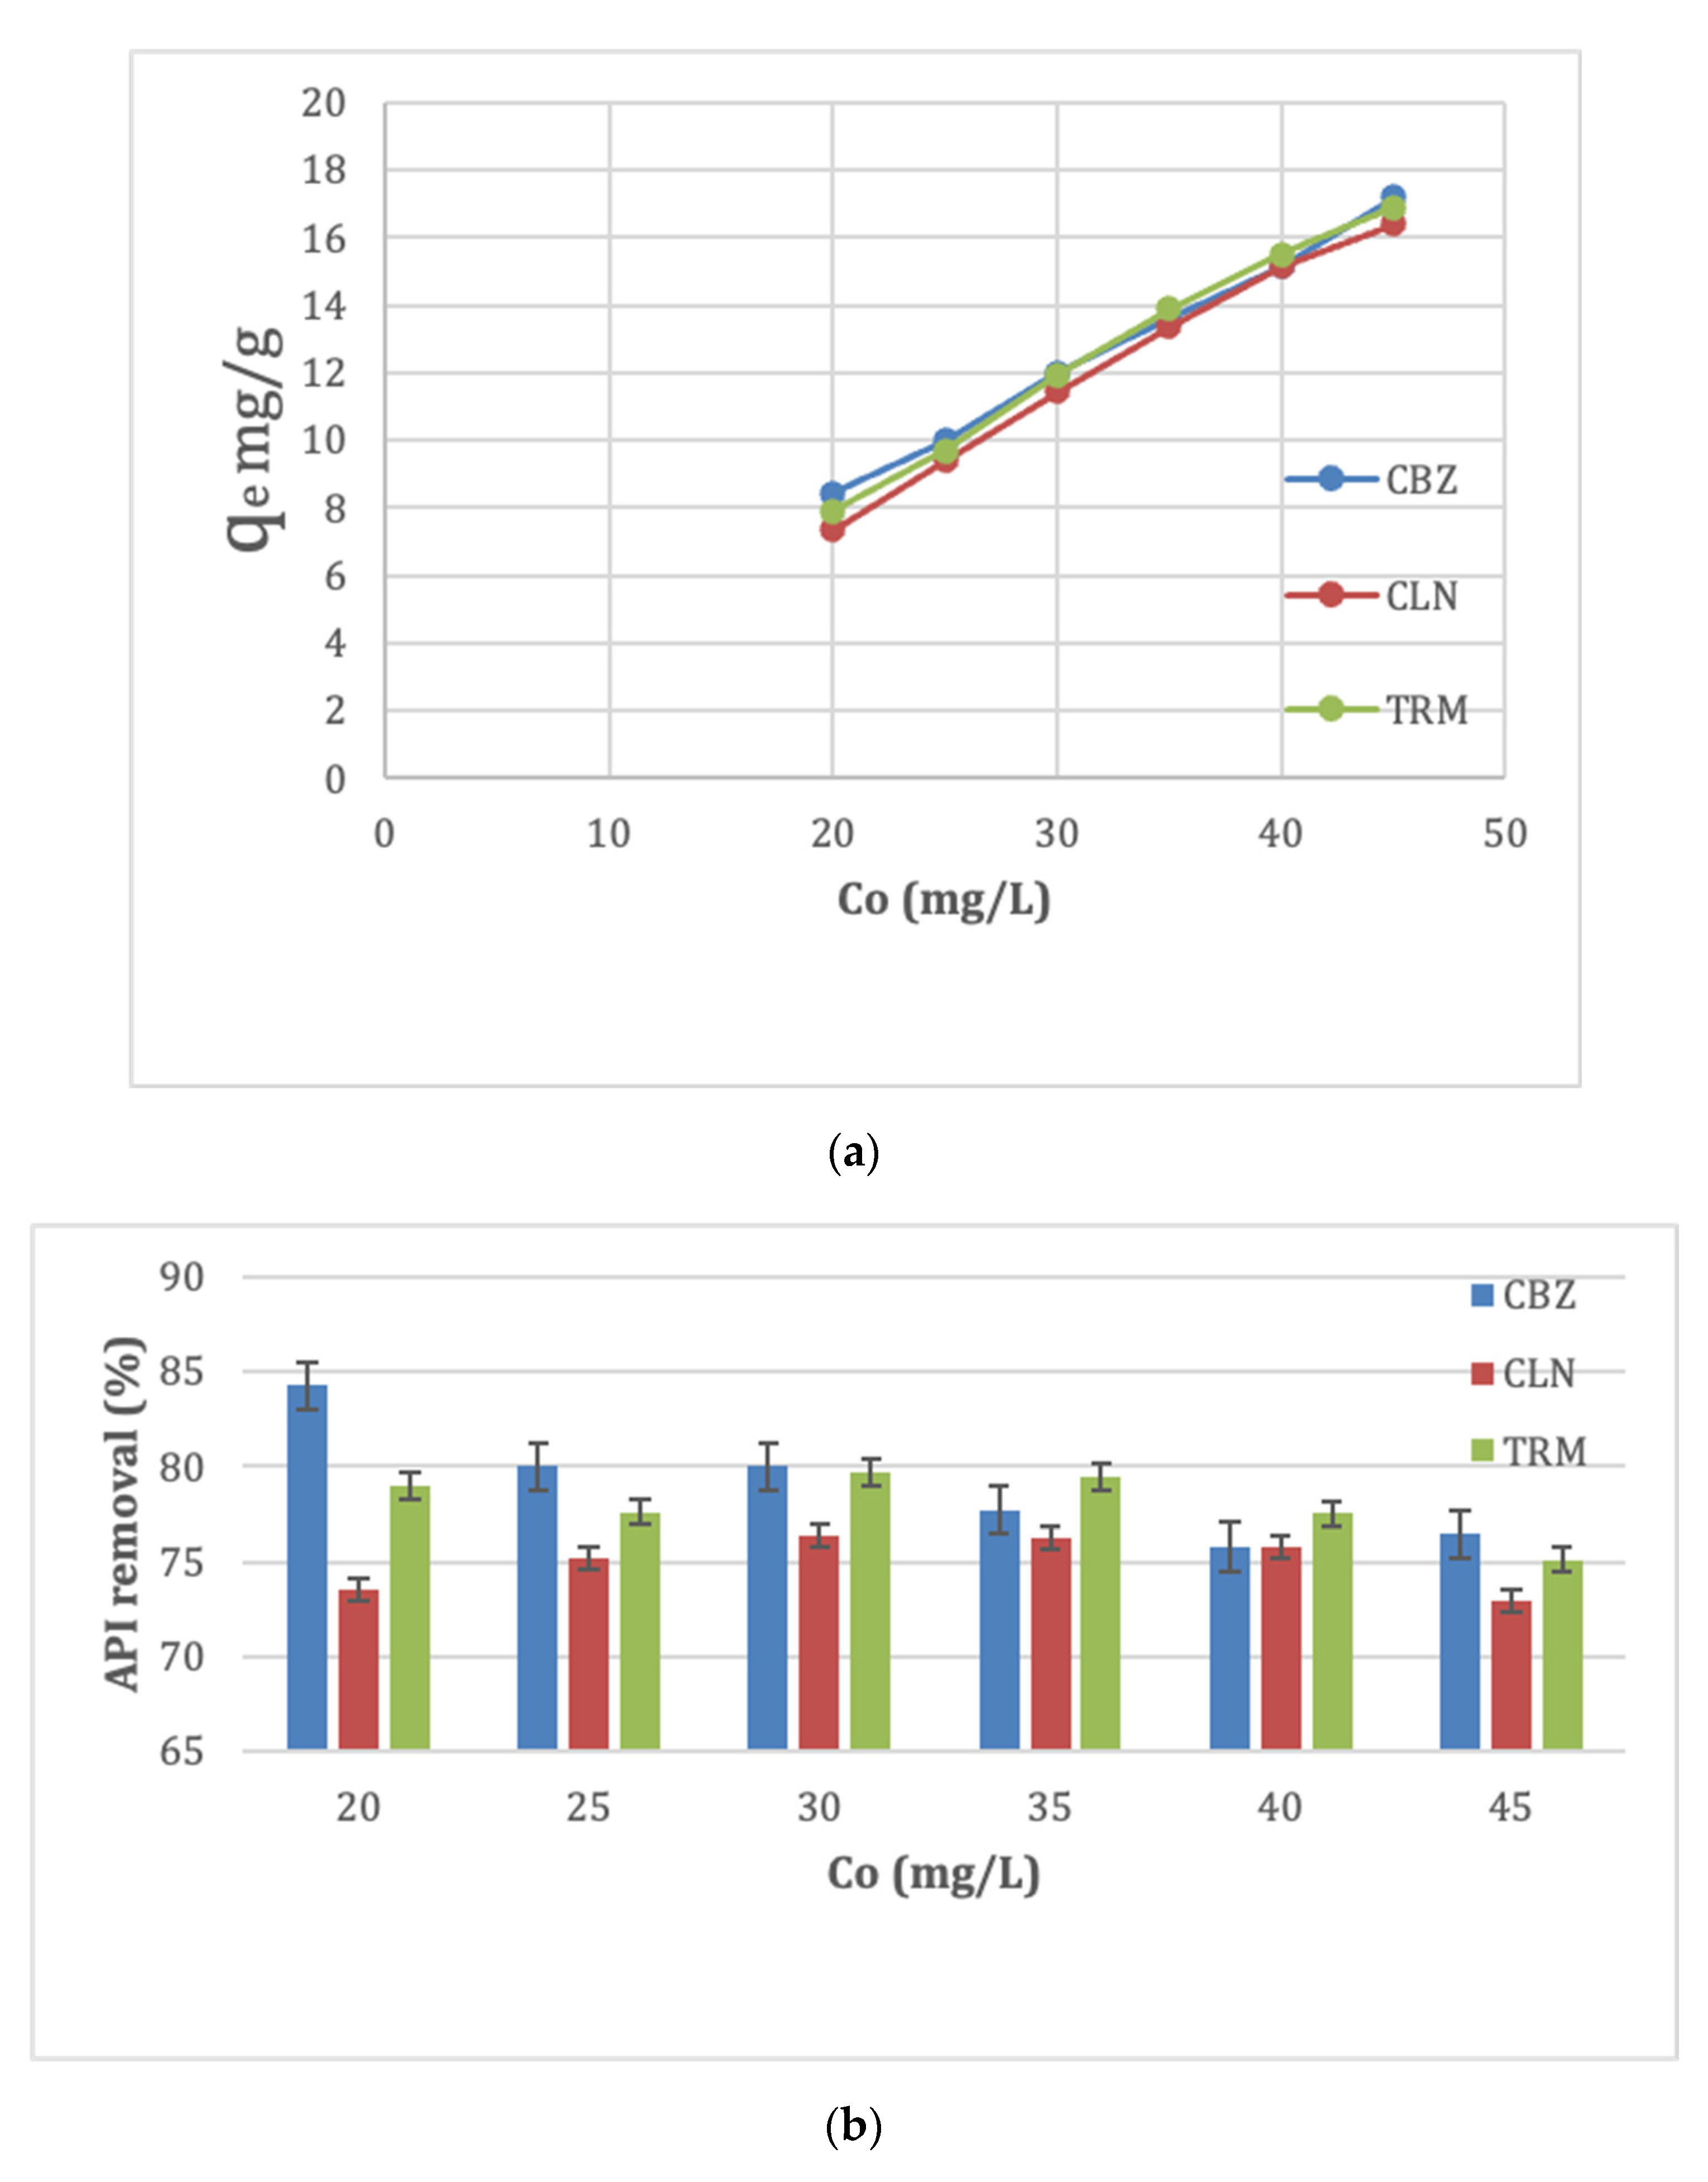
3.2.4. Effect of Initial API Concentration
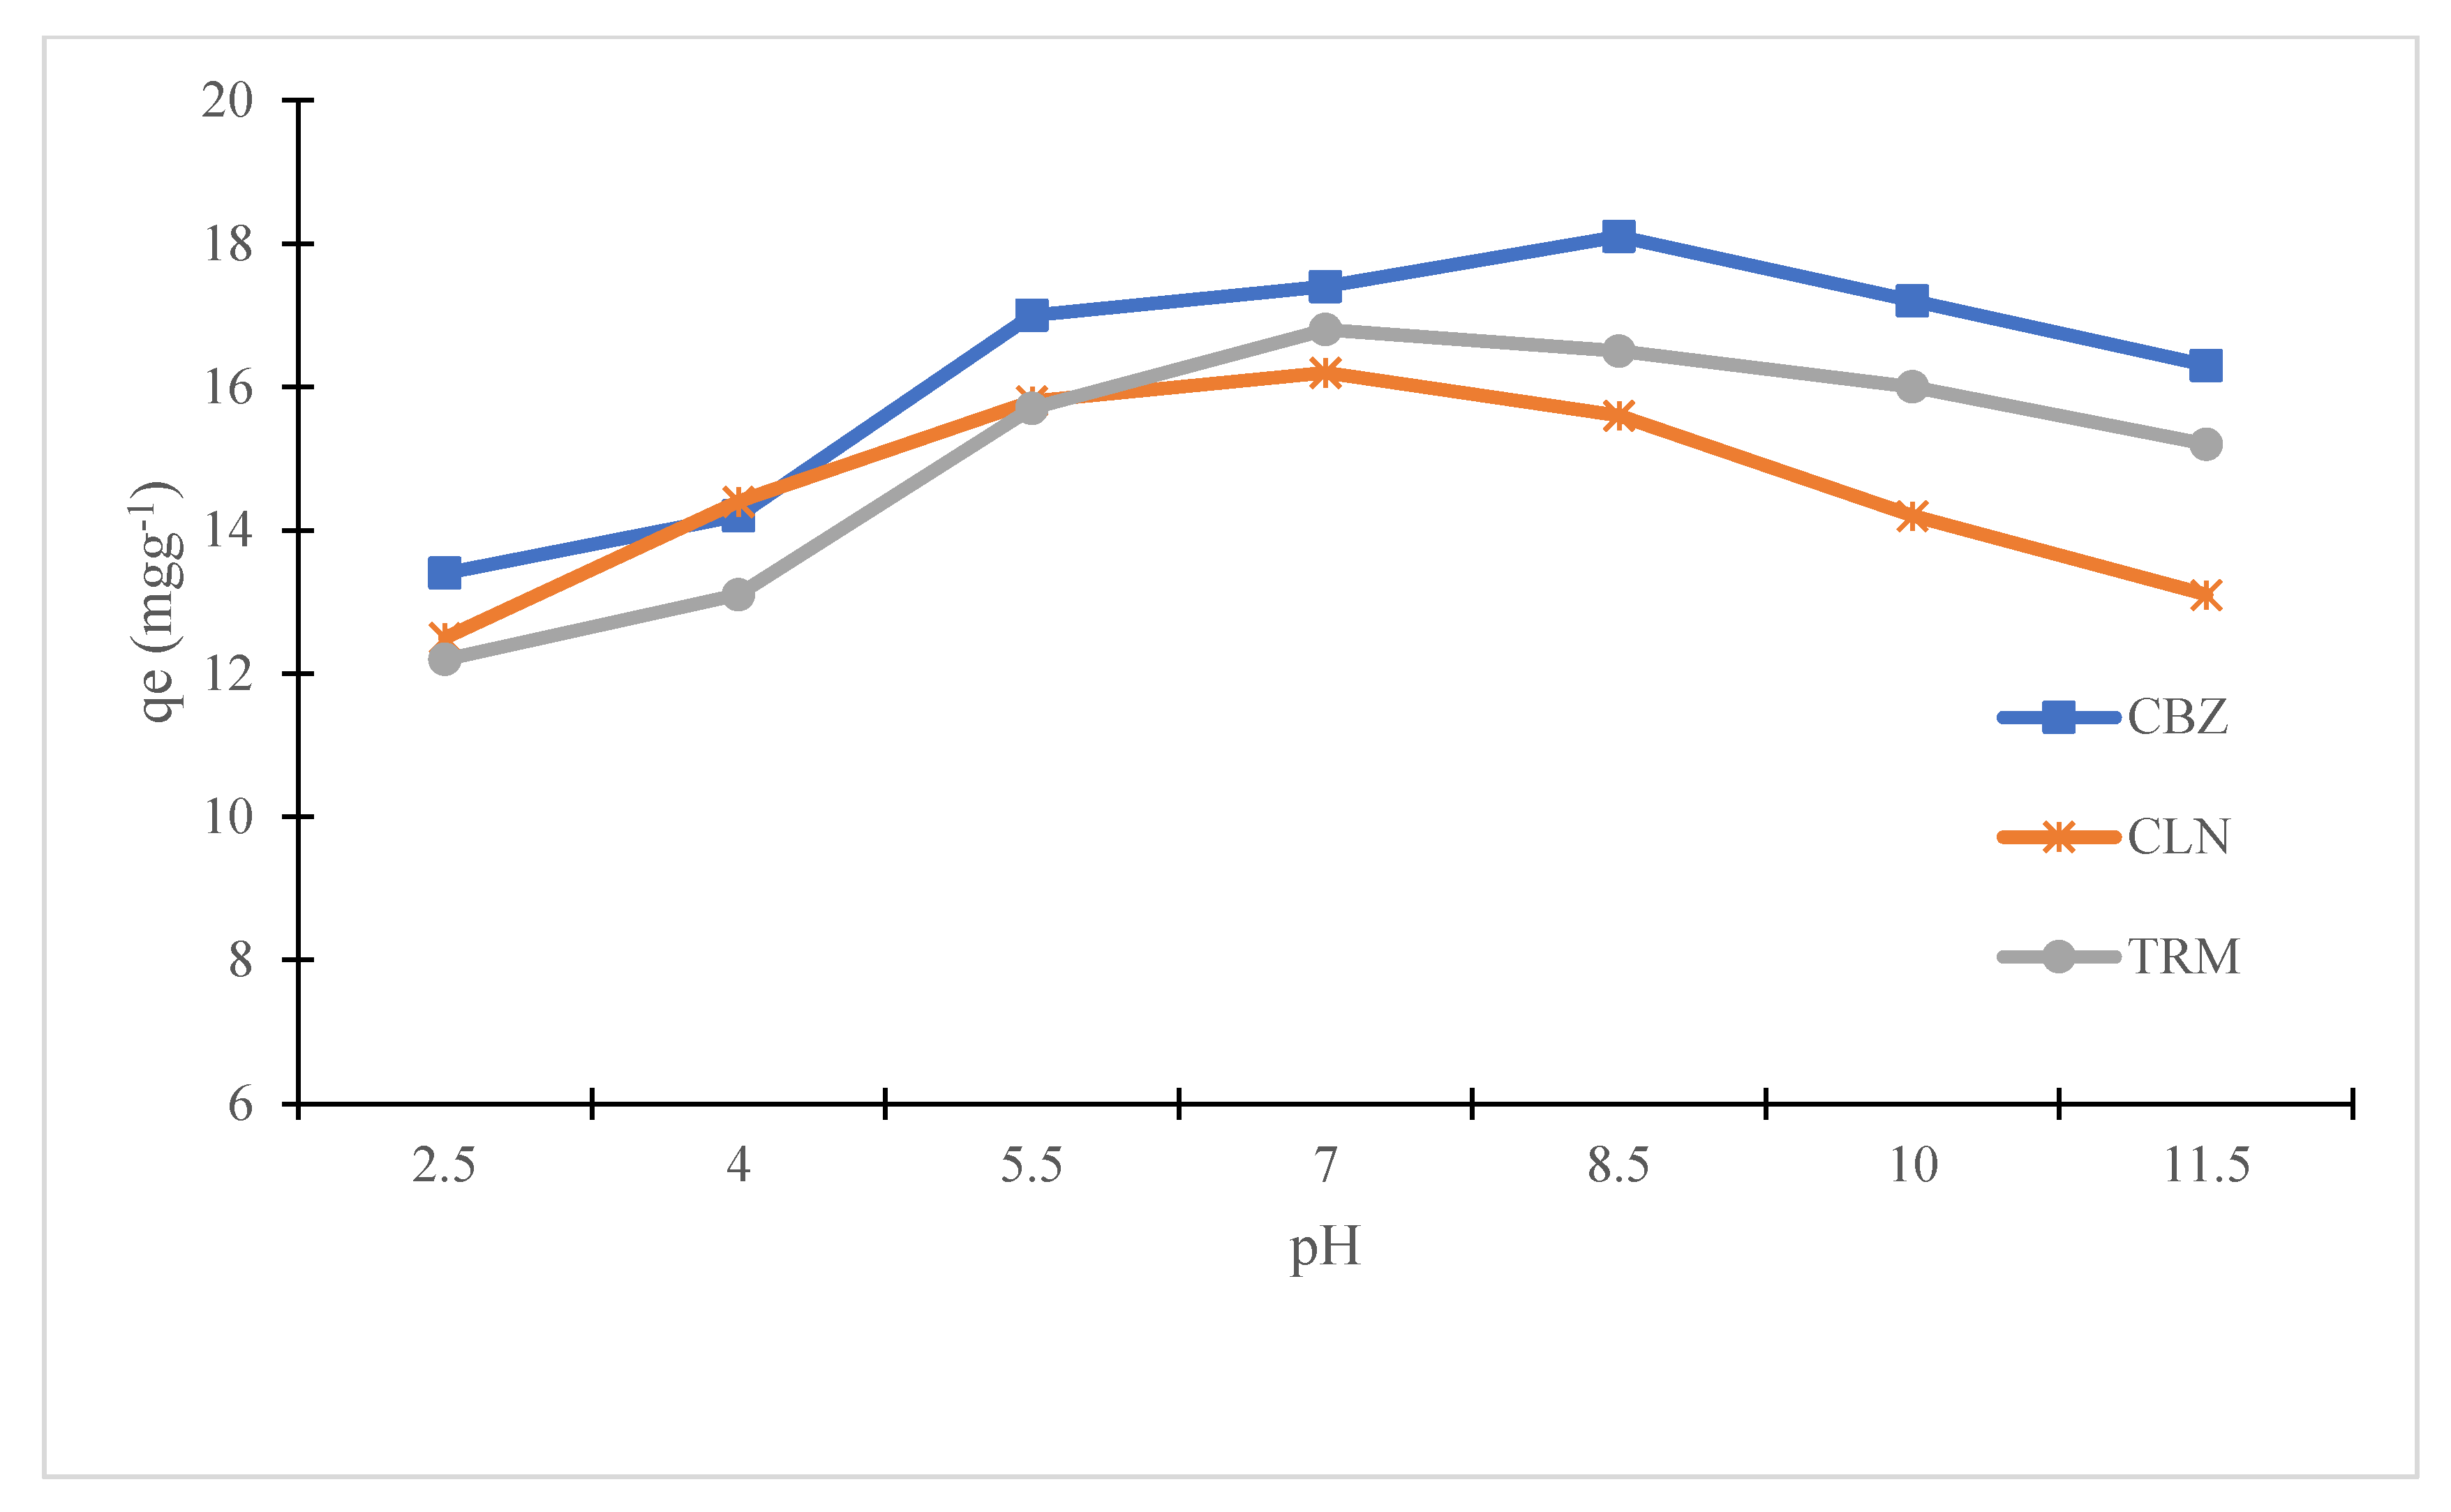
3.2.5. Effect of pH Variations on Adsorption Capacity of APIs
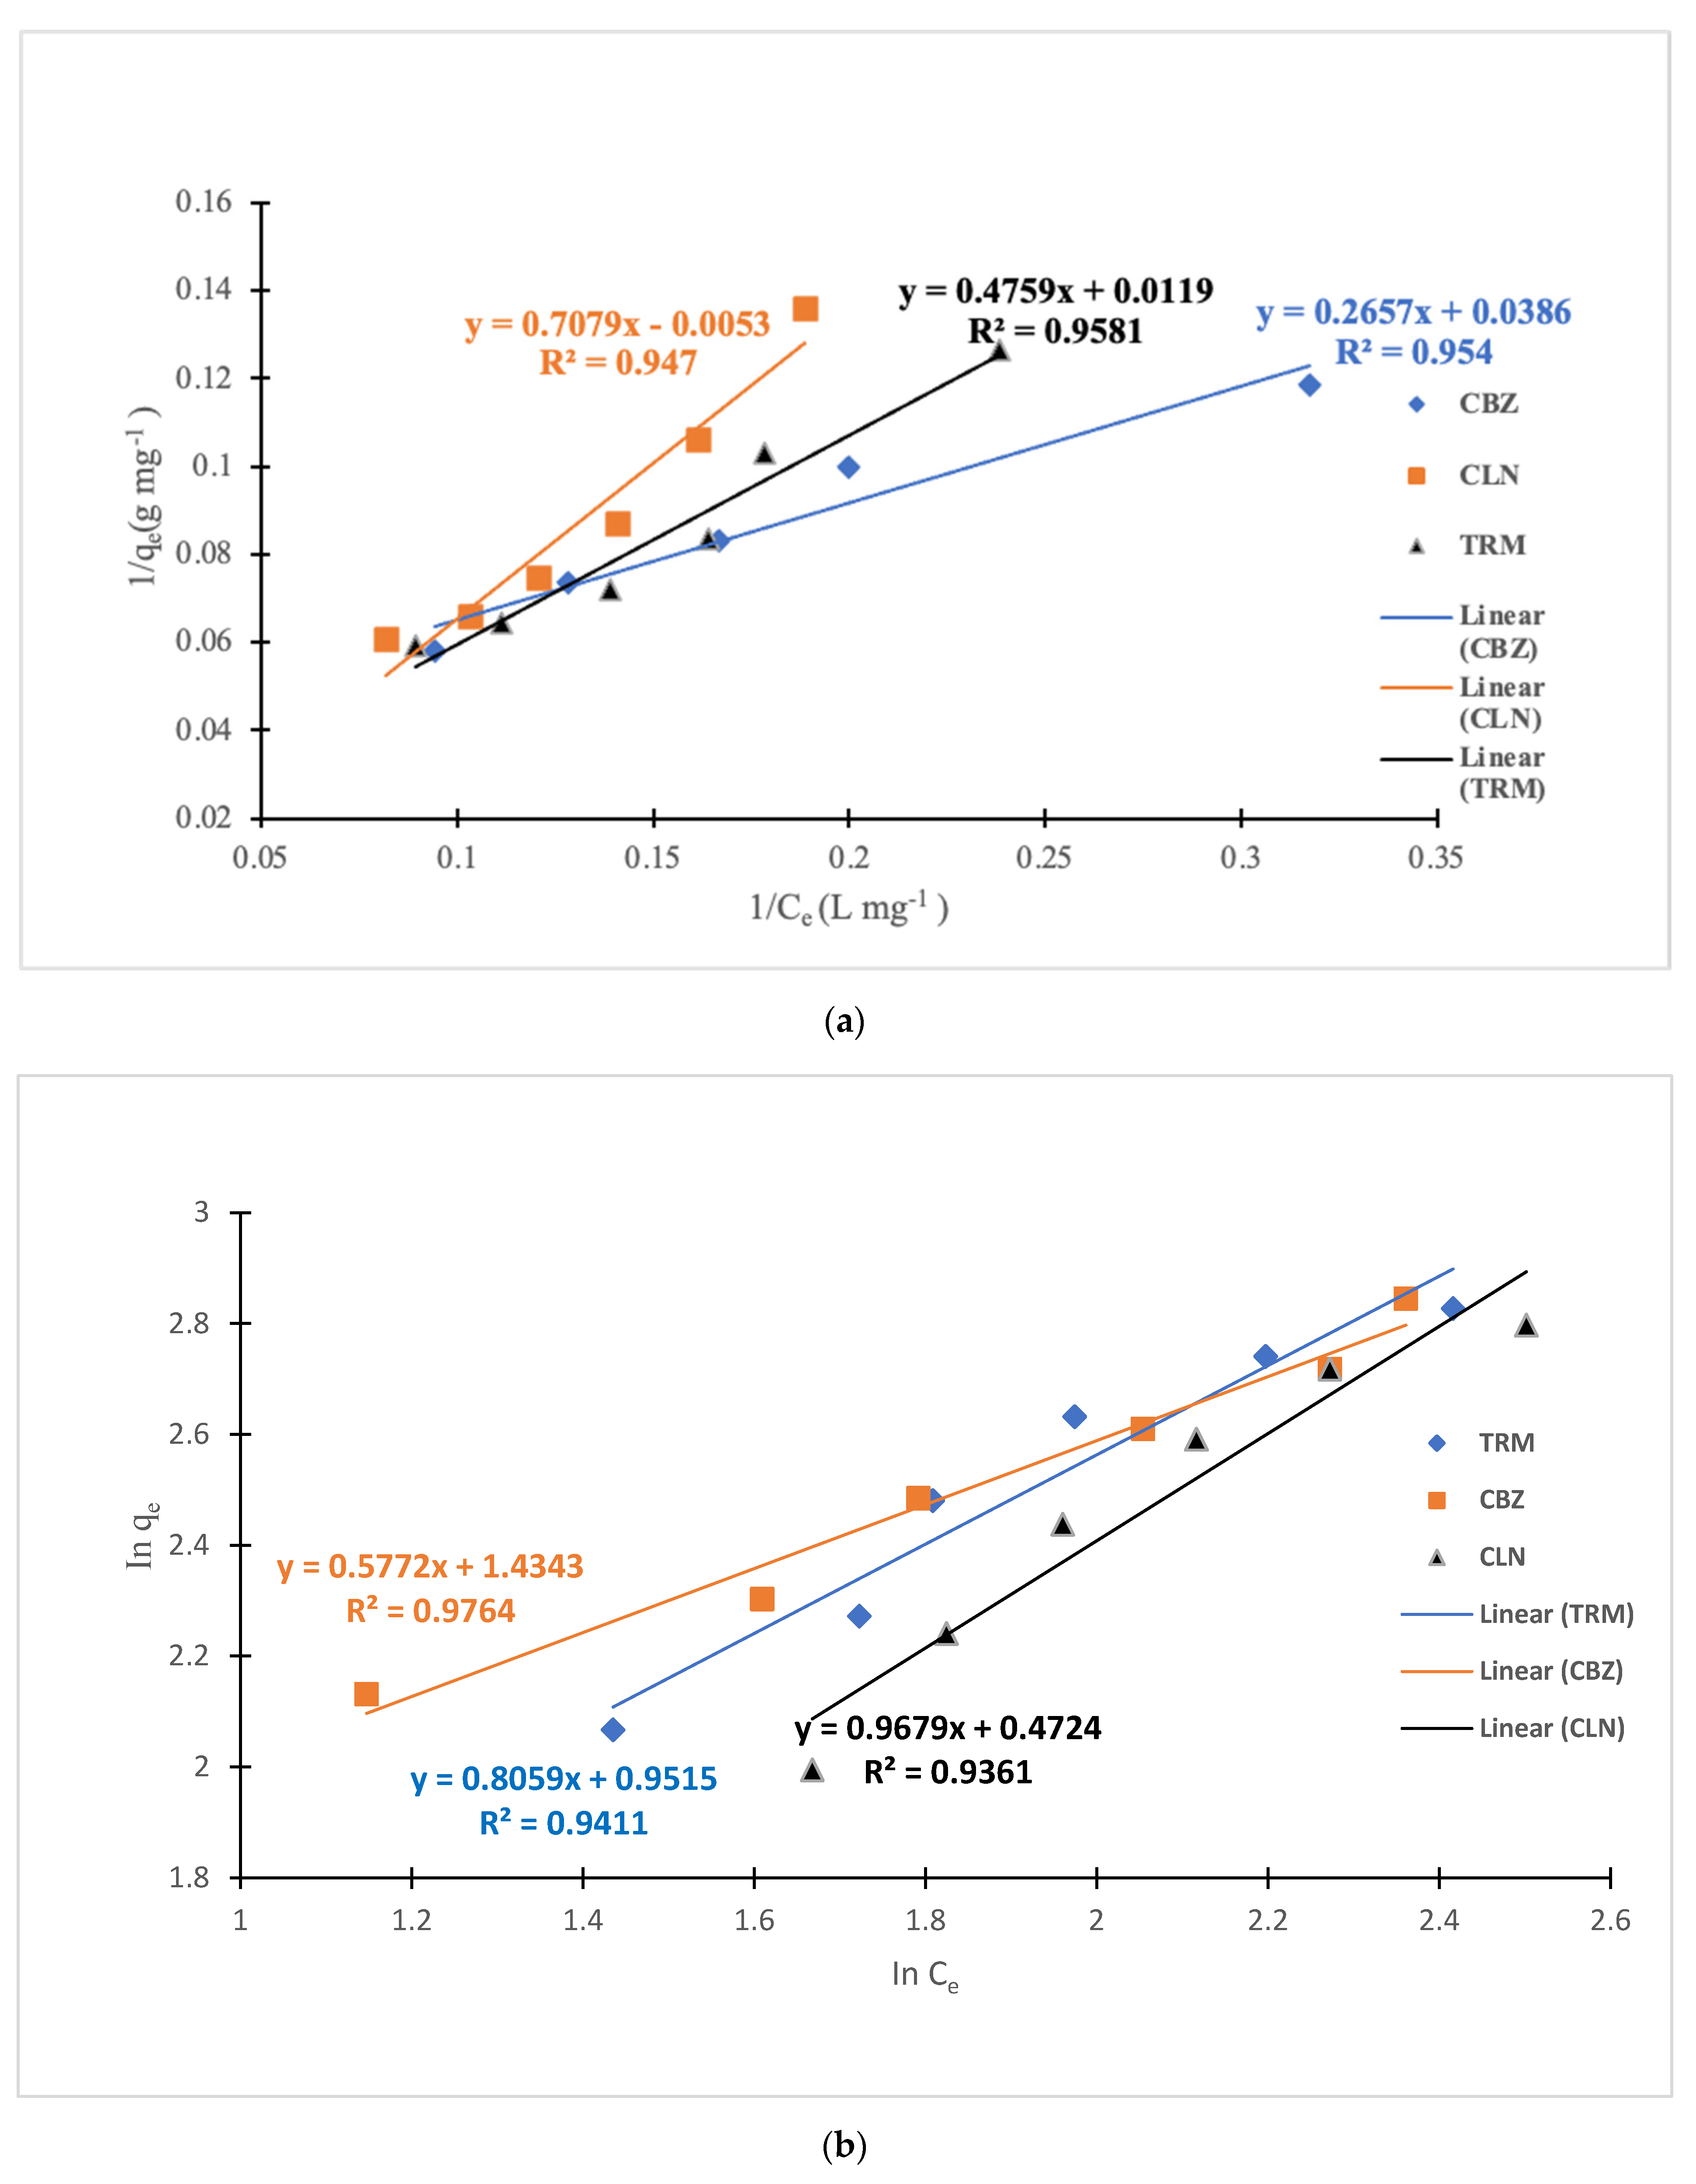
3.3. Adsorption Isotherm Models
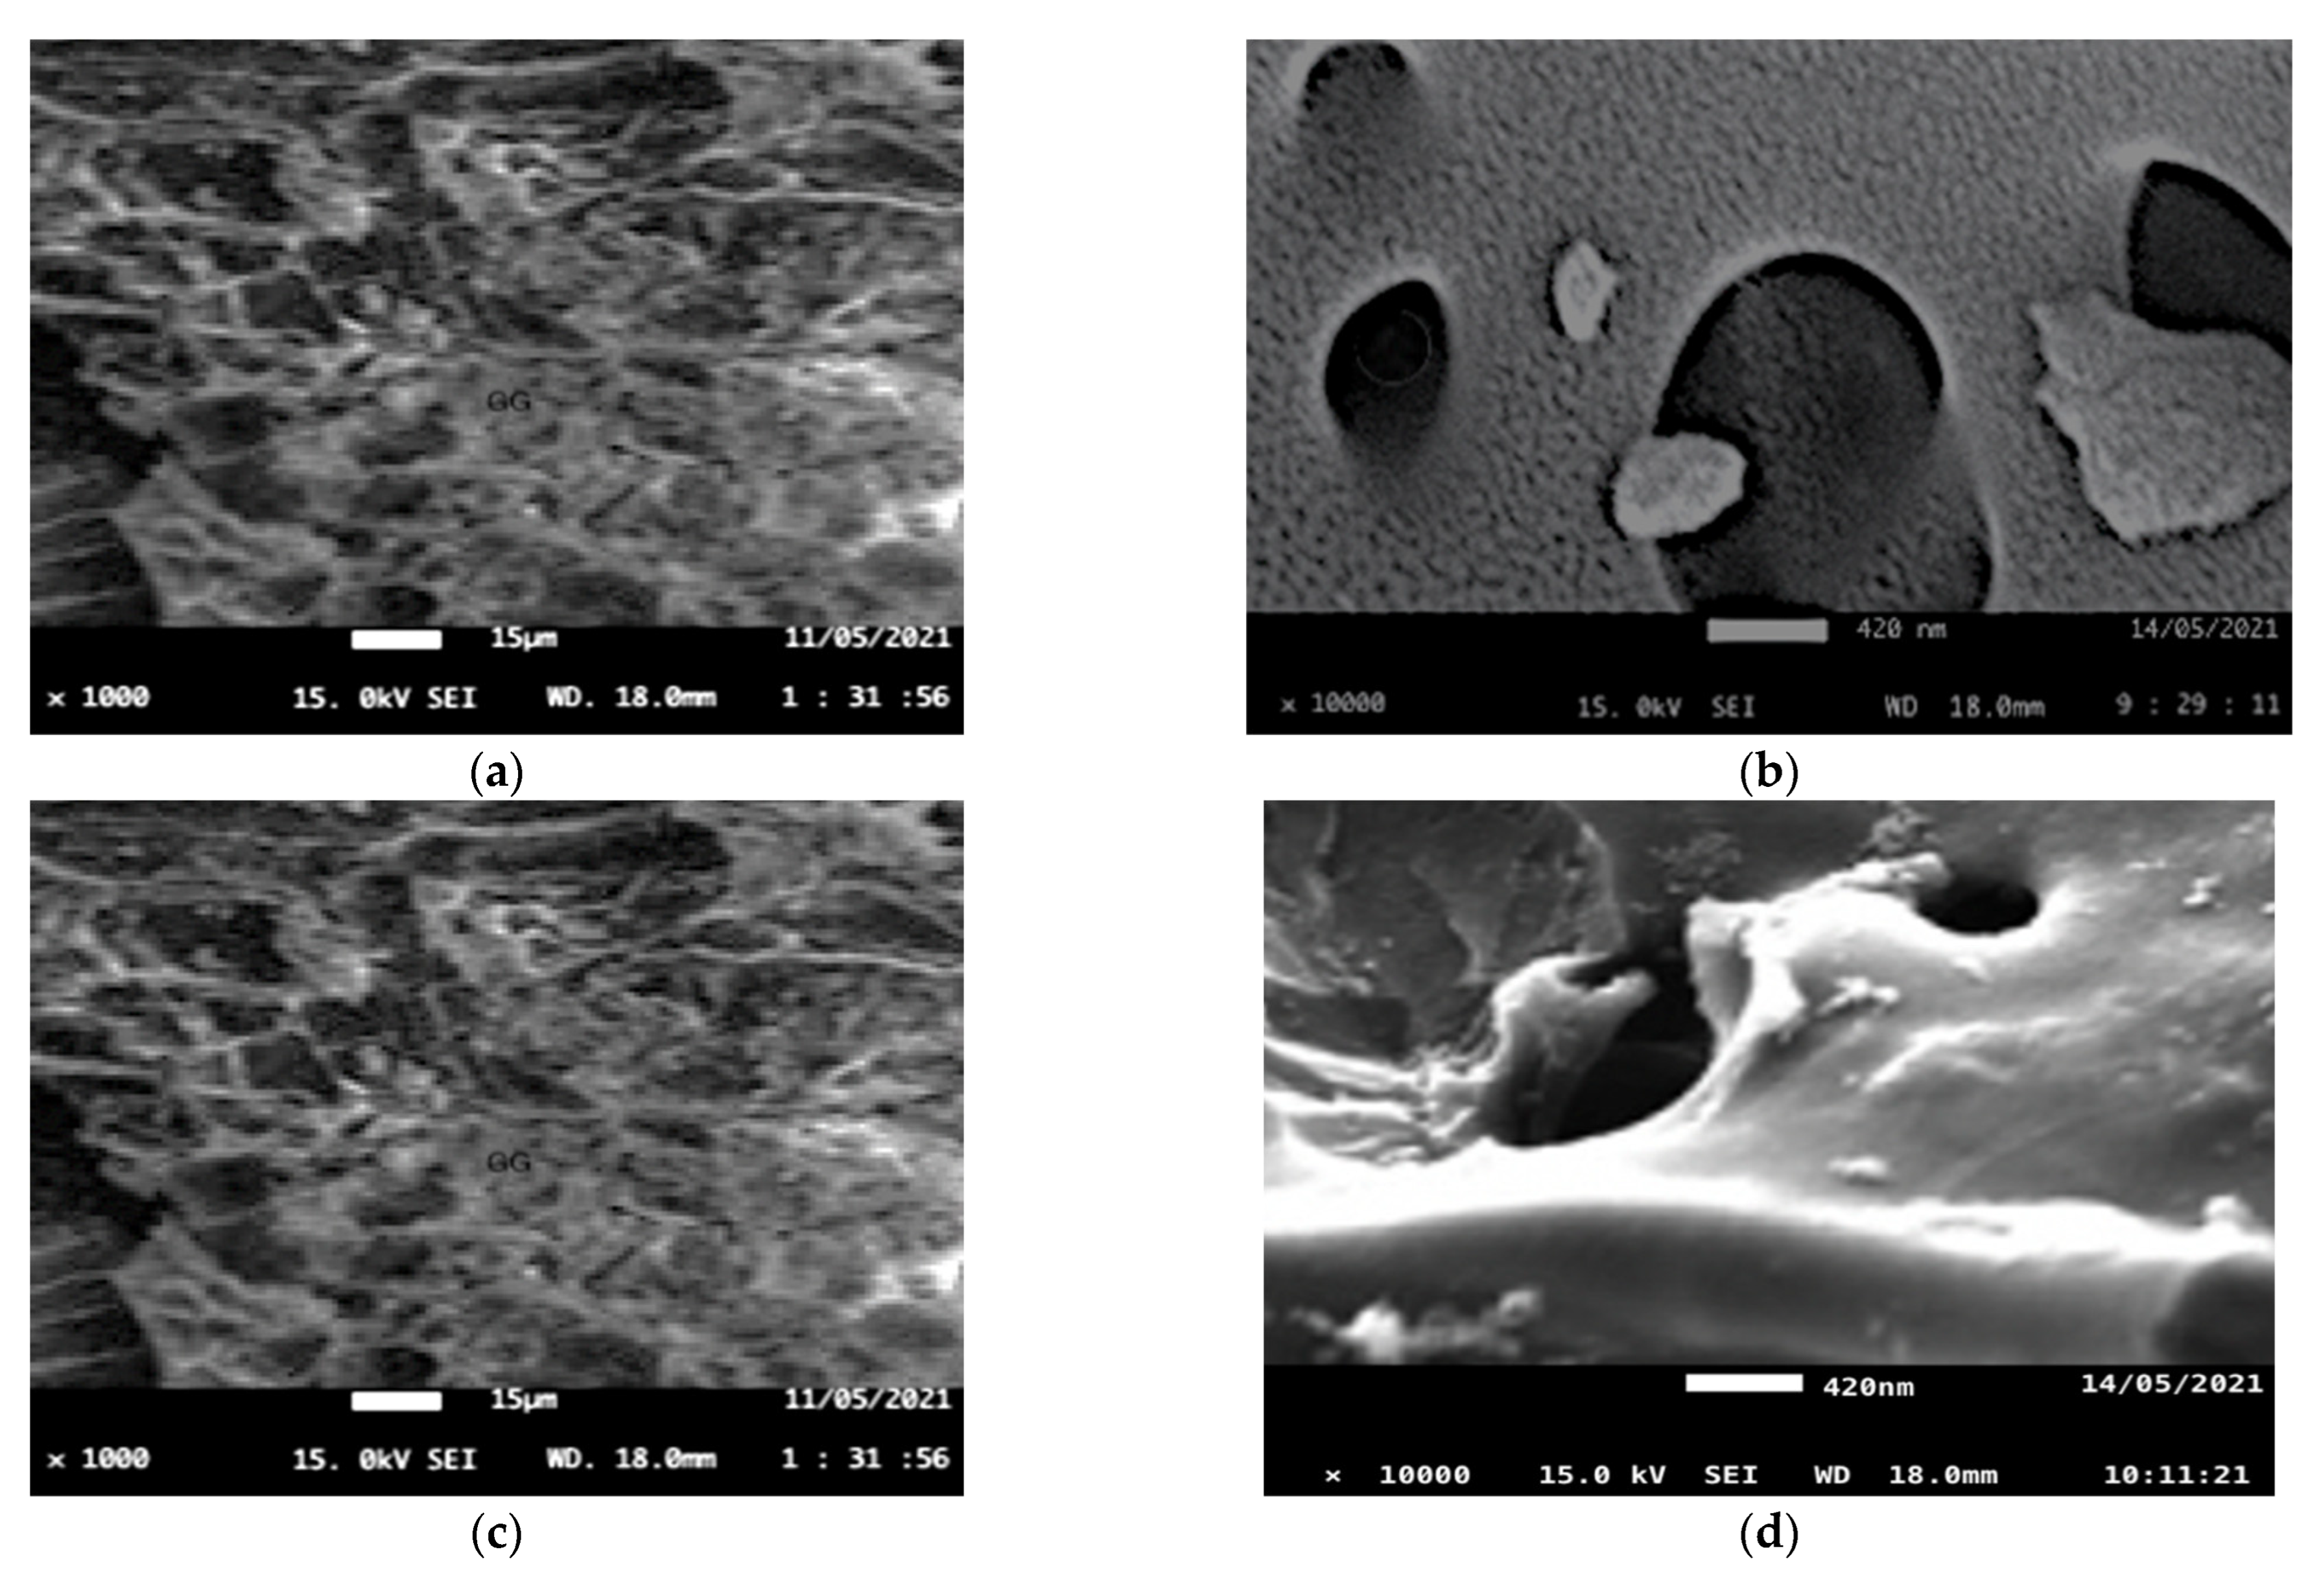
3.4. Morphology of Spent CPAC and Suggested Adsorption Mechanisms for APIs
4. Conclusions
- Mesoporous cassava peel activated carbon was successfully tested and proven to be a potential adsorbent for pharmaceutical ingredients in water.
- It is more effective to apply cassava peel activated carbon in the sequestration of active pharmaceutical ingredients after the removal of organic matter. This reduces the organic matter competition for adsorption sites with the intended APIs.
- Cassava peel activated carbon sequestrates more positively charged APIs than negatively charged molecules owing to the dominance of anions in its active adsorption sites.
- The solution pH affects the adsorption of the APIs using CPAC through the alteration of the CPAC’s surface chemistry and the APIs’ hydrophilicity. It is most appropriate, therefore, to run the adsorption processes at the point of zero charge of the CPAC.
- A dosage of 2 g/L of CPAC removes the highest percentages of CBZ, CLN, and TRM at an initial concentration of 20 mgL−1, pH range of 7–8, and contact time of 400 min.
Supplementary Materials
Author Contributions
Funding
Data Availability Statement
Acknowledgments
Conflicts of Interest
References
- Alongamo, B.A.A.; Ajifack, L.D.; Ghogomu, J.N.; Nsami, N.J.; Ketcha, J.M. Activated Carbon from the Peelings of Cassava Tubers (Manihot esculenta) for the Removal of Nickel(II) Ions from Aqueous Solution. J. Chem. 2021, 2021, 5545110. [Google Scholar] [CrossRef]
- Altmann, J.; Rehfeld, D.; Träder, K.; Sperlich, A.; Jekel, M. Combination of granular activated carbon adsorption and deep-bed filtration as a single advanced wastewater treatment step for organic micropollutant and phosphorus removal. Water Res. 2013, 92, 131–139. [Google Scholar] [CrossRef] [PubMed]
- Álvarez-Torrellas, S.; Rodríguez, A.; Ovejero, G.; García, J. Comparative adsorption performance of ibuprofen and tetracycline from aqueous solution by carbonaceous materials. Chem. Eng. J. 2016, 283, 936–947. [Google Scholar] [CrossRef]
- Alves, T.C.; Cabrera-Codony, A.; Barceló, D.; Rodriguez-Mozaz, S.; Pinheiro, A.; Gonzalez-Olmos, R. Influencing factors on the removal of pharmaceuticals from water with micro-grain activated carbon. Water Res. 2018, 144, 402–412. [Google Scholar] [CrossRef]
- Anjum, M.; Miandad, R.; Waqas, M.; Gehany, F.; Barakat, M.A. Remediation of wastewater using various nano-materials. Arab. J. Chem. 2016, 12, 4897–4919. [Google Scholar] [CrossRef] [Green Version]
- Anumol, T.; Sgroi, M.; Park, M.; Roccaro, P.; Snyder, S.A. Predicting trace organic compound breakthrough in granular activated carbon using fluorescence and UV absorbance as surrogates. Water Res. 2015, 76, 76–87. [Google Scholar] [CrossRef] [PubMed]
- APHA; AWWA; WEF. Standard Methods for the Examination of Water and Wastewater, 21st ed.; APHA: Washington, DC, USA; AWWA: Denver, CO, USA; WEF: Cologny, Switzerland, 2005; pp. 258–259. [Google Scholar]
- Batt, A.L.; Kostich, M.S.; Lazorchak, J.M. Analysis of ecologically relevant pharmaceuticals in wastewater and surface water using selective solid-phase extraction and UPLC-MS/MS. Anal. Chem. 2008, 80, 5021–5030. [Google Scholar] [CrossRef]
- Benstoem, F.; Nahrstedt, A.; Boehler, M.; Knopp, G.; Montag, D.; Siegrist, H.; Pinnekamp, J. Performance of granular activated carbon to remove micropollutants from municipal wastewater—A meta-analysis of pilot- and large-scale studies. Chemosphere 2017, 185, 105–118. [Google Scholar] [CrossRef]
- Benstoem, F.; Pinnekamp, J. Characteristic numbers of granular activated carbon for the elimination of micropollutants from effluents of municipal wastewater treatment plants. Water Sci. Technol. 2017, 76, 279–285. [Google Scholar] [CrossRef]
- Berges, J.; Moles, S.; Ormad, M.P.; Mosteo, R.; Gómez, J. Antibiotics removal from aquatic environments: Adsorption of enrofloxacin, trimethoprim, sulfadiazine, and amoxicillin on vegetal powdered activated carbon. Environ. Sci. Pollut. Res. 2021, 28, 8442–8452. [Google Scholar] [CrossRef]
- Chen, D.; Xie, S.; Chen, C.; Quan, H.; Hua, L.; Luo, X.; Guoa, L. Activated biochar derived from pomelo peel as a high-capacity sorbent for removal of carbamazepine from aqueous solution. RSC Adv. 2017, 7, 54969–54979. [Google Scholar] [CrossRef] [Green Version]
- Clarithromycin. Tuberculosis 2008, 88, 92–95. [CrossRef]
- De Ridder, D.J.; Mcconville, M.; Verliefde, A.R.D.; van der Aa, L.T.J.; Heijman, S.G.J.; Verberk, J.Q.J.C.; Rietveld, L.C.; van Dijk, J.C. Development of a predictive model to determine micropollutant removal using granular activated carbon. Drink. Water Eng. Sci. 2009, 2, 57–62. [Google Scholar] [CrossRef] [Green Version]
- De Wilt, A.; van Gijn, K.; Verhoek, T.; Vergnes, A.; Hoek, M.; Rijnaarts, H.; Langenhoff, A. Enhanced pharmaceutical removal from water in a three step bio-ozone-bio process. Water Res. 2018, 138, 97–105. [Google Scholar] [CrossRef]
- Delgado, L.F.; Charles, P.; Glucina, K.; Morlay, C. The removal of endocrine disrupting compounds, pharmaceutically activated compounds and cyanobacterial toxins during drinking water preparation using activated carbon—A review. Sci. Total Environ. 2012, 435–436, 509–525. [Google Scholar] [CrossRef]
- Delgado, N.; Capparelli, A.; Navarro, A.; Marino, D. Pharmaceutical emerging pollutants removal from water using powdered activated carbon: Study of kinetics and adsorption equilibrium. J. Environ. Manag. 2019, 236, 301–308. [Google Scholar] [CrossRef]
- El-Hendawy, A.N.A.; Alexander, A.J.; Andrews, R.J.; Forrest, G. Effects of activation schemes on porous, surface and thermal properties of activated carbons prepared from cotton stalks. J. Anal. Appl. Pyrolysis 2008, 82, 272–278. [Google Scholar] [CrossRef] [Green Version]
- Falås, P.; Wick, A.; Castronovo, S.; Habermacher, J.; Ternes, T.A.; Joss, A. Tracing the limits of organic micropollutant removal in biological wastewater treatment. Water Res. 2016, 95, 240–249. [Google Scholar] [CrossRef] [Green Version]
- Freihardt, J.; Jekel, M.; Ruhl, A.S. Comparing test methods for granular activated carbon for organic micropollutant elimination. J. Environ. Chem. Eng. 2017, 5, 2542–2551. [Google Scholar] [CrossRef]
- Gorzin, F.; Bahri Rasht Abadi, M.M. Adsorption of Cr(VI) from aqueous solution by adsorbent prepared from paper mill sludge: Kinetics and thermodynamics studies. Adsorpt. Sci. Technol. 2018, 36, 149–169. [Google Scholar] [CrossRef] [Green Version]
- Gratuito, M.K.B.; Panyathanmaporn, T.; Chumnanklang, R.A.; Sirinuntawittaya, N.; Dutta, A. Production of activated carbon from coconut shell: Optimization using response surface methodology. Bioresour. Technol. 2008, 99, 4887–4895. [Google Scholar] [CrossRef]
- Kårelid, V.; Larsson, G.; Björlenius, B. Pilot-scale removal of pharmaceuticals in municipal wastewater: Comparison of granular and powdered activated carbon treatment at three wastewater treatment plants. J. Environ. Manag. 2017, 193, 491–502. [Google Scholar] [CrossRef]
- Kayiwa, R.; Kasedde, H.; Lubwama, M.; Kirabira, J.B. Mesoporous activated carbon yielded from pre- leached cassava peels. Bioresour. Bioprocess. 2021, 8, 53. [Google Scholar] [CrossRef]
- Kayiwa, R.; Olupot, P.W.; Lubwama, M. Production and Potential of Activated Carbon from Cassava Peels for Remediation of Active Pharmaceutical Ingredients from Wastewater: A Review. J. Mater. Sci. Res. Rev. 2019, 4, 1–24. [Google Scholar]
- Kosasih, A.N.; Febrianto, J.; Sunarso, J.; Ju, Y.H.; Indraswati, N.; Ismadji, S. Sequestering of Cu(II) from aqueous solution using cassava peel (Manihot esculenta). J. Hazard. Mater. 2010, 180, 366–374. [Google Scholar] [CrossRef]
- Kumar, R.; Siril, P.F. Ultrafine carbamazepine nanoparticles with enhanced water solubility and rate of dissolution. RSC Adv. 2014, 4, 48101–48108. [Google Scholar] [CrossRef]
- Kurniawan, A.; Kosasih, A.N.; Febrianto, J.; Ju, Y.H.; Sunarso, J.; Indraswati, N.; Ismadji, S. Evaluation of cassava peel waste as lowcost biosorbent for Ni-sorption: Equilibrium, kinetics, thermodynamics and mechanism. Chem. Eng. J. 2011, 172, 158–166. [Google Scholar] [CrossRef]
- Lee, C.O.; Howe, K.J.; Thomson, B.M. Ozone and biofiltration as an alternative to reverse osmosis for removing PPCPs and micropollutants from treated wastewater. Water Res. 2012, 46, 1005–1014. [Google Scholar] [CrossRef]
- Li, Y.; Lian, J.; Wu, B.; Zou, H.; Tan, S.K. Phytoremediation of pharmaceutical-contaminated wastewater: Insights into rhizobacterial dynamics related to pollutant degradation mechanisms during plant life cycle. Chemosphere 2020, 253, 126681. [Google Scholar] [CrossRef]
- Liu, F.F.; Zhao, J.; Wang, S.; Du, P.; Xing, B. Effects of solution chemistry on adsorption of selected pharmaceuticals and personal care products (PPCPs) by graphenes and carbon nanotubes. Environ. Sci. Technol. 2014, 48, 13197–13206. [Google Scholar] [CrossRef]
- Liu, H.; Zhang, J.; Nani, B.; Cheng, C.; Zhang, C.; Liang, R.; Chenglu, Z. Textural properties and surface chemistry of lotus stalk-derived activated carbons prepared using different phosphorus oxyacids: Adsorption of trimethoprim. J. Hazard. Mater. 2012, 235–236, 367–375. [Google Scholar] [CrossRef]
- Mailler, R.; Gasperi, J.; Coquet, Y.; Buleté, A.; Vulliet, E.; Deshayes, S.; Zedek, S.; Mirande-Bret, C.; Eudes, V.; Bressy, A.; et al. Removal of a wide range of emerging pollutants from wastewater treatment plant discharges by micro-grain activated carbon in fluidized bed as tertiary treatment at large pilot scale. Sci. Total Environ. 2016, 542, 983–996. [Google Scholar] [CrossRef] [Green Version]
- Mailler, R.; Gasperi, J.; Coquet, Y.; Deshayes, S.; Zedek, S.; Cren-Olive, C.; Cartiser, N.; Eudes, V.; Bressy, A.; Caupos, E.; et al. Study of a large scale powdered activated carbon pilot: Removals of a wide range of emerging and priority micropollutants from wastewater treatment plant effluents. Water Res. 2015, 72, 315–330. [Google Scholar] [CrossRef] [Green Version]
- Margot, J.; Kienle, C.; Magnet, A.; Weil, M.; Rossi, L.; de Alencastro, L.F.; Abegglen, C.; Thonney, D.; Chèvre, N.; Schärer, M.; et al. Treatment of micropollutants in municipal wastewater: Ozone or powdered activated carbon? Sci. Total Environ. 2013, 461–462, 480–498. [Google Scholar] [CrossRef]
- Marques, S.C.R.; Mestre, A.S.; Machuqueiro, M.; Gotvajn, A. Ž.; Marinšek, M.; Carvalho, A.P. Apple tree branches derived activated carbons for the removal of β-blocker atenolol. Chem. Eng. J. 2018, 345, 669–678. [Google Scholar] [CrossRef]
- Menya, E.; Olupot, P.W.; Storz, H.; Lubwama, M.; Kiros, Y. Characterization and alkaline pretreatment of rice husk varieties in Uganda for potential utilization as precursors in the production of activated carbon and other value-added products. Waste Manag. 2018, 81, 104–116. [Google Scholar] [CrossRef]
- Moreno-Piraján, J.C.; Giraldo, L. Study of activated carbons by pyrolysis of cassava peel in the presence of chloride zinc. J. Anal. Appl. Pyrolysis 2010, 87, 288–290. [Google Scholar] [CrossRef]
- Nantaba, F.; Wasswa, J.; Kylin, H.; Palm, W.; Bouwman, H.; Kümmerer, K. Occurrence, distribution, and ecotoxicological risk assessment of selected pharmaceutical compounds in water from Lake Victoria, Uganda. Chemosphere 2020, 239, 124642. [Google Scholar] [CrossRef]
- National Center for Biotechnology Information. PubChem Compound Summary for CID 5578, Trimethoprim 2022. Available online: https://pubchem.ncbi.nlm.nih.gov/compound/Trimethoprim (accessed on 30 August 2021).
- National Center for Biotechnology Information. PubChem Compound Summary for CID 2554, Carbamazepine. PubChem Compound Summary for CID 2554, Carbamazepine 2022. Available online: https://pubchem.ncbi.nlm.nih.gov/compound/Carbamazepine (accessed on 30 August 2021).
- National Center for Biotechnology Information. PubChem Compound Summary for CID 84029, Clarithromycin 2022. Available online: https://pubchem.ncbi.nlm.nih.gov/compound/Clarithromycin (accessed on 30 August 2021).
- Nguyen Dang Giang, C.; Sebesvari, Z.; Renaud, F.; Rosendahl, I.; Hoang Minh, Q.; Amelung, W. Occurrence and dissipation of the antibiotics sulfamethoxazole, sulfadiazine, trimethoprim, and enrofloxacin in the Mekong Delta, Vietnam. PLoS ONE 2015, 10, e0131855. [Google Scholar] [CrossRef] [Green Version]
- Piai, L.; Dykstra, J.E.; Adishakti, M.G.; Blokland, M.; Langenhoff, A.A.M.; van der Wal, A. Diffusion of hydrophilic organic micropollutants in granular activated carbon with different pore sizes. Water Res. 2019, 162, 518–527. [Google Scholar] [CrossRef] [PubMed]
- Reza, R.A.; Ahmaruzzaman, M.; Sil, A.K.; Gupta, V.K. Comparative adsorption behavior of ibuprofen and clofibric acid onto microwave assisted activated bamboo waste. Ind. Eng. Chem. Res. 2014, 53, 9331–9339. [Google Scholar] [CrossRef]
- Sbardella, L.; Comas, J.; Fenu, A.; Rodriguez-Roda, I.; Weemaes, M. Advanced biological activated carbon filter for removing pharmaceutically active compounds from treated wastewater. Sci. Total Environ. 2018, 636, 519–529. [Google Scholar] [CrossRef] [PubMed]
- Sekulic, M.T.; Boskovic, N.; Slavkovic, A.; Garunovic, J.; Kolakovic, S.; Pap, S. Surface functionalised adsorbent for emerging pharmaceutical removal: Adsorption performance and mechanisms. Process Saf. Environ. Protect. 2019, 125, 50–63. [Google Scholar] [CrossRef]
- Singh, A.K. Nanoparticle Ecotoxicology. Engineered Nanoparticles; Elsevier Inc.: Amsterdam, The Netherlands, 2016; pp. 343–450. [Google Scholar] [CrossRef]
- Sulaiman, N.S.; Hashim, R.; Amini, M.H.M.; Danish, M.; Sulaiman, O. Optimization of activated carbon preparation from cassava stem using response surface methodology on surface area and yield. J. Clean. Prod. 2018, 198, 1422–1430. [Google Scholar] [CrossRef]
- Tran, H.N.; Wen, Y.C.; Wang, Y.F.; You, S.J. Highly efficient removal of hazardous aromatic pollutants by micro-nano spherical carbons synthesized from different chemical activation methods: A comparison study. Environ. Technol. 2018, 40, 1376–1391. [Google Scholar] [CrossRef]
- Velusamy, K.; Periyasamy, S.; Kumar, P.S.; Jayaraj, T.; Krishnasamy, R.; Sindhu, J.; Sneka, D.; Subhashini, B.; Vo, D.V.N. Analysis on the removal of emerging ontaminant from aqueous solution using biochar derived from soap nut seeds. Environ. Pollut. 2021, 287, 117632. [Google Scholar] [CrossRef]
- Wang, J.; Kaskel, S. KOH activation of carbon-based materials for energy storage. J. Mater. Chem. 2012, 22, 23710–23725. [Google Scholar] [CrossRef]
- Wang, S.; Li, X.; Zhao, H.; Quan, X.; Chen, S.; Yu, H. Enhanced adsorption of ionizable antibiotics on activated carbon fiber under electrochemical assistance in continuous-flow modes. Water Res. 2018, 134, 162–169. [Google Scholar] [CrossRef]
- Xu, L.; Campos, L.C.; Li, J.; Karu, K.; Ciric, L. Removal of antibiotics in sand, GAC, GAC sandwich and anthracite/sand biofiltration systems. Chemosphere 2021, 275, 130004. [Google Scholar] [CrossRef]
- Yang, F.; Sun, L.; Xie, W.; Jiang, Q.; Gao, Y.; Zhang, W.; Zhang, Y. Nitrogen-functionalization biochars derived from wheat straws via molten salt synthesis: An efficient adsorbent for atrazine removal. Sci. Total Environ. 2017, 607–608, 1391–1399. [Google Scholar] [CrossRef]
- Zietzschmann, F.; Altmann, J.; Ruhl, A.S.; Dünnbier, U.; Dommisch, I.; Sperlich, A.; Meinel, F.; Jekel, M. Estimating organic micro-pollutant removal potential of activated carbons using UV absorption and carbon characteristics. Water Res. 2014, 56, 48–55. [Google Scholar] [CrossRef]
- Zietzschmann, F.; Stützer, C.; Jekel, M. Granular activated carbon adsorption of organic micro-pollutants in drinking water and treated wastewater—Aligning breakthrough curves and capacities. Water Res. 2016, 92, 180–187. [Google Scholar] [CrossRef]


| Variable | Factor | Variable Level | ||
|---|---|---|---|---|
| −1 | 0 | +1 | ||
| Time (min) | Xi | 20 | 90 | 180 |
| Temperature (°C) | Xj | 400 | 625 | 900 |
| Properties | CBZ | CLN | TRM |
|---|---|---|---|
| Molecular structure | 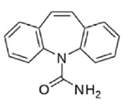 |  | 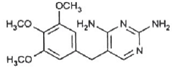 |
| Molecular formula | C15H12N2O | C38H69NO13 b | C14H18N4O3 |
| Molecular weight (g/mol) | 236.09 d | 747.953 b | 290.32 e |
| CAS ID | 298-46-4 d | 81103-11-9 b | 738-70-5 e |
| Water solubility at 20 °C (mgL−1) | Practically insoluble | 0.33 b | 1000 a |
| pka | <2.3; >13.9 d | 8.99 b | 6.60 e |
| log Kow | 2.45 | 3.2 | 0.59 a, 0.91 e |
| Formal/molecular charge | 0 d | 0 c | 0 e |
| Hydrogen bond donor count | 1 d | 4 c | 2 e |
| Hydrogen bond acceptor count | 1 d | 14 c | 7 e |
| Solution | DOC (mg/L) | NH4+ (mg/L) | NO3− (mg/L) | COD | BOD5 | CLN (mgL−1) | CBZ (mgL−1) | TRM (mgL−1) |
|---|---|---|---|---|---|---|---|---|
| A | 184.65 | 25.52 | 28.40 | 210.00 | 142.00 | 20.00 | 20.00 | 20.00 |
| B | 0.00 | 0.00 | 0.00 | 0.00 | 0.00 | 20.00 | 20.00 | 20.00 |
| Specific Surface Area (m2/g) | Micropore Volume (cm3/g) | Mesopore Volume (cm3/g) | Total Pore Volume (cm3/g) |
|---|---|---|---|
| 1684 ± 2 | 0.281 ± 0.02 | 0.471 ± 0.04 | 0.756 ± 0.01 |
| Langmuir | Freundlich | |||||
|---|---|---|---|---|---|---|
| API | KL (L/mg) | qmax (mg/g) | R2 | KF (mgg−1 (mgL−1) 1/n) | 1/n | R2 |
| CBZ | 0.1453 | 25.9067 | 0.954 | 4.19670629 | 0.5772 | 0.9764 |
| CLN | −0.0075 | −188.6792 | 0.947 | 1.48661244 | 1.01 | 0.9361 |
| TRM | 0.0250 | 84.0336 | 0.9581 | 2.58959113 | 0.8059 | 0.9411 |
| API | Adsorbent | Adsorption Capacity (mgg−1) | Process Conditions | Reference |
|---|---|---|---|---|
| CBZ | CPAC | 25.907 | Adsorbent dose: 2.0 gL−1; pH: 7–8; time: 12 h; Co: 20 mgL−1 | This study |
| CBZ | Activated biochar derived from pomelo peel | 286.50 | Adsorbent dose: 200 mgL−1; pH: 6.7; time: 24 h; Co: 100 mgL−1 | [51] |
| CBZ | Phosphorous-doped microporous carbonous material | 17.69 | Adsorbent dose: 2.0 gL−1; pH: 6–7; time: 1 h; Co: 50 mgL−1 | [53] |
| CLN | CPAC | 1.49 | Adsorbent dose: 2.0 gL−1; pH: 7–8; time: 12 h; Co: 20 mgL−1 | This study |
| CLN | Granular activated carbon biofilter | 0.0072 | Adsorbent dose: 0.5 gL−1; pH: 3–7; time: 90 days; Co: 5 µgL−1 | [54] |
| CLN | Activated carbon fiber under electrochemical assistance | 70.90 | Adsorbent dose: 10 mgL−1; pH: 8.99; time: 1 h; Co: 50 mgL−1 | [42] |
| TRM | CPAC | 84.034 | Adsorbent dose: 2.0 gL−1; pH: 7–8; time: 12 h; Co: 20 mgL−1 | This study |
| TRM | Lotus stalk-derived activated carbons prepared using phosphorus oxyacids | 175.125 | Adsorbent dose: 0.2 gL−1; pH: 5–7; time: 3 days; Co: 87.10 mgL−1 | [55] |
| TRM | Vegetal powdered activated carbon | 135.00 | Adsorbent dose: 100 mgL−1; pH:6.5; time: 60 min; Co: 15 mgL−1 | [48] |
Publisher’s Note: MDPI stays neutral with regard to jurisdictional claims in published maps and institutional affiliations. |
© 2022 by the authors. Licensee MDPI, Basel, Switzerland. This article is an open access article distributed under the terms and conditions of the Creative Commons Attribution (CC BY) license (https://creativecommons.org/licenses/by/4.0/).
Share and Cite
Kayiwa, R.; Kasedde, H.; Lubwama, M.; Kirabira, J.B. Active Pharmaceutical Ingredients Sequestrated from Water Using Novel Mesoporous Activated Carbon Optimally Prepared from Cassava Peels. Water 2022, 14, 3371. https://doi.org/10.3390/w14213371
Kayiwa R, Kasedde H, Lubwama M, Kirabira JB. Active Pharmaceutical Ingredients Sequestrated from Water Using Novel Mesoporous Activated Carbon Optimally Prepared from Cassava Peels. Water. 2022; 14(21):3371. https://doi.org/10.3390/w14213371
Chicago/Turabian StyleKayiwa, Ronald, Hillary Kasedde, Michael Lubwama, and John Baptist Kirabira. 2022. "Active Pharmaceutical Ingredients Sequestrated from Water Using Novel Mesoporous Activated Carbon Optimally Prepared from Cassava Peels" Water 14, no. 21: 3371. https://doi.org/10.3390/w14213371
APA StyleKayiwa, R., Kasedde, H., Lubwama, M., & Kirabira, J. B. (2022). Active Pharmaceutical Ingredients Sequestrated from Water Using Novel Mesoporous Activated Carbon Optimally Prepared from Cassava Peels. Water, 14(21), 3371. https://doi.org/10.3390/w14213371