Author Contributions
For the current work, author contributions were as follows: conceptualization, J.A.H., B.F.A. and L.J.; methodology, J.A.H., B.F.A. and L.J.; software, J.A.H.; validation, J.A.H., B.F.A. and L.J.; formal analysis, B.F.A. and L.J.; investigation, B.F.A. and L.J.; resources, J.A.H.; data curation, J.A.H., B.F.A. and L.J.; writing—original draft preparation, J.A.H., B.F.A. and L.J.; writing—review and editing, J.A.H. and B.F.A.; visualization, J.A.H., B.F.A. and L.J.; supervision, J.A.H.; project administration, J.A.H.; funding acquisition, J.A.H. All authors have read and agreed to the published version of the manuscript.
Figure 1.
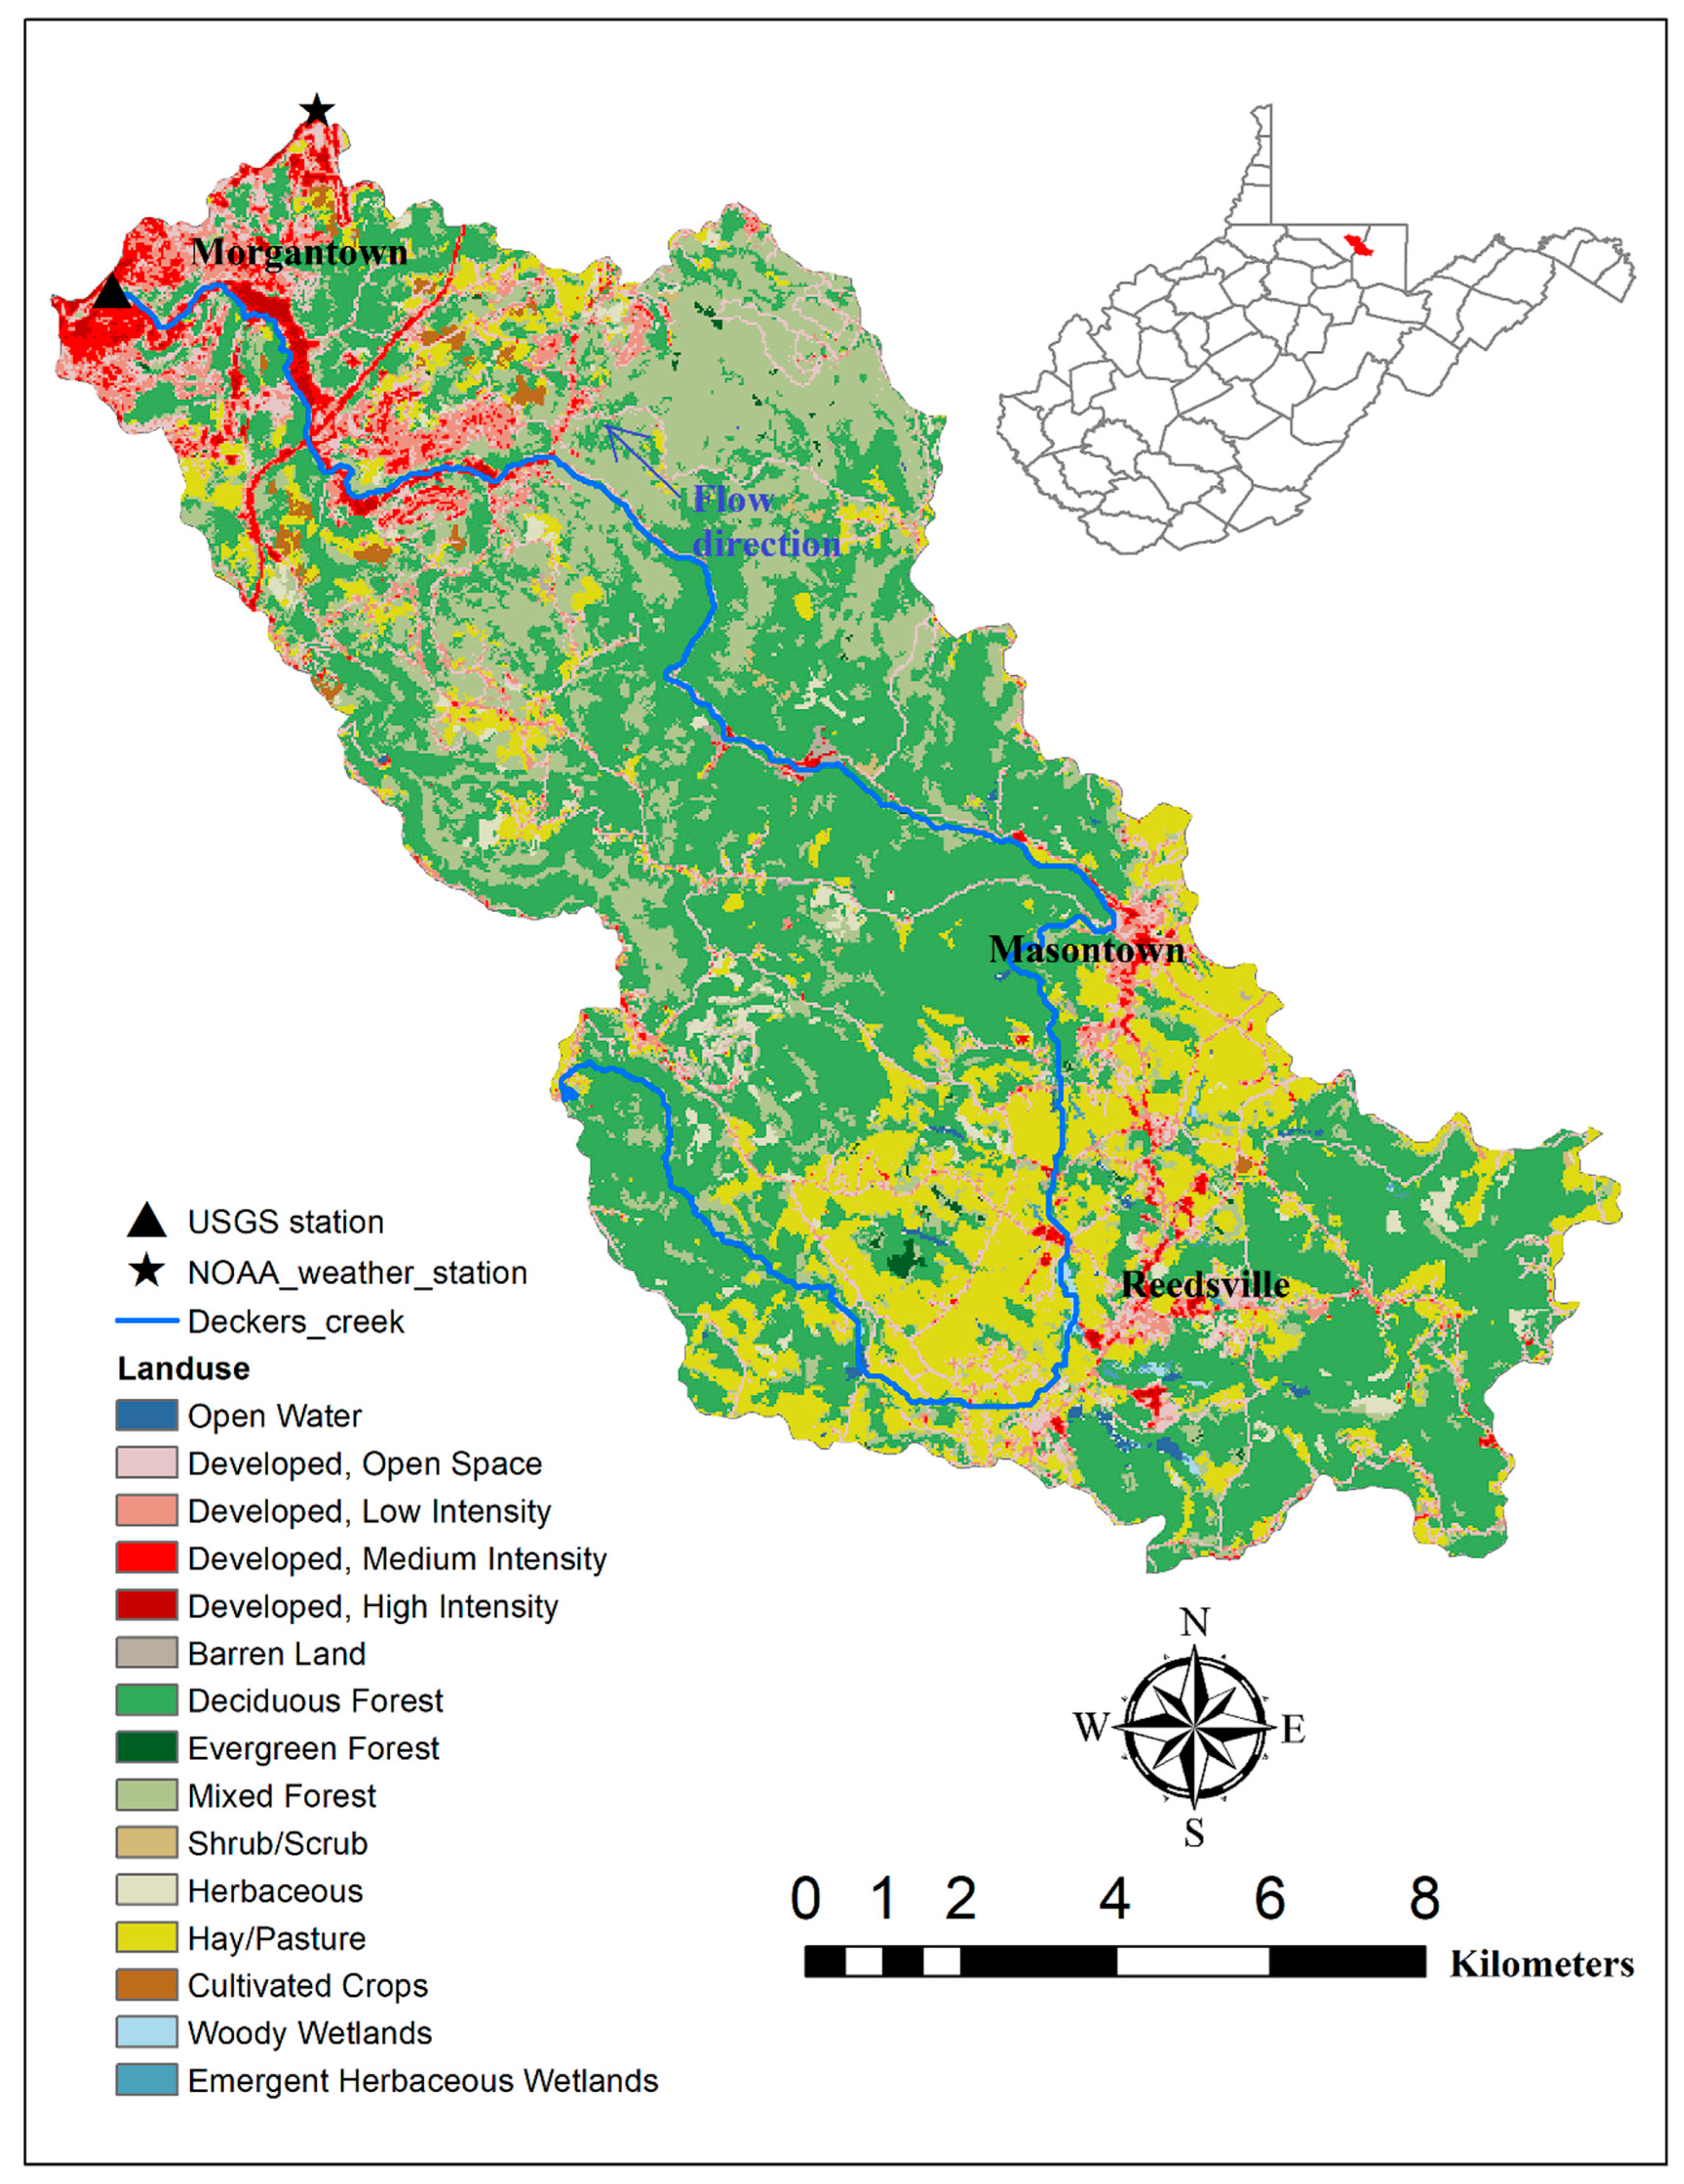
Deckers Creek Watershed (DCW) located in northern West Virginia with USGS station (USGS 03062500) and NOAA weather station (USW00013736).
Figure 1.
Deckers Creek Watershed (DCW) located in northern West Virginia with USGS station (USGS 03062500) and NOAA weather station (USW00013736).
Figure 2.
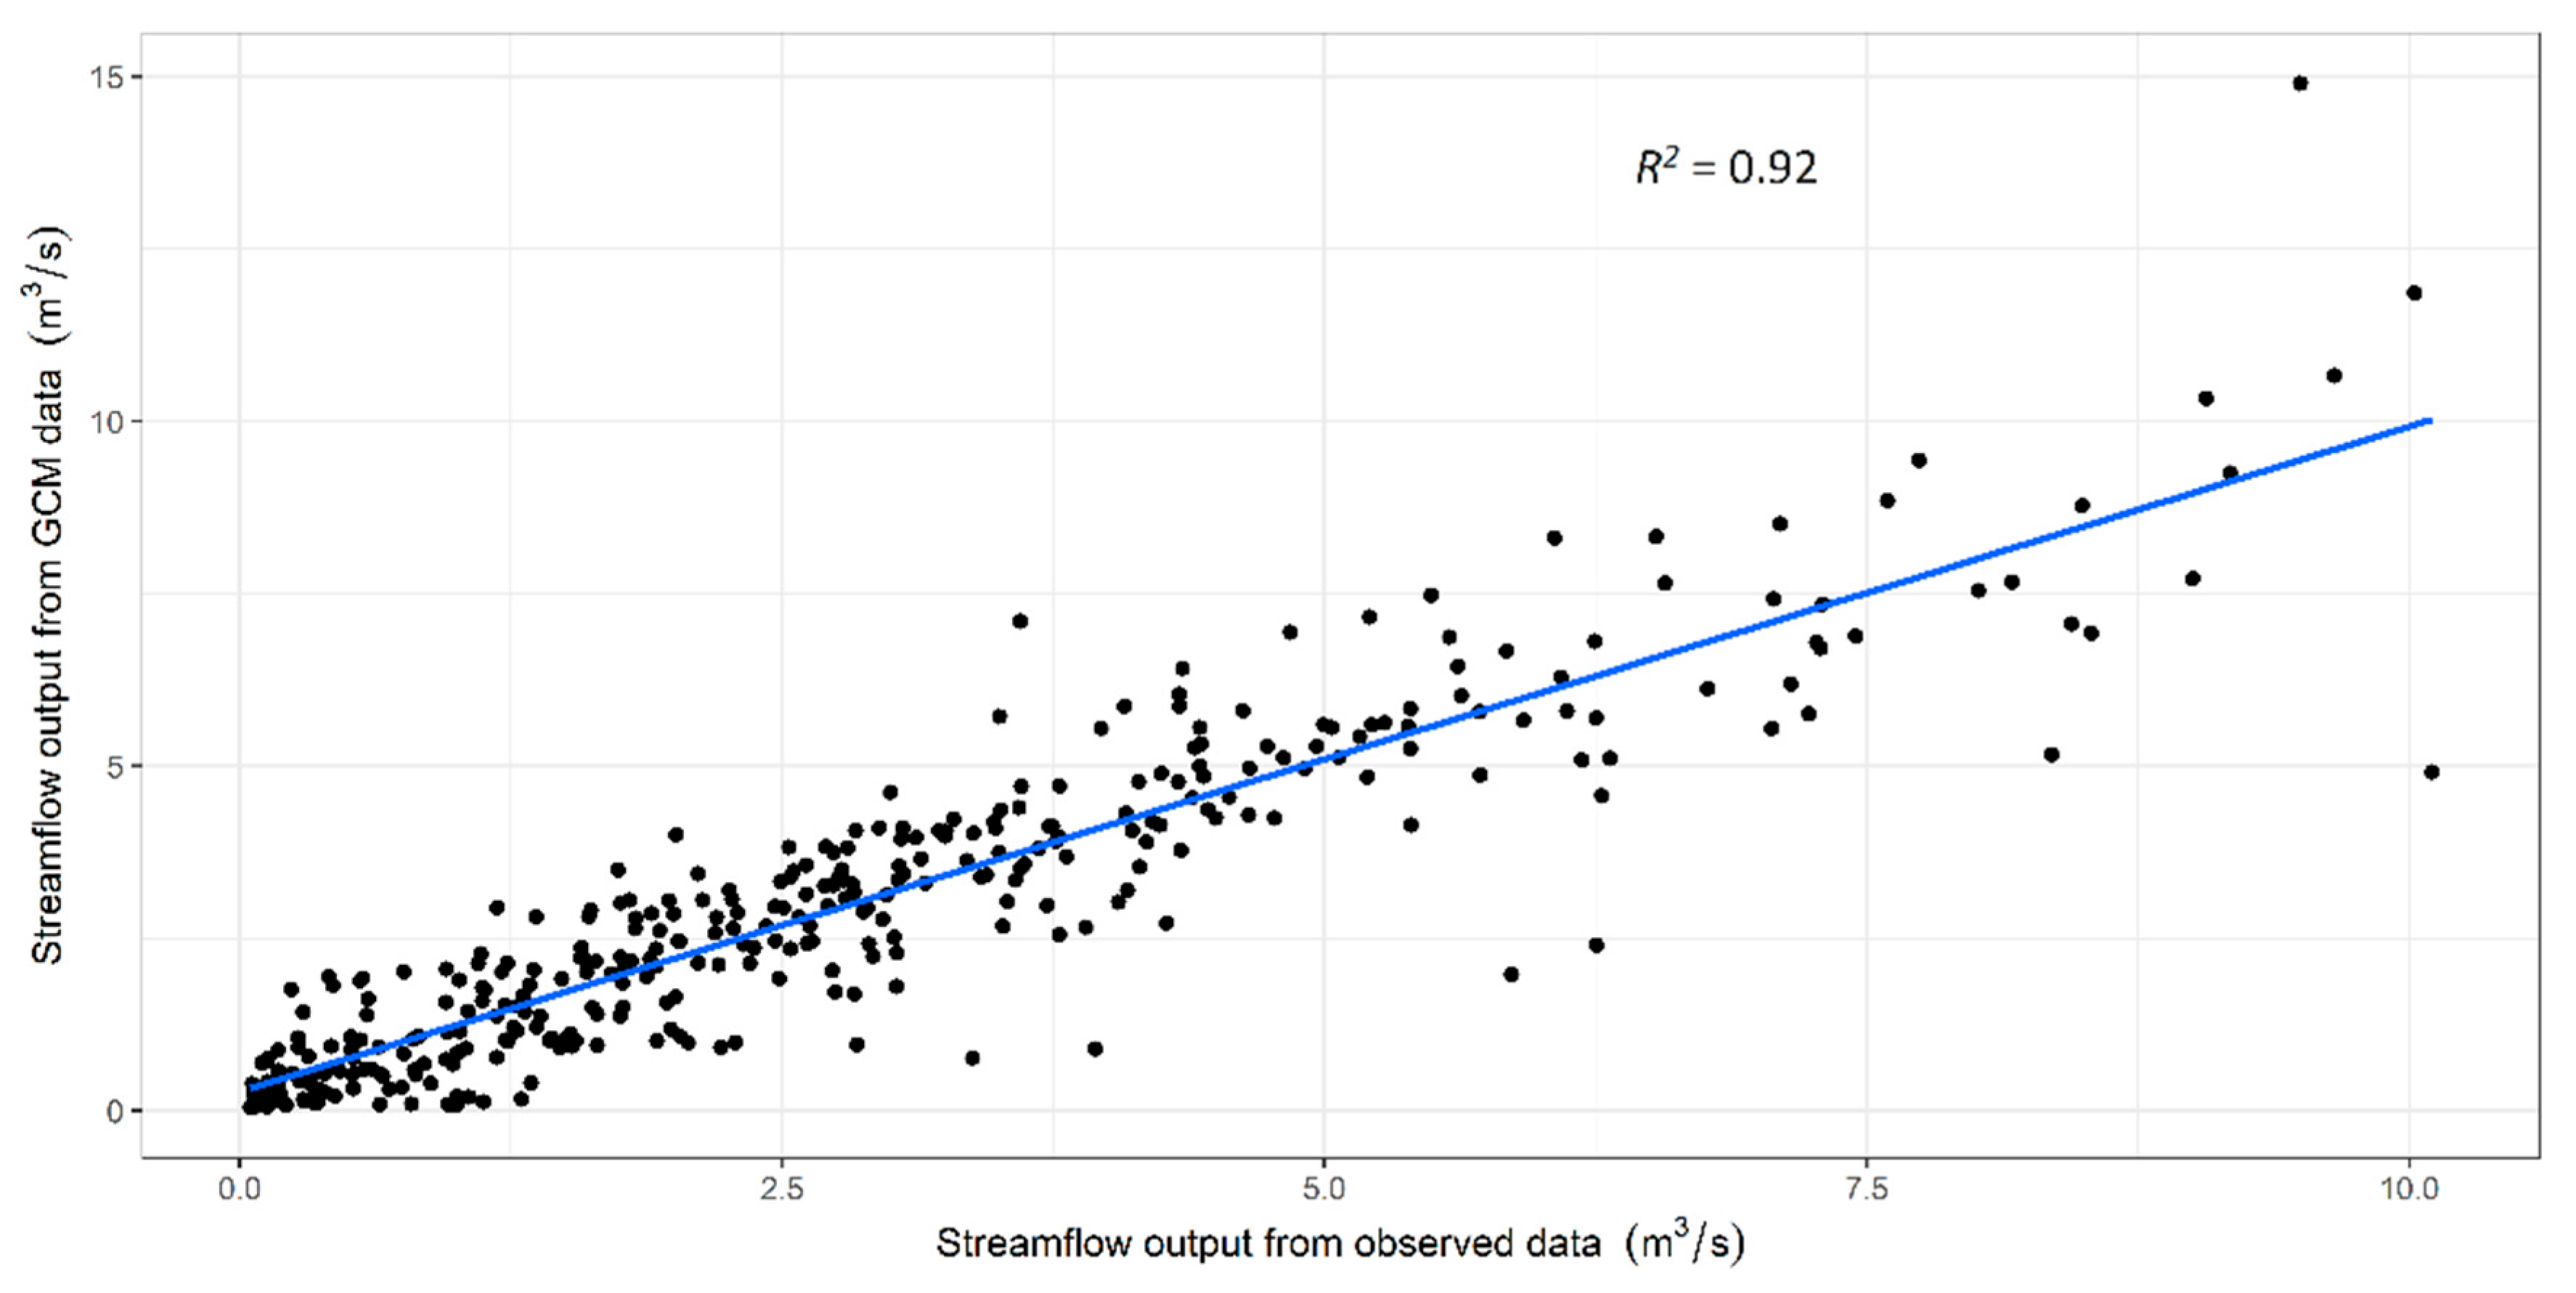
Simulated and observed streamflow during calibration and validation periods for Deckers Creek Watershed, Morgantown, West Virginia, USA.
Figure 2.
Simulated and observed streamflow during calibration and validation periods for Deckers Creek Watershed, Morgantown, West Virginia, USA.
Figure 3.
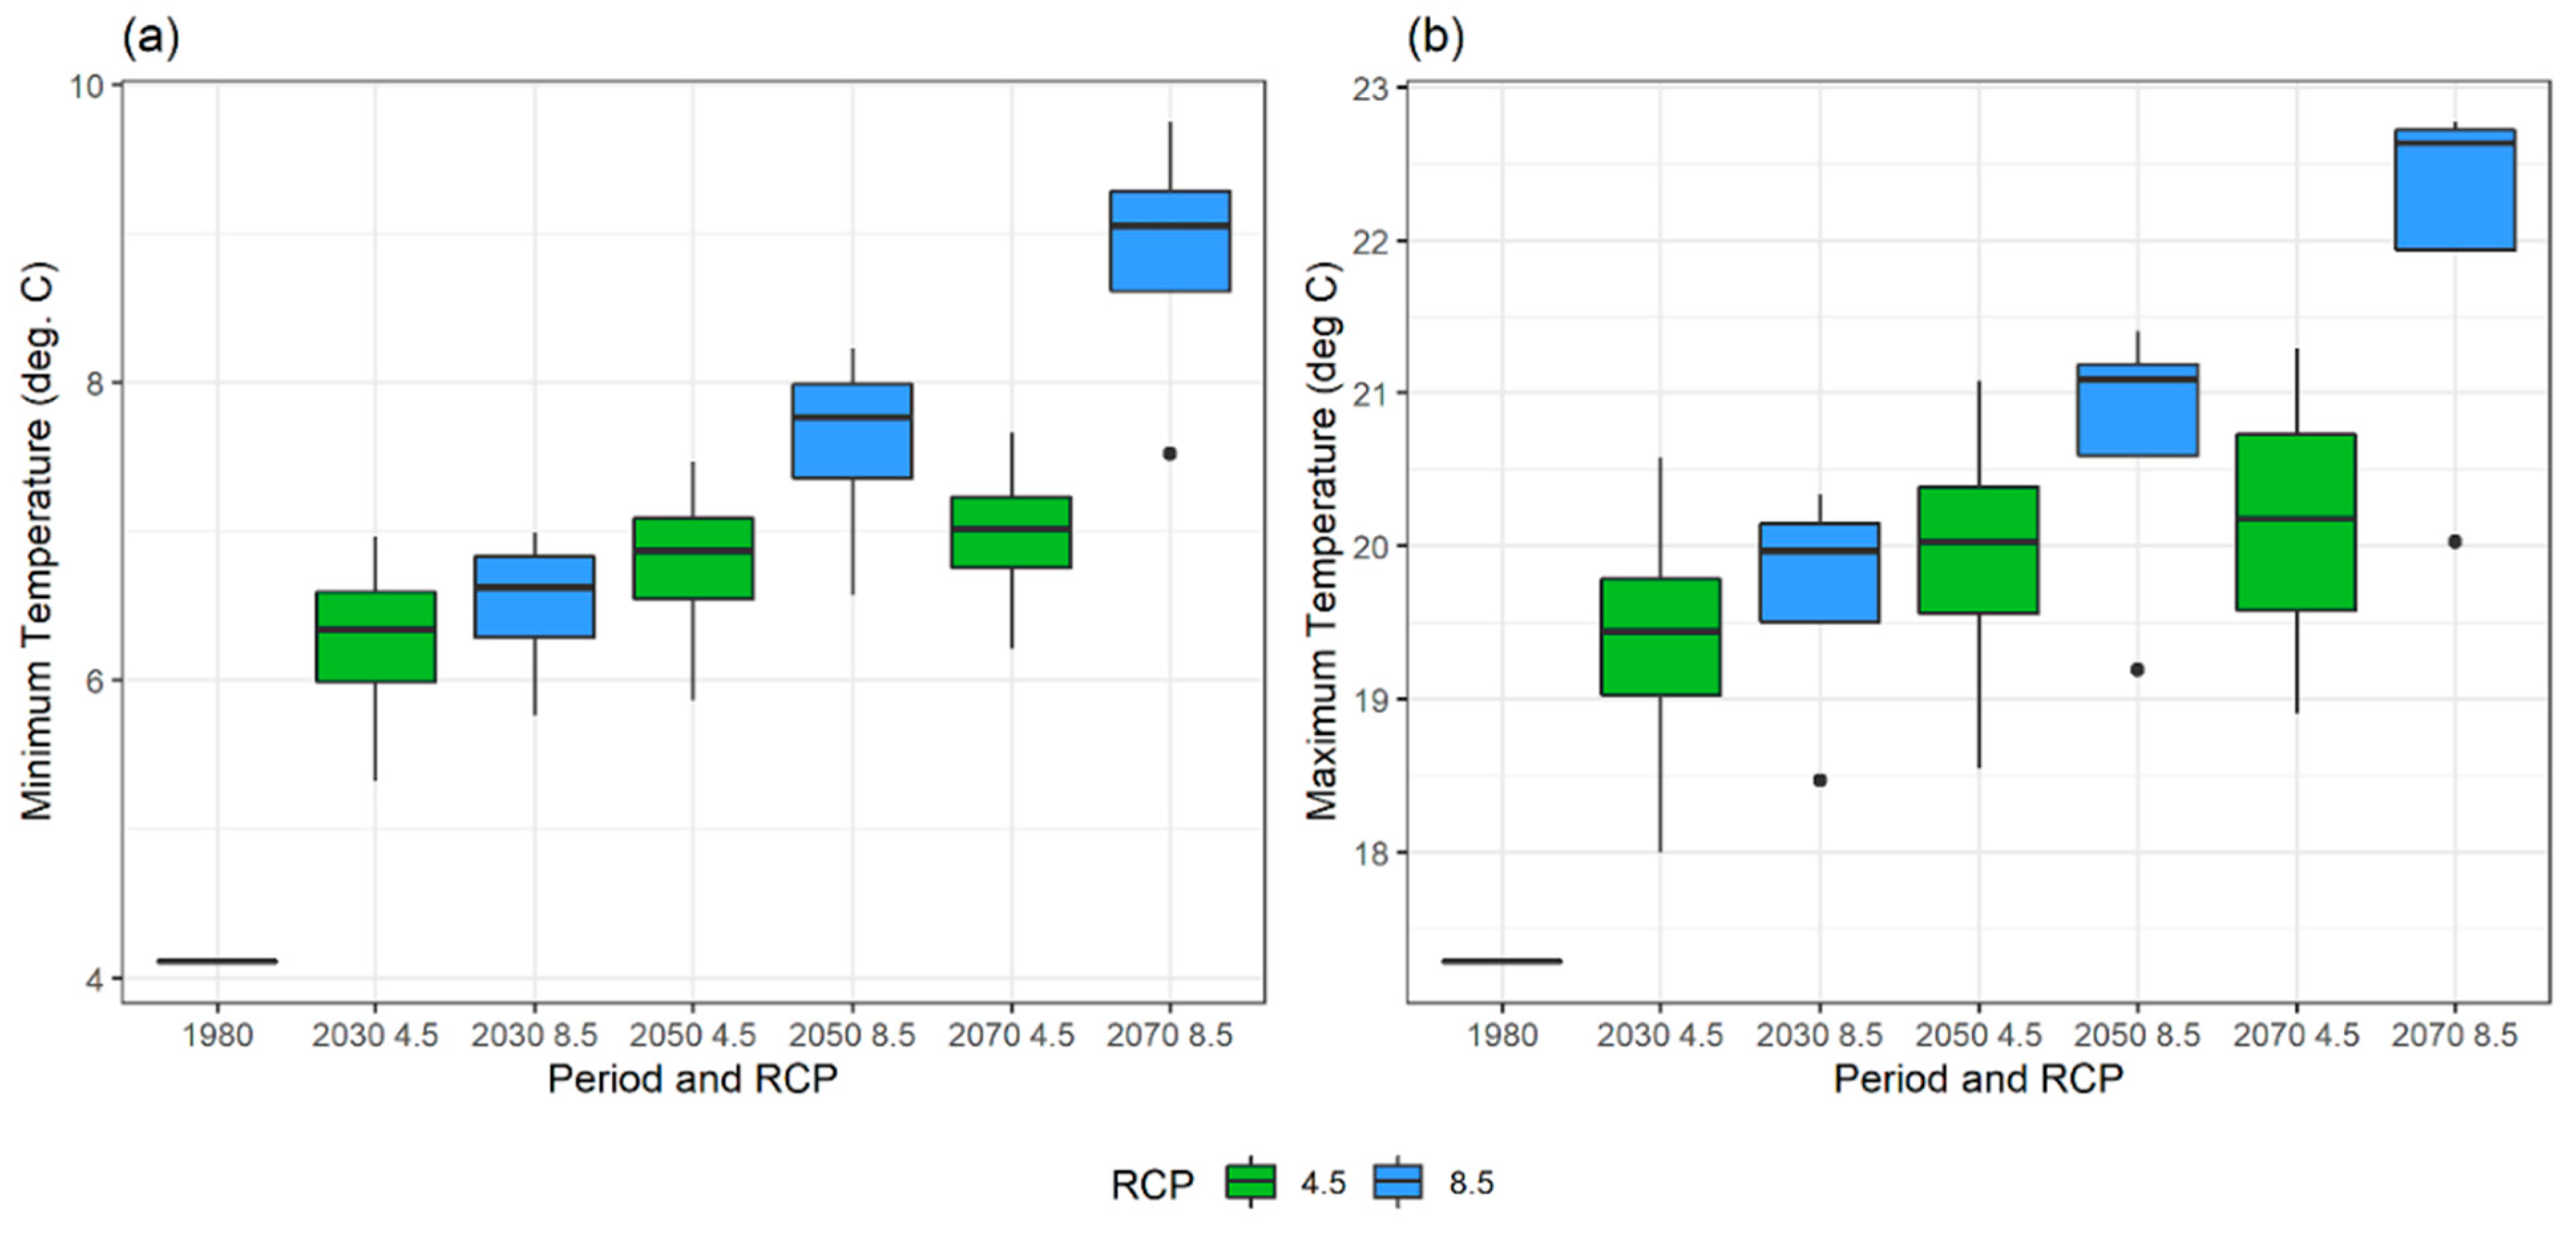
Projected annual temperature changes from ensemble mean for four GCM scenarios in (a) minimum temperature (°C), and (b) maximum temperature (°C) for 3 future periods of 20-year intervals (2030s: 2031–2050, 2050s: 2051–2070, 2070s: 2071–2090) and two RCPs (RCP 4.5 and RCP 8.5) in Deckers Creek Watershed, Morgantown, West Virginia, USA. The black line in 1980 represents the average temperature for the historical baseline of 1980–1999.
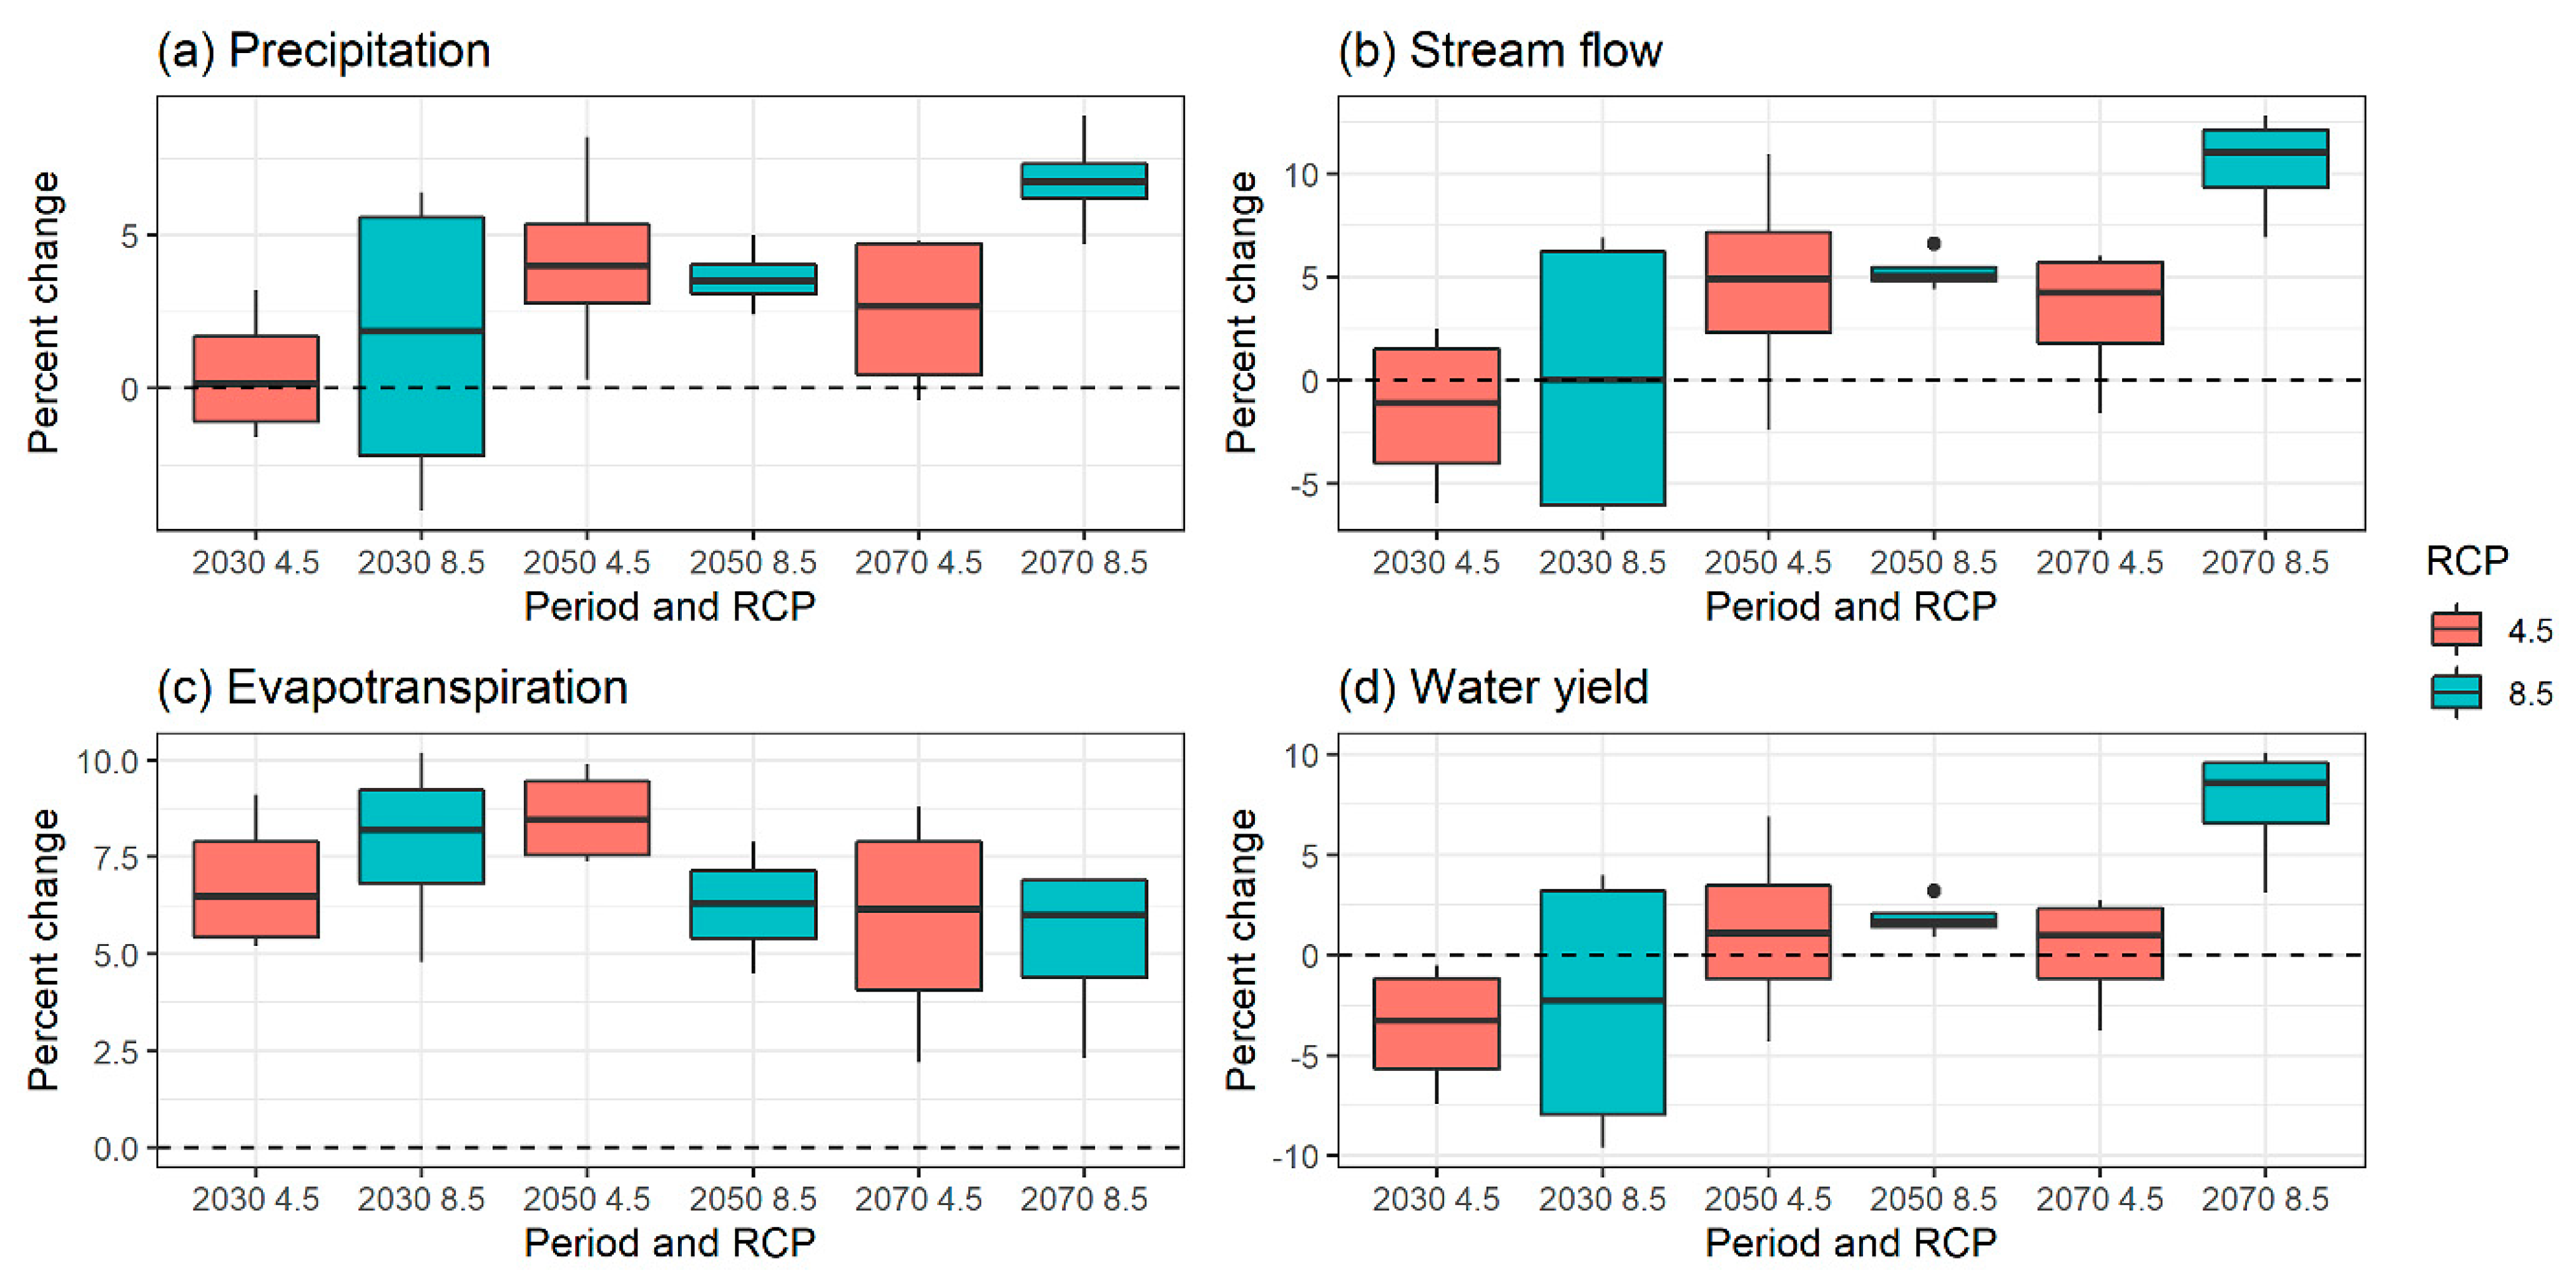
Figure 4.
Projected annual changes in water balance components (a) precipitation, (b) streamflow, (c) evapotranspiration, and (d) water yield in Deckers Creek Watershed, Morgantown, West Virginia, USA. Box and whisker plot represent ensemble percentage change for four GCMs under two RCPs (RCP 4.5 and RCP 8.5). Projections are for 3 future periods of 20-year interval (2030s = 2031−2050, 2050s = 2051−2070, 2070s = 2071−2090). The black dotted line represents the historical baseline of 1980–1999.
Figure 5.
Projected monthly changes in water balance components (a) precipitation, (b) streamflow in Deckers Creek Watershed, Morgantown, West Virginia, USA. Box and whisker plot represent ensemble percentage change for four GCMs under two RCPs (RCP 4.5 and RCP 8.5). Projections are for 3 future periods of 20-year interval (2030= 2031−2050, 2050 = 2051−2070, 2070 = 2071−2090). The dotted line represents the historical baseline of 1980−1999.
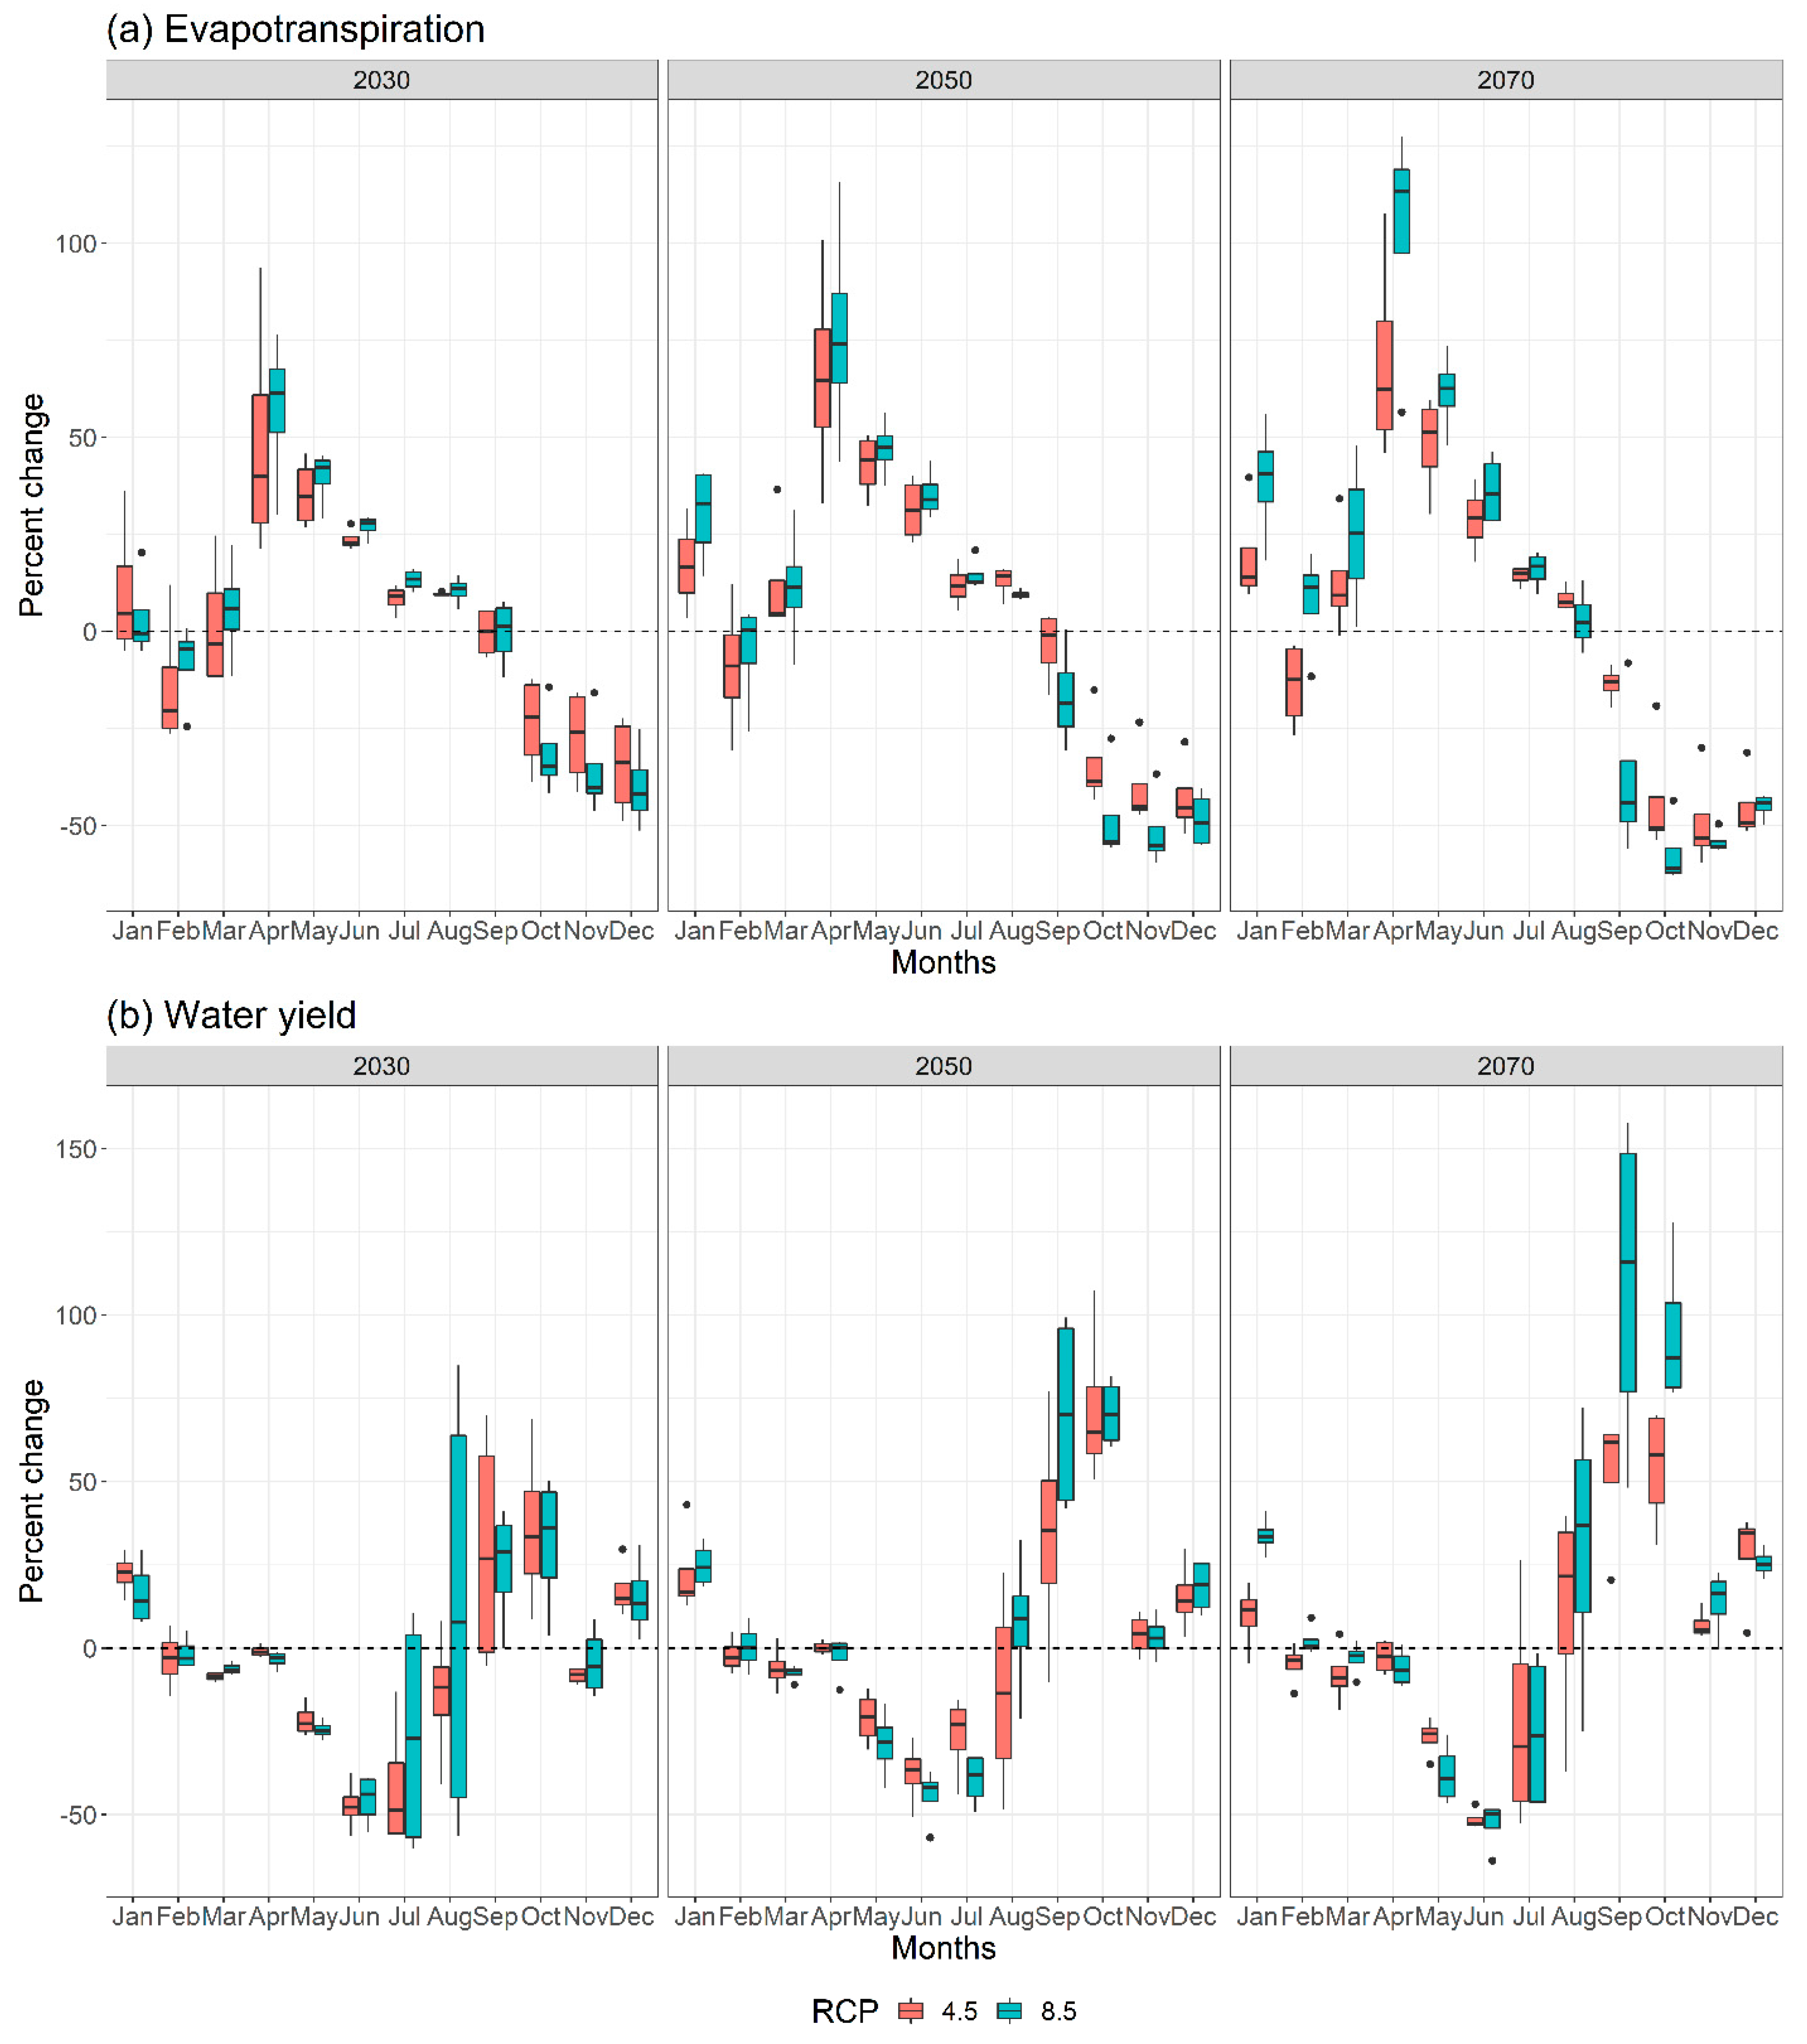
Figure 6.
Projected monthly changes in water balance components (a) evapotranspiration, (b) water yield in Deckers Creek Watershed, Morgantown, West Virginia, USA. Box and whisker plot represent ensemble percentage change for four GCMs under two RCPs (RCP 4.5 and RCP 8.5). Projections are for 3 future periods of 20-year interval (2030 = 2031−2050, 2050 = 2051−2070, 2070 = 2071−2090). The dotted line represents the historical baseline of 1980−1999.
Figure 7.
Projected monthly changes in groundwater and surface runoff in Deckers Creek Watershed, Morgantown, West Virginia, USA. Box and whisker plot represent ensemble percentage change for four GCMs under two RCPs (RCP 4.5 and RCP 8.5). Projections are for 3 future periods of 20-year interval (2030s = 2031−2050, 2050s = 2051−2070, 2070s = 2071−2090). The dotted line represents the historical baseline of 1980−1999.
Table 1.
Calibrated values of the parameters selected for SWAT calibration for Deckers Creek Watershed, Morgantown, West Virginia, USA. Note(s): “V”: The default parameter is replaced by a given value; “R”: The existing parameter value is changed relatively. “~” = approximately.
Table 1.
Calibrated values of the parameters selected for SWAT calibration for Deckers Creek Watershed, Morgantown, West Virginia, USA. Note(s): “V”: The default parameter is replaced by a given value; “R”: The existing parameter value is changed relatively. “~” = approximately.
| Parameter Identifier | Parameter | Detailed Parameter Description | Range | Fitted Value | Unit | Literature Source |
|---|
| V | SURLAG.bsn | Surface runoff lag coefficient | 7.13–13.35 | 9.84 | --- | [40,56] |
| R | CN2.mgt | SCS curve number for moisture condition II | −0.84~−0.67 | −0.83 | --- | [11,40,56,57,58,59] |
| V | GW_DELAY.gw | Groundwater delay | −126.16~−56.99 | −125.12 | days | [11,56,57,58,59] |
| V | ALPHA_BF.gw | Baseflow alpha factor | 1.19~1.29 | 1.24 | (1/days) | [56,57,58,59] |
| V | GWQMN.gw | Shallow aquifer water threshold depth required to occur for the return flow | 2.92~3.32 | 3.31 | mm | [56,58] |
| V | ESCO.hru | Compensation soil evaporation | 0.94~1.41 | 1.19 | --- | [11,40,56,59] |
| V | SOL_AWC.sol | The capacity of water available | −0.27~0.31 | −0.15 | mm H2O/mm soil | [11,40,56,57,58,59] |
| V | CH_K2.rte | Alluvium main channel hydraulic conductivity | 93.79~148.44 | 138.33 | mm/hr | [56,58] |
| V | TIMP.bsn | Temperature lag snow pack factor | 0.23~0.73 | 0.62 | --- | [56,57] |
| V | SMTMP.bsn | Temperature base of snow melt | 4.12~7.89 | 6.71 | °C | [56,57,58] |
| V | SLSUBBSN.hru | Average slope length | 39.55~83.75 | 67.17 | m | [56,58,59] |
| V | CANMX.hru | Maximum canopy storage | 30.70~50.37 | 48.70 | mm | [11,56] |
| V | SMFMX.bsn | Maximum melt rate for snow during the year | 6.52~0.39 | 8.34 | (mm H2O/°C-day | [56,57,58] |
| V | SFTMP.bsn | Temperature of snowfall | −1.14~2.03 | 1.35 | °C | [56,57,58] |
| V | SMFMN.bsn | Minimum melt rate for snow during the year | 4.90~8.95 | 8.77 | (mm H2O/°C-day | [56,57,58] |
Table 2.
Global Circulation Models (GCMs) chosen for future climate scenario analysis using the SWAT model for Deckers Creek Watershed, Morgantown, West Virginia, USA.
Table 2.
Global Circulation Models (GCMs) chosen for future climate scenario analysis using the SWAT model for Deckers Creek Watershed, Morgantown, West Virginia, USA.
| Modeling Institute | GCM | Period | RCP |
|---|
| | Historical | 1980 (1980–1999) | |
| Japan Agency for Marine-Earth Science and Technology, Atmosphere and Ocean Research Institute, and National Institute for Environmental Studies | miroc5.3 | 2030s (2031–2050) | 4.5 |
| Max Planck Institute for Meteorology | mpi-esm-Ir3 | 2050s (2051–2070) | 8.5 |
| Meteorological Research Institute | mri-cgcm3.1 | 2070s (2071–2090) | |
| Norwegian Climate Centre | Noresm1-m.1 | | |
Table 3.
Correlation coefficient (R2) of historical records from Morgantown Municipal Airport and historical simulations of GCMs from 1950–1980 at a monthly scale under RCP 4.5 for precipitation, minimum and maximum temperature.
Table 3.
Correlation coefficient (R2) of historical records from Morgantown Municipal Airport and historical simulations of GCMs from 1950–1980 at a monthly scale under RCP 4.5 for precipitation, minimum and maximum temperature.
| GCM | Precipitation | Maximum Temperature | Minimum Temperature |
|---|
| miroc5.3 | 0.8398 | 0.9994 | 0.9983 |
| mpi-esm-Ir3 | 0.8816 | 0.9998 | 0.9988 |
| mri-cgcm3.1 | 0.8304 | 0.9954 | 0.9986 |
| Noresm1-m.1 | 0.9279 | 0.9937 | 0.9979 |
Table 4.
Goodness-of-fit statistics for the monthly streamflow at the US Geological Survey (USGS) flow gauging station at Deckers Creek Watershed, Morgantown, West Virginia, USA. Note(s): R2 = Coefficient of Determination; NSE = Nash-Sutcliffe Efficiency; PBIAS = Percent Bias.
Table 4.
Goodness-of-fit statistics for the monthly streamflow at the US Geological Survey (USGS) flow gauging station at Deckers Creek Watershed, Morgantown, West Virginia, USA. Note(s): R2 = Coefficient of Determination; NSE = Nash-Sutcliffe Efficiency; PBIAS = Percent Bias.
| Watershed | Station No. | Period | Time Span | R2 | NSE | PBIAS (%) |
|---|
| Deckers Creek | USGS 03062500 | Calibration | 2004–2013 | 0.77 | 0.76 | 7.1 |
| Validation | 2014–2020 | 0.8 | 0.78 | 8.8 |
Table 5.
Projected minimum temperature (Tmin) and maximum temperature (Tmax) for three future periods (2030s, 2050s, 2070s) under two RCPs (4.5, 8.5) in DCW, Morgantown, WV, USA. Ensemble mean for four GCMs with the ensemble minimum and maximum values on the parentheses.
Table 5.
Projected minimum temperature (Tmin) and maximum temperature (Tmax) for three future periods (2030s, 2050s, 2070s) under two RCPs (4.5, 8.5) in DCW, Morgantown, WV, USA. Ensemble mean for four GCMs with the ensemble minimum and maximum values on the parentheses.
| Period_RCP | Tmin (°C) | Tmax (°C) |
|---|
| 2030s 4.5 | 6.24 (5.33,6.97) | 19.37 (18.00, 20.58) |
| 2030s 8.5 | 6.50 (5.76, 6.99) | 19.69 (18.47, 20.34) |
| 2050s 4.5 | 6.77 (5.87, 7.47) | 19.92 (18.54, 21.08) |
| 2050s 8.5 | 7.58 (6.57, 8.23) | 20.69 (19.19, 21.41) |
| 2070s 4.5 | 6.98 (6.21, 7.66) | 20.14 (18.91, 21.29) |
| 2070s 8.5 | 8.84 (7.52, 9.75) | 22.02 (20.03, 22.77) |
Table 6.
Projected changes of water balance components from baseline trends (1980–1999) for three future periods (2030s, 2050s, 2070s) under two RCPs (4.5, 8.5) in Deckers Creek Watershed, Morgantown, West Virginia, USA. Ensemble mean for four GCMs with the ensemble minimum and maximum on the parentheses.
| Period_RCP | Streamflow | Precipitation | Evapotranspiration | Water Yield |
|---|
| 2030 4.5 | −1.400 (−5.9, 2.5) | 0.475 (−1.6, 3.2) | 6.825 (5.2, 9.1) | −3.600 (−7.4, −0.5) |
| 2030 8.5 | 0.175 (−6.3, 6.9) | 1.525 (−4.0, 6.4) | 7.850 (4.8, 10.2) | −2.525 (−9.6, 4.0) |
| 2050 4.5 | 4.575 (−2.4, 10.9) | 4.125 (0.3, 8.2) | 8.550 (7.4, 9.9) | 1.200 (−4.3, 6.9) |
| 2050 8.5 | 5.275 (4.4, 6.6) | 3.600 (2.4, 5.0) | 6.250 (4.5, 7.9) | 1.850 (0.9, 3.2) |
| 2070 4.5 | 3.225 (−1.6, 6.0) | 2.450 (−0.4, 4.8) | 5.825 (2.2, 8.8) | 0.200 (−3.8, 2.7) |
| 2070 8.5 | 10.425 (6.9, 12.8) | 6.775 (4.7, 8.9) | 5.300 (2.3, 6.9) | 7.575 (3.1, 10.1) |
Table 7.
Surface runoff (mm) and groundwater contribution (mm) to water yield for historical baseline and three future periods (2030s, 2050s, 2070s) under two RCPs (4.5, 8.5) in Deckers Creek Watershed, Morgantown, West Virginia, USA. The number in the parentheses shows the percent contribution of surface runoff and groundwater to water yield.
| Period RCP | Surface Runoff (mm) | Groundwater (mm) | Water Yield (mm) |
|---|
| 1980–1999 | 13.77 (25.14%) | 35.45 (64.71%) | 54.78 |
| 2030 4.5 | 10.47 (19.83%) | 36.60 (69.33%) | 52.79 |
| 2030 8.5 | 10.61 (19.87%) | 36.94 (69.19%) | 53.39 |
| 2050 4.5 | 10.71 (19.32%) | 38.60 (69.62%) | 55.44 |
| 2050 8.5 | 10.65 (19.09%) | 38.91 (69.76%) | 55.78 |
| 2070 4.5 | 10.81 (19.69%) | 38.03 (69.28%) | 54.89 |
| 2070 8.5 | 11.26 (19.10%) | 41.05 (69.65%) | 58.94 |

