Abstract
Agricultural non-point source (NPS) pollution has become a prominent problem for China’s water quality. Paddy fields pose a high risk of pollution to surrounding water bodies. The paddy in situ observation method (PIOM) can calculate the runoff pollution load of paddy fields in situ without changing the original runoff characteristics and agricultural water management measures. In this study, we carried out multisite field experiments during the rice growing period in the Taihu Lake basin and calculated the runoff pollution loads. Then, we developed a runoff pollution empirical model (RPEM) and runoff pollution machine learning models of paddy fields. Based on the PIOM, the average runoff volume was 342.1 mm, and the runoff pollution loads mainly occurred in the early-stage seedling and tillering stages. The mean TN, NH4+-N, TP and CODMn loads of paddy fields were 10.28, 3.35, 1.17 and 23.49 kg·ha−1, respectively. The mean N and P fertilizer loss rates were 4.09 and 1.95%, respectively. The RPEM mainly included the runoff model and surface water concentration model of paddy fields, the performance of which was validated based on the PIOM. The irrigation and runoff volumes of Zhoutie paddy (ZT) and Heqiao paddy (HQ) analyzed by RPEM and PIOM had an absolute difference of 1.2~3.1%. With the exception of the difference in CODMn loads of ZT, the absolute differences in TN, NH4+-N, TP and CODMn loads of ZT and HQ measured by two methods were less than 20%. This result illustrates the accuracy and feasibility of the RPEM for analysis of the water balance and runoff pollution loads of paddy fields. Based on 114 field runoff pollution datasets, RF provided the best machine learning model for TN, NH4+-N and TP, and SVM was the best model for CODMn. The training set R2 values of the best models for TN, NH4+-N and CODMn were above 0.8, and the testing set R2 values of the best models were above 0.7. The runoff pollution RF and SVM models can support the calculation and quantitative management of paddy field pollution load. This study provides a theoretical basis and technical support for the quantification of runoff pollution load and the formulation of pollution control measures in the Taihu Lake basin.
1. Introduction
With gradual improvements in point source pollution treatment in China, water quality pollution caused by non-point source (NPS) pollution, especially agricultural NPS pollution, has become a key problem over time [1,2,3,4]. China’s agricultural production adopts the modern agricultural production mode characterized by high input, yield and waste [5], which sacrifices the ecological environment. The Taihu Lake basin, as the “land of fish and rice”, is one of the most densely populated and intensively cropped areas in China, where approximately 75% of the arable land is exploited for rice field cultivation [6]. Paddy fields pose a high risk of pollution to surrounding water bodies by delivering nitrogen (N) and phosphorus (P) through surface runoff [7,8]. Excessive chemical fertilizers and pesticide use in paddy fields have caused a series of environmental problems, such as soil degradation, deterioration of water quality, eutrophication and groundwater pollution [9,10,11,12,13].
Currently, three experimental observation methods are used to observe runoff pollution in paddy fields [14]: the runoff storage pond method [15], the synchronous observation method [16,17] and the paddy in situ observation method (PIOM) [18,19]. The runoff storage pond method requires an individual runoff outlet, a specific volume runoff pond and a constant ridge height of the paddy field. The synchronous observation method requires the simultaneous observation of the water volume and water quality and calculates the pollution loads caused by the outflow of paddy fields [20]. These two methods are mainly used in experimental stations or experimental plots. For outdoor paddy fields with no single outlet and dynamically changing ridge height, the PIOM can calculate the runoff pollution load of paddy fields in situ without changing the original runoff characteristics and agricultural water management measures [19].
Owing to the advantages of the PIOM, the field-scale observation method has been applied in Beijing [14,18] and Taihu Lake basin [19]. An empirical model of paddy field runoff pollution load can be developed through multisite field experiments combined with hydrologic budget, evapotranspiration calculation and runoff pollution load accounting. Such an empirical model can provide a theoretical basis for the accounting of regional paddy field runoff pollution load, technical support for paddy field water and fertilizer management and quantitative control of agricultural NPS pollution.
Machine learning methods have become one of the most popular research directions and a strong driving force to revolutionize a wide range of fields [21,22], such as intelligent identification, smart health care, financial technology and surveillance systems. A machine learning algorithm can be formulated as an optimization problem to find the extremum of an objective function [22]. The runoff pollution load of paddy fields is mainly related to water and fertilizer management measures. During the growth of rice, a large amount of field water is maintained, which often causes runoff loss. The amount of fertilizer and fertilization timing affect the surface water pollutant concentration of paddy fields. By selecting the main factors that affect the runoff pollution load, machine learning algorithms may be applied to develop a runoff pollution model of paddy fields, which can provide support for the accounting and quantitative management of runoff pollution loads.
In this study, based on the PIOM, a multisite paddy field experiment was conducted in the Taihu Lake basin. The objectives of this study are to (i) study the characteristics of the runoff pollution load of paddy fields in situ, (ii) develop a runoff pollution empirical model (RPEM) of paddy fields based on paddy in situ observation experiments and (iii) develop runoff pollution machine learning models of paddy fields. This study will provide a theoretical basis and technical support for the quantification of paddy field pollution load and the formulation of pollution control measures in the Taihu Lake basin.
2. Calculation of Runoff Pollution Loads of Paddy Fields Based on PIOM
2.1. Materials and Data
2.1.1. Experimental Site
Multisite field experiments using PIOM were conducted during the rice growing period in the Taihu Lake basin. The research area is located on the southern bank of the lower reaches of the Yangtze River in the western plain river network of the Taihu Lake basin. It belongs to the subtropical humid monsoon climate.
Three paddy experiments were conducted in Yixing, Wuxi, Jiangsu Province in 2017: Zhoutie paddy (ZT), Heqiao paddy (HQ) and Wanshi paddy (WS). Two paddy experiments were conducted in Liyang, Wuxi, Jiangsu Province in 2013 and 2014: Licheng paddy 2013 (LC13) and Licheng paddy 2014 (LC14). Figure 1 shows the location of Taihu Lake basin in China and the paddy sites.
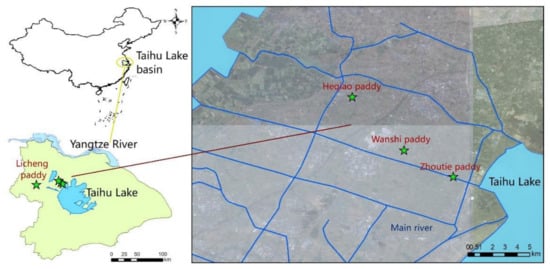
Figure 1.
The location of Taihu Lake basin in China and the paddy sites.
2.1.2. Data Collection
The experimental paddy fields produce rice in rotation with wheat. The alternate wetting and drying irrigation mode was adopted as a water-saving strategy. Direct sowing and surface fertilizer were applied in practice owing to their convenience and low economic costs. The amount of fertilizer applied in the experimental paddy field was in accordance with local agricultural management measures. Compound fertilizer and urea were applied in the paddy field. The N, P2O5 and K2O application amounts were 259.6, 72.0 and 117.0 kg·ha−1 in ZT, HQ and WS; 257.8, 46.7 and 53.3 kg·ha−1 in LC13; and 220.0, 58.3 and 66.7 kg·ha−1 in 2014, respectively. For LC13 and LC14, the monitoring periods were from 12 July to 20 October and from 14 July to 20 October, with a monitoring period of 101 days in 2013 and 99 days in 2014. For ZT, HQ and WS, the monitoring period was from 26 June to 14 October, with a monitoring period of 111 days.
The growing period, paddy water depth and precipitation hydrograph of the paddy field are shown in Figure 2. The monitoring period included the seedling stage, tillering stage, jointing–booting stage and maturity stage (including the milk-ripening stage and the yellow ripe stage).
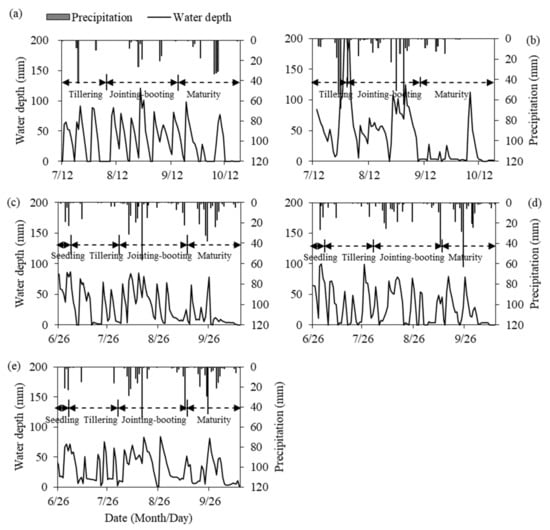
Figure 2.
Growing period, paddy water depth and precipitation hydrograph of the paddy field. (a) LC13, (b) LC14, (c) ZT, (d) HQ, (e) WS.
To obtain continuous precipitation and water depth data, a pluviograph was set up to record precipitation every 10 min, and a mareograph was set up to record the paddy water depth of paddy fields every 30 min.
Water samples were collected twice a week for laboratory water quality analysis. The TN (total nitrogen), NH4+-N (ammonium nitrogen), TP (total phosphorus) and CODMn (chemical oxygen demand) concentrations were determined using the alkaline potassium persulfate digestion-UV spectrophotometric method, salicylic acid spectrophotometry method, digestion–ammonium molybdate spectrophotometric method and acid potassium permanganate method, respectively. For LC13 and LC14, the CODMn concentration was not monitored.
Meteorological data on a daily scale were obtained from the Liyang Meteorological Station and the Yixing Meteorological Station. The data include the cumulative precipitation (mm); average relative humidity (%); mean wind speed (m·s−1); sunshine duration (h); maximum, minimum and mean air temperature (°C); and daily net radiation (MJ·m−2).
2.2. Paddy In Situ Observation Method
2.2.1. Runoff Calculation of the Paddy Field
The variation in water depth of paddy fields depended mainly on precipitation, irrigation, evapotranspiration, infiltration and runoff. When there was ponded water in a paddy field, the change in water depth was calculated as follows according to the water balance model [23,24]:
where P is the daily precipitation (mm), IRin is the irrigation water inflow (mm), ET is the evapotranspiration (mm), F is the infiltration loss (mm), Rout is the surface water outflow (mm) and is the change in water depth (mm).
According to water balance Equation (1), the irrigation and runoff can be calculated based on daily precipitation, the water depth difference between consecutive days, evapotranspiration and infiltration, as expressed in Equation (2) [19,25,26].
where Pi is the precipitation (mm) on day i, ETi is the evapotranspiration (mm) on day i, Fi is the infiltration (mm) on day i, Hi is the water depth (mm) on day i, Hi+1 is the water depth (mm) on day i + 1, is the difference value (mm) between the water inflow and outflow on day i, IRin,i is the paddy inflow of water (mm) on day i and Rout,i is the paddy outflow of water (mm) on day i.
is the total irrigation volume (mm) during the rice growing period, and is the total surface runoff volume (mm).
2.2.2. Evapotranspiration and Infiltration Estimation in Steadily Declining Water Level Period
The factors influencing the water depth include natural factors and artificial factors. The natural factors include evapotranspiration and infiltration (ET + F), as well as precipitation. The artificial factors include irrigation and artificial drainage. When there was no rainfall, irrigation or artificial drainage, the water depth variation process line was only affected by (ET + F) processes [18]. Therefore, Equation (1) can be simplified as follows:
The (ET + F) term can be estimated by determining the steady decline in the water level that was selected to calibrate (ET + F) by determining the steady decrease rate based on synchronous observation of the precipitation and water depth.
2.2.3. Evapotranspiration Calculation
The crop coefficient method was applied to calculate the daily evapotranspiration of the paddy field with synchronous meteorological data using the recommended FAO-56 Penman–Monteith equation [27,28]. In this study, the single-crop coefficient method was applied. The rice reference evapotranspiration (ETc), which accounts for soil evaporation and rice transpiration, was calculated as follows:
where ETc is the daily rice reference evapotranspiration (mm·d−1) of the paddy field, ET0 is the reference crop evapotranspiration (mm·d−1) and Kc is the rice coefficient.
The values of Kc at different rice growth stages were determined using the FAO-56 Penman–Monteith equation [27]. Water was kept in the paddy field for most of the time, so it was assumed that there was no water stress for rice growth during the monitored growing period, except in the late maturity stage.
2.2.4. Infiltration Estimation and (ET + F) Estimation within the Rice Growing Period
The infiltration of paddy fields included vertical percolation and lateral seepage. The percolation through the plow sole of a paddy field can be assumed to be similar to that of soil with a similar texture. Thus, the percolation of the paddy field was obtained from related studies conducted in the Taihu Lake basin. During the steadily declining water level period, the seepage of the paddy field was calculated as Equation (5):
where S is the daily seepage (mm·d−1), (ET + F) is the estimated evapotranspiration and infiltration (mm·d−1) according to determination of the steady decrease rate of the water level, ETc is the daily evapotranspiration (mm·d−1) of the paddy field and C is the percolation (mm·d−1) of paddy fields in the Taihu Lake basin.
After obtaining the average seepage of different growth stages of the paddy field, the average infiltration of different growth stages was obtained by summing the average seepage and percolation values. After summing the average infiltration of different growth stages and the daily ETc, the daily (ET + F) in the growing period was acquired. Therefore, the water balance of the paddy field was calculated using Equation (2).
2.2.5. Runoff Pollution Calculation
It was difficult to determine the pollutant concentration of every runoff in the paddy field in situ, so paddy field water was regularly collected and analyzed. The pollutant concentration variation during the growing period was obtained by the interpolation method. The runoff pollution was calculated by multiplying the runoff volume by the pollutant concentration according to Equation (6) as follows:
where Li is the runoff pollution export intensity (mg·m−2·d−1), Rout,i is the runoff volume (mm·d−1) and Ci is the runoff concentration (mg·L−1).
is the total runoff pollution export load (kg·ha−1) during the whole rice monitoring period. The fertilizer loss rate (%) is equal to L divided by the fertilizer application amount (kg·ha−1).
2.2.6. Statistical Analysis
Microsoft Excel 2013 was used for statistical data and to generate graphs. Statistical analysis was performed using SPSS version 22.0 (SPSS, Chicago, IL, USA). Bivariate correlation with Pearson correlation analysis and curve estimation via SPSS linear regression analysis were applied.
2.3. Results and Discussion
2.3.1. Runoff Calculation of Paddy Fields
Precipitation and irrigation constitute the water inflow of paddy fields. The surface runoff of the paddy field includes rainfall runoff, drainage runoff and irrigation overflow [19,29,30]. Table 1 shows the components of the hydrologic budget of paddy fields LC13, LC14, ZT, HQ and WS. Irrigation was negatively correlated with precipitation according to Pearson correlation analysis. When there was more rainfall, irrigation in paddy fields decreased. The runoff volume varied from 290 to 410 mm, with an average value of 342.1 mm. The proportion of runoff volume to inflow volume ranged from 23.1% to 37.6%, with an average value of 29.2%. The mean proportions of rainfall runoff, drainage runoff and irrigation overflow with respect to surface runoff were 48.3%, 23.1% and 28.6%, respectively. Rainfall runoff was the main type of runoff, followed by irrigation overflow and artificial drainage. The proportion of rainfall runoff to precipitation ranged from 31.4% to 44.7%, with an average value of 38.2%.

Table 1.
Components of the hydrologic budget (mm) of the paddy field.
There was more inflow in Yixing paddy fields (ZT, HQ and WS) than in Liyang paddy fields (LC13 and LC14). The mean proportion of runoff volume to inflow volume in Liyang paddy fields was 33.0%, which is more than that in Yixing paddy fields (26.7%). For Yixing paddy fields (ZT, HQ and WS) in 2017, there was no significant difference in precipitation and rainfall runoff among the three plots, and the runoff difference was mainly reflected in drainage runoff and irrigation overflow. In paddy fields with extensive agricultural water management, drainage runoff and irrigation overflow were common phenomena.
2.3.2. Runoff Pollution Loads of the Paddy Field
Each runoff TN, NH4+-N, TP and CODMn load of paddy fields during the rice monitoring period is shown in Figure 3. The overall trend indicates that the early-stage seedling and tillering stages were critical risk stages for runoff pollution load, which is consistent with related research [31,32], compared with the relatively average distribution of runoff during the growing period. The elapsed time after fertilizer application significantly impacted N and P surface runoff loss, which occurred during the early stage after fertilizer application and contributed the most to pollution loss [12]. There were differences in the pollution load distribution between the Liyang paddy fields and Yixing paddy fields. The proportions of TN, NH4+-N and TP pollution loads in the early stage of Liyang paddy fields were 40.2, 48.5 and 44.5%, respectively. The proportions of TN, NH4+-N, TP and CODMn pollution loads in the early stage of Yixing paddy fields were 74.2, 82.4, 34.4 and 69.9%, respectively. These differences might be attributed to the rice growth, fertilization practices and artificial management measures between the Liyang paddy fields and the Yixing paddy field.
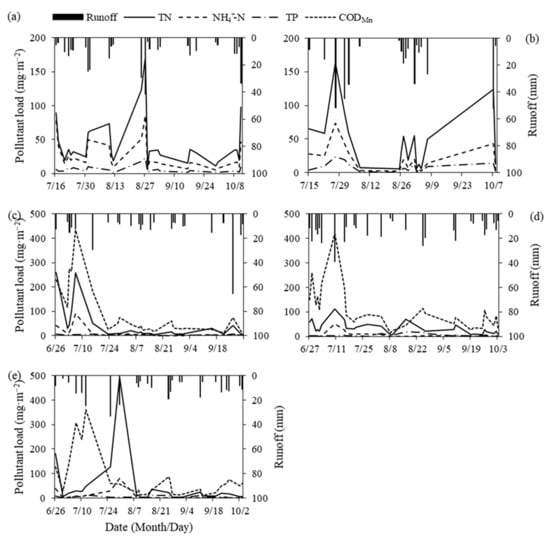
Figure 3.
Runoff TN, NH4+-N, TP and CODMn loads of paddy fields during the rice monitoring period. (a) LC13. (b) LC14. (c) ZT. (d) HQ. (e) WS.
Compared to the N and CODMn pollution loads, the P pollution load distribution was more consistent during the monitoring period, which was related to the differing release rates of N and P fertilizer [19]. After fertilizer application, dissolved N and particulate P were the main forms in the paddy field. Particulate P, which is the main form of P loss in runoff, is adsorbed on soil particles with a low release rate [33]. More than 90% of TP in the runoff was lost through suspended particles [26].
Table 2 shows the runoff TN, NH4+-N, TP and CODMn loads and N and P fertilizer loss rates of the paddy field. The mean TN, NH4+-N, TP and CODMn loads of the five paddy fields were 10.28, 3.35, 1.17 and 23.49 kg·ha−1, respectively. The mean N and P fertilizer loss rates of the paddy fields were 4.09 and 1.95%, respectively. The mean TN, NH4+-N and TP loads and the mean N and P fertilizer loss rates of the Liyang paddy fields were larger than those of the Yixing paddy fields. The NH4+-N load of the Liyang paddy fields differed significantly from that in the Yixing paddy fields, mainly due to the differences in rate and type of fertilizer.

Table 2.
Runoff TN, NH4+-N, TP and CODMn loads and N and P fertilizer loss rates of the paddy field.
For Liyang paddy fields, the runoff TN, NH4+-N and TP loads in 2013 were greater than those in 2014, although the surface runoff volume in 2013 was less than that in 2014. This indicates that N and P loads are more dependent on N and P concentrations in the runoff than on the runoff volume [19,34]. The difference in pollutant concentration is mainly related to the fertilization types and fertilizer application timing.
3. Development of a Runoff Pollution Empirical Model of the Paddy Field
Agricultural N and P losses are involved in complicated hydrological and biogeochemical processes, which can be influenced by many factors, such as climate, soil properties and crop types [35]. To better quantify the runoff pollution load and provide decision-making support for mitigation and control of agricultural NPS pollution, a field-scale model can be established and applied. Mechanistic models are usually relatively complex, needing to clarify the mechanism process of runoff, pollution production and pollutant degradation, with high data requirements and requiring intensive parameter calibration and validation, making their application logistically difficult, especially due to a lack of detailed regional data [36,37]. Based on multisite field-scale experiments applying PIOM and analyzing the water balance and the surface water concentration degradation of paddy fields, it was convenient and feasible to develop a semi-empirical and semi-mechanistic RPEM of paddy fields. An empirical model could provide support for sustainable agricultural water and fertilizer management, runoff pollution accounting and efficient pollution control strategies of paddy fields in the Taihu Lake basin.
According to previous studies [19,25,26], precipitation, irrigation, fertilization and ridge height have a significant effect on the runoff pollution loads of paddy fields. Based on multisite in situ observational experiments and specifications for paddy field planting in Yixing and Liyang, the RPEM of paddy fields in the Taihu Lake basin was developed. The RPEM of the paddy field includes the runoff model and surface water concentration model of the paddy field.
3.1. Runoff Model of the Paddy Field
Surface runoff occurs when rainfall exceeds the field water storage capacity, which depends on the elevation difference between the ponding and drainage water levels [38]. The surface runoff was closely correlated with the precipitation, irrigation, artificial drainage and ridge height of the paddy field. When there was no rainfall and artificial management measures, the water depth of the paddy field was only affected by (ET + F) processes. The runoff model of the paddy field includes infiltration, the lowest ridge height, irrigation and irrigation overflow, artificial drainage and rainfall runoff [19].
3.1.1. Infiltration
The infiltration of paddy fields includes percolation and seepage. The percolation of the paddy field with similar texture in the Taihu Lake basin could be assumed to have an approximate value. In this study, we assumed the percolation rate of paddy fields to be 2.6 mm·d−1 based on the loamy clay soil texture, which is consistent with the relevant research results [19,30,39].
The average seepage rate of the different growth stages of paddy fields was calculated using Equation (5) with the percolation rate of the paddy field, ETc calculated using the Penman–Monteith equation and the estimated (ET + F) in the steadily declining water level period. The average infiltration, percolation and seepage of the paddy field according to the experimental data in Yixing and Liyang are shown in Table 3.

Table 3.
Average infiltration, percolation and seepage (mm·d−1) of the paddy field. (S is the seepage, C is the percolation and F is the infiltration).
The relatively large lateral seepage in the seedling stage was related to the incomplete compaction of the new ridge of the paddy field. Less monitoring data also contributed some errors. The lateral seepage of paddy fields gradually increased in the tillering stage, jointing–booting stage and maturity stage, which was related to the reduction in the lowest ridge height by long-term rainfall, irrigation erosion and artificial compaction.
3.1.2. The Lowest Ridge Height of the Paddy Field
Exposed ridges that connect discrete paddy units are easily eroded, which leads to significant soil erosion and agricultural non-point source pollution [40]. Paddy field runoff is closely related to ridge height [41]. Referring to relevant research [29,42,43] and combined with the paddy field management specifications in Yixing and Liyang, the lowest ridge height of the paddy fields was determined as follows.
- (1)
- After sowing, the field should be kept moist in the bud stage without ponding and irrigation. Therefore, the ridge height in the bud stage was set to 50 mm. If the amount of rainfall was large, rainfall runoff occurred.
- (2)
- Irrigation overflow and rainfall runoff might occur during normal irrigation and rainfall in the seedling stage, tillering stage, jointing–booting stage and milk-ripening stage. The ridge height of the paddy field showed dynamic changes, especially before and after irrigation and rainfall. The ridge height of paddy fields decreased due to frequent irrigation and rainfall erosion. The irrigation amount was typically large. Due to extensive water management, irrigation overflow often occurred after irrigation [19]. Based on the analysis of paddy field experiments, the ridge height for irrigation overflow and rainfall runoff was set to 75 and 70 mm, respectively.
- (3)
- The lowest ridge height of the paddy field during artificial drainage in the jointing–booting stage was set to 0 mm.
- (4)
- The ridge height in the mature stage and yellow ripe stage was set to 0 mm.
3.1.3. Irrigation and Irrigation Overflow
- (1)
- IrrigationThe basic irrigation principles of direct seeding paddy fields are as follows: moist in the bud stage, thin water in the seedling stage, intermittent irrigation in the early tillering stage, enough seedlings to dry the field in the middle and late tillering stages, irrigation with little water in the jointing–booting stage and wet–dry alternation in the strong seed stage. The basic irrigation strategy obtained by statistical analysis is as follows.
- (i)
- The plow sole of the paddy field was formed by early muddy irrigation at 50 mm. There was no other irrigation in the bud stage.
- (ii)
- The irrigation volume was determined to be 80 mm according to the upper limit of 95% confidence of the average irrigation amount of paddy fields during the growth period.
- (iii)
- Irrigation was carried out when there was no water in the paddy field in the seedling stage and one day after no water in the paddy field in the jointing–booting stage. Artificial drainage and drying of fields was carried out in the tillering stage. Generally, the last irrigation was performed when entering the milk-ripening stage. If there was no water and no rain for consecutive days in a paddy field, appropriate supplementary irrigation was carried out. There was no irrigation during the yellow ripe stage.
- (iv)
- The irrigation period was generally 5 to 8 days and adjusted according to the variation in the surface water depth of the paddy field.
- (2)
- Irrigation overflow
In actual paddy fields with extensive agricultural water management, irrigation overflow was a common phenomenon that should not be neglected for in situ paddy fields. According to the statistics, the average proportion of irrigation overflow of paddy fields to the irrigation volume was 15%, and the probability of irrigation overflow was 56%.
3.1.4. Artificial Drainage
The artificial drainage of drying fields in the tillering stage could promote moderate tillering, enhance rice root growth activity and improve the reproductive health of rice by impeding the excessive tillering of rice [44]. Combined with appropriate panicle stage fertilizer, the artificial drainage of a drying field could also improve the nitrogen use efficiency and yield of rice.
- (1)
- In the tillering stage of the drying field
There were generally three drainage events of the drying field in the tillering stage. Table 4 presents information about the three drainage events.

Table 4.
Description of three drainage events of the paddy field.
- (2)
- With excess rainfall
Artificial drainage was required if the water depth in the paddy field was too high due to excess rainfall, representing a routine agricultural water management measure.
3.1.5. Rainfall Runoff
Rainfall runoff is related to precipitation, water depth and the lowest ridge height of the paddy field. Excess heavy rainfall, extreme rainstorm events and water depth were the main factors inducing rainfall runoff [45]. If the paddy field surface water plus precipitation minus (ET + F) exceed the lowest ridge height, rainfall runoff would occur.
According to the statistics of the Yixing and Liyang paddy fields, the average proportion of rainfall runoff to the total precipitation during the growth monitoring period of paddy fields was 38%.
3.2. Surface Water Concentration Model of the Paddy Field
As an important initial condition for analysis of NPS pollution from rice paddy fields, a reasonable estimation of pollution dynamics in paddy surface water can help identify the risk of NPS pollution and provide a warning for the risk of agricultural NPS pollution [46]. Site experiments have shown that pollutant concentration changes in paddy surface water conform to a first-order kinetic equation, which can reveal the attenuation process of pollutants during fertilization [8,13,32]. The pollutant concentration is normally high in the initial surface water after fertilizer applications in the early stage and gradually decreases to a low concentration [12]. The variation in the pollutant concentration of paddy fields is predominantly governed by the time and amount of fertilization, which is also related to the water volume in the field. Therefore, we developed the paddy field water pollutant concentration with the following first-order kinetic equation: , where y is the concentration (mg·L−1) of pollutants in the field surface water after fertilization; k is the attenuation coefficient (d−1); FP is the amount of fertilization (kg·ha−1); t is the days (d) after fertilization; and A, b and c are the coefficients. In this study, the surface water concentration models and parameters of paddy fields were obtained using linear regression analysis based on the experimental runoff pollution data.
TN concentration model:
where is the concentration (mg·L−1) of TN, and is the amount of nitrogen fertilization (kg·ha−1).
NH4+-N concentration model:
where is the concentration (mg·L−1) of NH4+-N.
TP concentration model:
where is the concentration (mg·L−1) of TP, and is the amount of phosphorus fertilization (kg·ha−1).
CODMn concentration model:
where is the concentration (mg·L−1) of CODMn, and is the amount of total fertilization (kg·ha−1).
The R2 values for the TN, NH4+-N, TP and CODMn concentration model were 0.953, 0.999, 0.999 and 0.997, respectively, indicating a good fit to the linear model.
3.3. Validation of RPEM
The runoff volume and runoff pollution loads of ZT and HQ in 2017 were calculated based on the PIOM and RPEM. Then, the discrepancies between the two methods were assessed, and the performance of the RPEM was validated based on the PIOM.
3.3.1. Runoff Verification of Paddy Fields
Table 5 shows the hydrologic budget using two methods: PIOM and RPEM. The irrigation and runoff volumes of ZT and HQ analyzed according to the two methods had an absolute difference of 1.2~3.1%, which illustrates the accuracy of the RPEM. Although the difference in drainage runoff at ZT calculated according the two methods was 29.0%, the absolute differences in rainfall runoff and irrigation overflow of ZT and HQ calculated according to the two methods were less than 15%. The differential value of drainage runoff at ZT calculated according to the two methods was less than 15 mm. Low data values also cause large absolute differences. This result illustrates the accuracy and feasibility of RPEM for calculation of the runoff of paddy fields in the Taihu Lake basin.

Table 5.
Components of the hydrologic budget (mm) using two methods.
3.3.2. Runoff Pollution Load Verification of Paddy Fields
Table 6 shows the TN, NH4+-N, TP and CODMn loads calculated using two methods: PIOM and RPEM. With the exception of the difference in CODMn loads of ZT calculated using the two methods (22.3%), the absolute differences in TN, NH4+-N, TP and CODMn loads of ZT and HQ calculated using the two methods were less than 20%. The ETc calculated using the FAO-56 Penman–Monteith equation was theoretical reference evapotranspiration, causing errors with the actual ET of rice fields. The paddy field water and fertilizer management measures, including the time and amount of irrigation, drainage and fertilization, were empirical in RPEM, resulting in minimal difference relative to the actual measures in ZT and HQ, leading to an increase in uncertainty. This result illustrates the feasibility of the RPEM for calculation of the runoff pollution load of paddy fields. The RPEM can be applied to analyze the water balance and pollution loads of paddy fields in the Taihu Plain basin.

Table 6.
TN, NH4+-N, TP and CODMn loads (kg·ha−1) calculated using RPEM and PIOM methods.
4. Development of Runoff Pollution Machine Learning Models of Paddy Fields
4.1. Machine Learning Algorithm
Without requiring knowledge of the mathematical relationship between the inputs and the corresponding outputs, even with limited data, machine learning models provide methods for quick and flexible estimation with the goal of achieving a high level of generalization and prediction accuracy [47]. In this study, support vector machine (SVM), artificial neural network (ANN) and random forest (RF) models were selected for simulation, which have previously been applied in the fields of water concentration measurement and water quality prediction [48,49,50]. The runoff pollution models of paddy fields based on machine learning algorithms can provide support for the accounting and quantitative management of runoff pollution loads of paddy fields in the Taihu Lake basin.
4.1.1. SVM
SVM uses nonlinear input mapping to a very high-dimensional space and ensures high generalization. It can be represented as two-layer networks, where the weights are nonlinear in the first layer and linear in the second layer [47]. The aim of SVM is to determine the location of decision boundaries by maximizing the margin between classes.
SVM adopts the principle of structural risk minimization to minimize the sample error and reduce the model generalization error [51]. It can make full use of the distribution characteristics of training samples, does not require extensive prior information and has good generalization ability, especially for small samples in many machine learning models. The radial basis function (RBF), a popular kernel model owing to its low- or no-error advantage during testing and validation, as well as its reliable performance [52], was chosen for this study. Figure 4 shows the architecture of the SVM.
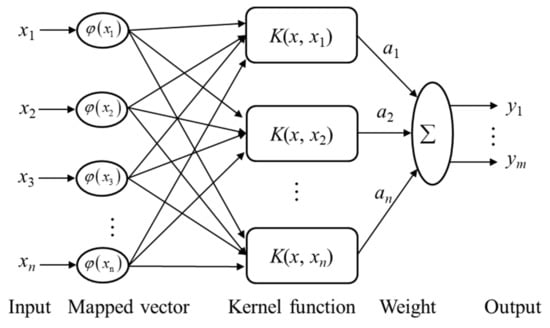
Figure 4.
Architecture of the SVM.
4.1.2. ANN
ANNs are suitable for solving the nonlinear and uncertain problems because their characteristics are similar to those of the brain nervous system [53]. An ANN can be represented as a system of interconnected “neurons”. Each neuron node represents an activation function. When neurons receive information from different inputs, they obtain nonlinearity through activation functions [53]. The output of ANNs varies according to the connection mode, weight value and activation function of the network. ANNs are generally distinguished as the input layer connecting the input information to the network, with the hidden layer acting as the intermediate computational layer and storing the threshold between the input and output layer and the output layer producing the desired output. Backpropagation neural networks (BPNNs) [54,55] are currently the most commonly used type of neural network learning algorithm. A BPNN is a multilayer forward neural network based on the feedforward propagation of input sample information and the backpropagation algorithm of output error to train networks. A BPNN can be regarded as a highly nonlinear mapping from input to output. Figure 5 shows the architecture of a typical three-layer BPNN.
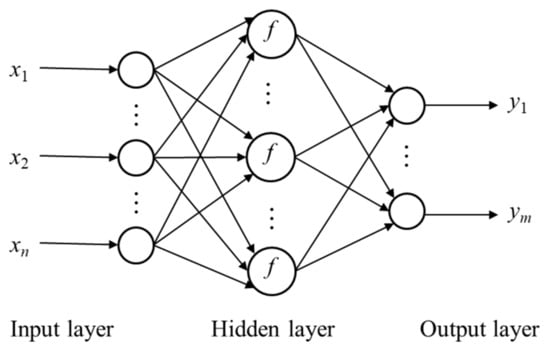
Figure 5.
Architecture of a typical three-layer BPNN.
4.1.3. RF
Combing classification and regression trees (CARTs) with an additional degree of randomization, RF is a type of ensemble learning algorithm in machine learning and is also known as classifier combinatorial learning [56]. The basic learner is a decision tree (DT). By extracting multiple training sample sets from original samples using the put-back resampling method, RF combines multiple DTs to obtain the final forecast result by obtaining the majority of votes [50]. The result is that multiple weak classifiers (decision trees) are aggregated into strong classifiers.
Distinct from many traditional analysis methods, RF is a nonparametric statistical method that does not require the distribution assumption for predictive variables. It has high prediction accuracy and strong anti-noise ability, as well as high tolerance for missing values, abnormal values, noise, etc. It is known as one of the best algorithms [57]. The architecture of RF is shown in Figure 6.
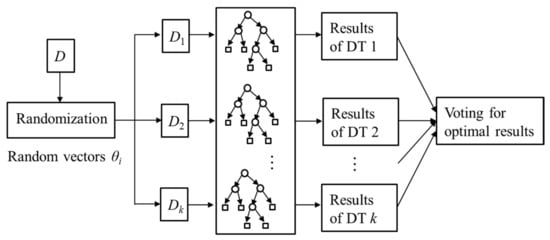
Figure 6.
Architecture of RF.
4.2. Model Construction and Simulation
The runoff pollution loads of paddy fields are mainly related to water and fertilizer management measures. The surface water of paddy fields includes rainfall and irrigation. The amount of fertilizer and fertilization timing affect the pollutant concentration of surface water. In paddy field experiments conducted in ZT, HQ, WS, LC13 and LC14 based on PIOM, a total of 114 field runoff pollution loads were obtained. Therefore, runoff pollution models based on machine learning algorithms were developed using the water depth (mm), daily rainfall (mm) and pollutant concentration (mg·L−1) of paddy field as independent variables and every runoff pollution load (mg·m−2) of paddy fields as a dependent variable. The 80 field runoff pollution datasets of LC13, ZT and HQ were selected as the training set for model calibration, and the 34 filed runoff pollution datasets of LC14 and WS were selected as the testing set for model validation.
In this study, calculation and simulation results were evaluated using the coefficient of determination (R2) and root mean square error (RMSE). R2 is defined as:
where N is the number of calculations, Li is the runoff pollution load (mg·m−2) calculated with PIOM, is the average value, is the runoff pollution load simulated with the machine learning algorithm and is the average value.
R2, ranging from 0 to 1, indicates the dispersion of dependent variables around the regression line. A high value of the R2 criterion indicates improved consistency of simulation with the calculation [58].
The RMSE is defined as:
4.3. Results and Optimal Model Selection
Table 7 shows the simulation results of the runoff pollutant load calculated by the machine learning algorithm. The best machine learning model for TN, NH4+-N and TP was RF, and the best machine learning model for CODMn was SVM. The RMSE was consistent with R2; the higher the R2, the lower the RMSE and the better the simulation effect of the machine learning algorithm. Among the best machine learning models selected, the training set R2 values of the best models for TN, NH4+-N and CODMn were above 0.8, and the testing set R2 values of the best models were above 0.7, indicating a good simulation effect. The training set R2 value of the best model for TP was 0.79 (close to 0.8), and the R2 value for the testing set was 0.68 (slightly worse) which might be related to the low pollution load value of TP. The best runoff pollution machine learning models of paddy fields generally provided reasonable estimates, and the runoff pollution models based on RF and SVM could support the calculation of paddy field pollution load.

Table 7.
Simulation results of runoff pollutant load calculated by the machine learning algorithm.
For the selection of the best machine learning model, the best TN, NH4+-N and TP model was RF, and the best CODMn model was SVM. In general, the RF model had the best simulation effect, followed by the SVM and the BPNN, with poor model performance. When the BPNN is used for function approximation, the weight adjustment adopts the negative gradient descent method, which has the disadvantage of slow convergence speed, easily falling into a local minimum value. ANN models depend heavily on the quantity of data. It is not recommended to use relatively small dataset for predictors because some useful information is lost in short-term data, which may lead to poor prediction results [53]. SVM has the advantages of small training samples and high training accuracy, resulting in a good simulation effect. Its prediction ability is even better than that of BPNN and RBF neural networks [51]. In contrast to SVM and BPNN, RF has two key characteristics: (1) the importance estimation of variables, which overcomes the defects of traditional variable selection methods; (2) the data arrangement analysis, including data similarity analysis, and the similarity measurement between data automatically generated by RF [56,59]. Additionally, due to the introduction of randomness, the RF method reduces the probability of overfitting cases and has good noise immunity with insensitivity to outliers [50].
A comparison between the calculated runoff TN, NH4+-N, TP and CODMn loads and simulated runoff loads of paddy fields with the best machine learning algorithm is shown in Figure 7, Figure 8, Figure 9 and Figure 10.
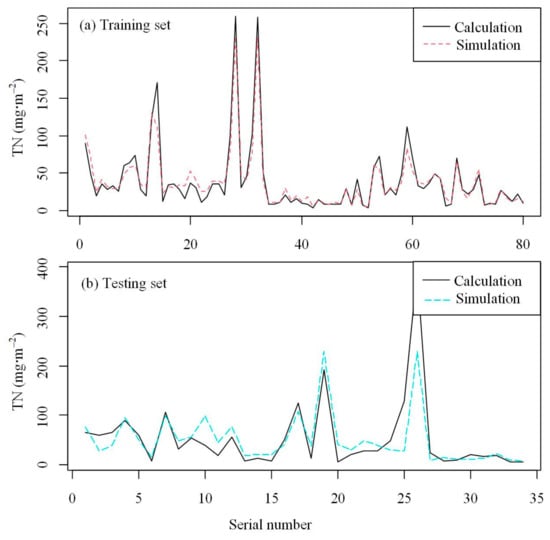
Figure 7.
Calculated and simulated runoff TN loads of paddy fields based on RF.
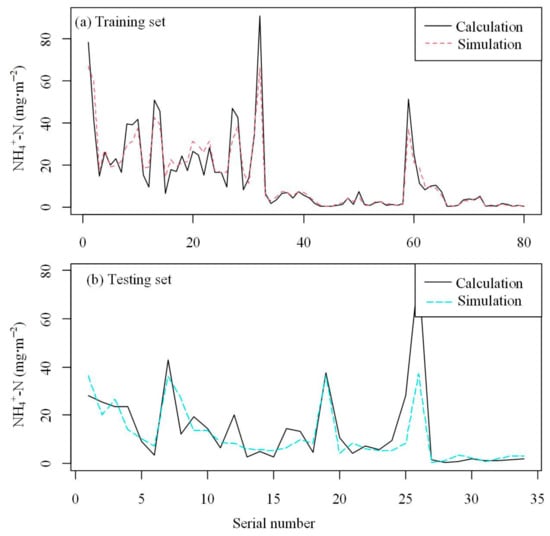
Figure 8.
Calculated and simulated runoff NH4+-N loads of paddy fields based on RF.
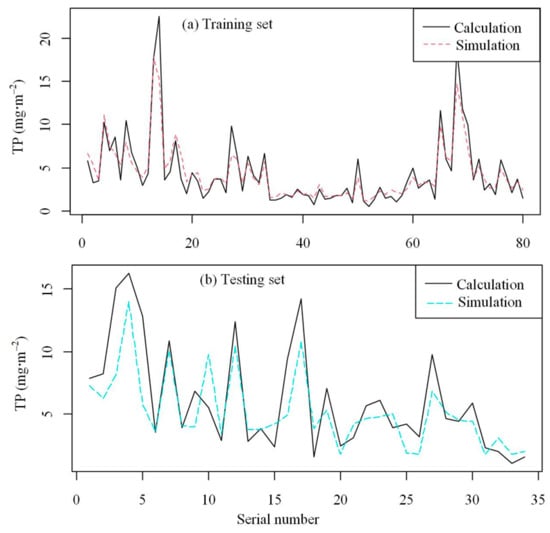
Figure 9.
Calculated and simulated runoff TP loads of paddy fields based on RF.
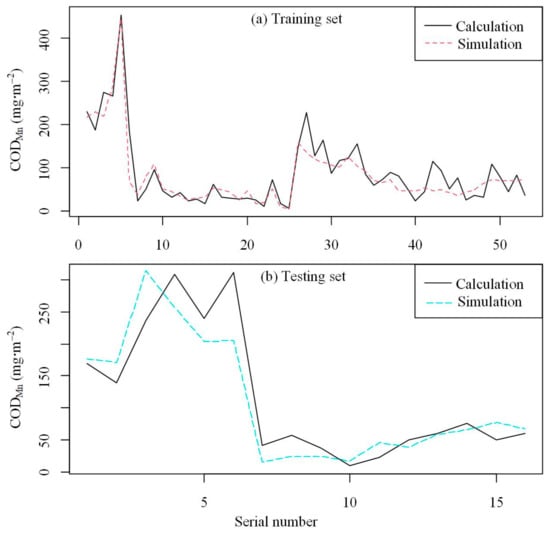
Figure 10.
Calculated and simulated runoff CODMn loads of paddy fields based on SVM.
Daily rainfall data can be acquired from rainfall stations in the Taihu Lake basin. the Rice reference evapotranspiration (ETc) can be calculated using the FAO-56 Penman–Monteith equation with the meteorological data from meteorological stations. Then, the water depth of the paddy field is obtained by RPEM. Combined with the fertilizer time and amount of the paddy field in the Taihu Lake basin, the pollutant concentration is obtained using the surface water concentration model of RPEM. With all independent variables, the runoff pollution load of paddy fields can be obtained by using the best machine learning model of RF and SVM. Furthermore, the runoff pollution load of paddy fields in the Taihu Lake basin can be quantified, and agricultural NPS pollution management and control measures can be formulated.
5. Conclusions
(1) The runoff volume and runoff pollution loads of paddy fields in the Taihu Lake basin were calculated Based on the PIOM. The surface runoff the paddy fields includes rainfall runoff, drainage runoff and irrigation overflow, rainfall representing the main type of runoff. The average runoff volume was 342.1 mm. The runoff pollution loads mainly occurred in the early-stage seedling and tillering stages. The mean TN, NH4+-N, TP and CODMn loads of paddy fields were 10.28, 3.35, 1.17 and 23.49 kg·ha−1, respectively. The mean N and P fertilizer loss rates of paddy fields were 4.09 and 1.95%, respectively.
(2) The RPEM of the paddy field was developed based on the experimental runoff pollution obtained using the PIOM. The RPEM mainly included the runoff model and surface water concentration model of paddy fields. The surface water concentration model of paddy fields was developed with a first-order kinetic equation. The performance of the RPEM was validated based on the PIOM. The irrigation and runoff volumes of ZT and HQ analyzed by the two methods had an absolute difference of 1.2~3.1%. With the exception of the difference in CODMn loads of ZT calculated using the two methods (22.3%), the absolute differences in TN, NH4+-N, TP and CODMn loads of ZT and HQ calculated using the two methods were less than 20%. This result illustrates the accuracy and feasibility of the RPEM for analysis of the water balance and runoff pollution loads of paddy fields in the Taihu Plain basin.
(3) Runoff pollution load models based on machine learning algorithms were developed with a total of 114 field runoff pollution datasets based on collected water samples, taking the water depth, daily rainfall and pollutant concentration of paddy fields as independent variables and the runoff pollution loads as dependent variables. RF provided the best machine learning model for TN, NH4+-N and TP, and SVM was the best model for CODMn. The training set R2 values of the best models for TN, NH4+-N and CODMn were above 0.8, and the testing set R2 values of the best models were above 0.7. The R2 value of the best model for TP was slightly worse. In general, the best runoff pollution machine learning models of NPS pollution from paddy fields showed good results. The runoff pollution RF and SVM models can support further development of NPS pollution loads in paddy fields.
Author Contributions
Conceptualization, Y.X., B.S. and H.W.; Data curation, Y.X.; Formal analysis, Y.X.; Funding acquisition, B.S.; Investigation, Y.X. and B.S.; Methodology, Y.X., B.S. and H.W.; Project administration, H.W.; Resources, B.S.; Software, Y.X.; Supervision, B.S. and H.W.; Validation, Y.X.; Visualization, Y.X.; Writing—original draft, Y.X.; Writing—review and editing, B.S. and H.W. All authors have read and agreed to the published version of the manuscript.
Funding
This research was supported by the Major Science and Technology Program for Water Pollution Control and Treatment (grant number 2013ZX07501005, 2017ZX07301003) and the National Natural Science Foundation of China (grant number 41772234).
Data Availability Statement
Not applicable.
Acknowledgments
The authors would like to thank K. Lei and F. Qiao of the Chinese Research Academy of Environmental Sciences for their assistance during the study.
Conflicts of Interest
The authors declare no conflict of interest.
References
- Vitousek, P.M.; Naylor, R.; Crews, T.; David, M.B.; Drinkwater, L.E.; Holland, E.; Johnes, P.J.; Katzenberger, J.; Martinelli, L.A.; Matson, P.A. Nutrient imbalances in agricultural development. Science 2009, 324, 1519–1520. [Google Scholar] [CrossRef] [PubMed]
- Ongley, E.D.; Xiaolan, Z.; Tao, Y. Current status of agricultural and rural non-point source Pollution assessment in China. Environ. Pollut. 2010, 158, 1159–1168. [Google Scholar] [CrossRef] [PubMed]
- Jiang, S.; Qiu, S.; Zhou, H.; Chen, M. Can FinTech development curb agricultural nonpoint source pollution? Int. J. Environ. Res. Public Health 2019, 16, 4340. [Google Scholar] [CrossRef]
- Xu, B.; Niu, Y.; Zhang, Y.; Chen, Z.; Zhang, L. China’s agricultural non-point source pollution and green growth: Interaction and spatial spillover. Environ. Sci. Pollut. Res. 2022, 29, 60278–60288. [Google Scholar] [CrossRef] [PubMed]
- Geng, R.; Sharpley, A.N. A novel spatial optimization model for achieve the trad-offs placement of best management practices for agricultural non-point source pollution control at multi-spatial scales. J. Clean Prod. 2019, 234, 1023–1032. [Google Scholar] [CrossRef]
- Peng, S.; He, Y.; Yang, S.; Xu, J. Effect of controlled irrigation and drainage on nitrogen leaching losses from paddy fields. Paddy Water Environ. 2015, 13, 1–10. [Google Scholar] [CrossRef]
- Liu, W.; Yang, H.; Ciais, P.; Stamm, C.; Schulin, R. Integrative crop-soil-management modeling to assess global phosphorus losses from major crop cultivations. Glob. Biogeochem. Cycles 2018, 32, 1074–1086. [Google Scholar] [CrossRef]
- Fu, J.; Jian, Y.; Wu, Y.; Chen, D.; Zhao, X.; Ma, Y.; Niu, S.; Wang, Y.; Zhang, F.; Xu, C.; et al. Nationwide estimates of nitrogen and phosphorus losses via runoff from rice paddies using data-constrained model simulations. J. Clean Prod. 2021, 279, 123642. [Google Scholar] [CrossRef]
- Qiao, J.; Yang, L.; Yan, T.; Xue, F.; Zhao, D. Nitrogen fertilizer reduction in rice production for two consecutive years in the Taihu Lake area. Agric. Ecosyst. Environ. 2012, 146, 103–112. [Google Scholar] [CrossRef]
- Reidsma, P.; Feng, S.; Loon, M.V.; Luo, X.; Kang, C.; Lubbers, M.; Kanellopoulos, A.; Wolf, J.; Ittersum, M.K.V.; Qu, F. Integrated assessment of agricultural land use policies on nutrient pollution and sustainable development in Taihu Basin, China. Environ. Sci. Policy 2012, 18, 66–76. [Google Scholar] [CrossRef]
- Chen, X.; He, G.; Liu, X.; Li, B.; Peng, W.; Dong, F.; Huang, A.; Wang, W.; Lian, Q. Sub-Watershed Parameter Transplantation Method for Non-Point Source Pollution Estimation in Complex Underlying Surface Environment. Land 2021, 10, 1387. [Google Scholar] [CrossRef]
- Cui, N.; Cai, M.; Zhang, X.; Abdelhafez, A.A.; Zhou, L.; Sun, H.; Chen, G.; Zou, G.; Zhou, S. Runoff loss of nitrogen and phosphorus from a rice paddy field in the east of China: Effects of long-term chemical N fertilizer and organic manure applications. Glob. Ecol. Conserv. 2020, 22, e01011. [Google Scholar] [CrossRef]
- Ruan, S.; Zhuang, Y.; Zhang, L.; Li, S.; Chen, J.; Wen, W.; Zhai, L.; Liu, H.; Du, Y. Improved estimation of nitrogen dynamics in paddy surface water in China. J. Environ. Manag. 2022, 312, 114932. [Google Scholar] [CrossRef]
- Liao, Y.; He, J.; Su, B.; Dou, J.; Xu, Y.; Li, L. Validation of an in-situ observation method for nonpoint source pollution in paddy fields: A case study of a Beijing paddy field. Water 2021, 13, 3235. [Google Scholar] [CrossRef]
- Xin, Y.; Liu, G.; Xie, Y.; Gao, Y.; Liu, B.; Shen, B. Effects of soil conservation practices on soil losses from slope farmland in northeastern China using runoff plot data. Catena 2019, 174, 417–424. [Google Scholar] [CrossRef]
- Cherobim, V.F.; Huang, C.-H.; Favaretto, N. Tillage system and time post-liquid dairy manure: Effects on runoff, sediment and nutrients losses. Agric. Water Manag. 2017, 184, 96–103. [Google Scholar] [CrossRef]
- Choi, J.D.; Park, W.J.; Park, K.W.; Lim, K.J. Feasibility of SRI methods for reduction of irrigation and NPS pollution in Korea. Paddy Water Environ. 2013, 11, 241–248. [Google Scholar] [CrossRef]
- Huang, N.B.; Su, B.L.; Li, R.R.; Yang, W.Z.; Shen, M.M. A field-scale observation method for non-point source pollution of paddy fields. Agric. Water Manag. 2014, 146, 305–313. [Google Scholar] [CrossRef]
- Xu, Y.; Su, B.; Wang, H.; He, J.; Yang, Y. Analysis of the water balance and the nitrogen and phosphorus runoff pollution of a paddy field in situ in the Taihu Lake basin. Paddy Water Environ. 2020, 18, 385–398. [Google Scholar] [CrossRef]
- Phong, T.K.; Nguyen, M.H.T.; Komany, S.; Vu, S.H.; Watanabe, H. Alternative water management for controlling simetryn and thiobencarb runoff from paddy fields. Bull. Environ. Contam. Toxicol. 2006, 77, 375–382. [Google Scholar] [CrossRef]
- Liu, B.; Ding, M.; Shaham, S.; Rahayu, W.; Farokhi, F.; Lin, Z. When machine learning meets privacy: A survey and outlook. ACM Comput. Surv. 2021, 54, 1–36. [Google Scholar] [CrossRef]
- Sun, S.; Cao, Z.; Zhu, H.; Zhao, J. A survey of optimization methods from a machine learning perspective. IEEE Trans. Cybern. 2020, 50, 3668–3681. [Google Scholar] [CrossRef] [PubMed]
- Khepar, S.D.; Yadav, A.K.; Sondhi, S.K.; Siag, M. Water balance model for paddy fields under intermittent irrigation practices. Irrig. Sci. 2000, 19, 199–208. [Google Scholar] [CrossRef]
- Tsubo, M.; Shu, F.; Basnayake, J.; Tuong, T.P.; Bouman, B.; Harnpichitvitaya, D. Estimating percolation and lateral water flow on sloping land in rainfed lowland rice ecosystem. Plant. Prod. Sci. 2005, 8, 354–357. [Google Scholar] [CrossRef]
- Zhao, X.; Zhou, Y.; Wang, S.; Xing, G.; Shi, W.; Xu, R.; Zhu, Z. Nitrogen balance in a highly fertilized rice–wheat double-cropping system in southern China. Soil Sci. Soc. Am. J. 2012, 76, 1068. [Google Scholar] [CrossRef]
- Wang, W.; Liang, T.; Wang, L.; Liu, Y.; Wang, Y. The effects of fertilizer applications on runoff loss of phosphorus. Environ. Earth Sci. 2013, 68, 1313–1319. [Google Scholar] [CrossRef]
- Allen, R.G.; Pereira, L.S.; Raes, D.; Smith, M. Crop evapotranspiration: Guidelines for computing crop water requirements. Fao Irrig. Drain. Pap. 1998, 56, 300. [Google Scholar]
- Xu, Y.; Su, B.; Wang, H.; He, J. A new method for indirectly estimating infiltration of paddy fields in situ. Proc. Int. Assoc. Hydrol. Sci. 2018, 379, 205–210. [Google Scholar] [CrossRef]
- Li, S.; Liu, H.; Zhang, L.; Li, X.; Wang, H.; Zhuang, Y.; Zhang, F.; Zhai, L.; Fan, X.; Hu, W.; et al. Potential nutrient removal function of naturally existed ditches and ponds in paddy regions: Prospect of enhancing water quality by irrigation and drainage management. Sci. Total Environ. 2020, 718, 137418. [Google Scholar] [CrossRef]
- Zhao, X.; Zhou, Y.; Min, J.; Wang, S.; Shi, W.; Xing, G. Nitrogen runoff dominates water nitrogen pollution from rice-wheat rotation in the Taihu Lake region of China. Agric. Ecosyst. Environ. 2012, 156, 1–11. [Google Scholar] [CrossRef]
- Liu, L.; Ouyang, W.; Liu, H.; Zhu, J.; Ma, Y.; Wu, Q.; Chen, J.; Zhang, D. Potential of paddy drainage optimization to water and food security in China. Resour. Conserv. Recycl. 2021, 171, 105624. [Google Scholar] [CrossRef]
- Liu, J.; Ouyang, X.; Shen, J.; Li, Y.; Sun, W.; Jiang, W.; Wu, J. Nitrogen and phosphorus runoff losses were influenced by chemical fertilization but not by pesticide application in a double rice-cropping system in the subtropical hilly region of China. Sci. Total Environ. 2020, 715, 136852. [Google Scholar] [CrossRef] [PubMed]
- Chen, Q.; Xi, Y.; Wang, L.; Li, Y.; Zhang, C.; Tian, W.; Tian, R.; Xiao, X.; Zhao, K. Characteristics of nitrogen and phosphorus runoff losses in organic and conventional rice-wheat rotation farmland in Taihu Lake Region. J. Ago-Enironment Sci. 2016, 35, 1550–1558, (In Chinese with English Abstract). [Google Scholar]
- Tian, Y.H.; Yin, B.; Yang, L.Z.; Yin, S.X.; Zhu, Z.L. Nitrogen runoff and leaching losses during rice-wheat rotations in Taihu Lake region, China. Pedosphere 2007, 17, 445–456. [Google Scholar] [CrossRef]
- Zhan, X.; Zhang, Q.; Zhang, H.; Hussain, H.A.; Yang, Z. Pathways of nitrogen loss and optimized nitrogen management for a rice cropping system in arid irrigation region, northwest China. J. Environ. Manag. 2020, 268, 110702. [Google Scholar]
- Chen, D.; Dahlgren, R.A.; Shen, Y.; Lu, J. A Bayesian approach for calculating variable total maximum daily loads and uncertainty assessment. Sci. Total Environ. 2012, 430, 59–67. [Google Scholar] [CrossRef]
- Zhang, Y.; Wu, H.; Yao, M.; Zhou, J.; Wu, K.; Hu, M.; Shen, H.; Chen, D. Estimation of nitrogen runoff loss from croplands in the Yangtze River Basin: A meta-analysis. Environ. Pollut. 2021, 272, 116001. [Google Scholar] [CrossRef]
- Liu, L.; Ouyang, W.; Liu, H.; Zhu, J.; Fan, X.; Zhang, F.; Ma, Y.; Chen, J.; Hao, F.; Lian, Z. Drainage optimization of paddy field watershed for diffuse phosphorus pollution control and sustainable agricultural development. Agric. Ecosyst. Environ. 2021, 308, 107238. [Google Scholar] [CrossRef]
- Wang, J.; Wang, D.; Zhang, G.; Wang, Y.; Wang, C.; Teng, Y.; Christie, P. Nitrogen and phosphorus leaching losses from intensively managed paddy fields with straw retention. Agric. Water Manag. 2014, 141, 66–73. [Google Scholar] [CrossRef]
- Ouyang, W.; Wu, Y.; Hao, Z.; Zhang, Q.; Bu, Q.; Gao, X. Combined impacts of land use and soil property changes on soil erosion in a mollisol area under long-term agricultural development. Sci. Total Environ. 2018, 613, 798–809. [Google Scholar] [CrossRef]
- Zhao, X.; Xie, Y.X.; Xiong, Z.Q.; Yan, X.Y.; Xing, G.X.; Zhu, Z.L. Nitrogen fate and environmental consequence in paddy soil under rice-wheat rotation in the Taihu lake region, China. Plant Soil 2009, 319, 225–234. [Google Scholar] [CrossRef]
- Yang, W. Modeling Of Hydrological and Nitrogen Processes for Paddy Field; Beijing Normal University: Beijing, China, 2013; (In Chinese with English Abstract). [Google Scholar]
- Ouyang, W.; Wei, P.; Gao, X.; Srinivasan, R.; Yen, H.; Xie, X.; Liu, L.; Liu, H. Optimization of SWAT-Paddy for modeling hydrology and diffuse pollution of large rice paddy fields. Environ. Model. Softw. 2020, 130, 104736. [Google Scholar] [CrossRef]
- Tan, X.; Shao, D.; Liu, H.; Yang, F.; Xiao, C.; Yang, H. Effects of alternate wetting and drying irrigation on percolation and nitrogen leaching in paddy fields. Paddy Water Environ. 2013, 11, 381–395. [Google Scholar] [CrossRef]
- Ye, Y.; Liang, X.; Chen, Y.; Liu, J.; Gu, J.; Guo, R.; Li, L. Alternate wetting and drying irrigation and controlled-release nitrogen fertilizer in late-season rice. Effects on dry matter accumulation, yield, water and nitrogen use. Field Crops Res. 2013, 144, 212–224. [Google Scholar] [CrossRef]
- Zhang, S.; Zhang, G.; Wang, D.; Liu, Q. Long-term straw return with N addition alters reactive nitrogen runoff loss and the bacterial community during rice growth stages. J. Environ. Manag. 2021, 292, 112772. [Google Scholar] [CrossRef] [PubMed]
- Karandish, F.; Darzi-Naftchali, A.; Asgari, A. Application of machine-learning models for diagnosing health hazard of nitrate toxicity in shallow aquifers. Paddy Water Environ. 2017, 15, 201–215. [Google Scholar] [CrossRef]
- Azimi, S.; Azhdary, M.M.; Hashemi, M. Prediction of annual drinking water quality reduction based on Groundwater Resource Index using the artificial neural network and fuzzy clustering. J. Contam. Hydrol. 2019, 220, 6–17. [Google Scholar] [CrossRef]
- Shan, W.; Cai, S.; Liu, C. A new comprehensive evaluation method for water quality: Improved fuzzy support vector machine. Water 2018, 10, 1303. [Google Scholar] [CrossRef]
- Xu, J.; Xu, Z.; Kuang, J.; Lin, C.; Xiao, L.; Huang, X.; Zhang, Y. An alternative to laboratory testing: Random forest-based water quality prediction framework for inland and nearshore water bodies. Water 2021, 13, 3262. [Google Scholar] [CrossRef]
- Tiyasha; Tung, T.M.; Yaseen, Z.M. A survey on river water quality modelling using artificial intelligence models: 2000–2020. J. Hydrol. 2020, 585, 124670. [Google Scholar] [CrossRef]
- Modaresi, F.; Araghinejad, S. A comparative assessment of support vector machines, probabilistic neural networks, and k-nearest neighbor algorithms for water quality classification. Water Resour. Manag. 2014, 28, 4095–4111. [Google Scholar] [CrossRef]
- Chen, Y.; Song, L.; Liu, Y.; Yang, L.; Li, D. A review of the artificial neural network models for water quality prediction. Appl. Sci. 2020, 10, 5776. [Google Scholar] [CrossRef]
- Rumelhart, D.; Hinton, G.E.; Williams, R.J. Learning representations by back propagating errors. Nature 1986, 323, 533–536. [Google Scholar] [CrossRef]
- Nour, M.H.; Smith, D.W.; El-Din, M.G.; Prepas, E.E. The application of artificial neural networks to flow and phosphorus dynamics in small streams on the Boreal Plain, with emphasis on the role of wetlands. Ecol. Model. 2006, 191, 19–32. [Google Scholar] [CrossRef]
- Tyralis, H.; Papacharalampous, G.; Langousis, A. A brief review of random forests for water scientists and practitioners and their recent history in water resources. Water 2019, 11, 910. [Google Scholar] [CrossRef]
- Breiman, L. Random forests. Mach. Learn. 2001, 45, 5–32. [Google Scholar] [CrossRef]
- Wu, G.; Li, L.; Ahmad, S.; Chen, X. A dynamic model for vulnerability assessment of regional water resources in arid areas: A case study of Bayingolin, China. Water Resour. Manag. 2013, 27, 3085–3101. [Google Scholar] [CrossRef]
- Zhang, L.; Wang, L.; Zhang, X.; Liu, S.; Sun, P.; Wang, T. The basic principle of random forest and its applications in ecology: A case study of Pinus yunnanensis. Acta Ecol. Sin. 2014, 34, 650–659, (In Chinese with English Abstract). [Google Scholar]
Publisher’s Note: MDPI stays neutral with regard to jurisdictional claims in published maps and institutional affiliations. |
© 2022 by the authors. Licensee MDPI, Basel, Switzerland. This article is an open access article distributed under the terms and conditions of the Creative Commons Attribution (CC BY) license (https://creativecommons.org/licenses/by/4.0/).