2.3.1. Motion Analysis Using Potential Program (1st-Stage)
In the first stage of the CMP model, motion analysis was conducted on the barge under wave conditions by applying the initial damping ratio using WAVELOAD-FD [
20], which is a potential-based analysis program of Lloyd’s Register. For the analysis, approximately 30,000 subsurface mesh cells were generated, as shown in
Figure 7, and the conditions of the motion analysis are listed in
Table 2. To calculate the motion RAO according to the wave direction, the directions were set at 30° intervals from 180° to 0°, and the frequency was set at 0.05 rad/s-intervals from 0.2 rad/s to 3.0 rad/s, based on the ABS Guidance Notes (2003) [
21]. In this study, a water depth of 20 m was applied, which was the average depth at the target sea site.
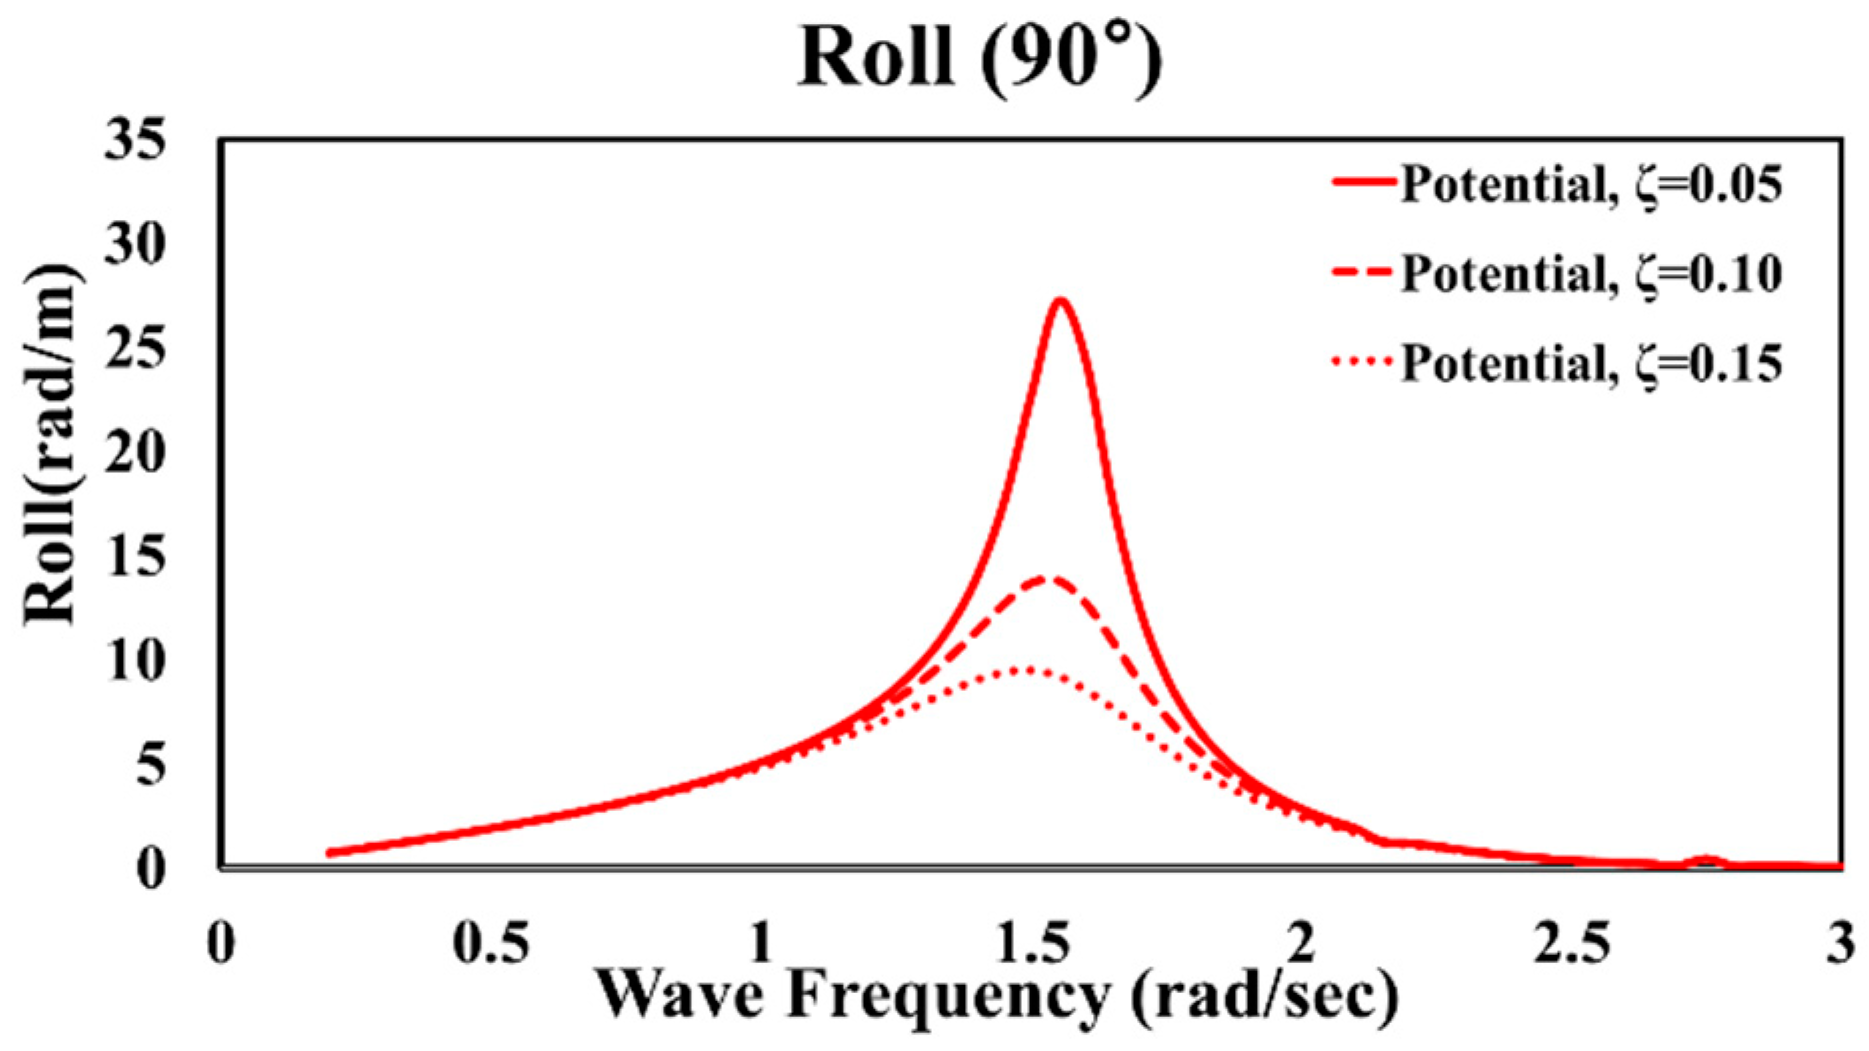
Hulls with a length greater than the width are significantly affected by viscosity during roll motion, which impacts hull stability. When using the potential program, the roll-damping ratio (ζ) must be applied to reflect the fluid viscous force in still water, which, however, cannot be reflected owing to the nature of potential-based analysis. The difference in the RAO motion was first confirmed in this study using three arbitrary damping ratios from 0.05 to 0.15, which is the range generally applied based on experience.
Figure 8 shows the RAO for the roll motion when different damping ratios are applied in the 90° wave direction. As observed, the degree of roll motion varies significantly with the damping ratio. Moreover, because pitch-damping ratios are not typically applied in motion analysis, the pitch was not considered in the initial motion analysis. However, in the CMP model procedure, the analysis results in the first stage, which apply the initial damping ratios for the roll and pitch motion, can be regarded as the primary results, which must be corrected by applying modified damping ratios in the third stage.
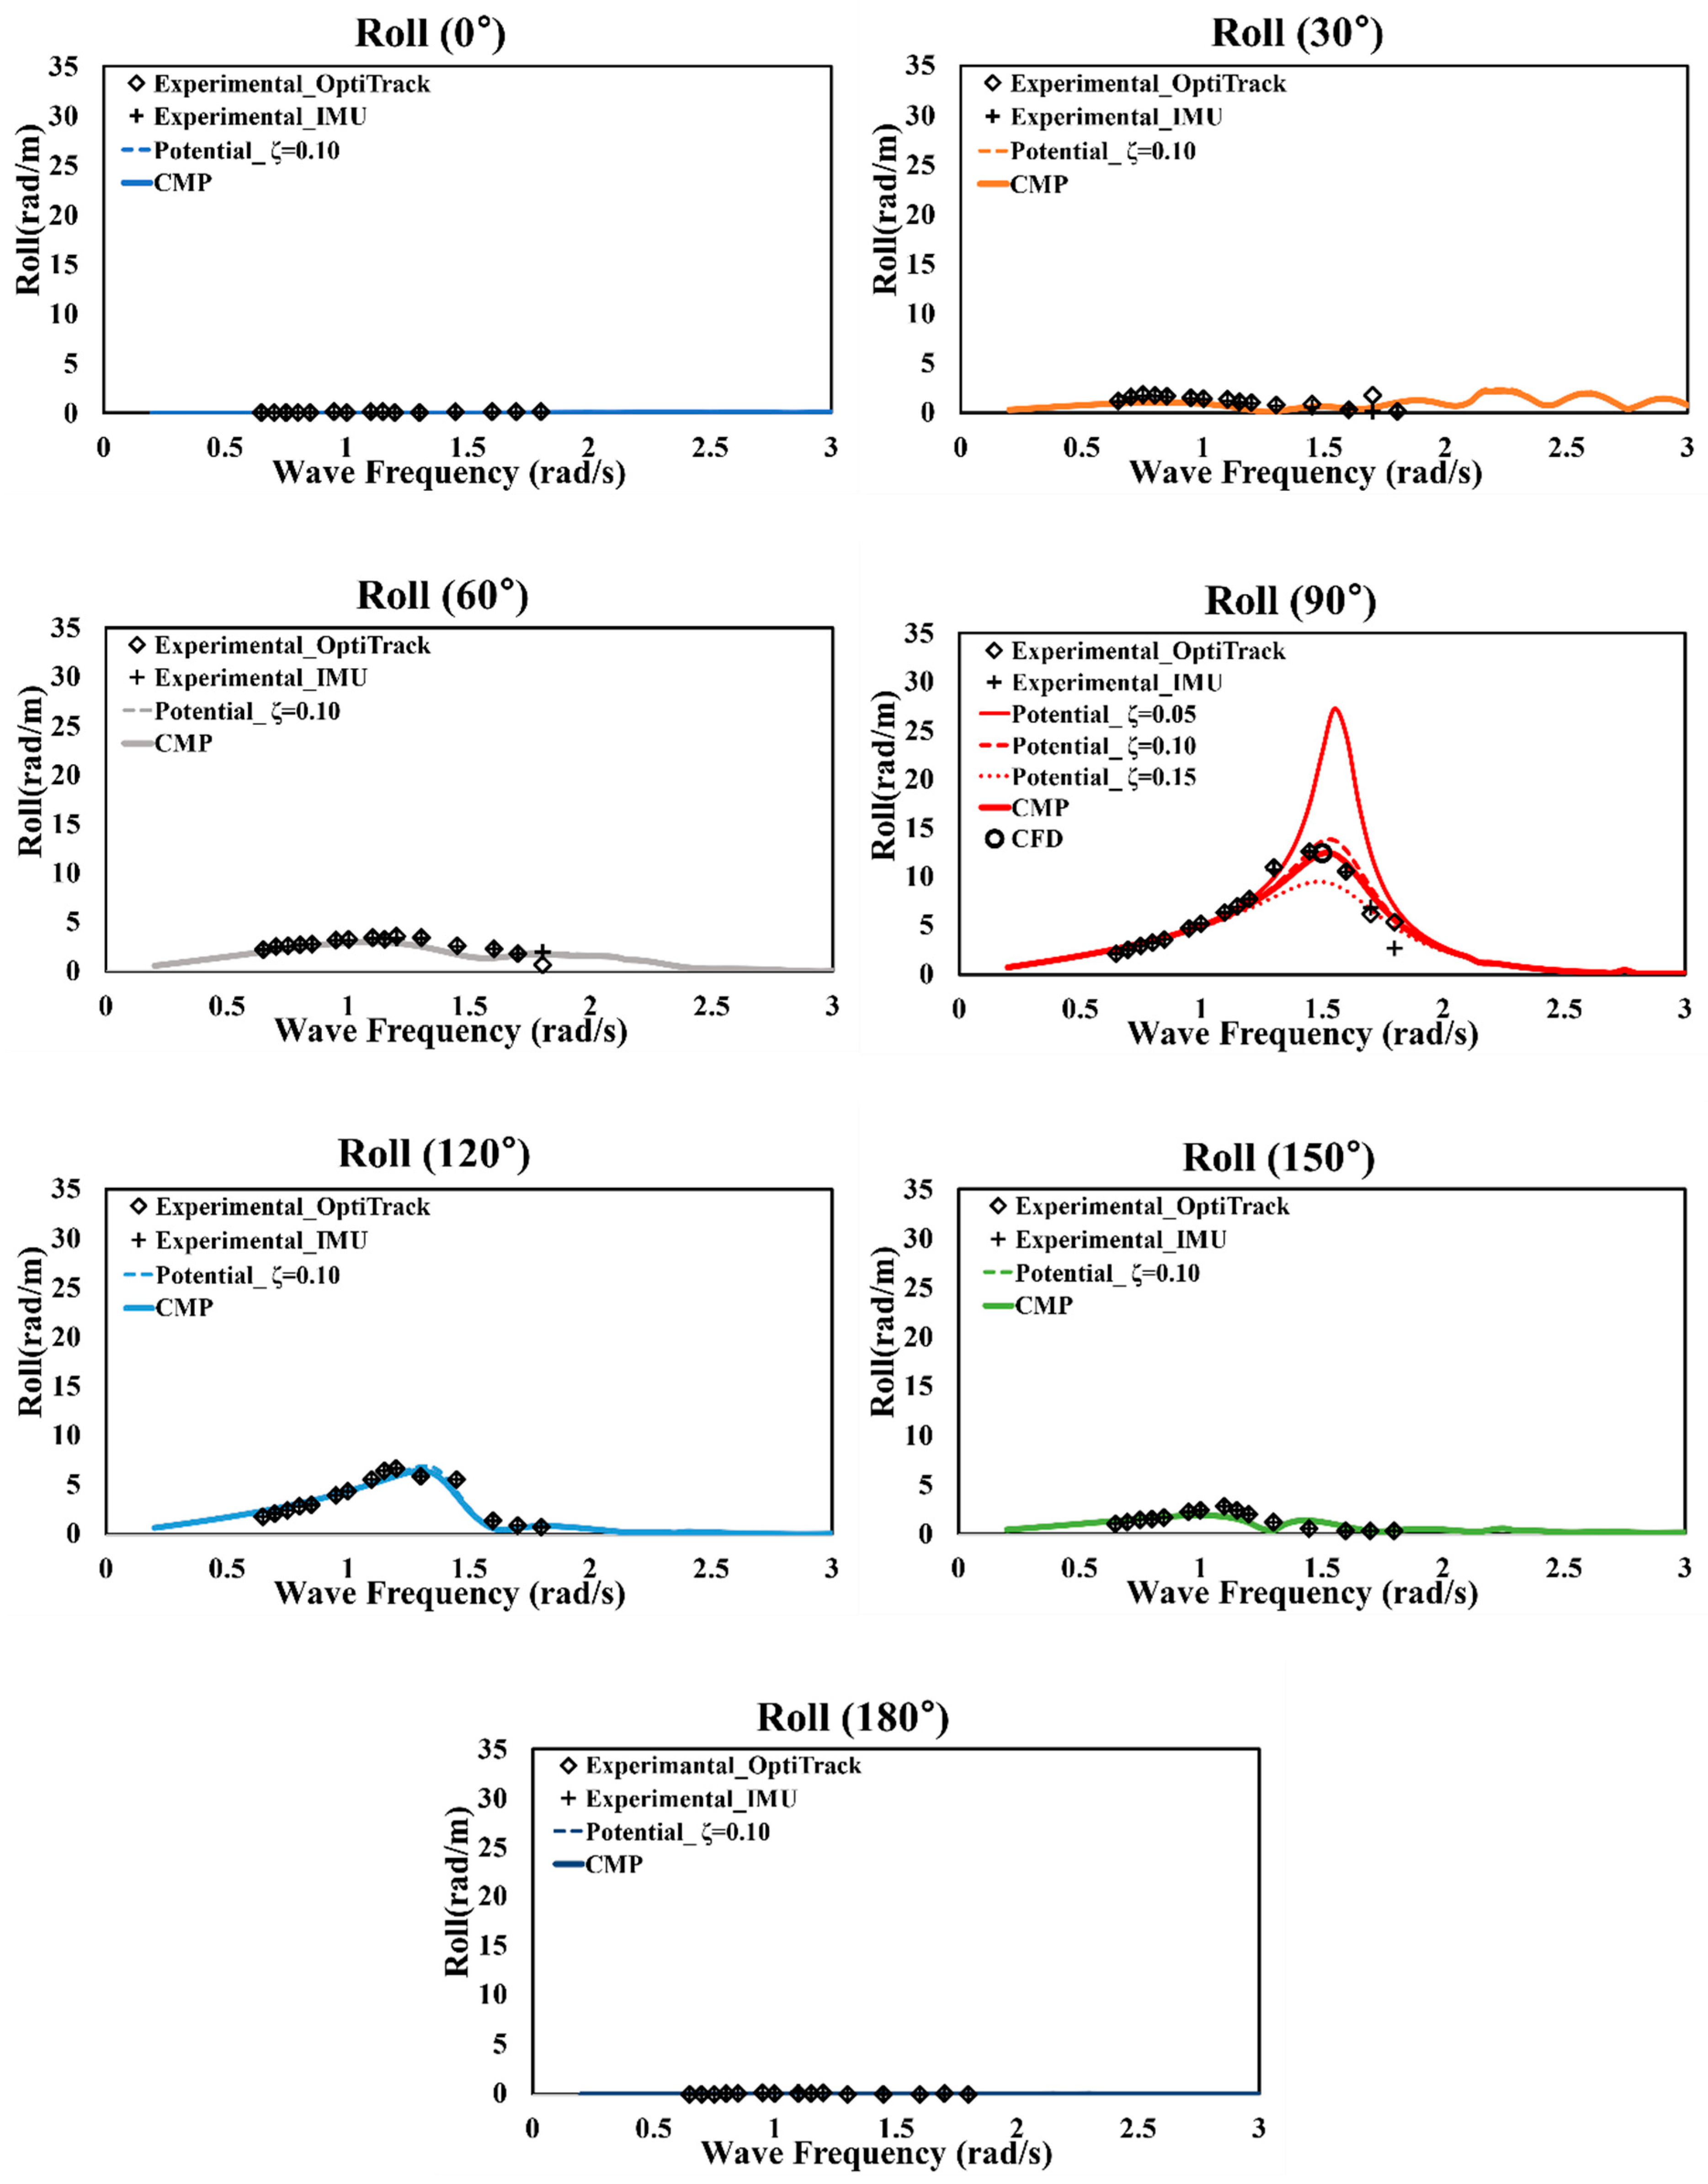
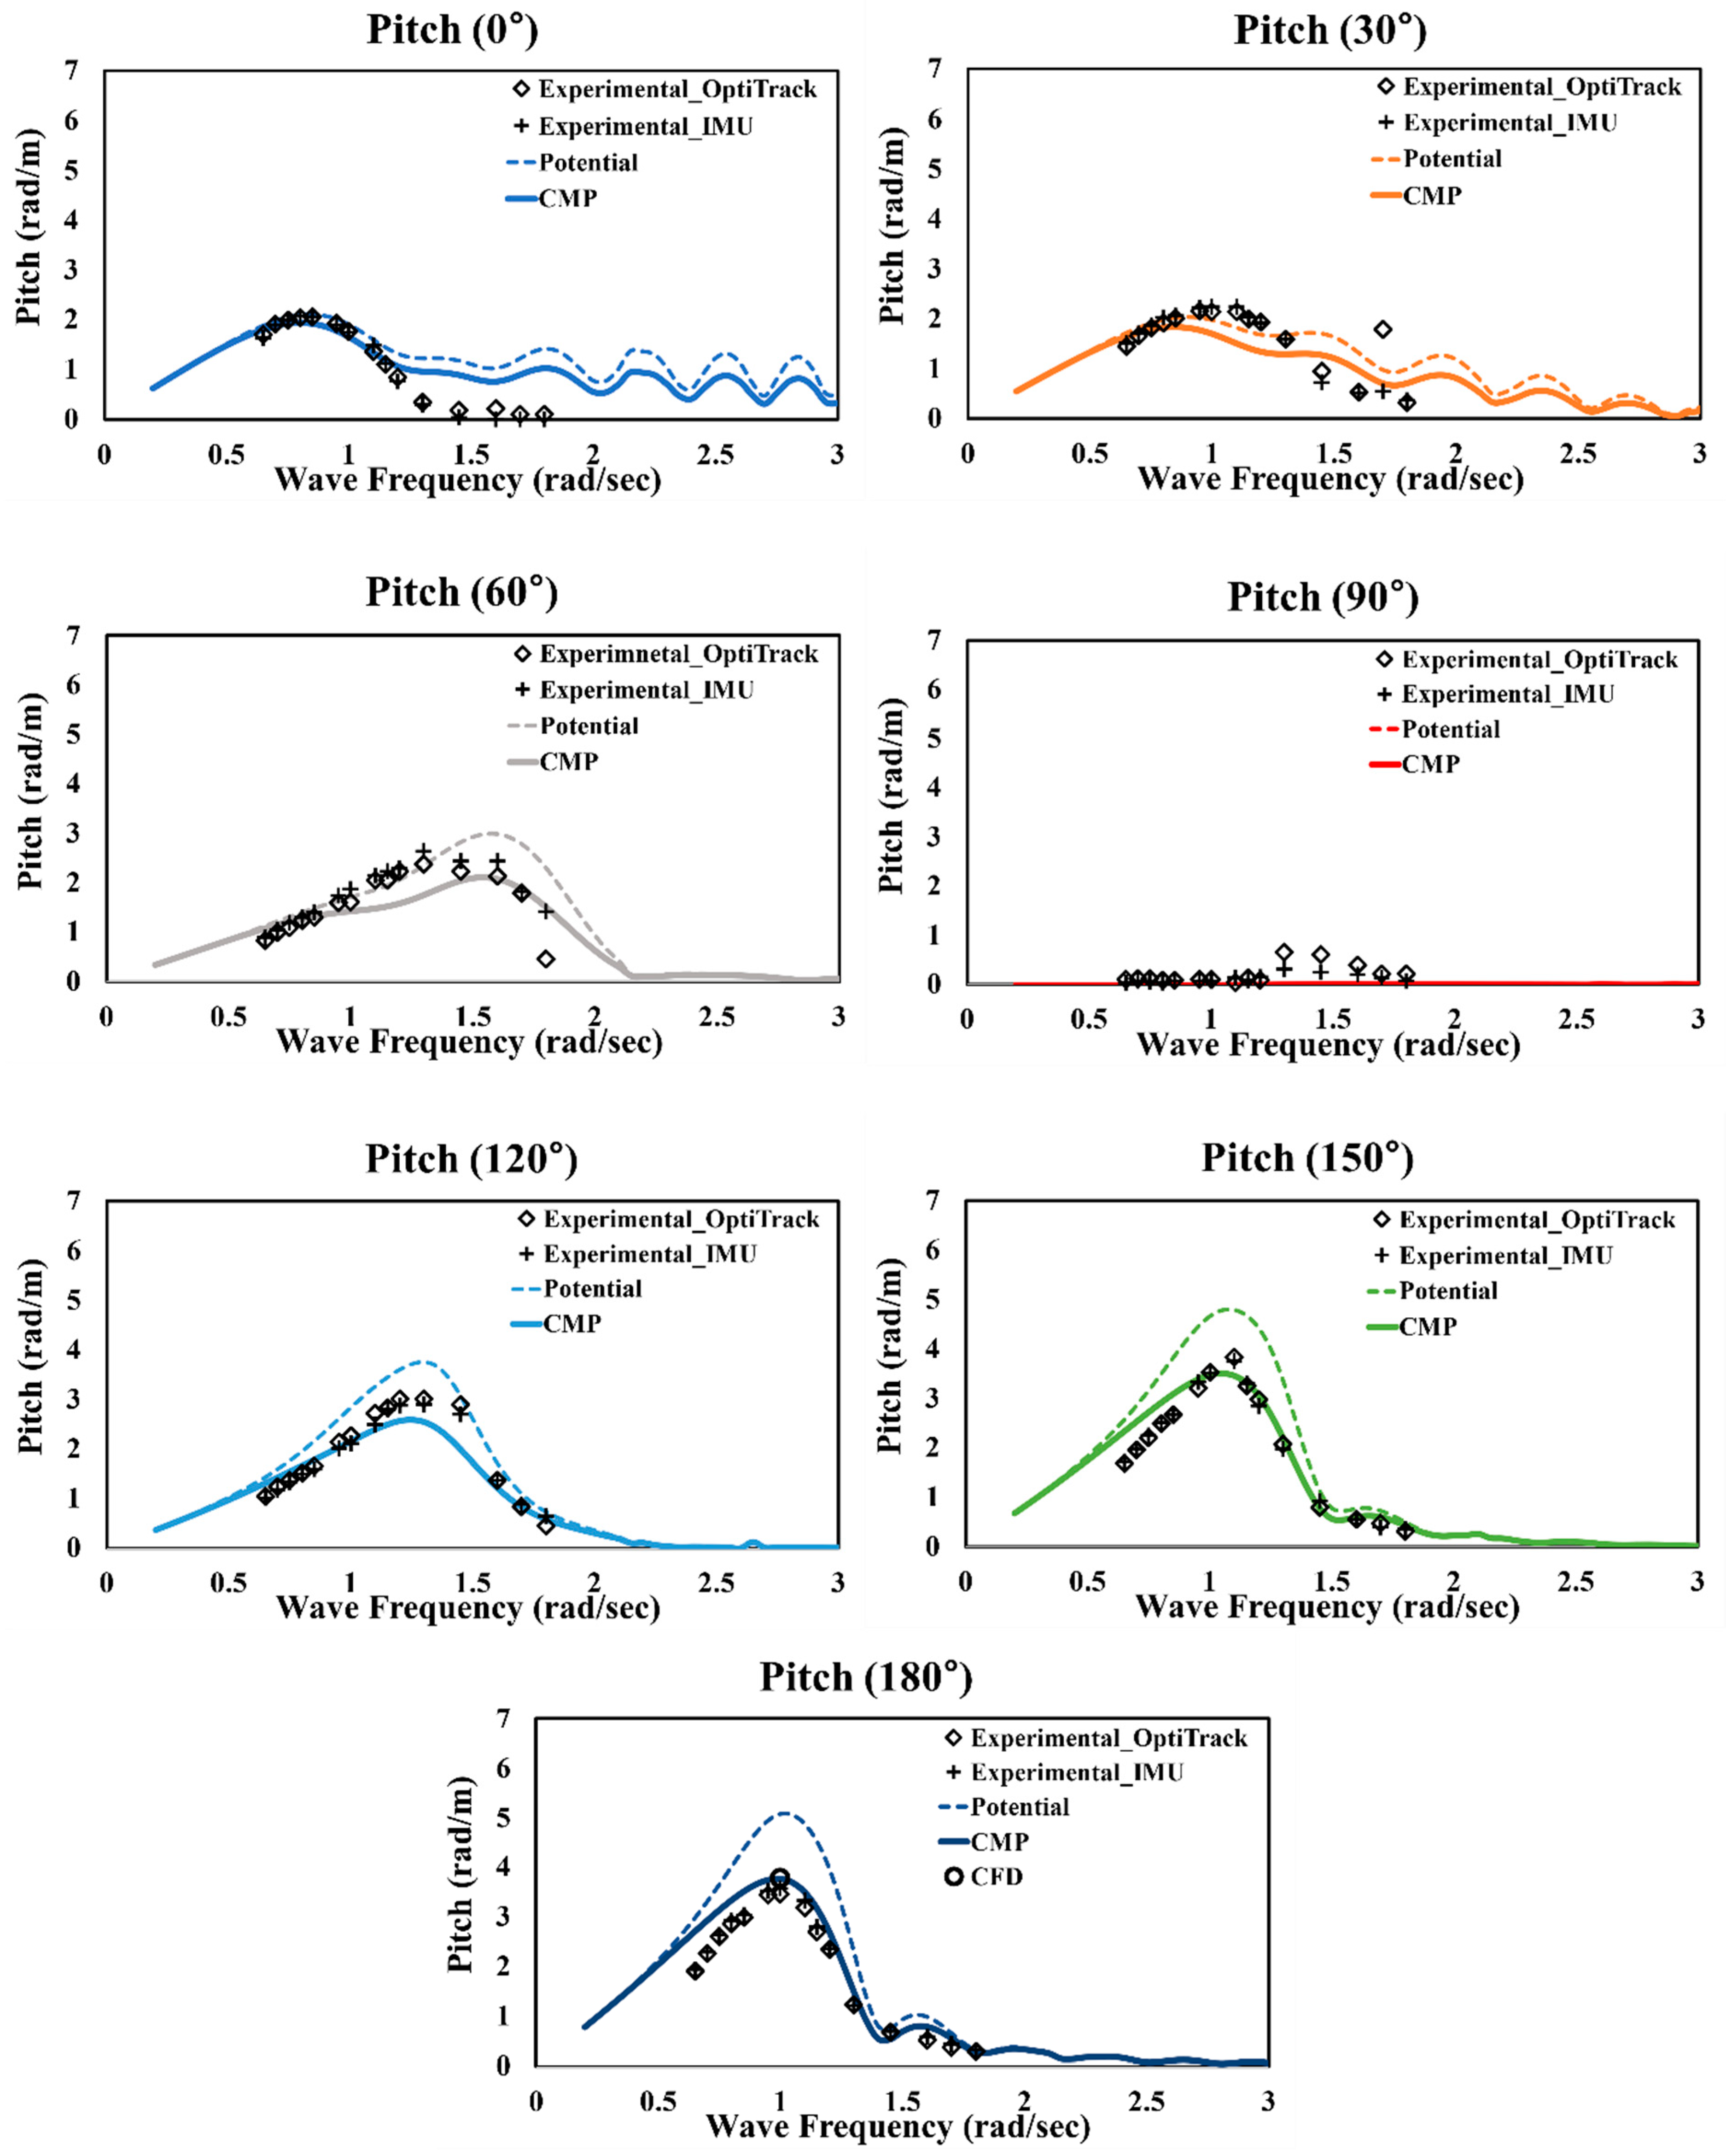
Figure 9 shows the initial RAO of the roll and pitch in each wave direction with an initial roll-damping ratio of 0.05. For roll, the largest motion occurs in a wave direction of 90°, and the corresponding natural frequency is 1.5 rad/s. For pitch, the largest RAO was observed at a frequency of 1.0 rad/s and a wave direction of 180°.
2.3.2. Motion Analysis Using CFD (2nd-Stage)
In the second stage, motion analysis is performed using CFD under operation conditions where the peak RAO occurs with reference to the results of the first stage. In this case, it is of paramount importance to guarantee sufficiently reliable and accurate CFD simulation results that can replace experiments. Therefore, we focused on ensuring the reliability of the CFD results through grid-convergence tests.
The commercial program STAR-CCM+15.02 (Siemens PLM Software, Plano, TX, USA) was used for the Reynolds-averaged Navier–Stokes (RaNS)-based CFD simulations. The numerical wave tank (NWT) concept used in the simulation is illustrated in
Figure 10. An overset mesh was employed inside the NWT to analyze the motion of the object; further, at the interface between the generated overset region and the NWT, physical quantities were exchanged in a least-square manner. The NWT used to reproduce the wave environment is fixed; however, the overset region around the hull expresses six-degrees-of-freedom (6-DOF) motion with respect to the hull’s center of gravity according to the hull’s dynamic behavior. The dynamic fluid body interaction (DFBI) model was used to express the 6-DOF hull behavior. This 6-DOF motion solver can calculate the new position of the ship by solving the equation of motion, which involves calculating the fluid force and moment acting on the ship.
For wave generation, as shown in
Figure 11, the velocity condition of the airy wave theory was imposed on all velocity inlet interfaces, and the wave forcing technique in STAR-CCM+ was introduced to the wave absorber used to suppress reflected waves [
22]. According to Kim et al. [
23], the wave forcing technique combines two methods—one that reduces the wave amplitude using the wave-damping coefficient in the wave-absorption area [
24,
25,
26] and the other that forces the reflected waves by mathematically harmonizing the wave information obtained from the linear wave theory in a given area between the waves inside the flow field and the given incident waves [
27,
28]. In this study, one wavelength (1.0λ) was set for all the velocity inlet interfaces to suppress the reflected waves as much as possible. For the simulation, the physical model was configured as shown in
Table 3 with reference to [
29]. A 2nd-order implicit unsteady solver for time and a 2nd-order upwind/central scheme solver for space were used as simulation solvers. The SST (Shear Stress Transport)
model was used as the turbulence model. The simulation was performed for 5 s with a time interval of 0.001 s.
For grid generation, a surface remesher and trimmed cell mesher were used, and a prism layer mesher was additionally used to implement the fluid viscosity effects close to the moving hull. Eight prism layers were used around the hull, and y+ was configured to be 4 or less.
As it is essential to guarantee the reliability of the CFD results, the grid convergence index (GCI) test, as defined by Roache [
30], was performed to evaluate the convergence due to the grid density.
Appendix B summarizes the GCI analysis process. This study conducted the grid convergence test for five grid sizes. Refinement factor
r was selected to be 1.33, and the base sizes were adjusted.
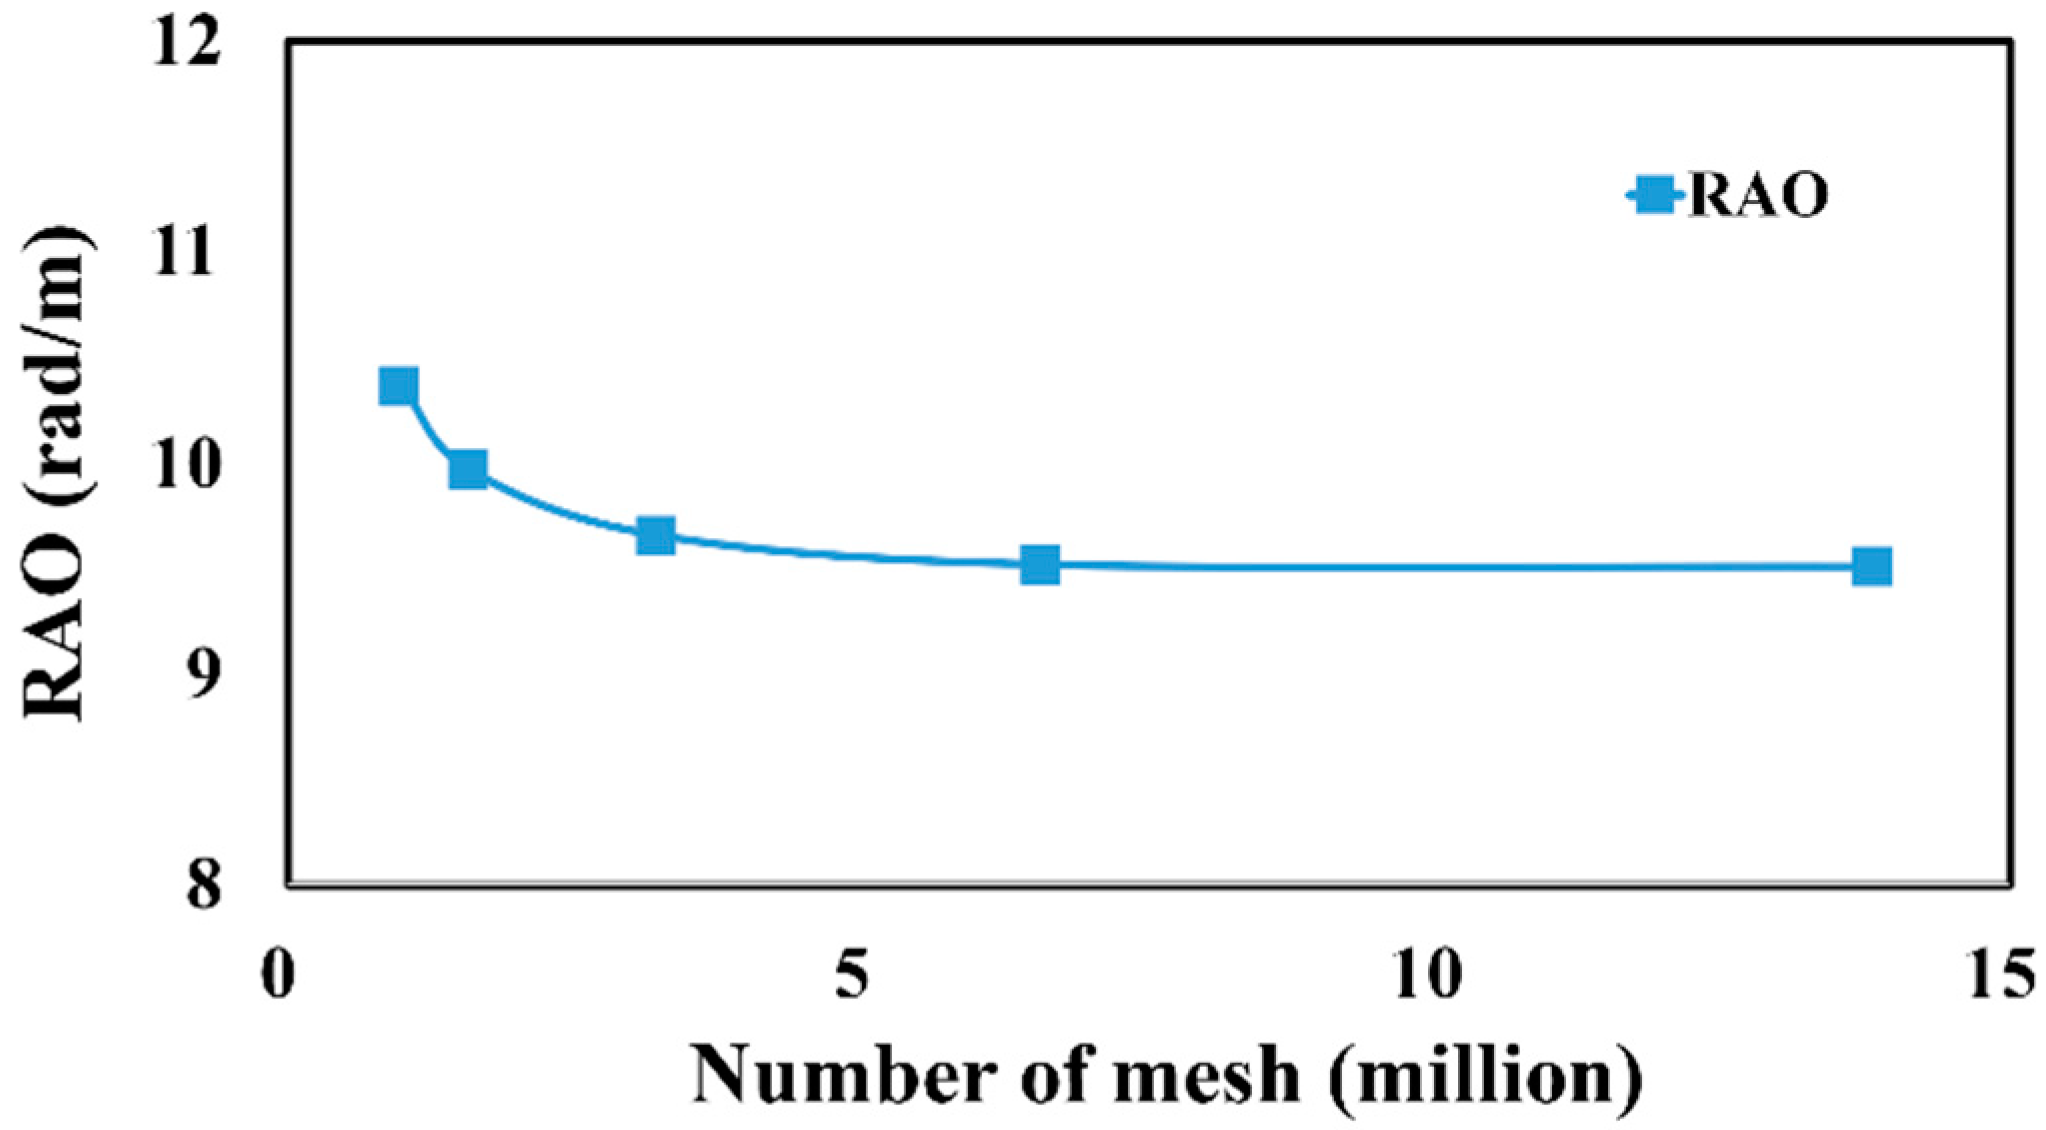
Table 4 and
Figure 12 show the total number of mesh cells for each case and their corresponding RAO values. According to the results, the RAO tended to converge to a constant value as the mesh became denser from mesh cases 1 to 5. To evaluate the results quantitatively, three mesh levels were combined to calculate the GCI as shown in
Table 5. Here, the recommended value of 1.25 was used as the safety factor.
shows the values of r, p, and GCI for four mesh levels: (1, 2, 3), (2, 3, 4), (3, 4, 5), and (1, 3, 5). For example,
(1, 2, 3) was calculated from the results of Case 5 (finest) and Case 4 (intermediate), and
(1, 2, 3) was calculated using the results of Case 4 (intermediate) and Case 3 (coarsest). Here,
and
as shown in the
Appendix B. The ratio is also shown to examine whether the result when h = 0 converges within an asymptotic range. According to the GCI analysis, both
and
exhibited the lowest mesh levels (3, 4, and 5). Hence, the mesh model used in Case 4 was selected, and motion analysis was conducted using approximately 6.5 million mesh cells.
The motion analysis using CFD for the vessel in operation was conducted under the wave direction and wave period conditions for which the RAOs for roll and pitch were maximized in the initial potential analysis results, as shown in
Figure 9, under the conditions listed in
Table 6. The current was considered by applying the advancing speed of the ship, which was satisfied by taking the inlet velocity of the fluid as 3.086 m/s in the STAR-CCM+.
2.3.3. Finding Modified Damping Ratio and RAO (3rd-Stage)
In the third step, iterative calculations were performed while correcting the damping ratio until the RAO obtained from the potential program became identical to that obtained from the CFD in the second step. In this step, the prerequisite should be assumed that the CFD results must be reliable and accurate values. In the iterative process, the damping ratio was modified based on the following process.
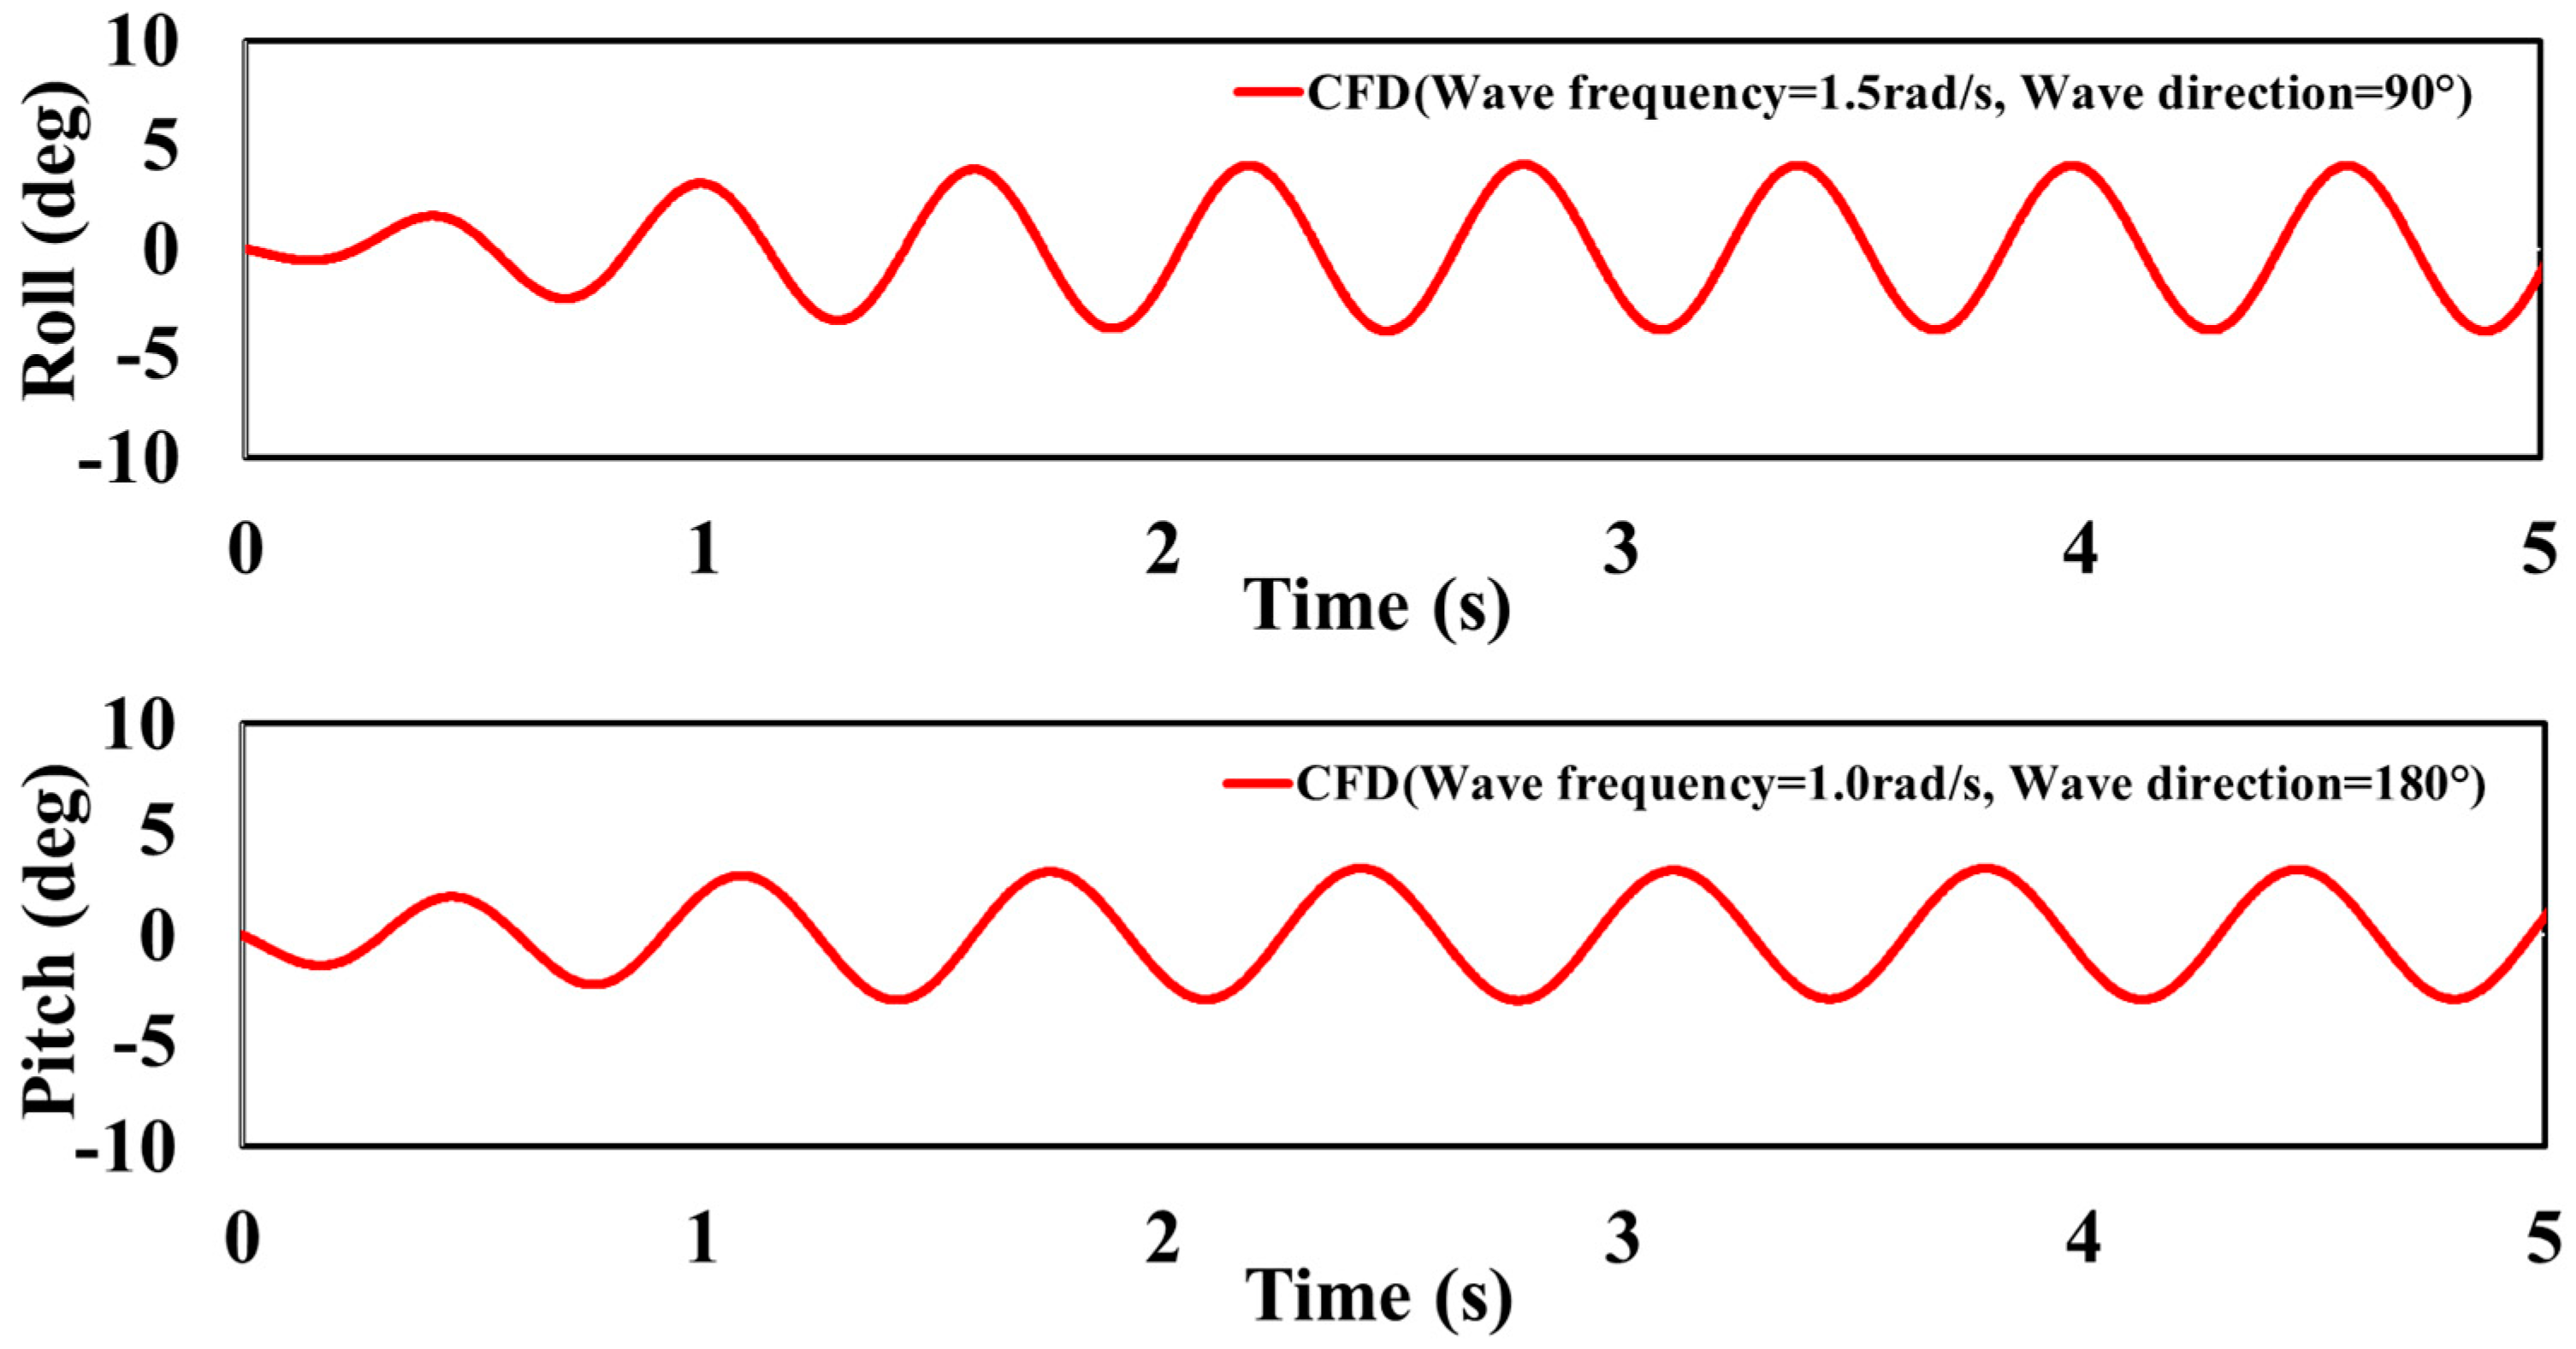
Figure 13 shows the time series of the CFD simulation results for the roll and pitch RAOs obtained from the second stage results. From these results, the mean value (radian) of the response amplitude when the motion reached a steady state, which was between 3 s and 5 s, was calculated. It was then divided by the wave amplitude under these conditions and converted into the RAO; that is, the response amplitude value per unit wave height was calculated.
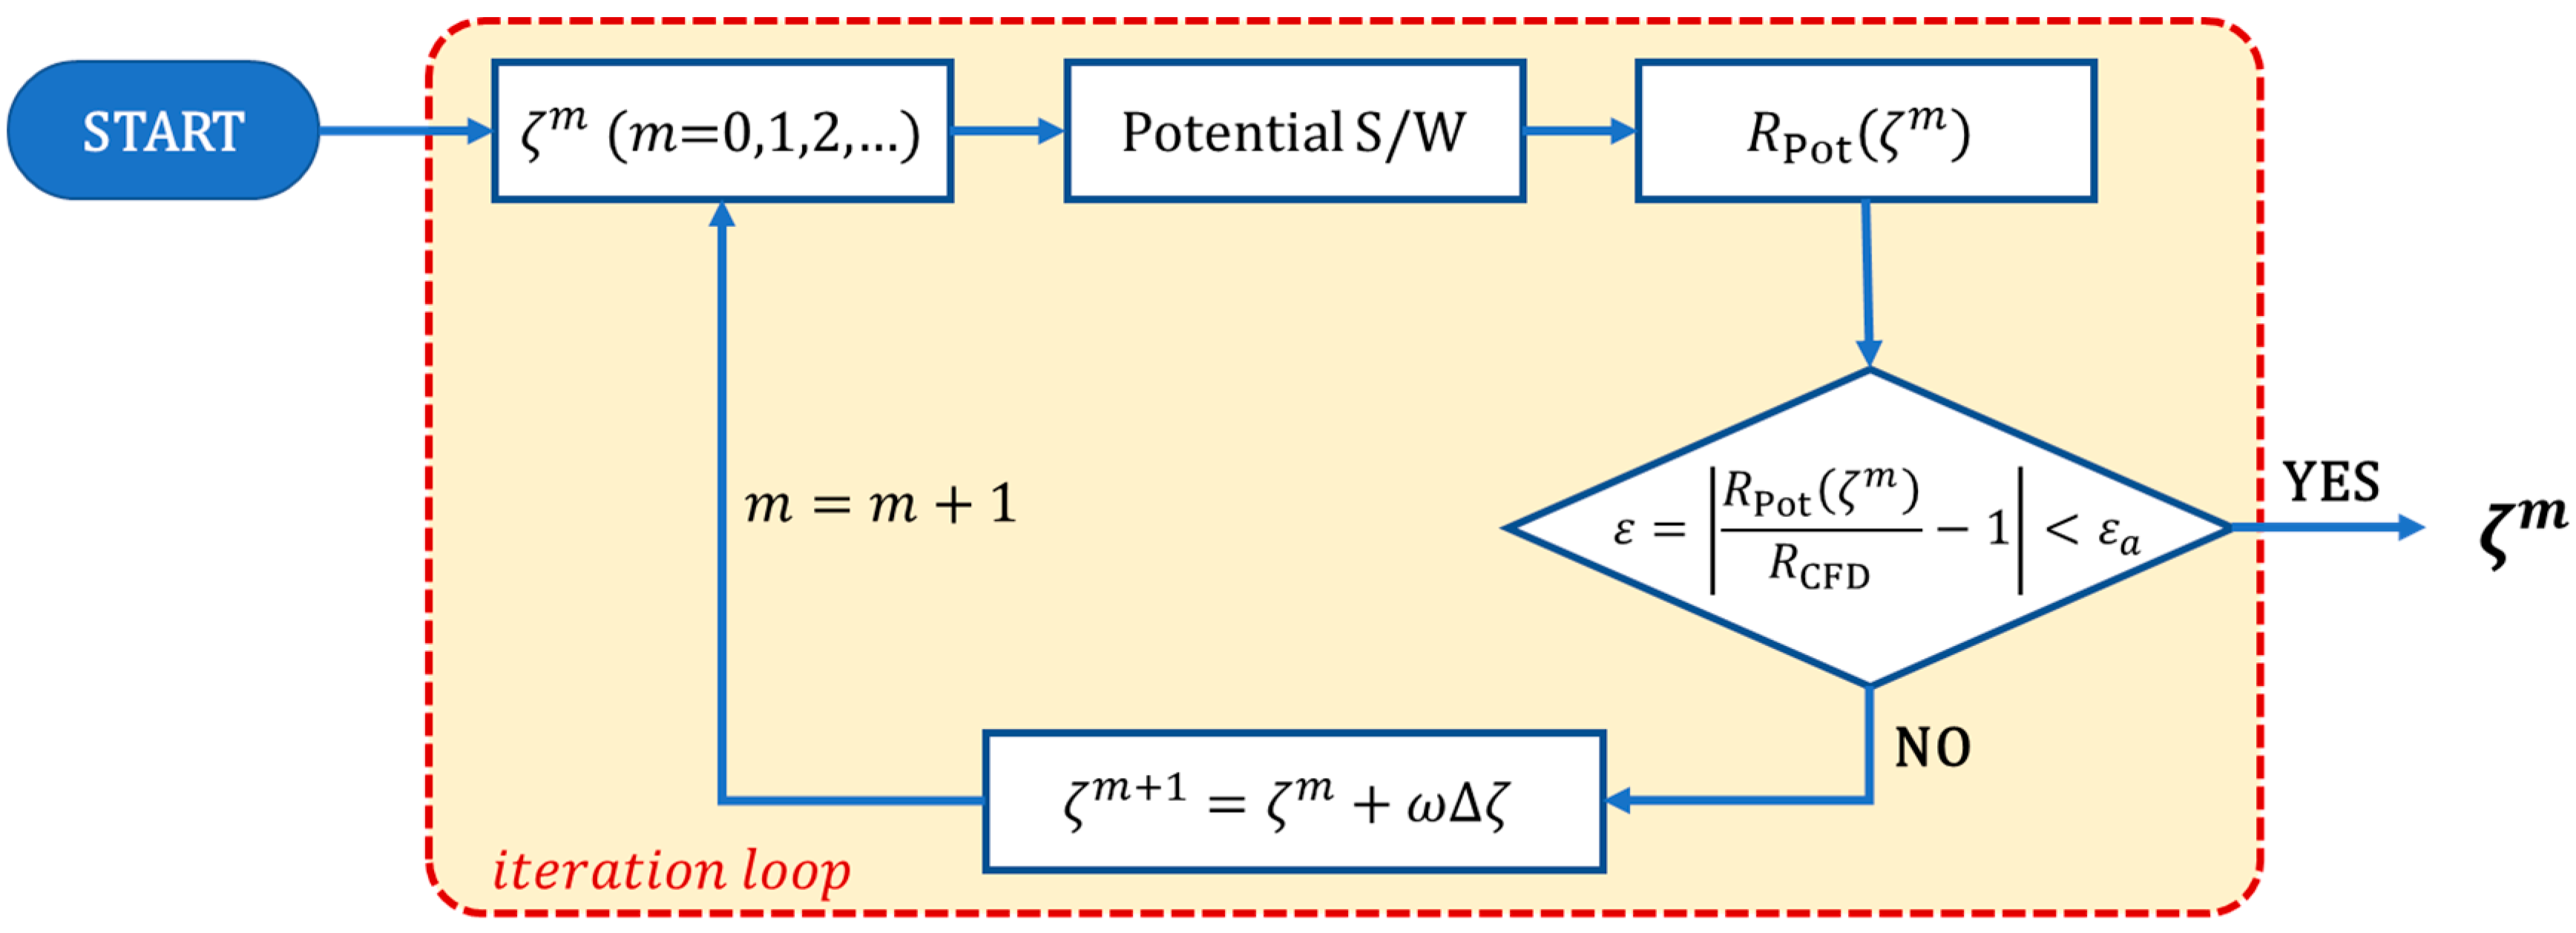
Table 7 summarizes these values. Finally, for the RAO calculated through CFD as an exact value, the input values for the damping ratio in the potential program were adjusted under the same conditions to determine the damping ratios for which the RAOs calculated by both methods become equal. The procedure for determining the final damping ratio is illustrated in
Figure 14. Here,
and
refer to RAOs derived through the potential analysis and CFD simulation, respectively. For example, firstly compare
with the initial damping ratio
to the
. If they do not match each other, the damping ratio is updated as
. Here,
means a relaxation factor between 0 and 1, and
is the correction. This process will be repeated iteratively until the difference of
and
reaches in a small error range
, and obtain the final
Table 8 shows the final damping ratios in each motion derived through iterative calculations.


