3.1. Chemical Compositions of Coal Gangue
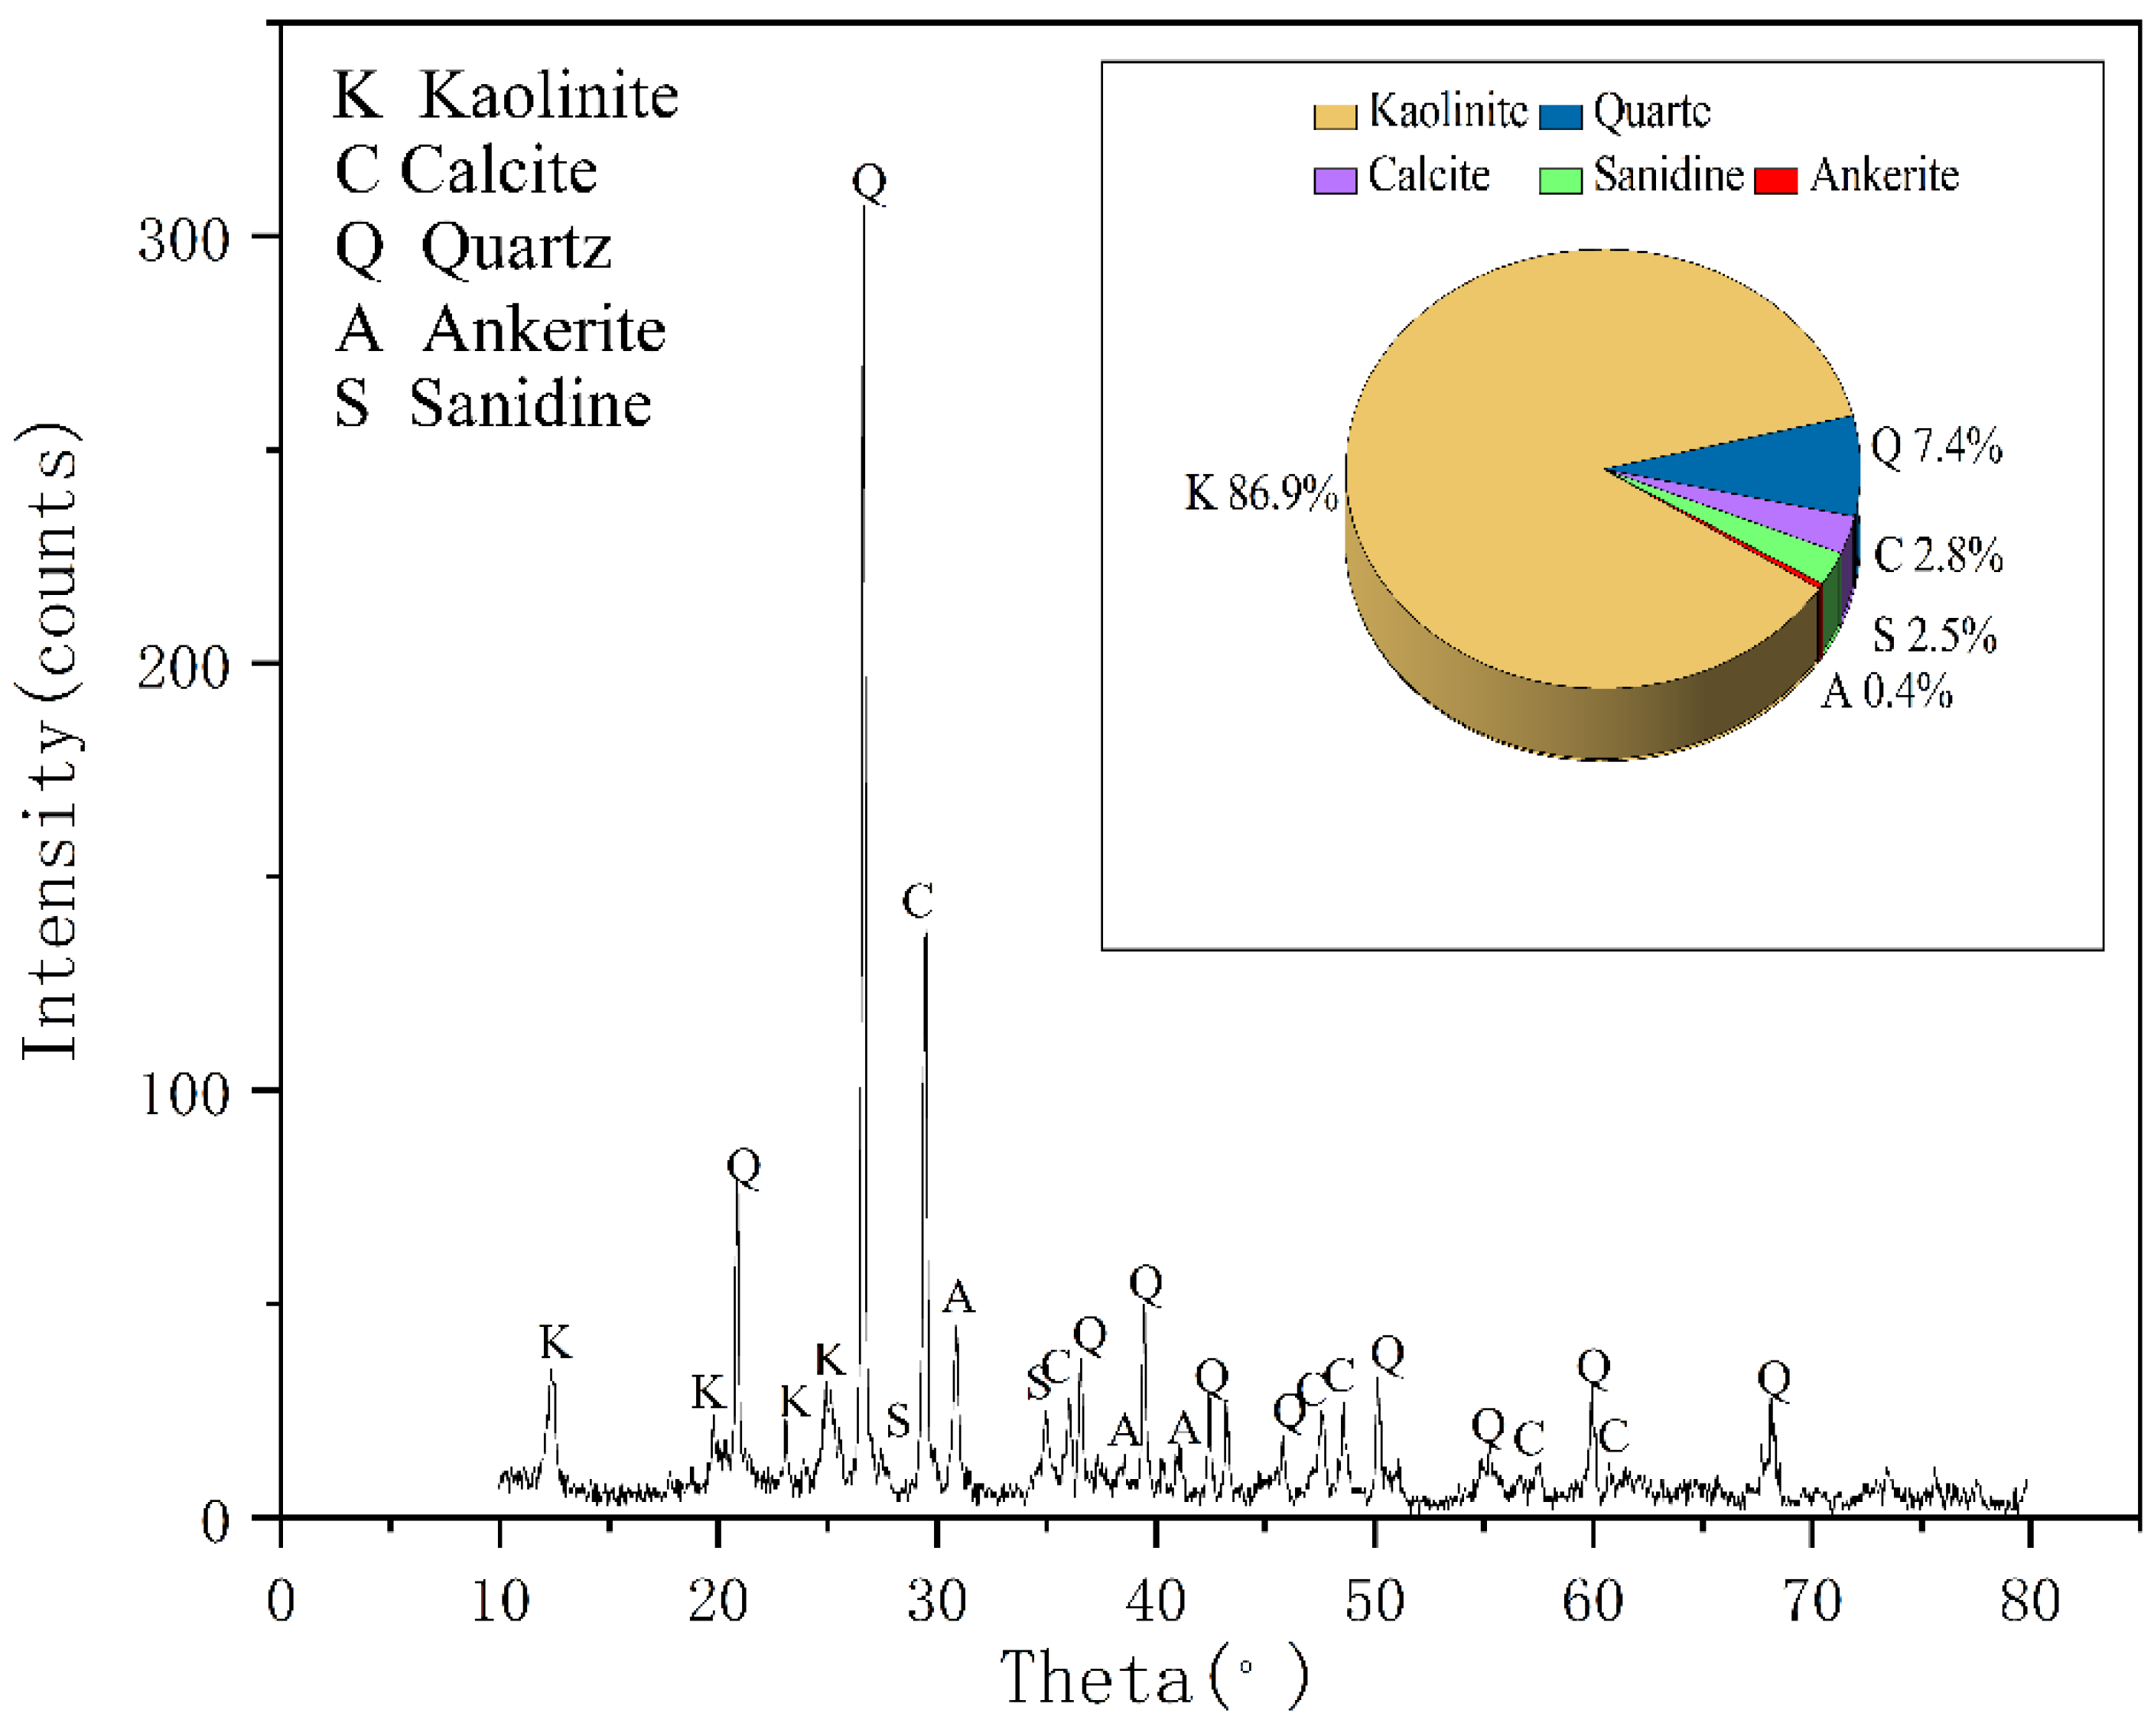
According to XRD analyses seen in
Figure 2, the main minerals of coal gangue are kaolinite and quartz, and its secondary minerals are kaolinite, ankerite, smectite, sanidine, illite, and muscovite. This result is consistent with the analysis report of Ju-ye coal exploration. In addition, according to the geological data of Juye Coal field [
21], this mine contains pyrite, but the possible content is less than 3% and has not been detected by XRD.
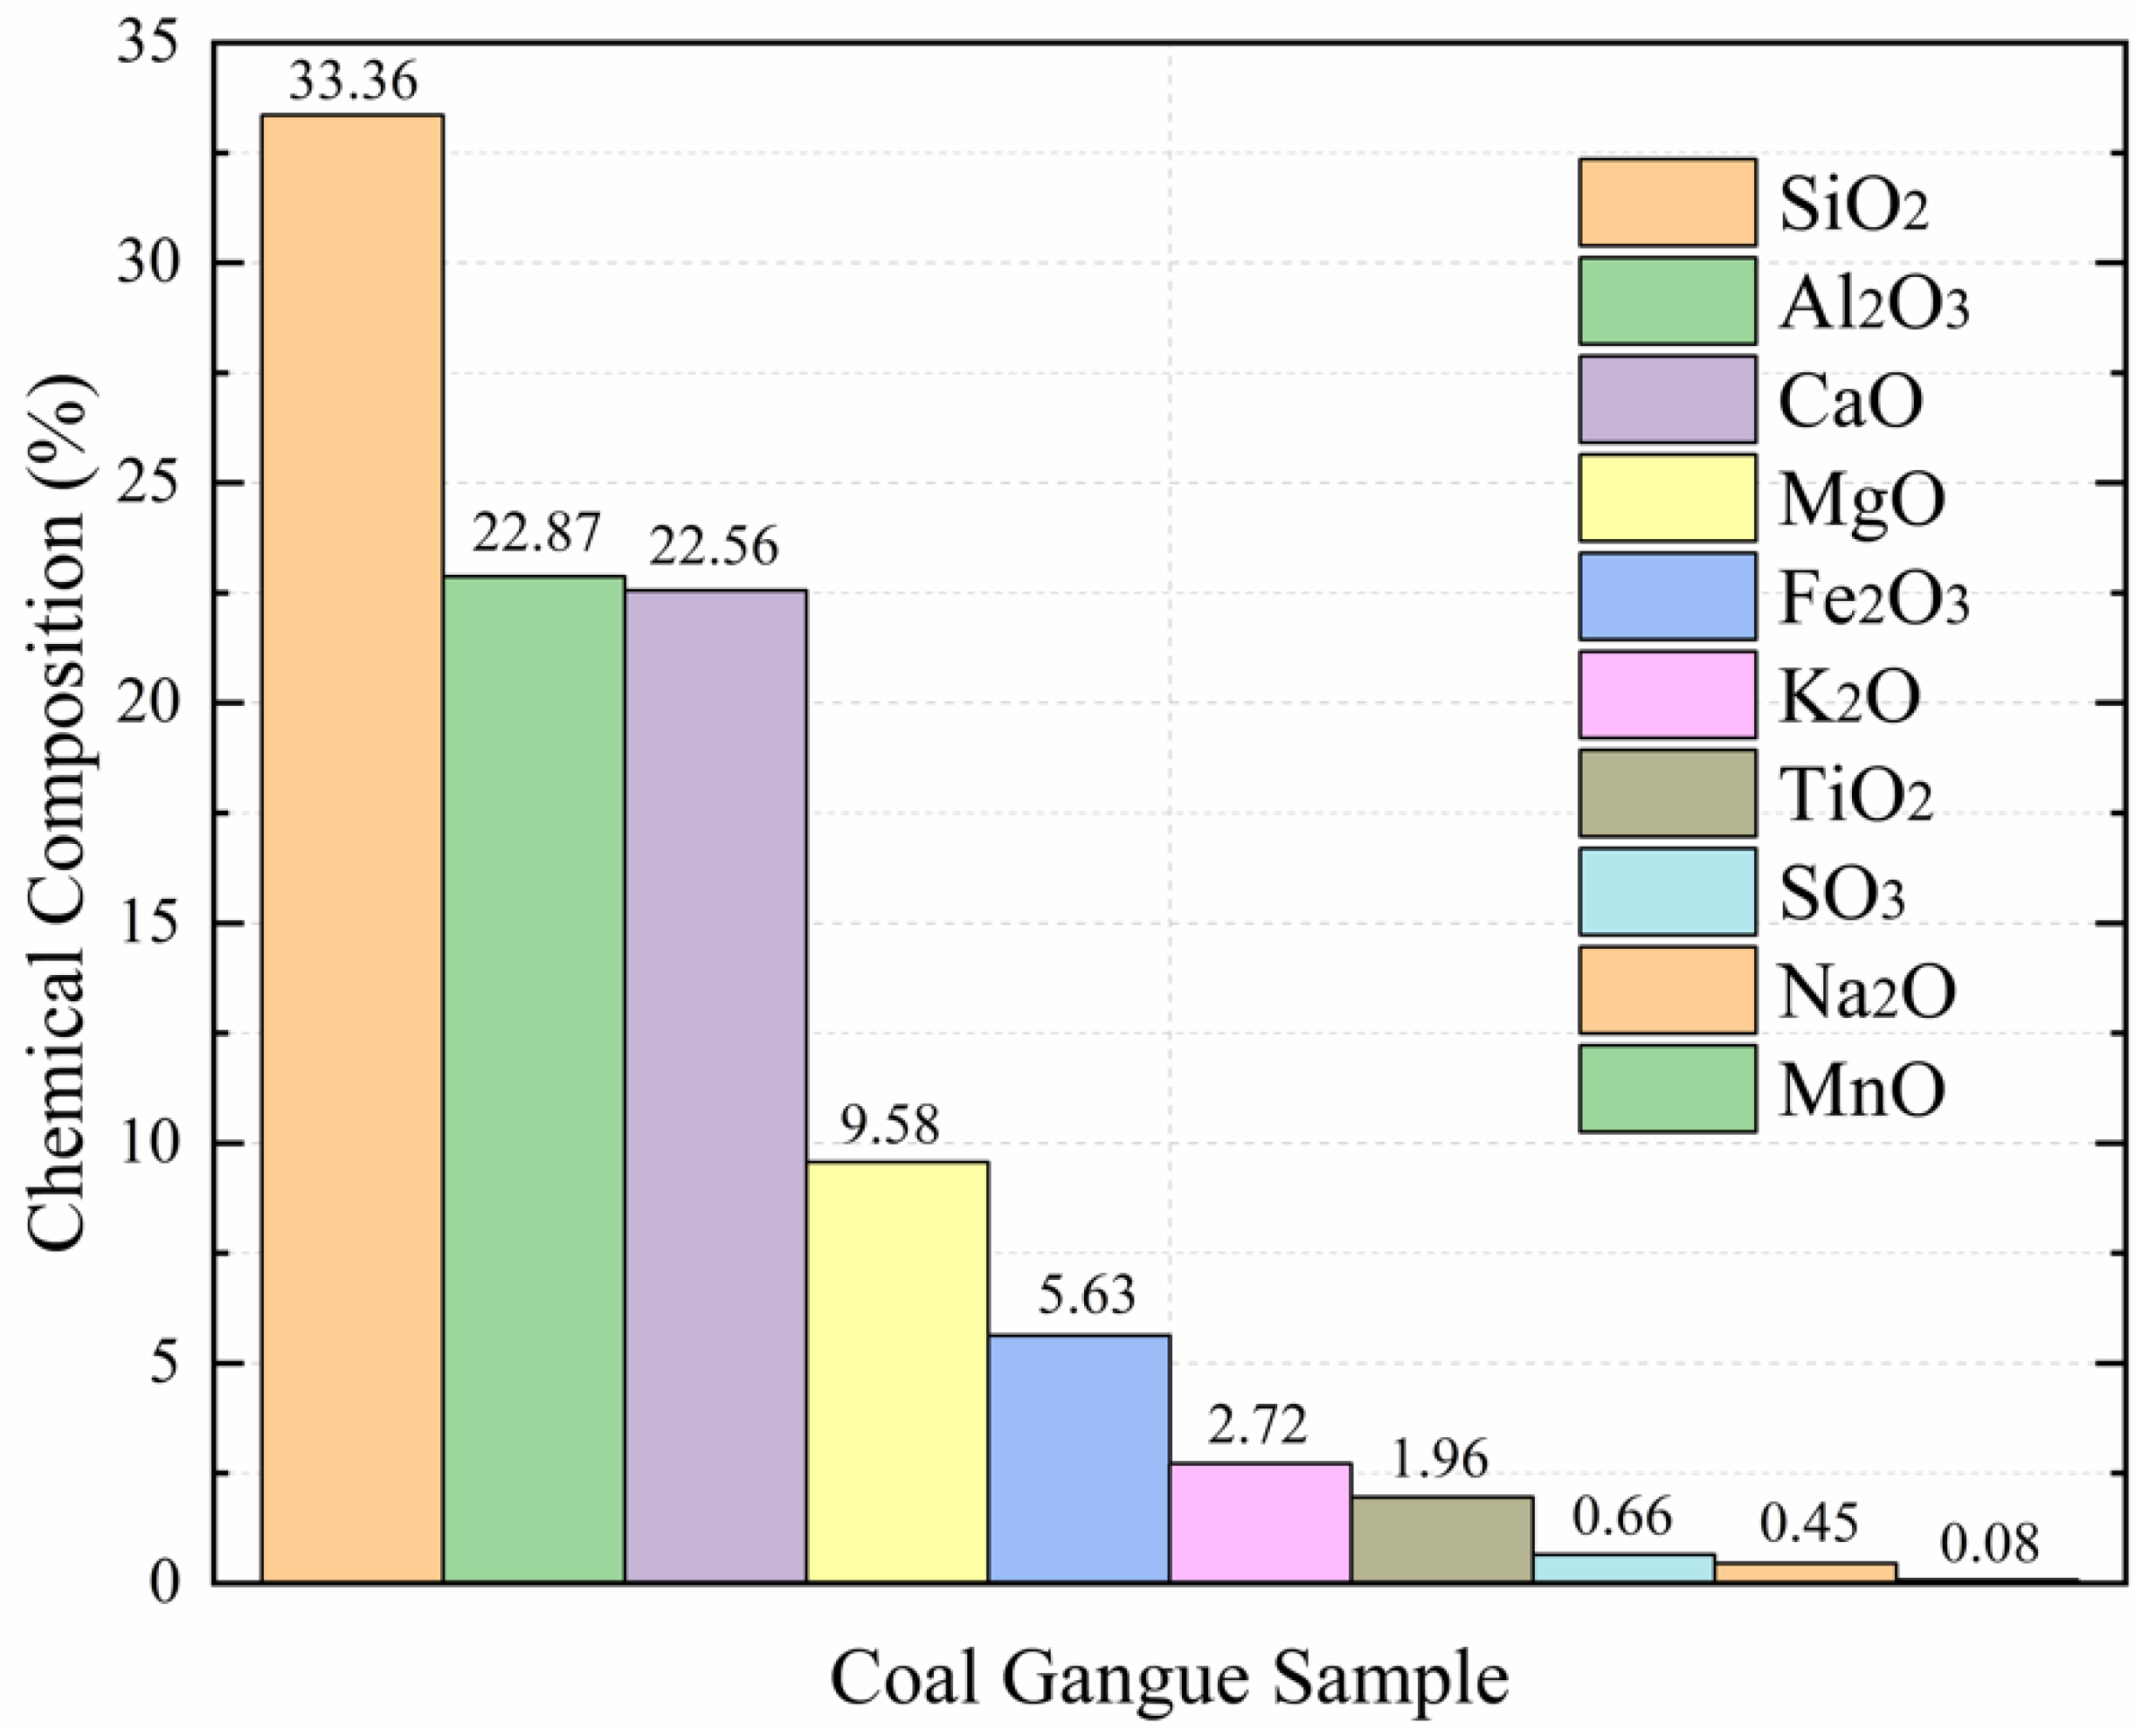
Through X-ray Fluorescence Spectrometry (XRF) at the Shandong University of Science and Technology, we can see that the contents of chemical composition in the coal gangue sample were SiO
2 (33.36%), Al
2O
3 (22.87%), CaO (22.56%), MgO (9.58%), Fe
2O
3 (5.63%), K
2O (2.72%), TiO
2 (1.96%), SO
3 (0.66%), Na
2O (0.45%), and MnO (0.08%). As seen from
Figure 2, the column chart shows the major constituents from the original coal gangue sample were successively observed as SiO
2 > Al
2O
3 > CaO > MgO > Fe
2O
3.The ratio of SiO
2/Al
2O
3 in the coal gangue samples is larger than the theoretical ratio in kaolinite (1.18) [
22], which indicated that the tested coal gangue samples mainly constitute kaolinite minerals and quartz, which is consistent with the XRD results.
The mine water studied in this paper is affected by the soaking of coal gangue, among which several water chemical components with large variations are sodium ion, calcium ion, magnesium ion, potassium ion, and iron ion. In addition, several types of oxides, such as CaO, MgO, Fe2O3, K2O, and Na2O, which are easy to react with water, including dissolved adsorption and ion exchange with water; they have a greater impact on water quality—CaO is 8 times and 50 times that of K2O and Na2O, respectively, and MgO is 3 times and 20 times that of K2O and Na2O, respectively, with a large difference.
3.2. Main Hydrochemical Composition Variation under the Effects of Different Karst Water Solutions
A massive immersion experiments of coal gangue were carried out under the conditions of site karst water and lab-configured water (GK1, GK2, and GU). Through ICP atomic emission spectrometry (ICP-AES), we obtained the concentrations of main hydrochemical composition including those of Na, K, Ca, and Mg in different solutions over time depicted in
Figure 3. The concentration curves of all tested and highly affected major cations in the different solutions showed roughly similar trends after experiencing the largest fluctuation in the earlier stage. Each curve could be divided into three stages, including the initial violent fluctuating stage (0–7 d), the middle stable stage (7–25 d), and the last slow reaction stage (25–35 d). Especially, there were completely opposite change tendency between the dissolved Na cation concentrations and Ca, Mg, and K cations in different solutions within 4–7 d of the first stage, which indicated a transitional period of cations exchange between the dissolved Na and Ca, Mg, and K concentrations. Furthermore, the concentrations of main cations including those of Na, K, Ca, and Mg in solution GK2 with original high salinity kept the highest solubility over time, as depicted in
Figure 3.
The dissolved Na levels in the different solutions over time were always ordered as GK2 > GK1 > GU, as seen in
Figure 4a. The change curves of the Na concentrations in GK2 solutions were very similar, and the concentrations decreased dramatically to the relatively lower level (389.4 mg/L) within 0–4 d, and then increased quickly to the first little dissolved peak values (511.2 mg/L) after 7 d, then decreased moderately to the almost lowest values (242.9 mg/L) after 15 d, and then with a slight downward to the lowest value (223.1 mg/L) between 15 and 25 d, and then finally increased moderately to a relatively higher dissolved values (612.8 mg/L) next to the highest value in the final stage between 25 and 35 d. The Na concentrations for solution GK1 showed a similar developing trend as that of GK2, except rapid increase from 50.8 mg/L to 141.8 mg/L between 0 and 1 d. However, the Na concentrations for solutions GU and GK1 also showed a similar developing trend with each other. Within 0–1 d, the Na concentrations in solutions GU first quickly rose from 0 to 48.4 mg/L, then continued to increase slowly to the first dissolved peak value (56.9 mg/L) after 7 d, next remained relatively stable from 7 to 25 d, and finally increased slowly from 30.2 mg/L to 97.7 mg/L within 25–35 d. From these results, we confirmed that the change trend in Na concentrations for site karst water fluctuated more greatly than that for lab-configured water, indicating that the effects of site karst water on Na in coal gangue obviously differed from lab-configured water. In combination with the detectable TDS content in the immersion solutions (ordered by GK2 > GK1 > GU) and the Na concentrations having the highest value of all cations, we inferred that sodium ions as the major element in the water solutions may control the change of the TDS content in the immersion solutions, although the dissolution, exchange, and precipitation of the ions in original water solutions and the minerals in coal gangue tried to maintain a dynamic balance.
Figure 4d shows that the dissolved kalium curves fluctuated greatly and were quite complicated in comparison to the other major cations examined. The dissolved quantities of kalium showed significant variations, which maintained an overall N-shaped developing trend that was similar to the trends of other major cations examined. The dissolved kalium levels in the other solutions over time as the fourth major cations in water solutions were almost ordered as GK2 > GK1 > GU, as seen in
Figure 3. The curve of GK1 fluctuated more greatly than that of GK2 in the initial stage (0–4 d), and it increased dramatically up to the peak value (18.2 mg/L), although the initial value was three times lower than that of GK2, and during this stage, it was only 5 mg/L less than that of GK2, and then decreased quickly to the value of 9.4 mg/L after 7 d, which was still lower than that of GK2. This indicated that the kalium concentrations of the solution GK1 experienced more violent reaction with the minerals from the coal gangue than that of the solution GK2 in the initial stage. However, the kalium curve trend of solution GU developed very similar to GK2 and maintained a lower level than that for other solutions, showing a relatively weak reaction process in kalium cation between the two solution and the coal gangue minerals. We also confirmed that the change curves in kalium concentrations for all immerse solutions almost had the same time schedule for the peak value and the minimum value of the kalium concentrations, indicating that the key influencing stage on kalium contents between the minerals in coal gangue and the water solutions may not matter much in relation to the water types.
The dissolved Ca levels in the different solutions over time as the second major cations in water solutions were always ordered as GK2 > GK1 > GU, as seen in
Figure 4b. The change trends of the Ca concentrations in GK2 and GK1 solutions were very similar, and the Ca concentrations fluctuated more and reached to the relatively lower level (227.3 mg/L and 106.6 mg/L, respectively) in the initial stage between 0 and 2 d, and then increased moderately to the little dissolved peak values (226.4 mg/L and 111.9 mg/L, respectively) after 4 d, three days earlier than the peak values of the Na concentrations curve; then, they decreased steadily to the almost lowest values (142.1 mg/L and 39.8 mg/L, respectively) after 15 d, similar to those of Na, had a slight downward trend to the lowest value (123.4 mg/L and 26.5 mg/L, respectively) between 15 and 25 d, and then finally increased to a relatively higher dissolved values (287.8 mg/L and 55.5 mg/L, respectively) between 25 and 35 d, whose values were obviously higher than their initial ones in solution GK2 but much less than the initial one in solution GK1. However, the Ca concentrations for solutions GU showed a similar developing trend with those of Na. In the initial stage (0–4 d), the Ca concentrations in solutions GU first gently rose up to the first dissolved peak value (7.8 mg/L) at the same peak time of the site karst water solutions, decreased slowly to the almost lowest values (1.2 mg/L) after 7 d, remained relatively stable after 7–25 d, and finally increased to the highest dissolved values (13.7 mg/L) after 35 d. From these results, we confirmed that the change curves in Ca
2+ for all solutions almost had the same time schedule for the peak value and the minimum value, indicating that the key influencing stage on Ca contents change may do not matter much with the water types.
The dissolved Mg change curves in all solutions over time as the third major cations in water solutions were extremely similar to those of Ca and corresponding with each other, having an order of GK2 > GK1 > GU, as seen in
Figure 4c. However, the variation tendencies of Mg were much steeper than those of Ca, although the first dissolved peak values (79.7 mg/L, 67.6 mg/L, and 2.8 mg/L, respectively) of Mg in all immerse solutions were reached after 4 d and the lowest values (31.5 mg/L, 12.3 mg/L, and 0.4 mg/L, respectively) were almost reached after 25 d, which were same as those of Ca. From these results, we also confirmed that the key influencing stage on Mg contents between the minerals in coal gangue and the water solutions do not matter much in relation to the water types.
The dissolved Fe levels in the other solutions over time were always ordered as GK2 > GK1 > GU, as seen in
Figure 4e. The change curve of the Fe concentrations in site karst water solutions including GK1 and GK2 were very similar and maintained an overall M-shaped developing trend before 15 d, and the Fe concentrations in the two solutions increased up to the first little peak value (1.41 mg/L and 0.74 mg/L, respectively) in the initial stage between 0 and 1 d, decreased to the bottom value (1.15 mg/L and 0.56 mg/L, respectively) after 4 d, increased to the peak values (2.71 mg/L and 1.02 mg/L, respectively) after 7 d, decreased to the almost lowest values (1.02 mg/L and 0.32 mg/L, respectively) after 15 d, remained relatively stable in the middle stage between 15 and 25 d, and then finally increased moderately to a relatively higher dissolved values (2.18 mg/L and 0.48 mg/L, respectively) in the final stage between 25 and 35 d. Moreover, the change curve of the Fe concentrations in GK2 fluctuated much more greatly than the other two solutions, and the difference between solutions GK1 and GU was getting smaller on the whole, with the biggest difference of 0.90 mg/L after 7 d and the smallest one of 0.18 mg/L. However, the Fe concentrations in solution GU first increased up to 0.1 mg/L after 1 d, kept relatively stable between 1 and 7 d, and then decreased slowly to the lowest value of 0.07 mg/L after 25 d with a slightly increase until the end of the experiment. From these results, we confirmed that the change in Fe concentrations for GK1 and GK2 had more long fluctuations until 15 d than that for GU.
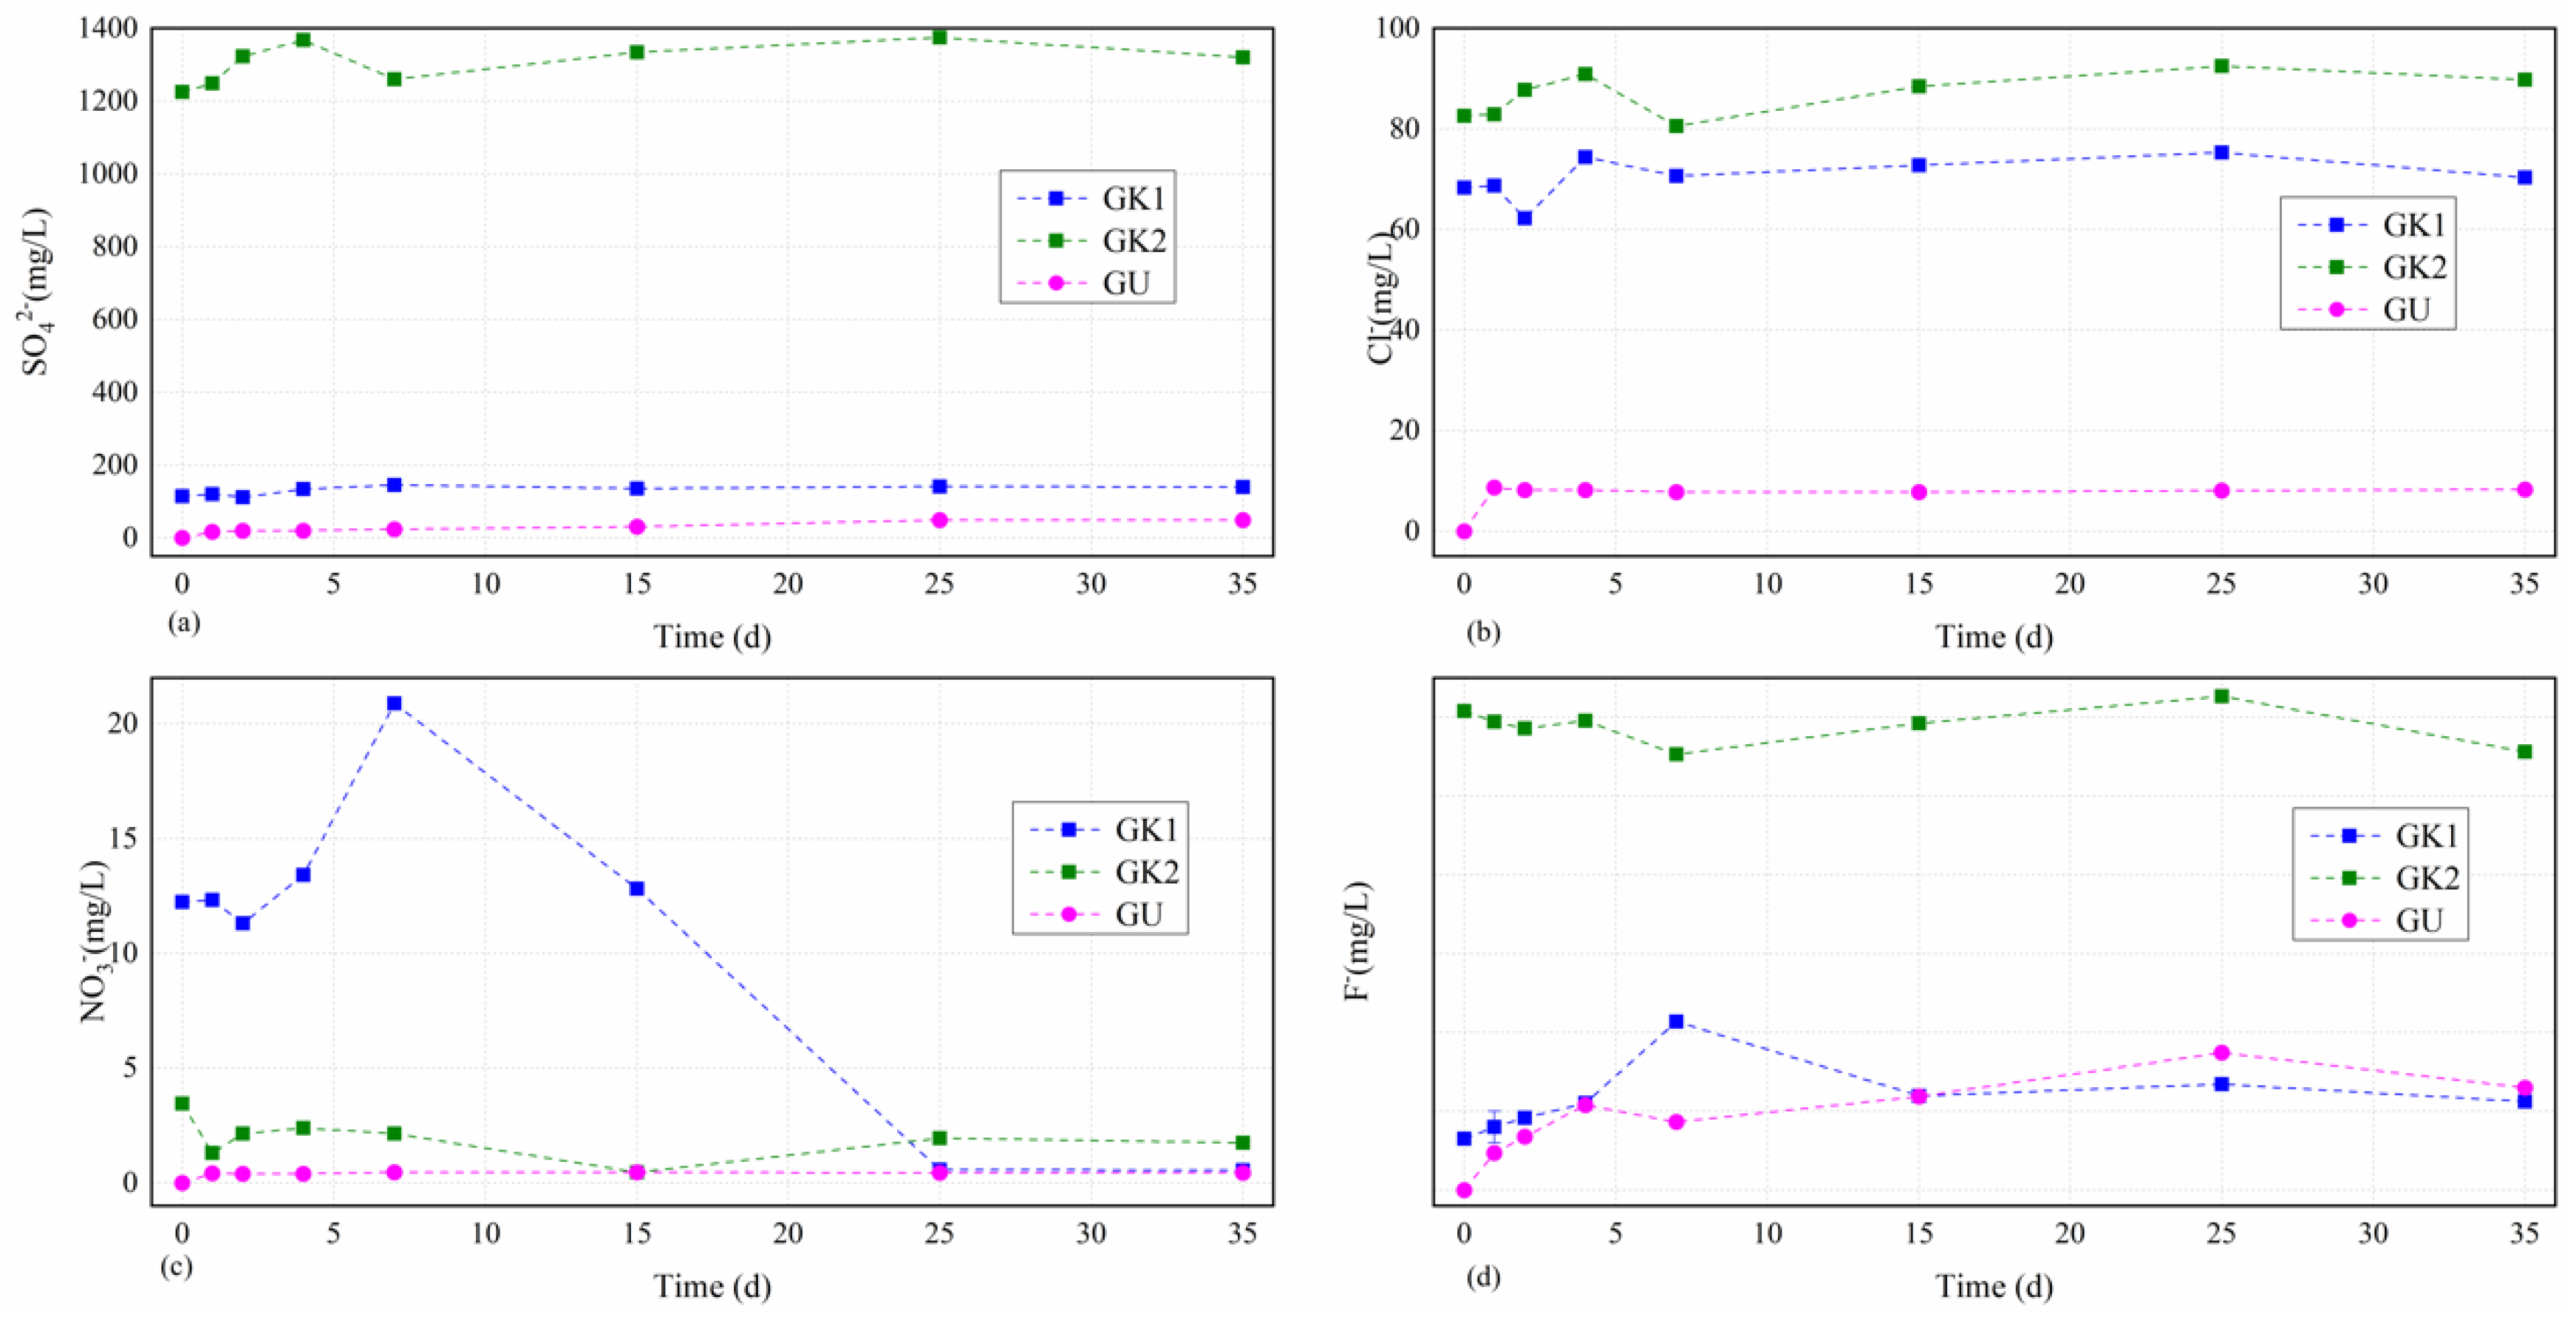
Through ion chromatograph (ICS), we also obtained the concentrations of main anions including those of sulphate, chloride, nitrate, and fluoride in different solutions over time depicted in
Figure 4.
Figure 4 presents that the concentration curves of all tested several anions in different solutions experienced a relatively larger fluctuation in the earlier stage (0–7 d) before keeping a relatively stable condition.
The dissolved sulphate levels in different solutions over time as the first major tested cations in water solutions were always ordered as GK2 > GK1 > GU, as seen in
Figure 5a. The sulphate concentrations in different solutions over time showed an increasing trend as a whole, and the higher the initial concentration of sulphate in different solutions, the greater the fluctuation and the greater the increase. Each curve could be divided into two stages, including the initial fluctuation stage (0–7 d) and the stable stage (7–35 d). Solution GK2 as the owner of the highest initial sulphate concentration (1224.6 mg/L, much higher than the others) increased moderately up to the first little dissolved peak value (1368.4 mg/L) after 4 d, decreased quickly to a relatively lower level (1260.2 mg/L) after 7 d, and then slowly increased to the highest value (1375.2 mg/L) after 25 d with a final slightly downward trend to a relatively lower value (1320.4 mg/L) after 35 d with an increase by 0.1 times from beginning to end. GK1 solution as the owner of the third highest initial sulphate concentration (114.4 mg/L) basically remained unchanged (111–120 mg/L) before 2 d, slowly increased to the highest value (146.1 mg/L) after 7 d, and finally remained relatively stable. However, the dissolved sulphate concentrations in lab-configured water solutions (solutions GU) showed nonlinear growth starting from 0 over time, which were very different from that of site karst water, due to the continual dissolution of soluble minerals in coal gangue, with a final value of 49.9 mg/L after 35 d, respectively. The dissolved sulphate concentrations variations of the lab-configured water solutions (GU) over time were calculated by solving the fitting formulas, namely Csul = −0.034T2 + 2.5391T + 14.916, where Csul is the dissolved sulphate concentration of the lab-configured water solutions, and T is the immersion time. The correlation coefficient was 0.872. From these results, we confirmed that the key reaction stage on sulphate contents between the minerals in coal gangue and the site karst water solutions was still the initial stage (0–7 d). Although the earlier reaction was relatively stronger, it stabilized soon due to a dynamic balance of the interaction between the minerals in coal gangue and the original ions in the site karst water. However, the dissolved sulphate concentration of the lab-configured water solutions was at a low level on the whole, indicating a different effect of site karst water and lab-configured water on the sulphate contents from the coal gangue, and it presented a very good nonlinear growth due to the oxidation of pyrite from the coal gangue.
The dissolved chloride levels in site karst water solutions over time as the third major tested cations in water solutions basically maintained unchanged and mainly focused on the range of 70–90 mg/L, as seen in
Figure 5b. The chloride concentrations in site karst water solutions over time showed a similar variation tendency and the biggest difference is the initial stage (1–2 d). The chloride concentrations in those solutions including GK2 and GK1 began to have a slight increase from 82.6 mg/L to 82.9 mg/L, and from 68.3 mg/L to 68.7 mg/L after 1 d, respectively. After that, a big difference that solution GK2 increased moderately to 87.8 mg/L, and solution GK1 increased dramatically to 62.3 mg/L occurred. Then, all of them experienced an increase to arrive at the first little dissolved peak value (90.9 mg/L and 74.4 mg/L, respectively) after 4 d, decreased moderately to a relatively lower level (80.5 mg/L and 70.6 mg/L, respectively) after 7 d, and then increased moderately to the highest value (92.5 mg/L and 75.3 mg/L, respectively), with a final decrease between 25 and 35 d. However, the dissolved chloride concentrations in lab-configured water solutions after 1 d experienced a dramatical respectively increase from 0 to 8.6 mg/L for solution GU. After that, the dissolved chloride concentrations in solution GU kept a stable range from 7.8 mg/L to 8.3 mg/L to the end of the experiment. From these results, we confirmed that the key reaction stage on chloride contents between the minerals in coal gangue and the site karst water solutions was still the initial stage (0–7 d). However, the dissolved chloride concentration of the lab-configured water solution was at a low level on the whole, similarly indicating a different effect of site karst water and lab-configured water on the chloride contents from the coal gangue.
The dissolved nitrate levels in site karst water solutions over time as the second major tested cations in water solutions experienced a very large fluctuation before 25 d, and finally maintained relatively unchanged after 25 d and were mainly focused on the range of 0.4–1.8 mg/L, as seen in
Figure 5c. Moreover, the higher the initial concentration of nitrate in site karst water solutions, the greater the fluctuation of nitrate levels at the initial stage. GK1 solution, having the highest initial concentrations, experienced the largest fluctuation throughout the experiment (from 20.9 mg/L to 0.6 mg/L), indicating a stronger reaction between the minerals from the coal gangue and the dissolved nitrate concentrations in GK1 solution than those of the others. GK1 solution first maintained relatively stable and then decreased from 12.3 mg/L to the first relatively lower level of 11.3 mg/L; after that, GK1 solution increased dramatically to the highest level of 20.9 mg/L before 7 d and then decreased quickly to the lowest level (0.6 mg/L) between 25 and 35 d. GK2 solution also experienced two depressions (1.3 mg/L after 1 d and 0.5 mg/L after 15 d) like GK1 solution, and it has two little peak value after 4 d and after 25 d with a relatively unchanged level of 1.8–1.9 mg/L between 25 and 35 d. However, the dissolved nitrate concentrations in lab-configured water solution, GU showed nonlinear growth starting from 0 over time like the sulphate level, which was very different from that of site karst water, due to the continual dissolution of soluble minerals in coal gangue, with a final value of 0.45 mg/L after 35 d, respectively. From these results, we confirmed that the key reaction stage on nitrate contents between the minerals in coal gangue and the site karst water solutions lasted longer than other anions focusing on the stage (0–25 d). However, the dissolved nitrate concentration of the lab-configured water solution was at a low level on the whole, indicating a different effect of site karst water and lab-configured water on the nitrate contents from the coal gangue. Moreover, the key reaction stage on nitrate contents between the minerals in coal gangue and the lab-configured water solution was in a single day.
The dissolved fluoride levels in site karst water solutions over time fluctuated relatively little overall and experienced a large fluctuation in solution GK1 in the initial stage between 0 and 7 d, and then remained relatively unchanged, as seen in
Figure 5d. GK2 solution experienced the smallest fluctuation throughout the experiment (between 2.8 mg/L and 3.0 mg/L); GK1 solution increased moderately up to the highest value from 0.3 mg/L to 1.1 mg/L in the initial stage between 0 and 7 d, and then kept in the range of 0.6–0.7 mg/L, which is overall at a relatively lower level among all the anions. However, the dissolved fluoride concentrations in lab-configured water solution GU basically showed nonlinear growth starting from 0 to the highest value (0.9 mg/L) after 25 d over time, which were very different from that of site karst water, due to the continual dissolution of soluble minerals in coal gangue, with a final value of 0.6 mg/L after 35 d. From these results, we confirmed that the key reaction stage on fluoride contents between the minerals in coal gangue and the site karst water solutions still focused on the initial stage (0–7 d), but it was not strong compared with the other anions. Moreover, the dissolved fluoride concentration of the lab-configured water solution was at a relatively higher level on the whole, which was even higher than that of GK1 solution, indicating that the fluoride in water may come from the minerals in coal gangue.
Cations of different immersion solutions have a similar trend of change, increasing and decreasing before soaking for 25 days, and gradually increasing after 25 days. Na+ concentration fluctuation in the karst water immersion solutions system is more severe than that in the ultrapure water immersion solutions system, which is related to higher initial sodium ions concentration (common ion effect), ions exchange, and precipitation. The changes of calcium and magnesium ions in karst water are similar, with obvious fluctuation in soaking early stage and slow fluctuation in soaking middle and late stage, which is less affected by the initial ions concentration in karst water.
However, the anions showed a similar trend, with significant fluctuation only in the early stage of soaking and small fluctuation in the late stage. Compared with ultrapure water immersion solution, sulfate ions fluctuation is more obvious in karst water immersion, which is affected by the initial ions in karst water. NO3− fluctuates longer than SO42−, and nitrate ion concentration in GK1 fluctuates sharply, which is due to the higher initial NO3− in GK1 that enhances the ions interaction. The Cl− concentration of GK1 and GK2 immersion solutions showed a similar variation tendency, and there was little change throughout the experiment. Solutions with lower initial F− ions concentration have more violent fluctuations, while those with higher F− ions concentration have less fluctuations.
3.3. Correlation of Main Hydrochemical Indexes and Main Controlling Factors
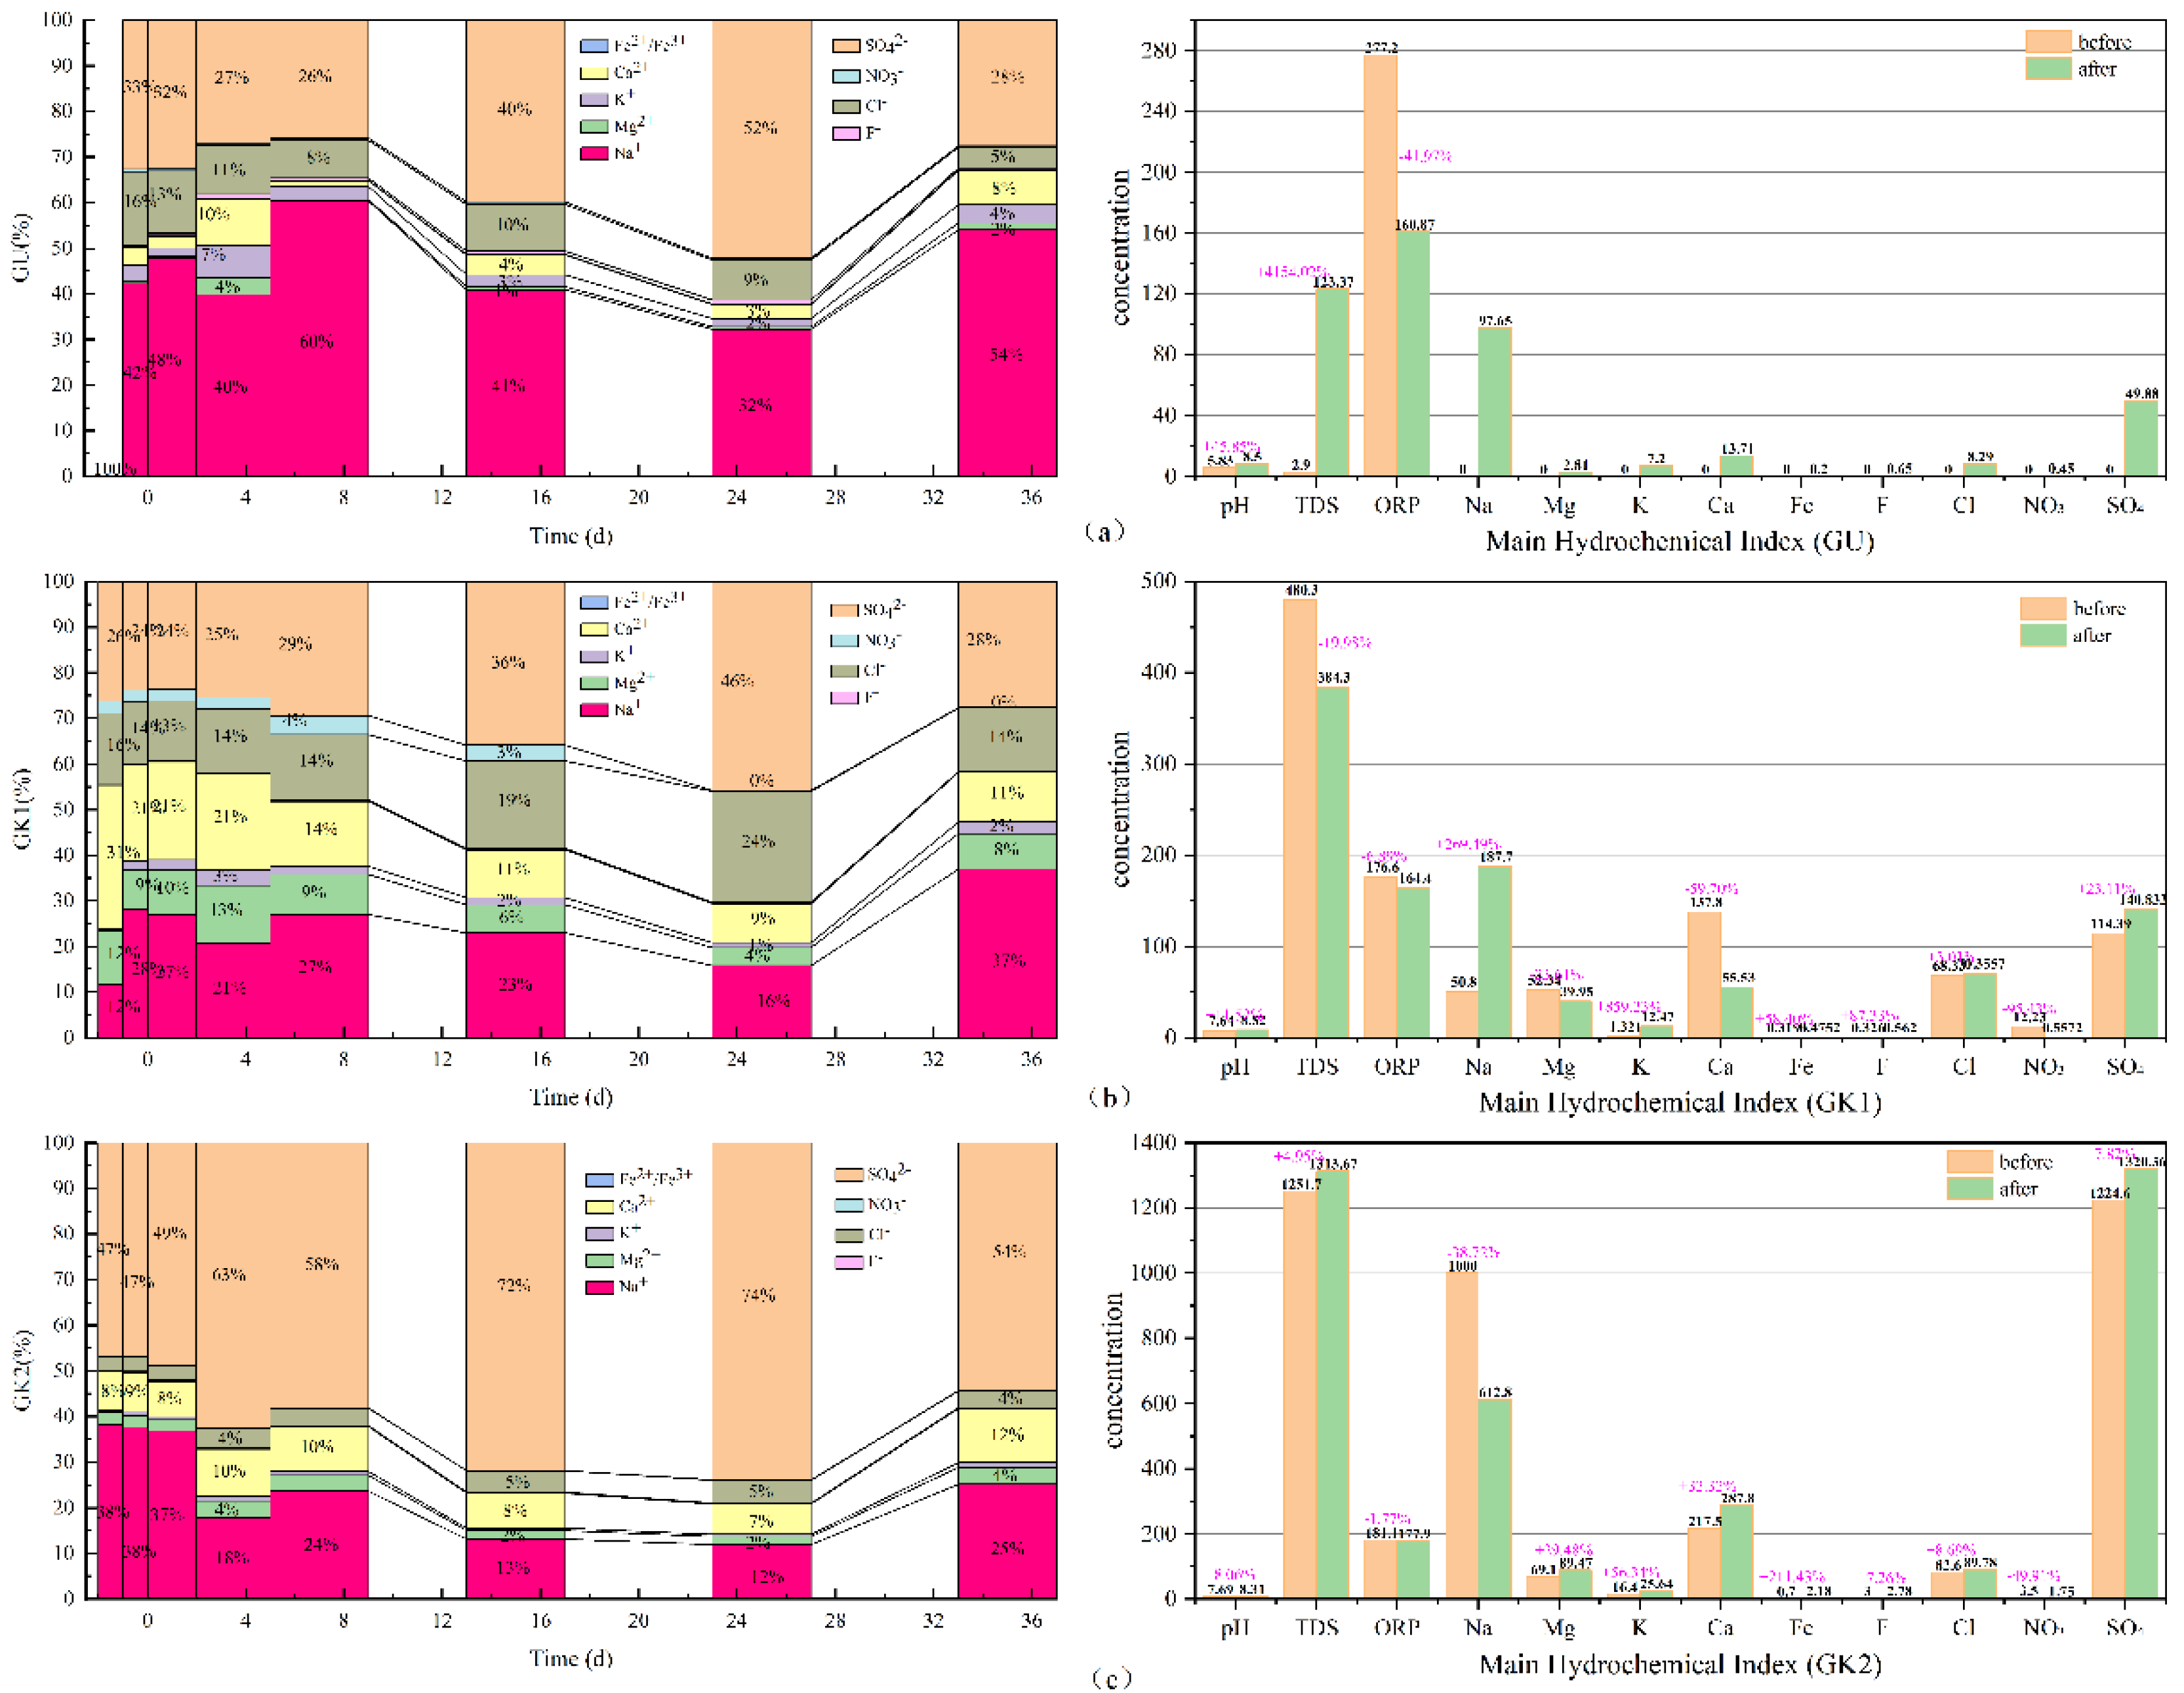
By adopting Origin 2021 software, the 100% stacked column graphs among the main hydrochemical ions variation (Na, K, Ca, Mg, Fe, sulfate, chlorides, nitrate, and fluoride), the difference from beginning to end in all water solutions can be obtained, which is shown in
Figure 5.
As can be seen in
Figure 6, in terms of the concentration proportion of each component in the three immersion solutions, sodium, sulfate, chlorides, calcium, and potassium ions always dominate in GU immersion solution. In terms of concentration contribution rate alone, Na and SO
42− ions account for 67–86% of the total, with a small fluctuation range; secondly, Cl, Ca, K, and Mg ions account for only 14–24%, and the contribution rate of other components is low. In GK1 immersion solution, Na, SO
42−, Ca, Cl, and Mg ions always dominate. In terms of concentration contribution rate alone, Na and SO
4 account for 38–65% of the total, with a large fluctuation range, especially in the initial stage, accounting for the smallest proportion; secondly, Ca, Cl, and Mg ions account for 33–59%. At the initial stage, Ca ions account for the largest proportion, surpassing all other ions, and the contribution rate of other components is low. SO
42−, Na, Ca, Cl, and Mg ions always dominate in GK2 immersion solution. In terms of concentration contribution rate alone, Na and SO
42− account for 81–86% of the total and are the most stable among the three solutions; secondly, Ca, Cl, and Mg ions account for 13–20%, and the contribution rate of other components is relatively low. GK2 is the most stable component in the three solutions. Among the three kinds of aqueous solutions, the hydrochemical components of high salinity immersion solutions, especially those dominated by Na and SO
42− ions, have basically reached dynamic equilibrium, and are less affected by coal gangue minerals, which plays a key role in the balance of the ionic components of the solution. Compared with ultrapure water solution, for the aqueous solution with a certain concentration in the initial state, such as GK1 immersion solution, under the action of coal gangue, its ionic components have undergone a relatively strong recombination process.
From the TDS, pH, and ORP of the three immersion solutions, the total dissolved solids in GU immersion solution increased to 120.47 mg/L, an increase of nearly 4154.02%, and the pH in the solution increased by nearly 45%; the oxidation environment changed into the reduction environment, with the greatest degree of change. The total dissolved solids in GK1 immersion solution decreased by 96 mg/L, nearly 19.98%, and the pH in the solution increased by 11.52%; the redox environment changes minorly. The total dissolved solids in GK2 immersion solution increased to 61.97 mg/L, an increase of nearly 4.95%, and the pH change in the solution was the smallest, an increase of only 8.06%; the redox environment changed minorly. By comparing the three indicators in the immersion solution, it is found that GK2 immersion solution is the most stable of the three immersion solutions. It can be seen that the high salinity mine water solution plays a good buffer role, making the basic water quality indicators in the immersion solution, such as TDS, pH, and ORP, change the least; the ultrapure water GU with the lowest salinity is the largest in terms of total dissolved solids, pH, or ORP. Therefore, for the immersion solution with low ion concentration, the change of water quality index of the immersion solution after the interaction between coal gangue and water mainly depends on the dissolution and release of minerals in coal gangue.
In terms of time scale, the minerals in coal gangue in GU immersion solution are rapidly dissolved and released in 0–1 days and form the initial equilibrium state of each ion component, the relative scale of each ion component is in a relatively stable period within 1–2 days, and the relative scale of each ion changes slightly; in 4–36 days, the relative scale of each ion component is in the fluctuation equilibrium period, and the relative scale of each ion changes greatly, but it returns to stability on the last day. In the fluctuation equilibrium period, the main changing ions in the aqueous solution are Na and SO42− ions, followed by Ca ions, and the concentration of Cl ions remains stable as a whole; the main period of ion exchange between Ca, K, and Mg ions and Na ions is 2–7 days; Ca/K/Mg ions are exchanged into Na ions in 1–2 days, Na ions are exchanged into Ca/K/Mg ions in 2–4 days, and Ca/K/Mg ions are exchanged into Na ions in 4–7 days. For GU immersion solution, the ion exchange capacity is the largest in the first 7 days, and the proportion of each ion in the solution enters the first relative scale equilibrium period on the 7th day. Combined with the change of ion concentration in 7–15 days, it is found that the cation exchange capacity between Na ion concentration and Ca/K/Mg ions is very small; the reason may be that, on the 7th day, the concentration of Na ions in the immersion solution basically reached saturation, and the concentration difference between the Na ions in the solution and the Na ions in the colloidal particles of coal gangue formed like the internal and external environment of the cell. It began to enter the pores of coal gangue and adsorbed on the surface of colloidal particles, resulting in a significant reduction in the concentration of Na ions in the immersion solution. When the colloidal particles adsorbed in coal gangue reach saturation, its adsorption capacity will slowly decrease and be released into the immersion solution, with the continuous dissolution of coal gangue minerals, a new concentration equilibrium is formed; that is, in 7–35 days, the GU immersion solution enters the second relative scale equilibrium period, and this process will continue to repeat in the future soaking cycle.
In 0–1 days, the concentration of each ion component in GK1 immersion solution rapidly recombines from the initial equilibrium state. When the concentration of Na is low, Ca and Mg ions exchange with Na ions, and the relative scale of each ion component is in a relatively stable period within 1–2 days, with little change in the relative scale of each ion; in 4–36 days, the relative scale of each ion component is in the fluctuation equilibrium period, and the relative scale of each ion changes greatly, but it returns to stability on the last day. In the fluctuation equilibrium period, the main changing ions in the immersion solution are Na, Ca, and SO42− ions, followed by Mg and K ions, and the concentration of Cl ions remains stable as a whole; consistent with the interaction process of GU water coal gangue samples, the main period of ion exchange between Ca, K, and Mg ions and Na ions is 2–7 days. In 1–2 days, Ca and Mg ions are exchanged into Na and K ions; in 2–4 days, Na ions are exchanged into Ca/K/Mg ions; and in 4–7 days, Ca/K/Mg ions are exchanged into Na ions. For GK1 aqueous solution, the ion exchange capacity is the largest in the first 7 days, and the proportion of each ion in the solution enters the first relative scale equilibrium period on the 7th day. Combined with the change of ion concentration on days 7–15, it is found that the cation exchange capacity between Na ion concentration and Ca/K/Mg ions is very small, and in 7–35 days, the GK1 immersion solution enters the second relative scale equilibrium period.
In 0–1 days, the concentration of each ion component in GK2 aqueous solution rapidly recombines from the initial equilibrium state. Under the condition of high Na concentration, the possibility of cation exchange is very small, and other ions are in an increasing trend. Although Na ions also exchange with Ca, Mg, and K ions, they does not play a leading role, and the relative scale of each ion component is in a relatively stable period within 1–2 days, with small changes in the relative scale of each ion. From 4 to 36 days, the relative scale of each ion component is in the fluctuation equilibrium period, and the relative scale of ions changes greatly, but it returns to stability on the last day. In the fluctuation equilibrium period, the main changing ions in the aqueous solution are Na, SO42−, and Ca ions, followed by Mg and K ions, and the concentration of Cl ions remains stable as a whole. Due to the high concentration of Na ions and SO42−, the ion exchange between Ca, K, and Mg ions and Na ions is very small. In the first 7 days, the GK2 immersion solution is significantly different from the first two types of water samples, but the relative scale of each ion in the solution enters the first concentration equilibrium period on the 7th day. Combined with the change of ion concentration from 7 to 15 days, it is found that the cation exchange between Na ion concentration and Ca, K, and Mg ions is very small; in 7–35 days, GK2 immersion solution enters the second relative scale equilibrium period, which is generally consistent with the action process of the first two types of water samples. Compared with other cations, the Na ion has a weak ability to adsorb on the surface of colloidal particles. With the change of Na ion concentration, the Na ion on the surface of colloidal particles is more likely to be lost to the aqueous solution, so its concentration changes violently in the whole test process.
By analyzing the dominant anions SO42− and Cl ions in the three kinds of immersion solutions, it can be found that although Cl ions basically do not change greatly after reaching the saturation solubility, the relative scale of each ion component is still violently recombined and then enters the relative scale equilibrium period again. It can be seen from Gu aqueous solution that the rapid increase of SO4 ion concentration may be mainly formed by the oxidation of sulfide in coal gangue particles, and the major change of its redox environment is its important evidence.
In addition, SO42− ions have a similar change law with the dominant cation Na. Comparing three kinds of aqueous solutions, it can be found that in the first 7 days, the concentration of Na ions entering the surface of colloidal particles inside the coal gangue is small, which still belongs to the accumulation process. In the 7–36 days of the fluctuation equilibrium period, when the Na ions adsorbed on the surface of colloidal particles of coal gangue reach a certain concentration, it will cause the loss of SO42− ions, and the negative correlation between SO42− ions and Na ions is more obvious, forming the alternating adsorption of cation and anion.
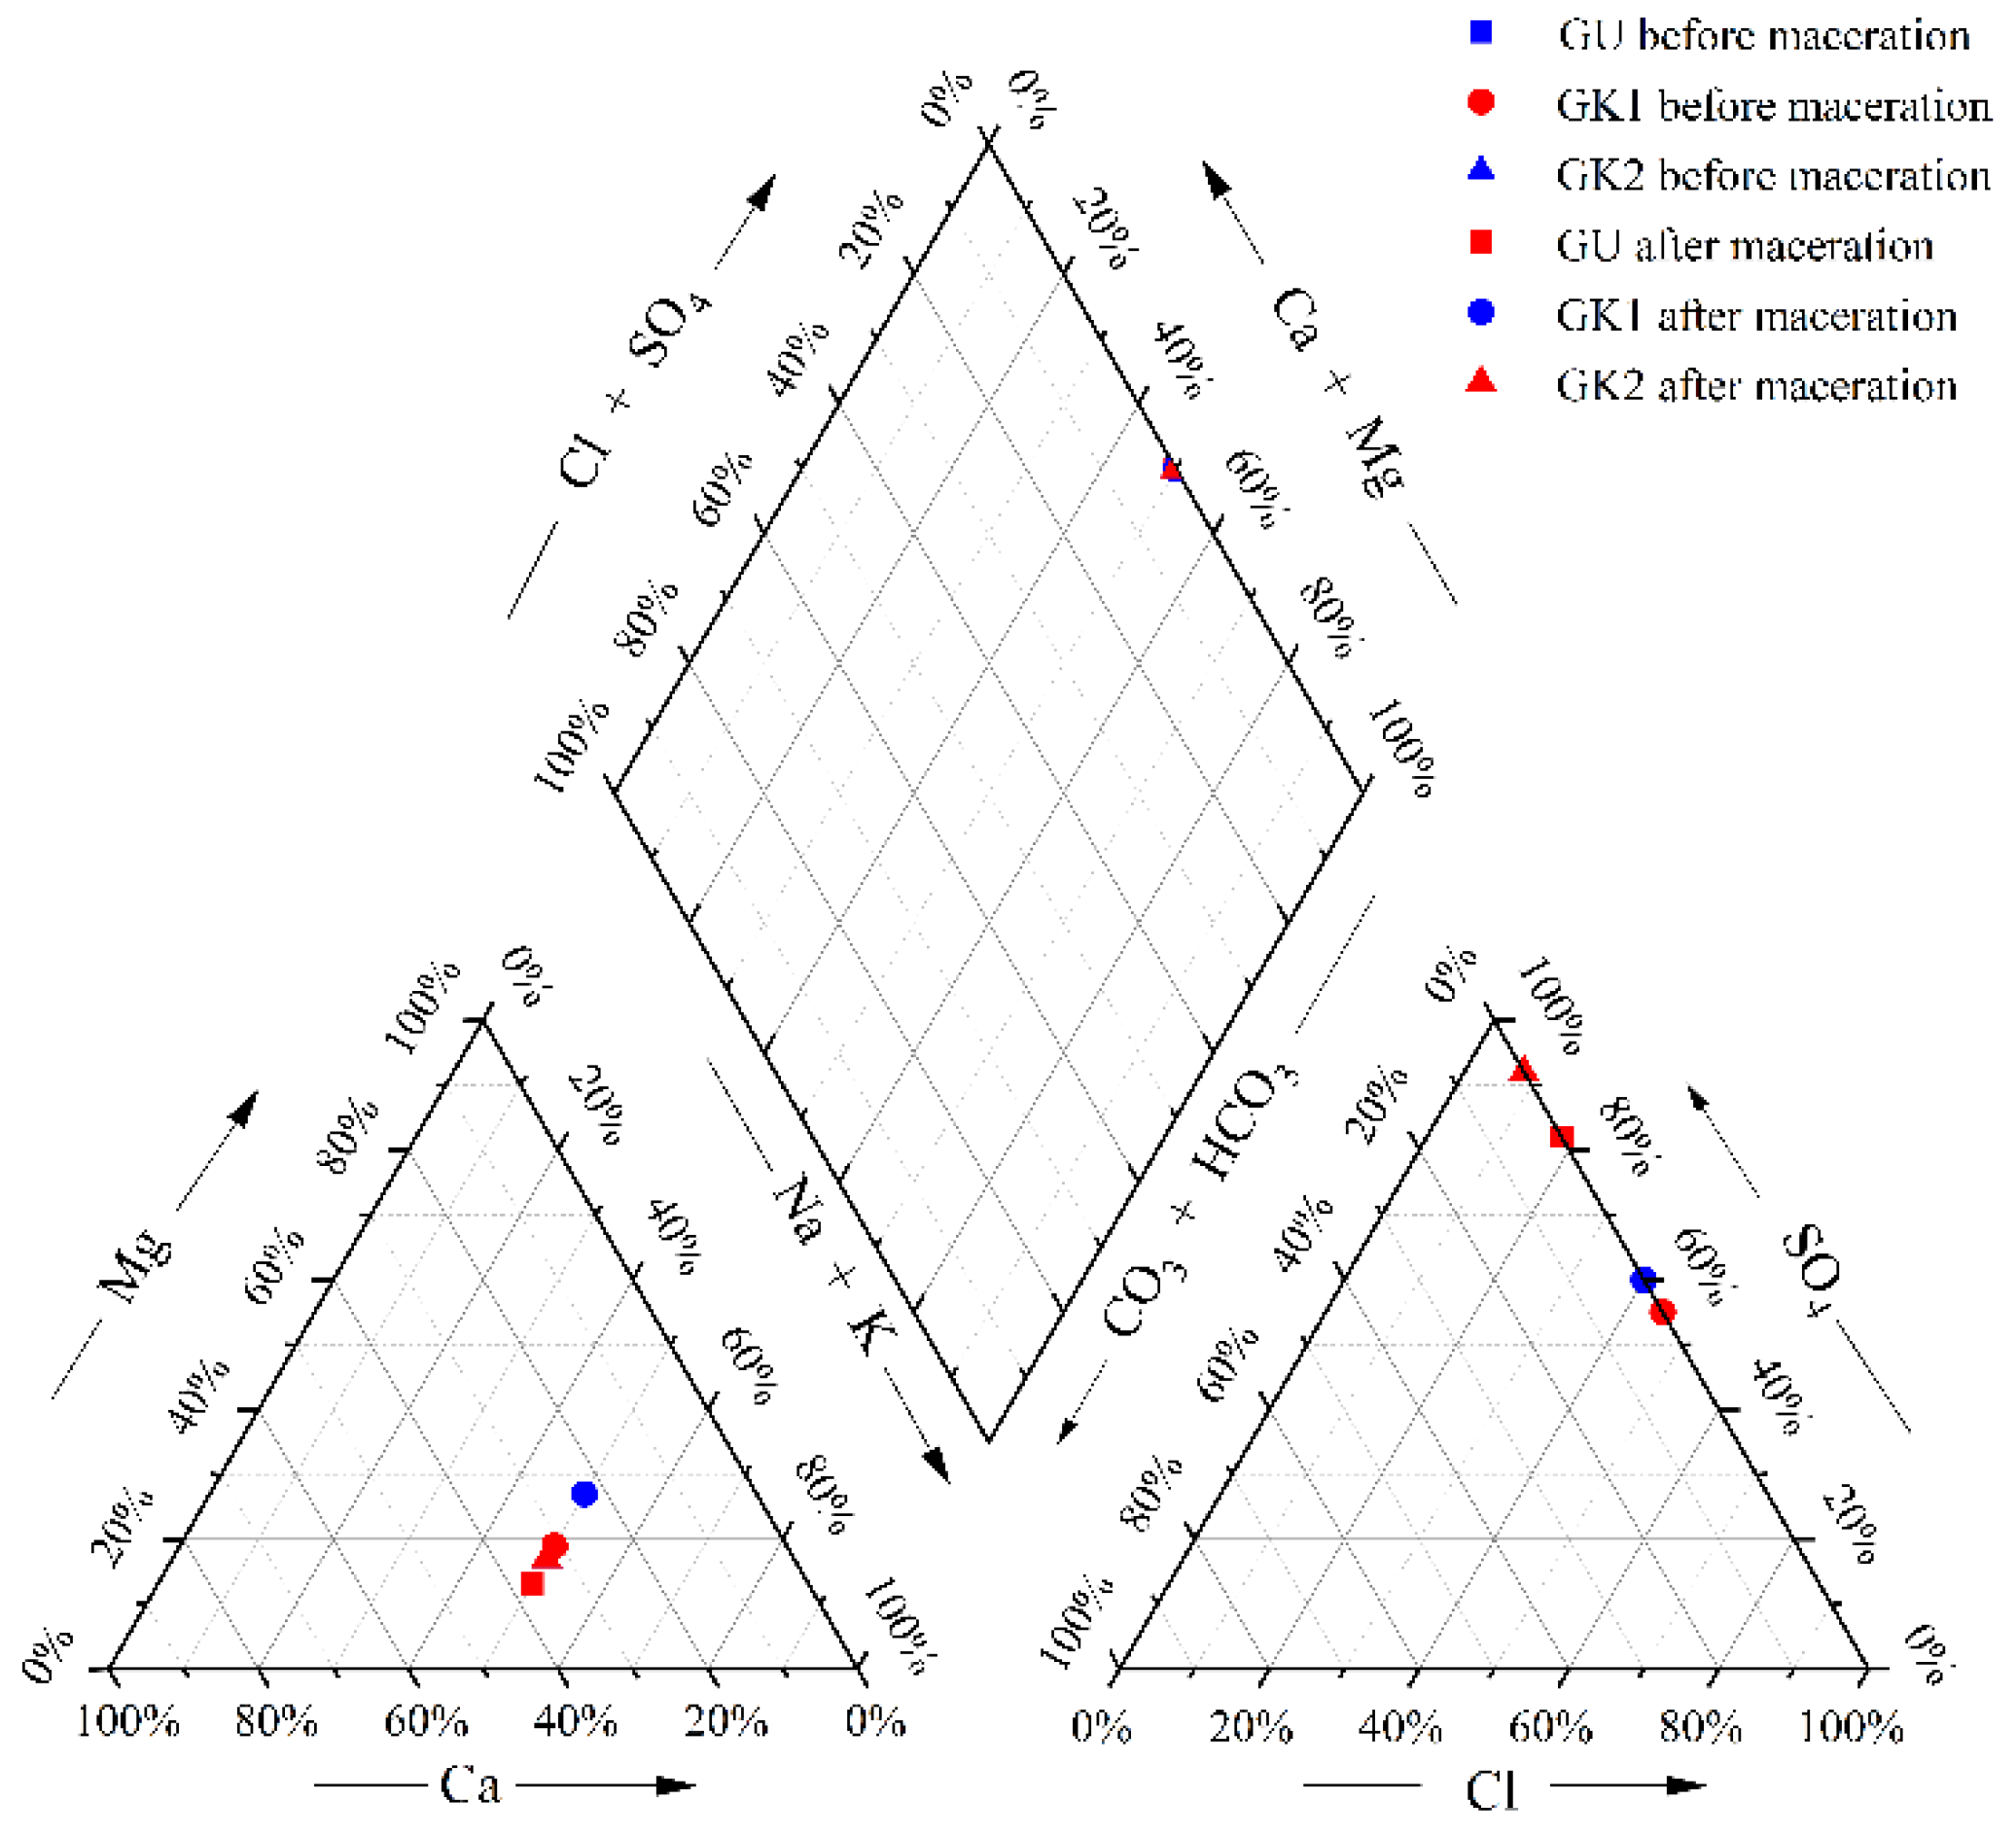
After the water–rock reaction, the mine water quality type changes, and the water quality type changes as shown below (
Figure 7 and
Table 2).
According to the above analysis, Ca and Mg ions and Na in GK1 immersion solution (within 2–7 d) are exchanged. and the exchange effect is strong in the early leaching stage; in addition, SO
42− and Cl
− do not change much after reaching saturation solubility, so the water quality type of GK1 after leaching changes from SO4-Cl-Na-Ca type to SO4-Cl-Na-Mg type (as shown in
Figure 7 and
Table 2), and the water quality type changes. Although ion exchange occurs in the early stage of leaching in GK2, the exchange effect is not strongly correlated, and the SO
42− ions in the anion always occupy a significant advantage, so the water quality type does not change after GK2 leaching.
