Article

Assessment of Zerovalent Iron Nanoparticle (nZVI) Efficiency for Remediation of Arsenic-Contaminated Groundwater: Two Laboratory Experiments

1
Department of Civil, Constructional and Environmental Engineering (DICEA), Sapienza University of Rome, 00184 Rome, Italy
2
Department of Chemical Engineering Materials Environment (DICMA), Sapienza University of Rome, 00184 Rome, Italy
3
Italian Institute for Environmental Protection and Research (ISPRA), 00144 Rome, Italy
*
Author to whom correspondence should be addressed.
Water 2022, 14(20), 3261; https://doi.org/10.3390/w14203261
Submission received: 7 September 2022 / Revised: 3 October 2022 / Accepted: 13 October 2022 / Published: 16 October 2022

Abstract

:
Zerovalent iron nanoparticle (nZVI) technology has been found to be promising and effective for soil and groundwater remediation. This paper shows the results of two batch tests (Test A and Test B) carried out to assess the capacity of nZVI to remediate arsenic (As)-contaminated water. Test A, performed with batches of tap water contaminated by arsenic, with a concentration equal to 10 mg ∗ L−1, showed a significant reduction of the As concentrations in solution, with a maximum removal rate up to 98% (Batch 3). Test A lasted 26 h. At the same time, Test B was performed with a sample of arsenic-contaminated sediment, with a concentration equal to 100 mg ∗ Kg−1 (ca). Test B lasted 72 h. Test B also confirmed an excellent reduction of the As concentrations in solution, up to a maximum removal rate of 99% (Batch 3). These results show the effectiveness of nZVI for the remediation of water contaminated by arsenic. However, as the As–nZVI interaction time increased, there was a decrease in the available sites for arsenic immobilization, and so the As concentrations in solution became constant. In fact, as the dose of nZVI (mnZVI) used in the batches increased, the mass concentration of residue As in the solution at the equilibrium decreased (cAse) and therefore the concentration of As absorbed (cAs0–cAse) on the nZVI increased due to the immobilization action of the nanoparticles. The results show concentrations of As absorbed (cAs0–cAse) on the nZVI with a range between 5.10 mg ∗ L−1 (mnZVI = 0.05 g) and 9.54 mg ∗ L−1 (mnZVI = 0.5 g) for Test A, and with a range between 0.029 mg ∗ L−1 (mnZVI = 0.05 g) and 0.058 mg ∗ L−1 (mnZVI = 0.7 g) for Test B. Therefore, these results underline the need to monitor As concentrations during applications in the field, in order to verify the demand for injecting new active nanoparticles for arsenic removal.

1. Introduction

Zerovalent iron nanoparticles (nZVIs) are an effective reagent to treat toxic and hazardous chemicals [1]. nZVIs have shown high reactivity to remediate aquifers contaminated by nonaqueous phase liquids, heavy metal ions, and many other hazardous compounds [2]. Their main applications involve the construction of permeable reactive barriers (PRBs), which can intercept contaminants such as trichloroethylene (TCE) in groundwater plumes and prevent them from reaching the surrounding areas [3,4]. However, PRBs do not allow a direct treatment of the contamination source. Furthermore, if the contamination is located at great depths, greater than 20–30 m, PRBs cannot be easily implemented due to technical difficulties associated with trenching, and due to implementation costs [5]. On the contrary, the injection of nZVI suspensions, through direct push technology or via various types of wells (e.g., temporary or permanent injection wells), both on a laboratory and pilot scale, has proved to be a promising remediation technique for contaminated aquifers [6,7,8,9,10,11]. The use of nanometric reactive materials to treat contaminated areas has made it possible to obtain the flexibility, effectiveness and economic convenience that PRBs lack [5].
The paper presents two laboratory applications (batch tests) using nZVI to evaluate the effectiveness of the remediation of water contaminated by arsenic (As). The nZVI suspensions were injected directly in the batches during the experiments. By analyzing the laboratory results, the aim is to assess the chance of using nZVIs in the field, considering the advantages and limitations of nZVI application for environmental remediation.

1.1. Overview of Some Environmental Applications

Wang and Zhang in 1997 [12] were the first to suggest the application of nZVI to remove environmental contaminants. In presence of oxygen dissolved in water, zero-valent iron is capable of oxidizing organic pollutants and more [11]. An application for TCE treatment was reported by Elliot and Zhang in 2001 [13]. They used bimetallic nZVI particles for the first field trial because of their ease of synthesis and reactiveness. A removal efficiency of 96% was achieved in four weeks for TCE, which is the highest value observed for nZVI [10,13]. Another study by Jordan et al. [14] showed the injection of nano-Fe–nZVI in a liquid state with food-grade inorganic material to remediate soil containing PCE (2.7 g/kg) and shallow groundwater containing PCE (41 mg/L) [10]. In a case study in Bornheim, Germany, byproducts, such as TCE and DCE, were reduced by about 90% of the total CVOCs (chlorinated volatile organic compounds). After two years of injection, no rebound has been noted, and the downward trend of pollutants still continues [15]. Furthermore, Zafar et al. [10] reported that contaminant sampling concentrations, within the injection zone, decreased by 49–89% for PCE, by 81–97% for TCE, and by 97–98% for hexachloroethane within three months of injection [16].
In this paper, Nanofer25S produced by NANO IRON s.r.o. (Rajhrad, Czech Republic) was used. Several studies have been carried out with Nanofer25S in laboratory experimentations [5,17,18] and field applications [8,9,19]. Zafar et al. [10] performed Nanofer treatment of PCE, TCE, and DCE with concentrations of up to 70 mg/L in 82 pumping wells under a pressure of 0.8 MPa [15]. Research on a case study in Horice, in the Czech Republic, proved that the initial contaminant decreased by 60–75% using Nanofer [15,20]. At same time, many studies [6,8,9] have highlighted that nZVI is used to treat inorganic pollutants and heavy metals (arsenic, chromium, copper, lead, nickel, etc.). The main interactions between metal and nZVI are reduction, adsorption, oxidation/re-oxidation, co-precipitation and precipitation [21,22,23]. nZVI is an exceptional electron donor that can transubstantiate the reduction potential (E0) of contaminants greater than 0.447 V [10,11]. Generally, processes such as adsorption to the iron (hydr)oxide shell are responsible for treatment of metals with a more negative—or similar—E0, if compared to Fe0 [21]. This happens for elements such as Cd and Zn, with standard redox potential values respectively equal to −0.40 V and −0.76 V. On the contrary, metals with E0 values more positive than Fe0 are preferentially removed by phenomena such as reduction and/or precipitation [21,24], as for elements such as Cr, As, Cu, U and Se. Chromium in the Cr6+ form, with standard redox potentials equal to +1.36 V (Cr2O72−) or +1.51 V (CrO42−), may be reduced to less toxic Cr3+ form by nZVI [21]. Latif et al. [23] reports that Singh et al. [25] used nZVI (0.1 g/L) to remove Cr6+ from water media, observing 100% reduction of Cr(VI) to Cr(III) within 120 min. The results of Singh’s research [25] showed that the rate of reduction was expressed by a pseudo-first-order reaction kinetics.

1.2. Interaction Mechanisms between Arsenic (As) and nZVI

nZVIs are characterized by a typical core-shell structure formed in an aqueous medium due to reactions with H2O and dissolved O2 [1].The core consists of zerovalent iron (Fe0) and gives the reducing power for reactions with contaminants. The shell consists principally of iron oxides/hydroxides (i.e., Fe(II) and Fe(III)), formed by the oxidation of zerovalent iron. However, the core provides the reducing power (the electron source) for the reactions. On the contrary, the shell is the site for complex chemical reactions and electrostatic interactions [23,26]. The specific surface area of the nZVI has been identified as a main characteristic that influences the reaction kinetics of the interaction between contaminants and ZVI. In fact, as particle size decreases, (i) the proportion of atoms at the surface increases, i.e., specific surface area, and (ii) its tendency to adsorb, interact and react with other atoms, molecules and complexes, also increases [27,28,29]. However, due to their small size, while nZVIs are traveling through porous media, they can rapidly aggregate. Attractive magnetic interactions and van der Waals forces between the particles are responsible for the rapid aggregation of nZVI in the micro-scale [30]. This phenomenon can cause the development of larger-sized particles, hence increasing the possibility of settling and deposition of particles [31]. The nZVI aggregation produces a loss in chemical reactivity and reduces the nZVI deliverability in soils [10,30].
This paper presents two laboratory experimental activities in order to assess the capacity of nZVI to remediate arsenic-contaminated water, highlighting benefits and limitations for in-field applications. The basis for the reaction is the corrosion of Fe0 in the environment [32]. It is a combination of these two phenomena: the reductive power of the iron core (Fe0) and the surface oxide layer of iron hydroxide, which causes As3+ oxidation. Arsenic is distributed in a multi-layered arrangement across the shell of nanoparticles. Figure 1 shows the main phenomena occurring between arsenic and nZVI.

2. Materials and Methods

Nanofer25S, used for the batch test, was selected and purchased from NANO IRON s.r.o. (Rajhrad, Czech Republic). Nanofer25S is a mixture mainly consisting of zerovalent iron Fe0 and water. The composition of Nanofer25S is shown in Table 1.
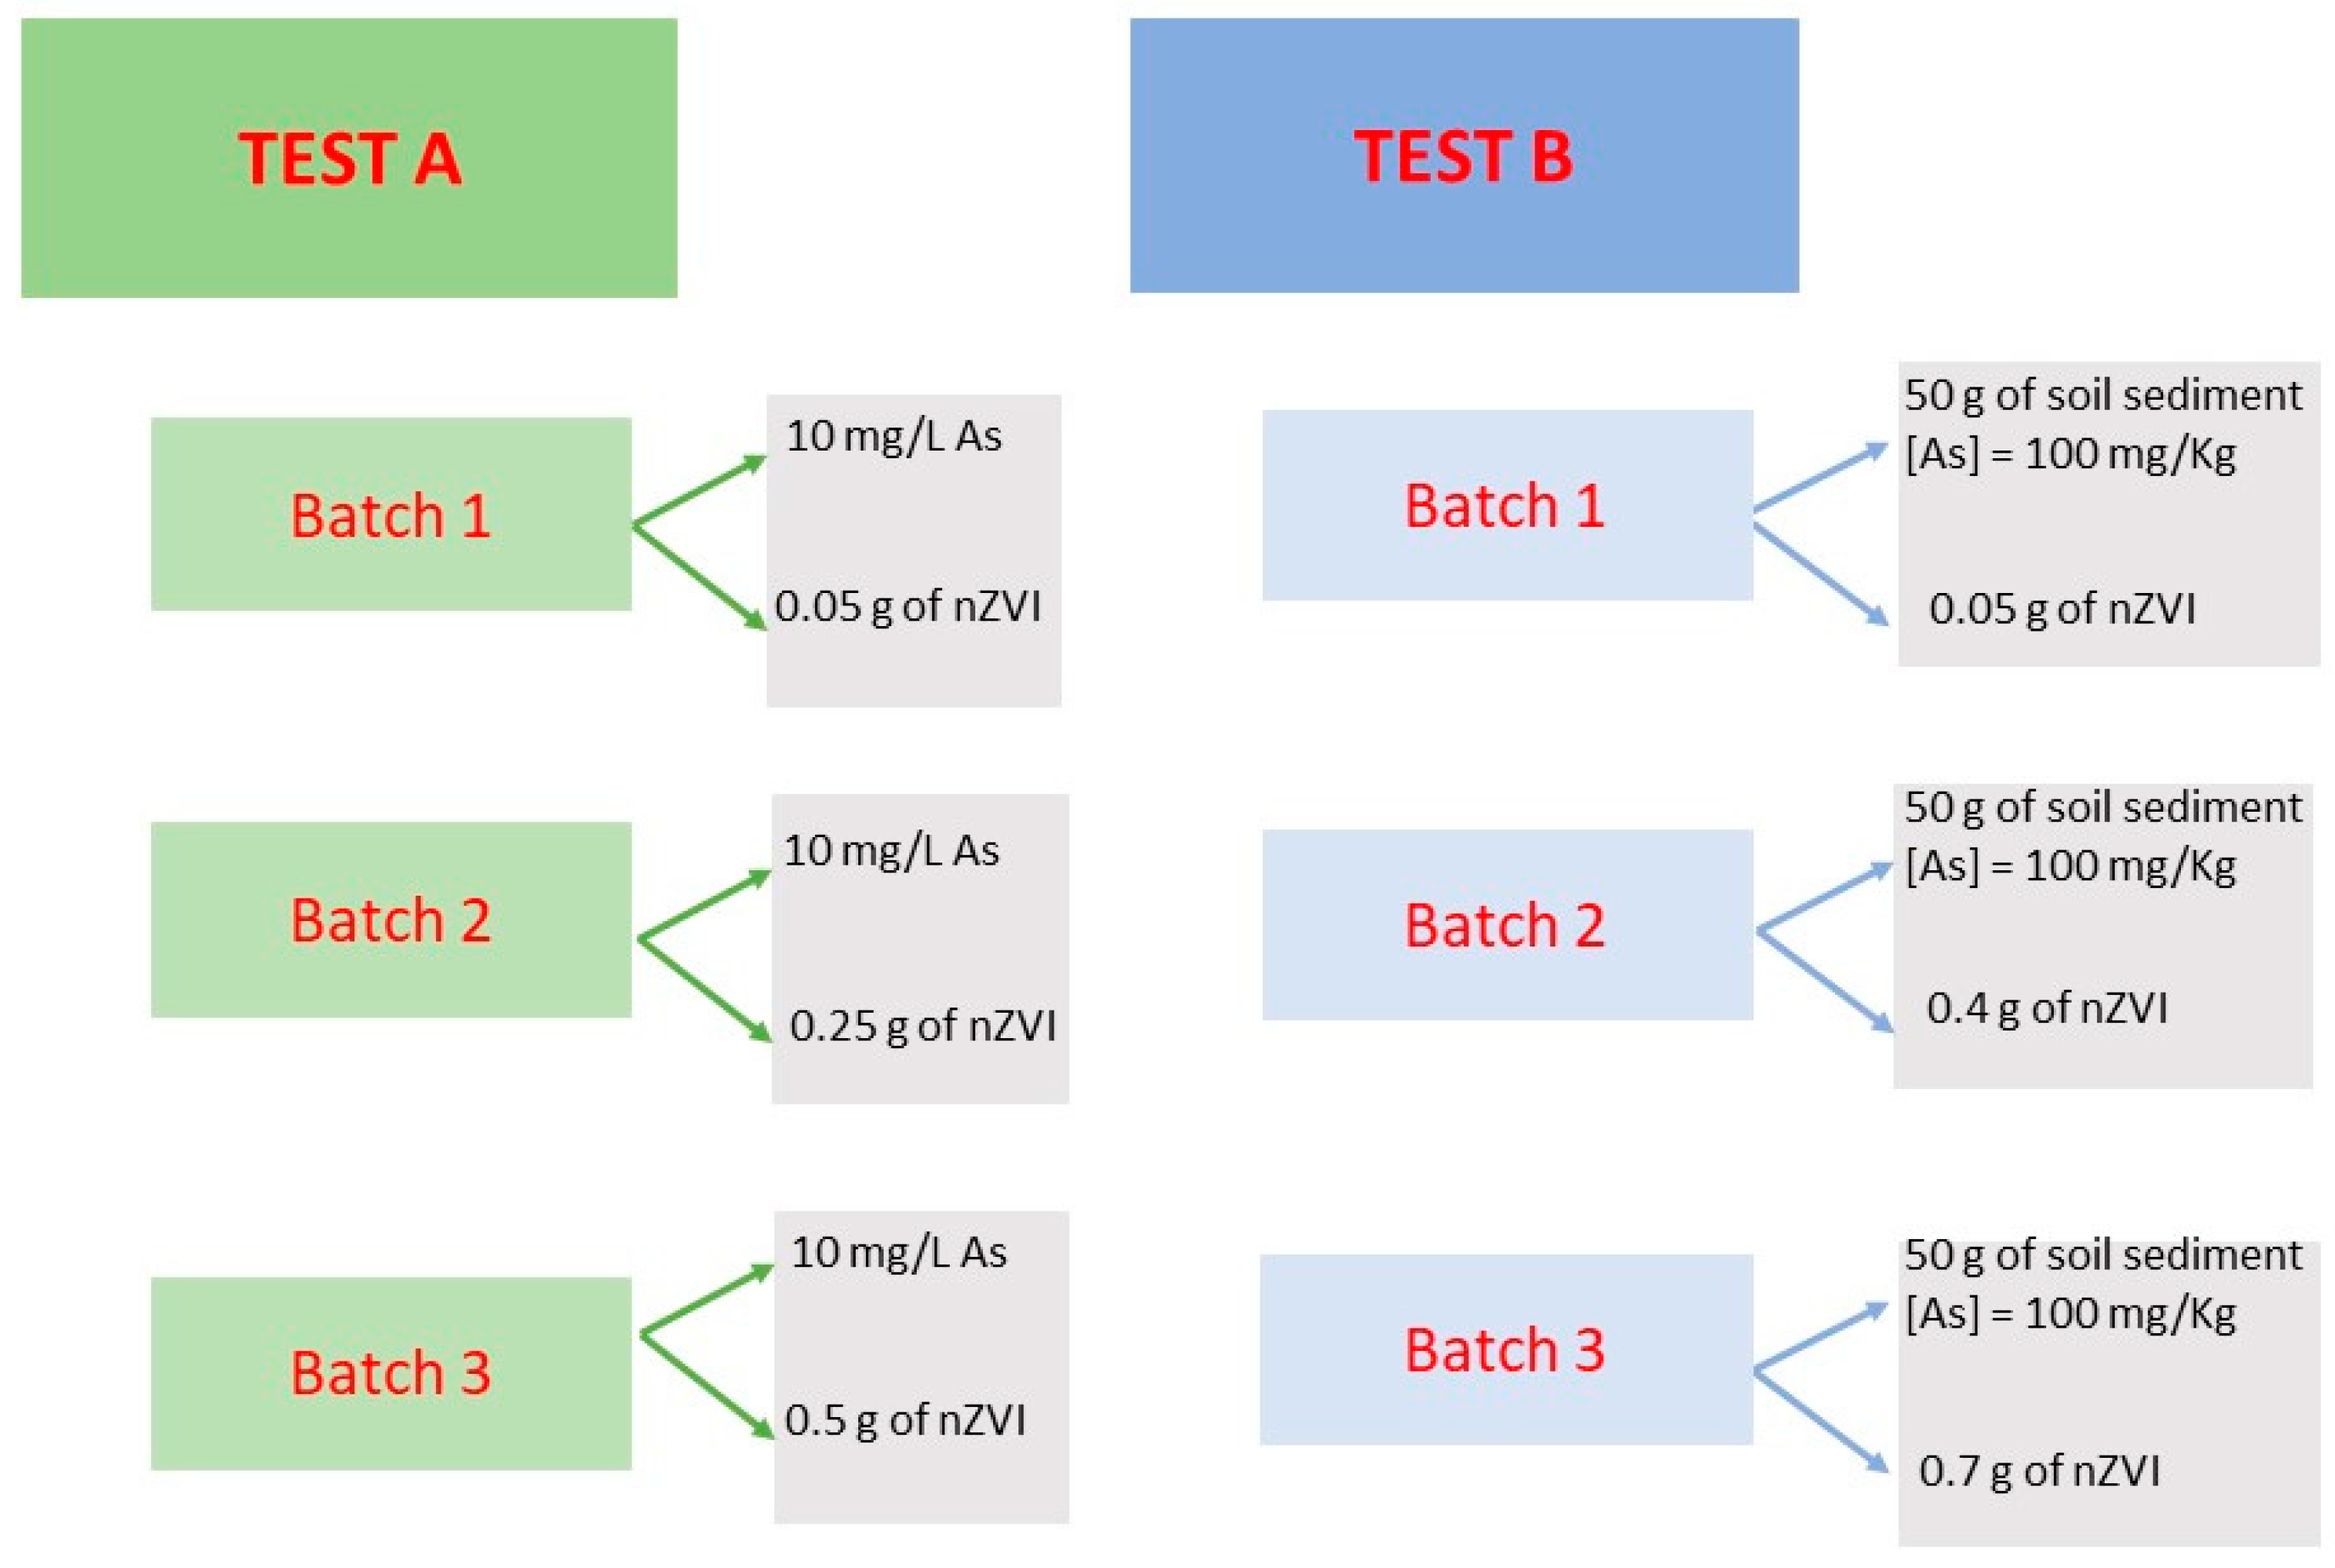
One Nanofer25S sample (500 g), with a concentration equal to 250 g/L, was stored in a freezer, at a 5 °C temperature, in order to reduce the corrosion rate. The tests were performed with closed batches and for a limited time to avoid further oxidation phenomena and avoid reducing the treatment effectiveness of arsenic concentrations in water due to interaction with oxygen. As shown in Figure 2, two tests were carried out:
-
Test A: experiment carried out on arsenic-contaminated water (HAsNa2O4 ∗ 7H2O) with nZVI injection;
-
Test B: experiment carried out on a sample of arsenic-contaminated sediment with nZVI injection.
The batch tests involved the analysis of the As concentrations in the water samples, taken from the batches after interacting with the nZVI. The water samples were analyzed at the Laboratory of Geochemistry of the Department of Earth Sciences of the University of Rome “La Sapienza” (Italy). Dissolved As concentrations obtained from collected samples were all determined by an inductively coupled plasma-mass spectrometer (ICP-MS X Serie II of Thermo Fisher Scientific, Dreieich, Germany) following filtration (0.45 μm) and acidification (to 3% with HNO3). The analytical accuracy of these methods ranged from 2 to 5%. An internal standard, Rh, was used to correct the ICP-MS instrumental drift. Ultrapure water (Millipore, Burlington, MA, USA, Milli-Q, 16 MΩ cm) was used in preparing blanks, standard solutions, and sample dilutions.

2.1. Test A

Test A required the preparation of three batches with a volume of 500 mL, containing a standard solution (tap water + As) at a given concentration (Figure 2). The standard solution was prepared by dissolving sodium arsenate heptahydrate in water (HAsNa2O4 ∗ 7H2O) [36], with an As concentration of 10 mg ∗ L−1 in each batch (Figure 2). Table 2 shows the compositions of batches used during Test A.
Three different amounts of nZVI were added separately for each batch. However, before injecting the nanoparticles into the batch, a sample of standard solution was analyzed to be used as a control experiment. Table 3 shows the electrical conductivity values of the blank control sample, at the beginning and at the end of the experiment.
After preparing the batches, they were placed on a benchtop orbital shaker table set at 110 rpm. The experiment lasted about 26h, obtaining a water sample every hour and a half.

2.2. Test B

Test B involved the preparation of three batches (Figure 2). Each batch consisted of water (VolWATER ~ 500 mL) and sediment, with a mass equal to 50 g (Figure 2). The sediment sample, before the set-up of the batches, was dried in an oven at 100 °C for to 24 h in order to remove its natural water content. For this experiment, a homogenized sediment aliquot <2 mm was considered. Sediment samples were characterized by an As concentration equal to 100 mg/Kg (c.a.) (Figure 2). Tap water was used for the test. Before injecting the nZVI into the batches, they, with only water and sediment, were placed on a benchtop orbital shaker for 24 h, in order to have arsenic desorbed by the sediment and dissolved in water. After 24 h, a water sample was collected from each batch and set as a reference. Then, three amounts of nanoparticles were injected into the batches. The nZVI amounts for Test B, defined according to bibliographic research [37], are shown in Table 4.
Table 5 shows the electrical conductivity values of the blank control samples.
The experiment lasted about 72 h, obtaining one water sample every hour and a half. The water samples were collected and suitably filtered with a 0.22 μm filter in order to eliminate the sediment particles, as that they would have changed the results of the analysis of the water samples. Water samples, thus obtained, were analyzed through ICP-MS.

3. Results and Discussion

Several studies [19,38,39] have demonstrated that nZVI can immobilize high levels of As(III) and As(V), under laboratory and field conditions. In fact, while the surface oxide of iron hydroxide (oxidizing power) absorbs As5+ and As3+, the core (Fe0) reduces the adsorbed As5+ to As3+, forming an As–Fe intermetallic phase adjacent to the Fe0 core [33,40]. Studies in the literature [21,41,42,43] have shown that As5+ can be reduced to either As0 or As3+, as confirmed by X-ray absorption spectroscopy analysis. The remaining As5+ can be adsorbed onto iron oxides (Fe(OH)3) in the outer layer of the iron nanoparticles. The As3+ form, thus formed, is adsorbed or co-precipitated in the iron nanoparticle surface. Studies in the literature [41,44] have shown that the 51% of the surface-bound arsenic remains as As3+, meanwhile 14% and 35% of the total arsenic are transformed to As5+ by iron oxides and to As0 by the Fe0 core, respectively. The main results of the experiments (Test A and Test B) carried out in our laboratory are shown below.

3.1. Test A

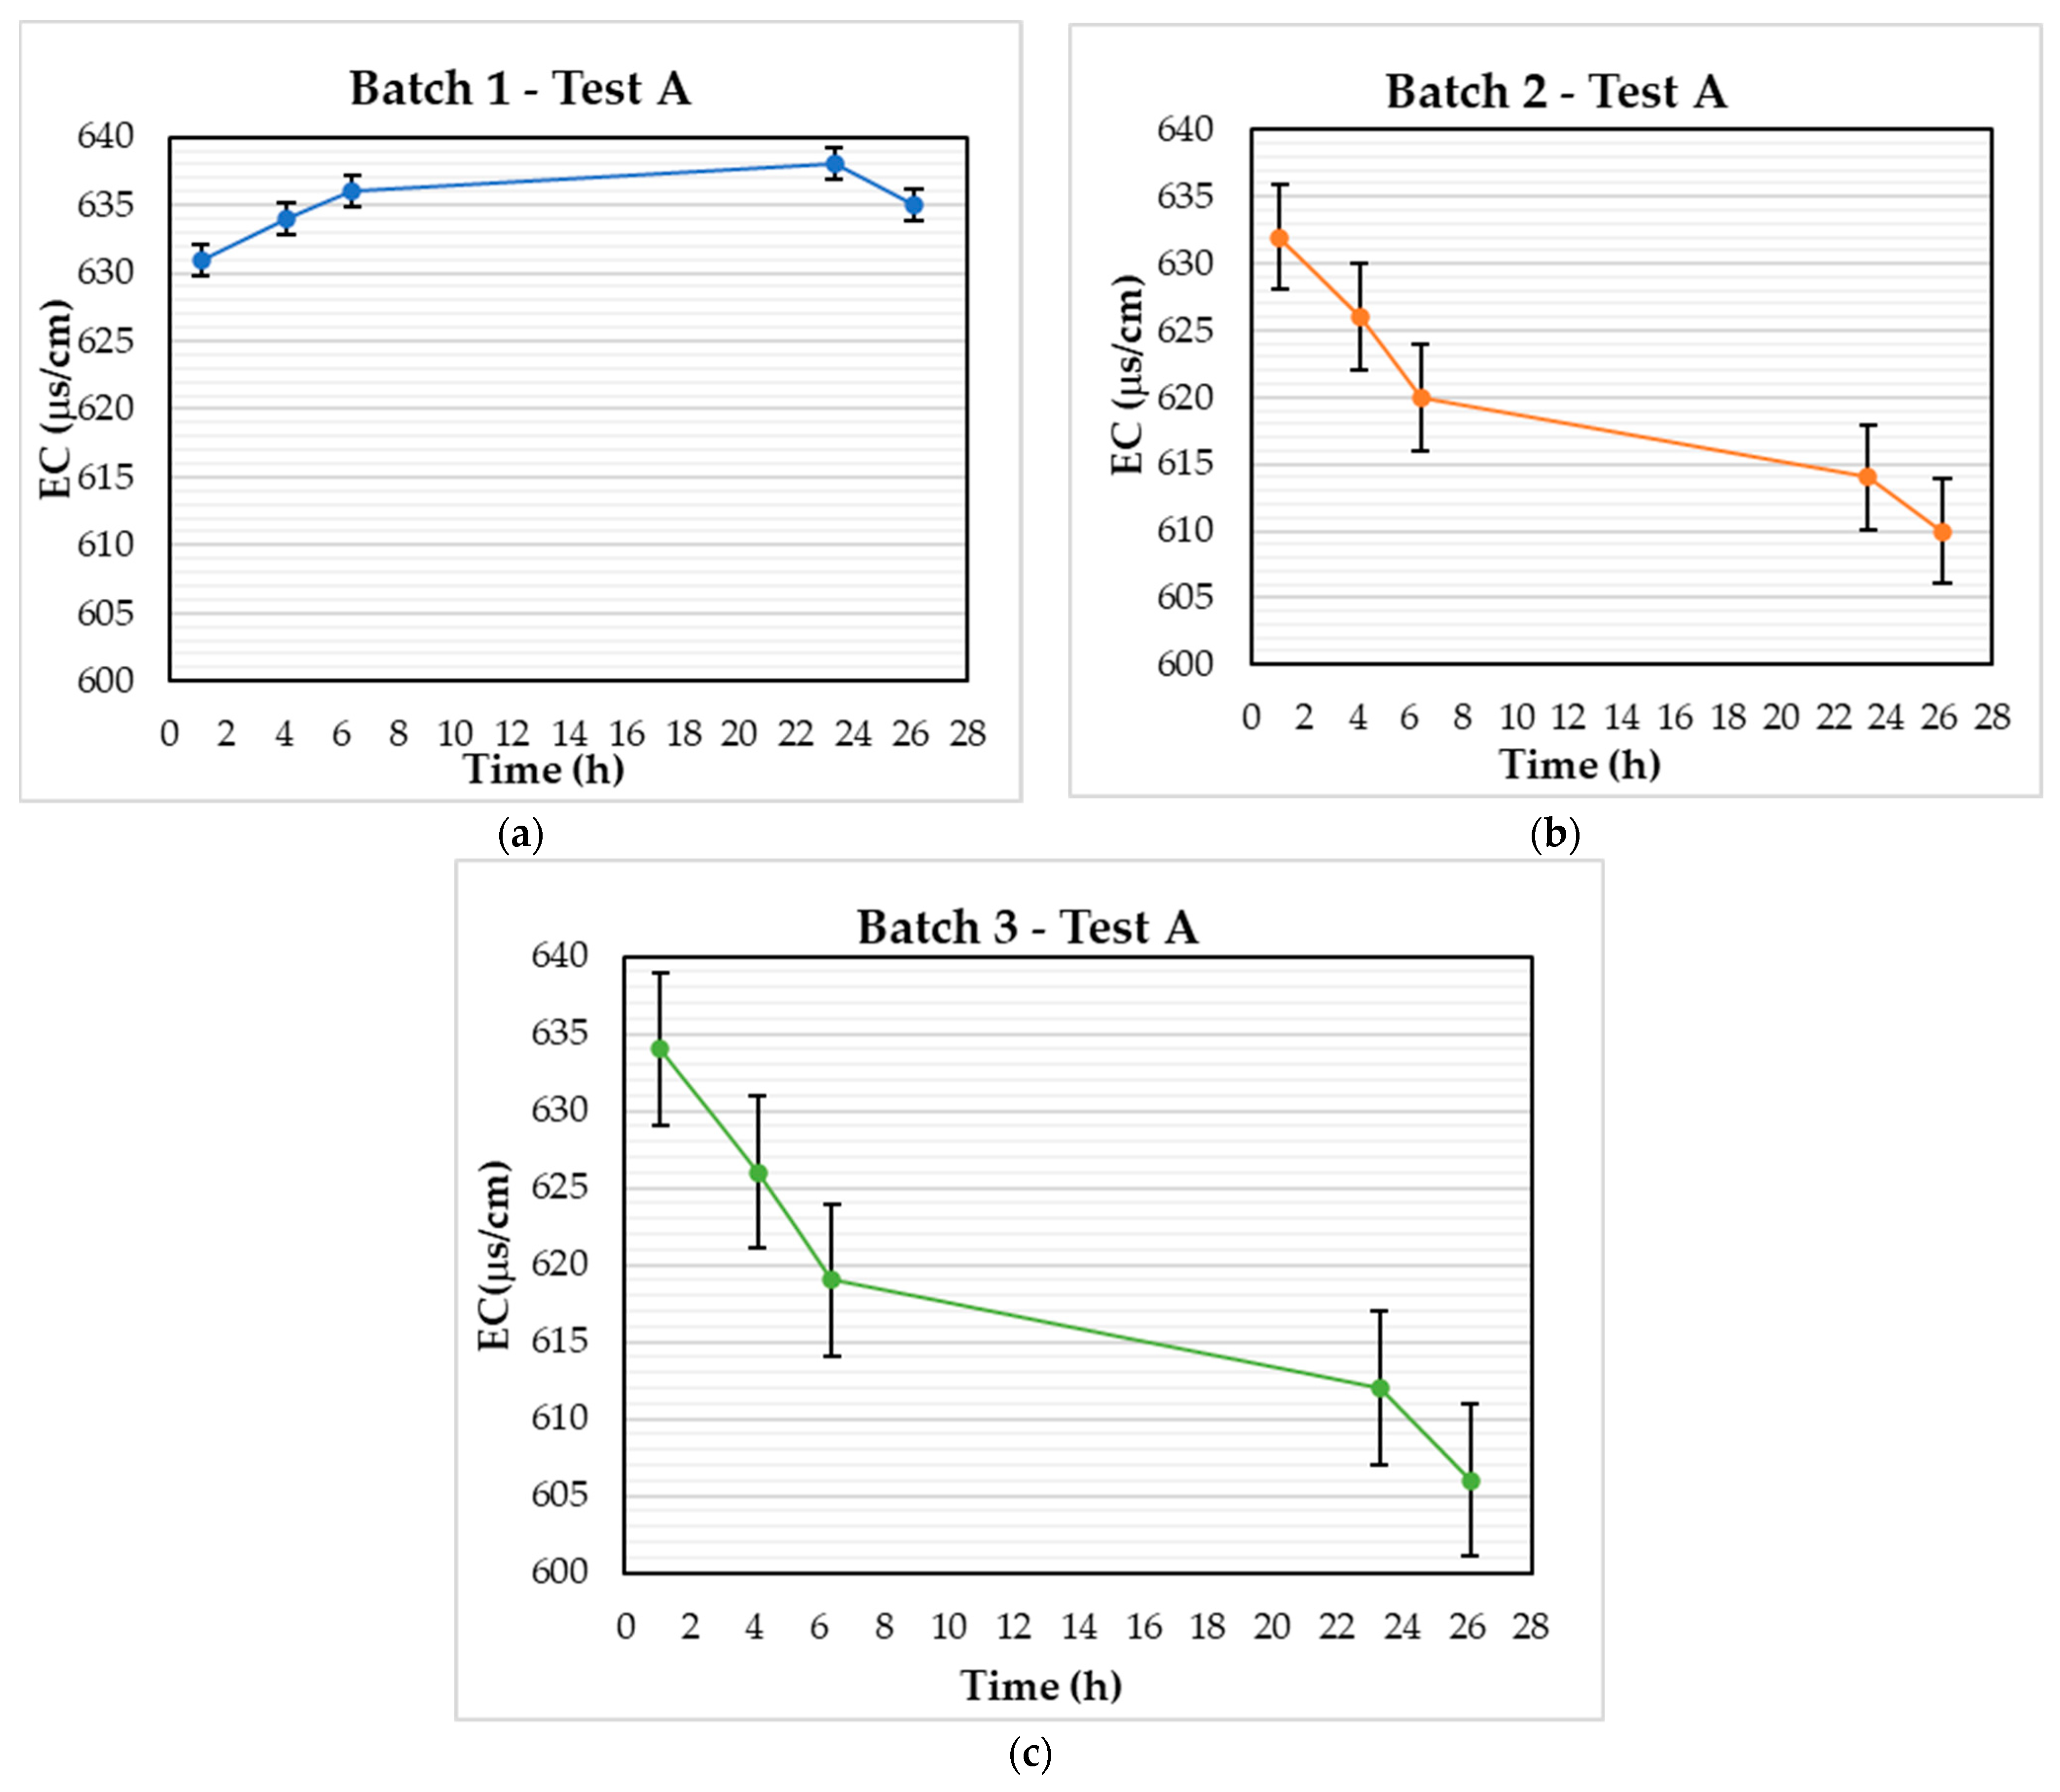
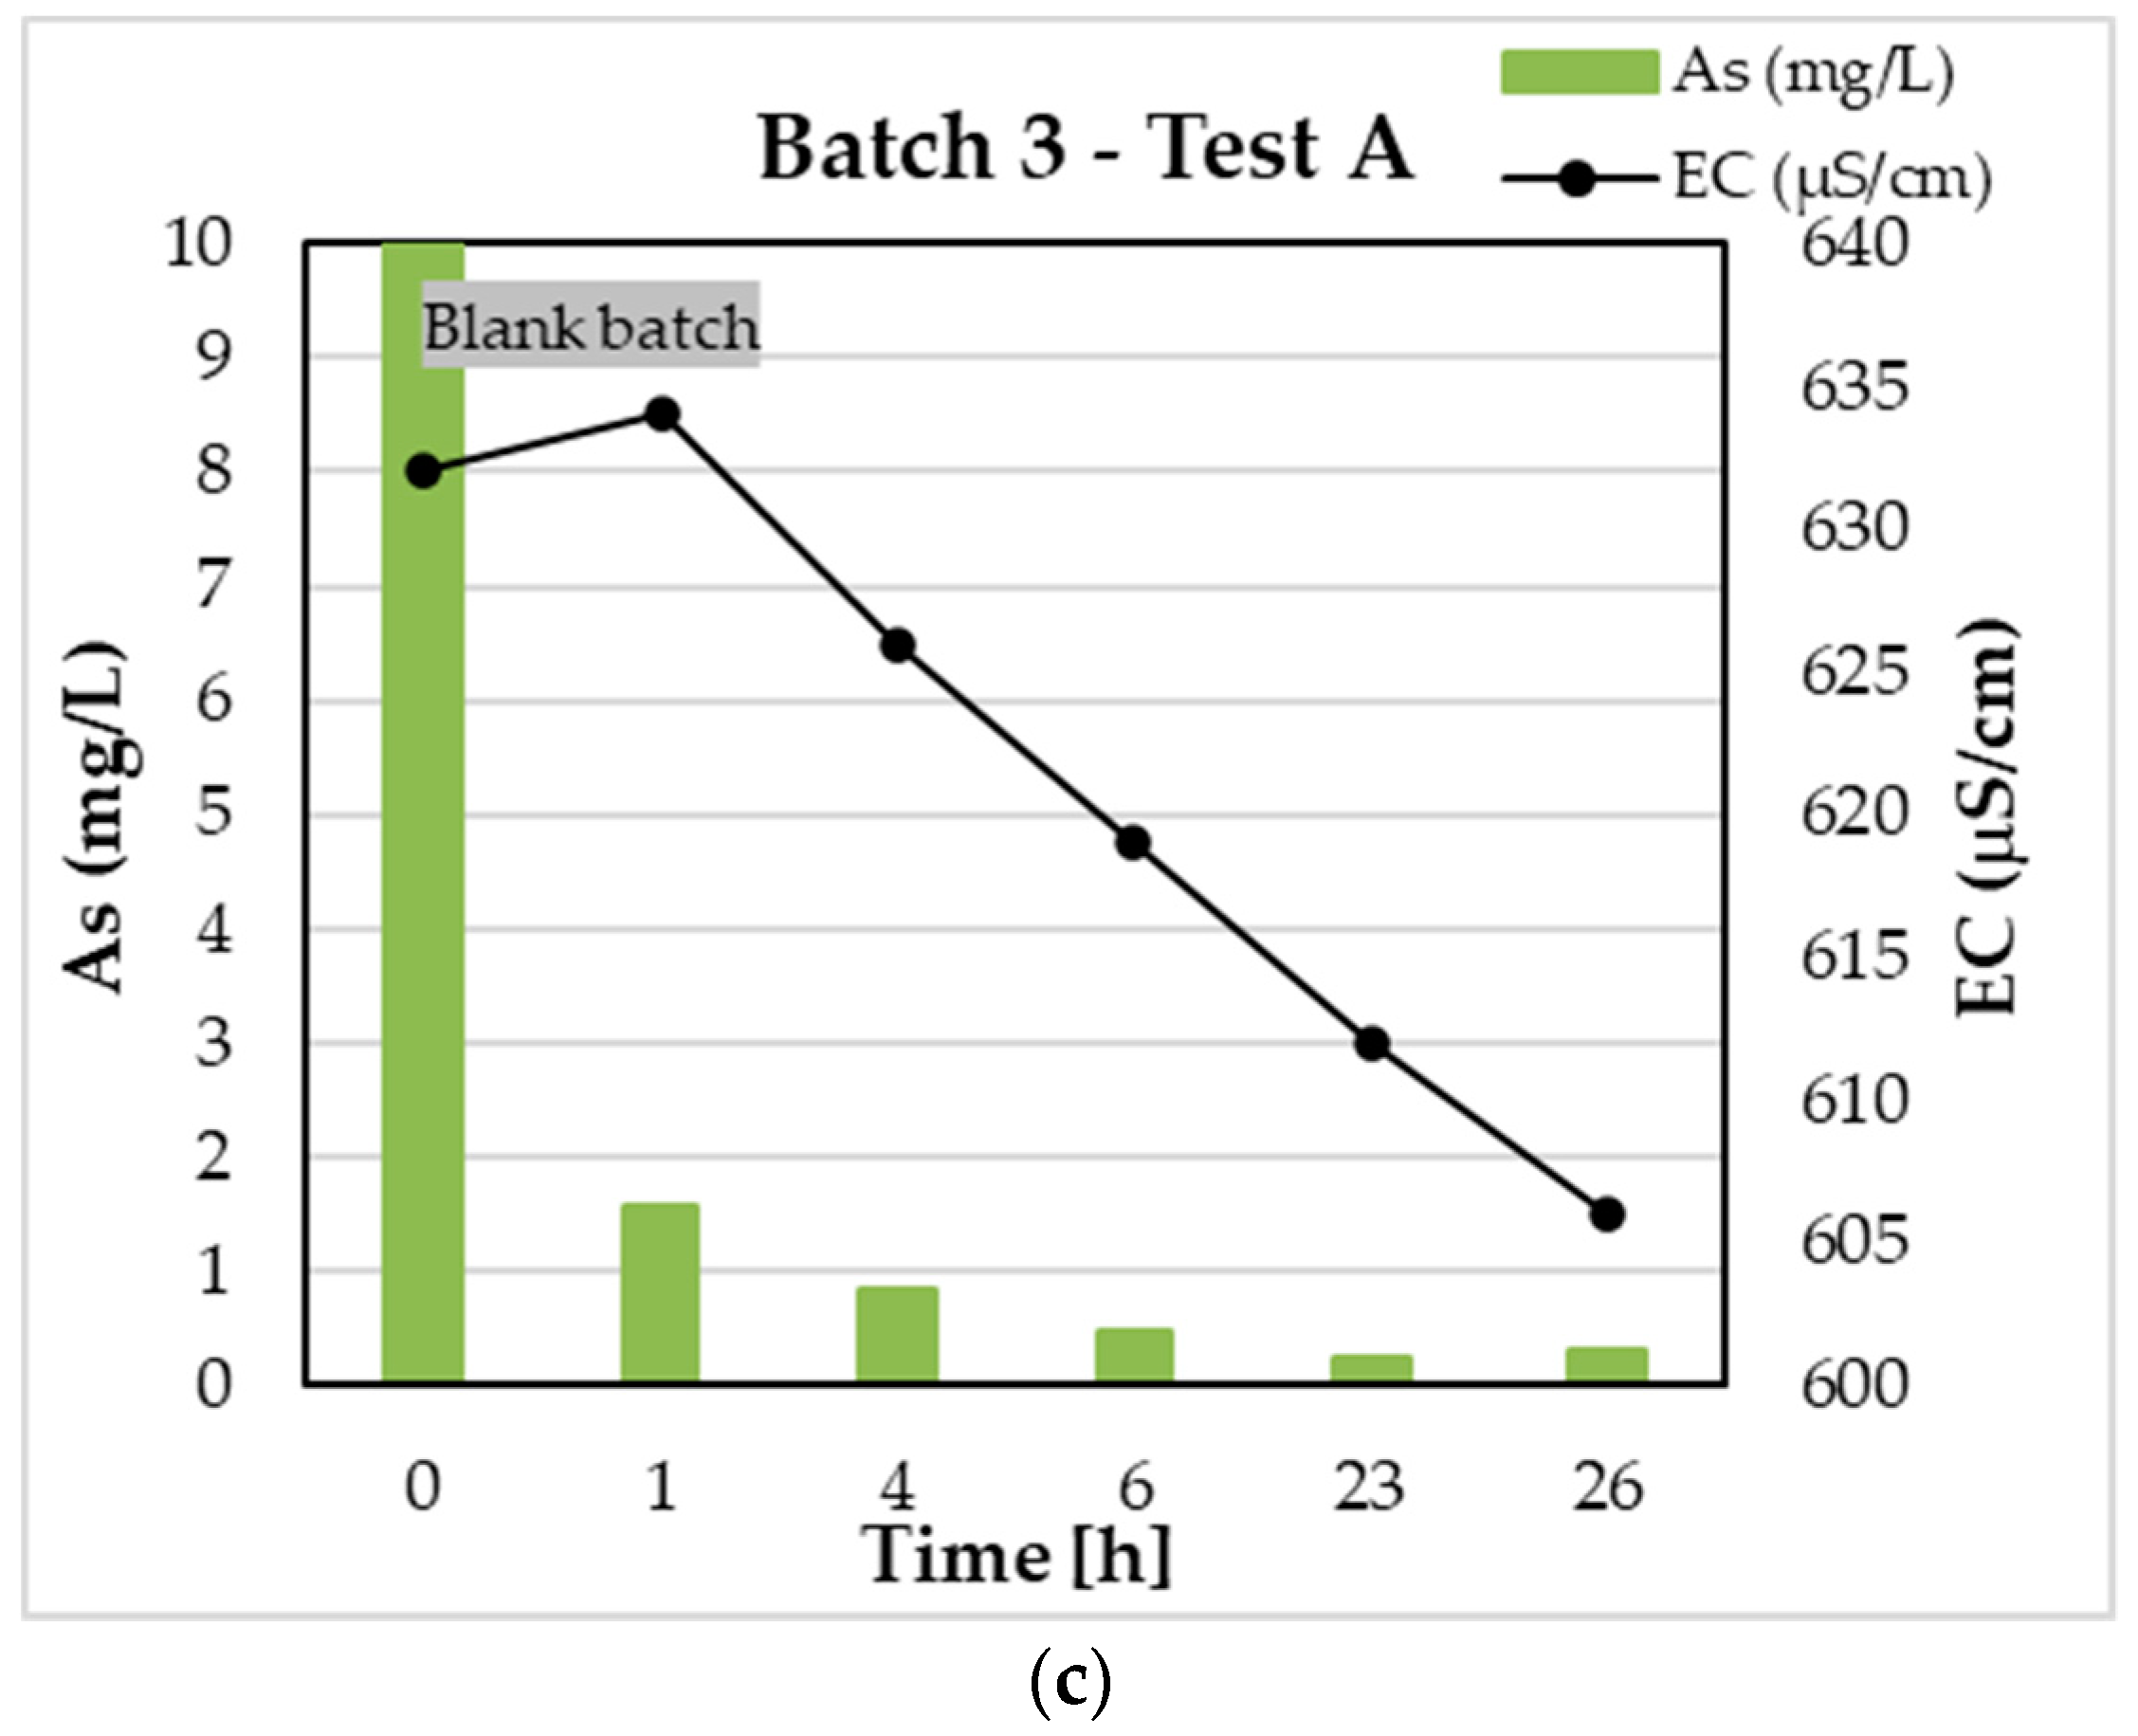
The electrical conductivity (EC) is the measure of the capacity to conduct electrical current. If the quantity of dissolved substances, chemicals, and minerals in the water is greater, the EC values increase. Therefore, some “anomalous” increases in electrical conductivity can be indicators of contamination phenomena occurring in water. Therefore, in order to verify the effectiveness of the nZVI treatment on arsenic-contaminated water, the electrical conductivity in the batches was measured before each water sampling. Figure 3a–c shows the electrical conductivity trend for Test A.
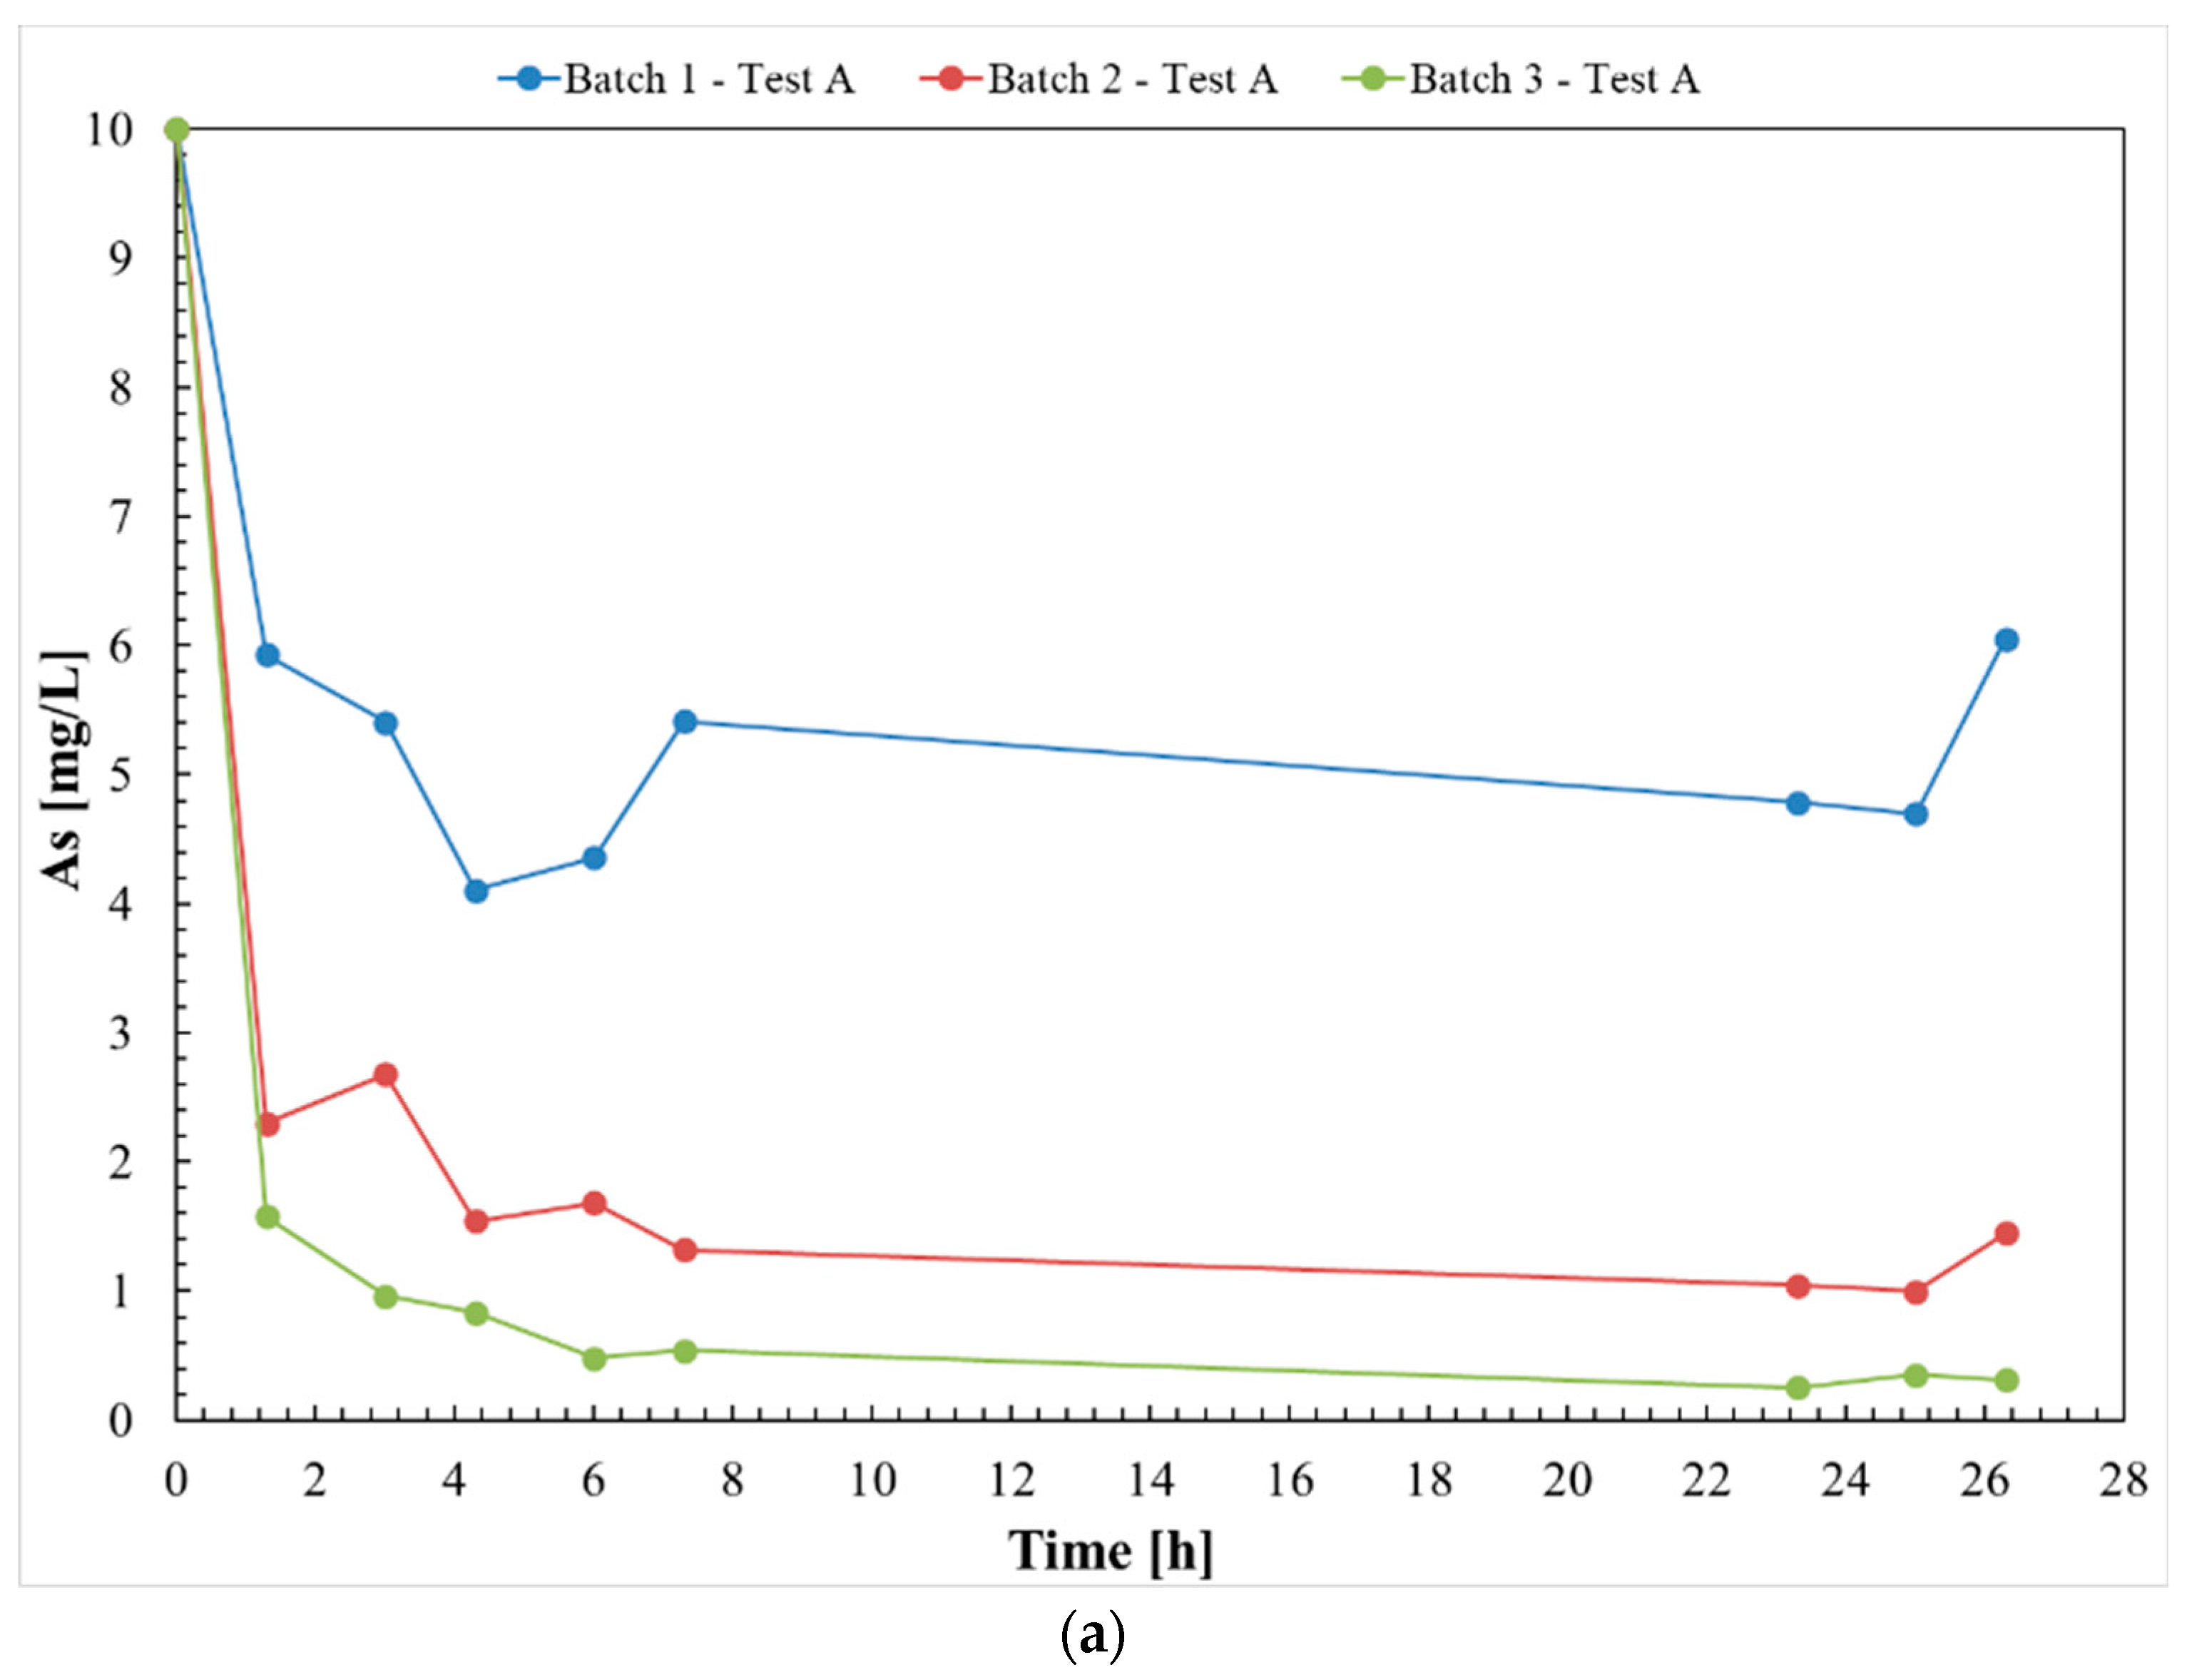
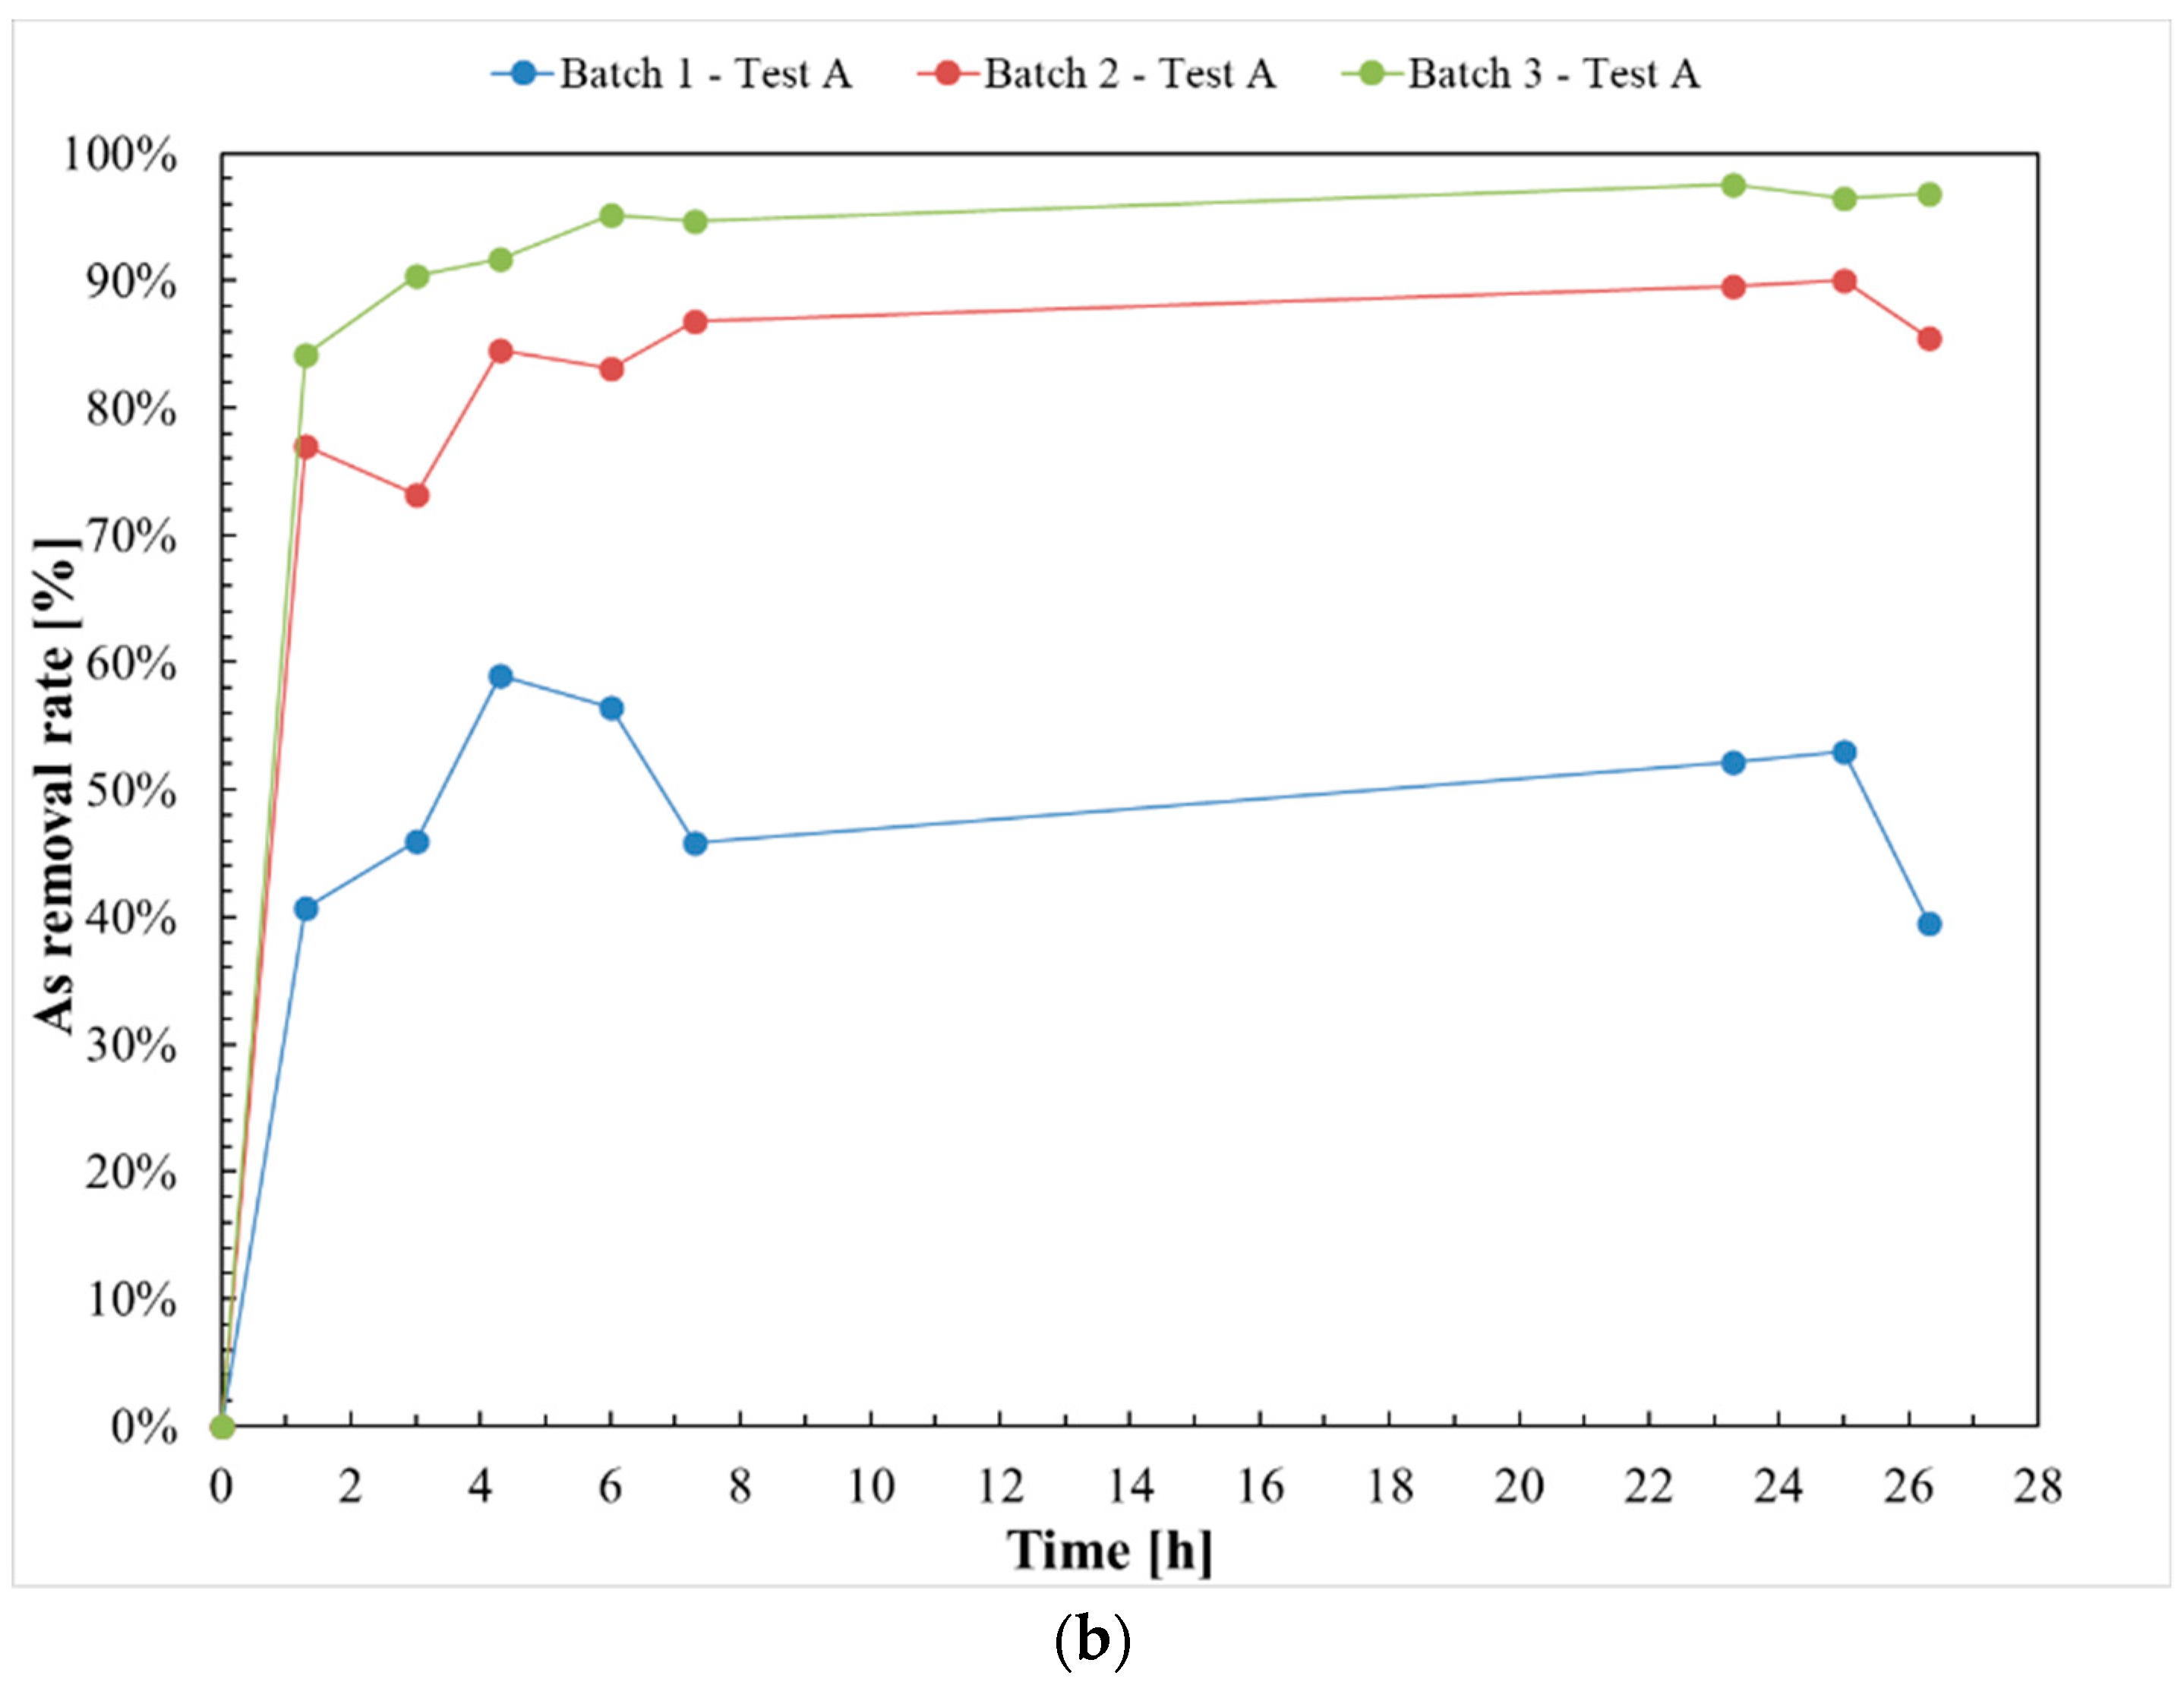
Figure 3a shows that for Batch 1, with lower quantities of nanoparticles (equal to 0.05 g), the EC values tend to increase progressively up to 638 μS/cm and then decrease. On the other hand, for the other two batches with higher amounts of nanoparticles, Batch 2 with 0.25 g of nZVI (Figure 3b) and Batch 3 with 0.5 g of nZVI (Figure 3c), there is a progressive reduction in electrical conductivity during the test. As already shown in Table 2, Batch 1 contains a nZVI mass equal to 0.05 g, the lowest of the three batches. Nevertheless, the nZVI mass of Batch1 does not appear to be suitable for a significant reduction of the As concentrations. In fact, this is proved by the trend of As concentrations over time, as shown in Figure 4a,b.
The results of the water analysis in Figure 4a show uniform behavior for the As concentrations in the three batches, with a gradual reduction of the As concentrations in solution, several hours after the beginning of the As–nZVI interaction. Furthermore, Figure 4b shows the removal rate of the As concentrations in solution. The removal rate of the As concentrations shows an increasing trend over time with the contemporary increase of nZVI mass in the batches. The lowest removal rate, equal to 40%, occurs in Batch 1; on the contrary the highest removal rate, equal to 98%, occurs in Batch 3, after 24 h. The results of Test A are also in agreement with several studies showing the use of a little mass of nZVI to obtain significant reductions of As concentrations [33,45,46,47]. A study by Rashid et al. [33] showed that in a batch experiment, consisting of a 500 mL bulk solution with an As concentration of 10 mg ∗ L−1 and a mass of nZVI equal to 0.5 g, the final As removal efficiency (after 2h) was reported as 99.57%. For Batch 2 and Batch 3, it is possible to verify that the removal rate is higher than 85% after 6h of reaction. Similar results have been reported from other investigations; Biterna et al. [45] reported 99.9% removal of arsenate at pH 7 ± 0.2 and 90% at pH 4 ± 0.2 after 6h of reaction; Bang et al. [46] reported 99.8% removal of arsenate at pH 6 after 9h of reaction; and Sunt et al. [47] found over 95% removal at pH 8.28. Batch 1 shows the lowest removal rate of arsenic concentrations, with the highest value of 56% after six hours from the test beginning. This result is confirmed by the trend in electrical conductivity, shown in Figure 3a–c. For Batch 1, the small mass of nanoparticles does not appear to be suitable for a significant reduction of As concentrations. Once the saturation condition of the active sites on the nZVI surface available to immobilize arsenic is reached, the As concentrations in solution tend to stabilize. So, the As concentration does not decrease, but it remains in solution, thus causing increases in EC values until the stabilization in the final phase. This proves that the nanoparticles have become inactive. Figure 5a,b shows the trend between the As concentrations in solution and the electrical conductivity for the batches.
The results for Batch 2 (Figure 5b) and Batch 3 (Figure 5c) show that as the As–nZVI interaction time increases, the electrical conductivity decreases with the time, up to 610 μS/cm for Batch 2 and 606 μS/cm for Batch 3. This behavior is linked to the As concentration decreasing in solution. On the contrary, there is an inverse behavior for Batch 1 (Figure 5a), where the As–nZVI interaction in time increases as the electrical conductivity increases. However, the increase in the electrical conductivity values for Batch 1 does not seem to be related to a release of As in solution, as shown in Figure 5a. On the contrary, there is a decrease in the As concentrations in solution up to stabilization of Batch 1. However, this As reduction for Batch 1 is as not significant as Batch 2 and Batch 3, with the highest nZVI masses. So, the increase in EC values could be associated with the saturation of the active sites available on the nZVI surface to immobilize arsenic. During the experiment, as the nZVI–As interactions increase, the As concentrations tend to decrease, first rapidly and then slowly, due to the progressive saturation of the active sites on the nanoparticles to immobilize arsenic. Therefore, as the active sites decrease, it is possible that the electrical conductivity may also increase due to the presence of arsenic in solution, as in fact shown for Batch 1 in Figure 5a, until it stabilizes. On the contrary, for Batch 2 (Figure 5b) and Batch 3 (Figure 5c), there is a significant reduction of the EC values due to the considerable reduction of the As concentrations in solution.
Moreover, the As adsorption capacity of nZVI was calculated according to the following equation [48,49,50]:
q e = ( c As 0   c Ase ) V m nZVI
where qe is the amount of adsorbed As at equilibrium in mg ∗ g−1, cAs0 is the initial mass concentration of As in mg ∗ L−1, cAse is the mass concentration of residue As in the solution at the equilibrium in mg ∗ L−1, V is the volume of the solution in L, and mnZVI is the dose of nZVI used in g. The equilibrium condition represents the instance in which the As concentrations in solution tend to stabilize, once the saturation condition of the available sites on the nZVI has been reached. When the solute concentration in the solution is in equilibrium with the solute concentration on the surface, the condition of thermodynamic equilibrium has been reached, which means that the As adsorption capacity of the nZVI is finished. According to the results of the water analysis for the three batches, the As equilibrium concentration was calculated after 4h of agitation, as the As concentrations tend to stabilize. Table 6 shows the results of the As adsorption capacity of nZVI.
The results in Table 6 show that, as the dose of nZVI used in the batches (mnZVI) increases, the mass concentration of residue As in the solution at the equilibrium decreases (cAse) and therefore the concentration of absorbed As on the nZVI (cAs0–cAse) increases due to the immobilization action of the nanoparticles. The results of Test A demonstrate a good effectiveness of the nZVI to reduce the As concentrations in solution within the first hours even with low nZVI mass. According to the results, the optimal conditions are shown for Batch 2 and Batch 3, with masses respectively equal to 0.25 and 0.5 g of nZVI in the batches and a maximum removal rate of As concentrations with the range between 90% and 98%. The results Table 6 show the concentrations of As absorbed (cAs0–cAse) on the nZVI, with a range between 5.10 mg ∗ L−1 (mnZVI = 0.05 g) and 9.54 mg ∗ L−1 (mnZVI = 0.5 g). Test A, in fact, shows that as dose of nZVI increases for the three batches, the mass concentration of residue As in the solution at the equilibrium (cAse) decreases, from 4.90 mg ∗ L−1 to 0.460 mg ∗ L−1. In fact, the mass of adsorbed As on the nZVI (cAs0–cAse ∗ V) increases from 2.55 to 4.77 mg (Table 6). Nevertheless, as the dose of nZVI (mnZVI) in the batches increases much more than the mass of adsorbed As on the nZVI (cAs0–cAse ∗ V), so the residual concentration in the adsorbent (qe) decreases up to 9.54 mg ∗ g−1 (Table 6). Similar results have been reported from other investigations: Wu et al. [48] demonstrated that the adsorption of arsenic by green synthesized iron nanoparticles (nFe) is fitted by the pseudo second-order kinetic rate equation, showing values of concentration of As absorbed on the nZVI increase as the concentration of nZVI increases. Ainiwaer et al. [49] reported that the equilibrium adsorption amounts were 38.44 ± 0.59 mg ∗ g−1 and 40.66 ± 0.21 mg ∗ g−1 for As(V) and As(III).
The results also show that when the saturation conditions of the nZVI active sites occur, the As concentrations in solution tend to stability, due to the nanoparticles becoming inactive. This phenomenon is linked to the decrease of active sites on their surface available to immobilize arsenic. This phenomenon shows a long time for total arsenic removal, according to many experiments from the literature [43,47,48,49,50,51], and also highlights the need to carry out more injections of nanoparticles, especially for field applications.

3.2. Test B

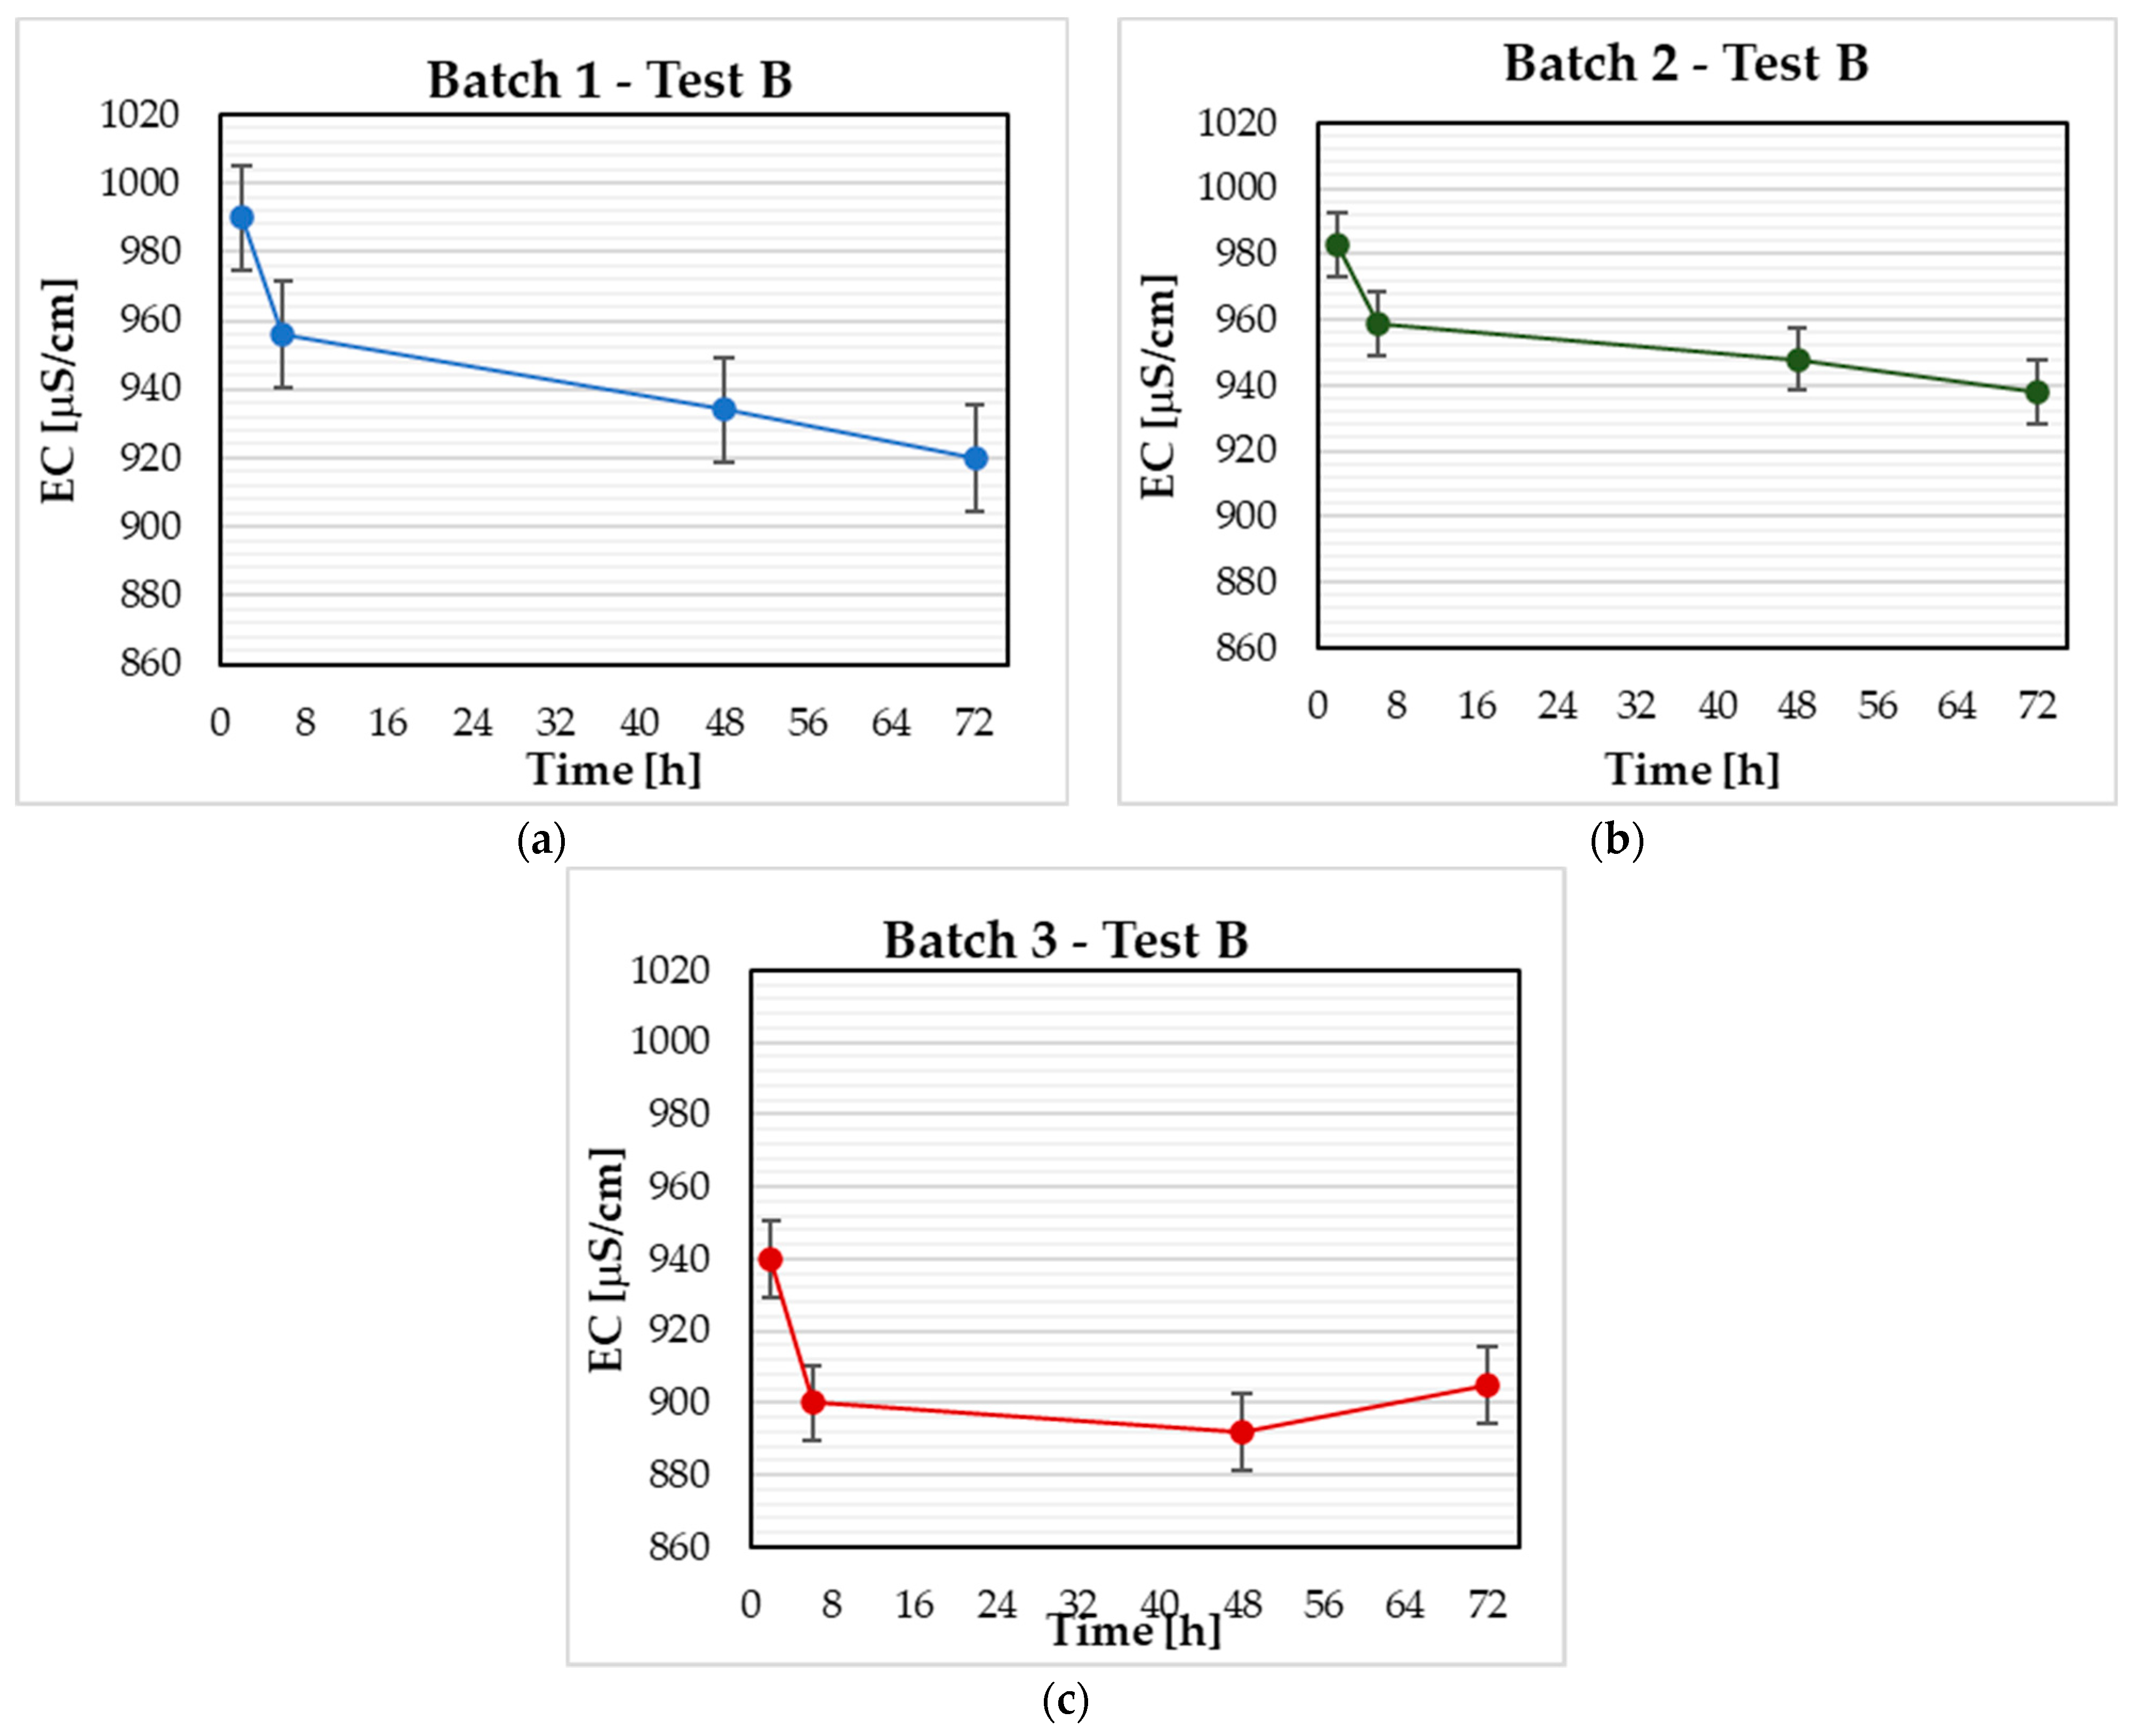
Test B lasted 72 h and involved the preparation of three batches (Table 5) with a total volume for each batch equal to 500 mL. Figure 6a–c shows the trend of the electrical conductivity during the experiment.
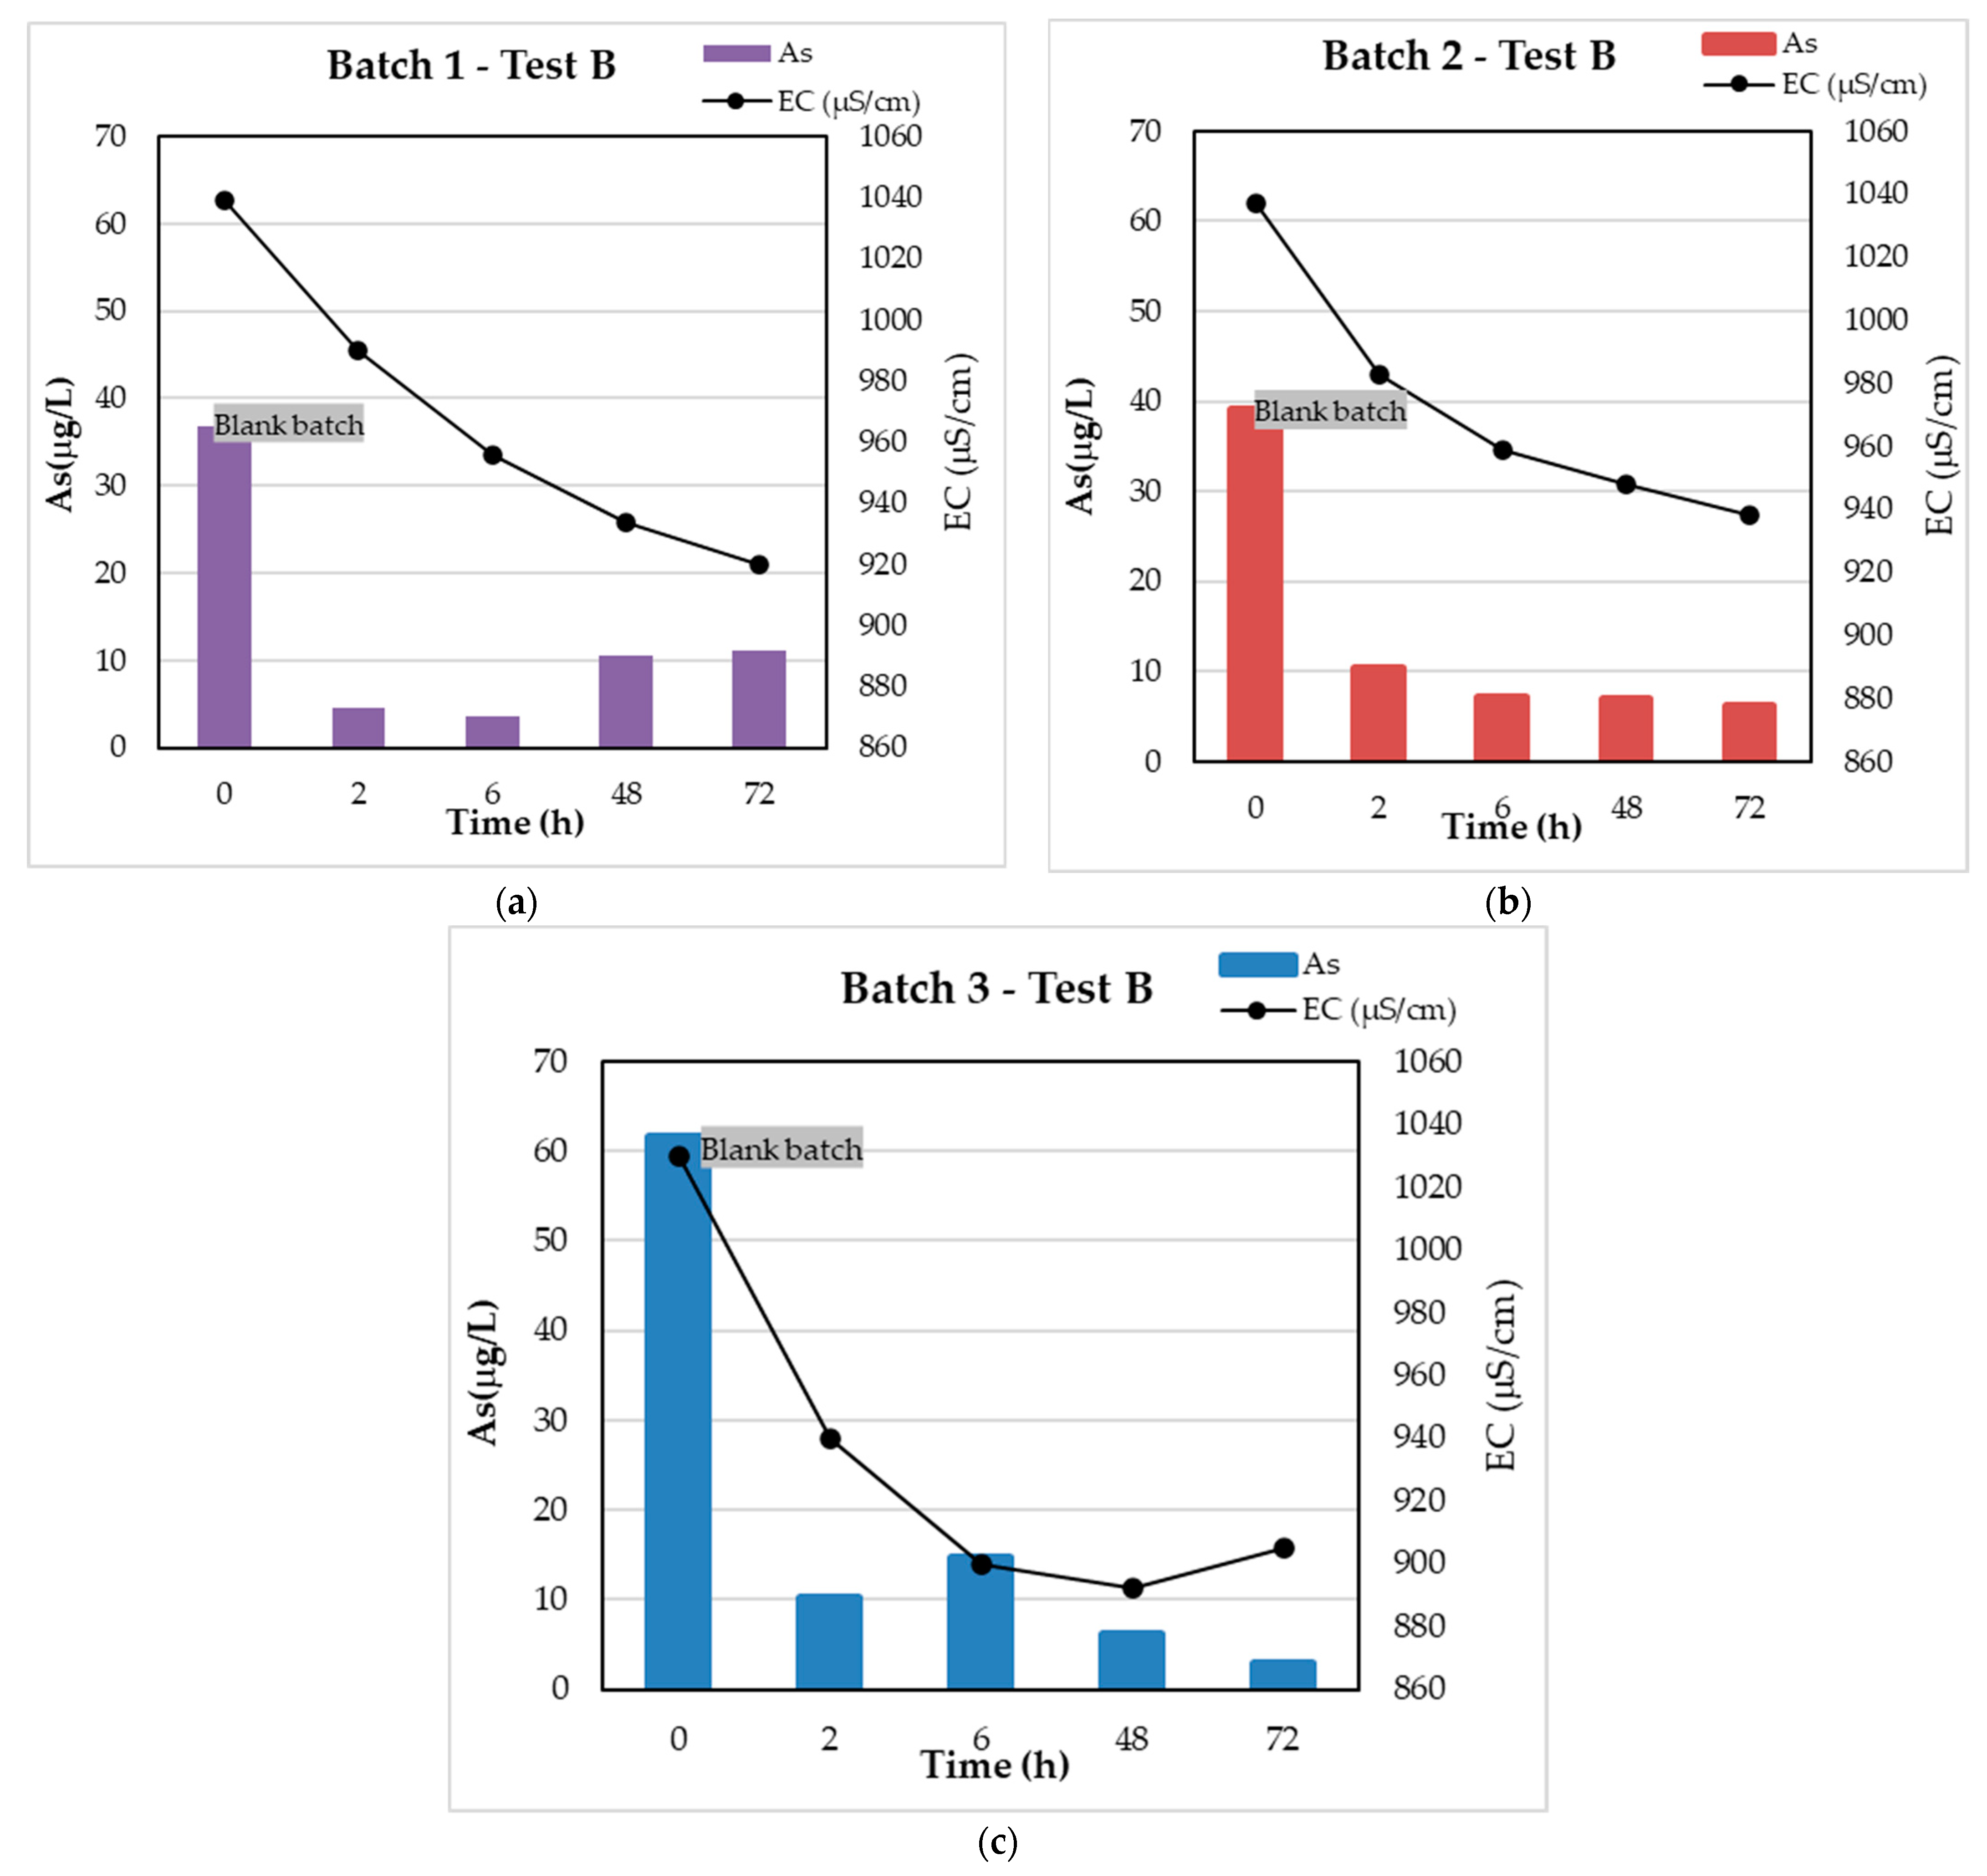
Figure 6a–c shows a decreasing trend for the three batches, with values in a range between 890 mS/cm (minimum) measured in Batch 3, and 990 μS/cm (maximum) measured in the blank sample of Batch 1. In particular, the decrease in electrical conductivity is higher for Batch 3 (Figure 6c), with a nZVI amount of 2.8 mL. This behavior, concerning electrical conductivity, is an index of the effective action of the nanoparticles. In the same way as in Test A, the progressive reduction in electrical conductivity for the water samples is linked to the action of the nanoparticles capable of absorbing arsenic on their surface. Figure 7a,b shows the results of the As concentrations in solution (Figure 7a) and the As removal rate (Figure 7b).
Figure 7a shows that the As amount, desorbed from the sediment and placed in solution, is not constant for the batches. The initial concentrations of arsenic in solution, indeed, range between a minimum of 36.83 μg/L for Batch 1 and a maximum of 61.62 μg/L for Batch 3. Even if the As concentration in the sediment sample is known (c.a. 100 mg ∗ Kg−1), the variation of the As initial concentrations in solution demonstrates a difficulty to establish a priori the actual amount of arsenic in solution, and hence the initial arsenic concentration. After the first hours of the experiment, the As concentration in solution reaches a steady state, due to the progressive decrease of the available sites on the nZVI surface. While the experiment continues and the nZVI–arsenic interaction time increases, the As concentrations in solution reach a steady state condition due to the nZVI inactivity, i.e., they have depleted all the available sites to immobilizing arsenic. This behavior is also confirmed by the trend of the As reduction rate [33,47], shown Figure 7b. In fact, the trend of the As removal rate, in Figure 7b, shows that while the nZVI amount in the batches increases, the As concentration in solution decreases. For Batch 3, characterized by the highest amount of nZVI, the decrease in As concentrations in solution reaches the maximum value of 99% one day after the start of the test. The other two batches, with lower quantities of nanoparticles, also show substantial reductions in As concentrations in solution, with maximum values equal to 90% for both batches. The results for Test B are in agreement with similar studies [33,45,46,47]. In the final phase, i.e., 48h after the beginning of the experiment, the As removal rate moves to a steady state condition due to the saturation of the sites available on the surface of the nanoparticles. This phenomenon confirms the issue related to the long duration of arsenic removal processes, described in several studies from the literature [43,47,48,51,52]. The relationships between As concentrations in solution and electrical conductivity (EC) are shown in Figure 8a–c.
Figure 8a–c shows that, as the As–nZVI interaction time increases, the electrical conductivity and the As concentrations in solution decrease. These reductions are greater for Batch 3 (Figure 8c), which is the one with the highest number of nanoparticles. These results are determined by the immobilization action of the arsenic on the nZVI, which leads to low electrical conductivity values.
The As adsorption capacity of nZVI was calculated according to Equation 1. As for Test A, the mass concentration of residue As in the solution at the equilibrium (cAse) was calculated after 4 h of agitation, as the As concentrations tend to stabilize once the saturation condition of the available sites on the nZVI has been reached. Table 7 shows the results of the As adsorption capacity of nZVI.
The results in Table 7 confirm that for Test A, as the dose of nZVI used in the batches (mnZVI) increases, the mass concentration of residue As in the solution at the equilibrium decreases (cAse) and therefore the concentration of absorbed As on the nZVI (cAs0–cAse) increases due to the immobilization action of the nanoparticles. The results of Test B confirm that nZVI allows for efficient arsenic removal. According to the results Table 7, the optimal conditions are in Batch 2 and 3, with masses respectively equal to 0.4 and 0.7 g of nZVI in the batches and a maximum removal rate of As between 86% and 93%. Therefore, the results in Table 7 show the concentrations of As absorbed (cAs0–cAse) on the nZVI, with a range between 0.029 mg ∗ L−1 (mnZVI = 0.05 g) and 0.058 mg ∗ L−1 (mnZVI = 0.7 g). Just as for Test A, the results for Test B in Table 7 show that as the dose of nZVI increases for the three batches, the mass concentration of residue As in the solution at the equilibrium (cAse) decreases from 0.0079 to 0.0040 mg ∗ L−1. The mass of adsorbed As on the nZVI (cAs0–cAse ∗ V) increases from 0.0144 to 0.028 mg (Table 7). Nevertheless, as the dose of nZVI (mnZVI) in the batches increases to more than the mass of adsorbed As on the nZVI (cAs0–cAse ∗ V), the residual concentration in the adsorbent (qe) decreases, up to 0.0412 mg ∗ g−1 (Table 7). These results are comparable with the experimental results of Zhu et al. [50], where the residual concentration in the adsorbent (qe) decreased from 2.545 to 0.999 mg ∗ g−1. However, for Test B, the concentrations of absorbed As on the nZVI are lower than in Test A, probably due to the low initial mass concentration of As in the solution. This phenomenon highlights the difficulty to identify the actual quantity of arsenic that is desorbed from the sediment and moved into water.

4. Conclusions

This paper shows the results of two laboratory experiments: Test A, performed with three batches of As-contaminated water ([As] =10 mg ∗ L−1) and the addition of doses of nanoparticles, and Test B, with three batches consisting of As-contaminated sediment ([As] = 100 mg ∗ Kg−1), tap water and the addition of doses of nanoparticles (Figure 2). The results highlight very high As–nZVI reaction rates, resulting in a progressive reduction of As concentrations in solution. Moreover, the calculations of the As adsorption capacity of nZVI, for both batch tests, showed that as dose of nZVI (mnZVI) increases for the batches, the mass concentration of residue As in the solution at the equilibrium (cAse) decreases and the concentration of absorbed As (cAs0–cAse) on the nZVI increases, due to the immobilization action of the nanoparticles. During the experiments, as the As–nZVI interactions increase, the As concentrations in solution tend to decrease, first rapidly and then slowly, due to the progressive saturation of the active sites on the nanoparticles used to immobilize arsenic. In fact, the experimental results show that once the nZVI saturation is reached, they become inactive and cannot be used for other applications, as they have filled the active sites available on their surface to immobilize the arsenic. Furthermore, another experimental study [53], performed in the laboratory, has shown that nZVI is characterized by a high interaction with soil grains, affecting their transport in the saturated porous medium. Once the active site saturation condition has been reached, the value of As concentrations becomes constant, and it is not easy to reduce it further. On the one hand, this is positive as it demonstrates the effectiveness of this treatment with zerovalent iron nanoparticles for the remediation of arsenic-contaminated aquifers; however, on the other hand, it also determines, for in-field applications, the need for continuous monitoring of injected nZVI quantities.

Author Contributions

Conceptualization, F.A. and P.V.; methodology, F.A. and M.B.; validation, P.V., M.B. and G.S.; investigation, F.A. and F.T.; data curation, F.A.; writing—original draft preparation, F.A.; writing—review and editing, P.V., F.T., M.B. and G.S.; supervision, P.V. and M.B.; project administration, G.S. All authors have read and agreed to the published version of the manuscript.

Funding

This research received no external funding.

Data Availability Statement

Not applicable.

Conflicts of Interest

The authors declare no conflict of interest.

References

  1. Martin, J.E.; Herzing, A.A.; Yan, W.; Li, X.Q.; Koel, B.E.; Kiely, C.J.; Zhang, W.X. Determination of the Oxide Layer Thickness in Core-Shell Zerovalent Iron Nanoparticles. Langmuir 2008, 24, 4329–4334. [Google Scholar] [CrossRef] [PubMed]
  2. Lin, Y.H.; Tseng, H.H.; Wey, M.Y.; Lin, M. Der Characteristics, Morphology, and Stabilization Mechanism of PAA250K-Stabilized Bimetal Nanoparticles. Colloids Surf. A Physicochem. Eng. Asp. 2009, 349, 137–144. [Google Scholar] [CrossRef]
  3. US EPA. Nanotechnology: Applications for Environmental Remediation; US EPA: Washington, DC, USA, 2014; pp. 1–11.
  4. Moraci, N.; Calabrò, P.S. Heavy Metals Removal and Hydraulic Performance in Zero-Valent Iron/Pumice Permeable Reactive Barriers. J. Environ. Manag. 2010, 91, 2336–2341. [Google Scholar] [CrossRef] [PubMed]
  5. Gallo, A.; Bianco, C.; Tosco, T.; Sethi, R. Ferro Zerovalente Nanoscopico per la Bonifica di Acquiferi Contaminari. Geam. Geoing. Ambient. E Min. 2018, 5–16. [Google Scholar]
  6. Bardos, P.; Merly, C.; Kvapil, P.; Koschitzky, H.P. Status of Nanoremediation and Its Potential for Future Deployment: Risk-Benefit and Benchmarking Appraisals. Remediation 2018, 28, 43–56. [Google Scholar] [CrossRef]
  7. Tosco, T.; Gastone, F.; Luna, M.; Sethi, R.; Torino, P. Micro E Nanoparticelle di Ferro per la Bonifica di Acquiferi Contaminati: Dal Laboratorio All’ Applicazione in Campo. Ing. dell’Ambiente 2015, 2, 59–68. [Google Scholar]
  8. Gil-Díaz, M.; Alonso, J.; Rodríguez-Valdés, E.; Gallego, J.R.; Lobo, M.C. Comparing Different Commercial Zero Valent Iron Nanoparticles to Immobilize as and Hg in Brownfield Soil. Sci. Total Environ. 2017, 584–585, 1324–1332. [Google Scholar] [CrossRef]
  9. Gil-Díaz, M.; Rodríguez-Valdés, E.; Alonso, J.; Baragaño, D.; Gallego, J.R.; Lobo, M.C. Nanoremediation and Long-Term Monitoring of Brownfield Soil Highly Polluted with As and Hg. Sci. Total Environ. 2019, 675, 165–175. [Google Scholar] [CrossRef]
  10. Zafar, A.M.; Javed, M.A.; Hassan, A.A.; Mohamed, M.M. Groundwater Remediation Using Zero-Valent Iron Nanoparticles (nZVI). Groundw. Sustain. Dev. 2021, 15, 100694. [Google Scholar] [CrossRef]
  11. Galdames, A.; Ruiz-Rubio, L.; Orueta, M.; Sánchez-Arzalluz, M.; Vilas-Vilela, J.L. Zero-Valent Iron Nanoparticles for Soil and Groundwater Remediation. Int. J. Environ. Res. Public Health 2020, 17, 5817. [Google Scholar] [CrossRef]
  12. Wang, C.B.; Zhang, W.X. Synthesizing Nanoscale Iron Particles for Rapid and Complete Dechlorination of TCE and PCBs. Environ. Sci. Technol. 1997, 31, 2154–2156. [Google Scholar] [CrossRef]
  13. Elliott, D.W.; Zhang, W.X. Field Assessment of Nanoscale Bimetallic Particles for Groundwater Treatment. Environ. Sci. Technol. 2001, 35, 4922–4926. [Google Scholar] [CrossRef] [PubMed]
  14. Jordan, M.; Shetty, N.; Zenker, M.J.; Brownfield, C. Remediation of a Former Dry Cleaner Using Nanoscale Zero Valent Iron. Remediation 2013, 24, 31–48. [Google Scholar] [CrossRef]
  15. Mueller, N.C.; Braun, J.; Bruns, J.; Černík, M.; Rissing, P.; Rickerby, D.; Nowack, B. Application of Nanoscale Zero Valent Iron (NZVI) for Groundwater Remediation in Europe. Environ. Sci. Pollut. Res. 2012, 19, 550–558. [Google Scholar] [CrossRef] [PubMed] [Green Version]
  16. Stejskal, V.; Lederer, T.; Kvapil, P.; Slunsky, J.; Skácelová, P. NanoRem Pilot Site-Spolchemie I, Czech Republic.: Nanoscale Zero-Valent Iron Remediation of Chlorinated Hydrocarbons; NanoRem Bulletin: Ústí nad Labem, Czech Republic, 2017; pp. 1–8. [Google Scholar]
  17. Eglal, M.M.; Ramamurthy, A.S. Nanofer ZVI: Morphology, Particle Characteristics, Kinetics, and Applications. J. Nanomater. 2014, 2014, 29. [Google Scholar] [CrossRef] [Green Version]
  18. Chekli, L.; Brunetti, G.; Marzouk, E.R.; Maoz-Shen, A.; Smith, E.; Naidu, R.; Shon, H.K.; Lombi, E.; Donner, E. Evaluating the Mobility of Polymer-Stabilised Zero-Valent Iron Nanoparticles and their Potential to Co-Transport Contaminants in Intact Soil Cores. Environ. Pollut. 2016, 216, 636–645. [Google Scholar] [CrossRef]
  19. Galdames, A.; Mendoza, A.; Orueta, M.; de Soto García, I.S.; Sánchez, M.; Virto, I.; Vilas, J.L. Development of New Remediation Technologies for Contaminated Soils Based on the Application of Zero-Valent Iron Nanoparticles and Bioremediation with Compost. Resour. Technol. 2017, 3, 166–176. [Google Scholar] [CrossRef]
  20. Pavelková, A.; Stejskal, V.; Pluhař, T.; Nosek, J. Advanced Remediation Using Nanosized Zero-Valent Iron and Electrical Current in Situ—A Comparison with Conventional Remediation Using Nanosized Zero-Valent Iron Alone. J. Environ. Chem. Eng. 2021, 9, 106124. [Google Scholar] [CrossRef]
  21. O’Carroll, D.; Sleep, B.; Krol, M.; Boparai, H.; Kocur, C. Nanoscale Zero Valent Iron and Bimetallic Particles for Contaminated Site Remediation. Adv. Water Resour. 2013, 51, 104–122. [Google Scholar] [CrossRef]
  22. Ji, Y. Ions Removal by Iron Nanoparticles: A Study on Solid-Water Interface with Zeta Potential. Colloids Surf. A Physicochem. Eng. Asp. 2014, 444, 1–8. [Google Scholar] [CrossRef]
  23. Latif, A.; Sheng, D.; Sun, K.; Si, Y.; Azeem, M.; Abbas, A.; Bilal, M. Remediation of Heavy Metals Polluted Environment Using Fe-Based Nanoparticles: Mechanisms, Influencing Factors, and Environmental Implications. Environ. Pollut. 2020, 264, 114728. [Google Scholar] [CrossRef] [PubMed]
  24. Li, X.Q.; Zhang, W.X. Sequestration of Metal Cations with Zerovalent Iron Nanoparticles—A Study with High Resolution X-Ray Photoelectron Spectroscopy (HR-XPS). J. Phys. Chem. C 2007, 111, 6939–6946. [Google Scholar] [CrossRef]
  25. Singh, R.; Misra, V.; Singh, R.P. Removal of Cr(VI) by Nanoscale Zero-Valent Iron (nZVI) From Soil Contaminated with Tannery Wastes. Bull. Environ. Contam. Toxicol. 2012, 88, 210–214. [Google Scholar] [CrossRef] [PubMed]
  26. Li, X.Q.; Elliott, D.W.; Zhang, W.X. Zero-Valent Iron Nanoparticles for Abatement of Environmental Pollutants: Materials and Engineering Aspects. Crit. Rev. Solid State Mater. Sci. 2006, 31, 111–122. [Google Scholar] [CrossRef]
  27. Mukherjee, R.; Kumar, R.; Sinha, A.; Lama, Y.; Saha, A.K. A Review on Synthesis, Characterization, and Applications of Nano zero Valent Iron (nZVI) for Environmental Remediation. Crit. Rev. Environ. Sci. Technol. 2016, 46, 443–466. [Google Scholar] [CrossRef]
  28. Sun, J.; Chillrud, S.N.; Mailloux, B.J.; Bostick, B.C. In Situ Magnetite Formation and Long-Term Arsenic Immobilization under Advective Flow Conditions. Environ. Sci. Technol. 2016, 50, 10162–10171. [Google Scholar] [CrossRef] [Green Version]
  29. Ribas, D.; Černík, M.; Benito, J.A.; Filip, J.; Marti, V. Activation Process of Air Stable Nanoscale Zero-Valent Iron Particles. Chem. Eng. J. 2017, 320, 290–299. [Google Scholar] [CrossRef] [Green Version]
  30. Visentin, C.; da Silva Trentin, A.W.; Braun, A.B.; Thomé, A. Nano Scale Zero Valent Iron Production Methods Applied to Contaminated Sites Remediation: An Overview of Production and Environmental Aspects. J. Hazard. Mater. 2021, 410. [Google Scholar] [CrossRef]
  31. Zhang, W.X. Nanoscale Iron Particles for Environmental Remediation: An Overview. J. Nanopart. Res. 2003, 5, 323–332. [Google Scholar] [CrossRef]
  32. Habuda-Stanić, M.; Nujić, M. Arsenic Removal by Nanoparticles: A Review. Environ. Sci. Pollut. Res. 2015, 22, 8094–8123. [Google Scholar] [CrossRef]
  33. Rashid, U.S.; Saini-Eidukat, B.; Bezbaruah, A.N. Modeling Arsenic Removal by Nanoscale Zero-Valent Iron. Environ. Monit. Assess. 2020, 192, 110. [Google Scholar] [CrossRef] [PubMed]
  34. Singh, P.; Pal, P.; Mondal, P.; Saravanan, G.; Nagababu, P.; Majumdar, S.; Labhsetwar, N.; Bhowmick, S. Kinetics and Mechanism of Arsenic Removal Using Sulfide-Modified Nanoscale Zerovalent Iron. Chem. Eng. J. 2021, 412, 128667. [Google Scholar] [CrossRef]
  35. Ahmed, M.F.; Abbas, M.A.; Mahmood, A.; Ahmad, N.M.; Rasheed, H.; Qadir, M.A.; Khan, A.U.; Qiblawey, H.; Zhu, S.; Sadiq, R.; et al. Hybrid Beads of Zero Valent Iron Oxide Nanoparticles and Chitosan for Removal of Arsenic in Contaminated Water. Water 2021, 13, 2876. [Google Scholar] [CrossRef]
  36. Yadav, R.; Sharma, A.K.; Babu, J.N. Sorptive Removal of Arsenite [As(III)] and Arsenate [As(V)] by Fuller’s Earth Immobilized Nanoscale Zero-Valent Iron Nanoparticles (F-nZVI): Effect of Fe0 Loading on Adsorption Activity. J. Environ. Chem. Eng. 2016, 4, 681–694. [Google Scholar] [CrossRef]
  37. Liang, Q.; Zhao, D. Immobilization of Arsenate in a Sandy Loam Soil Using Starch-Stabilized Magnetite Nanoparticles. J. Hazard. Mater. 2014, 271, 16–23. [Google Scholar] [CrossRef]
  38. Gil-Díaz, M.; Alonso, J.; Rodríguez-Valdés, E.; Pinilla, P.; Lobo, M.C. Reducing the Mobility of Arsenic in Brownfield Soil Using Stabilised Zero-Valent Iron Nanoparticles. J. Environ. Sci. Health Part. A Toxic/Hazard. Subst. Environ. Eng. 2014, 49, 1361–1369. [Google Scholar] [CrossRef] [PubMed]
  39. Baragaño, D.; Alonso, J.; Gallego, J.R.; Lobo, M.C.; Gil-Díaz, M. Zero Valent Iron and Goethite Nanoparticles as New Promising Remediation Techniques for As-Polluted Soils. Chemosphere 2020, 238, 124624. [Google Scholar] [CrossRef] [PubMed]
  40. Yan, W.; Lien, H.L.; Koel, B.E.; Zhang, W.X. Iron Nanoparticles for Environmental Clean-up: Recent Developments and Future Outlook. Environ. Sci. Process. Impacts 2013, 15, 63–77. [Google Scholar] [CrossRef]
  41. Ramos, M.A.V.; Weile, Y.; Li, X.Q.; Koel, B.E.; Zhang, W.X. Simultaneous Oxidation and Reduction of Arsenic by Zero-Valent Iron Nanoparticles: Understanding the Significance of the Core-Shell Structure. J. Phys. Chem. C 2009, 113, 14591–14594. [Google Scholar] [CrossRef]
  42. Kanel, S.R.; Nepal, D.; Manning, B.; Choi, H. Transport of Surface-Modified Iron Nanoparticle in Porous Media and Application to Arsenic(III) Remediation. J. Nanopart. Res. 2007, 9, 725–735. [Google Scholar] [CrossRef]
  43. Jegadeesan, G.; Mondal, K.; Lalvani, S.B. Arsenate Remediation Using Nanosized Modified Zerovalent Iron Particles. Environ. Prog. 2005, 24, 289–296. [Google Scholar] [CrossRef]
  44. Yan, W.; Ramos, M.A.V.; Koel, B.E.; Zhang, W.X. Multi-Tiered Distributions of Arsenic in Iron Nanoparticles: Observation of Dual Redox Functionality Enabled by a Core-Shell Structure. Chem. Commun. 2010, 46, 6995–6997. [Google Scholar] [CrossRef]
  45. Biterna, M.; Arditsoglou, A.; Tsikouras, E.; Voutsa, D. Arsenate Removal by Zero Valent Iron: Batch and Column Tests. J. Hazard. Mater. 2007, 149, 548–552. [Google Scholar] [CrossRef] [PubMed]
  46. Bang, S.; Korfiatis, G.P.; Meng, X. Removal of Arsenic from Water by Zero-Valent Iron. J. Hazard. Mater. 2005, 121, 61–67. [Google Scholar] [CrossRef] [PubMed]
  47. Sun, H.; Wang, L.; Zhang, R.; Sui, J.; Xu, G. Treatment of Groundwater Polluted by Arsenic Compounds by Zero Valent Iron. J. Hazard. Mater. 2006, 129, 297–303. [Google Scholar] [CrossRef]
  48. Wu, Z.; Su, X.; Lin, Z.; Owens, G.; Chen, Z. Mechanism of As(V) Removal by Green Synthesized Iron Nanoparticles. J. Hazard. Mater. 2019, 379. [Google Scholar] [CrossRef]
  49. Ainiwaer, M.; Zeng, X.; Yin, X.; Wen, J.; Su, S.; Wang, Y.; Zhang, Y.; Zhang, T.; Zhang, N. Thermodynamics, Kinetics, and Mechanisms of the Co-Removal of Arsenate and Arsenite by Sepiolite-Supported Nanoscale Zero-Valent Iron in Aqueous Solution. Int. J. Environ. Res. Public Health 2022, 19, 11401. [Google Scholar] [CrossRef]
  50. Zhu, H.; Shi, M.; Zhang, X.; Liu, B.; Yao, D. Adsorption Kinetics of Arsenic (V) on Nanoscale Zero-Valent Iron Supported by Activated Carbon. Nanomaterials 2020, 10, 1791. [Google Scholar] [CrossRef]
  51. Wu, C.; Tu, J.; Liu, W.; Zhang, J.; Chu, S.; Lu, G.; Lin, Z.; Dang, Z. The Double Influence Mechanism of pH on Arsenic Removal by Nano Zero Valent Iron: Electrostatic Interactions and the Corrosion of Fe0. Environ. Sci. Nano 2017, 4, 1544–1552. [Google Scholar] [CrossRef]
  52. Bang, S.; Johnson, M.D.; Korfiatis, G.P.; Meng, X. Chemical Reactions Between Arsenic and Zero-Valent Iron in Water. Water Res. 2005, 39, 763–770. [Google Scholar] [CrossRef]
  53. Andrei, F.; Sappa, G.; Boni, M.R.; Mancini, G.; Viotti, P. Mobility of nZVI in a Reconstructed Porous Media Monitored by an Image Analysis Procedure. Water 2021, 13, 2797. [Google Scholar] [CrossRef]
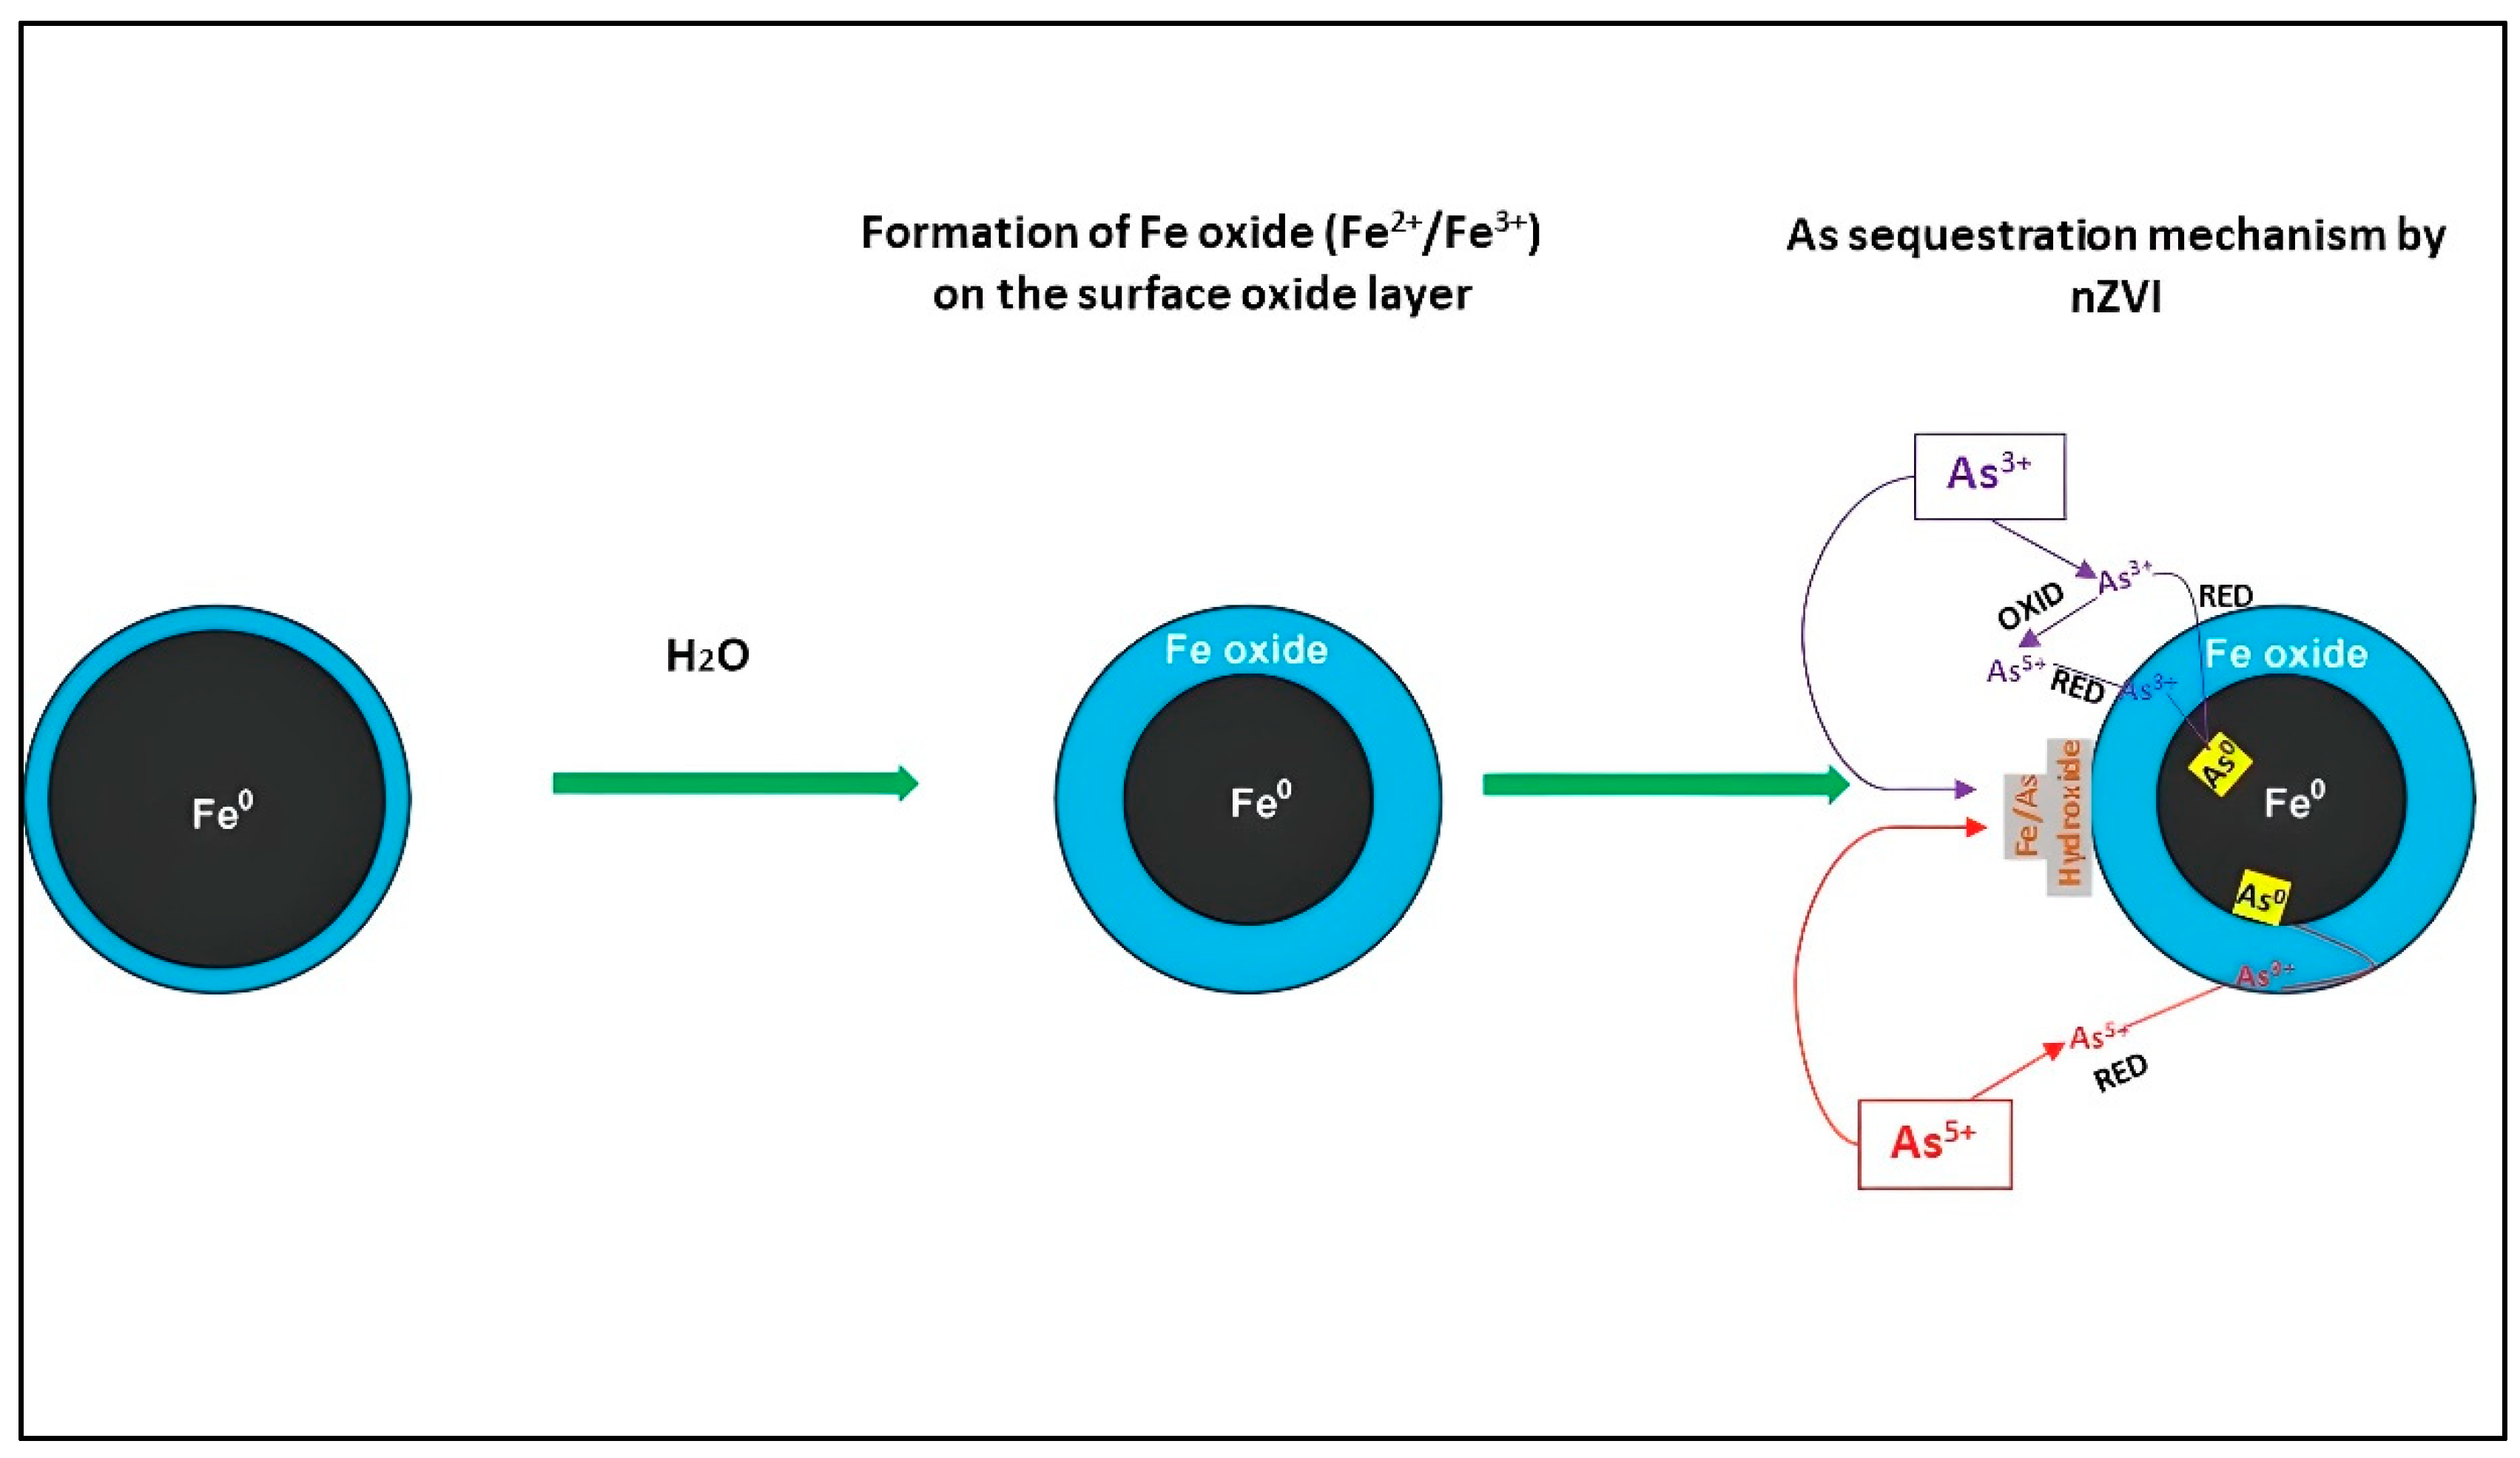
Figure 1. Main reaction mechanisms for the removal of As3+ and As5+ by nZVI. Adapted from Rashid et al., 2020 [33]; Singh et al., 2021 [34]; Ahmed et al., 2021 [35].
Water 14 03261 g001
Figure 2. Scheme of experiments.
Water 14 03261 g002
Figure 3. Electrical conductivity trend (Test A): (a) Batch 1, (b) Batch 2 and (c) Batch 3.
Water 14 03261 g003
Figure 4. Experimental results for Test A. (a) As concentrations trend; (b) As removal rate.
Water 14 03261 g004aWater 14 03261 g004b
Figure 5. As and EC trend (Test A): (a) Batch 1, (b) Batch 2 and (c) Batch 3.
Water 14 03261 g005aWater 14 03261 g005b
Figure 6. Electrical conductivity trend (Test B): (a) Batch 1, (b) Batch 2 and (c) Batch 3.
Water 14 03261 g006
Figure 7. Experimental results for Test B. (a) As concentrations trend; (b) As removal rate.
Water 14 03261 g007
Figure 8. As and EC trend (Test B): (a) Batch 1, (b) Batch 2 and (c) Batch 3.
Water 14 03261 g008
Table 1. Main features of the Nanofer25S solution.
Nanofer25S
Composition mixture (weight % content)77% Water
14–18% Iron (Fe)
3% Polyacrylic acid (PAA).
2–6% Magnetite (Fe3O4)
0–1% Carbon (C)
Granulometryd50 < 50 nm
pH11–12
Specific surface>25 m2/g
Specific gravity1.15–1.25 g/cm3 (20 °C)
Table 2. Batch compositions (Test A).
Test A
Batch 1Batch 2Batch 3
Volume batch (500 mL)H2O volume498.4 mL498.4 mL498.4 mL
HAsNa2O4 ∗ 7H2O volume1.6 mL1.6 mL1.6 mL
As concentration10 mg/L10 mg/L10 mg/L
nZVI mass0.05 g0.25 g0.5 g
nZVI volume0.2 mL1 mL2 mL
n Z V I   [ g ] A s   [ g ] [37]10 (0.1% m/m)50 (0.5% m/m)100 (1% m/m)
[ n Z V I   B a c t h   v o l u m e   ( V o l u m e = H 2 O + H A s N A 2 O 4 7 H 2 O )   ] 0.1 g/L0.5 g/L1 g/L
Table 3. Electrical conductivity values for the blank sample in Test A.
Test A
Electrical Conductivity (μS/cm)
Blank SampleStart of experiment632
End of experiment613
Table 4. Batch compositions (Test B).
Test B
Batch 1Batch 2Batch 3
50 g of soil sediment50 g of soil sediment50 g of soil sediment
500 mL of water500 mL of water500 mL of water
n Z V I   [ g ] / A s   [ g ] = 10 [37] n Z V I   [ g ] / A s   [ g ] = 80 [37] n Z V I   [ g ] / A s   [ g ] = 140 [37]
(0.1% m/m)(0.8% m/m)(1.4% m/m)
0.2 mL of nZVI1.6 mL of nZVI2.8 mL of nZVI
0.05 g of nZVI0.4 g of nZVI0.7 g of nZVI
Table 5. Electrical conductivity values for blank samples in Test B.
Test B
Blank SampleElectrical Conductivity (μS/cm)
Batch 11039
Batch 21037
Batch 31030
Table 6. The amount of adsorbed As at equilibrium in mg ∗ g−1 for Test A. Water 14 03261 i001 Water 14 03261 i002 low increase/decrease, Water 14 03261 i003 Water 14 03261 i004 moderate increase/decrease, Water 14 03261 i005 Water 14 03261 i006 high increase/decrease.
Batch 1Batch 2Batch 3
mnZVI [g]0.05 Water 14 03261 i0010.25 Water 14 03261 i0030.5 Water 14 03261 i005
cAs0 [mg ∗ L−1]101010
cAse [mg ∗ L−1]4.90 Water 14 03261 i0021.3 Water 14 03261 i0040.460 Water 14 03261 i006
cAs0–cAse [mg ∗ L−1]5.10 Water 14 03261 i0018.67 Water 14 03261 i0039.54 Water 14 03261 i005
(cAs0–cAse) ∗ V [mg]2.55 Water 14 03261 i0014.33 Water 14 03261 i0034.77 Water 14 03261 i005
qe [mg ∗ g−1]50.9917.329.54
Table 7. The amount of adsorbed As at equilibrium in mg ∗ g−1 for Test B. Water 14 03261 i001 Water 14 03261 i002 low increase/decrease, Water 14 03261 i003 Water 14 03261 i004 moderate increase/decrease, Water 14 03261 i005 Water 14 03261 i006 high increase/decrease.
Batch 1Batch 2Batch 3
mnZVI [g]0.05 Water 14 03261 i0010.4 Water 14 03261 i0030.7 Water 14 03261 i005
cAs0 [mg ∗ L−1]0.0360.0390.061
cAse [mg ∗ L−1]0.0079 Water 14 03261 i0020.0061 Water 14 03261 i0040.0040 Water 14 03261 i006
cAs0–cAse [mg ∗ L−1]0.029 Water 14 03261 i0010.033 Water 14 03261 i0030.058 Water 14 03261 i005
(cAs0–cAse) ∗ V [mg]0.0144 Water 14 03261 i0010.016 Water 14 03261 i0030.028 Water 14 03261 i005
qe [mg ∗ g−1]0.290.04130.0412
Publisher’s Note: MDPI stays neutral with regard to jurisdictional claims in published maps and institutional affiliations.