1. Introduction
Continuous urban development, changing climate and shirking cities have placed a lot of strain on the centralised water infrastructures leading to water scarcity in many cities as well as urban flooding [
1]. It is reported that by 2050, urban water demand could increase by a further 80% as a result of growth in population and their wealth [
2]. Several technologies have been implemented in easing these problems, and rainwater harvesting (RWH) is one of the decentralised technologies that has attracted several researchers’ attention in tackling water scarcity in many cities and urban flooding [
3].
A decentralised RWH system involves purchasing rainwater tanks by households to collect and store rainwater which can be used for many nonpotable purposes and, in some cases, potable purposes if the water is treated properly [
4]. The most important decision that has to be made by the household is to the selection of optimum tank size that would improve not only the reliability of the system but also the saving. The recognised definition of reliability is how much the water demand can be supplemented by stored rainwater [
5,
6]. The saving can be defined as the difference between the reduction in water bill because of the use of rainwater and the costs of purchasing and maintaining the rainwater tank.
The RWH system is considered a viable method of addressing water-related challenges by many researchers; however, the feasibility of this method has also been contested by others [
1,
7]. The primary benefit of decentralised RWH systems over centralised systems is they are multi-purpose. For example, they can increase water supplies, subsidise the use of high-quality drinking water for nonpotable purposes and contribute to the reduction of stormwater runoff [
5,
8]. Though the advantages of RWH systems in mitigating water supply and runoff reduction have been well supported in the existing literature [
9,
10,
11], many argued that the system has low water supply potential and the cost is substantially higher than that of the centralised systems [
12,
13].
The inconsistent findings discussed above on the feasibility of a decentralised RWH system opens doors for further investigation. A literature review is one of the standard methods of accumulating recent results and systematically analysing them to make a decisive decision on an argument [
14]. Several review articles can be found in the existing literature on the RWH system.
Table 1 includes literature review articles published recently on RWH systems.
As we can see that the focuses of current review studies are on the benefits of RWH systems [
15,
28,
29,
30], optimisation of tank size [
3,
20,
31], potential application in rural irrigation [
19,
21,
26], quality of harvested rainwater and its treatment processes [
8,
17,
27] and application of new technologies in maximising the benefits of RWH systems [
16,
24,
28]. To provide a few more details, Semaan, et al. [
3] performed a literature review on the optimal sizing of rainwater harvesting systems. Sizing of storage was identified as the most important objective of optimization, yet sizing for cost was the most frequently implemented outcome of optimization [
3]. Musayev, et al. [
14] investigated the performance of rainwater harvesting (globally) under climate conditions and argued that climate change would have little impact on the performance even in arid regions. Conversely, Haque, et al. [
32] ‘s model showed that climate change would have a negative impact on the RWH system’s performance. Liu, et al. [
33] studied the use of membrane technology in treating harvested rainwater. It was concluded that the proposed technology could significantly improve the water quality; however, the main challenge with this technology is membrane fouling. Deng [
34] investigated contaminants in the harvested rainwater and their impact on urban agriculture. It was argued that a tailored water treatment system needed to be added to the RWH system to supply quality water to the crops. Hindiyeh, et al. [
35] studied policies in different countries on implementing RWH system and revealed that many countries still do not have a comprehensive policy.
Based on the above discussion, it can be argued that most of the previous reviews articles focused on the optimal sizing of the RWH system which would be cost effective, quality of the harvested rainwater, treatment of the harvested rainwater, effect of climate change on the RWH system performance and policies/guidelines for adopting RWH systems. While all these studies have their own merit, a bibliometric analysis of the RWH system does not exist in the available literature. Therefore, this study aims to present a bibliometric analysis on RWH systems, which will complete the process of detecting the state of the art of this technology.
2. Materials and Methods
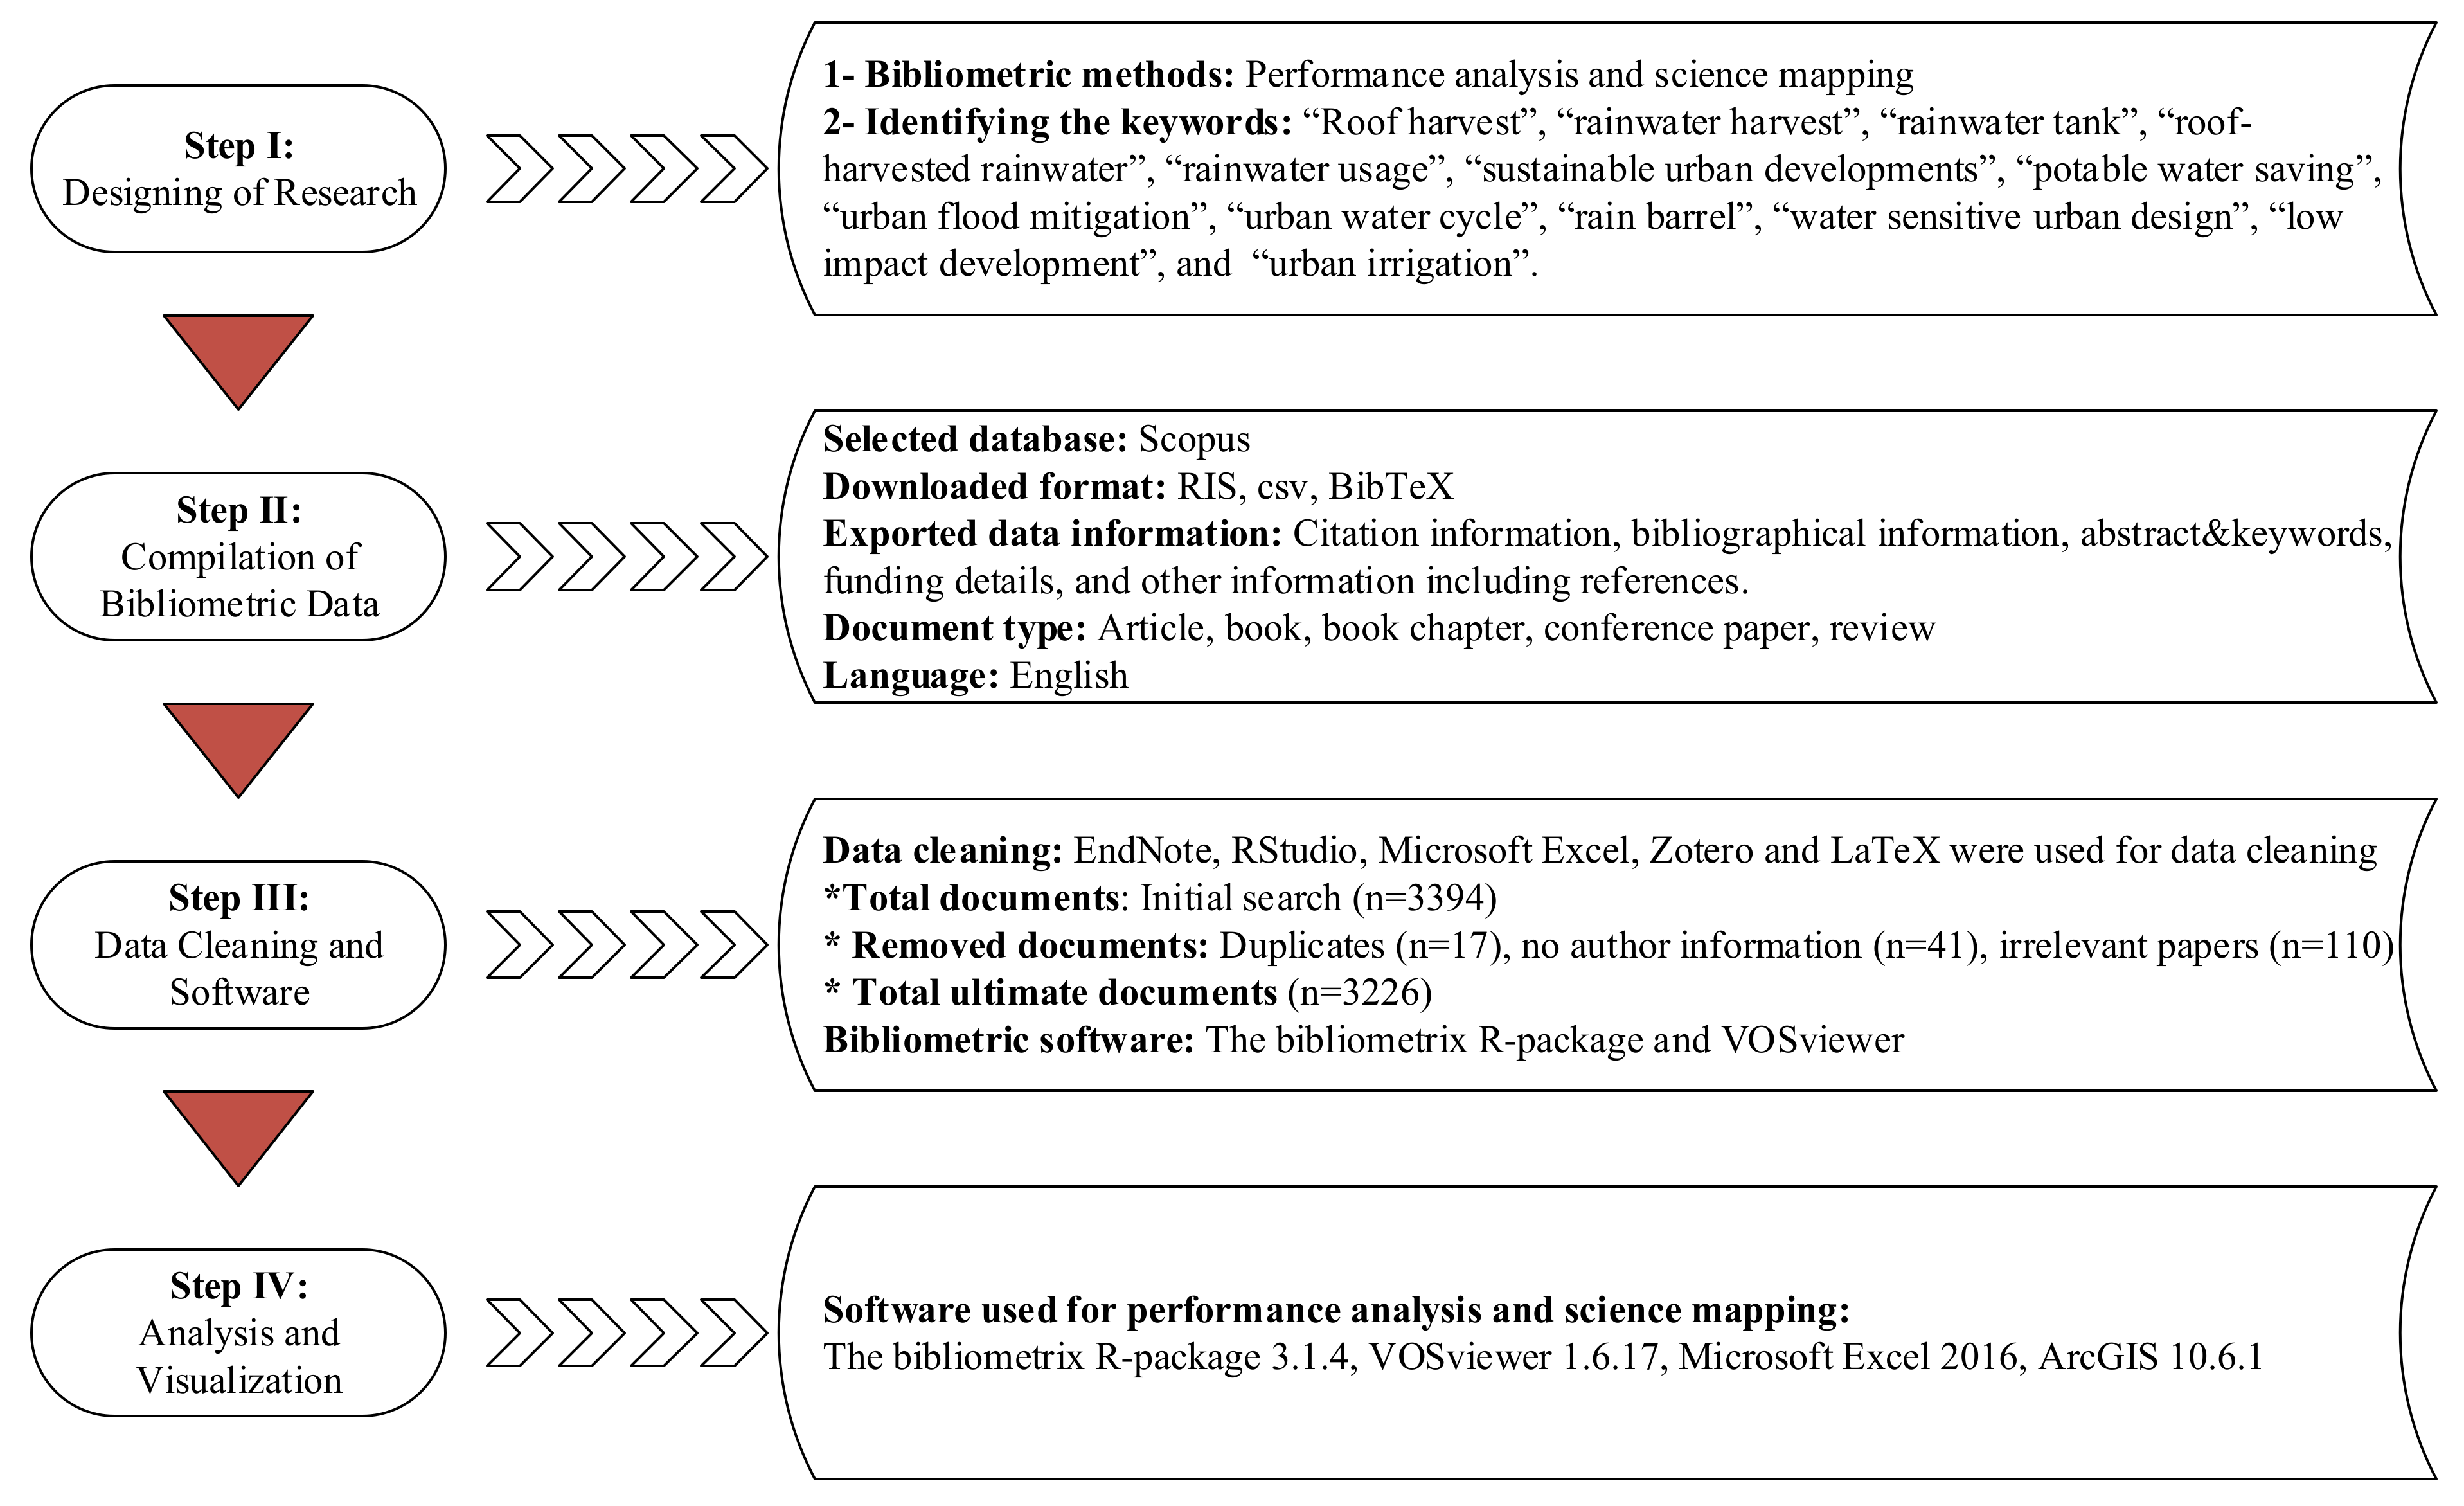
Methodological workflow [
36] of the bibliometric analysis carried out in this study is given in
Figure 1.
2.1. Step I: Designing of Research
This bibliometric analysis aimed to depict the conceptual evolution and trends of RWH studies between 1982 and 2021. Bibliometric methods (performance analysis and science mapping) were used to address scientific evolution (e.g., in terms of authorship, country of origin and citations) and their network (e.g., co-occurrence, co-citation and co-authorship) of a given topic. This study used the following keywords and their combinations to map the research on RWH: “roof harvest”, “rainwater harvest”, “rainwater tank”, “roof-harvested rainwater”, “rainwater usage”, “sustainable urban developments”, “potable water saving”, “urban flood mitigation”, “urban water cycle”, “rain barrel”, “water sensitive urban design”, “low impact development”, and “urban irrigation”.
2.2. Step II: Compilation of Bibliometric Data
Selection of a database depends on quality and quantity of information, ease to use, institutional access, maximum downloadable data at once, coverage of journals and volume of data. Elsevier’s Scopus and Thomson Reuters’ Web of Science (WoS) are the most widely used databases in bibliometric analysis in different fields [
37,
38,
39,
40]. It was argued that the results (documents) and impacts (citations) of countries obtained from the Scopus and WoS databases were highly correlated [
41], even though both databases differ in terms of scope, the volume of data and coverage policies [
42]. We selected the Scopus database due to its significant coverage of peer-reviewed publications [
43] and allowance to download a high number of data at once (e.g., Scopus allows to download 2000 documents, whereas WoS allows downloading 500 documents at once) and institutional access. Published studies on RWH were obtained through the Scopus database covering the period from 1982 to 24 October 2021. Although our search was in October 2021, we noted eight documents’ publication dates as 2022 on Scopus. The query for data collection was searched in title (TITLE), abstract (ABS) and keywords (KEY) with Boolean logical functions-AND/OR- as follow: TITLE-ABS-KEY ((“roof* harvest*”) OR (“harvest* roof*”) OR (“roof* rainwater”) OR (“rainwater harvest*”) OR (“harvest* rainwater”) OR (“rainwater tank”) OR (“roof-harvested rainwater”) OR (“rainwater usage”) OR (“sustainable urban developments” AND rainwater) OR (“potable water saving” AND rainwater) OR (“urban flood mitigation” AND rainwater) OR (“urban water cycle” AND rainwater) OR (“rain barrel” AND rainwater) OR (“water sensitive urban design” AND rainwater) OR (“low impact development” AND rainwater) OR (“urban irrigation” AND rainwater)).
Downloaded data formats were RIS (Endnote and Zotero), csv (VOSviewer and Microsoft Excel) and BibTeX (Rstudio and LaTeX) for the analysis. The exported data from Scopus consists following information: citation information (author(s), document and source title/type, year, citation count), bibliographical information, keywords (keyword plus and author keywords), and other information (includes references). The search criteria were limited to language (English), source type (e.g., journal, conference proceeding and book), document type (article, conference paper, book chapter, review, conference review and book) and time span (1982 to 24 October 2021) in the search query.
2.3. Step III: Data Cleaning and Software
Data cleaning is one of the most crucial and critical steps of bibliometric analysis. It was reported that downloaded data might contain numerous inconsistencies in the data format [
44]. For instance, inconsistent cells (e.g., misspellings, variant names and overflowing into the next cell in csv format), no author information, duplicates or irrelevant documents. Although detecting irrelevant documents is not exactly a part of the data cleaning phase, it is the most difficult and tricky one to detect for a reliable bibliographic analysis. The reason is that authors may suggest using “rainwater harvesting” in the abstract although they did not address it in the main text. Therefore, detecting irrelevant documents requires more effort and time in bibliometric analysis.
Figure 1 illustrates number of initial search (
n = 3394) and number of total removed documents (
n = 168). We obtained 3226 documents after data cleaning (removing duplicates, no author information and irrelevant papers) for the analysis to be addressed.
Different tools can be used for science mapping [
45,
46,
47,
48,
49,
50,
51,
52,
53]. The bibliometrix R-package and VOSviewer have been used widely in scientometrics studies in different field all around the world [
54,
55,
56,
57,
58,
59]. Bibliometric analysis in this study was carried out by using the bibliometrix R-package 3.1.4 [
44] in Rstudio environment (
https://www.rstudio.com/, accessed on 24 October 2021) and VOSviewer 1.6.17 [
53].
2.4. Step IV: Analysis and Visualization
There are two main pillars in bibliometric methods, which are performance analysis and science mapping. Performance analysis aims to evaluate scientific actors (authors, countries, institutions) and the impact of their activities. Science mapping seeks to reveal the cognitive (structure) and evolution of scientific fields.
We used auxiliary tools, Microsoft Excel 2016 and ArcGIS 10.6.1 (
https://www.esri.com/, accessed on 21 November 2021), in addition to the bibliometrix R-package and VOSviewer for bibliometric analysis.
2.5. Comprehensive Strength Analysis
The number of publications (academic scale) and citations (influence) can reflect the academic impact of the country [
60].
Standard scores of indicators, which are total publications and citations, are calculated using the standard score method for each country as follows:
where
is the standard score of
indicator in
country;
is the original score of
indicator in
country;
is the average score of
indicator;
N is the number of countries;
is standard deviation of
indicator in
country.
Table 2 represents the summary of downloaded data used in this study.
3. Results and Discussion
This section is organized into six sub-categories including general statistics, featured sources and publications, authors statistics, keywords statistics, countries and their collaborations.
3.1. General Statistics
Based on our search, a total of 3226 documents were published on RWHs between the years 1982 and 2021. Published documents were from 1002 different sources and 91 countries. Publishing trends and average citations of RWH studies are given in
Figure 2. As can be seen, break year (abrupt change) was detected in the early 2000s and noticeable growth was continued up to date. In the last five years, the highest number of publications were occurred in 2020 (
n = 331), 2021 (
n = 283), 2018 (
n = 282), 2019 (
n = 263), 2017 (
n = 254) in that order. Furthermore, the highest average citation per year has been increasing since the early 2000s, parallel to the number of publications.
3.2. Featured Sources and Highly Cited Publications
The data were collected from 1002 academic sources in RWH field from Scopus between 1982 and 2021 (October). According to the statistics of these sources, the top 15 journals that published most of the articles related to RWH and their publication trends over time are presented in
Table 3 and
Figure 3. The Water (MDPI) was the first ranked journal with the highest number of publication (
n = 128), the highest publication ratio (3.97%) followed by Journal of Cleaner Production with 81 publications and 2.51% publication ratio. Although, these two journals started to publish first time in 2011, the Journal of Cleaner Production had a much higher total citation (TC = 1897) than Water (MDPI) (TC = 1386). However, Agricultural Water Management (TC = 2704) and Resources Conservation and Recycling (TC = 2670) had far higher total citations than other journals. Besides, Resources Conservation and Recycling had the highest H-index among other journals. The H-index was developed by Hirsch [
61] to evaluate and quantify academic impacts. The H-index is an author’s (or journal’s) number of publications (h), each of which has been cited in other documents at least H times. Simply, a higher H-index shows a greater academic impact. Therefore, the H-index is an important parameter to evaluate the quantity and quality of academic studies in any bibliometric analysis [
62,
63]. Agricultural Water Management has the oldest publication history (first published in 1982), whereas Resources Conservation and Recycling started to publish first in 2007. Furthermore, Resources Conservation and Recycling holds the highest H-index (32) and the second-best citation per publication (CPP) (40.45).
Figure 3 illustrates that Water (MDPI) was the only one showing the steepest growth trend among other journals. It should be noted that there were 16 articles published on rainwater harvesting in 2010 in Water Science and Technology (as evidenced by the peak in
Figure 3). There was no special issue on rainwater harvesting in this year, and it was found that 4, 2, 4, 4 and 2 articles were published respectively in January, March, April, July and August regular issues. The very high growth rate of Water (MDPI) (in
Figure 3) during 2018 to 2021 could be attributed to strong promotion/marketing by this journal.
The number of citations of an article is one of the prominent ways to reflect its academic impact and influence.
Table 4 presents top 15 highly cited articles. The most frequently cited article on RWH related studies was published in 2009 in Field Crops Research by Li-Min Zhou from China [
64]. It has been cited for 396 times with 30.46 citation per year. Among the top 15 most frequently cited articles, there are three from China and these highly cited articles are mainly related to agricultural studies. It is possible that an article can be cited by others in a different discipline. Therefore, citation analysis is an essential tool to see the degree of connectivity between pairs of articles in the created 3226-papers network.
Table 5 illustrates results of citation analysis. As we can see, local citations show the number of citations within the 3226 publications whereas global citations present the actual Scopus citations (
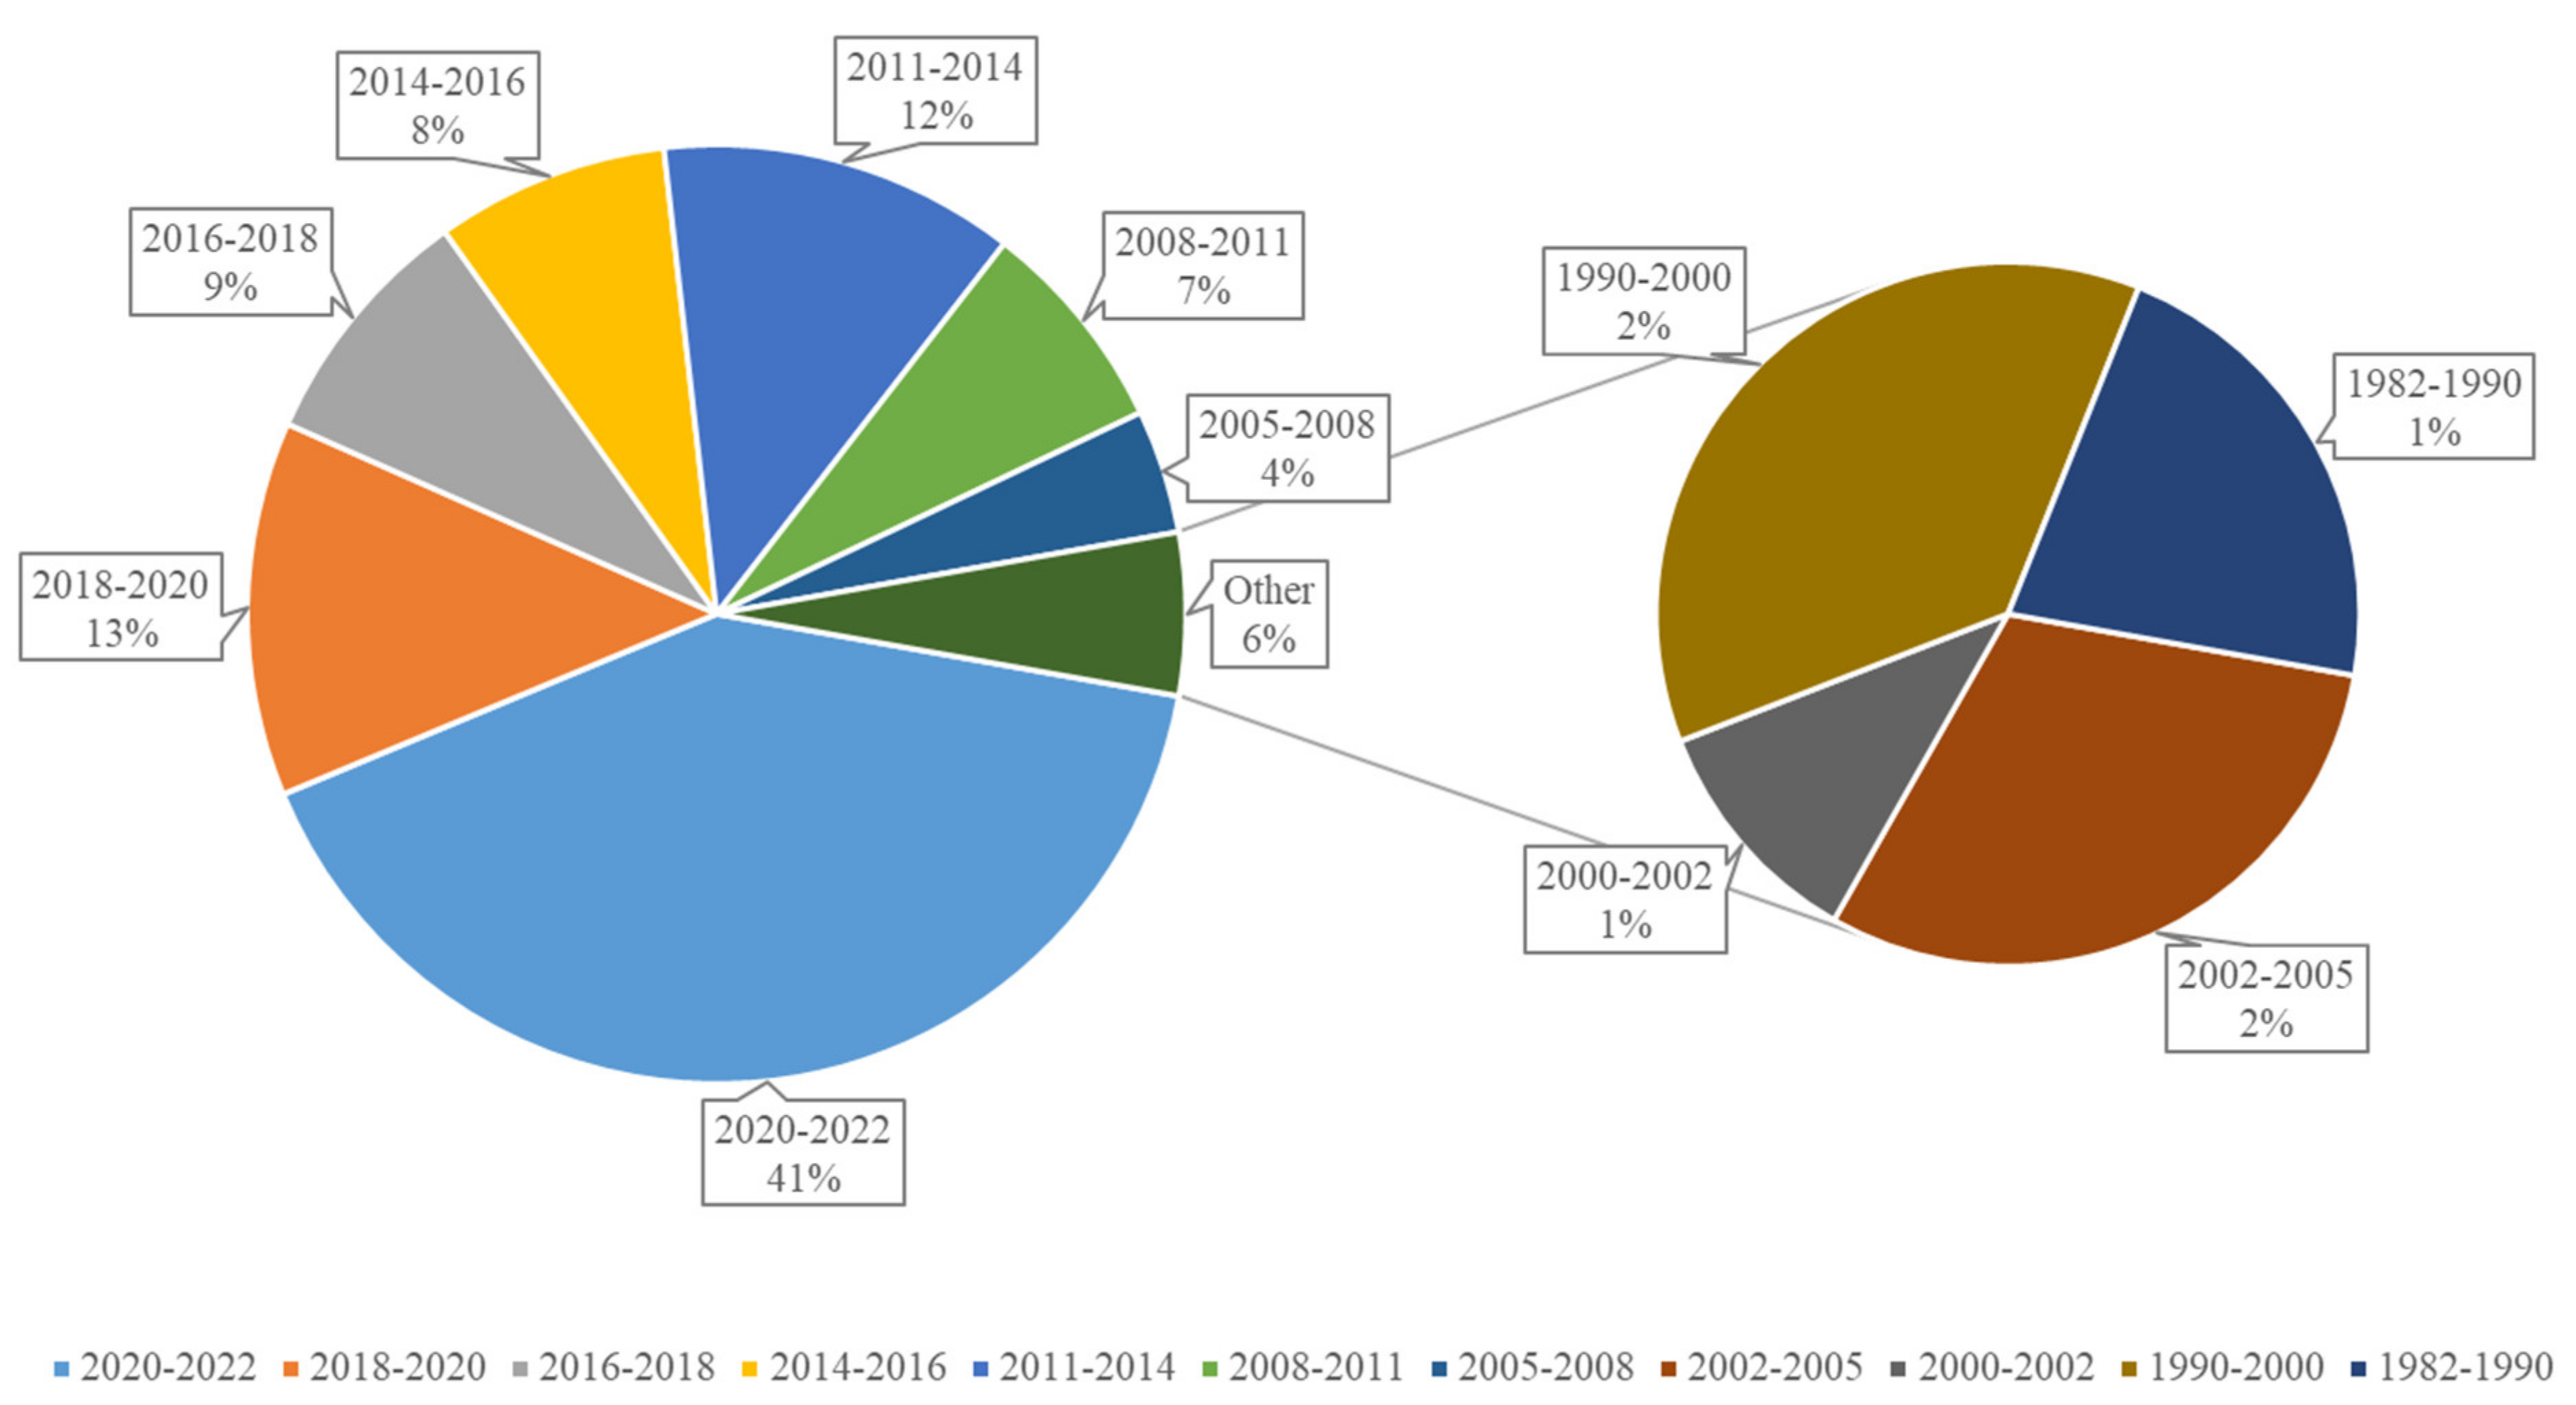
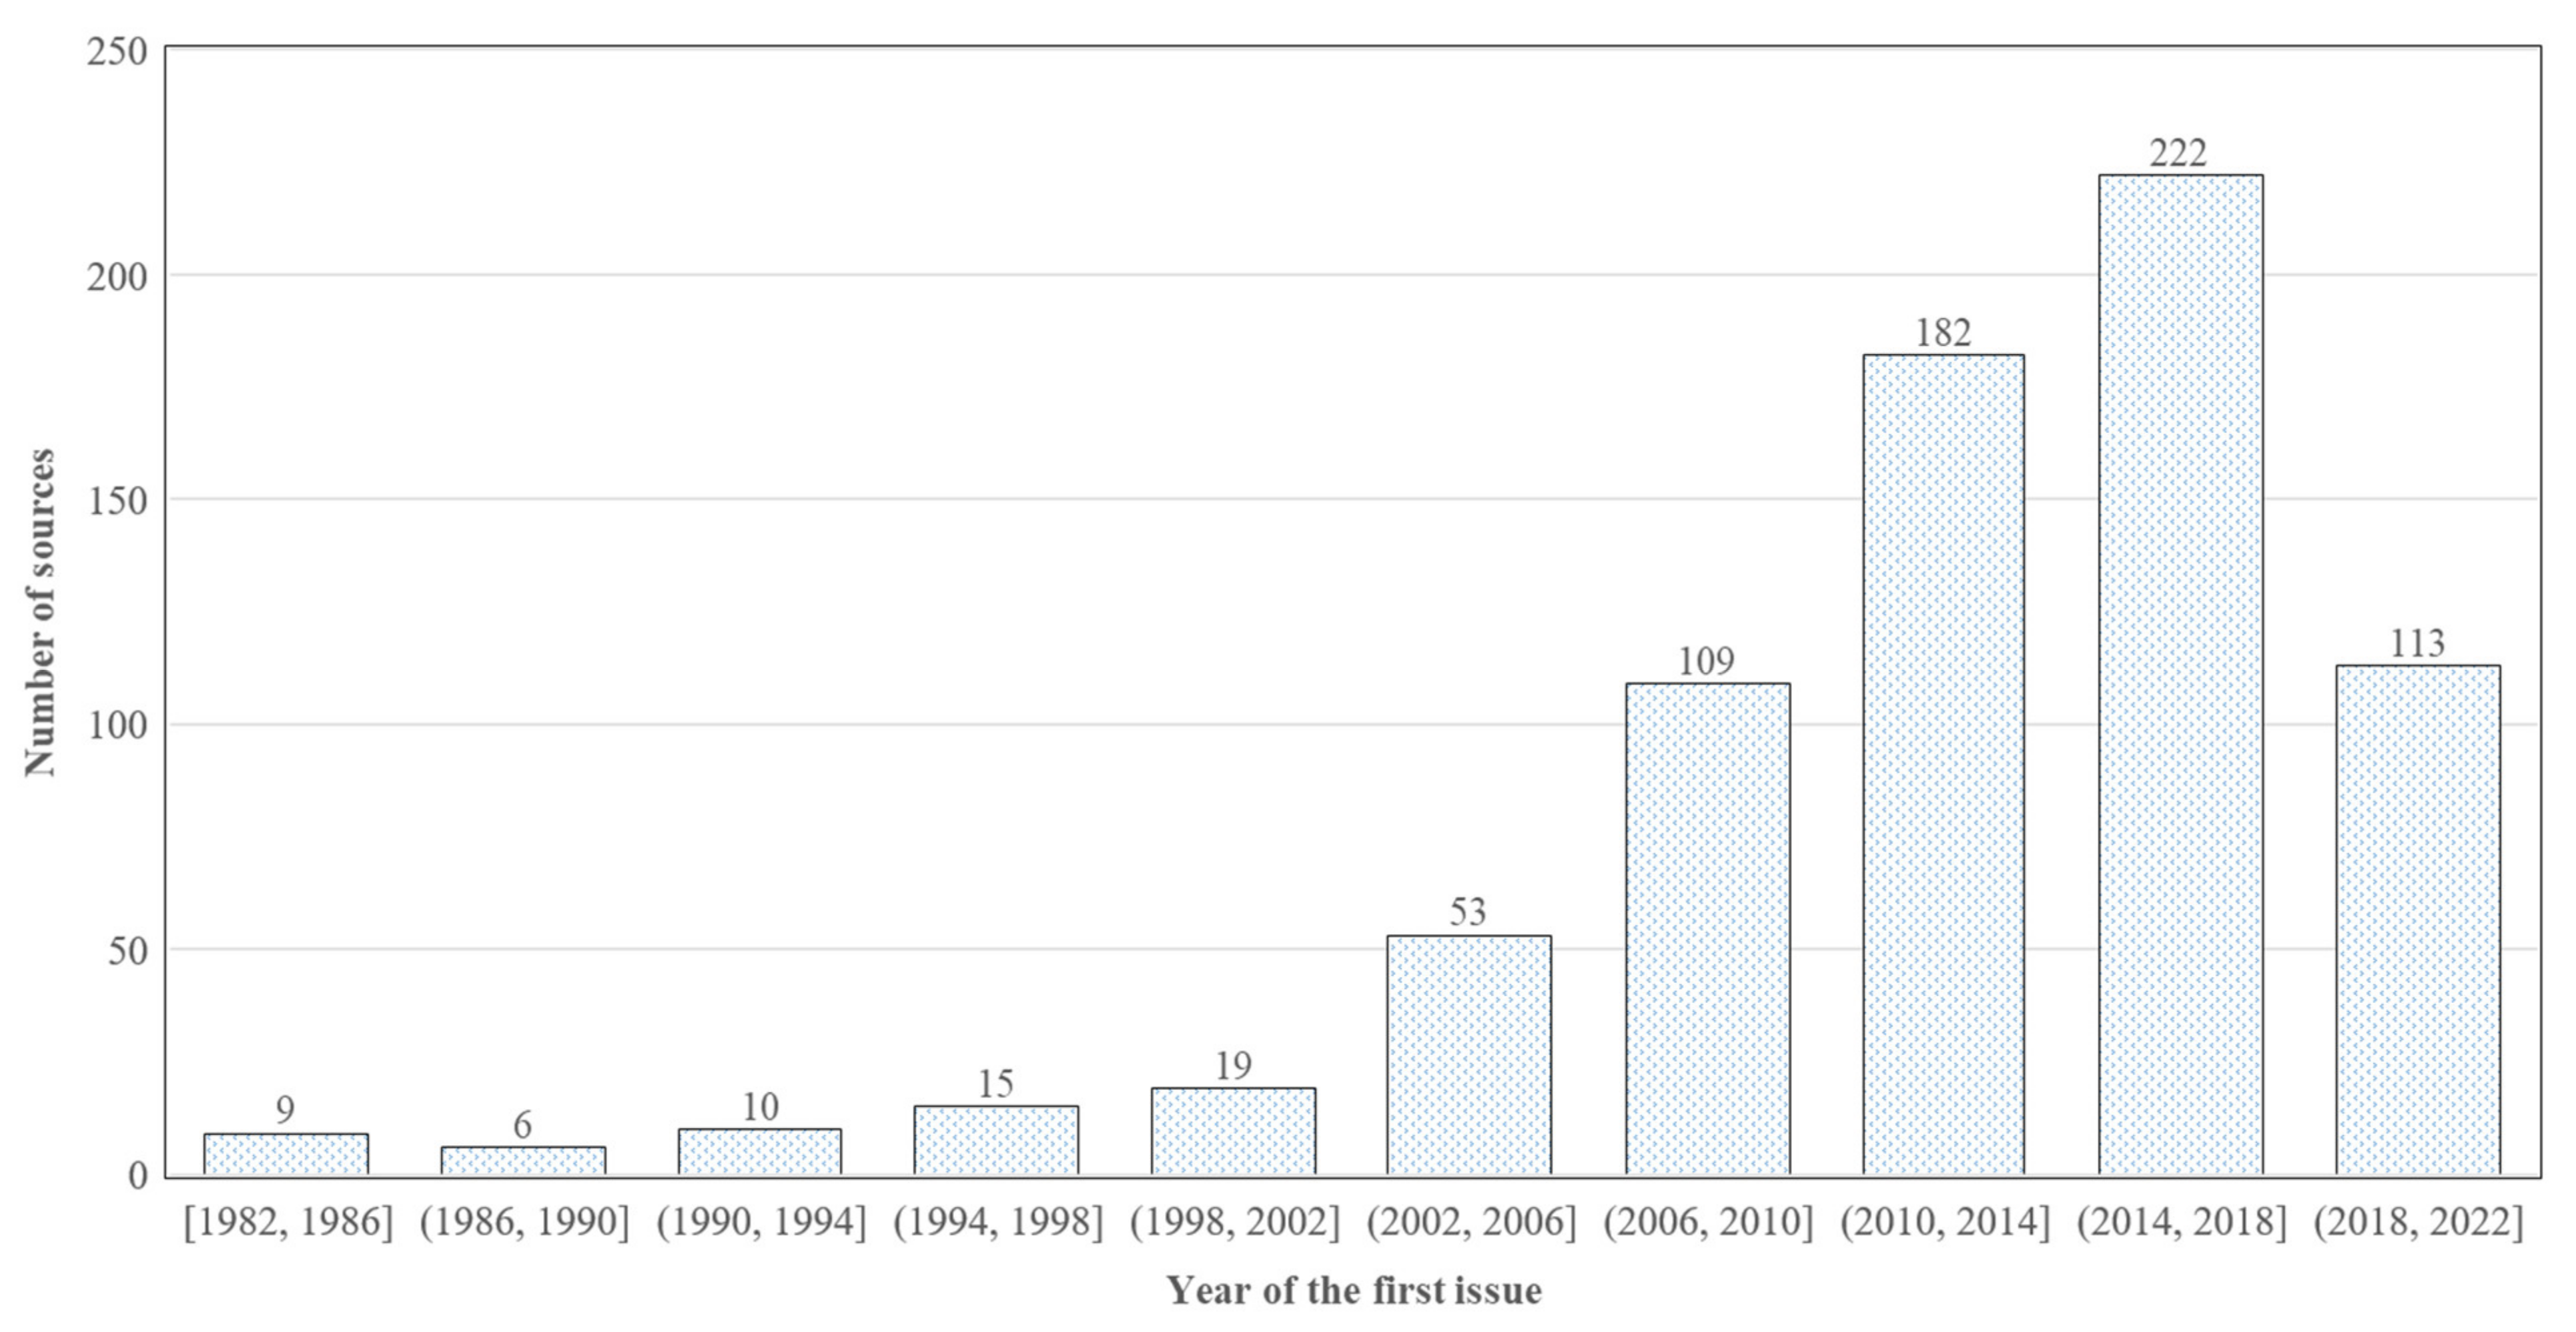
Table 4 also presents global citations). The citation analysis revealed that 1487 papers out 3226 have cited each other (at least once). In other words, 1739 papers out of 3226 have not cited each other. About 28% of 1487 papers have been cited only once. Furthermore, 821 papers out of 3226 have not been cited either locally or globally. The reason is the fact that considerable proportion of these 821 papers were published in the last few years. For example, the percentage of papers published between 2020 and 2022 was 41% (336 documents) whereas 5% (46 documents) of non-cited papers were published before 2005. Another reason is that a significant number of sources have been introduced recently. For instance, the number of sources that had their first issue between 2018 and 2022 is 113 whereas 222 sources had their first issue between 2014 and 2018. More details about non-cited documents can be found in
Figure A1 and
Figure A2. It can be seen from
Table 5 that there are noticeable differences between local and global citations; the reason is that RWH field has also received interest from researchers in other fields. Besides, it can also be seen that the order of papers based on local and global citations does not need to match. For instance, Abdulla and Al-Shareef (2009) has ranked as first in
Table 5 in terms of local citation yet has been placed at the sixth rank based on global citation (
Table 4). Interestingly, highly cited articles (
Table 4) from China were not appeared in local citation analysis (
Table 5). In contrast to global citation in
Table 4, Australia is the leading country in terms of local citation (
Table 5) whereas China is not in the top 15 local citations list.
3.3. Author Statistics
Table 6 represents the top 15 authors in RWH related studies. The number of an academic publication can reflect an author’s research strength and academic impact of his/her work. Hence, the quantity of a researcher’s papers in a field is regarded as an important index in order to evaluate the author’s influence in the field [
62]. According to the results, 7522 authors produced 3226 publications. Among them, 256 authors have more than five articles, representing 3.40% of the total authors and their publications account for 19.34% of the total number of publications. The most productive author in RWH field was Ghisi, E. from Brazil, who has 45 articles, 1454 citations, 19 H-index, 38 g-index and 91 citation per year. Egghe [
88] introduced the g-index, which is the unique largest number such that the top g articles received together at least g
2 citations. H-index and g-index complement each other [
89]. Ghisi, E. (Brazil) and Rahman, A. (Australia) were the only authors who were cited more than 1000 times in RWH field. Rieradevall, J. from Spain has the highest citation per article with 38.5 times. Moreover, his first publication year was 2011, which was later than most of the top authors.
Co-citation analysis, which studies the cited documents [
90], is the most common analysis in bibliometric area [
44,
91,
92]. Co-citation analysis is a tool for monitoring the development of scientific fields, and for assessing the degree of interrelationship among specialities [
90]. Co-citation of two documents occurred when two documents were cited together in a third document. It should be noted that self-citation issue was not considered in this study. It can be a legitimate way to reference authors’ earlier findings; however it affects all the citation metrices.
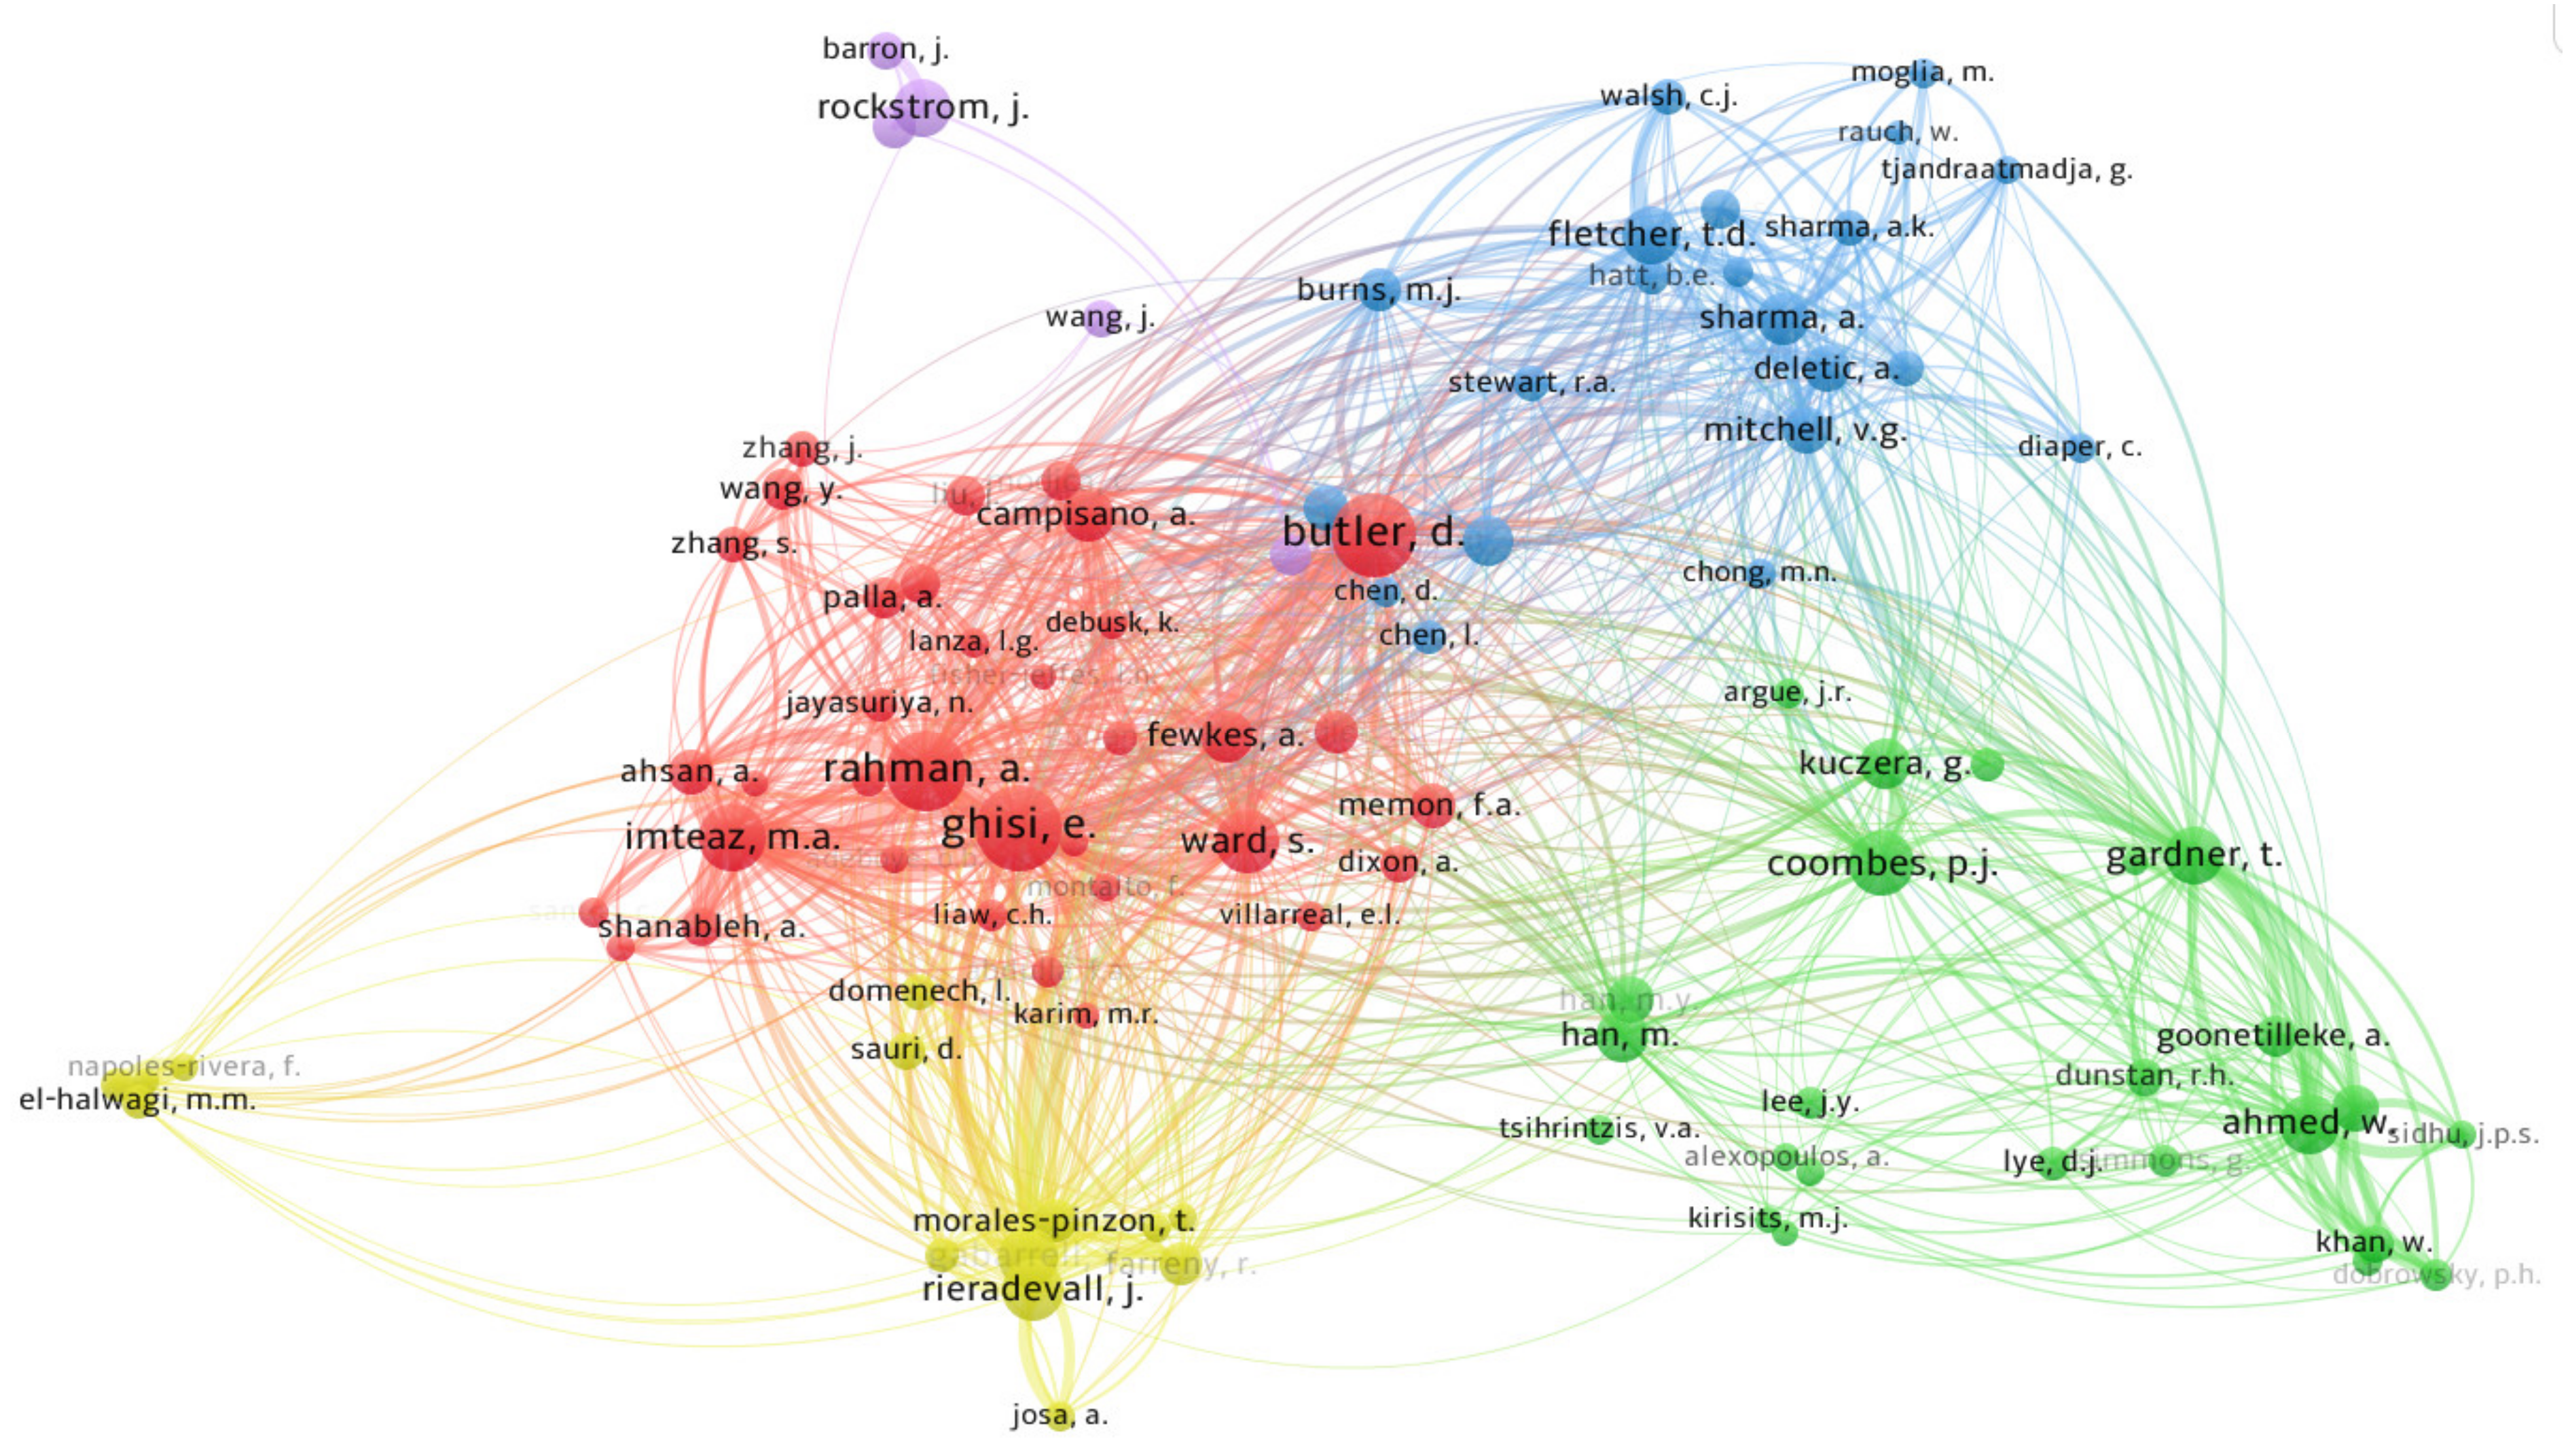
Figure 4 presents the findings of frequently cited authors in terms of co-citation. Network visualization maps illustrate the extent and strength link among authors. The size of circles depicts the total strength of the cited authors (nodes) and thickness of lines represents the strength of collaboration between any two nodes. The distance between two authors roughly indicates the relatedness of the authors in terms of co-citation links. The closer the two authors (nodes) are, the stronger their relatedness. The cluster to which the item belongs determines the colour of an item. Co-citation analysis between cited authors with full counting method [
53] shows that there were 4904 links between 100 out of 103,021 authors in five clusters in the RWH field (
Figure 4). Authors with a minimum number of 100 citations were selected and 200 of 103,021 authors met the selected threshold. For each of the 200 authors, the total strength of the co-citation links with other authors were calculated. The top 100 authors with the greatest total link strength were selected and given in
Figure 4.
Table 7 presents the top 15 co-cited authors which visualized in
Figure 4. It can be seen that the top four authors who are Ghisi, E., Butler, D., Rahman, A. and Imteaz, M.A. had far higher total link strength than others. Those four authors were also placed in the same cluster (Cluster 1-Red). The biggest link strength (=2004) was between Rahman, A. and Imteaz, M.A. Link strength between Rahman, A. and Ghisi, E. was 1528 whereas between Butler, D. and Ward, S. was 1679.
3.4. Keyword Statistics
Table 8 presents the most frequently used keyword in RWH related studies. Although author’s keywords and keyword plus are very similar, there are noticeable differences in terms of their frequencies. For instance, frequency of rainwater is 131 and 1139 based on author’s keywords and keyword plus, respectively. The reason is because keywords plus are index terms obtained by a computer algorithm based on frequent words (more than once) in the titles and in the reference list of papers. Therefore, keywords plus comprise the majority of author keywords [
93]. The use of keywords plus helps capturing a document content with greater variety and depth in bibliometric analysis [
94]. Keywords plus have been widely used to identify gaps or research trends in different scientific studies [
95,
96,
97,
98].
Although number of keywords is important for a research area, changing of keywords over time helps to understand research trends.
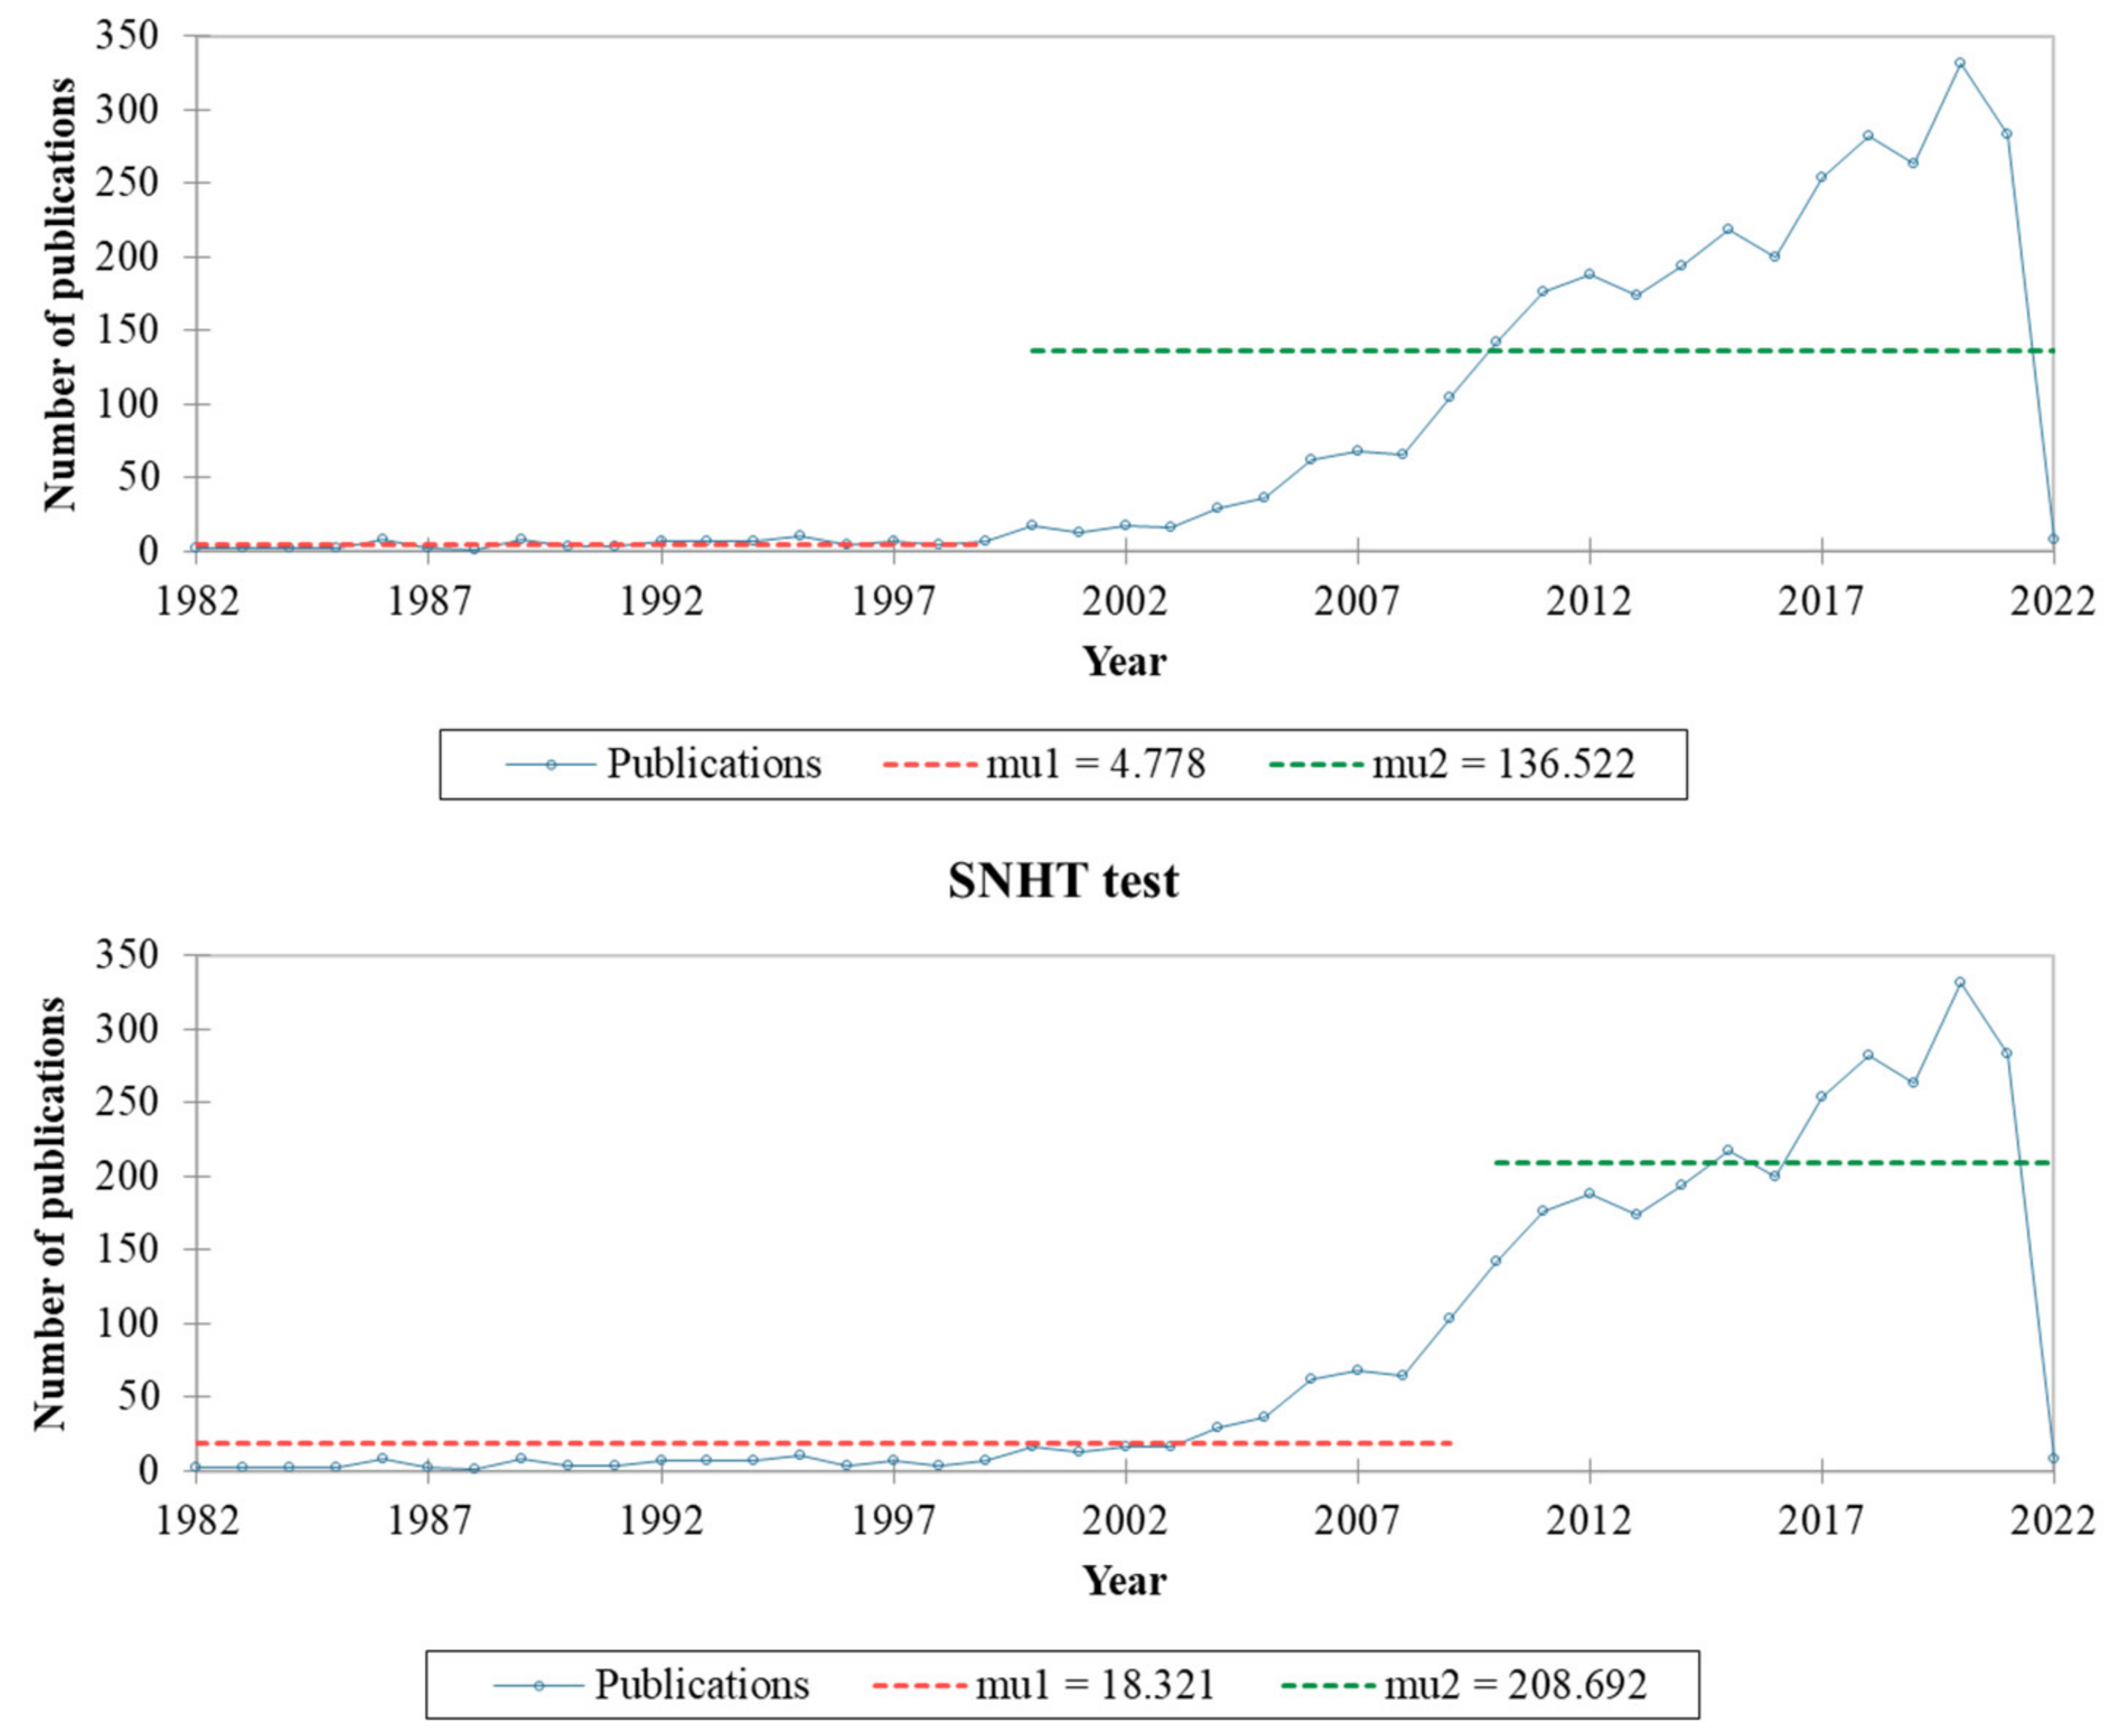
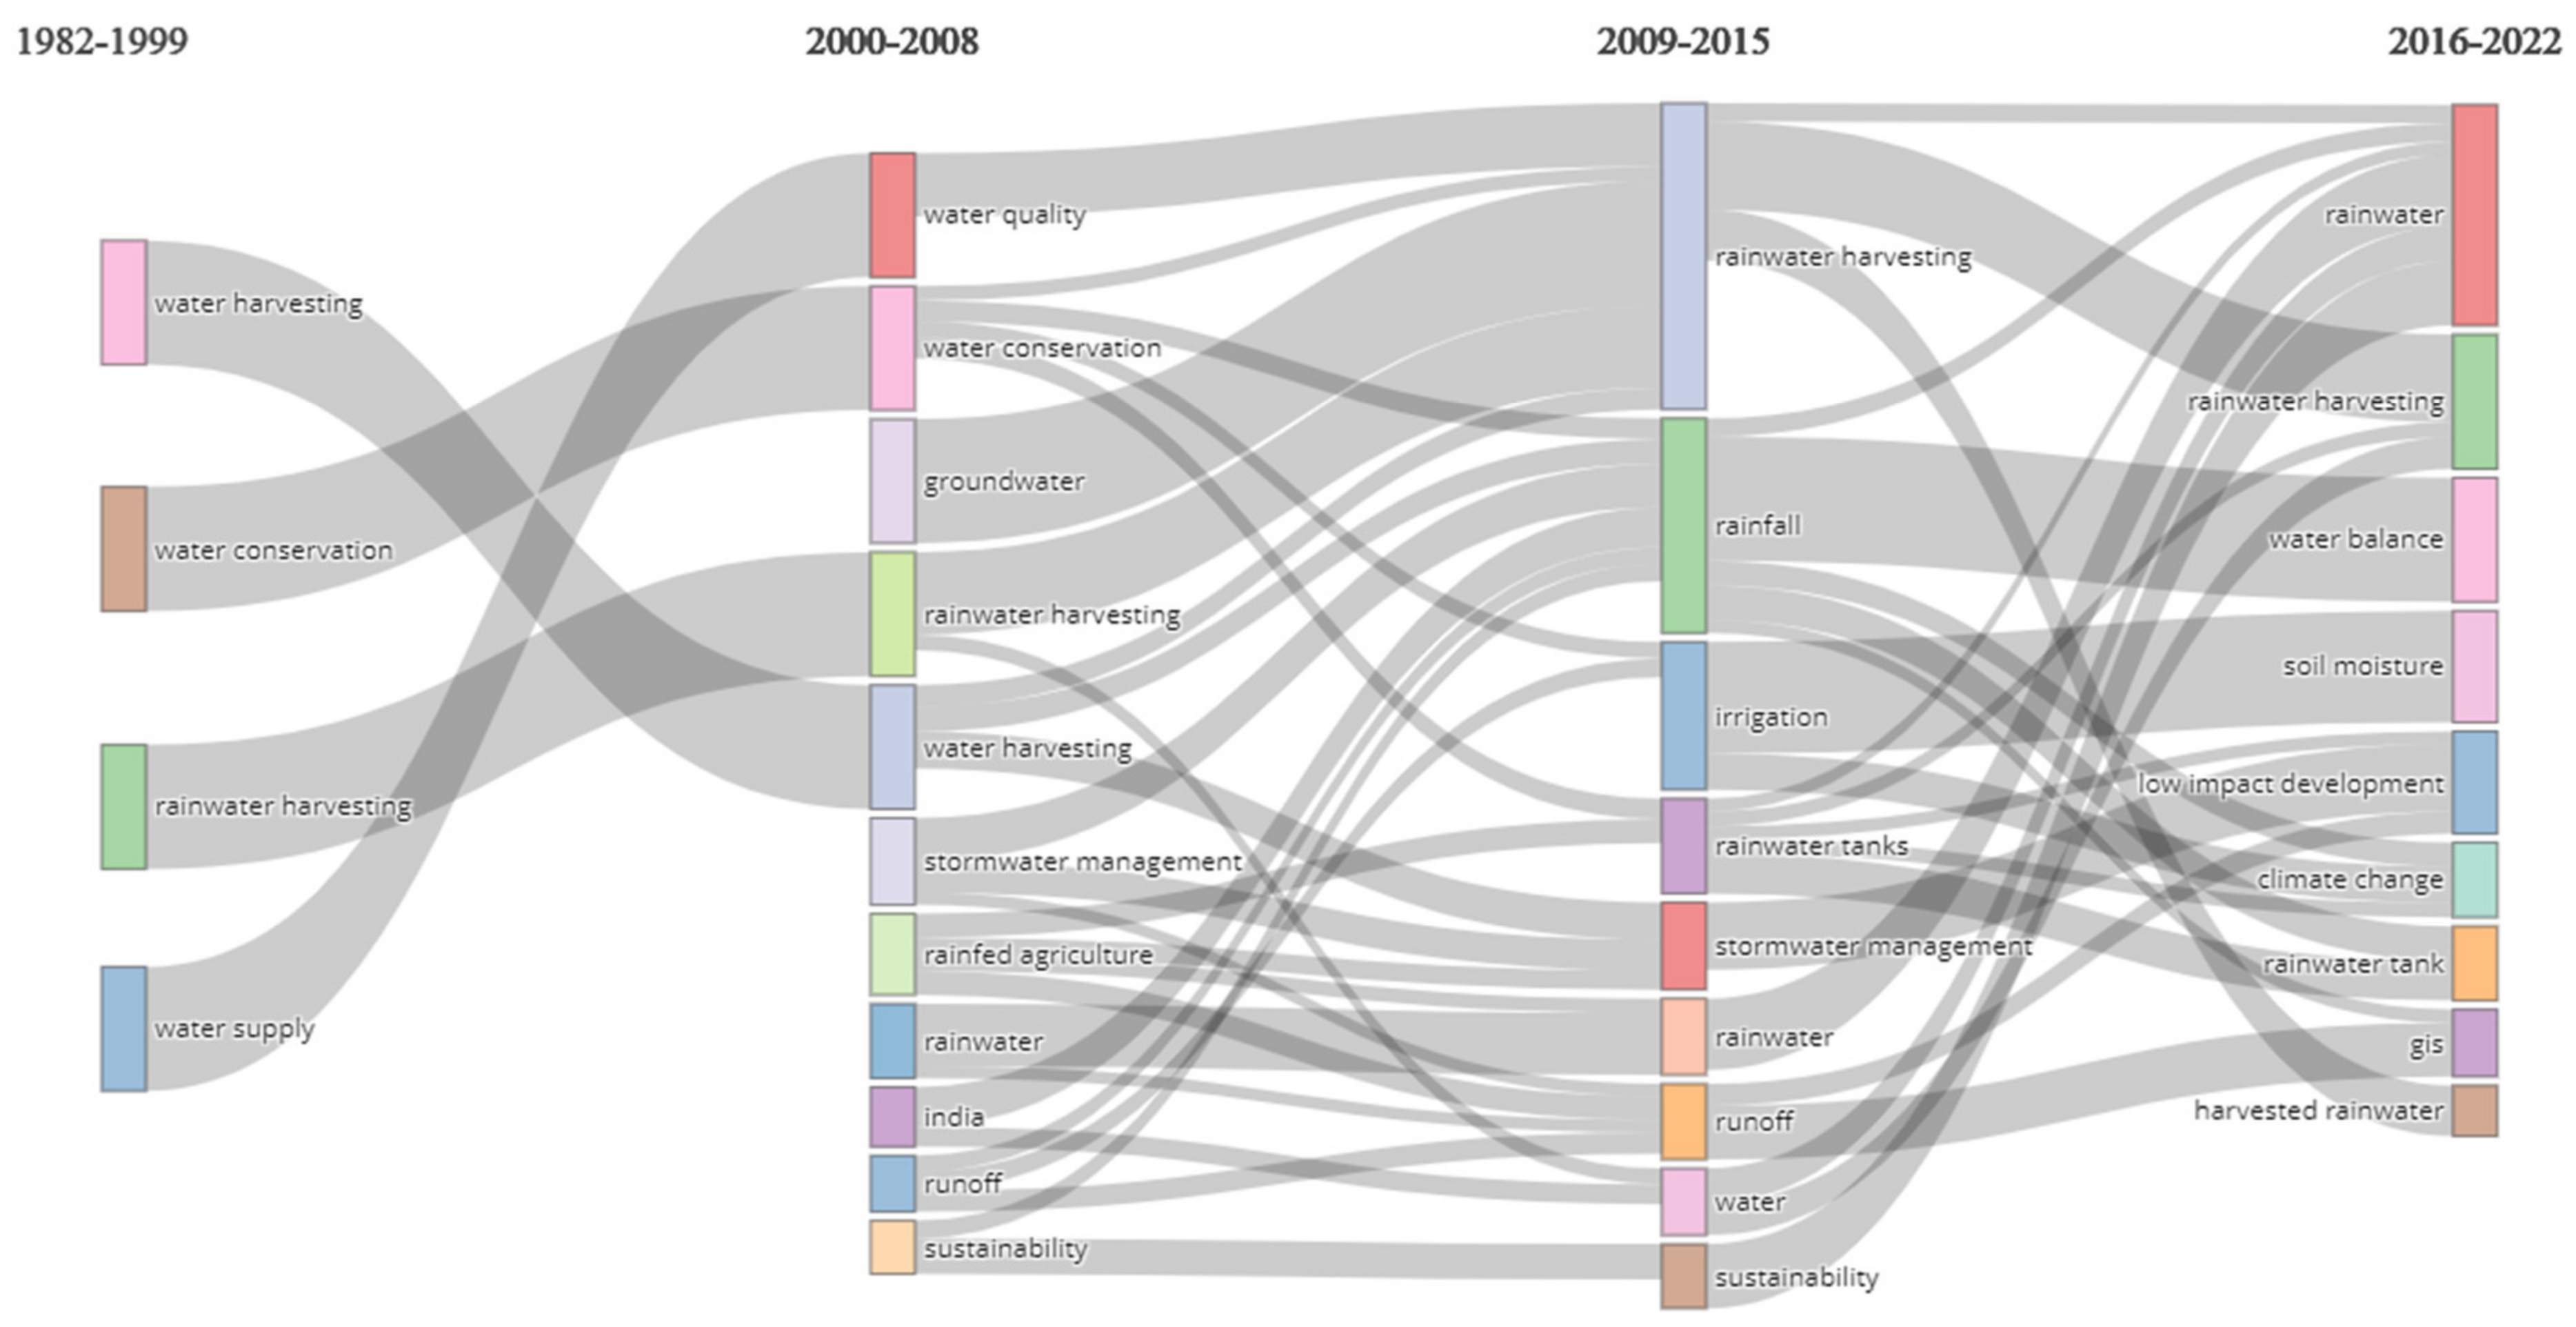
Figure 5 illustrates the thematic evaluation of author’s keywords between 1982 and 2021. Abrupt changes on number of publications were found based on the Pettitt test [
99] and the SNHT [
100] as 1999 and 2009, respectively (see
Figure A3). Each node in
Figure 5 represents a cluster of author’s keywords for a given sub-period. Furthermore, the size of the nodes is proportional to the number of author’s keywords for the corresponding cluster. The flow between nodes illustrates the evolutionary direction of the clusters.
Analysing the most frequent words with their occurrence by time allows us to interpret evaluation of research trends. For this purpose, trend topics (TTs) were analysed and given in
Figure 6. The size of dots represented the frequency of words, whereas the horizontal line depicted the time frame of frequency of occurrence. We used the parameters to create the TTs (
Figure 6) as follows: field (keyword plus), time span (1982–2021), minimum word frequency (15), and number of words per year (2).
For instance, the term ‘agricultural robots’ occurred 46 times between 2020 and 2021. Although ‘Iran’ placed in top of the TTs, it occurred only 22 times between 2013 and 2020. TTs also depicts the top Australian authors published mostly after 2010 (see also
Table 4 and
Table 5). It can be seen from the
Figure 6, the term ‘Australia’ occurred 294 times between 2010 and 2015. This result also shows that several researchers focused on rainwater harvesting in Australia after one of the worst droughts, ‘Millennium Drought’ [
101,
102,
103].
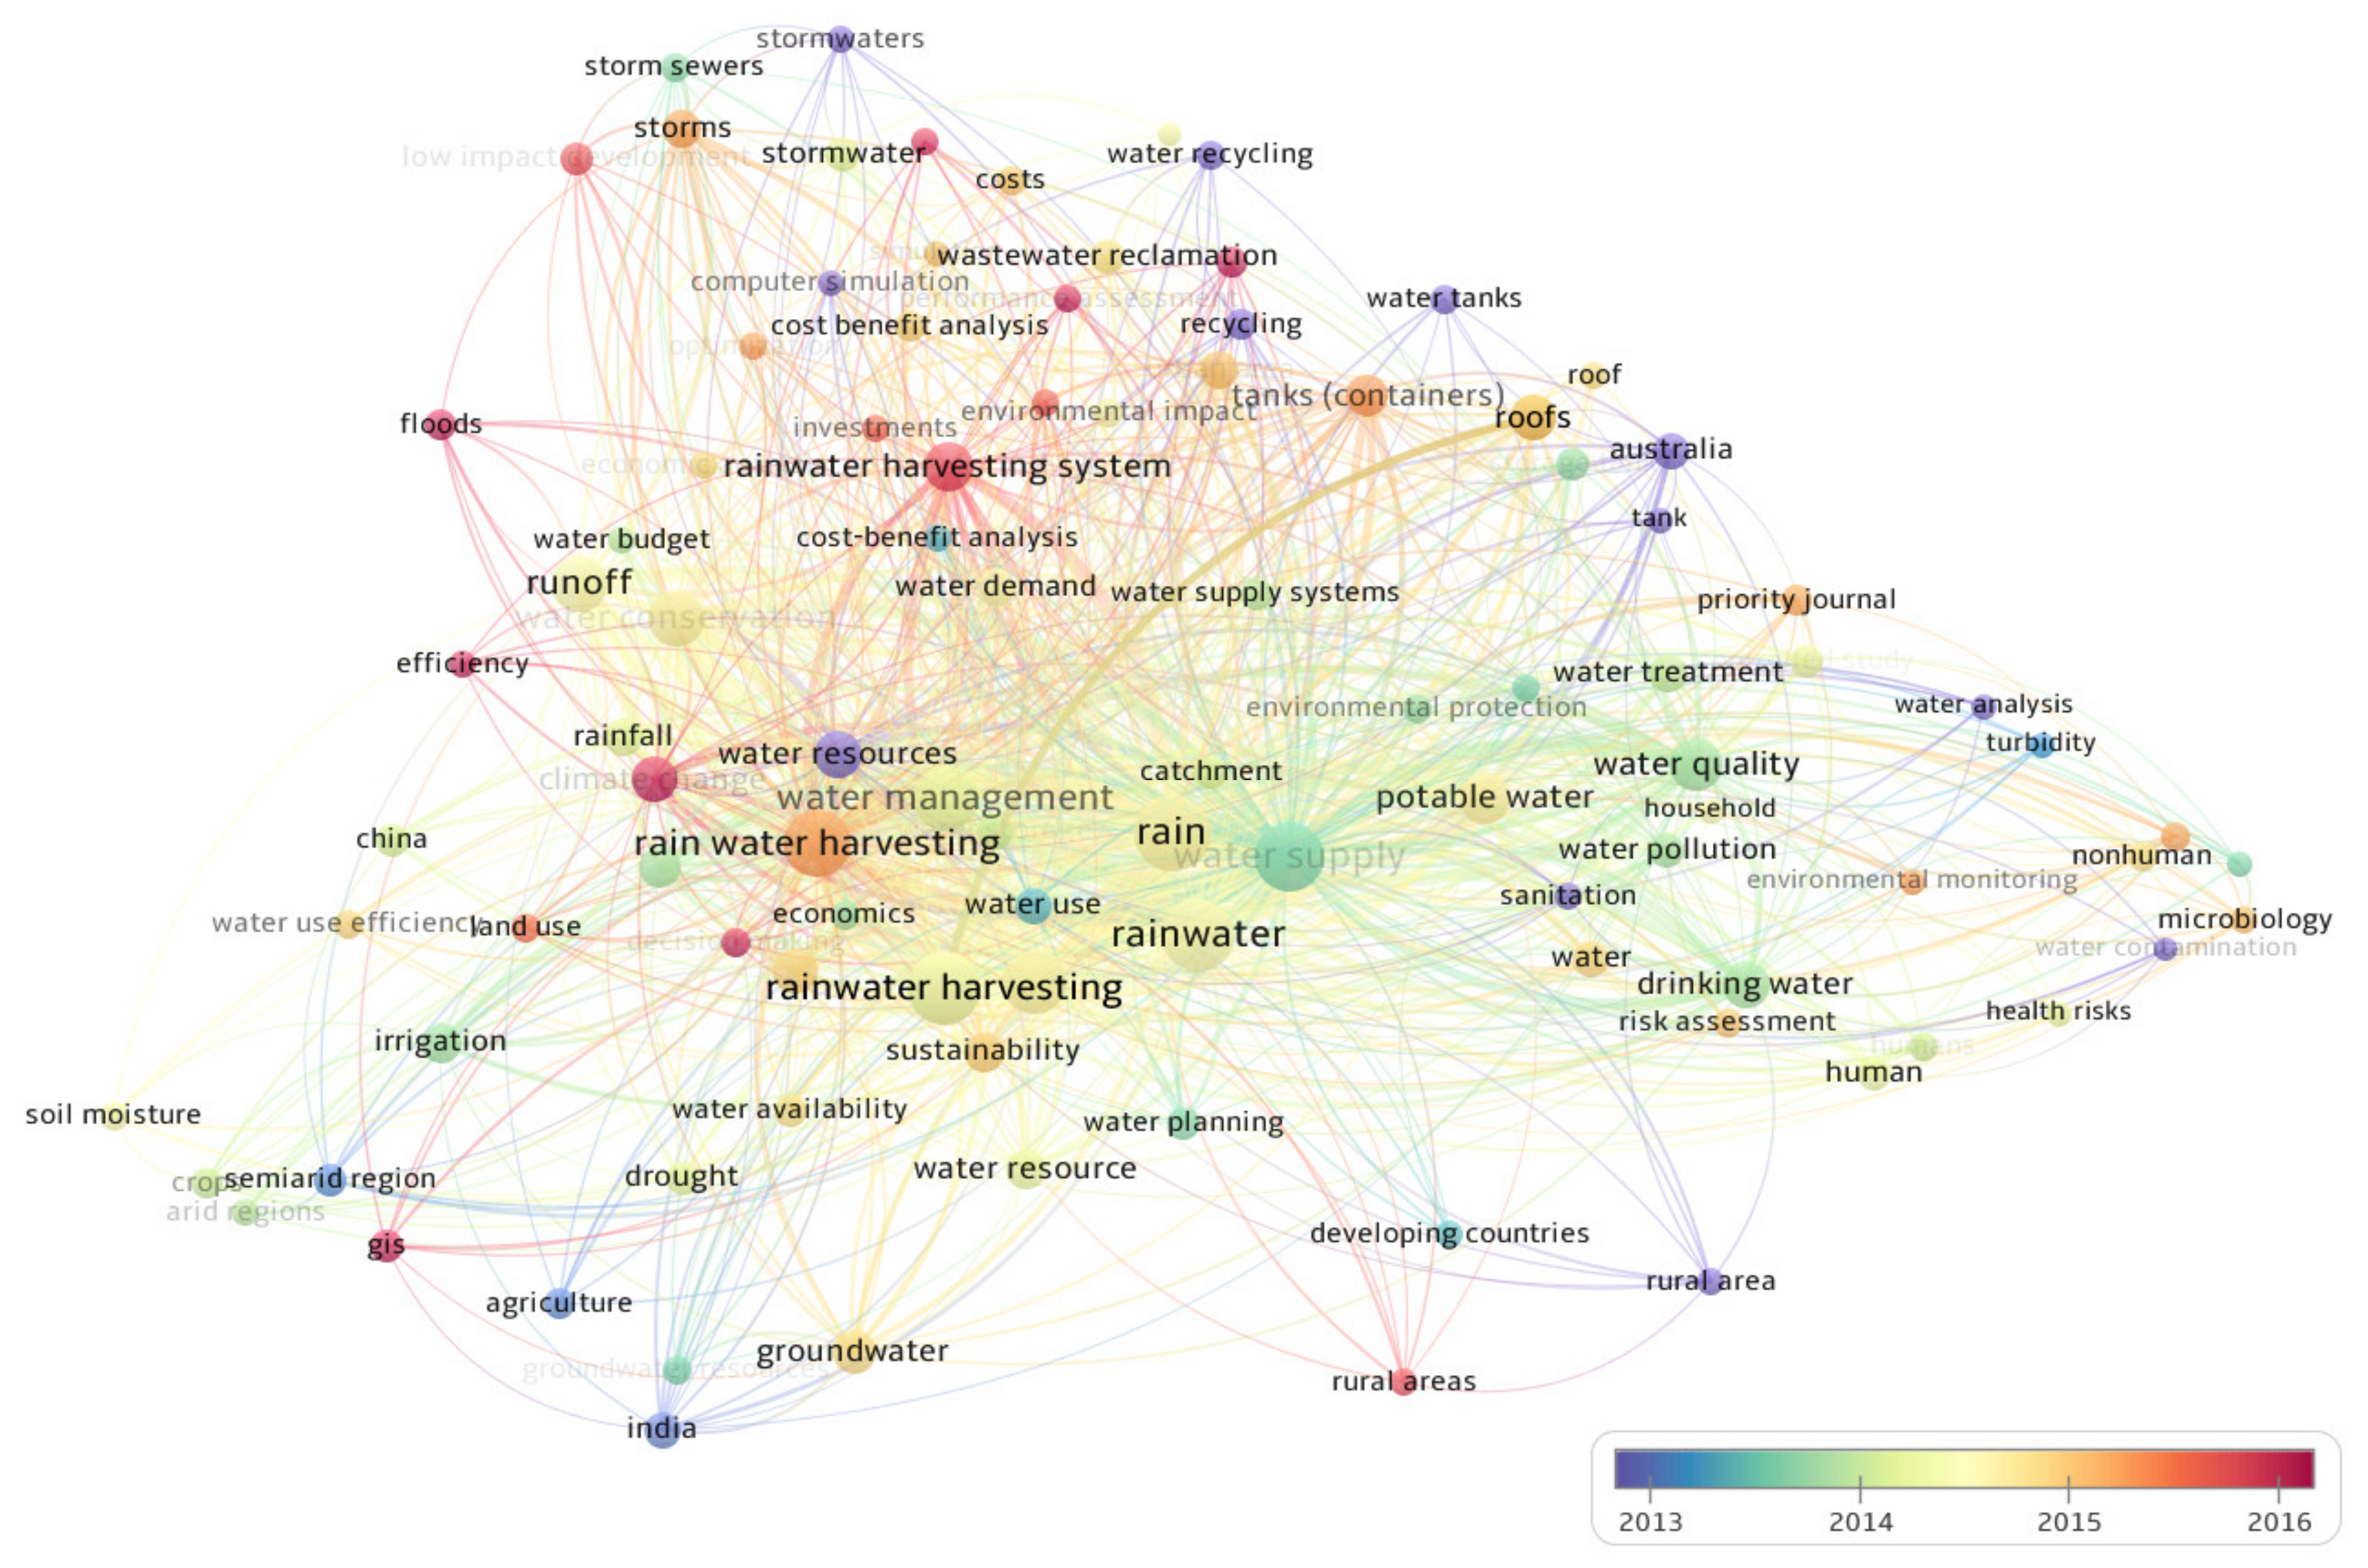
Figure 7 illustrates the co-occurrence map of all keywords (author keywords and keyword plus) over time with full counting method in RWH field. High frequency keywords which is occurred minimum 50 times were selected to make co-occurrence analysis of keywords. Based on selected criteria, 185 keywords met the threshold out of 16,466 keywords. The most frequent used keywords detected between 2013 and 2016. The closeness of a node (circle/keyword) to another reflects the degree of relatedness of the two nodes (keywords) [
104]. Colour of circles represent the average publication year whereas size of the circle represents number of links between keywords. For example, number of occurrences and average publication year of ‘tanks (containers)’ were 271 and 2015.25, respectively. The purple colour shows the publishing time before 2013, most keywords like ‘water recycling’, ‘computer simulation’, ‘sanitation’, ‘water tanks’, ‘rural area’ etc. The most dominant keywords which had the highest total strength are as follows: rain (link strength = 12,962), rainwater (link strength = 10,645), water supply (link strength = 10,286), rain water harvesting (link strength = 8459), and water management (link strength = 8226). Occurrences of given keywords were 1357, 1159, 1062, 947, and 907 times, respectively.
Figure 7 depicts that more and more researchers have focused on ‘floods’, ‘efficiency’, ‘climate change’, ‘performance assessment’, ‘housing’, and ‘decision making’ keywords after 2016.
3.5. Featured Countries and Collaboration Network Analysis
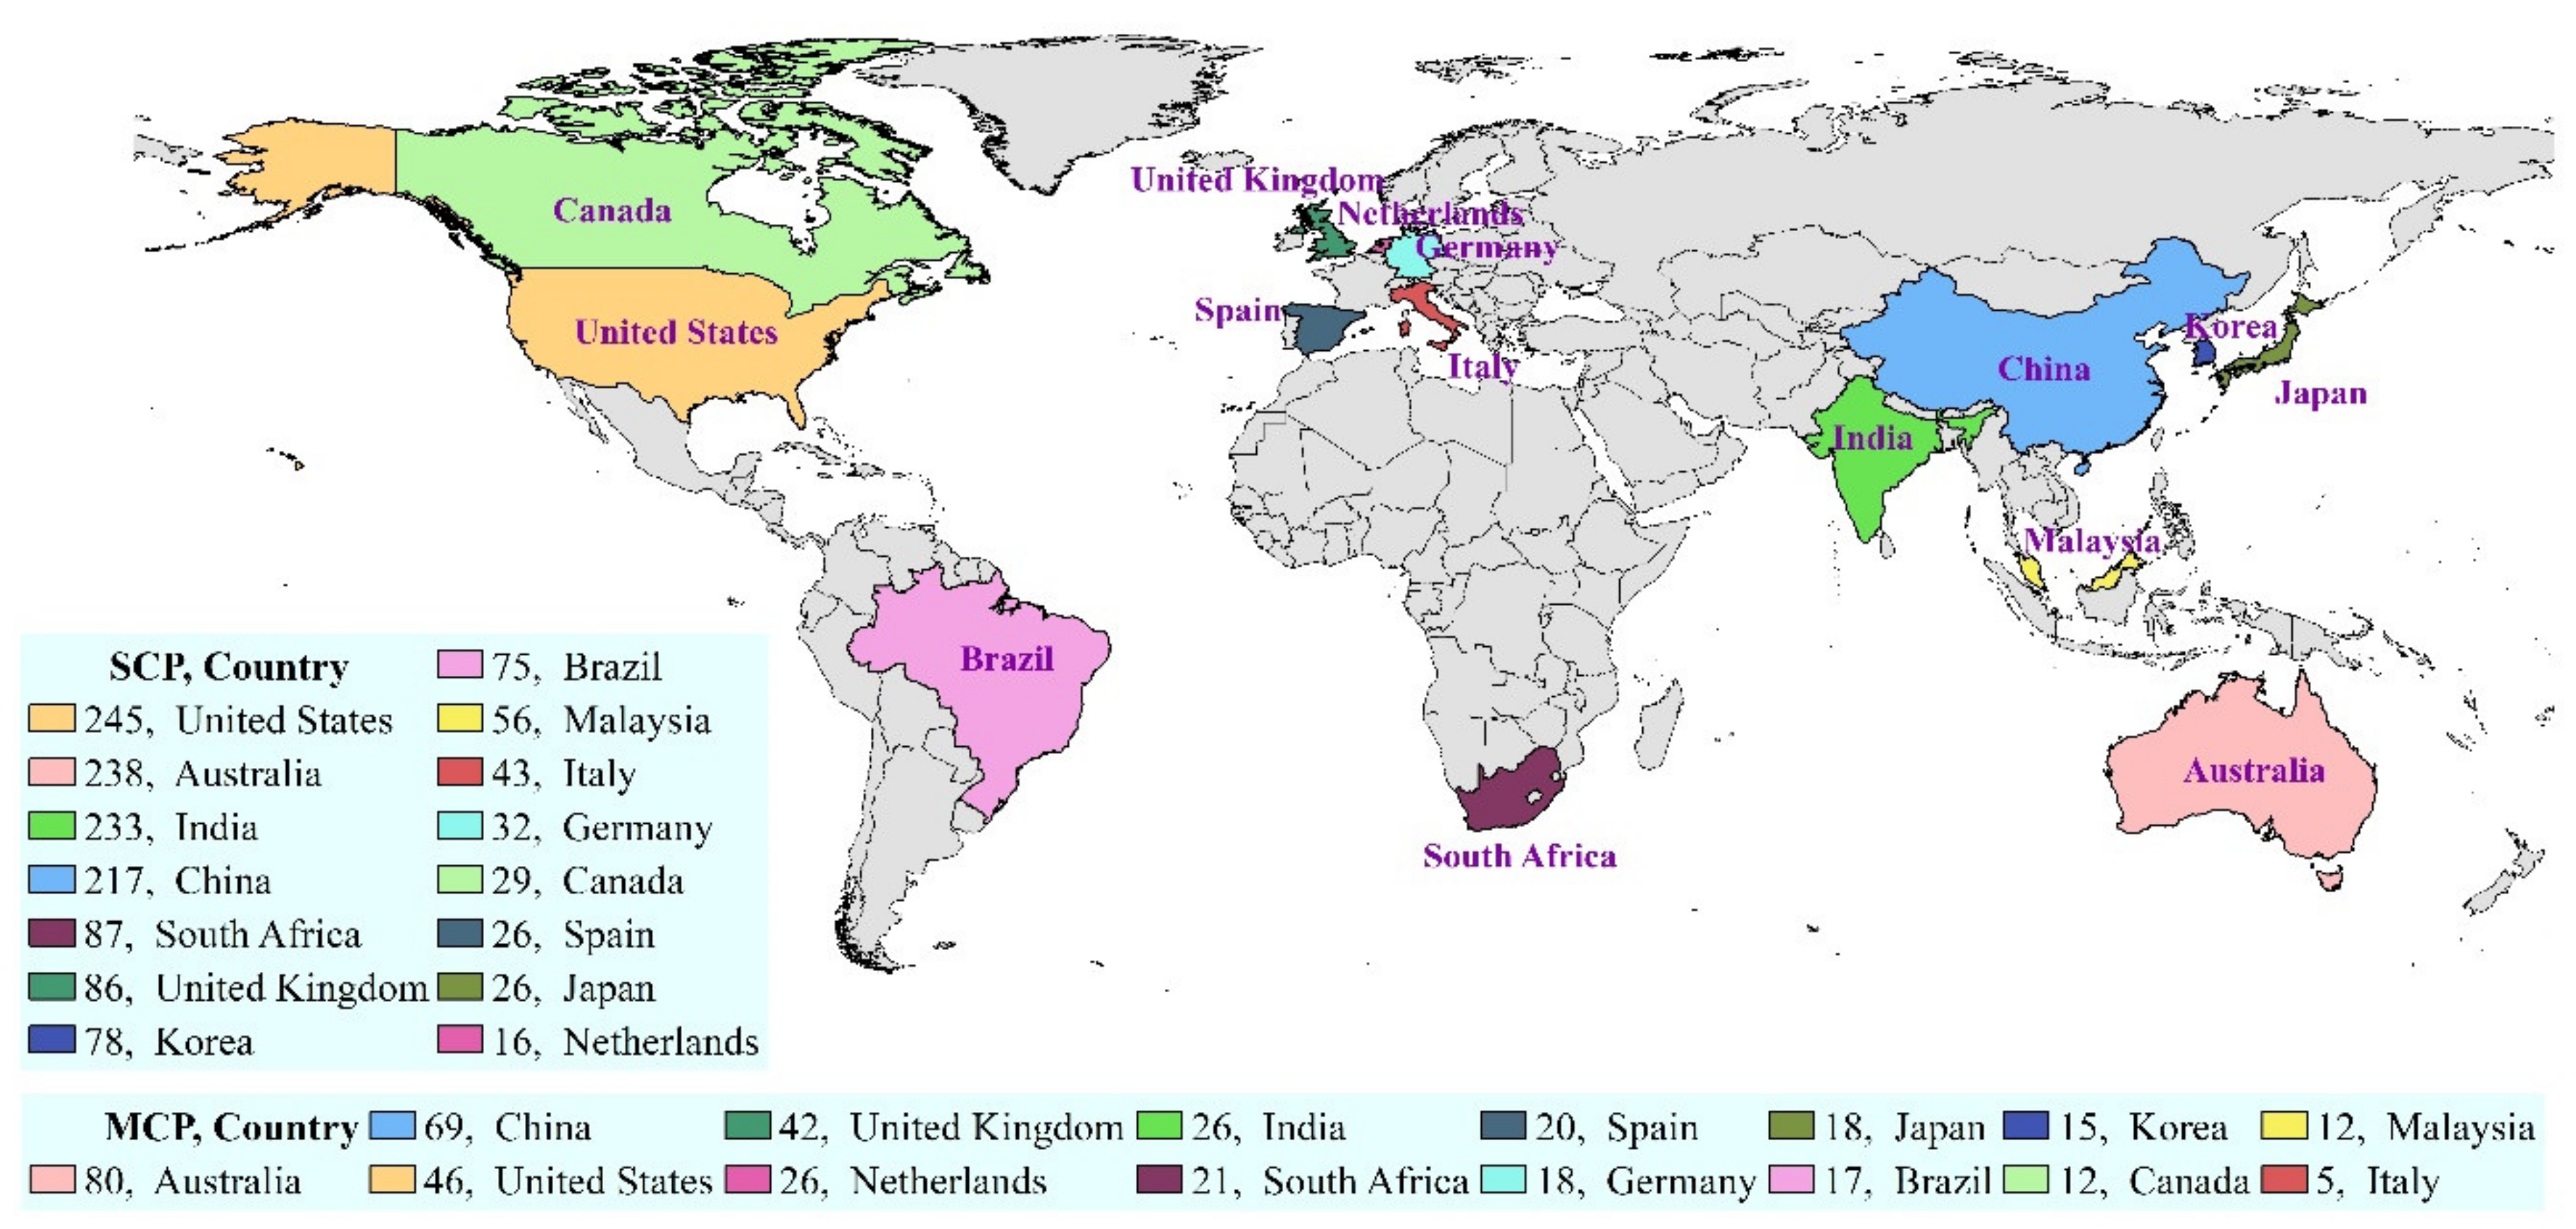
Table 9 and
Figure A4 present the most active countries in RWH field. The number of publications is one of the important indicators to assess the development trends in a specific research area. It can be seen that Australia is the leading country in terms of number of articles on RWH (
n = 318) and total citations (
n = 6687) (
Table 9).
Table 9 shows that the USA was the first ranked country based on single country publication (SCP) whereas Australia had the highest number of multiple country publication (MCP). SCP and MCP refer to international collaboration of authors in the RWH related studies. SCP represents publications done by authors who belonged to the same country, whereas MCP represents that the publications were written by the authors who belonged to different countries.
We calculated the ranking of comprehensive strength of each country based on quantity of publications and citations. A country’s research strength in a particular field to a certain extent can be reflected by its number publications whereas the citation frequency of one publication reflects its academic influence [
60].
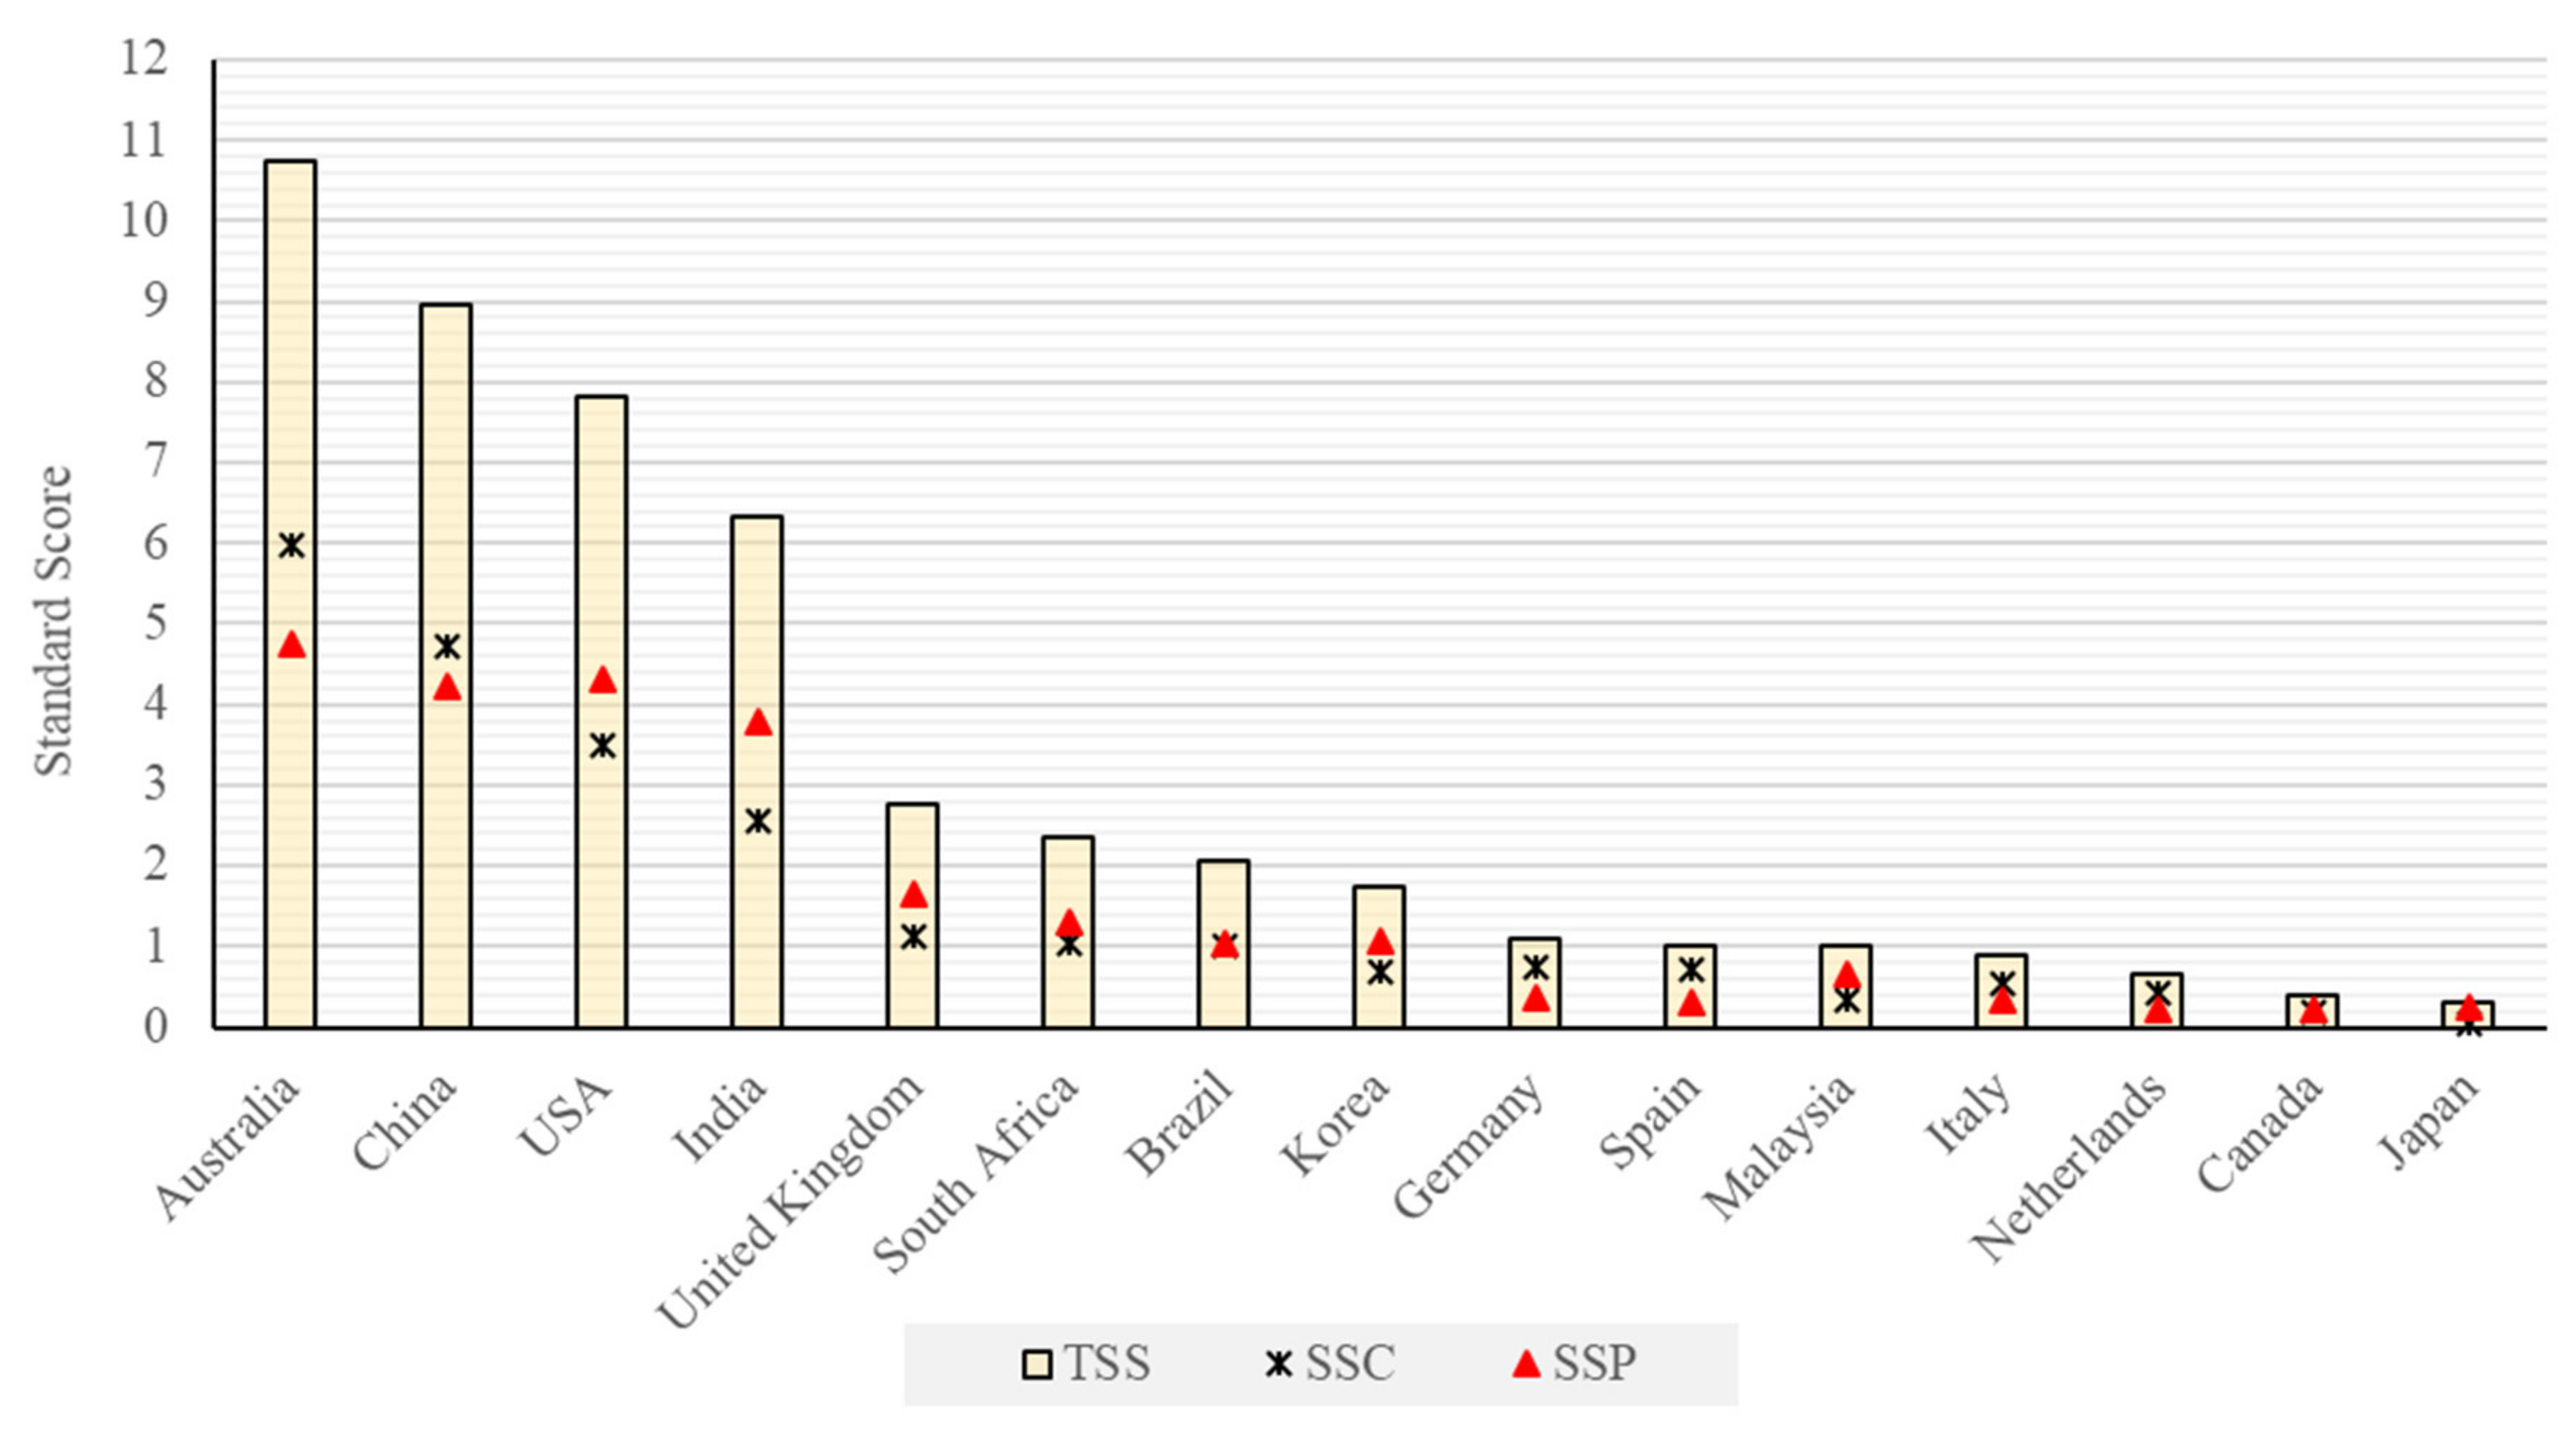
Figure 8 depicts that Australia, China, USA and India were leading countries and their standard scores are far higher than other countries.
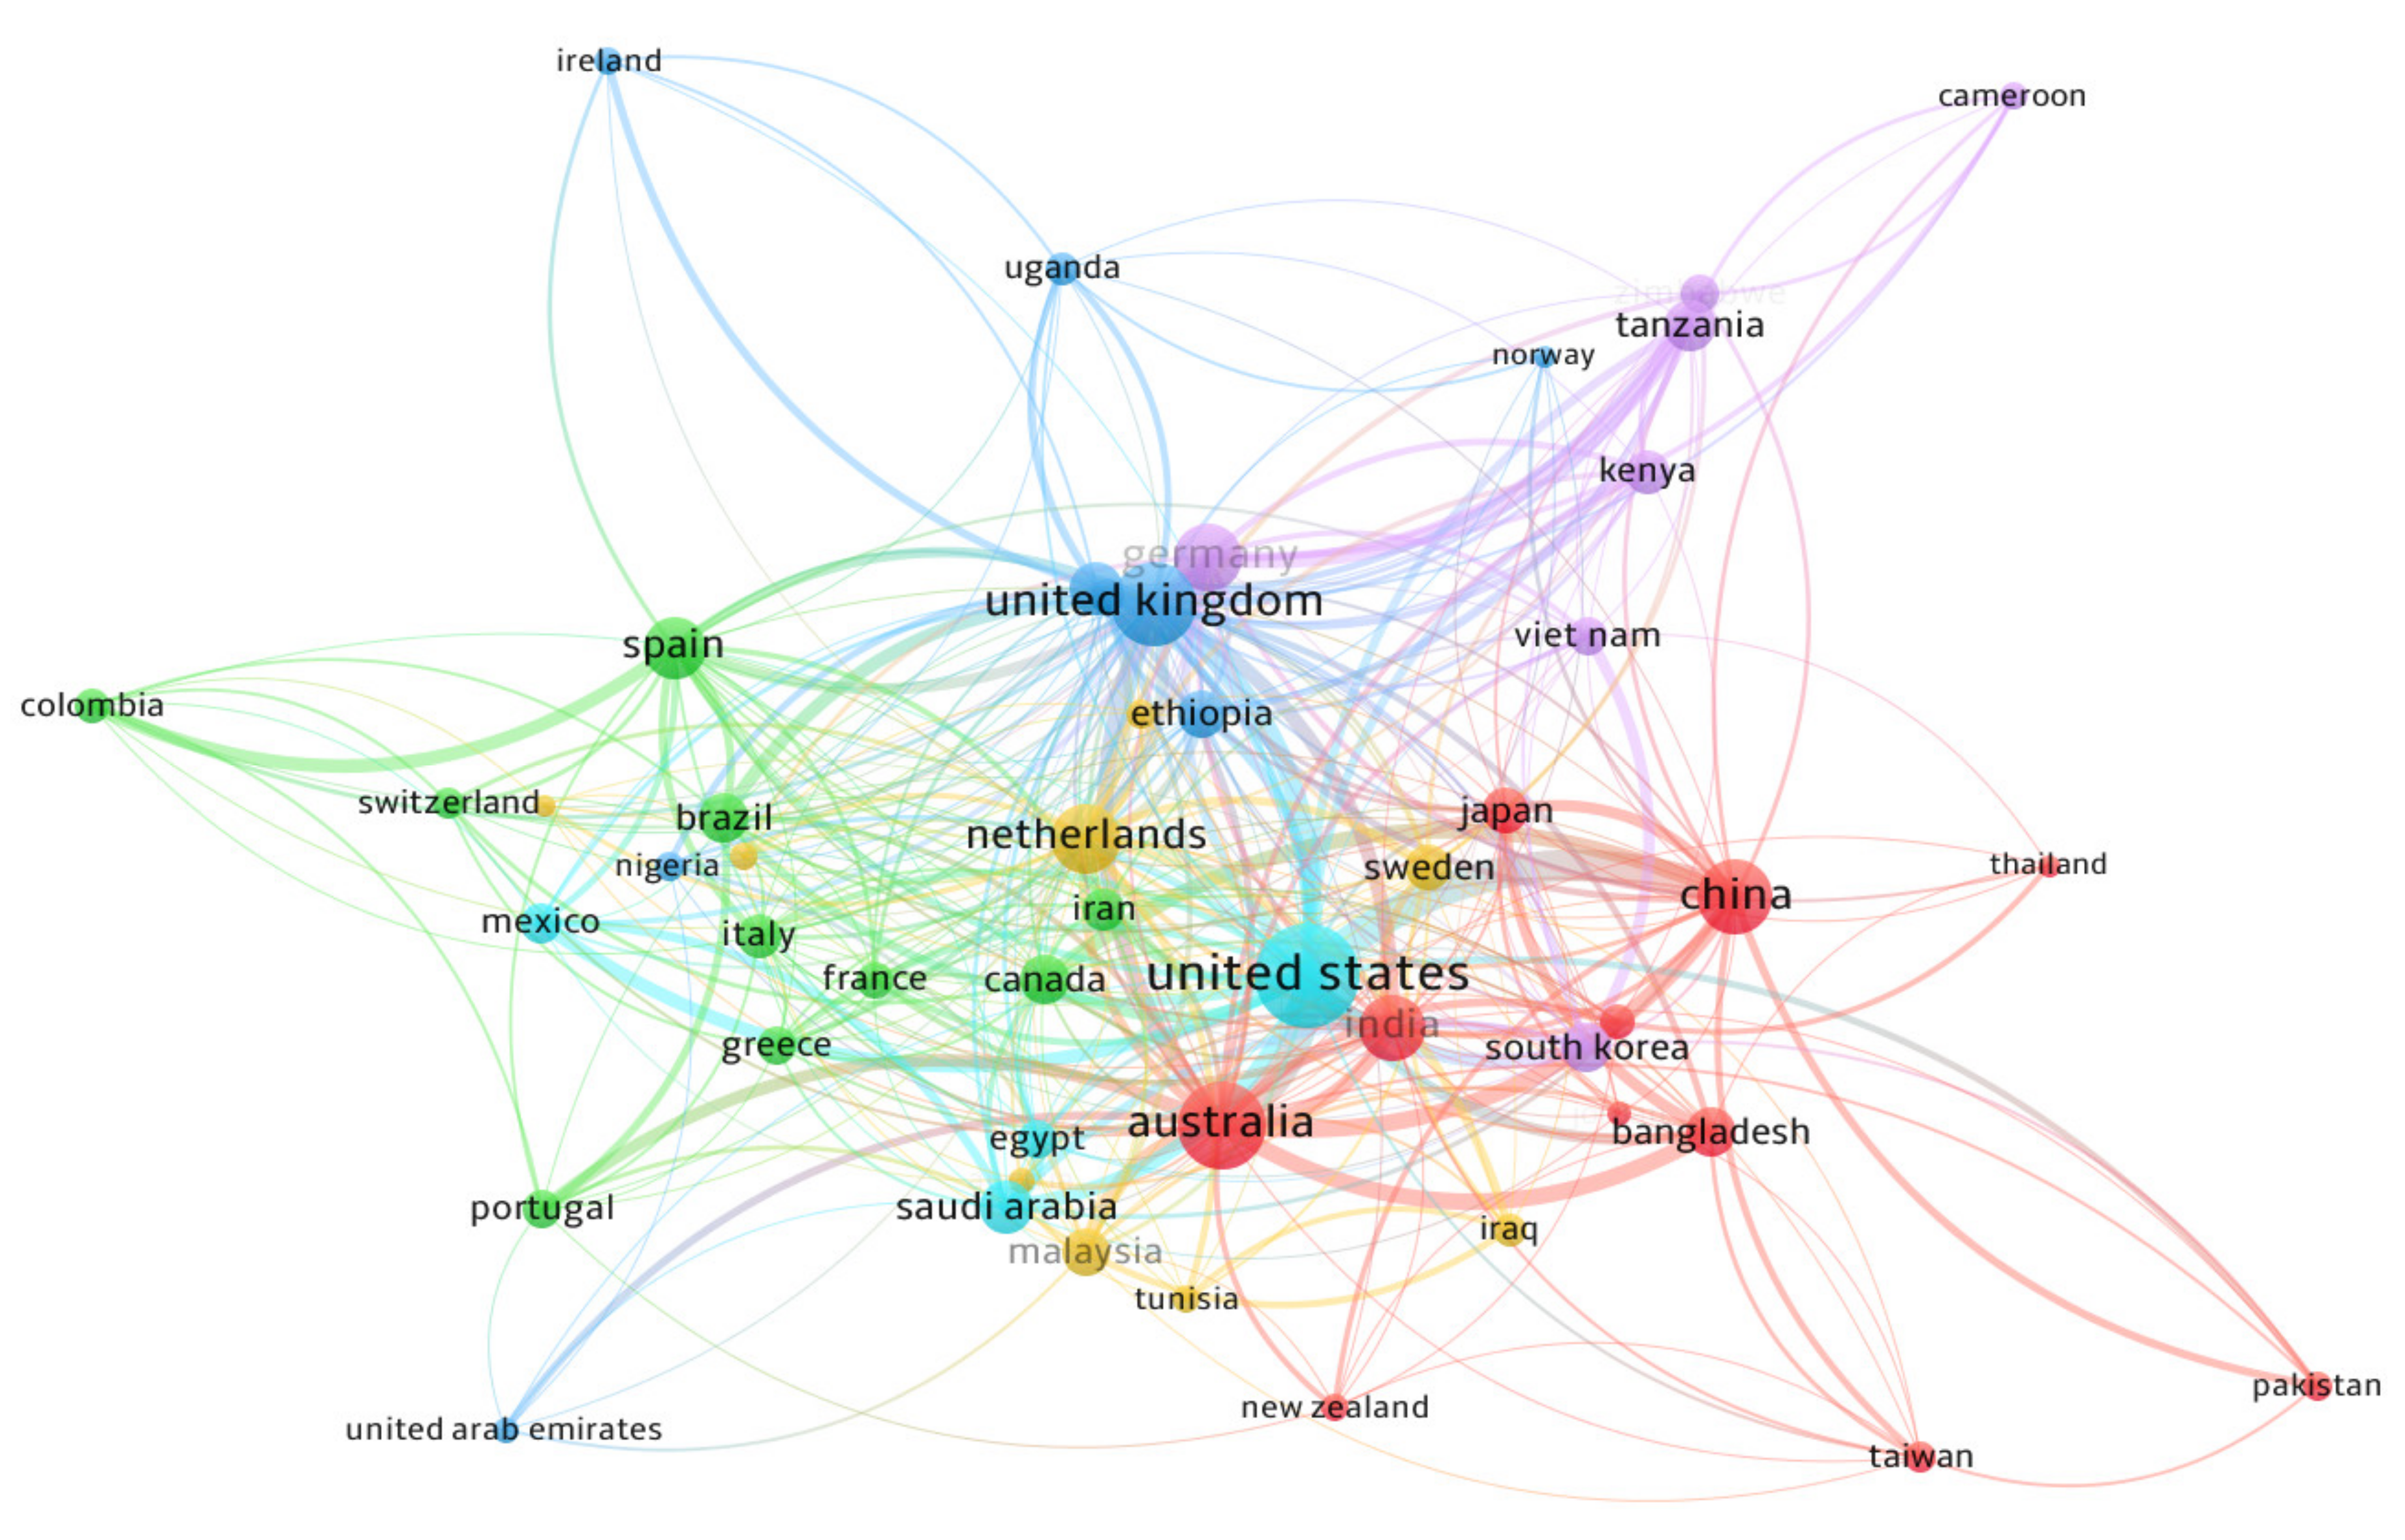
The result of co-authorship analysis between countries with full counting method [
53] is shown in
Figure 9. There were 413 links between 50 out of 69 countries, 1208 total link strength in six clusters. The following pairs of countries were found to be having strong collaborations: USA–China (link strength = 30), USA–Australia (link strength = 28), USA–UK (link strength = 17), Australia–UK (link strength = 14), Australia–China (link strength = 14), Australia–Bangladesh (link strength = 14) and Germany–Tanzania (link strength = 14). The number of co-authorship was the highest for the USA (40 links), UK (40 links), Australia (37 links), The Netherlands (35 links), and Germany (32 links). Average publication year of these countries are as follow: USA (2014.35), UK (2012.98), Australia (2013.73), The Netherlands (2014.62) and Germany (2014.38).
Table 10 shows the most productive institutions in RWH field. Seoul National University (
n = 64) was the leading institution followed by CSIRO Land and Water (
n = 63). These are the most dominant institutions based on number of publications. Australia is the most dominant country in terms of number of institutions in the top 15 productive institutions.
3.6. Comparison of the Most Cited Documents on Scopus, Web of Science and Google Scholar
Scopus, Web of Science (WoS) and Google Scholar (GS) are the most widely used databases for scientific search and analysis. However, they have pros and cons depending on purpose. This study did not aim to compare these databases. However, we would like to show comparison of the most cited articles from these databases. Other comparisons such as trends or network analysis are not possible with GS since GS does not allow to download data in any specific data format. Therefore,
Table 11 present the most frequently cited document with their citations in Scopus, WoS, and GS. It clearly shows that all highly cited papers had higher number of citations in GS than Scopus and WoS. The reason is that GS includes several non-indexed repositories compared to Scopus and WoS. WoS had the lowest number of citations without exception compared to GS and Scopus. Furthermore, one paper was not found in WoS database.
4. Conclusions
This study presents a review of RWH studies using a bibliometric analysis considering publications between 1982 and 2021 sourced from Scopus database. A total of 3226 documents were found on RWH research. It has been found that since early 2000s, there is a continued growth in publication count in RWH research. Moreover, Water (MDPI) has published the highest number of publications (128), followed by Journal of Cleaner Production with 81 publications. In terms of total citations, Agricultural Water Management has the highest citations (2704), followed by Resources Conservation and Recycling (2670).
Based on the current analysis, it can be argued that Ghisi, E. is the most active author in RWH, followed by Han, M., Rahman, A., Butler, D. and Imteaz, M.A., Ghisi, E. and Rahman, A. are the only authors who were cited more than 1000 times in RWH research. However, Rieradevall, J. from Spain has the highest citation per article. In terms of link strength, the top four authors are identified as Ghisi, E, Butler, D., Rahman, A. and Imteaz, M.A. In relation to research collaboration, the top performing countries are USA–China, USA–Australia, USA–UK, Australia–UK, Australia–China, Australia–Bangladesh and Germany–Tanzania. The most productive institutions in RWH field (based on number of publications) are Seoul National University, CSIRO Land and Water, Universidade Federal de Santa Catarina, University of Exeter and Western Sydney University.
The most dominant keywords having the highest total strength are rain, rainwater, water supply, rainwater harvesting and water management; however, more and more researchers have focused on ‘floods’, ‘efficiency’, ‘climate change’, ‘performance assessment’, ‘housing’, and ‘decision making’ keywords after 2016.
It is expected that research on RWH will continue to rise in coming years as it is considered as a sustainable means of water cycle management. Many of the previous research studies were focused in urban areas to save mains water. Future research should focus on (i) RWH for drinking water production in rural areas fitted with disinfection systems; (ii) RWH for household irrigation; (iii) application of GIS to identify suitable areas to harvest rainwater at a larger scale; (iv) RWH for stormwater and flood management as a component of water sensitive urban design; (v) community scale RWH; (vi) RWH for urban livelihood improvement in developing countries; (vii) utilization of harvested rainwater for mitigating heat island effects; (viii) rural drinking water production mini industry based on harvested rainwater; (ix) use of harvested rainwater for artificial groundwater recharge; (x) storing harvested rainwater within seawater and in large flexible rubber balloons/bladder tanks; (xi) impact of climate change on RWH; (xii) innovative rainwater tanks to suit site and water quality requirements; (xiii) RWH in water-food-energy-ecosystems nexus; and (xiv) fully automatic/digital RWH systems with water quantity and quality monitoring.
The main contribution of this research is mapping the previous research on RWH, which will assist to direct future research in this important area. When the capability of the bibliometric analysis tools increases in future, a new bibliometric analysis should be carried out.
