Article

Achieving Partial Nitritation in Anammox Start-Up Environment

1
Department of Process, Energy and Environmental Technology, University of South-Eastern Norway, 3918 Porsgrunn, Norway
2
Biowater Technology AS, 3115 Tønsberg, Norway
*
Authors to whom correspondence should be addressed.
Water 2022, 14(2), 229; https://doi.org/10.3390/w14020229
Submission received: 26 November 2021 / Revised: 5 January 2022 / Accepted: 10 January 2022 / Published: 13 January 2022

Abstract

:
Removing ammonium via the partial nitritation anammox (PNA) process has been widely applied because of its cost and energy effectiveness. However, the first stage of PNA, partial nitritation, is hard to implement practically due to the challenging suppression of nitrate oxidizing bacteria (NOB) and should be achieved in the anammox environment to extend it to one stage PNA. Hence, this article evaluates different techniques, such as the combination of low dissolve oxygen (DO) and high free ammonia (FA), and the intermittent aeration cycle to achieve partial nitritation in an anammox start-up environment. For this purpose, a 10.5 L lab-scale moving bed biofilm reactor was set up and fed with synthetic wastewater and the transformation of influent ammonium into nitrate and nitrite was measured. The results showed that, despite applying low DO and higher free ammonia than the inhibition range of NOB, the nitrate production rate (NPR) was consistently higher than the nitrite accumulation rate (NAR), signifying no sufficient NOB suppression, partial nitritation under continuous aeration and up to a 0.27 gN/m2·d surface ammonium loading rate (SALR). Higher SALR than 0.27 gN/m2·d could result in partial nitritation since nitrogen compounds transformation was closer to partial nitritation when the reactor was subjected to 0.27 gN/m2·d rather than 0.14 gN/m2·d. Lifting up the SALR, on the other hand, results in a bad anammox environment and cannot prolong it to one-stage PNA. An intermittent aeration cycle with four different cycle lengths sets, obtained by monitoring nitrogen compound transformation, was, therefore, applied to the reactor. The relatively shorter aerobic length of 10 min ON and 30 OFF intermittent aeration cycle with 0.5 mg/L aerated DO was successful in achieving the partial nitritation with NPR, NAR, and ammonium removal efficiency (ARE) values of 17%, 78%, and 37%, respectively, showing that shorter aerated length suppresses NOB to a high degree due to less available time for NOB after oxygen starvation.

1. Introduction

Partial nitritation is the process by which ammonia oxidizing bacteria (AOB) convert half of the ammonium concentration in wastewater to nitrite in an aerobic environment (Equation (1)) [1]. Based on the energy source, the AOB bacteria are chemolithoautotroph, which means that they obtain the energy from the oxidation of inorganic compounds and utilize carbon dioxide as carbon source for cell synthesis. In recent years, partial nitritation has been considered a crucial mechanism, as it provides sufficient substrates for the anammox process.
1.0   NH 4 + + 0.75   O 2 + HCO 3     0.5   NH 4 + + 0.5   NO 2   + CO 2 + 1.5   H 2 O
Anammox process is the simultaneous consumption of nitrite and ammonium to yield nitrogen gas by anammox bacteria in an anoxic environment (Equation (2)) [2]. Since wastewater has low nitrite content, partial nitritation is often combined with an anammox process for the complete nitrogen removal from the wastewater, known as the partial nitritation anammox process (PNA). This combination can be carried out in a single reactor
1.0   NH 4 + + 1.32   NO 2 + 0.066   HCO 3 + 0.13   H +     1.02   N 2 + 0.26   NO 3 + 0.066   CH 2 O 0.5   N 0.15 + 2.03   H 2 O
(one-stage PNA) as well as in two reactors (two-stage PNA). In the attached growth biological wastewater treatment process, the biofilm with the combination of AOB in the outer layer and anammox in the inner layer in one reactor is responsible for one-stage PNA (Figure 1), whereas distinct biofilm for each phase in a separate reactor result in two-stage PNA. The PNA is a more cost-effective nitrogen removal approach than the conventional nitrification-denitrification process because it does not require organic carbon, requires 63% less aeration (i.e., energy) [3], and reduces the sludge yields by approximately 80% [4]. In addition, carbon dioxide produced in the preceding partial nitritation step (Equation (1)) is utilized by anammox bacteria, resulting in a lower carbon footprint than the traditional nitrogen removal technique [5]. However, the practical implementation of the partial nitritation process is quite challenging due to the growth of nitrite oxidizing bacteria (NOB). If a significant number of NOB population is present, the nitrite produced by partial nitritation could be completely oxidized to nitrate. Therefore, the NOB bacteria should be suppressed to prevent nitrite accumulation and ensure efficient nitrogen removal through the PNA process.
Several operational strategies, such as high free ammonia (FA) concentration [6], low dissolved oxygen (DO) [7], intermittent aeration [8], chemical dosing [9], and elevated ammonium loading rate [10] have been used to achieve quick and stable partial nitritation.
The free ammonia (FA) concentration higher than 8–120 mg/L inhibits the AOB bacteria, while 0.08–0.82 mg/L FA concentration hinders the NOB activity [11]. Hence, the application of relatively higher free ammonia (i.e., in between inhibition range of AOB and NOB) could enhances nitrite accumulation. To maintain the right temperature, pH, and inflow ammonium concentration can help to keep the right amount of FA in the system [11].
Because the NOB has a higher DO half-saturation constant (Ks) value than the AOB (0.032–0.48 for AOB vs. 0.7–5.3 for NOB), NOB has a slower growth rate than the AOB under low DO concentrations [3]. However, a recent study found that partial nitritation is impossible even at low DO concentrations because of the growth of Nitrospira species of NOB bacteria, which has a comparably lower DO half-saturation constant (Ks) value than AOB bacteria (i.e., 0.33) [12].
Consequently, an intermittent aeration cycle is an effective approach to suppress NOB bacteria and is considered as a robust technique because it can be applied in almost all types of reactors. In this strategy, the aerobic and anaerobic condition is applied in the reactor alternatively in short cycle (Figure 2). By the alternation of such environments, it is possible to suppresses NOB bacteria because of its lower starvation recovery dynamics compared to AOB [13]. When the reactor shifts from the anoxic phase to the aerobic phase, AOB, which has a higher recovery time, acts upon the wastewater immediately, but NOB takes a longer time to convert nitrite to nitrate because of lower starvation recovery dynamics. As a result, nitrite is accumulated in the reactor, and before NOB starts to convert nitrite to nitrate, aeration should turn off to shift the reactor environment from aerobic phase to anoxic phase. Hence, the main principle behind the intermittent aeration cycle is to suppress NOB using starvation recovery time of NOB, and the actual aerobic length should be similar or less than that time for complete NOB suppression. In addition, under this strategy, AOB produces two compounds, which are inhibitory of NOB growth: (i) hydroxylamine (NH2OH), formed when aeration is suddenly turned off [14], and (ii) nitric oxide (NO), which is produced by performing denitrification under anoxic conditions [15]. However, maintaining optimum cycle lengths (i.e., aerobic length and anoxic length) is quite challenging due to a lack of knowledge of the actual recovery time of NOB.
Moreover, volatile fatty acids (VFA) like formic, acetic, propionic, and n-butyric, which have a high inhibitory effect on the NOB but no inhibitory effect on the AOB, can be used to achieve partial nitritation [17]. A study carried out by Peng et al. [18] on several inhibition compounds for nitrification shows that chlorate, cyanide, azide (i.e., conjugate base of hydrazoic acid), and hydrazine have a greater inhibition effect on the NOB than AOB. Therefore, the addition of such compounds in an appropriate amount suppresses NOB without affecting AOB, resulting in partial nitritation.
The main aim of this experimental test was to obtain rapid partial nitritation, which can then be expanded into a one-stage PNA. For this, partial nitritation should be accomplished in an anammox-friendly environment; otherwise, altering operating conditions for anammox start-up may affect achieved partial nitritation and, subsequently, the anammox process. The study has proposed the potential of two distinct strategies for stable partial nitritation, including a combination of high free ammonia and low dissolved oxygen under continuous aeration, as well as an intermittent aeration cycle with varying cycle lengths.

2. Materials and Methods

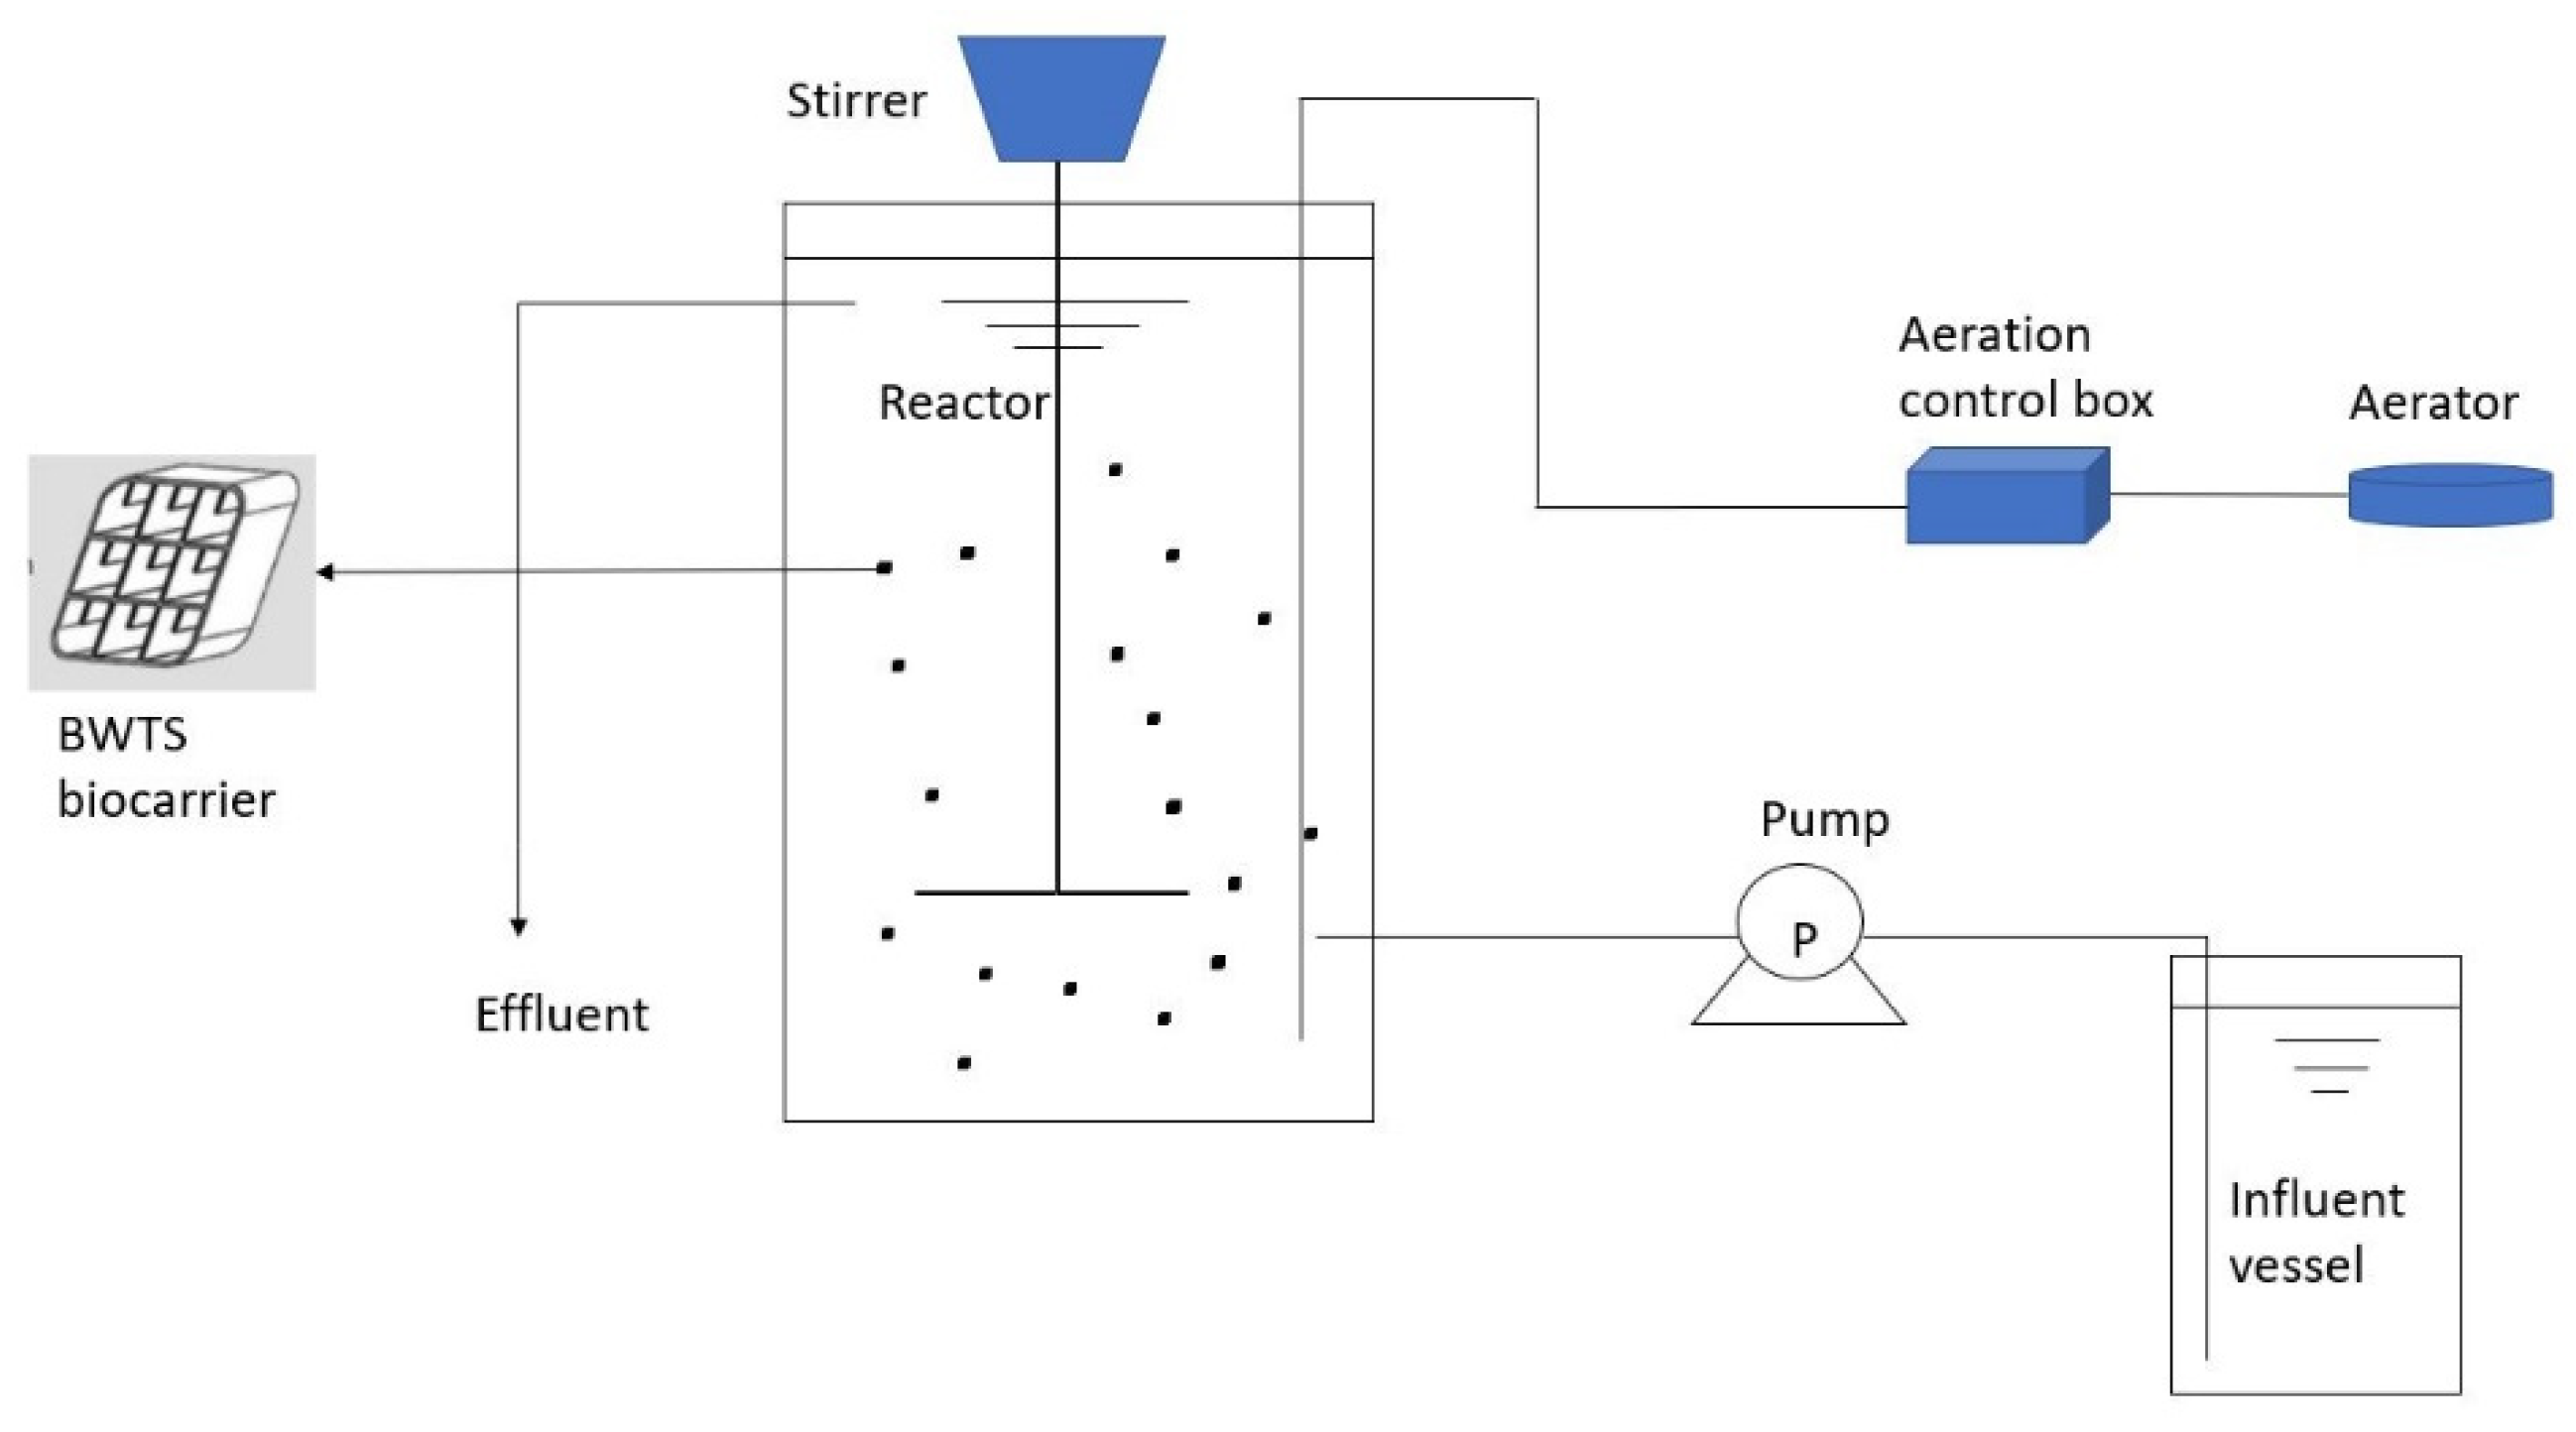
2.1. Experimental Setup of Moving Bed Biofilm Reactor

The schematic diagram of the experimental setup of the lab-scale MBBR reactor is depicted in Figure 3. The reactor had a working volume of 10.5 L, of which 5 L was filled with the BWTS® bio-carriers (dimensions: 14.5 × 18.5 × 7.3 mm and protected surface: 650 m²/m³, from Biowater Technology AS), resulting in a total surface area of carrier and effective water volume of 3.25 m2 and 8 L, respectively. Among 5 L of the carrier 3 L was obtained from a pilot nitrification-denitrification moving bed biofilm reactor (MBBR) at Knarrdalstrand Wastewater Treatment Plant (KRA) in Porsgrunn, Norway. The MBBR reactor was continuously fed with synthetic wastewater through a peristaltic pump (IsmatecTM ISM795C) from a 20 L influent vessel (Duran glass bottle). The continuous aeration was provided in the reactor by means of the aerator (Sera air 550R, Germany) and was connected with the aeration control box (Draeger air control) for the intermittent aeration cycle. The reactor was wrapped with PTFE-insulated heating tape (ISOHEAT, Germany) to maintain a temperature of 30 ± 1 °C throughout the experimental period. The mechanical stirrer (i.e., Joanlab digital overhead stirrer) was inserted from the top and rotation speed was set to 140 rpm (i.e., revolution per minute) for uniform movement of the biofilm inside the reactor. Moreover, the reactor was completely wrapped from outside with a black rubber plastic insulation sheet to protect the active biofilm from the sunlight.

2.2. Operating Conditions

Two different surface ammonium loading rates (SALR), which were achieved by varying the influent flow rate, were applied in the reactor under continuous aeration as operating conditions up to the experimental period, day 59. Then, the strategy was changed to intermittent aeration, and four different sets of intermittent aeration cycles, from now onwards called IAC-1, IAC-2, IAC-3, IAC-4, were tested. The reactor operations details, such as hydraulic retention time (HRT), SALR, and flow rate for continuous aeration and cycle length with DO for intermittent aeration, for each test period, is shown in Table 1.

2.3. Synthetic Wastewater

The simulated synthetic wastewater was prepared fresh every two-days by using tap water. According to the calculated stoichiometry mass balance, by adding the appropriate amount of ammonium chloride (NH4Cl) and sodium bicarbonate (NaHCO3), the concentrations of ammonium-nitrogen (NH4-N) and alkalinity as CaCO3 were kept at 140 mg/L and 500–1100 mg/L, respectively. In addition, vitamins, and minerals solutions with a concentration of 1 ml/L of each were added in the synthetic wastewater as micronutrients. The composition of vitamins and minerals (Table 2) was the same as adopted by Dinamarca and Bakke [19]. During feed preparation, as well as while feeding the reactor, the whole mixture was always placed on the magnetic stirrer (Stuart UC151 magnetic stirrer) for the homogeneity of the solution.

2.4. Wastewater Constituients Analysis

The wastewater samples from the inlet and outlet of the reactor were taken on a daily basis, except on a few occasions where samples were taken in a one-day gap. The samples (two of each from inlet and outlet in parallel) were analysed for the nitrogen compounds (i.e., ammonium (NH4-N), nitrite (NO2-N), nitrate (NO3-N), alkalinity analysis, and pH measurement, whereas onsite measurements, such as DO, and temperature, were measured every day during the experimental period. For all samples, the bio-chemical analysis was done using a cell test (test kit) method and the measurements were done by the Spectroquant® Pharo 300 UV/VIS photometer (Merck KGaA, Darmstadt, Germany). The cell test method is analogous to the US standard method of numbers 114,559, 100,609, 114,563 and 101,758 for the NH4-N, NO2-N, NO3-N, and alkalinity as CaCO3 analysis, respectively [20]. The temperature and dissolved oxygen (DO) of the reactor were measured by WTW Oxi 3310 (Weilheim, Germany). In addition, The Beckman 390 pH meter was used to measure the pH of the samples.
The concentrations of nitrogen compounds in the synthetic wastewater obtained from laboratory analysis were quantified in terms of the surface ammonium loading rate (SALR), nitrate production rate (NPR), nitrite accumulation rate (NAR), ammonium removal efficiency (ARE), and was calculated by using Equations (3)–(6). Moreover, the hydraulic retention time (HRT) was calculated by using Equation (7).
SALR   [ gN m 2 d ] = C N H 4 N , i n × Q A c a r r i e r × 1000  
N P R [ % ] = ( C N O 3 N , o u t C N O 3 N , i n ) ( C N H 4 N , i n C N H 4 N , o u t ) × 100  
N A R [ % ] = ( C N O 2 N , o u t C N O 2 N , i n ) ( C N H 4 N , i n C N H 4 N , o u t ) × 100  
ARE [ % ] = ( C N H 4 N , i n C N H 4 N , o u t ) C N H 4 N , i n × 100  
HRT = V Q  
where, CNH4-N,in = Inlet ammonium concentration [mg/L] or total ammonium nitrogen (TAN)
CNH4-N,out = Outlet ammonium concentration [mg/L]
Acarrier = Total surface area of carrier [m2] = Protected surface area of carrier [m2/m3] × total volume of carrier [m3]
CNO3-N,in = Inlet nitrate concentration [mg/L]
CNO3-N,out= Outlet nitrate concentration [mg/L]
CNO2-N,in= Inlet nitrite concentration [mg/L]
CNO2-N,out = Outlet nitrite concentration [mg/L]
Q = Water flow rate [L/d]
V = Effective water volume inside the reactor [L]
The operating conditions such as dissolved oxygen (DO) concentration expressed as the ratio of DO and total ammonium nitrogen (TAN), surface ammonia loading rate (SALR), and aeration strategy were applied based on two requirements of partial nitritation: (i) around 50% of ammonia removal efficiency (ARE), and (ii) almost none (i.e., 0%) nitrate production rate (NPR) or 100% nitrite accumulation rate (NAR). From now onwards, these requirements are mentioned as first and second requirement, respectively.

2.5. Data Analysis

The data generated from the biochemical analysis and onsite measurement were processed in Microsoft Excel for data visualization, mass balance analysis and standard plotting. The mean of each biochemical and physical parameter measurements over time were used for the statistical comparisons.

3. Results and Discussion

3.1. Synthetic Medium Concentration and Operating Conditions

The influent ammonium concentration (≈140 mg/L) was chosen based on the two major factors, which are essential for the anammox start-up: (i) the FA concentration should be between 1 and 10 mg/L for the NOB suppression and to promote AOB and anammox simultaneously [21], and (ii) the accumulated nitrite concentration should be between 40–60 mg/L [22]. Reactor temperature and pH were maintained around 30 °C and 7.8, respectively, during the experimental period, which had created a conductive environment for anammox growth [23]. The temperature and pH resulted in FA less than 10 mg/L, and the partial nitritation yielding below 60 mg/L nitrite concentration. In addition, the alkalinity provided was sufficient to compensate for the hydrogen ions produced by partial nitritation. Stoichiometrically, 2.0 mole of alkalinity (as HCO3) is required to maintain a stable pH for 1.0 moles of NH4-N oxidation (Equation (1)), which is equivalent to 7.14 g alkalinity as CaCO3 required for 1 g of NH4-N oxidation.

3.2. Nitrogen Compounds Transformations in Different SALR under Continuous Aeration

The transformation of influent ammonium to nitrite and nitrate, along with their accumulation rate under the continuous aeration experimental period, is shown in Figure 4. During this period the reactor was subjected to a low influent flow rate of 3.3 L/d from the start to day 21, which resulted in HRT and SALR of 2.42 d and 0.14 ± 0.1 gN/m2·d, respectively. Up to day 10, when the reactor’s DO/TAN ratio was greater than 0.025, there was close to 90% ARE, resulting in a 10 mg/L ammonium concentration in the outlet. NPR was initially lower during this period, but it steadily climbed over time. NAR, on the other hand, was on the rise, reaching a peak value of nearly 90% on day 7, resulting in an NO2-N outlet concentration of 115 mg/L, before it began to fall (Figure 4b). The observed higher accumulation of nitrite than nitrate in this period was due to the faster recovery time of AOB [13]. The biomass on the old carriers was under critical starvation of substrate while being transferred from KRA to the lab reactor; when it has got substrate from synthetic wastewater, the AOB populations were more active than NOB. Moreover, the nitrogen mass balance analysis showed that, on day 3, there was a significant quantity of nitrogen gas production, which was due to the activity of heterotrophic bacteria present in the old bio carrier with a COD source from endogenous decay [24]. However, later in the experimental period, the activity of heterotrophic bacterial biomasses diminished due to the lack of COD source in the synthetic wastewater. Here, the nitrogen mass balance only considered the inlet and outlet’s NH4-N, NO2-N, and NO3-N, but in fact, additional compounds such as nitric oxide (NO) and nitrous oxide (N2O) were also assessed. Therefore, there was negative nitrogen gas production observed from the mass balance analysis on some days. Thus, in this experimental period, the DO/TAN value higher than 0.025 did not meet the first requirement of partial nitritation. Hence, the aeration rate was further decreased in the subsequent test.
From day 10 to day 15, the DO/TAN ratio was gradually reduced to 0.005 and applied steady until day 21. As the DO/TAN declined, ARE decreased substantially as well, eventually stabilizing at 65%, which was a promising value in terms of the first requirement of partial nitritation (i.e., around 50% ARE) when the DO/TAN became stable. Despite the decrement in the DO/TAN ratio, the NPR was continuously increased and reached a peak value of 88% on day 15, resulting in 85 mg/L NO3-N in the outlet (Figure 4b). On the other hand, the NAR was significantly decreased and became close to 15%. However, afterwards, the NPR and NAR trends were altered, i.e., a decrease in NPR and an increase in NAR, but did not reach the second requirement of partial nitritation (i.e., almost 0% NPR or 100% NAR). Therefore, on a subsequent test, the SALR was increased to 0.27 ± 0.005 gN/m2·d from day 21 by increasing the influent flow rate to 6.5 L/d, which had decreased the HRT by half to 1.2 d.
When the SALR was increased, while the DO/TAN ratio was kept similar, ARE dropped significantly from 65% to 27%. This shows that, for low HRT to attain the same ARE as in high HRT, a large amount of DO/TAN is required, which signifies that the DO/TAN and HRT had an inverse relation to achieve same ARE. Hence, the DO/TAN was increased to bring the reactor NH4-N accumulation close to the first requirement of partial nitritation. As the DO/TAN ratio was increased starting from 0.005 on day 30, ARE was also increased and became around 48% when DO/TAN was around 0.015 on day 34 (Figure 4c). At these operating conditions, the reactor was behaving promising in terms of the first requirement of partial nitritation, but the NPR and NAR was 65% and 24%, respectively. This resulted in 56 mg/L of NO3-N and 20 mg/L NO2-N accumulation in the reactor, which was far from the second requirement of partial nitritation. Therefore, the DO/TAN was decreased and was maintained stable with a value around 0.005 from day 38.
ARE followed the same trends as DO/TAN and became closely stable with an average value of 44.7%, which was close to the first requirement. However, the average value of NPR and NAR was far from the second requirement, which was around 72% and 32%, respectively. As a result, the average NO3-N production and NO2-N accumulation were 45.6 mg/L and 18.7 mg/L, which was an insufficient substrate for the anammox process while it promoted NOB activity.
Shortly, continuous aeration and up to SALR of 0.27 ± 0.005 gN/m2·d did not create PN conditions, despite that the reactor was operated with different DO/TAN ratio ranging from 0.005–0.04. Even with a far lower value than 0.25 for NOB suppression, as reported by Bartrolí et al. [25], the NPR was higher than NAR. The same result was observed by Schopf et al. [10] in the MBBR reactor with 0.11 DO/TAN and up to SALR of 6.5 gN/m2·d. The failure in achieving partial nitritation was due to small biofilm thickness, which had resulted in the sufficient diffusion of the oxygen in the inner part of the biofilm where NOB lies, even though the DO/TAN ratio was extremely low. Similarly, Choi et al. [26] did not observe partial nitritation due to the growth of Nitrospira spp. when the SALR was below 2.16 kg N/m3·d. The Nitrospira spp. are the k-strategists type NOB bacteria, whose growth is favorable in the wastewater having low ammonium concentration and below 2 mg/L DO [26,27]. Therefore, we conclude that the failure to achieve partial nitritation could be due to either low biofilm thickness or due to the dominant Nitrospira spp., or a combination of both. Furthermore, During the whole time of the continuous aeration, the average free ammonia concentration was 6.59 ± 3.5 mg/L, which was higher than the inhibition range of NOB; however, this high concentration of FA also couldn’t suppress NOB because they became adapted and resilient to FA inhibition as time went on [28].
In our observation, the high SALR of 0.27 ± 0.005 gN/m2·d was a bit closer to partial nitritation as NPR was lower, and NAR was higher than low SALR of 0.14 ± 0.1 gN/m2·d under 0.0053 DO/TAN ratio (Figure 5). Hence, the highest degree in SALR could give complete partial nitritation because it mitigated both possible reasons for NOB activity: (i) lower thickness of biofilm and (ii) growth of Nitrospira spp. However, the SALR was not increased over 0.27 ± 0.005 gN/m2·d, because increasing SALR requires increasing either the influent flow rate or the influent ammonium concentrations. Both factors contribute to a poor anammox start-up environment since a flow rate greater than 6.5 L/d leads to significantly lower HRT than what was found by Klaus et al. [29], who reported 33 h HRT for a successful anammox start-up, and increasing ammonium concentration increases free ammonia levels to greater than 10 mg/L. Moreover, low HRT facilitates washout of microorganisms, especially the anammox microorganisms that need time for extracellular polymeric substances (EPS) production for stable biofilm formation and aggregation [30]. Hence, to avoid both strategies in the subsequent test, the aeration strategy was changed from continuous to intermittent.

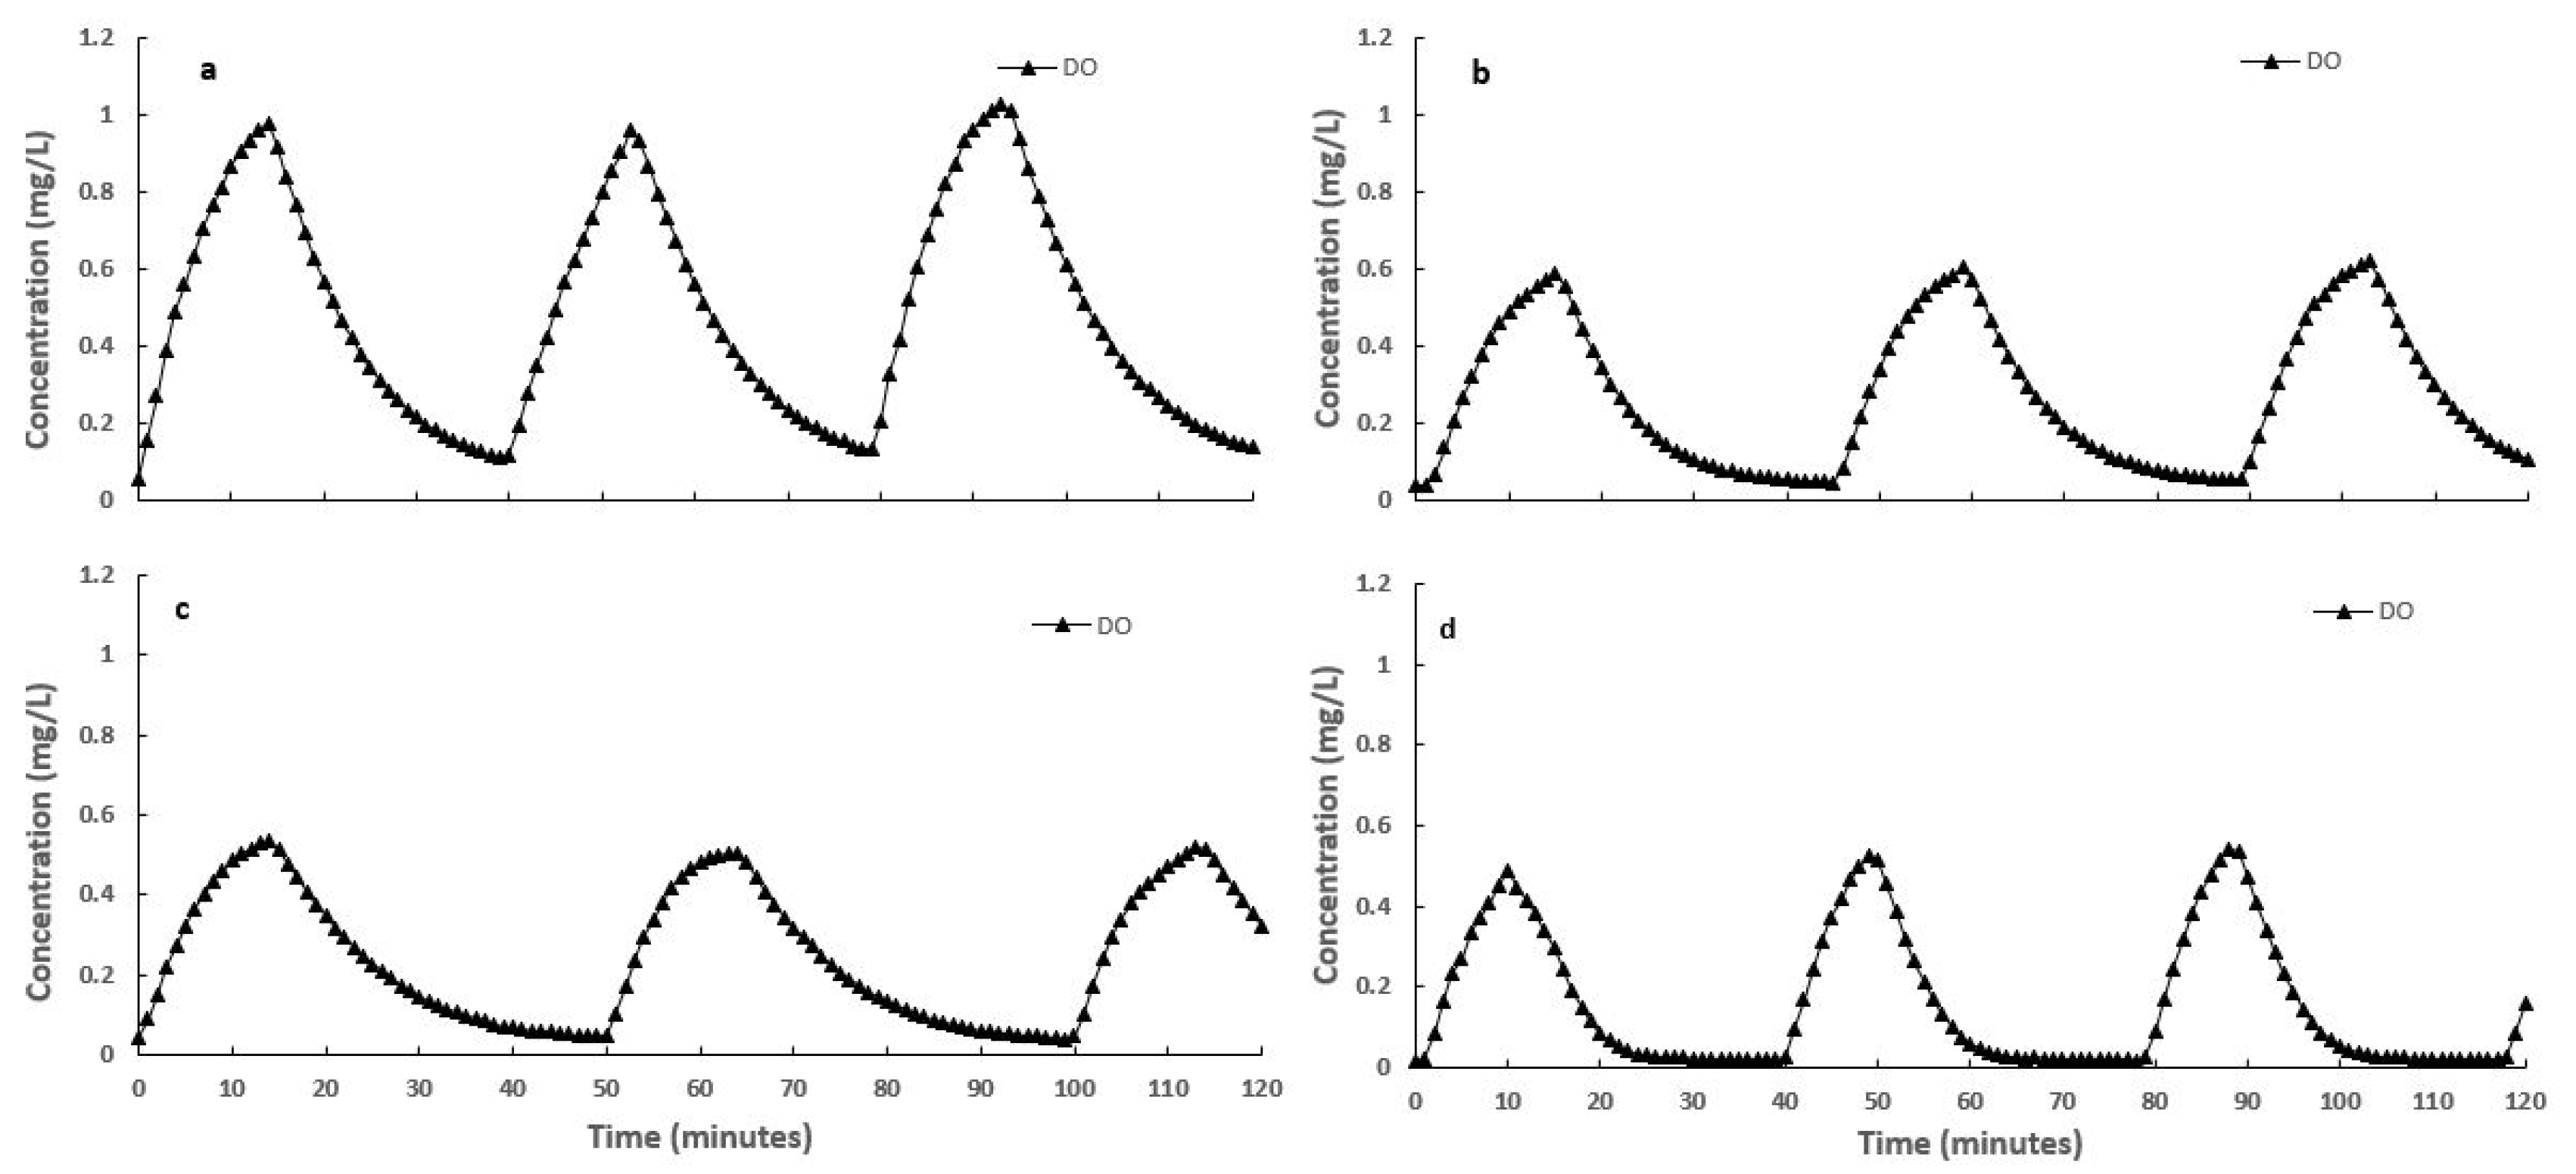
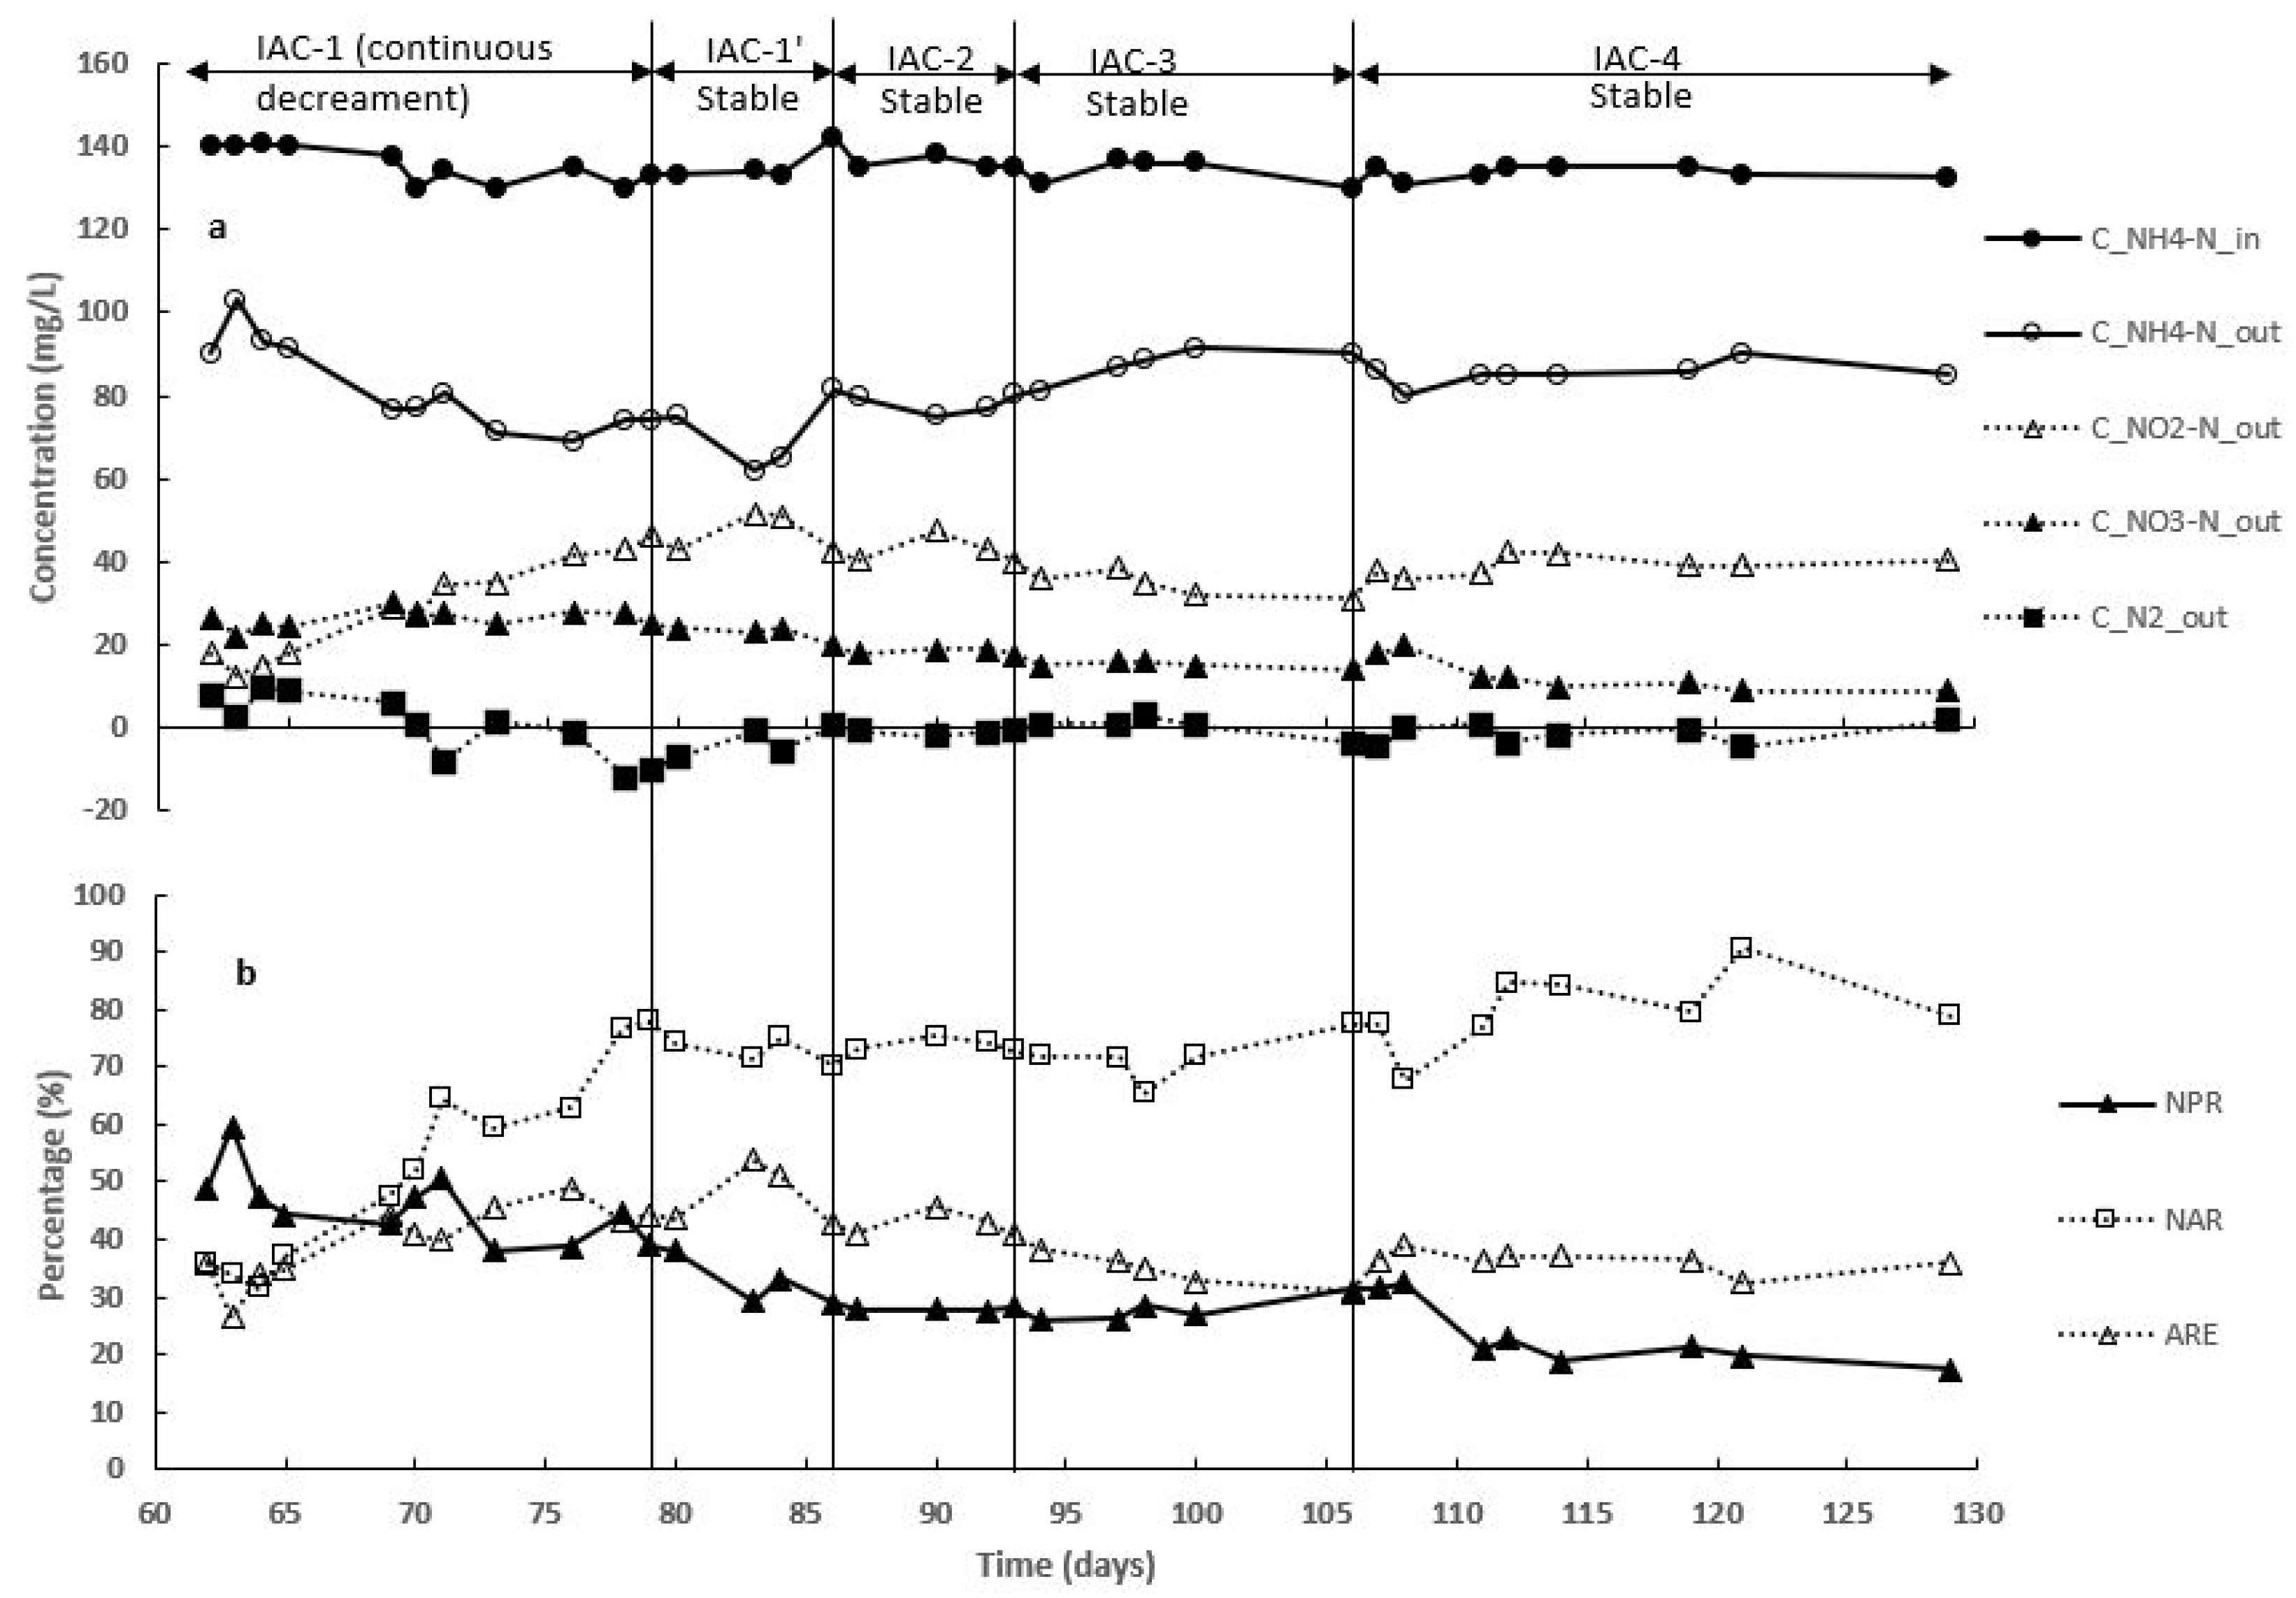
3.3. Effect of Intermittent Aeration Cycle on Nitrogen Compounds Transformation

When the SALR was 0.27 gN/m2·d under continuous aeration, the reactor had roughly 50% ARE at 0.0056 DO/TAN, equivalent to 0.78 mg/L DO. Hence, it was decided to use an intermittent aeration cycle with 0.8–1 mg/L DO in the aerobic phase and roughly 0.1 mg/L DO in the anaerobic phase. The reactor was tested with a variety of intermittent aeration cycle (IAC) lengths and aeration rates, and the desired profile was eventually achieved with the cycle length of 15 min ON and 25 min OFF (IAC-1) (Figure 6a) and applied in the reactor from day 59. Figure 7 shows the transformation of influent ammonium into nitrite and nitrate under different set of intermittent aeration cycle. ARE began to fall when the intermittent aeration cycle was first introduced, reaching 26% on day 63, due to the biofilm’s inability to quickly acclimate to the new environment [8]. ARE was steadily increased by consuming DO from the bulk liquid, reaching 44% on day 79, the same as before the intermittent aeration cycle was introduced. As a result, the DO concentration in the intermittent aeration cycle fell and became 0.5 mg/L and 0.075 mg/L in aerated and non-aerated phases (IAC-1′), respectively. The NO3-N in the outlet was stable at 26 mg/L on that period, signifying that the consumed ammonium over the time was accumulated as NO2-N, reaching 46 mg/L on day 79, which indicates the partial nitritation. As a result, NAR crossed over the NPR value on day 69 and reached 78% on day 79. After that day, when IAC-1 was stabilized, IAC-1′, ARE and NAR were also stable; however, the NPR kept on decreasing. As a result, the NO3-N in the outlet began to fall and reached 20 mg/L on day 86, indicating that the NOB was inhibited even more than before. This operating condition resulted in a promising ARE; however, the NPR and NAR value was not close to the second requirement (i.e., almost 0% NPR or 100% NAR). Hence, in the subsequent test, the cycle length of the intermittent aeration cycle was changed.
The non-aerated length in the IAC-1 was extended by 5 min to make an intermittent aeration cycle length of 15 min ON and 30 min OFF with DO concentration around 0.1 mg/L higher than IAC-1′ in the aerobic phase, which was IAC-2 (Figure 6b) and applied from day 85. No significant change in nitrogen compound transformation was observed with this intermittent aeration cycle. This was due to the increased anoxic time that was balanced by the higher DO in the aerobic phase. Hence, another intermittent aeration cycle IAC-3 was applied from day 93, which had the non-aerated cycle length 10 min higher than IAC-1 and with the same aerated phase DO as in IAC-1′ (Figure 6c). As soon as this intermittent aeration cycle was applied, ARE started to fall sharply to reach 30% on day 106, lower than the first requirement of partial nitritation. The decrement in ARE had a greater effect on the AOB than NOB as NO2-N in the outlet was sharply decreased compared to NO3-N, even though both the NPR and NAR profile was steady. This was attributed to the intermittent aeration cycle’s longer anoxic period than IAC-1, which did not encourage AOB activity.
Hence, in a subsequent test, another intermittent aeration cycle was applied. The DO profile of the intermittent aeration cycle IAC-4 is depicted in the Figure 6d. The cycle length of this intermittent aeration cycle was chosen based on the cycle length of IAC-2. The time extension in the anoxic phase in IAC-2 to make IAC-3 resulted in the ARE lower than the requirement for partial nitritation, and 15 min ON time did not suppress NOB as required by the second requirement. Hence, the cycle length of 10 min ON/30 min OFF was obtained by maintaining the same anoxic time and aerobic time was shorted by 5 min. When this cycle was applied, ARE starts to rise slowly, resulting in an average ARE of 37%. The NPR was gradually decreasing, whereas NAR shows the increasing trends, reaching 17% and 78%, respectively, on day 129. The outlet NO3-N and NO2-N, on the other hand, had a concentration of 9 mg/L and 40.5 mg/L, respectively. In terms of partial nitritation, the above-mentioned conversion rate and concentrations look promising. On top of that, more suppression of NOB, in this case, was due to the shorter aerated length of the intermittent aeration cycle (Table 1), which gave less chance for activity of NOB after starvation.
However, a study carried out by Zhou et al. [8] in sequential batch reactor (SBR) with synthetic wastewater has successfully suppressed NOB using an intermittent aeration cycle having lengths of 20 min ON and 20 min OFF with 0.5 mg/L DO in the aerated phase. Moreover, Kanders et al. [31] achieved partial nitritation by suppressing NOB bacteria with a cycle length of 45 min ON and 15 min OFF in MBBR (but DO was not reported), which was fed with reject water. Therefore, no specific optimum aerobic/anoxic length exists to suppress NOB and depends upon several factors, such as reactor configuration, type of wastewater and ammonium concentration in influent, and the proportion of the AOB/NOB biofilm on the biocarriers.

4. Conclusions

In the anammox start-up environment within this study condition, the combination of low DO obtained from continuous aeration and high free ammonia could not give partial nitritation up to SALR of 0.27 ± 0.005 gN/m2·d, as NPR was always higher than NAR. This result can be attributed to either growth of Nirospira spp., or low biofilm growth and thickness, or a combination of both. Increasing SALR to a high level, on the other hand, may result in partial nitritation but cannot be prolonged to one stage PNA due to the inadequate environment for anammox start-up. As a result, the aeration technique was altered to an intermittent aeration, and four different intermittent aeration cycles (IAC-1, IAC-2, IAC-3, IAC-4) were investigated. The intermittent aeration cycle having relatively shorter aeration length (i.e., 10 min) in the aerobic phase and 30 min in the non-aerated phase (i.e., the test condition IAC-4) has resulted in successful partial nitritation because of less time available for NOB activation after starvation. However, the optimum length of aerobic/anoxic in intermittent aeration cycle can be different to different conditions. Therefore, a novel set of aerobic/anoxic lengths is required and can be achieved by the real time observation of the transformation of nitrogen compounds.

Author Contributions

Writing—original draft, S.P.; Writing—review and editing, S.P., E.J. and S.W.; Methodology, S.P., E.J. and S.W.; Data curation, S.P.; Conceptualization, S.P.; Funding acquisition, S.W. and E.J.; Supervision E.J. and S.W. All authors have read and agreed to the published version of the manuscript.

Funding

The research project “Efficient upgrading of municipal wastewater treatment plants (Project No: 269014)” was funded by the Research Council of Norway’s “Oslofjordfondet”. The APC was funded by the University of South-Eastern Norway.

Data Availability Statement

The related biochemical data from the laboratory analysis and their calculations can be found in the Dropbox link: https://www.drobox.com/scl/fi/3bve2hj1ek4uz0ctz8zq1/Data-and-calcultions.xlsx?dl=0&rlkey=cmb9wk8hxjqszw8w7fjjayiy5 (accessed on 25 November 2021).

Conflicts of Interest

The authors declare no conflict of interest.

References

  1. Ahn, Y.-H. Sustainable nitrogen elimination biotechnologies: A review. Process Biochem. 2006, 41, 1709–1721. [Google Scholar] [CrossRef]
  2. Van Hulle, S.W.; Vandeweyer, H.J.; Meesschaert, B.D.; Vanrolleghem, P.A.; Dejans, P.; Dumoulin, A. Engineering aspect and practical application of autotrophic nitrogen removal from nitrogen rich stream. Chem. Eng. J. 2010, 162, 1–20. [Google Scholar] [CrossRef]
  3. Qiu, S.; Li, Z.; Hu, Y.; Shi, L.; Liu, R.; Shi, L.; Chen, L.; Zhan, X. What’s the best way to achieve successful mainstream partial nitritation-anammox application? Crit. Rev. Environ. Sci. Technol. 2020, 51, 1–33. [Google Scholar] [CrossRef]
  4. Cao, Y.; van Loosdrecht, M.C.M.; Daigger, G.T. Mainstream partial nitritation–anammox in municipal wastewater treatment: Status, bottlenecks, and further studies. Appl. Microbiol. Biotechnol. 2017, 101, 1365–1383. [Google Scholar] [CrossRef]
  5. Jetten, M.S.M.; Horn, S.J.; van Loosdrecht, M.C.M. Towards a more sustainable municipal wastewater treatment system. Sustain. Sanit. 1997, 35, 171–180. [Google Scholar] [CrossRef]
  6. Qian, W.; Peng, Y.; Li, X.; Zhang, Q.; Ma, B. The inhibitory effects of free ammonia on ammonia oxidizing bacteria and nitrite oxidizing bacteria under anaerobic condition. Bioresour. Technol. 2017, 243, 1247–1250. [Google Scholar] [CrossRef]
  7. Wiesmann, U. Biological nitrogen removal from wastewater. Adv. Biochem. Eng. Biotechnol. 1994, 51, 113–154. [Google Scholar]
  8. Zhou, Z.; Qi, M.; Wang, H. Achieving Partial Nitrification via Intermittent Aeration in SBR and Short-Term Effects of Different C/N Ratios on Reactor Performance and Microbial Community Structure. Water 2020, 12, 3485. [Google Scholar] [CrossRef]
  9. Xu, G. Partial nitrification adjusted by hydroxylamine in aerobic granules under high DO and ambient temperature and subsequent Anammox for low C/N wastewater treatment. Chem. Eng. J. 2012, 8, 338–345. [Google Scholar] [CrossRef]
  10. Schopf, A.; Delatolla, R.; Kirkwood, K.M. Partial nitritation at elevated loading rates: Design curves and biofilm characteristics. Bioprocess Biosyst. Eng. 2019, 42, 1809–1818. [Google Scholar] [CrossRef]
  11. Anthonisen, A.C.; Loehr, R.C.; Prakasam, T.B.; Srinath, E.G. Inhibition of Nitrification by Ammonia and Nitrous Acid. J. Water Pollut. Control Fed. 1976, 48, 835–852. [Google Scholar]
  12. Ma, B.; Wang, S.; Cao, S.; Miao, Y.; Jia, F.; Du, R.; Peng, Y. Biological nitrogen removal from sewage via anammox: Recent advances. Bioresour. Technol. 2016, 200, 981–990. [Google Scholar] [CrossRef] [PubMed]
  13. Li, J.; Elliott, D.; Nielsen, M.; Healy, M.G.; Zhan, X. Long-term partial nitrification in an intermittently aerated sequencing batch reactor (SBR) treating ammonium-rich wastewater under controlled oxygen-limited conditions. Biochem. Eng. J. 2011, 55, 215–222. [Google Scholar] [CrossRef]
  14. Kostera, J.; Youngblut, M.D.; Slosarczyk, J.M.; Pacheco, A.A. Kinetic and product distribution analysis of NO* reductase activity in Nitrosomonas europaea hydroxylamine oxidoreductase. J. Biol. Inorg. Chem. 2008, 13, 1073–1083. [Google Scholar] [CrossRef]
  15. Kampschreur, M.J.; Tan, N.C.G.; Kleerebezem, R.; Picioreanu, C.; Jetten, M.S.M.; Loosdrecht, M.C.M. van Effect of Dynamic Process Conditions on Nitrogen Oxides Emission from a Nitrifying Culture. Environ. Sci. Technol. 2008, 42, 429–435. [Google Scholar] [CrossRef]
  16. Bakke, R. High Tech Process in Combination with Natural Systems. Msc Lecture Presentation; University of South-Eastern Norway: Notodden, Norway, 2018. [Google Scholar]
  17. Eilersen, A.M.; Henze, M.; Kløft, L. Effect of volatile fatty acids and trimethylamine on nitrification in activated sludge. Water Res. 1994, 28, 1329–1336. [Google Scholar] [CrossRef]
  18. Peng, Y.; Song, X.; Peng, C.; Li, J.; Chen, Y. Biological nitrogen removal in SBR bypassing nitrate generation accomplished by chlorination and aeration time control. Water Sci. Technol. J. Int. Assoc. Water Pollut. Res. 2004, 49, 295–300. [Google Scholar] [CrossRef]
  19. Dinamarca, C.; Bakke, R. Apparent hydrogen consumption in acid reactors: Observations and implications. Water Sci. Technol. J. Int. Assoc. Water Pollut. Res. 2009, 59, 1441–1447. [Google Scholar] [CrossRef] [PubMed]
  20. American Public Health Association; Eaton, A.D.; American Water Works Association; Water Environment Federation. Standard Methods for the Examination of Water and Wastewater; APHA-AWWA-WEF: Washington, DC, USA, 2005; ISBN 978-0-87553-047-5. [Google Scholar]
  21. Dimitrova, I.; Dabrowska, A.; Ekström, S. Start-up of a full-scale partial nitritation-anammox MBBR without inoculum at Klagshamn WWTP. Water Sci. Technol. 2020, 81, 2033–2042. [Google Scholar] [CrossRef]
  22. Kanders, L.; Ling, D.; Nehrenheim, E. Rapid start-up of one-stage deammonification MBBR without addition of external inoculum. Water Sci. Technol. 2016, 74, 2541–2550. [Google Scholar] [CrossRef] [PubMed]
  23. Yang, Y.; Zuo, J.; Shen, P.; Gu, X. Influence of temperature, pH value and organic substance on activity of ANAMMOX sludge. Huan Jing Ke Xue Huanjing Kexue 2006, 27, 691–695. [Google Scholar]
  24. Yumpu.com. Nitrification & Denitrification—The Water Planet Company. Available online: https://www.yumpu.com/en/document/view/11509528/nitrification-denitrification-the-water-planet-company (accessed on 15 September 2021).
  25. Bartrolí, A.; Pérez, J.; Carrera, J. Applying Ratio Control in a Continuous Granular Reactor to Achieve Full Nitritation under Stable Operating Conditions. Environ. Sci. Technol. 2010, 44, 8930–8935. [Google Scholar] [CrossRef]
  26. Choi, M.; Cho, K.; Jeong, D.; Chung, Y.-C.; Park, J.; Lee, S.; Bae, H. Effects of the ammonium loading rate on nitrite-oxidizing activity during nitrification at a high dose of inorganic carbon. J. Environ. Sci. Health Part A 2018, 53, 708–717. [Google Scholar] [CrossRef] [PubMed]
  27. Wu, J.; He, C.; van Loosdrecht, M.C.M.; Pérez, J. Selection of ammonium oxidizing bacteria (AOB) over nitrite oxidizing bacteria (NOB) based on conversion rates. Chem. Eng. J. 2016, 304, 953–961. [Google Scholar] [CrossRef]
  28. Duan, H.; Ye, L.; Lu, X.; Yuan, Z. Overcoming Nitrite Oxidizing Bacteria Adaptation through Alternating Sludge Treatment with Free Nitrous Acid and Free Ammonia. Environ. Sci. Technol. 2019, 53, 1937–1946. [Google Scholar] [CrossRef]
  29. Klaus, S.; Baumler, R.; Rutherford, B.; Thesing, G.; Zhao, H.; Bott, C. Startup of a Partial Nitritation-Anammox MBBR and the Implementation of pH-Based Aeration Control. Water Environ. Res. 2017, 89, 500–508. [Google Scholar] [CrossRef]
  30. Jia, F.; Yang, Q.; Liu, X.; Li, X.; Li, B.; Zhang, L.; Peng, Y. Stratification of Extracellular Polymeric Substances (EPS) for Aggregated Anammox Microorganisms. Environ. Sci. Technol. 2017, 51, 3260–3268. [Google Scholar] [CrossRef]
  31. Kanders, L.; Areskoug, T.; Schneider, Y.; Ling, D.; Punzi, M.; Beier, M. Impact of seeding on the start-up of one-stage deammonification MBBRs. Environ. Technol. 2014, 35, 2767–2773. [Google Scholar] [CrossRef]
Figure 1. Simultaneous partial nitritation and anammox process in the biofilm: (a) figure of biocarrier along with biofilm; (b) different biochemical process in different layer of biofilm [3].
Water 14 00229 g001
Figure 2. DO profile in the intermittent aeration cycle adopted and modified from Bakke, R [16].
Water 14 00229 g002
Figure 3. A schematic diagram of the experimental setup of MBBR reactor.
Water 14 00229 g003
Figure 4. Nitrogen compounds transformation under continuous aeration: (a) inlet and outlet nitrogen compounds variations; (b) Production and removal percentage of nitrogen compounds; (c) DO/TAN ratio as an operating parameter.
Water 14 00229 g004
Figure 5. Effect of SALR on nitrogen compounds transformations under same DO/TAN ratio. Error bars are the standard deviations calculated from six samples.
Water 14 00229 g005
Figure 6. Different intermittent aeration cycle with DO profile: (a) Intermittent aeration cycle with cycle length 15 min ON/25 min OFF (IAC-1); (b) Intermittent aeration cycle with cycle length 15 min ON/30 min OFF (IAC-2); (c) Intermittent aeration cycle with cycle length 15 min ON/35 min OFF (IAC-3); (d) Intermittent aeration cycle with cycle length 10 min ON/30 min OFF (IAC-4).
Water 14 00229 g006
Figure 7. Nitrogen compounds transformation under intermittent aeration: (a) Nitrogen compounds variations; (b) Nitrogen compounds accumulation and removal efficiency.
Water 14 00229 g007
Table 1. Details of different operating conditions.
Continuous Aeration
S.N.Flow Rate (L/d)HRT (d)SALR (gN/m2·d)Duration
13.32.40.14 ± 0.1Day1–day 21
26.51.20.27 ± 0.005Day 21–day 59
Intermittent Aeration
TestCycle Length (min)ON/OFF or Aerated/Non-Aerated Time (min/min)Aerated/Non aerated DO (mg/L)HRT
(d)
Duration
IAC-14015/251/0.11.2Day 59–day 79
IAC-24515/300.6/0.051.2Day 86–day 93
IAC-35015/350.5/0.051.2Day 93–day 106
IAC-44010/300.5/0.0251.2Day 106–day 129
Table 2. The composition of vitamins and minerals solutions in the synthetic wastewater.
Vitamin Composition(g/L)Mineral Composition(g/L)
Thioctic acid
p-aminobenzoic acid
Pantothentic acid
Vitamin B12
Thiamine
Nicotinic acid
Riboflavin
Pyridoxine hydrochloride
Folic acid
Biotin
0.05
0.05
0.05
0.001
0.05
0.05
0.05
0.1
0.02
0.02
CuSO4·5H2O
MnSO4·H2O
FeSO4·7H2O
NiCl2·6H2O
ZnSO4·7H2O
CoCl2·6H2O
H3BO3
0.055
0.04
2.7
0.1
0.088
0.05
0.05
Publisher’s Note: MDPI stays neutral with regard to jurisdictional claims in published maps and institutional affiliations.

