Article

Key Factors for Activated Carbon Adsorption of Pharmaceutical Compounds from Wastewaters: A Multivariate Modelling Approach

1
Water Quality and Treatment Laboratory, Urban Water Unit, Hydraulics and Environment Department, LNEC—National Laboratory for Civil Engineering, Av. Brasil 101, 1700-066 Lisboa, Portugal
2
Centro de Química Estrutural, Institute of Molecular Sciences, Faculdade de Ciências, Universidade de Lisboa, 1749-016 Lisboa, Portugal
3
BioISI—Biosystems & Integrative Sciences Institute, Faculdade de Ciências, Universidade de Lisboa, 1749-016 Lisboa, Portugal
*
Authors to whom correspondence should be addressed.
Water 2022, 14(2), 166; https://doi.org/10.3390/w14020166
Submission received: 8 November 2021 / Revised: 21 December 2021 / Accepted: 3 January 2022 / Published: 8 January 2022
(This article belongs to the Special Issue Advanced Technologies for Water Reclamation and Reuse)

Abstract

:
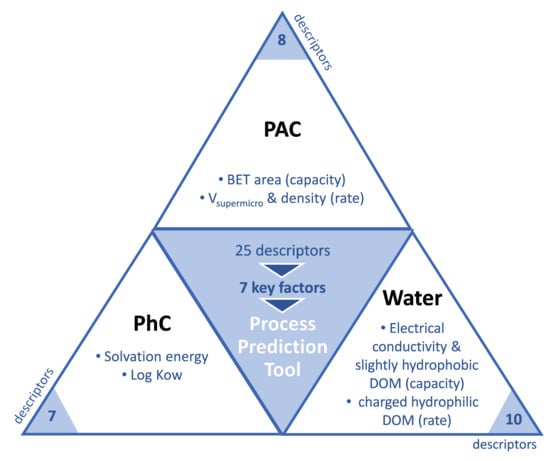
Projection to Latent Structures (PLS) regression, a generalization of multiple linear regression, is used to model two datasets (40 observed data points each) of adsorption removal of three pharmaceutical compounds (PhCs), of different therapeutic classes and physical–chemical properties (carbamazepine, diclofenac, and sulfamethoxazole), from six real secondary effluents collected from wastewater treatment plants onto different powdered activated carbons (PACs). For the PLS regression, 25 descriptors were considered: 7 descriptors related to the PhCs properties, 10 descriptors related to the wastewaters properties (8 related to the organic matrix and 2 to the inorganic matrix), and 8 descriptors related to the PACs properties. This modelling approach showed good descriptive capability, showing that hydrophobic PhC-PAC interactions play the major role in the adsorption process, with the solvation energy and log Kow being the most suitable descriptors. The results also stress the importance of the competition effects of water dissolved organic matter (DOM), namely of its slightly hydrophobic compounds impacting the adsorption capacity or its charged hydrophilic compounds impacting the short-term adsorption, while the water inorganic matrix only appears to impact PAC adsorption capacity and not the short-term adsorption. For the pool of PACs tested, the results point to the BET area as a good descriptor of the PAC capacity, while the short-term adsorption kinetics appears to be better related to its supermicropore volume and density. The improvement in these PAC properties should be regarded as a way of refining their performance. The correlations obtained, involving the impact of water, PhC and PAC-related descriptors, show the existence of complex interactions that a univariate analysis is not sufficient to describe.

Graphical Abstract

1. Introduction

Water is a critical transport system for the dissemination of contaminants of emerging concern (CECs) into the environment. The European Union is aware of these problems as can be seen from the seven directives published in the last two decades, including pharmaceuticals from distinct therapeutic classes, pesticides and fungicides [1]. This issue is also being addressed by the US Environmental Protection Agency that, in 2009 and 2016, added hormones to the drinking water contaminant candidate list. Among the CECs, pharmaceutical compounds (PhCs) deserve special attention due to their biological activity even at trace level concentration and still unknown consequences for living organisms and the environment. In fact, the panoply of PhCs nowadays detected in wastewater and recipient water bodies is a challenge for wastewater treatment plants (WWTPs) that may need to improve their barriers against this class of organic compounds to comply with future legislation.
Powdered activated carbon (PAC)-based solutions are among the best available technologies due to the high adsorption capacity of these materials and their tuneable pore structure, surface chemistry and morphology. Adsorption onto PAC depends on the adsorbate, adsorbent and water organic and inorganic matrices. Background organics, typically occurring in concentrations of 3–6 orders of magnitude above the target contaminants, may compete for the adsorption sites. The water inorganic matrix may affect the extent and prevailing mechanisms of adsorbent–adsorbate interactions. Although there are numerous literature studies exploring the adsorption of PhCs onto commercial or lab-made activated carbons, the great majority of studies exploring the performance of lab-made materials only focus on spiked pure water, hindering the prediction of activated carbon’s performance in real operating environments, where the water matrix often plays a key role [2]. On the other hand, studies reporting data on real wastewater perform univariate analysis, focusing mostly on activated carbon’s properties [3,4,5] or microcontaminants’ properties [6]. When focusing on both domains, they are explored independently [7,8], and thus, combined effects are not assessed.
The complexity of the water matrices and the large range of physical–chemical properties and therapeutic classes of pharmaceuticals call for a deeper understanding of the key properties of activated carbons that ensure their best performance for the target PhCs. Some of the current challenges on PAC selection to address the problem of PhCs removal during wastewater treatment are: (i) the large number of PhC classes and properties lead to distinct interactions with PAC and water matrix; (ii) lack of information regarding PAC characterization with most studies only using the BET area and not considering the effect of pore structure or surface chemistry; (iii) most studies proposing novel activated carbon materials only test single-solute conditions in pure water; (iv) the low concentration level of PhCs in wastewater requests heavy analytical work; (v) wastewater can have very distinct properties; and (vi) mechanisms and properties ruling PhC adsorption onto PACs need deeper knowledge. A better comprehension of data addressing all the above-described challenges will contribute to optimising the adsorption performance.
The present work aims to shed some light on this complex challenge. Between 2016 and 2019 in the framework of the LIFE IMPETUS project (LIFE14 ENV/PT/000739) a valuable pool of data on adsorption of PhCs, spiked in WWTP effluent samples, onto PAC was gathered thus allowing an integrated analysis to deeper explore the PAC removal of PhCs from various wastewater matrices.
Projection to Latent Structures, also called Partial Least Squares, (PLS) regression is a developed generalization of multiple linear regression. PLS regression is of particular interest because, unlike multiple linear regression, it was designed to cope with small datasets and it can analyse data with many correlated and even incomplete variables in both X and Y [9]. PLS eliminates redundancies in the original data sets through linear combination and defines a new set of independent variables. PLS regression has proven to be a very versatile method for multivariate data analysis and the number of applications is steadily increasing in research fields, such as bioinformatics, machine learning, and chemometrics [10]. It has been recently applied to water and wastewater quality and treatment [11,12,13,14,15], and, namely, for modelling adsorption to activated carbon [16]. This latter study used a PLS modelling approach to identify the key preparation conditions and characteristics of own-prepared activated carbon adsorbents that enabled predicting their adsorption capacity towards three aromatic compounds. Nevertheless, a deeper multivariate quantitative analysis of the complex adsorption process, namely regarding the properties of the three players in the adsorbent–adsorbate–water matrix, is still lacking.
In the present study, PLS regression was used to model the adsorption data of three PhCs of different therapeutic classes and physical–chemical properties (carbamazepine, diclofenac, and sulfamethoxazole) from several real wastewaters onto different PACs. The PLS regression was conducted to correlate the adsorption removals obtained at 21 h and 1 h with properties related to the PhCs (physical–chemical and size-related properties), wastewaters (related to the background inorganic and organic matrices), and PACs (textural, surface, and physical properties). The removals at 21 h (long-term adsorption) allow appraising the factors mostly affecting the PAC adsorption capacity and correspond to the adsorption quasi-equilibrium, which can be achieved in processes such as tertiary wastewater treatment with PAC recycling after sedimentation/filtration, providing 30–60 min hydraulic residence time [17]; the removals at 1 h allow appraising mostly short-term adsorption kinetics-related factors and simulate typical contact times of PAC dosing processes without recycling, e.g., in dead-end hybrid PAC adsorption/low-pressure membrane processes.
The aim of this study was to identify, through the analysis of the regression coefficients of the models, key factors/parameters determining PhC removal from urban secondary effluent by adsorption and to infer the mechanisms involved as to drive the improvement in PAC performance in real environments. This work does not intend to exhaustively study the descriptors, rather to assess if and how they affect performance in the tight ranges in which they usually occur (well-performing PACs and urban wastewaters (secondary effluents) of similar composition), and to appraise if the modelling approach proposed could contribute to developing a tool of practical application in urban wastewater treatment.

2. Materials and Methods

2.1. Chemicals and Materials

Liquid chromatography-grade acetonitrile, methanol, and formic acid used in HPLC analyses were purchased from Chem-Lab (Zedelgem, Belgium). Reagent-grade methanol used for the solid-phase extraction method was from Merck (Germany). Carbamazepine (Sigma, St. Louis, MO, USA), diclofenac sodium salt (Alfa Aesar, Kandel, Germany), and sulfamethoxazole (Fluka/Sigma–Aldrich, St. Louis, MO, USA) were used for spiking waters and preparing standard solutions. PhC standard solutions for high-pressure liquid chromatography (HPLC) analysis were prepared in methanol 5%. Ultrapure water (18.2 MΩ cm) was produced using a MilliQ Plus System (Millipore, Molsheim, France). Glass microfiber membrane (0.7 µm, 47 mm diameter) were from Filtres Fioroni (Ingré, France) and polypropylene membrane (GH Polypro, 0.45 µm, 47 mm diameter) from Pall Corporation (Ann Arbor, MI, USA). OASIS, HLB (500 mg, 6 mL) cartridges, for solid-phase extraction, were from Waters (Wexford, Ireland). Amberlite XAD-4 and Amberlite IRA958 resins were from Alfa Aesar (Karlsruhe, Germany) and Supelite DAX-8 was from Supelco (Bellefonte, PA, USA).

2.2. Selection of the Target Pharmaceutical Compounds (PhCs)

The monitoring data of 18 PhCs (nine distinct therapeutic classes) in secondary effluents of two Portuguese WWTPs (Beirolas and Faro Northwest) between January 2016 and December 2018 [18] allowed identifying the most recalcitrant PhCs. Considering their distinct physical–chemical properties (see Table 1 and Table 2), namely charge at pH 7.4 and hydrophobic/hydrophilic character [19,20], carbamazepine (CBZ), diclofenac (DCF), and sulfamethoxazole (SMX), were selected as representative models of the recalcitrant PhCs.

2.3. Analytical Methods

2.3.1. Quantification of Pharmaceutical Compounds (PhCs)

The analysis of the PhCs required water sample clean-up and PhC extraction/concentration by solid-phase extraction (SPE) following a method adapted from Gaffney et al. [21]. They were subsequently analysed by liquid chromatography with a photodiode array detection (HPLC-PDA). The description of the extraction/concentration procedure and the chromatographic methods are given in Text S1.

2.3.2. Wastewaters Characterisation

Six grab samples of well-clarified (turbidity < 2 NTU, total suspended solids (TSS) < 4 mg/L) secondary effluents of two Portuguese WWTPs (collected after secondary (biological) treatment) were used in the adsorption assays. These real waters contained the dissolved organic and inorganic matrices of most real applications of PAC in WWTPs, i.e., directly added to the complete-mix biological reactor or downstream of the secondary treatment [1,18]. The water was preserved at 8 °C, being characterized and used in the adsorption assays within 24 h.
To characterise the inorganic matrix of the wastewater samples, pH and electrical conductivity (EC) were measured with a multiparametric potentiometer C863T (Consort, Brussels, Belgium), using standard methods of analysis [22]. Dissolved organic matter (DOM) concentration was measured as dissolved organic carbon (DOC) in filtered samples (0.45 µm polypropylene membrane prewashed with ultrapure water) by the UV/persulphate chemical oxidation method [23] using a TOC analyser (TOC Fusion from Teledyne Tekmar, Mason, OH, USA). DOM nature was characterized by rapid fractionation as very hydrophobic (vHB), slightly hydrophobic (sHB), charged hydrophilic (cHL) and neutral hydrophilic (nHL) organic acids, using Supelite DAX-8, Amberlite XAD-4 and IRA 958 resins, respectively, according to Chow et al. [24]. The UV-Vis absorbance of filtered water samples (as for DOC) was measured at 436 nm (A436) and at 254 nm (A254) (UV/Vis spectrophotometer Aqualog, from Horiba Scientific, Kyoto, Japan), and specific UV absorbance (SUVA) was computed as the ratio of A254 (in m−1) to DOC (in mg/L). A436 indicated the water colour, A254 the DOM aromaticity and C=C bonds and SUVA DOM nature (aromaticity).

2.3.3. PAC Characterisation

The main textural, surface and physical properties of the tested PACs were determined. The textural characterization was made through N2 adsorption at −196 °C with data acquired in a volumetric analyser from Micromeritics (ASAP 2010) using 70 mg of material previously degassed at 120 °C for 17 h under vacuum (pressure < 10−2 Pa). The adsorption data were used to determine apparent surface area and BET constant, total pore volume, mesopore volume (pores with widths between 2 nm and 50 nm), micropore volume (Vα total, pores with widths ≤ 2 nm), ultramicropore volume (Vα ultra, pores with widths ≤ 0.7 nm), and supermicropore volume (Vα super, pores with widths between 0.7 nm and 2 nm). Briefly, the apparent surface area (ABET) was estimated by the Brunauer–Emmett–Teller (BET) method, following the most recent recommendations [25,26,27] for the determination of this parameter in microporous solids. The total pore volume, Vtotal, was assessed using the Gurvich rule. The total micropore (Vα total), ultramicropore (Vα ultra), and supermicropore (Vα super) volumes were determined by applying the alfa-s method to the N2 adsorption data taking as reference the isotherm reported by Rodríguez-Reinoso et al. [28] and as described in more detail in [29].
The surface chemistry properties were assessed by the determination of the pH at the point of zero charge (pHPZC) following the reverse mass titration method according to the methodology described by Mestre et al. [30]. When the water pH is equal to PAC pHPZC, the material has a net neutral surface charge. For pH values lower/higher than the pHPZC, the surface of the carbon material has a net positive/negative charge. Regarding the physical properties, the apparent density of all the materials was determined according to the procedure described by Mestre et al. [29]. As a measure of the particle size of the PACs, the mass median diameter, D50, was considered. For commercial samples, D50 values provided by the suppliers were used. For the lab-made samples, D50 was computed by fitting the Rosin–Rammler particle size distribution model [31] to the weight percentages collected in sieves between 297 µm and 74 µm.

2.4. Batch Adsorption Tests

Batch adsorption experiments were conducted in several real wastewaters with a pool of PACs, selected by their expected good performance toward the adsorption of the three target PhCs (carbamazepine, diclofenac, and sulfamethoxazole), known recalcitrant compounds in wastewater treatment. To cancel the PhC and PAC concentration effects on the PhC adsorption removals, all experiments were carried out with equal initial concentrations of PhCs and PACs.
Prior to use, all carbons were dried at 105 °C overnight and stored in a desiccator. PhC stock solutions used to spike wastewater samples were prepared in ultrapure water to a concentration of 10 mg/L and stirred overnight. Just before the adsorption tests, 100 mL of PhC stock solutions were added to 10 L of the wastewater sample to achieve the target concentration of ~100 µg/L in each PhC. After 1 h stirring, 500 mL were collected for the adsorption tests.
The adsorption tests were run at room temperature (20 ± 1 °C), at stirring speed of 150 rpm, for 1 h and 21 h contact in jar testing apparatus (G. Vittadini and Aqualytic). One-liter glass jars were used, filled with the 500 mL wastewater samples spiked with PhCs, and to which 10 mg/L of PAC was added. Each trial included blank sample jars, filled with the spiked wastewater sample but without PAC addition, which allowed checking the initial concentration of PhCs (92 ± 11 µg/L carbamazepine, 76 ± 14 µg/L diclofenac and 86 ± 10 µg/L sulfamethoxazole).
After the established contact time, a sample was withdrawn and filtered immediately through a 0.7 µm glass microfiber membrane (prewashed with ultrapure water) to remove PAC. The PhCs remaining in the solution were quantified as described above. The PhC removals obtained at 1 h and 21 h were computed in relation to the corresponding concentration in the spiked wastewater without PAC addition (blank samples).
A table summarising the combinations tested (i.e., PhC, PAC and secondary effluent) and the measured PhC concentrations of all samples before and after adsorption are shown in the Supplementary Information, Table S1 and Figure S1, respectively.

2.5. Parameters Used as Model Inputs

For the PLS regression, 25 descriptors were considered: 7 descriptors related to the PhCs properties, 10 descriptors related to the wastewaters properties (8 related to the organic matrix and 2 to the inorganic matrix) and 8 descriptors related to the PACs properties.

2.5.1. PhCs Parameters

Table 1 and Table 2 present the physical–chemical properties of the 3 target PhCs—CBZ, DCF, and SMX—selected as representative models of the recalcitrant PhCs.

Molecular Modeling

The initial structures of the three target PhCs were built in Avogadro (http://avogadro.cc; accessed on 25 May 2020) and the geometries were optimized by energy minimization with the GAUSSIAN 09 software package [32] using the M06-X2 functional [33] and the 6-31+G** basis set. All calculations were conducted using the universal solvation water model (SMD, or solvent model density) [34], where the full solute electron density is used instead of the partial atomic charges. Frequency calculations were performed to confirm the absence of imaginary frequencies for the obtained minima. Several torsions around the rotatable bonds were explored to confirm the global minima here presented. The reported solvation free energies are the free energy changes associated with the transfer of each compound between the gas phase and water. These were calculated directly from the SMD continuum model, which has been shown to compare very well with the corresponding thermodynamic cycle of a large dataset of pKa and reduction potential values [35].

Molecular Data

The logarithms of the octanol–water partition coefficient (log Kow) and distribution coefficient (log D7.4), and polarizability values were predicted using the ACD/Labs Percepta Platform, which along with pKa values were retrieved from the ChemSpider database (http://www.chemspider.com/; accessed on 25 May 2020). The log DpH value (Equation (1)) corrects the log Kow (Equation (2)) for the pKa of each compound by quantifying the amount of both the ionized and non-ionized forms of the PhCs in octanol and water at the pH values under study.
logD pH   value = log ( [ solute ] octanol ionised + [ solute ] octanol non - ionised [ solute ] water ionised + [ solute ] water non - ionised )
logKow = log ( [ solute ] octanol non - ionised [ solute ] water non - ionised )
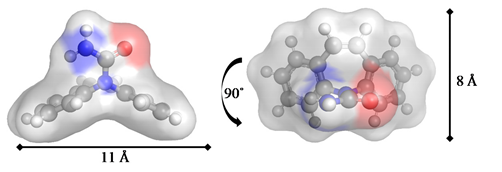
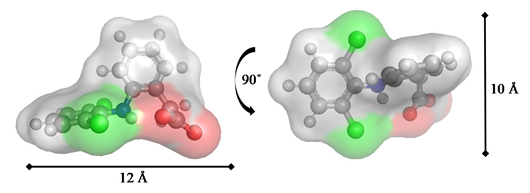
The molecular structures and dimensions of the three target PhCs are presented in Table 1, while Table 2 gathers other relevant chemical properties: log Kow, polarizability, pKa value, charge, critical dimension, and solvation energy. CBZ is an anti-epileptic and psychiatric drug with an amide group and a tricyclic delocalized π system, available in the wastewaters studied in its neutral form (pH < pKa) and is hydrophobic regardless of the water pH (log Kow and log D above 2). SMX is an antibiotic with a sulfone group and two amine functionalities; it is hydrophilic with a pKa value of 5.6 and at pH 7 the main species is the N-centred anion which has a predominant extended conformation (lowest energy). DCF is an anti-inflammatory medicine, with carboxylic acid, amine and chlorine functionalities and is relatively hydrophobic, i.e., its hydrophobicity depends on the water pH–ionization degree (log Kow = 4.06; log D7.4 = 1.37), and has a pKa value of 4.0, which rendered the anionic species the most abundant in the wastewaters studied (Table 1). The solvation free energies of these three PhCs (Table 2) confirm that the anionic species of SMX and DCF are very well-stabilized by water, while neutral CBZ is not, indicating that this compound should interact stronger with more hydrophobic matrices.

2.5.2. Wastewater Parameters

The dissolved organic matter present in secondary effluents of urban WWTPs (effluent DOM) consists of a complex and heterogenic mixture of organic compounds resulting from water treatment processes, such as transformation products of natural and anthropogenic organic matter and soluble microbial products [36]. Depending on its nature and concentration, effluent DOM competes in different extents with PhCs for the adsorption sites on PAC.
The experimental runs were performed with 6 different wastewaters, secondary effluents from two Portuguese WWTPs, whose characteristics are presented in Table 3.
Bulk parameters were used to characterise the background organic matter in the tested waters. DOC, representing the total amount of dissolved organic matter expressed as C mass concentration, ranged from 4.7 to 7.9 mg C/L. A254, a measure of dissolved organic compounds with aromatic rings and double C-C bonds, varied between 0.147 and 0.236 cm−1. A436, an indicator of colour, was between 0.012 and 0.021 cm−1. The normalized UV absorbance at 254 nm, SUVA, calculated as A254/DOC × 100, was used as a surrogate parameter for aromaticity or hydrophobicity of natural organic matter present in waters. SUVA > 4 L/(mg×m) indicates mainly very hydrophobic and high molecular weight organic matter, SUVA < 2 L/(mg m) suggests the presence of mainly low hydrophilic material, and intermediate values correspond to a mixture of hydrophobic and hydrophilic compounds and a mixture of molecular weights [37]. SUVA and organic matter rapid fractionation results showed the DOM in the tested waters to comprise mainly high hydrophobic organic acids (vHB), representing 45% to 53% of the DOC, followed by slightly hydrophobic (sHB) and charged hydrophilic (cHL) organic matter (11–13% to 25% of DOC), while neutral hydrophilic (nHL) organics represented 5 to 18% of the DOC.
pH was neutral to slightly alkaline, showing a reasonable buffer capacity of the wastewaters, while electrical conductivity ranged from 704 µS/cm to 2450 µS/cm, reflecting considerable fluctuations of the ions’ concentration in these waters, mostly related to stormwater dilution (both WWTPs are associated with combined drainage systems—wastewater and stormwater).

2.5.3. PACs Parameters

A set of seven PACs, comprising commercially available and lab-made activated carbons, was tested for the adsorption of the three target PhCs. The selection of the commercial PACs gathered materials obtained from mineral and vegetable precursors, only considered materials with well-developed micro and mesopore structures (adequate for PhC adsorption), with an alkaline character (to maximize the adsorption of neutral–anionic PhCs, Table 2), and with apparent densities ≥ 300 kg/m3 to assure good settleability and easier separation from the treated water [38]. The four commercial PACs tested are recommended for wastewater or drinking water treatment by their producers.
All the commercial and lab-made PACs were characterised, and the main textural, surface and physical properties are summarized in Table 4.
The set of seven PACs selected cover materials with BET areas from 746 m2/g to 1463 m2/g, and total pore volumes ranging between 0.52 cm3/g and 0.90 cm3/g. It is commonly accepted that well-performing PACs for PhC adsorption from real water matrices require both micro and mesopores, as shown by Ebie et al. [39]; accordingly, the selected materials presented 35–53% mesopores, while their micropore structure was exclusively, or mainly, composed of larger micropores (supermicropores, Vα super). PAC pHPZC values covered a 7 to 10 range, meaning that at the pH of the tested secondary effluents, one PAC sample had an overall neutral surface charge, while the others presented an overall positive surface charge (pHPZC does not quantify the number of charges, rather it indicates the pH at which the overall surface charge changes from positive to negative). Regarding the physical properties, particle sizes varied by one order of magnitude (15–100 µm) and all materials presented apparent densities ≥ 372 kg/m3, which assured their good settleability.

2.6. Development of PLS Regression

Multivariate statistically-based models were developed to correlate the adsorption data obtained experimentally with properties related to the PhCs (physical–chemical and size-related properties), wastewaters (related to the background inorganic and organic matrices), and PACs (textural, surface, and physical properties). PLS was applied to describe adsorption (outputs) through multilinear correlations of several parameters (inputs) and was implemented in Microsoft Excel™ using Kamakura’s Analytic Tools for Excel [40].
This tool normalises the experimental data used in the PLS models by subtracting to each value the average of the experimental data of the respective variable and dividing by the respective standard deviations, i.e., ( X X ¯ ) / S . With this procedure, all variables are fed into the model with comparable weights, regardless of the units used for each variable, and the regression coefficients of each model obtained are, therefore, normalised and can be compared between them. As such, the multilinear model obtained is of the form:
y = a · x 1 + b · x 2 + c · x 3 +
where a ,   b , and c are the normalised regression coefficients and x 1 , x 2 , x 3 , are the useful normalised predictors to describe the modelled output.
The tool also produces raw predictors of the non-normalised data, enabling the prediction of the adsorption removals with a new set of non-normalised data.

2.7. PLS Regression Optimisation and Selection

Two PLS models were developed, one for fitting the removals at 21 h and one for fitting the removals at 1 h. For developing each of the models, a dataset of 40 samples (data points) was used. The combinations tested (i.e., PhC, PAC and secondary effluent) are shown in Table S1. The selection of the number of latent variables (LV) of each PLS was made by the application of a stratified k-fold cross-validation [41]. This approach includes stratification during the selection of samples, aiming at an equal distribution of samples across the validation segments. Each of the two datasets was partitioned into 4 disjoint folds of equal size, distributing the samples roughly evenly by the folds. As an example, regarding the PhCs, 14 samples contained the attributes CBZ and DCF and 12 samples contained the attribute SMX which were distributed as follows: folds one and two contained three instances of CBZ and SMX and four instances of DCF, and folds three and four contained four instances of CBZ and three instances of DCF and SMX. The composition of each fold is shown in the Supplementary Information (Table S1).
Each fold was, in turn, dropped from the data set, with the remaining folds constituting the learning set. The learning set was used to build a PLS regression model that was applied to predict the left-out block, which then constituted the testing set. One to five LVs were tested, and, for each testing set, the residual sum of squares was computed and represented as a function of the number of LVs. The number of LVs of the PLS was selected by applying consecutively the following criteria: (1) by the mode of the two LVs holding the highest R2 of all the testing sets and (2) by the average R2 of all the testing sets. The PLS model was finally obtained using all data set with the selected number of LVs [42].
For selecting the number of predictors, a wrapper method [10] with backward variable elimination approach [43], using the R2 and the Akaike Information Criterion (AIC) [44], was used. The R2 indicates the higher predictive power of the model (the higher the better), while the AIC (the lower the better) performs model selection rewarding the simplest model with the least assumptions and variables but with greater explanatory power. Starting with all the predictors, the regression models were refined by progressive elimination of non-relevant predictors (filter measure), if their weight (normalised) was <5% of the higher weight parameter or one at a time, based on the relevance in the regression equation. Two consecutive models were compared for the goodness of fit using the R2 and the AIC. This procedure was first followed up for achieving 3 parameters in each domain (totalling 9 parameters) and then with no restrictions. These methods enabled the elimination of non-useful inputs for each output, resulting in better prediction with fewer inputs.

3. Results and Discussion

3.1. Univariate Analysis

The establishment of univariate correlations between the removal of PhCs from wastewaters and specific parameters is often not conclusive. Nevertheless, an attempt to establish simple univariate correlations between specific descriptors and adsorption was carried out prior to multivariate analysis. The selection of the descriptors to establish these correlations was based on correlations published in the literature by other authors [3,4,5,8,45,46,47], as well as by plotting the available experimental data to identify possible univariate correlations. The correlations obtained with the available data can be used to indicate trends but, due to the limited data points, cannot be regarded as sound statistical analysis.
Aiming to illustrate the effect of a specific parameter/property, the univariate analyses presented in Figure 1 and Figure 2 were obtained with data from assays performed with the same WWTP effluent. Figure 1 revealed that for a set of two commercial PACs and two lab-made PACs tested with the same WWTP effluent (SE6), there were reasonable linear relationships between the PhC removals attained after 21 h of contact time and two of the textural parameters of the PACs: the apparent surface area and supermicropore volumes. While some literature studies report reasonable linear relationships between the BET area values and the dose of activated carbon to attain 80% removal of the pharmaceutical compounds or the removal percentage [4,7], others do not find a clear trend [3]. Regarding the microporosity, Alves et al. [7] found a reasonable relationship with the total micropore volume yet, as expected, not with the volume of narrow micropores (ultramicropores) since target pharmaceuticals were larger than 0.7 nm. Thus, regarding textural parameters, the trends found in the present work are in line with previous literature data and support the hypothesis of the supermicropore volume or BET area being possible predictors of the activated carbon’s performance. Furthermore, it is clear that in both cases, the removal efficiency was more dependent on the target PhCs than on the PAC properties, CBZ (79–95%) > DCF (60–79%) >> SMX (13–29%). This trend is in line with previous literature data [7,19] that rationalize this tendency with the decrease in PhCs hydrophobicity, pointing out the contribution of hydrophobic interactions. When performing this univariate analysis to another set of data obtained with different PACs in another WWTP effluent, no linear relationships were found but the distinct range of removal efficiencies attained for each PhC continued to be observed (Figure S2, supplementary information (SI)).
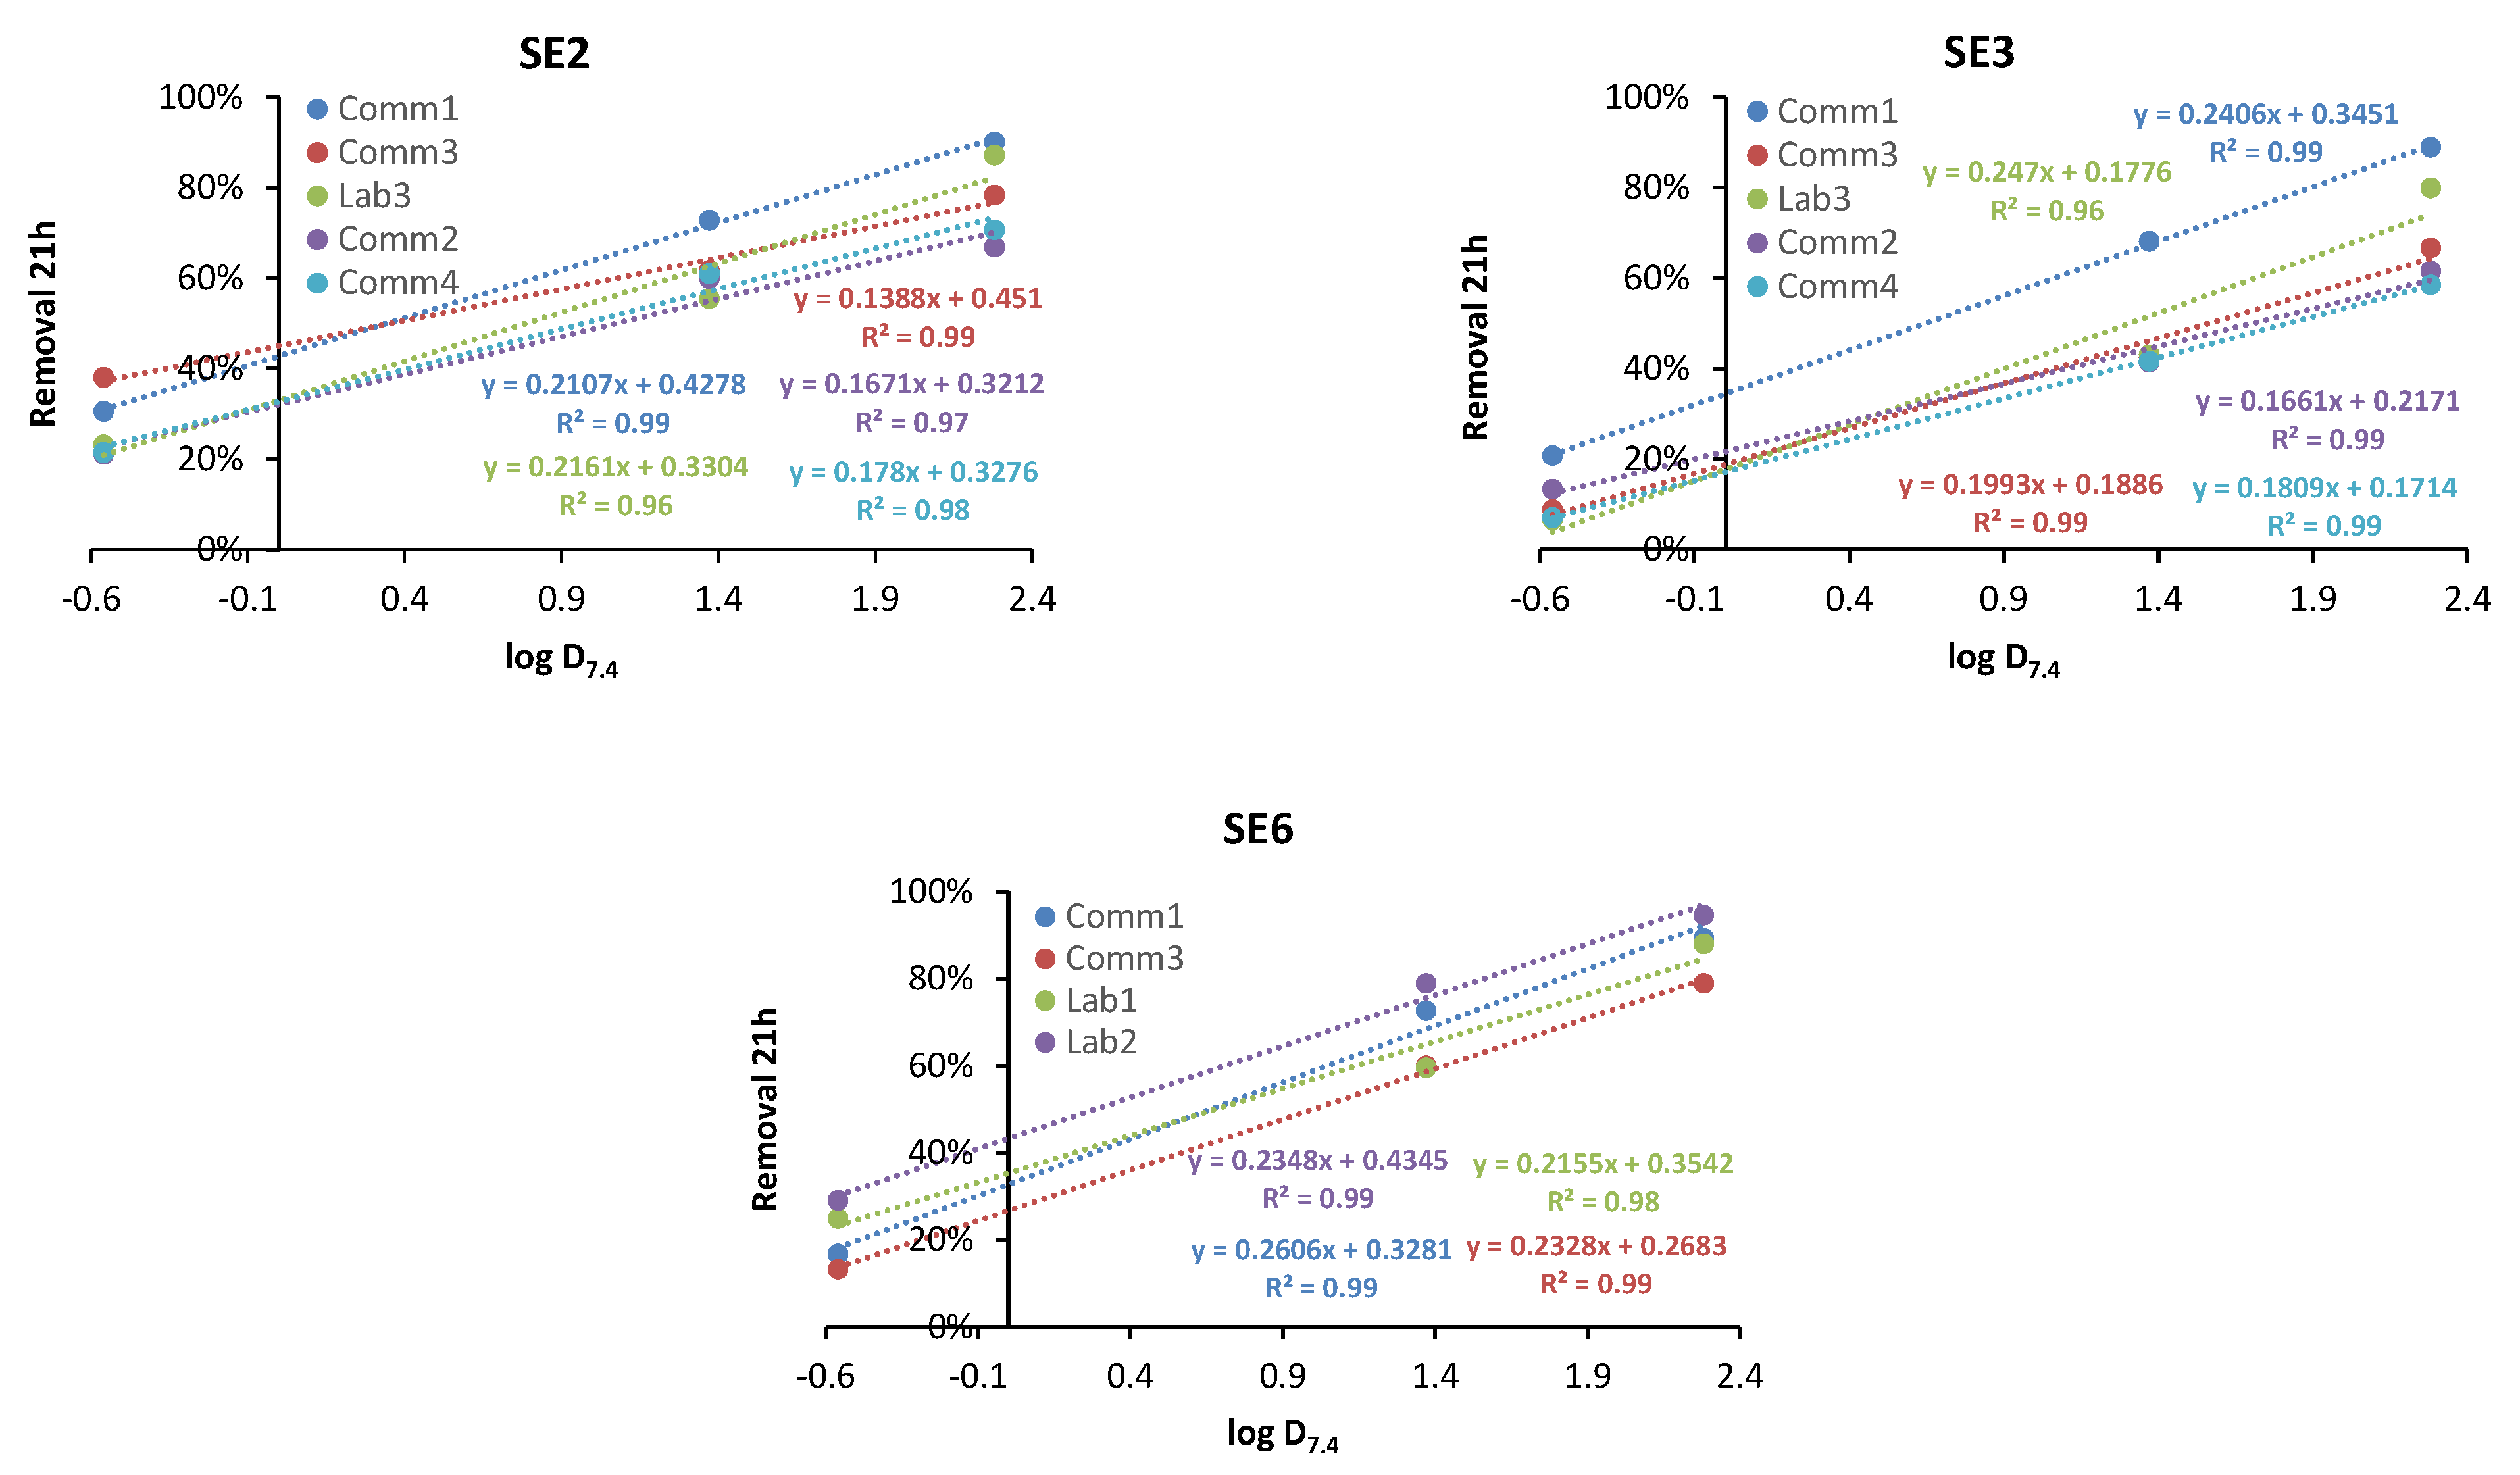
Regarding the properties of the PhCs, Figure 2 and Figure S3–S5 show log D7.4 (Figure 2 for removal at 21 h and Figure S4 for removal at 1 h) and solvation energy (Figure S5) values were the only parameters presenting a relationship with the removal efficiency, although the former presenting by far the best linear relationship both for 1 h (Figure S4) and 21 h (Figure 2) contact time. The removal efficiencies of the three PhCs presented a linear relationship with log D7.4 values, attaining R2 close to 1, regardless of PAC properties and wastewater tested (Figure 2). In turn, the plot of removal efficiency at 21 h versus log Kow presented R2 ≤ 0.6 (Figure S3 of SI). While log Kow only accounts for the non-ionized entities in both organic and aqueous phases, the log DpH value parameter quantifies the amount of entities ionized and non-ionized in both organic and aqueous phases at a given pH. At pH 7.4, CBZ was neutral, but DCF and SMX were anionic, thus the log D7.4 values appeared to be more robust than log Kow values. In fact, the univariate analysis for three distinct wastewater samples clearly pointed out that the removal efficiencies greatly increased as the log D7.4 value increased, once again indicating the paramount role of hydrophobic interactions of PhCs with the solvent and PAC surface.
Regarding the removal efficiencies and the water matrix properties, it was not possible to find any linear relationship (Figures S6 and S7 of SI). In general, the common feature among all the dispersion plots was the same PhC removal trend, CBZ attaining always the higher removal, followed closely by DCF and SMX with the lower removals. This trend indicates that, in our pool of data, the features of the PhCs seemed to overcome the contribution of the water matrix properties for defining the trend, and DOM content may affect the adsorption extent.
Univariate analysis is, therefore, clearly not sufficient to describe and identify the most relevant variables in PhC removal by adsorption onto PAC, probably due to the existence of complex interactions and synergetic effects resulting from the large range of properties of the PhCs, PACs and waters in each specific removal assay. To unravel these complex relationships, multivariate statistically-based models were developed as follows.

3.2. Multivariate Analysis

In addition to its potential as a predictive tool, PLS regression can be used to understand the relationships between outputs and their input descriptors. In the present study, PLS models were developed to identify significant parameters that correlate with the adsorption of PhCs onto PAC in well-clarified secondary treated effluents.
The optimisation was conducted to select the relevant inputs and simplify the interpretation of the obtained correlations. The selected models, as well as the regression coefficients of the model inputs (contribution of the relevant inputs to the model), are presented in the following sections. A detailed discussion of the relationships between outputs and the corresponding descriptors established by the models is also provided.

3.2.1. Fitting of Adsorption at 21 h

The selection of the number of latent variables for the PLS followed the procedure described in Section 2.6. The R2 for the four training sets and the four test sets as a function of the number of latent variables are depicted in Figure S8. Figure S9 depicts the frequency plot of the number of latent variables selected for the four test sets (best two) and the average R2 for the four test sets as a function of the number of latent variables.
Regarding the frequency of LVs, it was observed that 1, 2 and 5 LVs were the most frequent, while regarding the average R2 values of the four test sets the highest value was obtained for 2 LVs, which were then selected for performing the PLS.
The model parameters selection followed the procedure described in Section 2.6. Progressive elimination of non-relevant predictors was performed until achieving nine parameters, three parameters in each domain. Afterwards, the elimination was conducted with no restrictions. Figure S10 depicts the AIC and R2 values as a function of the number of the model parameters.
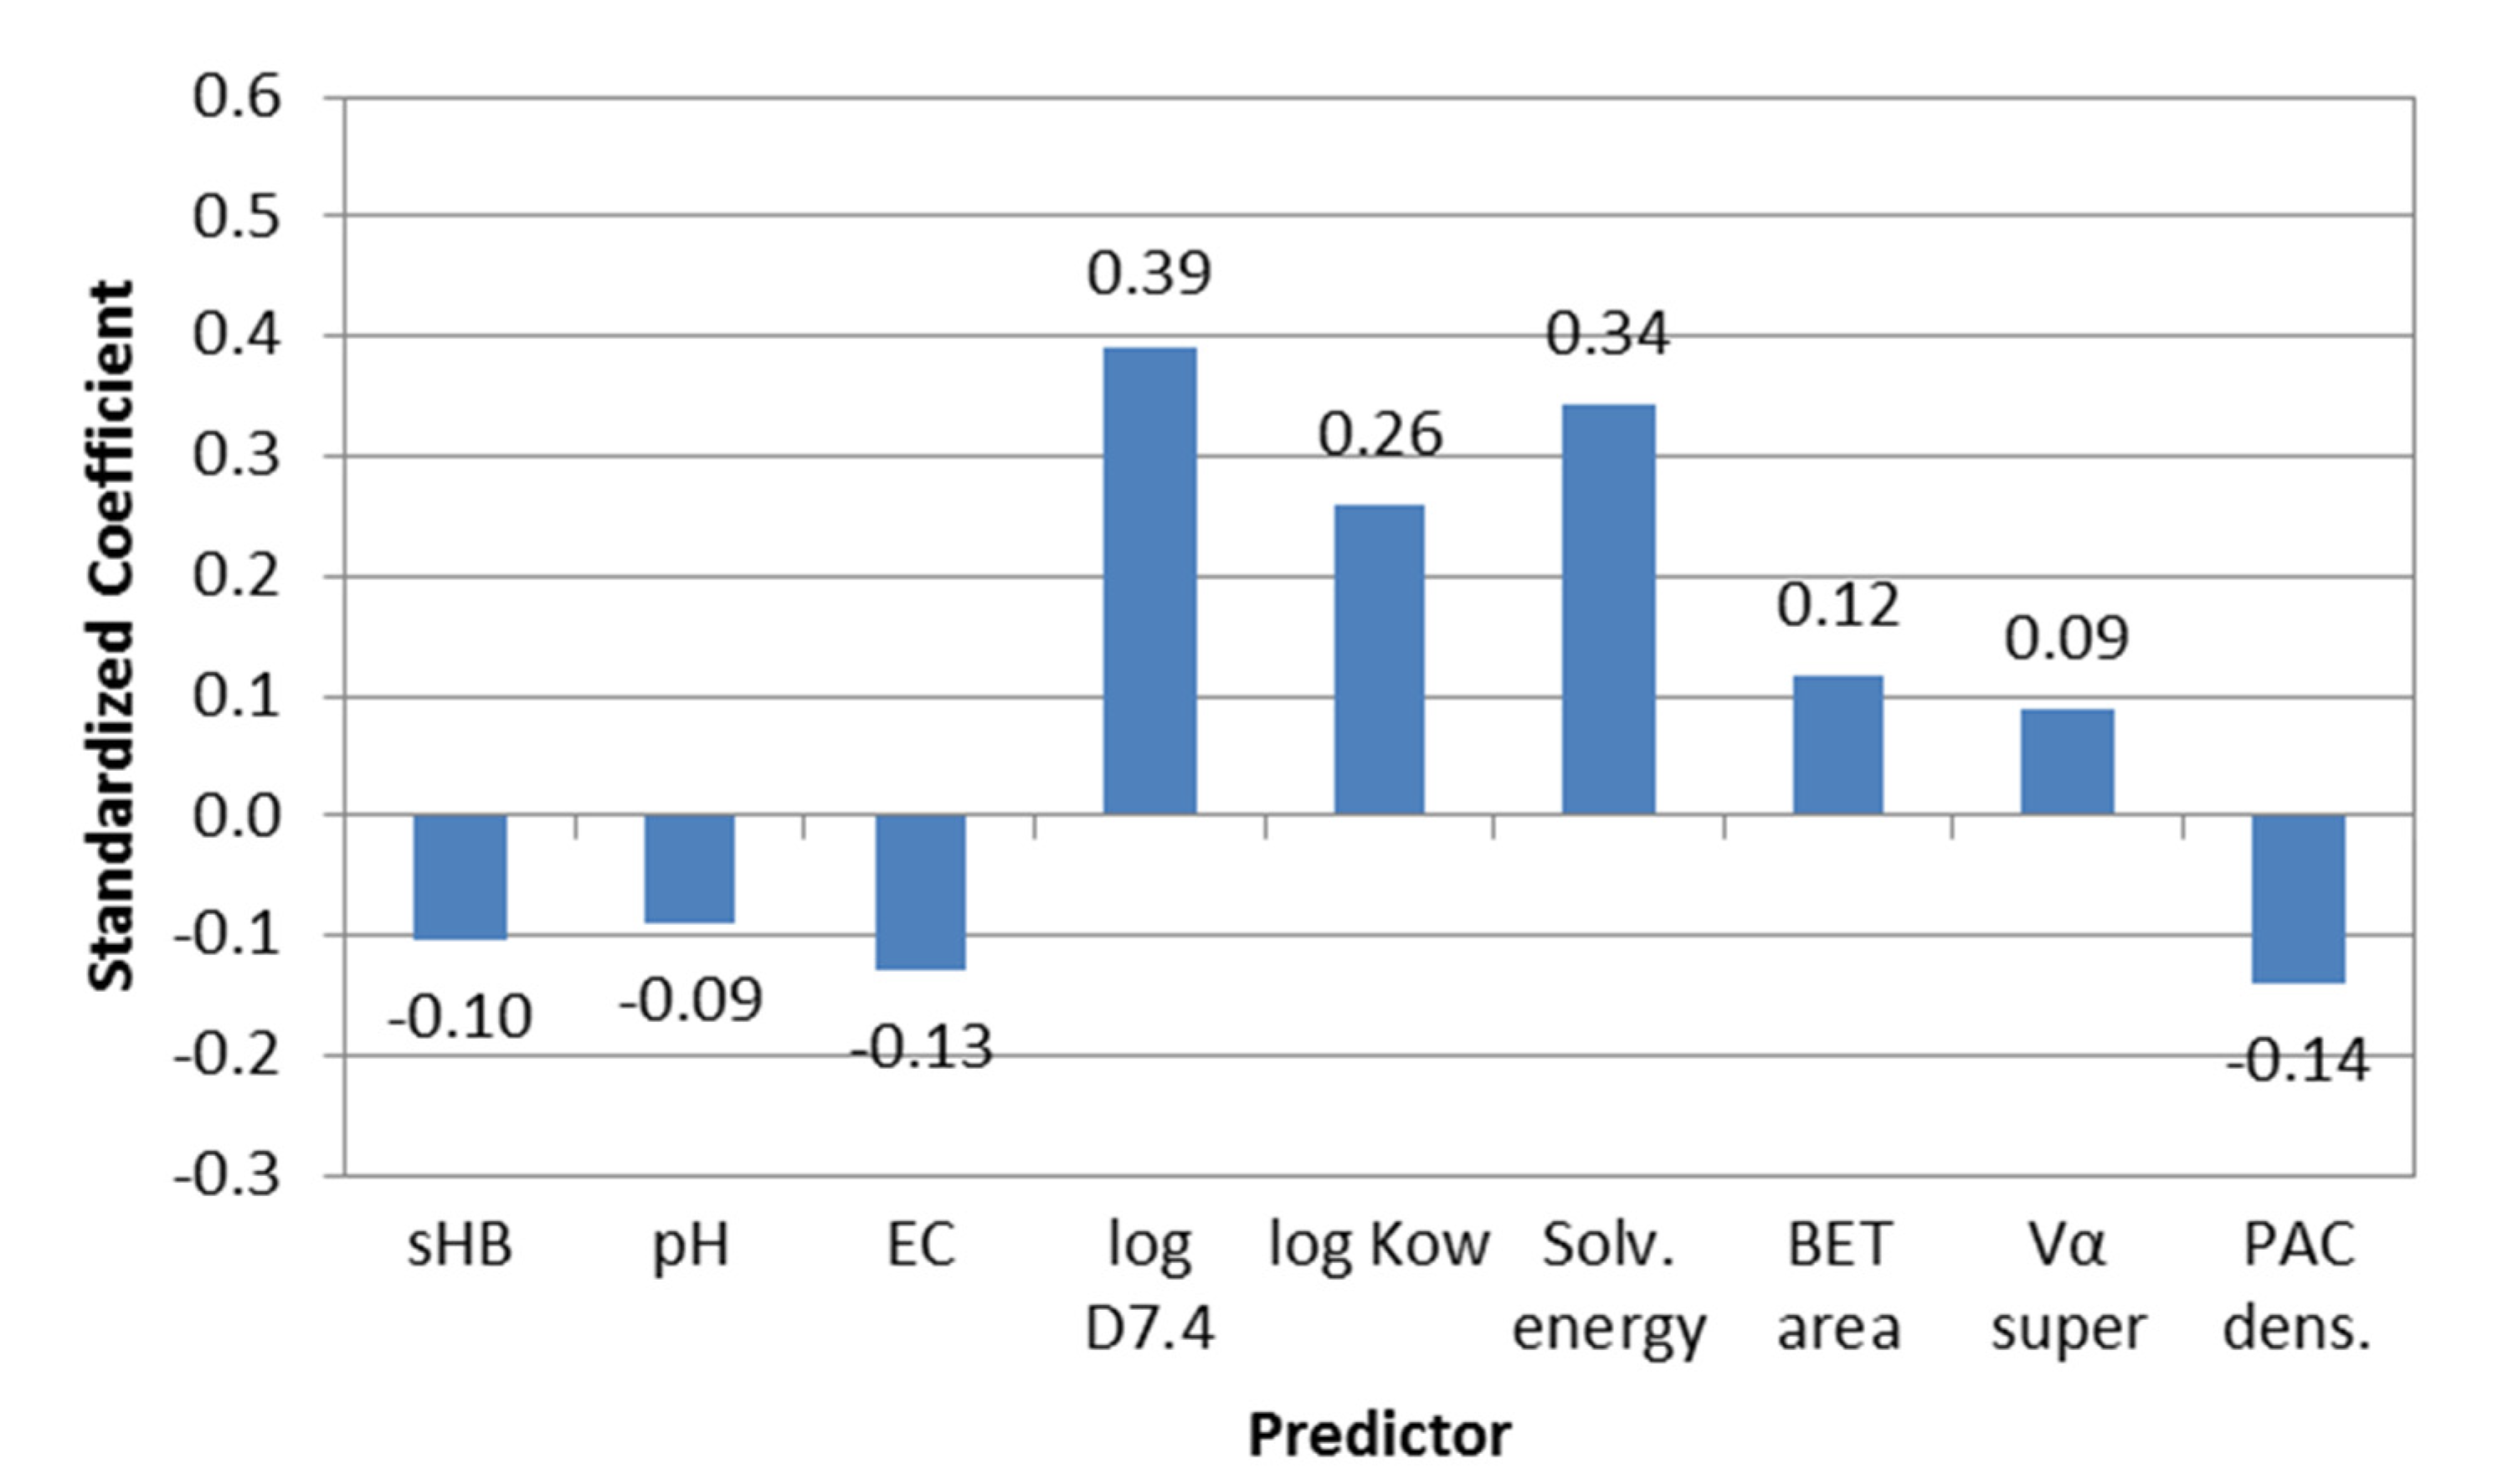
The 9 parameters model fitting, observed removals plotted versus model-fitted removals, and the standardised coefficients of the model, are shown in Figure 3 and Figure 4, respectively.
As can be observed in Figure 3, a very good fitting was obtained, with an R2 value of 0.979 and with a slope of the predicted versus the observed removals close to 1 (0.979). Regarding the impact of the parameters on the removal (Figure 4), a higher weight of PhC predictors was observed, in line with what was anticipated by the univariate analysis, with a high positive impact of the PhC hydrophobicity (log D7.4, solvation energy and log Kow). Similar findings have been reported for low molar mass PhCs [7] and neutral compounds [8]. Conversely, no impact of the PhC size- or charge-related descriptors was highlighted. Concerning the size, since the three PhCs were of similar size and all were to be adsorbed in supermicropores, no impact was expected. Concerning the charge, it points to the lower weight of electrostatic over hydrophobic PhC-PAC interactions. The negative weight of EC on the removals may be due to a shielding effect of the electrostatic interactions between the PhCs and the PACs by the inorganic matrix ions of the waters [48,49]. The results also stress the importance of competition effects of water DOM, namely of its slightly hydrophobic fraction, a better descriptor than the usually considered DOC [47,50] or eventually A254. The results also stress the positive importance of the PAC pore structure (supermicropore volume, Vα super) besides the most commonly found BET area [4] and disregard the importance of the PAC surface properties. This last observation was expected given that only neutral–alkaline PACs were selected (PAC pHPZC range of 7 to 10), thus six out of eight with similar charges at the wastewater pH. The negative impact of PAC density, also previously observed in GAC studies [5] may be explained by its inverse correlation with the PAC pore volume or BET area [4]. In general, the importance of conventional and non-conventional parameters should be stressed.
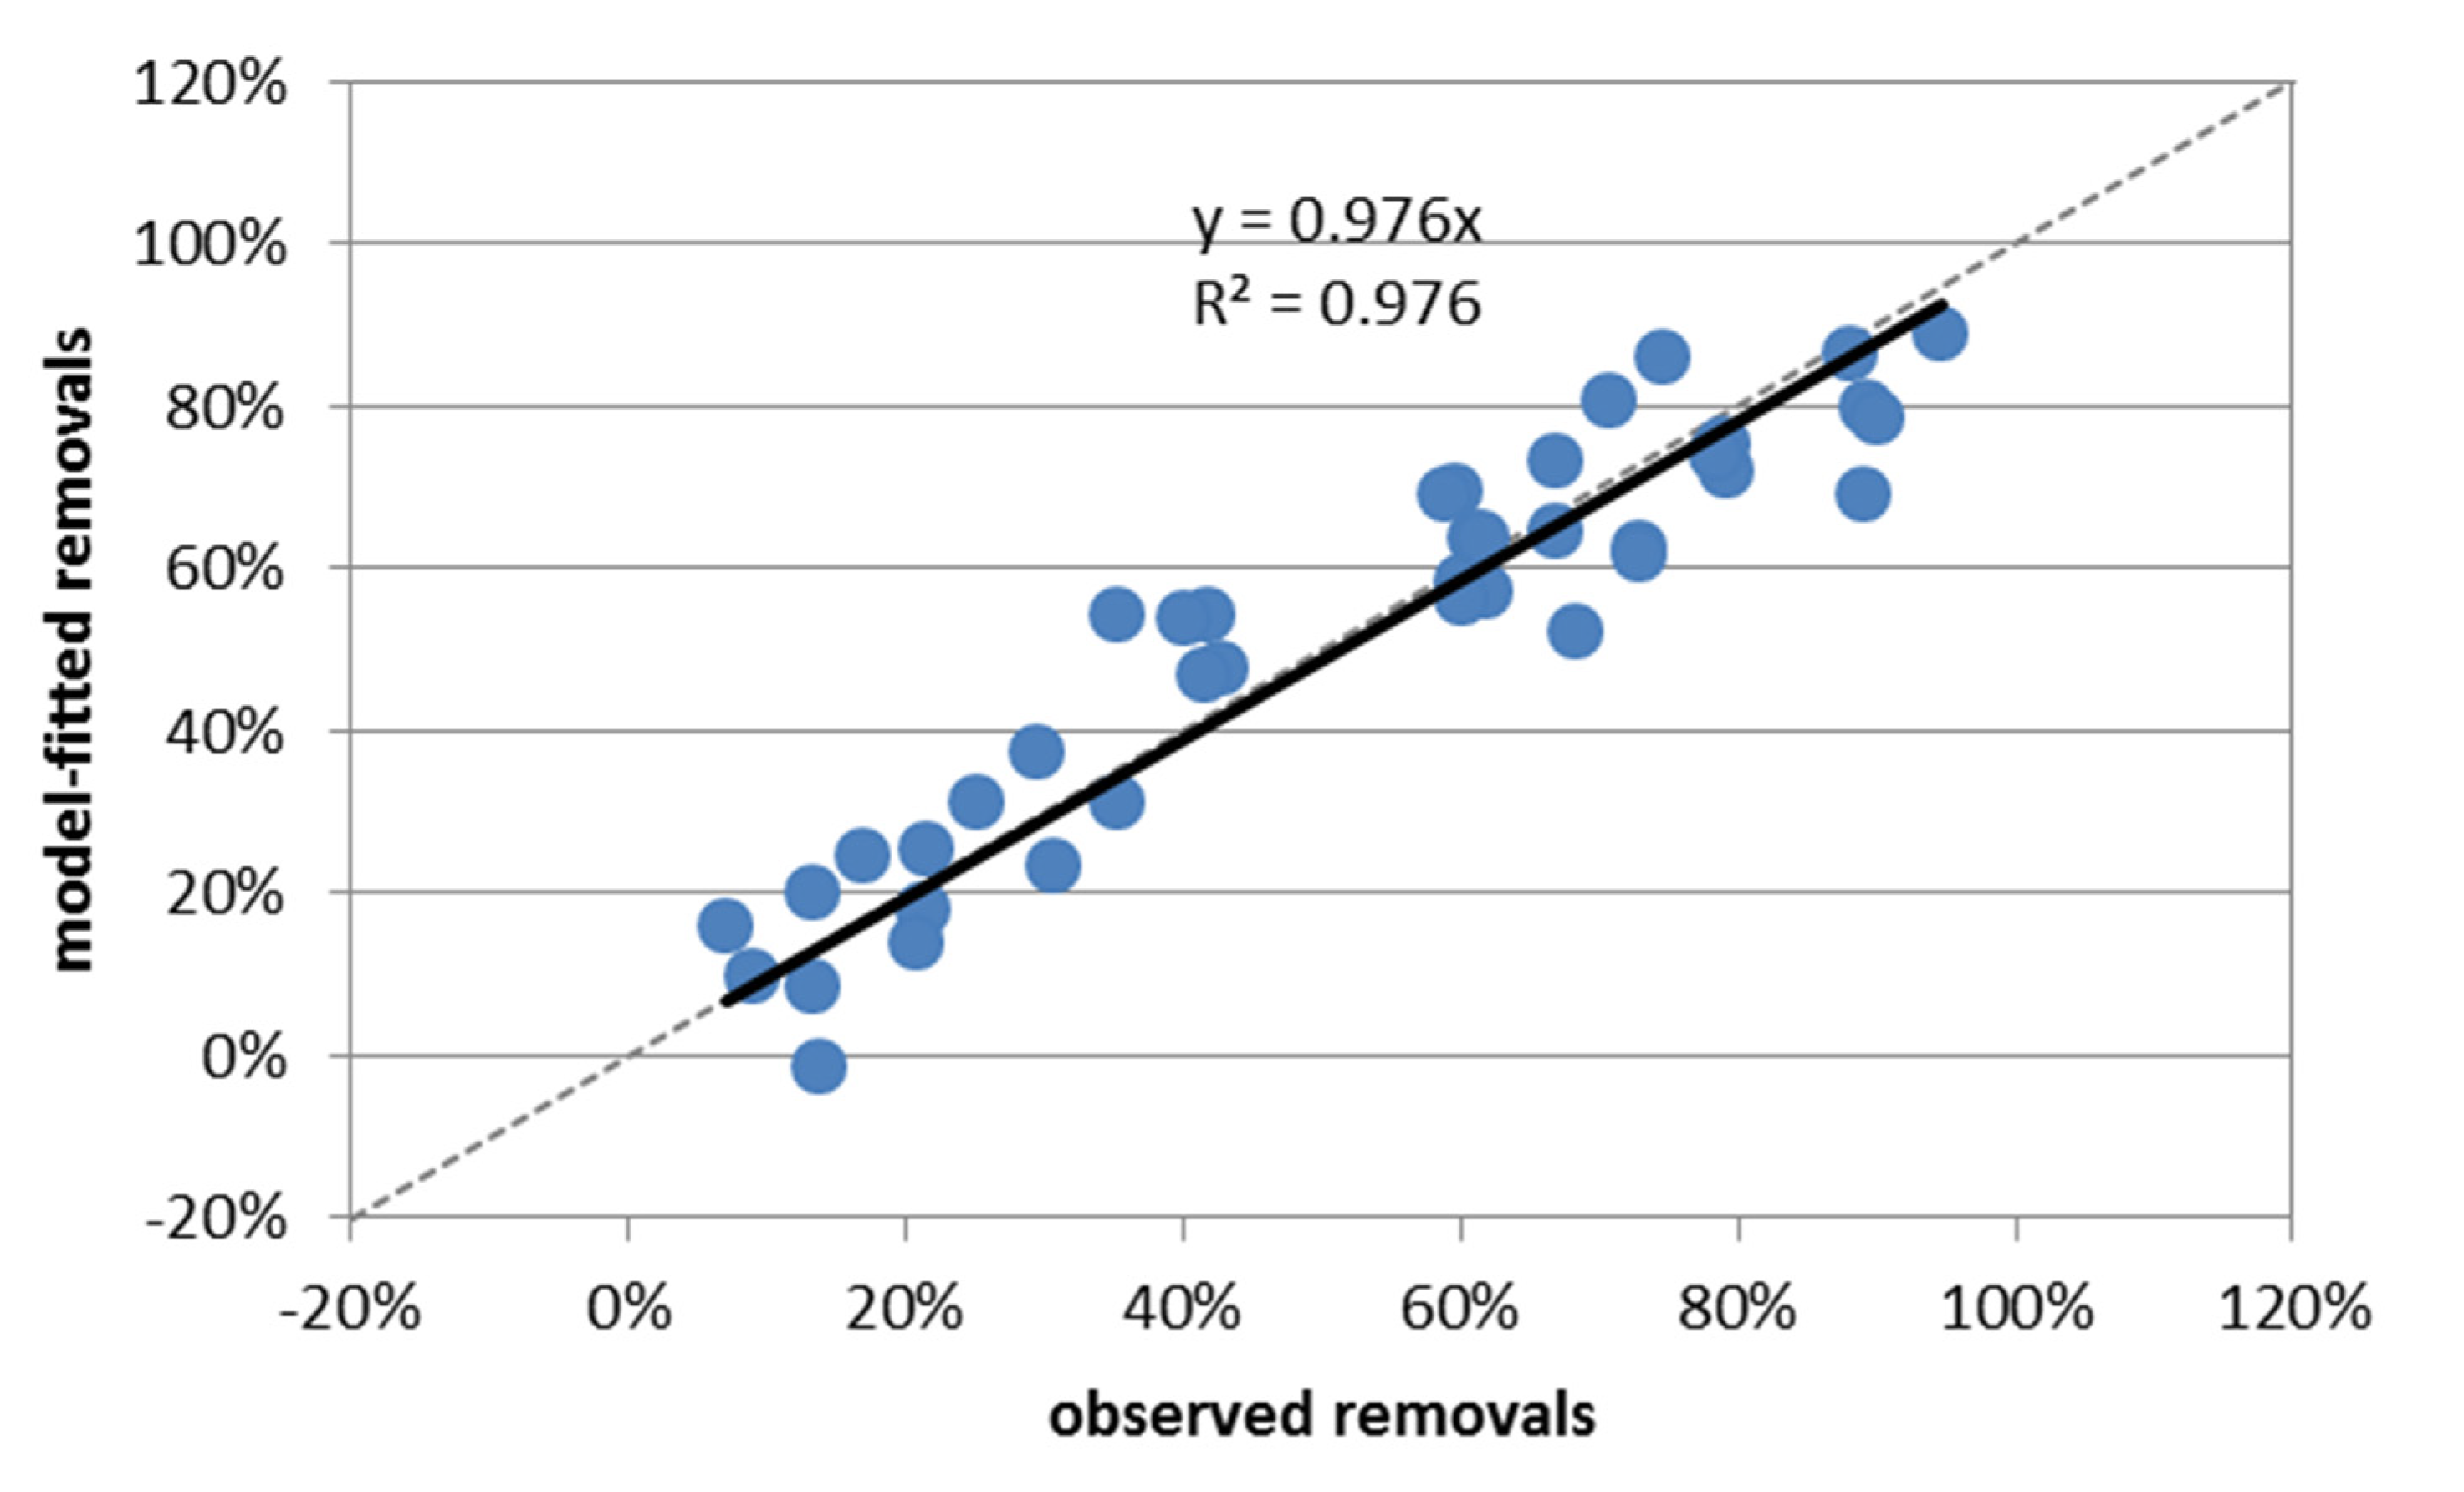
After assessing the three most relevant parameters in each domain, the elimination of variables was carried out with no restrictions. As can be observed in Figure S10, the optimum solution (minimum AIC value without a significant decrease in R2) corresponded to a five parameters model. The five parameters model fitting and the standardised coefficients of the model are depicted in Figure 5 and Figure 6, respectively.
As depicted in Figure 5, a very good fitting was obtained, with an R2 value of 0.976, a root mean square error (RMSE) of 9%, and a slope of the predicted versus the observed removals of 0.976.
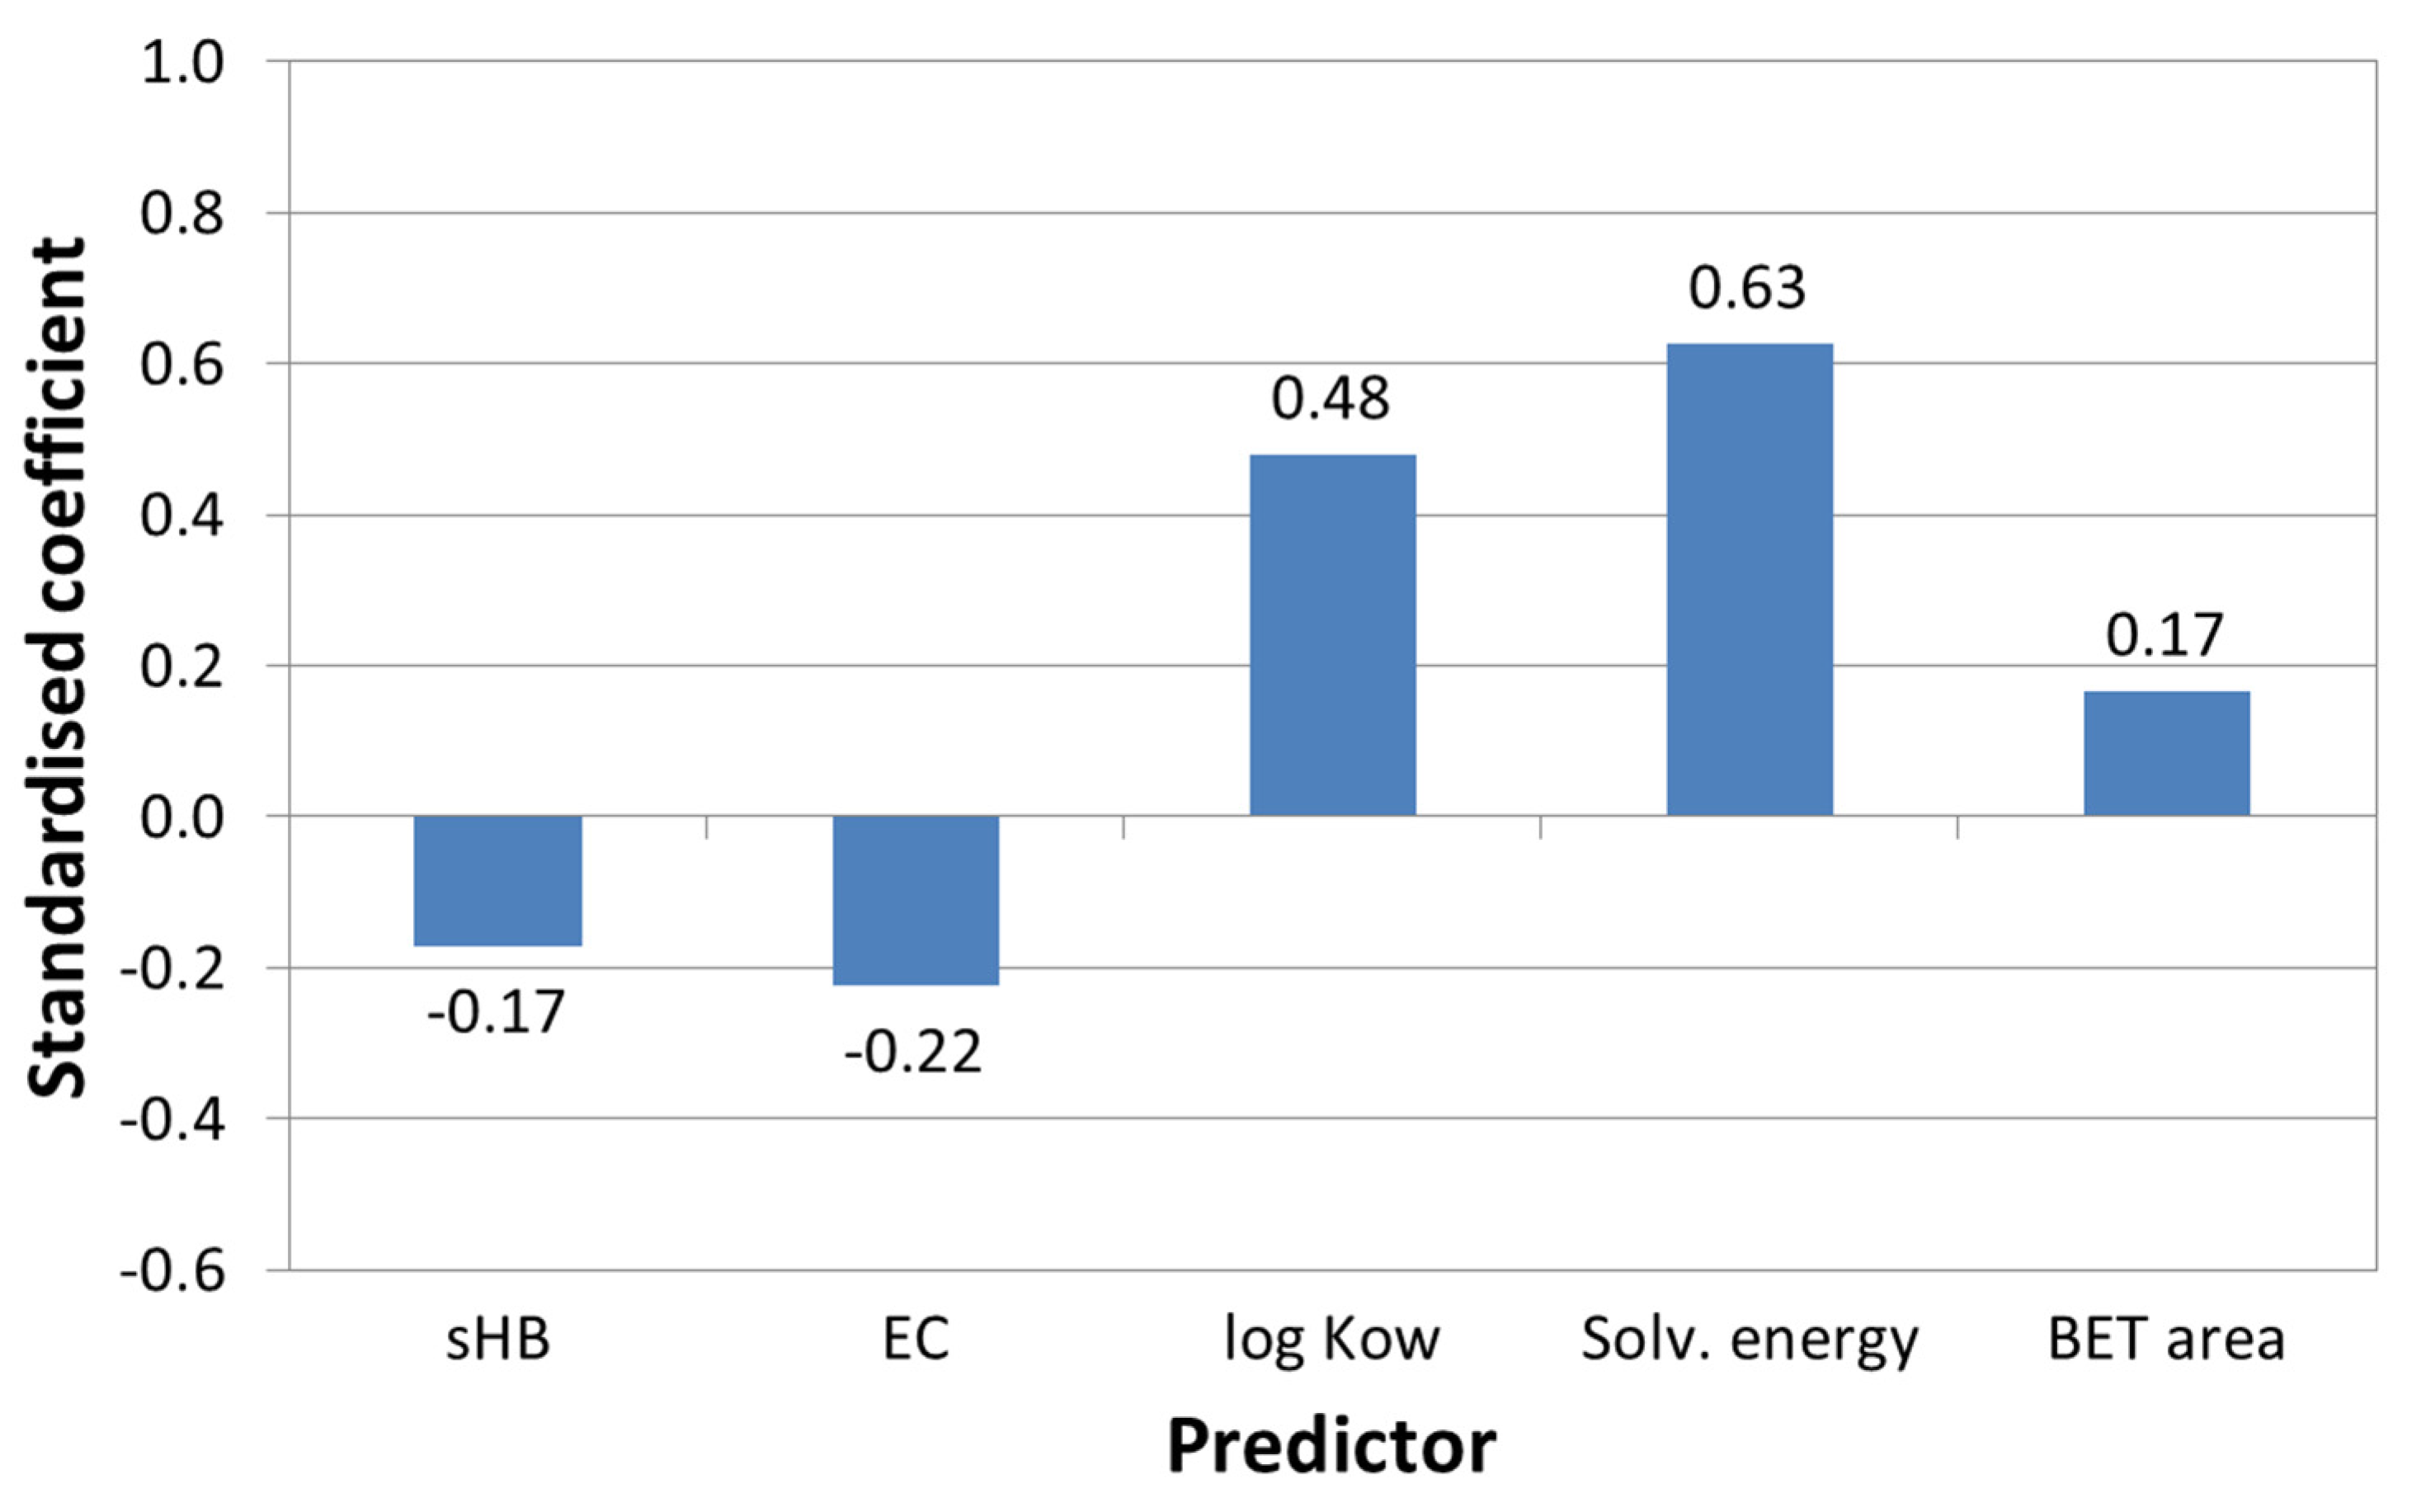
Regarding the parameters’ impact on PhC removal (Figure 6), it can be observed that all domains mattered, with the PhC descriptors (solvation energy and log Kow) having the highest weight (positive). Comparing the previous solution (9 parameters) with this simplest solution, log D7.4 was eliminated, most probably due to its explanatory power being incorporated in the solvation energy (the highest weight descriptor), as both properties followed a similar trend. This similar trend is due to the fact that both solvation energy and log D7.4 account for all the species involved, whereas log Kow only accounts for the neutral species. It is also perceived that PAC properties lower their impact, with the only descriptor being the conventional BET area parameter, incorporating the explanatory power of the PAC micropores volume and density. Regarding the wastewater properties, both organic and inorganic matrix parameters retained their importance, namely related to the adsorption competing species of the dissolved organic matter (slightly hydrophobic fraction) and with a probable shielding of PhC-PAC electrostatic interactions by waters ions.
From the normalised weights presented in Figure 6, Equation (4) enables predicting the percentage removal of the three PhCs at 21 h, for the conditions tested (100 µg/L initial concentration and 10 mg/L of PAC):
%   r e m o v a l   ( 21   h ) = 0.147 · s H B ( m g C L ) 1.45 × 10 4 · E C   ( u S c m ) + 6.73 × 10 3 · S o l v .   e n e r g y   ( k J m o l ) + 0.0978 · log K o w + 2.04 × 10 4 · A B E T   ( m 2 g ) + 0.709

3.2.2. Fitting of Adsorption at 1 h

The procedure used to fit the data obtained at 21 h was followed to fit the data at 1 h and is described in text S2 and Figures S11–S16.
For the nine parameters’ model, it was observed a higher weight of PhC predictors and a high positive impact of PhC hydrophobicity (log D7.4, solvation energy and log Kow) (Figure S14), similarly to the removals at 21 h. Again, no impact of PhC size- or charge-related descriptors was observed, pointing also to lower weight of electrostatic interactions than of hydrophobic PhC-PAC interactions, furthermore consistent with the negative weight of EC on the removals. The results also emphasised the importance of competition effects of water DOM, highlighting its slightly hydrophobic fraction and, unlike for 21 h adsorption, also its charged hydrophilic fraction. Although compounds associated with this latter fraction should be less adsorbed than slightly hydrophobic compounds, they are negatively charged, thus interacting electrostatically with the positively charged PAC, and possess a lower molar mass, thus more readily diffusing to the PAC surface. Concerning the PAC properties impact, the descriptors identified were the supermicropores volume (positive), the PAC density (negative), as for 21 h adsorption, and also the PAC size (negative), the latter being typically pointed as adsorption kinetics determining [51]. Overall, the PAC descriptors presented a total weight higher for adsorption at 1 h than at 21 h.
Further elimination of model variables was then carried out with no restrictions. By having a higher R2 value, the model with five parameters was selected as the optimised model.
Regarding the impact of the parameters on the removal (Figure S16), it can be observed that all domains mattered, with the PhC descriptors (solvation energy and log Kow) having the highest weight (positive), similarly to the removals at 21 h. Compared with the nine parameters model, log D7.4 was again eliminated, with its explanatory power being most probably incorporated in the solvation energy, again the highest weight descriptor. This simpler model also showed a lower weight of the water descriptor, neglecting the inorganic matrix impact and identifying the DOM main competitor to be the charged hydrophilic compounds. On the other hand, the PAC descriptors increased their impact, with the supermicropore volume and the PAC density, which incorporated the PAC size effect, retaining the stronger role.
From the normalized weights presented in Figure S16, Equation (5) enables predicting the percentage removal of the three PhCs at 1 h, for the conditions tested (100 µg/L initial concentration and 10 mg/L of PAC):
%   r e m o v a l   ( 1   h ) = 0.0469 · c H F ( m g C L ) + 4.49 × 10 3 · S o l v .   e n e r g y   ( k J m o l ) + 0.0190 · log P + 0.190 · V s u p e r ( c m 3 g ) 1.24 × 10 3 · P A C d e n s   ( k g c m 3 ) + 0.928

3.2.3. Assessing the Main Descriptors for Adsorption Capacity and Short-Term Adsorption

The good fittings obtained for the simpler models presented in the previous sections allow comparing the main descriptors affecting PAC adsorption capacity (21 h adsorption as indicator) of PhCs and the descriptors most related to the PAC short-term adsorption (1 h adsorption as indicator). It was observed that for both situations, all domains impacted PhC removal, the highest weight being associated with the PhC predictors, solvation energy, and log Kow, both related to their hydrophobicity and with high positive impact. On the other hand, the adsorption capacity appeared to be more impacted by the water properties, while the short-term adsorption appeared to be more impacted by the PAC properties. It was observed that both organic and inorganic matrices impacted the adsorption capacity of the PACs towards the PhCs. On the other side, only the charged hydrophilic organic compounds of the water matrix seemed to hinder short-term adsorption. The results also pointed to the BET area to be a good descriptor of PAC adsorption capacity, while short-term adsorption appeared to be better related to PAC supermicroporous volume and density. It should be stressed, however, that the pool of PACs tested comprised only PACs with expected good performance in real water matrices and, therefore, the PAC properties identified to increase their performance should not be regarded as a starting point to select or develop/engineer new PACs but as a way of refining their performance.

4. Conclusions

The PLS modelling approach followed showed good descriptive capability and contributed to an overall comprehension of the PAC adsorption mechanisms of the selected PhCs in real wastewaters. Hydrophobic PhC-PAC interactions played a major role in the adsorption process, surpassing the electrostatic interactions, with the solvation energy and log Kow being the most suitable descriptors; no impact of PhC size- or charge-related descriptors was observed.
The results also stressed the importance of competition effects of water DOM, namely of its slightly hydrophobic compounds impacting the adsorption capacity or its charged hydrophilic compounds impacting short-term adsorption. Those were better descriptors than the usually considered A254 or DOC. The water inorganic matrix appeared to only impact PAC adsorption capacity, not the short-term adsorption.
For the pool of PACs tested, all with expected good performance, the results pointed to the BET area being a good descriptor of the PAC capacity, while short-term adsorption appeared to be better related to its supermicropore volume and density. The improvement in these properties should be regarded as a way of refining their performance.
The correlations obtained, involving the impact of water-, PhC- and PAC-related descriptors, showed the existence of complex interactions that a univariate analysis was not sufficient to describe.
Nevertheless, it should be stressed that since the models developed were calibrated with a limited number of compounds and experimental conditions, generalised conclusions from the present work should be taken with care. As to broaden the range of application of the present approach, the pool of data is being fed, increasing the diversity of properties. PACs with much lower and higher pore volumes than the set studied will amplify the scale and improve the response of the model. In addition, PACs with similar textural properties but distinct surface chemistry, covering both acidic and basic range, are aimed and will allow a better assessment of the complex adsorption process and further allow driving the PAC engineering/tailoring (product design). Furthermore, enlarging the set of PhCs and including other molecular descriptors will allow having a finer quantification of the PhC structure (heterocycles, aromaticity degree, chemical functionalities) impact on adsorption. Finally, including waters from a more diverse origin could also enlarge the range of DOM characteristics (e.g., DOC, A254, SUVA, organic matter fractions) here presented.
The extension of the application range of the models obtained will ultimately deliver a sound process prediction tool to better foresee PAC performance for microcontaminants’ adsorption in real water systems.

Supplementary Materials

The following supporting information can be downloaded at: https://www.mdpi.com/article/10.3390/w14020166/s1, Text S1 regarding PhCs quantification; Text S2 regarding the procedure used to fit the data at 1 h; Table S1: Summary of the combinations tested (PhC, PAC and secondary effluent); Figure S1: PhC initial concentrations (C0) in the samples used in batch adsorption tests and respective PhC concentrations after 1 h and 21 h contact time; Figure S2: Univariate relation between removal efficiencies of target PhCs and PACs’ textural parameters: apparent surface (BET) area (a) and supermicropore volume (b) (assays performed in SE2); Figure S3: Univariate relation between removal efficiencies of target PhCs and PhCs’ log Know; Figure S4: Univariate relation between removal efficiencies of target PhCs and PhCs’ log D7.4; Figure S5: Univariate relation between removal efficiencies of target PhCs and PhCs’ solvation energy; Figure S6: Univariate relation between removal efficiencies of target PhCs and waters’ properties; Figure S7: Univariate relation between removal efficiencies of target PhCs and waters’ electrical conductivity (identifying the PAC used in each assay); Figure S8: R2 for the 4 training sets and the 4 test sets as a function of the number of latent variables (21 h batch adsorption); Figure S9: Frequency plot of the number of latent variables selected for the 4 test sets (best two) and the average R2 for the 4 test sets as a function of the number of latent variables (21 h batch adsorption); Figure S10: AIC and R2 values as a function of the number of the model parameters (21 h batch adsorption); Figure S11: Frequency plot of the number of latent variables selected for the 4 test sets (best two) and the average R2 for the 4 test sets as a function of the number of latent variables (1 h batch adsorption); Figure S12: AIC and R2 values as a function of the number of the model parameters (1 h batch adsorption); Figure S13: Observed removals versus model-fitted removals (nine parameters model, 1 h batch adsorption); Figure S14: Standardised coefficients of the nine parameters’ model fitting (1 h batch adsorption); Figure S15. Observed removals versus model-fitted removals (five parameters model, 1 h batch adsorption); Figure S16. Standardised coefficients of the five parameters’ model fitting (1 h batch adsorption).

Author Contributions

R.M.C.V.: Funding acquisition, Conceptualization, Methodology, Investigation, Writing—Original draft preparation, Writing—Review & Editing. A.S.M.: Funding acquisition, Conceptualization, Methodology, Investigation, Writing—Original draft preparation, Writing—Review & Editing. E.M.: Investigation, Writing—Original draft preparation. M.M.: Investigation, Writing—Original draft preparation. M.A.A.: Investigation. A.P.C.: Funding acquisition, Writing—review & editing. M.J.R.: Funding acquisition, Conceptualization, Methodology, Writing—Original draft preparation, Writing—Review & Editing, Project administration. All authors have read and agreed to the published version of the manuscript.

Funding

This work was supported by the European Union LIFE Programme under Grant Agreement LIFE14 ENV/PT/000739—LIFE Impetus and by Fundação para a Ciência e a Tecnologia (FCT) grants UIDB/00100/2020, UIDP/00100/2020, UIDB/04046/2020, UIDP/04046/2020, CEECIND/02300/2017. Ana S. Mestre thanks FCT from the Assistant Research contract CEECIND/01371/2017 (Embrace Project).

Acknowledgments

The authors acknowledge Maria Almeida e Silva for helping in the development of the PLS modeling. Grupo Cecílio and Industrial Farense are acknowledged for providing the biomasses for new PACs’ preparation and Salmon (through José Montes) and SAPEC (through Ana Sofia Caldas) for donating the commercial PAC samples.

Conflicts of Interest

The authors declare no conflict of interest.

References

  1. Mestre, A.S.; Campinas, M.; Viegas, R.M.C.; Mesquita, E.; Carvalho, A.P.; Rosa, M.J. Activated carbons in full-scale advanced wastewater treatment (in press). In Advanced Materials for Sustainable Environmental Remediation: Terrestrial and Aquatic Environments (in Press); Giannakoudakis, D.A., Meili, L., Anastopoulos, I., Eds.; Elsevier: Boston, MA, USA, 2022; ISBN 0323904858. [Google Scholar]
  2. Ania, C.O.; Armstrong, P.A.; Bandosz, T.J.; Beguin, F.; Carvalho, A.P.; Celzard, A.; Frackowiak, E.; Gilarranz, M.A.; László, K.; Matos, J.; et al. Pereira, Engaging nanoporous carbons in “beyond adsorption” applications: Characterization, challenges and performance. Carbon 2020, 164, 69–84. [Google Scholar] [CrossRef]
  3. Zietzschmann, F.; Altmann, J.; Ruhl, A.S.; Dünnbier, U.; Dommisch, I.; Sperlich, A.; Meinel, F.; Jekel, M. Estimating organic micro-pollutant removal potential of activated carbons using UV absorption and carbon characteristics. Water Res. 2014, 56, 48–55. [Google Scholar] [CrossRef]
  4. Mailler, R.; Gasperi, J.; Coquet, Y.; Derome, C.; Buleté, A.; Vulliet, E.; Bressy, A.; Varrault, G.; Chebbo, G.; Rocher, V. Removal of emerging micropollutants from wastewater by activated carbon adsorption: Experimental study of different activated carbons and factors influencing the adsorption of micropollutants in wastewater. J. Environ. Chem. Eng. 2016, 4, 1102–1109. [Google Scholar] [CrossRef] [Green Version]
  5. Benstoem, F.; Pinnekamp, J. Characteristic numbers of granular activated carbon for the elimination of micropollutants from effluents of municipal wastewater treatment plants. Water Sci. Technol. 2017, 76, 279–285. [Google Scholar] [CrossRef] [PubMed]
  6. de Ridder, D.; Villacorte, L.; Verliefde, A.; Verberk, J.; Heijman, S.; Amy, G.; van Dijk, J. Modeling equilibrium adsorption of organic micropollutants onto activated carbon. Water Res. 2010, 44, 3077–3086. [Google Scholar] [CrossRef] [PubMed]
  7. Alves, T.C.; Cabrera-Codony, A.; Barceló, D.; Rodriguez-Mozaz, S.; Pinheiro, A.; Gonzalez-Olmos, R. Influencing factors on the removal of pharmaceuticals from water with micro-grain activated carbon. Water Res. 2018, 144, 402–412. [Google Scholar] [CrossRef]
  8. Guillossou, R.; Le Roux, J.; Mailler, R.; Morlay, C.; Vulliet, E.; Nauleau, F.; Rocher, V.; Gasperi, J. Influence of the properties of 7 micro-grain activated carbons on organic micropollutants removal from wastewater effluent. Chemosphere 2020, 243, 125306. [Google Scholar] [CrossRef] [PubMed]
  9. Wold, S.; Sjöström, M.; Eriksson, L. PLS-regression: A basic tool of chemometrics. Chemom. Intell. Lab. Syst. 2001, 58, 109–130. [Google Scholar] [CrossRef]
  10. Mehmood, T.; Liland, K.H.; Snipen, L.; Sæbø, S. A review of variable selection methods in Partial Least Squares Regression. Chemom. Intell. Lab. Syst. 2012, 118, 62–69. [Google Scholar] [CrossRef]
  11. Sanches, S.; Galinha, C.; Crespo, M.B.; Pereira, V.; Crespo, J. Assessment of phenomena underlying the removal of micropollutants during water treatment by nanofiltration using multivariate statistical analysis. Sep. Purif. Technol. 2013, 118, 377–386. [Google Scholar] [CrossRef]
  12. Shahmansouri, A.; Bellona, C. Application of quantitative structure-property relationships (QSPRs) to predict the rejection of organic solutes by nanofiltration. Sep. Purif. Technol. 2013, 118, 627–638. [Google Scholar] [CrossRef]
  13. Brito, R.S.; Pinheiro, H.M.; Ferreira, F.; Matos, J.S.; Lourenço, N.D. In situ UV-Vis spectroscopy to estimate COD and TSS in wastewater drainage systems. Urban Water J. 2014, 11, 261–273. [Google Scholar] [CrossRef]
  14. Flyborg, L.; Björlenius, B.; Ullner, M.; Persson, K.M. A PLS model for predicting rejection of trace organic compounds by nanofiltration using treated wastewater as feed. Sep. Purif. Technol. 2017, 174, 212–221. [Google Scholar] [CrossRef]
  15. Jones, S.M.; Watts, M.J.; Wickramasinghe, S.R. Wickramasinghe, A Nanofiltration Decision Tool for Potable Reuse: A New Rejection Model for Recalcitrant CECs. Water Environ. Res. 2017, 89, 1942–1951. [Google Scholar] [CrossRef] [PubMed]
  16. Paredes-Doig, A.L.; Sun-Kou, M.D.R.; Doig, M.E.; Comina, G. Use of mathematical algorithms to evaluate the influence of physicochemical parameters affecting the adsorption of aromatic compounds on activated carbon. Rev. Colomb. Quim. 2015, 44, 25–29. [Google Scholar]
  17. Meinel, F.; Sperlich, A.; Jekel, M. Pilot-scale study of powdered activated carbon recirculation for micropollutant removal. Water Sci. Technol. 2016, 74, 927–934. [Google Scholar] [CrossRef] [Green Version]
  18. Rosa, M.J.; Campinas, M.; Viegas, R.M.C.; Silva, C. Life Impetus Technical Guidelines for improved control of pharmaceutical compounds in urban activated sludge WWTPs. In Deliverable of LIFE IMPETUS Action D1 (Communication and Dissemination); LNEC: Lisbon, Portugal, 2019. [Google Scholar]
  19. Viegas, R.M.; Mestre, A.S.; Mesquita, E.; Campinas, M.; Andrade, M.A.; Carvalho, A.P.; Rosa, M.J. Assessing the applicability of a new carob waste-derived powdered activated carbon to control pharmaceutical compounds in wastewater treatment. Sci. Total Environ. 2020, 743, 140791. [Google Scholar] [CrossRef] [PubMed]
  20. Campinas, M.; Silva, C.; Viegas, R.M.; Coelho, R.; Lucas, H.; Rosa, M.J. To what extent may pharmaceuticals and pesticides be removed by PAC conventional addition to low-turbidity surface waters and what are the potential bottlenecks? J. Water Process Eng. 2020, 40, 101833. [Google Scholar] [CrossRef]
  21. Gaffney, V.D.J.; Cardoso, V.V.; Rodrigues, A.; Ferreira, E.; Benoliel, M.J.; Almeida, C.M. Analysis of pharmaceutical compounds in water by SPE-UPLC-ESI-MS/MS. Quim. Nova 2014, 37, 138–149. [Google Scholar] [CrossRef] [Green Version]
  22. Clesceri, L.; Greenberg, A.; Eaton, A. Standard Methods for the Examination of Water and Wastewater, 20th ed.; American Public Health Association (APHA); American Water Works Association (AWWA); Water Environment Federation (WEF): Washington, DC, USA, 1998. [Google Scholar]
  23. EN1484. Water analysis—Guidelines for the Determination of Total Organic Carbon (TOC) and Dissolved Organic Carbon (DOC); CEN: Brussels, Belgium, 1997. [Google Scholar]
  24. Chow, C.W.K.; Fabris, R.; Drikas, M. A rapid fractionation technique to characterise natural organic matter for the optimisation of water treatment processes. J. Water Supply Res. Technol. Aqua 2004, 53, 85–92. [Google Scholar] [CrossRef]
  25. Thommes, M.; Kaneko, K.; Neimark, A.V.; Olivier, J.P.; Rodriguez-Reinoso, F.; Rouquerol, J.; Sing, K.S.W. Physisorption of gases, with special reference to the evaluation of surface area and pore size distribution (IUPAC Technical Report). Pure Appl. Chem. 2015, 87, 1051–1069. [Google Scholar] [CrossRef] [Green Version]
  26. Rouquerol, J.; Llewellyn, P. Is the bet equation applicable to microporous adsorbents? In Studies in Surface Science and Catalysis; Llewellyn, P.L., Rodriquez-Reinoso, F., Rouquerol, J., Seaton, N., Eds.; Elsevier B.V.: Amsterdam, The Netherlands, 2007; pp. 49–56. [Google Scholar]
  27. ISO9277. Determination of Specific Surface Area of Solids by Gas Adsorption—BET Method, 2nd ed.; ISO: Geneva, Switzerland, 2010. [Google Scholar]
  28. Rodríguez-Reinoso, F.; Martin-Martinez, J.M.; Prado-Burguete, C.; McEnaney, B. A standard adsorption isotherm for the characterization of activated carbons. J. Phys. Chem. 1987, 91, 515–516. [Google Scholar] [CrossRef]
  29. Mestre, A.S.; Hesse, F.; Freire, C.; Ania, C.O.; Carvalho, A. Chemically activated high grade nanoporous carbons from low density renewable biomass (Agave sisalana) for the removal of pharmaceuticals. J. Colloid Interface Sci. 2019, 536, 681–693. [Google Scholar] [CrossRef]
  30. Mestre, A.; Pires, J.; Nogueira, J.M.; Parra, J.B.; Carvalho, A.; Ania, C.O. Waste-derived activated carbons for removal of ibuprofen from solution: Role of surface chemistry and pore structure. Bioresour. Technol. 2009, 100, 1720–1726. [Google Scholar] [CrossRef] [Green Version]
  31. Rosin, P.; Rammler, E. The Laws Governing the Fineness of powdered coal. J. Inst. Fuel 1933, 7, 29–36. [Google Scholar]
  32. Frisch, M.J.; Trucks, G.; Schlegel, H.B.; Scuseria, G.E.; Robb, M.A.; Cheeseman, J.; Scalmani, G.; Barone, V.; Mennucci, B.; Petersson, G.A.; et al. Gaussian 09; Gaussian Inc.: Wallingford, CT, USA, 2009. [Google Scholar]
  33. Zhao, Y.; Truhlar, D.G. The M06 suite of density functionals for main group thermochemistry, thermochemical kinetics, noncovalent interactions, excited states, and transition elements: Two new functionals and systematic testing of four M06 functionals and 12 other functionals. Theor. Chem. Acc. 2008, 120, 215–241. [Google Scholar] [CrossRef] [Green Version]
  34. Marenich, A.V.; Cramer, C.J.; Truhlar, D.G. Universal Solvation Model Based on Solute Electron Density and on a Continuum Model of the Solvent Defined by the Bulk Dielectric Constant and Atomic Surface Tensions. J. Phys. Chem. B 2009, 113, 6378–6396. [Google Scholar] [CrossRef] [PubMed]
  35. Ho, J. Are thermodynamic cycles necessary for continuum solvent calculation of pKas and reduction potentials? Phys. Chem. Chem. Phys. 2015, 17, 2859–2868. [Google Scholar] [CrossRef] [PubMed]
  36. Krasner, S.W.; Westerhoff, P.; Chen, B.; Rittmann, B.E.; Nam, S.-N.; Amy, G. Impact of Wastewater Treatment Processes on Organic Carbon, Organic Nitrogen, and DBP Precursors in Effluent Organic Matter. Environ. Sci. Technol. 2009, 43, 2911–2918. [Google Scholar] [CrossRef]
  37. Edzwald, J.K.; Tobiason, J.E. Enhanced coagulation: US requirements and a broader view. Water Sci. Technol. 1999, 40, 63–70. [Google Scholar] [CrossRef]
  38. Przepiórski, J. Chapter 9 Activated carbon filters and their industrial applications. In Interface Science and Technology; Bandosz, T.J., Ed.; Elsevier Ltd.: Oxford, UK, 2006; pp. 421–474. [Google Scholar]
  39. Ebie, K.; Li, F.; Azuma, Y.; Yuasa, A.; Hagishita, T. Pore distribution effect of activated carbon in adsorbing organic micropollutants from natural water. Water Res. 2001, 35, 167–179. [Google Scholar] [CrossRef]
  40. Kamakura, W. Kamakura’s Analytic Tools for Excel. Available online: www.katexcel.com/home (accessed on 11 October 2021).
  41. Diamantidis, N.; Karlis, D.; Giakoumakis, E. Unsupervised stratification of cross-validation for accuracy estimation. Artif. Intell. 2000, 116, 1–16. [Google Scholar] [CrossRef] [Green Version]
  42. Abu-Mostafa, Y.S.; Magdon-Ismail, M.; Lin, H.-T. Learning from Data: A Short Course; AMLBook: USA, 2012. [Google Scholar]
  43. Pierna, J.A.F.; Abbas, O.; Baeten, V.; Dardenne, P. A Backward Variable Selection method for PLS regression (BVSPLS). Anal. Chim. Acta 2009, 642, 89–93. [Google Scholar] [CrossRef] [PubMed]
  44. Malash, G.F.; El-Khaiary, M.I. Piecewise linear regression: A statistical method for the analysis of experimental adsorption data by the intraparticle-diffusion models. Chem. Eng. J. 2010, 163, 256–263. [Google Scholar] [CrossRef]
  45. Mailler, R.; Gasperi, J.; Coquet, Y.; Buleté, A.; Vulliet, E.; Deshayes, S.; Zedek, S.; Mirande-Bret, C.; Eudes, V.; Bressy, A.; et al. Removal of a wide range of emerging pollutants from wastewater treatment plant discharges by micro-grain activated carbon in fluidized bed as tertiary treatment at large pilot scale. Sci. Total Environ. 2016, 542, 983–996. [Google Scholar] [CrossRef] [Green Version]
  46. Kårelid, V.; Larsson, G.; Björlenius, B. Pilot-scale removal of pharmaceuticals in municipal wastewater: Comparison of granular and powdered activated carbon treatment at three wastewater treatment plants. J. Environ. Manag. 2017, 193, 491–502. [Google Scholar] [CrossRef]
  47. Zietzschmann, F.; Aschermann, G.; Jekel, M. Comparing and modeling organic micro-pollutant adsorption onto powdered activated carbon in different drinking waters and WWTP effluents. Water Res. 2016, 102, 190–201. [Google Scholar] [CrossRef]
  48. Campinas, M.; Rosa, M.J. The ionic strength effect on microcystin and natural organic matter surrogate adsorption onto PAC. J. Colloid Interface Sci. 2006, 299, 520–529. [Google Scholar] [CrossRef] [PubMed]
  49. Campinas, M.; Viegas, R.M.; Rosa, M.J. Modelling and understanding the competitive adsorption of microcystins and tannic acid. Water Res. 2013, 47, 5690–5699. [Google Scholar] [CrossRef]
  50. Altmann, J.; Ruhl, A.S.; Zietzschmann, F.; Jekel, M. Direct comparison of ozonation and adsorption onto powdered activated carbon for micropollutant removal in advanced wastewater treatment. Water Res. 2014, 55, 185–193. [Google Scholar] [CrossRef]
  51. Matsui, Y.; Ando, N.; Yoshida, T.; Kurotobi, R.; Matsushita, T.; Ohno, K. Modeling high adsorption capacity and kinetics of organic macromolecules on super-powdered activated carbon. Water Res. 2011, 45, 1720–1728. [Google Scholar] [CrossRef] [PubMed]
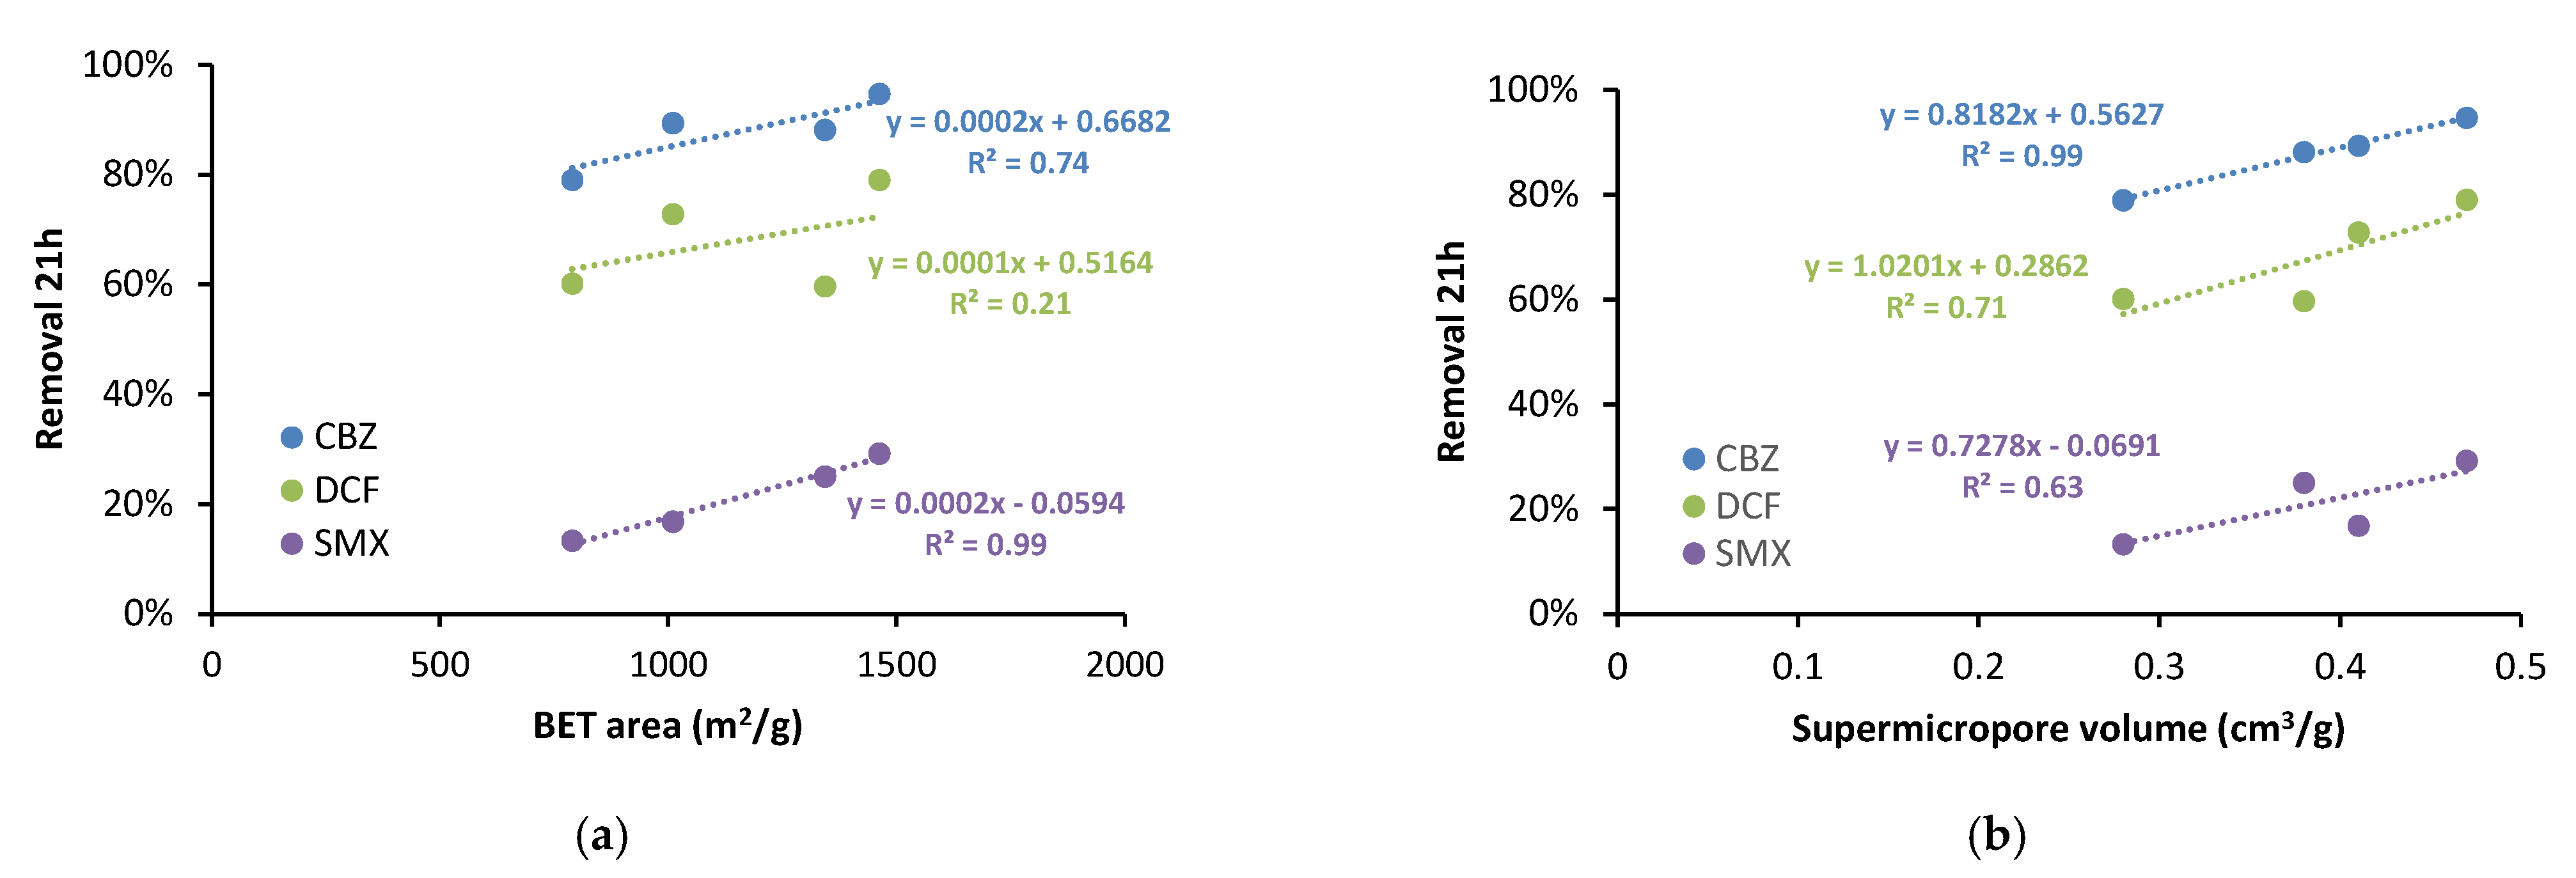
Figure 1. Univariate relationship between removal efficiencies of target PhCs and PACs’ textural parameters: apparent surface (BET) area (a) and supermicropore volume (b) (assays performed in SE6).
Water 14 00166 g001
Figure 2. Univariate relationship between removal efficiencies of target PhCs and log D7.4 values of CBZ, DCF, and SMX for assays performed in distinct WWTP effluents.
Water 14 00166 g002
Figure 3. Observed removals versus model-fitted removals (nine parameters model, 21 h batch adsorption).
Water 14 00166 g003
Figure 4. Standardised coefficients of the nine parameters’ model fitting (21 h batch adsorption).
Water 14 00166 g004
Figure 5. Observed removals versus model-fitted removals (five parameters model, 21 h batch adsorption).
Water 14 00166 g005
Figure 6. Standardised coefficients of the five parameters’ model fitting (21 h batch adsorption).
Water 14 00166 g006
Table 1. Molecular structures, therapeutic classes and optimized geometries of the extended conformation of carbamazepine/CBZ, diclofenac/DCF anion and sulfamethoxazole/SMX anion.
PhC Molecular Structure
Therapeutic Class
Optimized Geometries and Dimensions
Carbamazepine/CBZ
Water 14 00166 i001
Anti-epileptic & psychiatric drug
Water 14 00166 i002
Diclofenac/DCF
Water 14 00166 i003
Non-steroidal analgesic & anti-inflammatory drug
Water 14 00166 i004
Sulfamethoxazole/SMX
Water 14 00166 i005
Antibiotic
Water 14 00166 i006
Table 2. Physical–chemical properties of the target PhCs.
CharacteristicsCBZDCFSMX
log Kow (-)2.674.060.89
log D7.4 (-)2.281.37−0.56
Polarizability (Å3)27.630.324.8
Charge at pH 7.4 (-)0−1−1
pKa (-)13.94.05.6
Critical dimension 1 (Å)8106
Solvation energy (kJ/mol)−15−60−71
1 the shortest section of the geometry optimized for pH 7 in water medium.
Table 3. Characteristics of the secondary effluents from two WWTPs (prior to PhC spiking).
CharacteristicsSE1SE2SE3SE4SE5SE6
A254 (au cm−1)0.1630.1950.1540.2360.2160.147
A436 (au cm−1)0.0130.0200.0120.0210.0200.014
DOC (mg C/L)5.56.45.37.94.75.3
SUVA (L/(mg×m))3.03.12.93.04.62.8
vHB (mg C/L)2.53.42.73.72.52.4
sHB (mg C/L)0.61.11.32.00.91.2
nHL (mg C/L)1.00.50.60.40.30.4
cHL (mg C/L)1.41.40.71.91.01.3
pH (-)7.27.37.87.67.37.4
EC (µS/cm)1014880133013062450704
A254—presence of aromatic rings and C=C; A436—colour indicator; au—absorbance units; DOC—dissolved organic carbon; SUVA = A254/DOC; vHB—very hydrophobic, sHB—slight hydrophobic, nHL—neutral hydrophilic, and cHL—charged hydrophilic organic acids; EC—electrical conductivity.
Table 4. Textural, surface and physical properties of the commercial and lab-made PACs.
Comm1Comm2Comm3Comm4Lab1Lab2Lab3
OriginCoalBituminousCoalVegetableVegetableVegetableVegetableVegetable
ActivationSteamNASteamNASteamSteamSteam
Textural properties
Apparent surface (BET) area—ABET (m2/g)1010746790111113431463762
BET constant—CBET (-)77266272681613879831247
Total pore volume—VTotal (cm3/g)0.660.520.530.830.720.900.56
Mesopore volume—VMeso (cm3/g)
2 nm < φ < 50 nm
0.250.240.230.440.250.430.28
Total micropore volume—Vα total (cm3/g)
φ < 2 nm
0.410.280.300.390.470.470.28
Supermicropore volume—Vα super (cm3/g)
0.7 nm < φ < 2 nm
0.410.280.280.390.380.470.21
Ultramicropore volume—Vα ultra (cm3/g)
φ < 0.7 nm
0.000.000.020.000.090.000.07
Surface properties
pHPZC (-)7.48.28.07.910.19.68.0
Overall surface charge at pH 7.4 ± 0.2 * (-)0positive
Physical properties
Particle size D50 (µm)202015205555100
Apparent density (kg/m3)385417400370430372550
NA—information not available; * average pH ± standard deviation of tested secondary effluents (Table 3).
Publisher’s Note: MDPI stays neutral with regard to jurisdictional claims in published maps and institutional affiliations.