Article

Water Efficiency Households Retrofit Proposal Based on Rainwater Quality in Acapulco, Mexico

by
Mariana Martínez-Castrejón
1,
Enrique J. Flores-Munguía
1,
Oscar Talavera-Mendoza
2,
América L. Rodríguez-Herrera
1,
Omar Solorza-Feria
3,
Osbelia Alcaraz-Morales
4,
Jazmin A. López-Díaz
2 and
Giovanni Hernández-Flores
5,*
1
Centro de Ciencias de Desarrollo Regional, Universidad Autónoma de Guerrero, Privada de Laurel No. 13, Col. El Roble, Acapulco C.P. 39640, Mexico
2
Escuela Superior de Ciencias de la Tierra, Universidad Autónoma de Guerrero, Ex Hacienda San Juan Bautista s/n, Taxco el Viejo C.P. 40323, Mexico
3
Department of Chemistry, Centro de Investigación y de Estudios Avanzados del Instituto Politécnico Nacional, Av. Instituto Politécnico Nacional 2508, Col. San Pedro Zacatenco, Gustavo A. Madero C.P. 07360, Mexico
4
Facultad de Arquitectura y Urbanismo, Universidad Autónoma de Guerrero, Av. Juárez No. 38 Interior, C.U. Zona Norte, Chilpancingo C.P. 39000, Mexico
5
CONACYT-Escuela Superior de Ciencias de la Tierra, Universidad Autónoma de Guerrero, Ex Hacienda San Juan Bautista s/n, Taxco el Viejo C.P. 40323, Mexico
*
Author to whom correspondence should be addressed.
Water 2022, 14(18), 2927; https://doi.org/10.3390/w14182927
Submission received: 9 August 2022 / Revised: 13 September 2022 / Accepted: 14 September 2022 / Published: 19 September 2022
(This article belongs to the Special Issue Green Infrastructure as a Technology for Rainwater Retention)

Abstract

:
Climate change, urbanization, and population growth, particularly in urban areas such as Acapulco, Mexico, put pressure on water availability, where although surrounded by water, the inhabitants lack enough good-quality water, especially in the rainy season. In addition, water scarcity, socioeconomic factors, and infrastructure problems limit the satisfaction of water demand in this context, e.g., operational issues in the water treatment plants and problems in the distribution network caused by hurricanes. The objectives of this research were: (i) to determine the rainwater quality in Acapulco, Mexico; (ii) to propose a domestic water efficiency retrofit (WER) design implementing a rainwater harvesting system (RWHS); and (iii) to determine the RWHS efficiency in terms of economic savings, considering rainwater’s social acceptance for domestic consumptive uses. The WER design was developed in an SFH in Acapulco, Mexico. The RWHS catchment surface area was 29 m2. The device comprises a first-rain separator (20 L) and a storage tank (1200 L). The rainwater harvesting potential (RWHP) was evaluated during the 2020 and 2021 rainy seasons, whereas the harvested rainwater quality (HRWQ) was analyzed in samples from 2021. Alkalinity, pH, electrical conductivity, total dissolved solids, chlorides, nitrates, sulfates, and heavy metals and potentially toxic metalloids were analyzed. Additionally, 168 surveys were applied to SFH owners to evaluate WER acceptance. Results showed that the RWHP was ca. 44 and 21 L/m2 in 2020 and 2021, respectively. All the rainwater quality parameters met the World Health Organization guidelines for consumptive uses except for drinking water. The perception study showed a 95% willingness to adopt the WER. Due to the RWHP and the HRWQ, the WER of SFHs is a promising solution to address Acapulco hydric stress under the nature-based solutions approach.

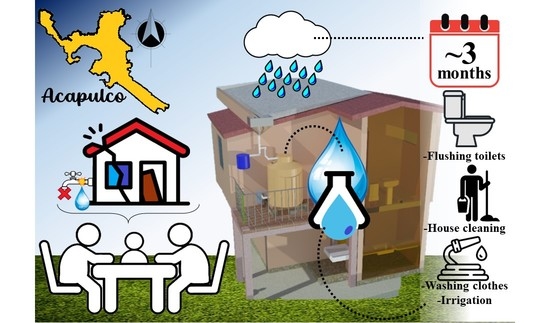
Graphical Abstract

1. Introduction

The availability of quality water is determinant for the existence of life and the development of society [1]. The availability of freshwater of sufficient quality in large cities is a social challenge [2,3]. The global freshwater shortage highlights the need for permanent access and rational use of water resources [4]. Accelerated population growth decreases per capita freshwater availability, threatening water security due to droughts caused by global warming [5,6]. Due to climate change, society experiences an irregular water supply due to seasonal variations resulting from increasingly erratic weather patterns that impact rainy and dry seasons, particularly in coastal areas with rugged topography. These meteorological changes affect the quality and quantity of water from natural sources and increase flooding and drought catastrophes, thus affecting society by limiting its capacity to meet its water demand. The rugged topography of the site plays a challenging role in water supply through centralized systems. In addition, the natural slopes of the terrain and the prevailing impermeable surface increase rainfall runoff, causing flooding in areas at sea level. The catastrophes caused by climate change mentioned above lead to the occurrence of water stress (WS) [7]. WS occurs when water withdrawal from natural sources exceeds natural resilience [8]. Willem-Hofste et al. [9] note that the world is increasingly facing WS-related crises. This phenomenon is aggravated by social aspects such as the limitations of municipal water managers and improper use and consumption habits of the population. [10]. In addition, land use change to generate new urban areas is one of the main factors contributing to WS [11].
The increasing demand for water in urban areas highlights the need to identify and exploit alternative sources of good-quality water [12]. According to Gleason-Espíndola et al. [13], rainwater (RW) has been the ancestral option for harvesting quality water (Figure S1, Supplementary Material).
Since the mid-20th century, interest in rainwater harvesting systems (RWHSs) and the RW chemical composition has increased in the scientific community [14]. Because of its excellent quality, captured RW from buildings has been identified as an invaluable complement to existing water supply sources from a sustainability perspective [15]. Collected RW is feasible to be used in different domestic activities and industrial processes depending on the quality it presents or acquires with its management [15]. It has been reported that RW removes atmospheric pollutants. The chemical composition of rainwater varies from site to site due to the influence of both natural and anthropogenic local factors [14,16]. In the urban context, RWHS have shown significant benefits. The urban area, dominated by impervious surfaces, presents an opportunity for the conversion of simple stormwater runoff surfaces into catchment surface areas (CSAs) for the use of this alternative water source. However, stormwater harvesting represents a societal challenge itself, towards the revaluation of rainwater. It is an opportunity for society to strengthen ancestral environmental knowledge, eliminate the perception of the health risks associated with its consumption, and become a self-managing entity of the water resource. Among the population, the reported uses for rainwater are varied; however, they have in common the objective to reduce the water quantity imported by the municipal distribution networks, i.e., from the centralized infrastructure. This indicates that rainwater harvesting systems bring benefits in terms of preserving natural water sources [17].
In the typical household, the main water consumption practices are toilet flushing, washing clothes, outdoor uses, and irrigation, accounting for ca. 80–90% of overall water usage [18]. Additional implications are part of a broader water management strategy, including individuals rationalizing and managing water collection, storage, and consumption [19]. In addition, RWHSs in urban areas can prevent the degradation of urban streams by providing an attenuating “buffer” for excess water facing extreme precipitation [15]. Water scarcity, increasing water demand, and impacts of stormwater runoff have attracted the attention of the scientific community to apply RWHSs [20]. This nature-based solution (NbS) simply collects and stores precipitated water. The systems use simple storage tanks (STs) and cisterns to contain runoff for future use [19]. In general, the RWHSs include an impermeable CSA, and a RW-conveying system to a ST.
In Mexico, in large cities, the population living in marginalized areas is that which experiences the most acute effects of WS [21]. This phenomenon is observed in Acapulco, an international tourist destination, where water supply to the tourist sector is a priority, generating a water inequity that affects the rest of the population [22]. In Acapulco the marginalized areas suffer water shortages, especially in the rainy season, due to maintenance issues in municipal water treatment plants and problems associated with the distribution network due to obsolescence of facilities or caused by hurricanes.
To the best of our knowledge, in Acapulco, no analysis of rainwater quality has been carried out to propose a system for retrofitting a single-family household (SFH) for rainwater harvesting, considering social perception. Thus, the objectives of this multidisciplinary study were: (i) to determine the rainwater quality in Acapulco, Mexico, (ii) to propose a domestic water efficiency retrofit (WER) design implementing an RWHS, and (iii) to determine the RWHS efficiency in terms of economic savings, considering rainwater’s social acceptance for domestic consumptive uses.

2. Materials and Methods

2.1. Sampling Location

The city of Acapulco is located in Guerrero, Mexico, at coordinates 16°51′ N latitude and 99°54′ W longitude (Figure 1). The prevailing climate in the region is warm and subhumid, with summer rains and an annual rainfall of 1415.0 mm. The rainy season (RS) is from May to November, and the average annual temperature is 27.6 °C [23].
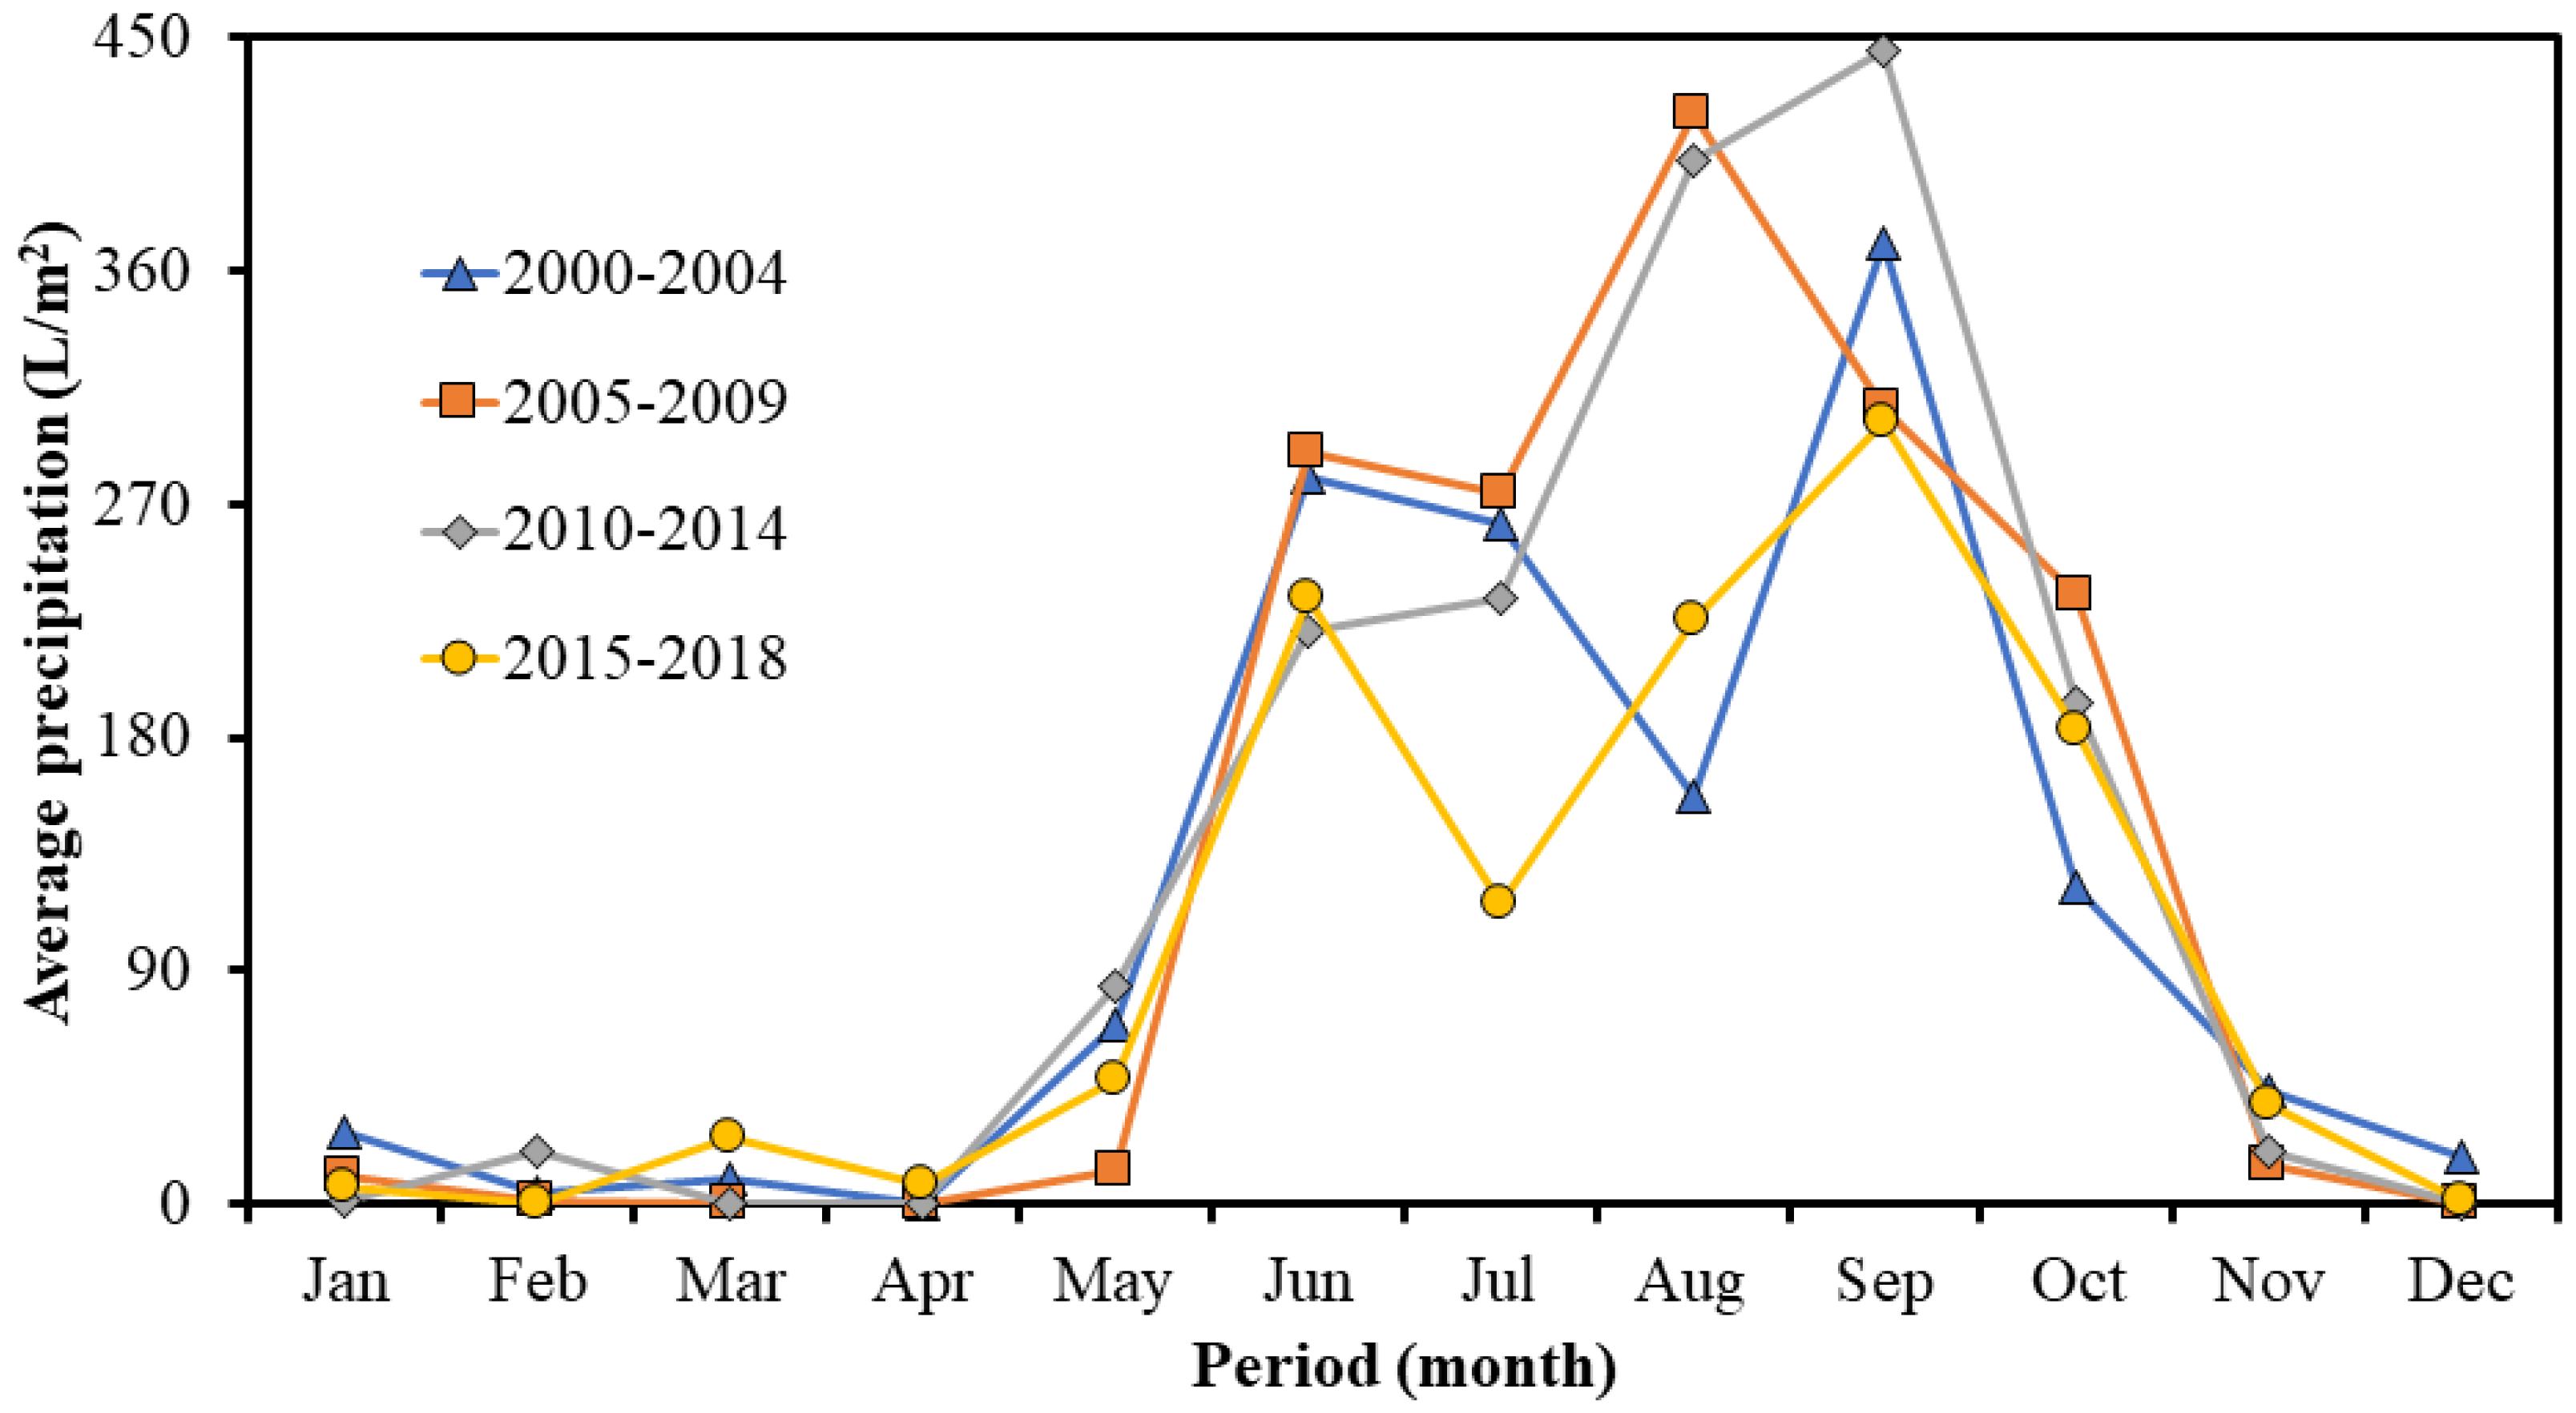
Figure 2 shows the behavior of the multiannual monthly precipitation according to meteorological station No. 12142, being the closest to the study area, and operated by Meteorological National Service [24]. Figure 2 shows the beginning of the rainy season and its end (middle of May to mid-November). On the other hand, September is the month with the highest rainfall, followed by August. In Acapulco, the most extended period without rain since 2000 has been 22 consecutive days during the 2019 RS [24]. In addition, according to local newspaper reports, water outages by the Acapulco Drinking Water and Sewerage Commission (CAPAMA) vary from ~48 h to ~2 months during the RS [25,26].

2.1.1. Characteristics of a Pattern Single-Family Household

The BGA-2736 was originated as a popular colony intended to satisfy the housing needs of state workers. This social-production housing was built in the 1970s. Three different prototypes were designed and built for this area. Some inhabitants have modified the dwellings according to their spatial needs; however, the study area presents some that have not modified their original characteristics, and their structural and hydrosanitary installations require maintenance, such as the pattern single-family household (PSFH).
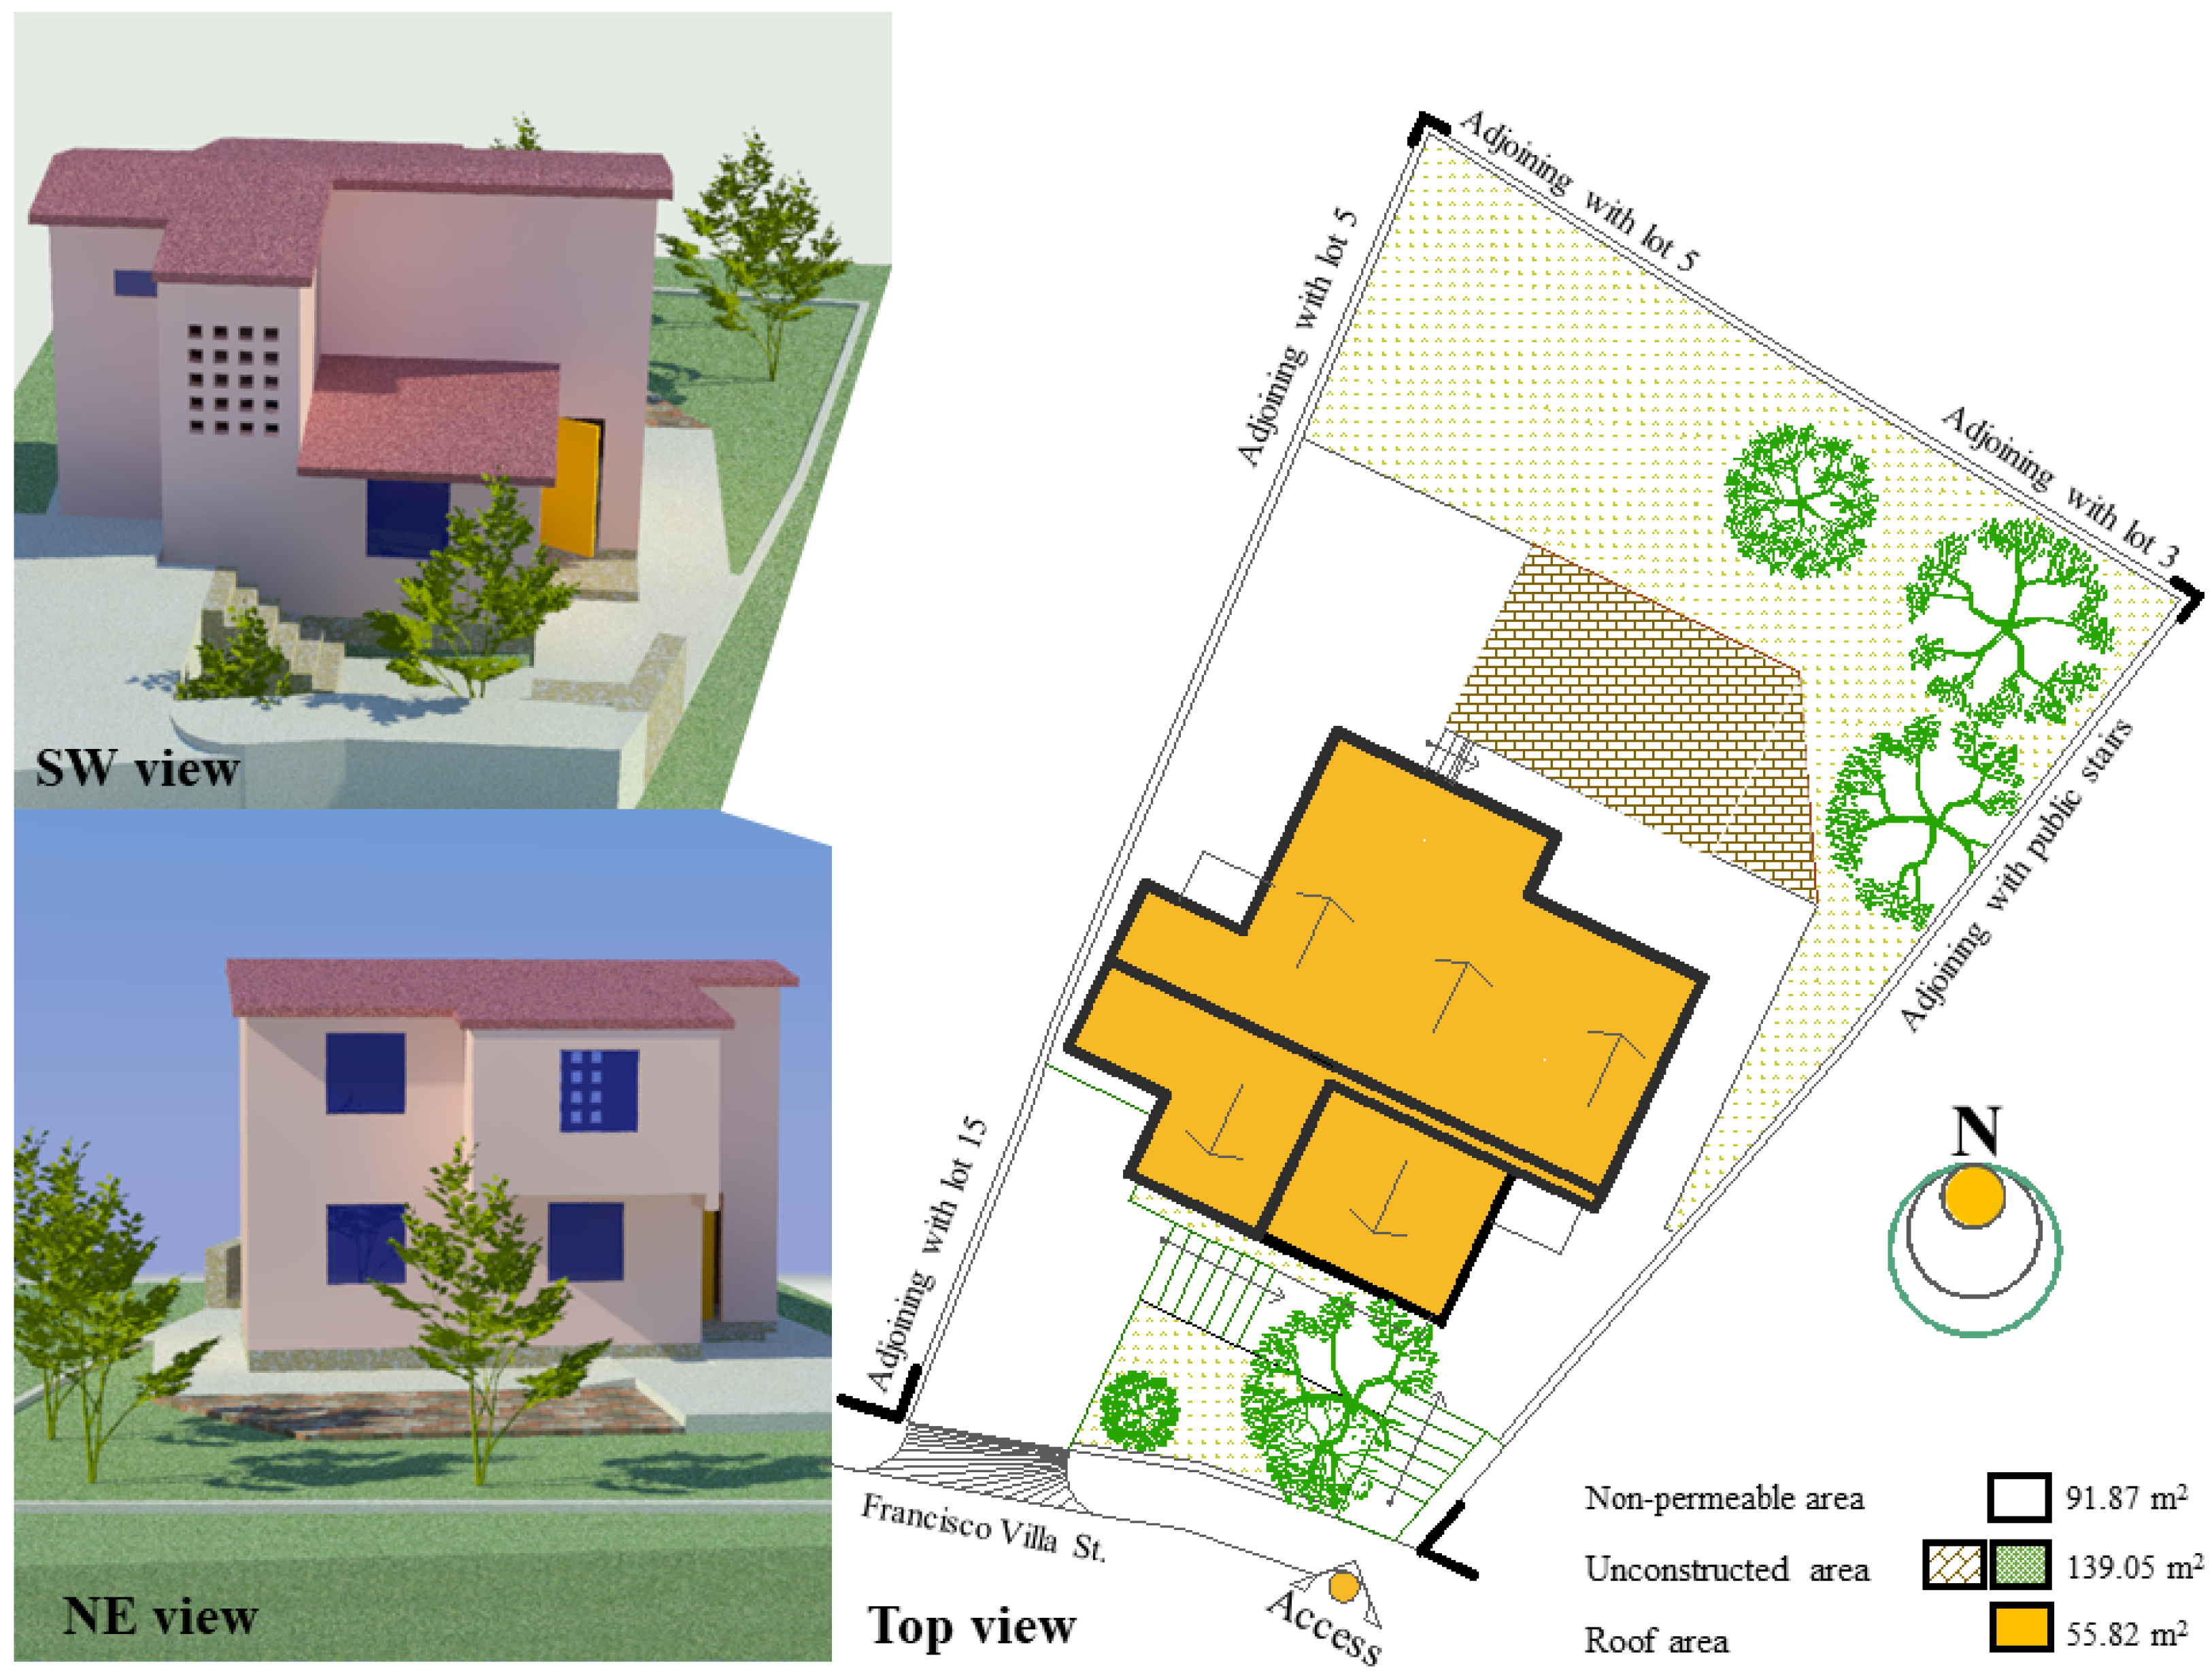
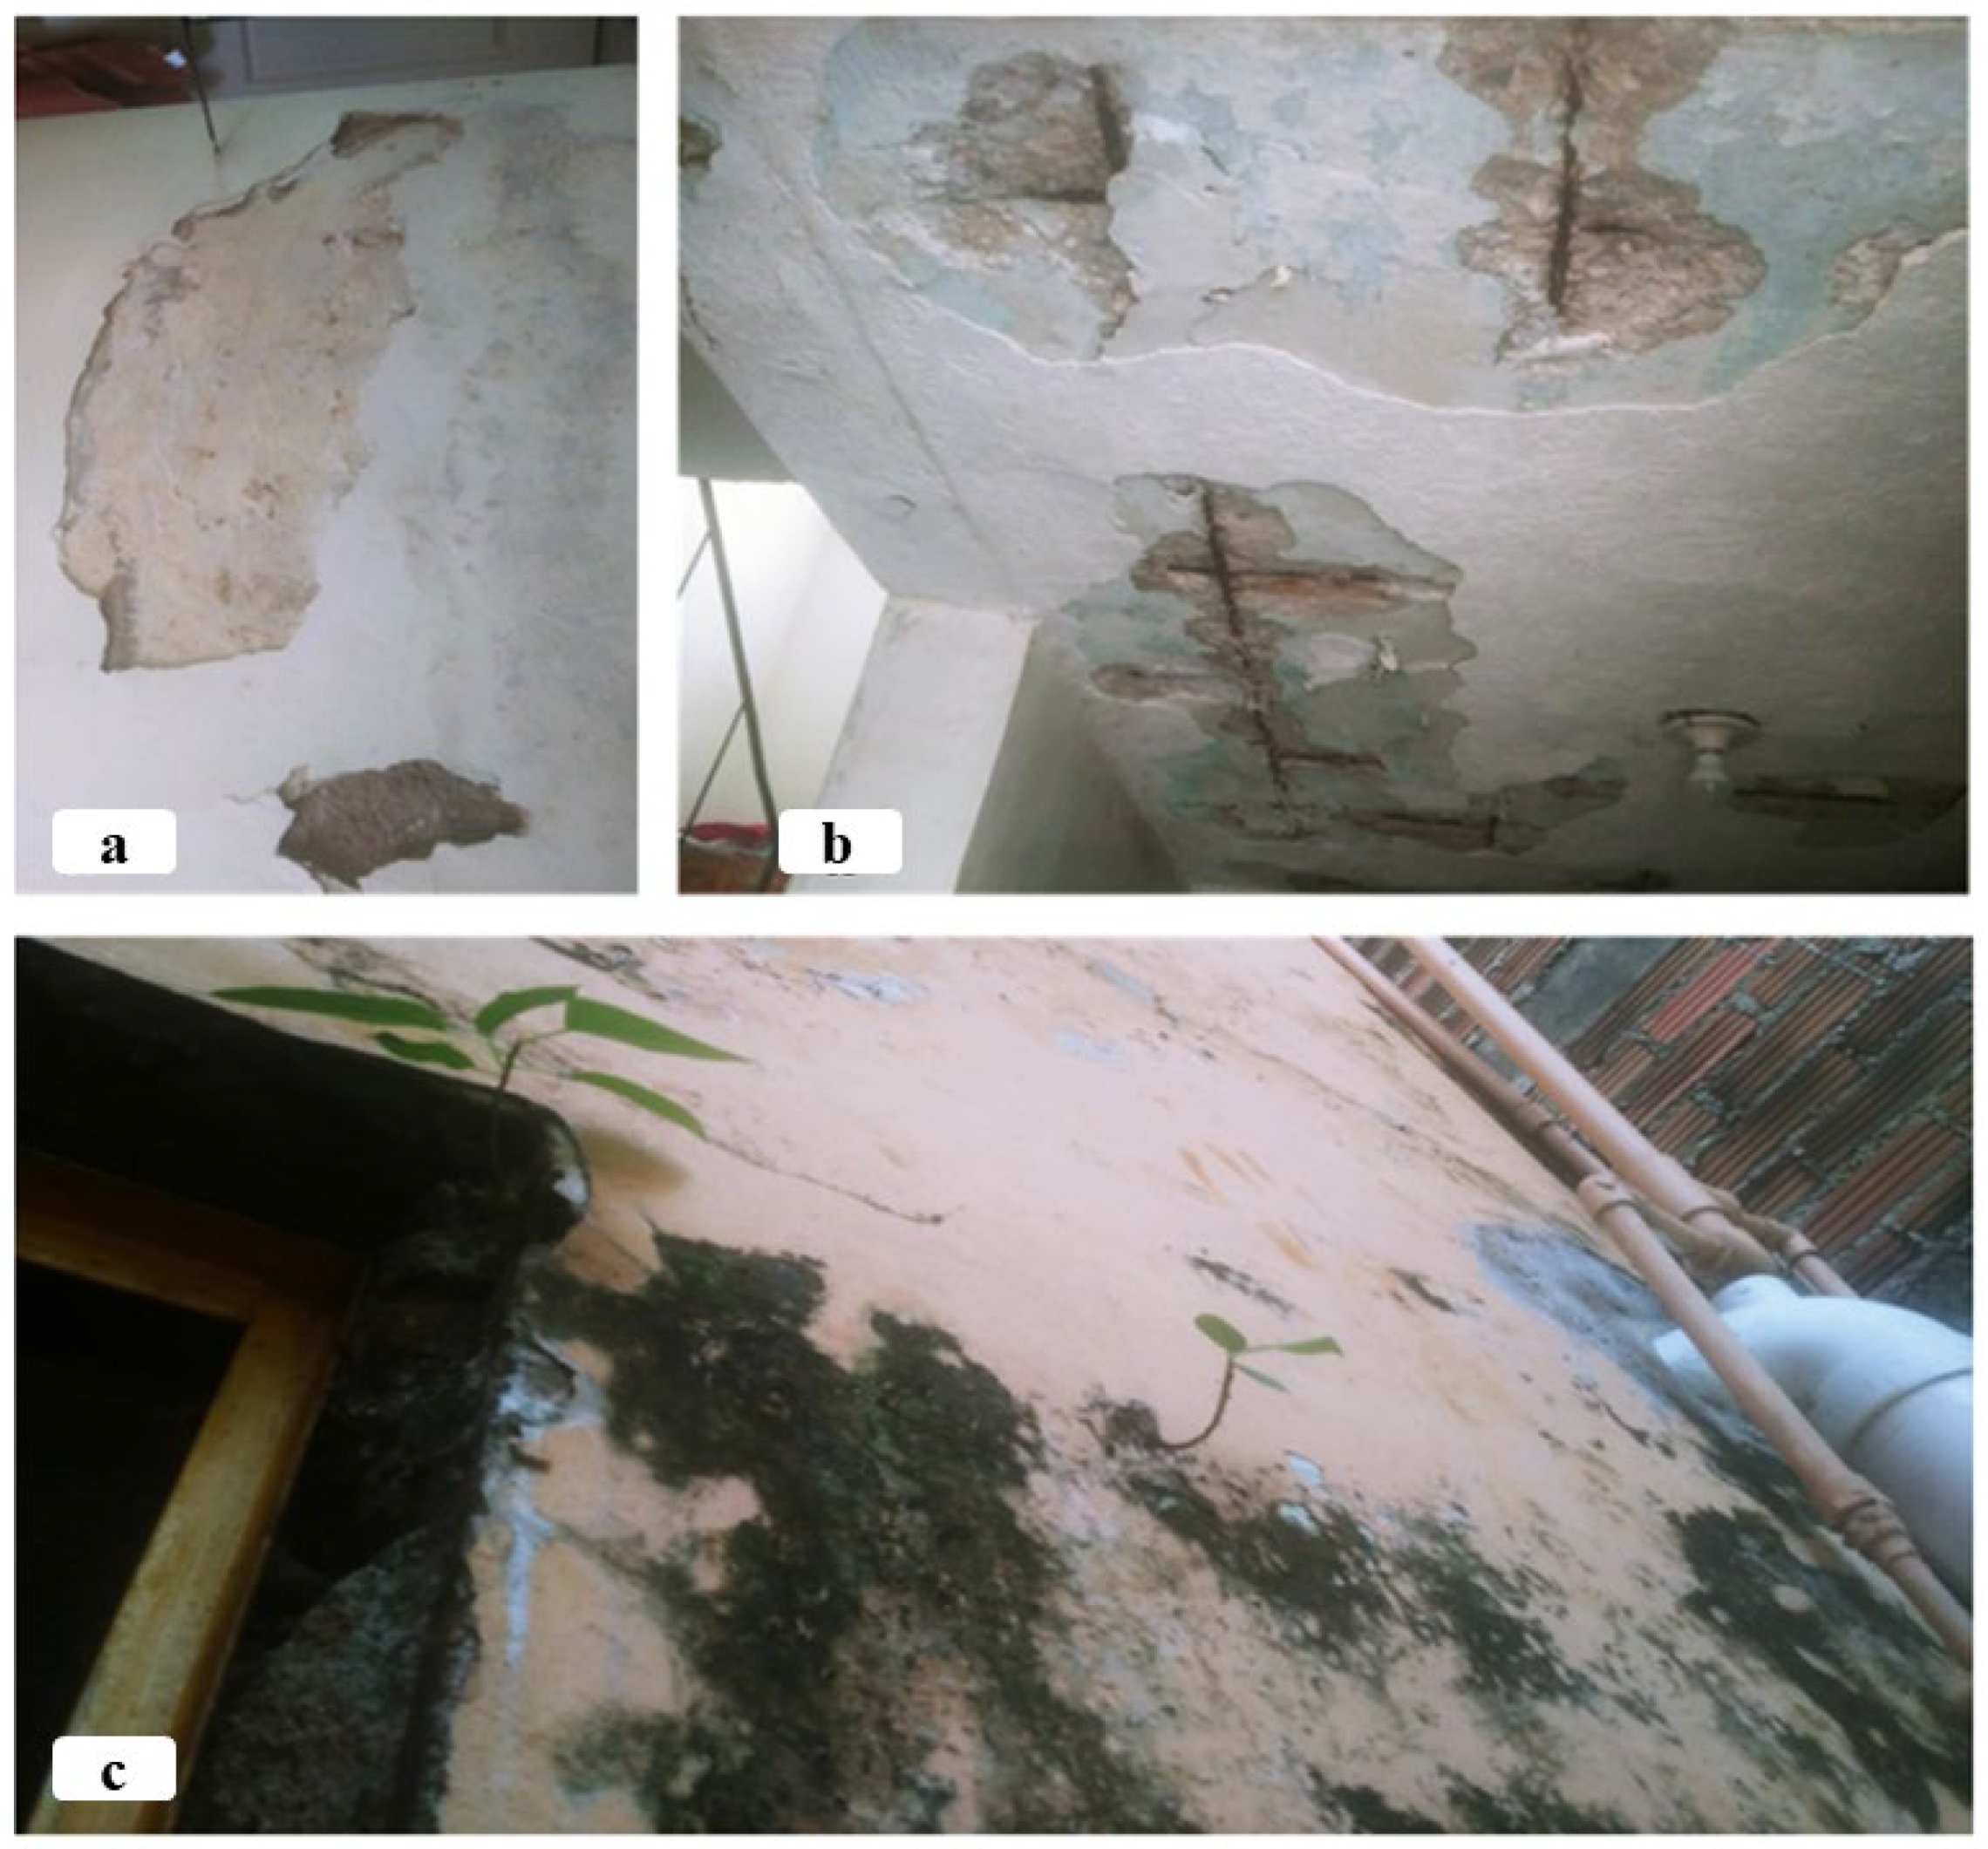
The PSFH is located within the BGA-2736 southwest of Acapulco, Gro., Mexico (Figure 1) [23]. The PSFH site has a total surface area (SA) of 252.78 m2 (55% is a permeable SA) having a total built area of 171.12 m2 distributed in two levels (Figure 3). The roof has a gable pitch at an angle of 15°, i.e., 27% slope and the total SA of the slab is 55.82 m2. The hydrosanitary installations of the PSFH show evident deterioration, i.e., they have reached their maximum utility life (Figure 4). In short, by preserving the original morphology of rooves unaltered and showing signs of the urgent need for hydrosanitary maintenance, the PSFH was selected as the model for the development of this work, aiming to form a cluster of study for future research with similar buildings that will be susceptible to receiving the WER.

2.1.2. Basic Geostatistical Area 2736 Socioeconomic and Urban Characterization

According to the 2020 population and housing census, there are 1362 people living in BGA-2736 and the gross density is 77.36 inhabitants per ha [27].
The same source reports a total of 645 dwellings, both single-family and multifamily, of which 385 are occupied, 181 of them are uninhabited, and 13 are for temporary use. The same population census determines that the average number of inhabitants per dwelling is 3.02.
On the other hand, the age of the inhabitants is variable; however, the highest percentage of the inhabitants (47%) is in the age range of 25 to 59 years old. There are 1069 inhabitants over 18 years old. The average level of schooling is 14 years, which means that they have studied up to the second year of high school. A total of 672 of the inhabitants of BGA-2736 aged 12 years and older are economically active, whereas 1166 inhabitants are affiliated to public health services [27]. The degree of social backwardness of the population according to CONEVAL [28] is “very low”, considering the scale as: very low, low, medium, high, and very high.
The BGA-2736 presents a total area of 17.60 ha; 21 blocks are distributed in this area of regular layout. Land use in BGA-2736 is predominantly residential, i.e., 19 of the 21 blocks have residential buildings, and in 14 of them there are only single-family dwellings. In addition, there are commercial activities in the area that are compatible with residential use, such as grocery stores. The urban equipment observed in BGA-2736 includes a medical clinic, parks and recreational areas, and equipment related to municipal water infrastructure.

Water Sources and Management

All households in BGA-2736 (450) have electricity, municipal sewerage, and piped water supplied by the municipal water utility, the CAPAMA. 94% of households have a water tank, while an additional 30% have a cistern [27].
The CAPAMA indicates that Acapulco’s drinking water supply is taken directly from the Papagayo River through a suction and pumping sump and piped to the “El Cayaco” drinking water treatment plant. The distance between the water treatment plant and the supply point on the Papagayo River is 45 km [29]. This water treatment plant is the only source of drinking water supply for the population of Acapulco and the tourist sector. Potable water is distributed throughout the municipality by means of subway pipelines. Moreover, the distance between the water treatment plant and the main potable water storage tank that supplies BGA-2736 by gravity is 18 km and is located at 185 m above sea level, whereas the water treatment plant is located at 18 m above sea level [29]. In addition, there is a sector of BGA-2736 that is located at a higher elevation than the main storage tank; therefore, there is a second 25 m3 tank located at a higher elevation than the main tank, to which water is pumped to supply the remaining houses by gravity (Figure S2, Supplementary Material). In BGA-2736, the fee applicable by CAPAMA is the “popular domestic rate”, established at 1.41 USD/m3, but depending on the consumption range it varies up to 2.69 USD/m3 [30]. However, the cost of water in Acapulco and BGA-2736 is not the problem yet. The problem is the intermittent and good-quality supply, especially during the rainy season [30].

2.2. Design of the Rainwater Harvesting Sampling System

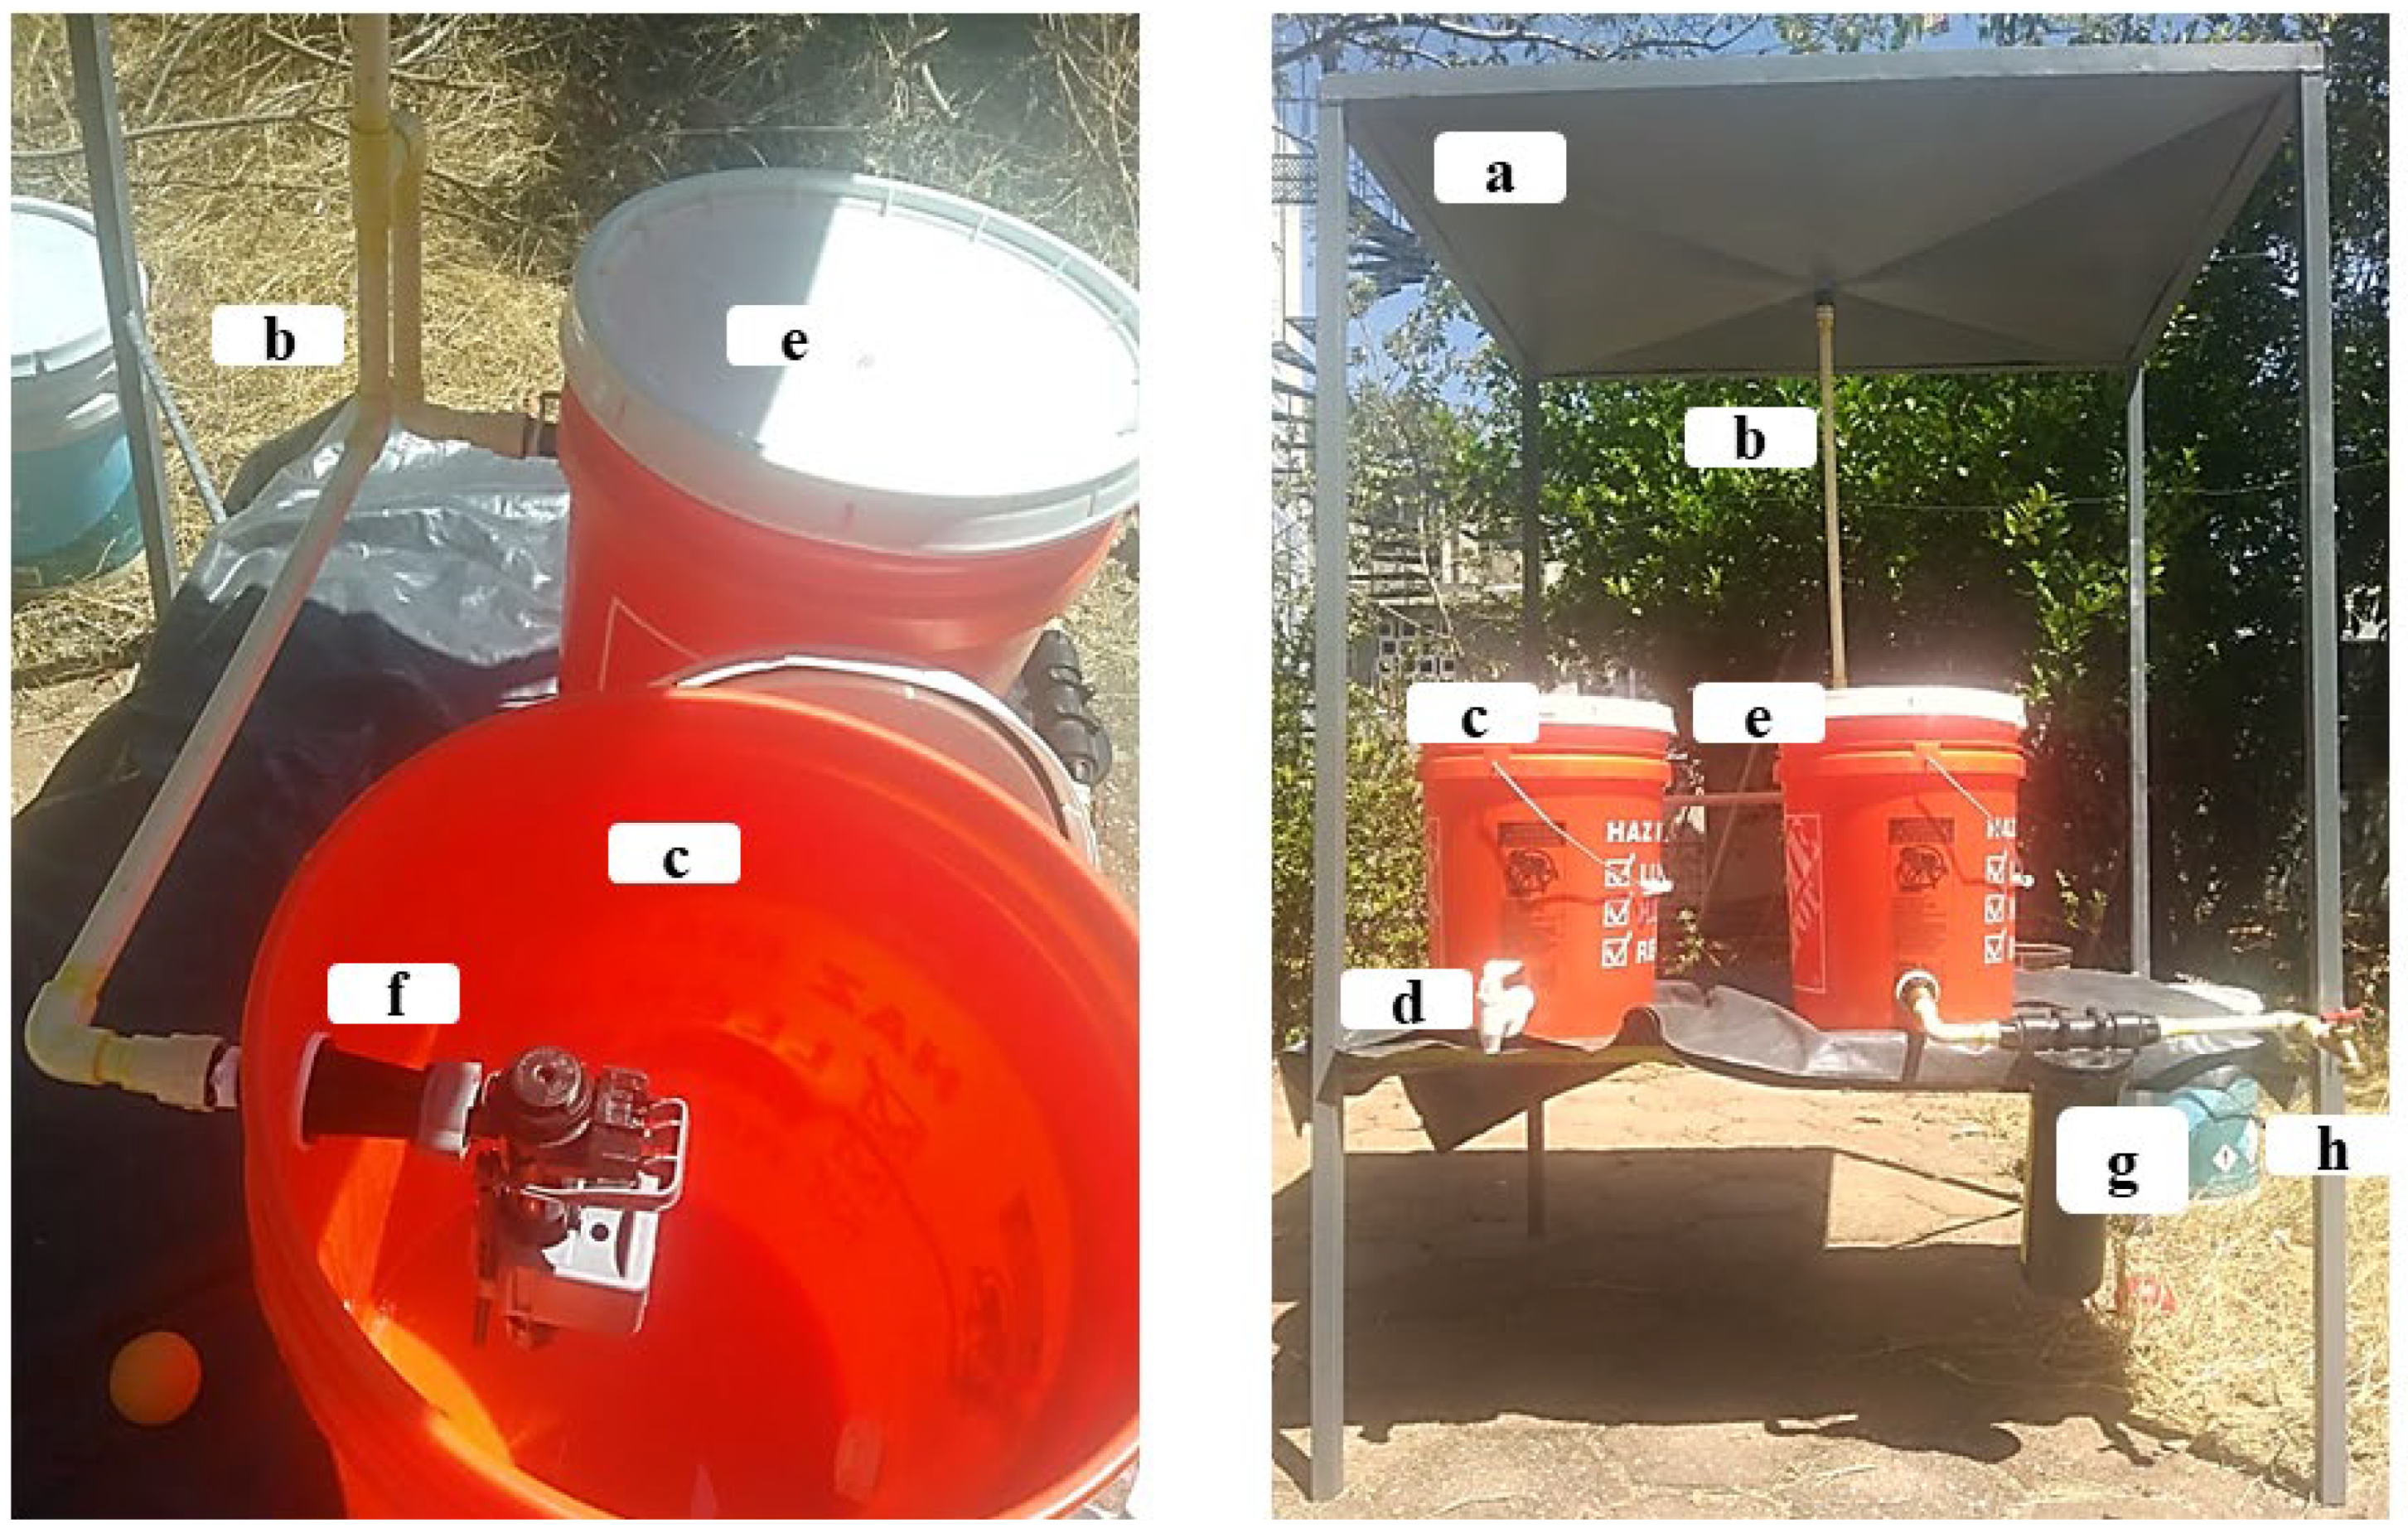
The purpose of this device was to set up a system that simulates the process, separation, and treatment of the precipitated water at the study site. The RWHSS was a device designed based on CONAGUA [31]. It operated by gravity and was installed in the PSFH (Figure 5). It has a CSA of 1 m2. After filtration, the effluent is conveyed to a container that serves as a first-rain separator (FRS). The technical guidelines for RWHSs for drinking-water purposes at the household level establish the diversion of 400 mL/m2 [31]. Once the FRS is filled, a Kerick valve allows for the automatic diversion of the flow to a 20 L ST. Finally, the ST is connected to a commercial filter packed with activated carbon mixed with synthetic fiber. The collection SA of this sampling device was made of galvanized sheet metal. The conveyance was made of ¼ CPVC pipe, and the commercial containers were made of plastic.

2.3. Rainwater Harvesting System Performance

2.3.1. Calculation of Rainwater Harvesting Potential

The rainwater harvesting potential (RWHP) was determined from the methodology established by CONAGUA [31] using Equation (1).
R W H P = S C a t c h m e n t × P A v e r a g e × K R u n o f f
where RWHP represents the volume feasible to be recovered by rainfall phenomenon (L), S C a t c h m e n t   refers to the CSA (m2), P A v e r a g e is the average precipitation (L/m2) of rainfall occurring in the RS in 24 h lapses, and K R u n o f f is the runoff coefficient (dimensionless). The K R u n o f f is a function of the cover material of the CSA according to the standard for sustainable buildings [32]. On the other hand, P A v e r a g e was measured in situ at open air by recording rainfall per phenomenon during the years 2020 and 2021. That was performed using a graduated plastic container a maximum volume of 10 L (Figure S3, Supplementary Material).

2.3.2. Water Saving and System Harvesting Efficiency

The potable water saving ( W s a v i n g ) was estimated per year considering an average rainy season and using Equation (2).
W s a v i n g = R W H P A C o n s u m p t i o n × 100
where W s a v i n g is reported in %, and A C o n s u m p t i o n is the amount of water required in the PSFH per year (L). On the other hand, the harvesting efficiency (%) is a function of K R u n o f f (Section 2.3.1) where the values of this constant range from 0 to 1.

2.3.3. Rainwater Chemical Analysis

When collected volume allowed it, two samples per rainfall event were taken during the RS. The first sample was taken from the FRS, while the second sample was collected at the outlet of the RWHS. The samples were collected in 100 and 500 mL NalgeneTM polypropylene bottles previously treated with diluted H N O 3 (8 N) and washed with deionized water. The volume collected from the FRS was 400 mL, subsequently divided into 300 and 100 mL.
In total, 49 samples came from the FRS and 39 from the RWHS outlet. The samples were stored at 4 °C. The first 300 mL of RW was analyzed for alkalinity (Alk), pH, electrical conductivity (σ), and total dissolved solids (TDS). For the consequent determinations, one pair of samples (FRS and RWHS, respectively) per period was randomly selected. In this work, a period is equal to two weeks. Using 24 samples, i.e., 12 from FRS and 12 from the RWHS, nitrates ( N O 3 ) , sulfates ( S O 4 2 ), and chlorides ( C l ) were determined; whereas to determine the concentration of heavy metals and potentially toxic metalloids (HMPTM) 15 samples of 100 mL were used—8 and 7 from FRS and RWHS, respectively.
Alk was determined by titration according to NMX-AA-036-SCFI-2001 [33]. The pH, σ, and TDS were determined using a Hi98130 pH/EC/TDS potentiometer, Hanna Instruments. Calibration of the equipment was carried out with certified solutions.
On the other hand, the quantification of N O 3 and S O 4 2 was carried out using a portable colorimeter HACH model DR/890. B a C l 2 and cadmium reduction reagents were used for sulfate and nitrate determination, respectively. The argentometric method determined the concentration of C l following the methodology established in the Mexican standard NMX-AA-073-SCFI-2001 [34]. Finally, a volume of 100 mL of RW was acidified with 0.5 mL of ultrapure concentrated H N O 3 (Ultrex II). Afterwards, 50 mL was taken and filtered using 0.45 µm cellulose nitrate filters, and an aliquot of this sample was analyzed by inductively coupled plasma atomic emission spectroscopy (ICP-AES) using a Perkin Elmer Optima 3200 DV to HMPTMs quantification. Four certified high-purity standards for wastewater were used for the ICP-AES calibration: CWW-TM-D, CWWTM-H, CWW-TM-A, and CWW-TM-E. The detection limits of the equipment are (mg/L): Cd—0.005; Ba, As, Pb, Se, Mo, and Sb—0.010; Fe, Mn, Co, and Cu— 0.025 [35].
From the outlet of the RWHS, a volume of 500 mL divided into two bottles with a volume of 400 and 100 mL was taken and stored at 4 °C. The Alk, pH, σ, TDS, N O 3 , S O 4 2 , C l , and HMPTM quantifications were also analyzed for these samples. All these parameters were evaluated following the methodology previously described for samples from the FRS.

2.4. Water Efficiency Retrofit in a Single-Family Household for the Harvesting and Use of Rainwater: Social Acceptance Evaluation

The quantitative analysis was carried out through surveys. The objective of the surveys was to measure the social willingness to WER adoption within SFH owners in the BGA-2736. Based on the characteristics of the BGA-2736 and based on the estimation made from Equation (3), 168 surveys were applied to the inhabitants of the BGA-2736 [36].
n = N × Z 2 × p q e 2 × ( N 1 ) + ( Z 2 × p q )
where n represents the sample size; N is the population size; Z is a statistical parameter that depends on the confidence level; p is the probability of occurrence of the observed phenomenon; q is a complementary value of p; and e is the maximum acceptable estimation error.
The calculation of the probability sample for the BGA-2736 considers the total number of SFHs (366), of which only 269 are inhabited. A confidence level of 95% and a confidence interval of 5% were established.
The design of the surveys (Supplementary material, Perception instrument S1 B1) was focused on finding out about water consumption, use of technologies related to sustainable water management, and willingness to implement RWHS.
From 1 March to 16 May 2021, daily walkthroughs were conducted in BGA-2736. A total of 366 single-family dwellings were quantified within the study area, of which seven were single-family dwellings with retail. In addition, 27% of the single-family dwellings were identified as unoccupied, i.e., 97 of the 366. Considering the 269 inhabited dwellings minus the PSFH, a universe of 268 surveyable dwellings was calculated. According to Equation (3) and the population size obtained from the fieldwork (268 dwellings), at least 158 surveys were necessary to obtain a representative sample. During the mentioned period (11 weeks) 168 surveys were applied (10 surveys more than the minimum required to obtain a representative sample), one per inhabited SFH. Respondents were over 18 years of age and preferably family heads. The descriptive statistics discussed in the results section were obtained using SPSS software. Finally, for the qualitative analysis, the techniques chosen for data collection were a “semi-structured in-depth interview” and “participant observation” (Supplementary material, Perception instrument S2) [37]. To obtain the qualitative results, semistructured in-depth interviews were conducted with CAPAMA personnel in treatment plants, the micrometering department, and the commercial operations unit. In addition, from January to August 2021, every official communication from CAPAMA was retrieved from its official online page about the study area and journalistic notes from local online media about citizen complaints related to the subject. On the other hand, it was possible to collect several comments from the inhabitants of the study area handwritten on the blank spaces of some of the surveys applied (Supplementary material Perception instrument S1), with free impressions on aspects of their interest related to the problems presented by the hydrosanitary infrastructure in BGA-2736.

3. Results and Discussion

3.1. Average Precipitation in Basic Geostatistical Area 2736

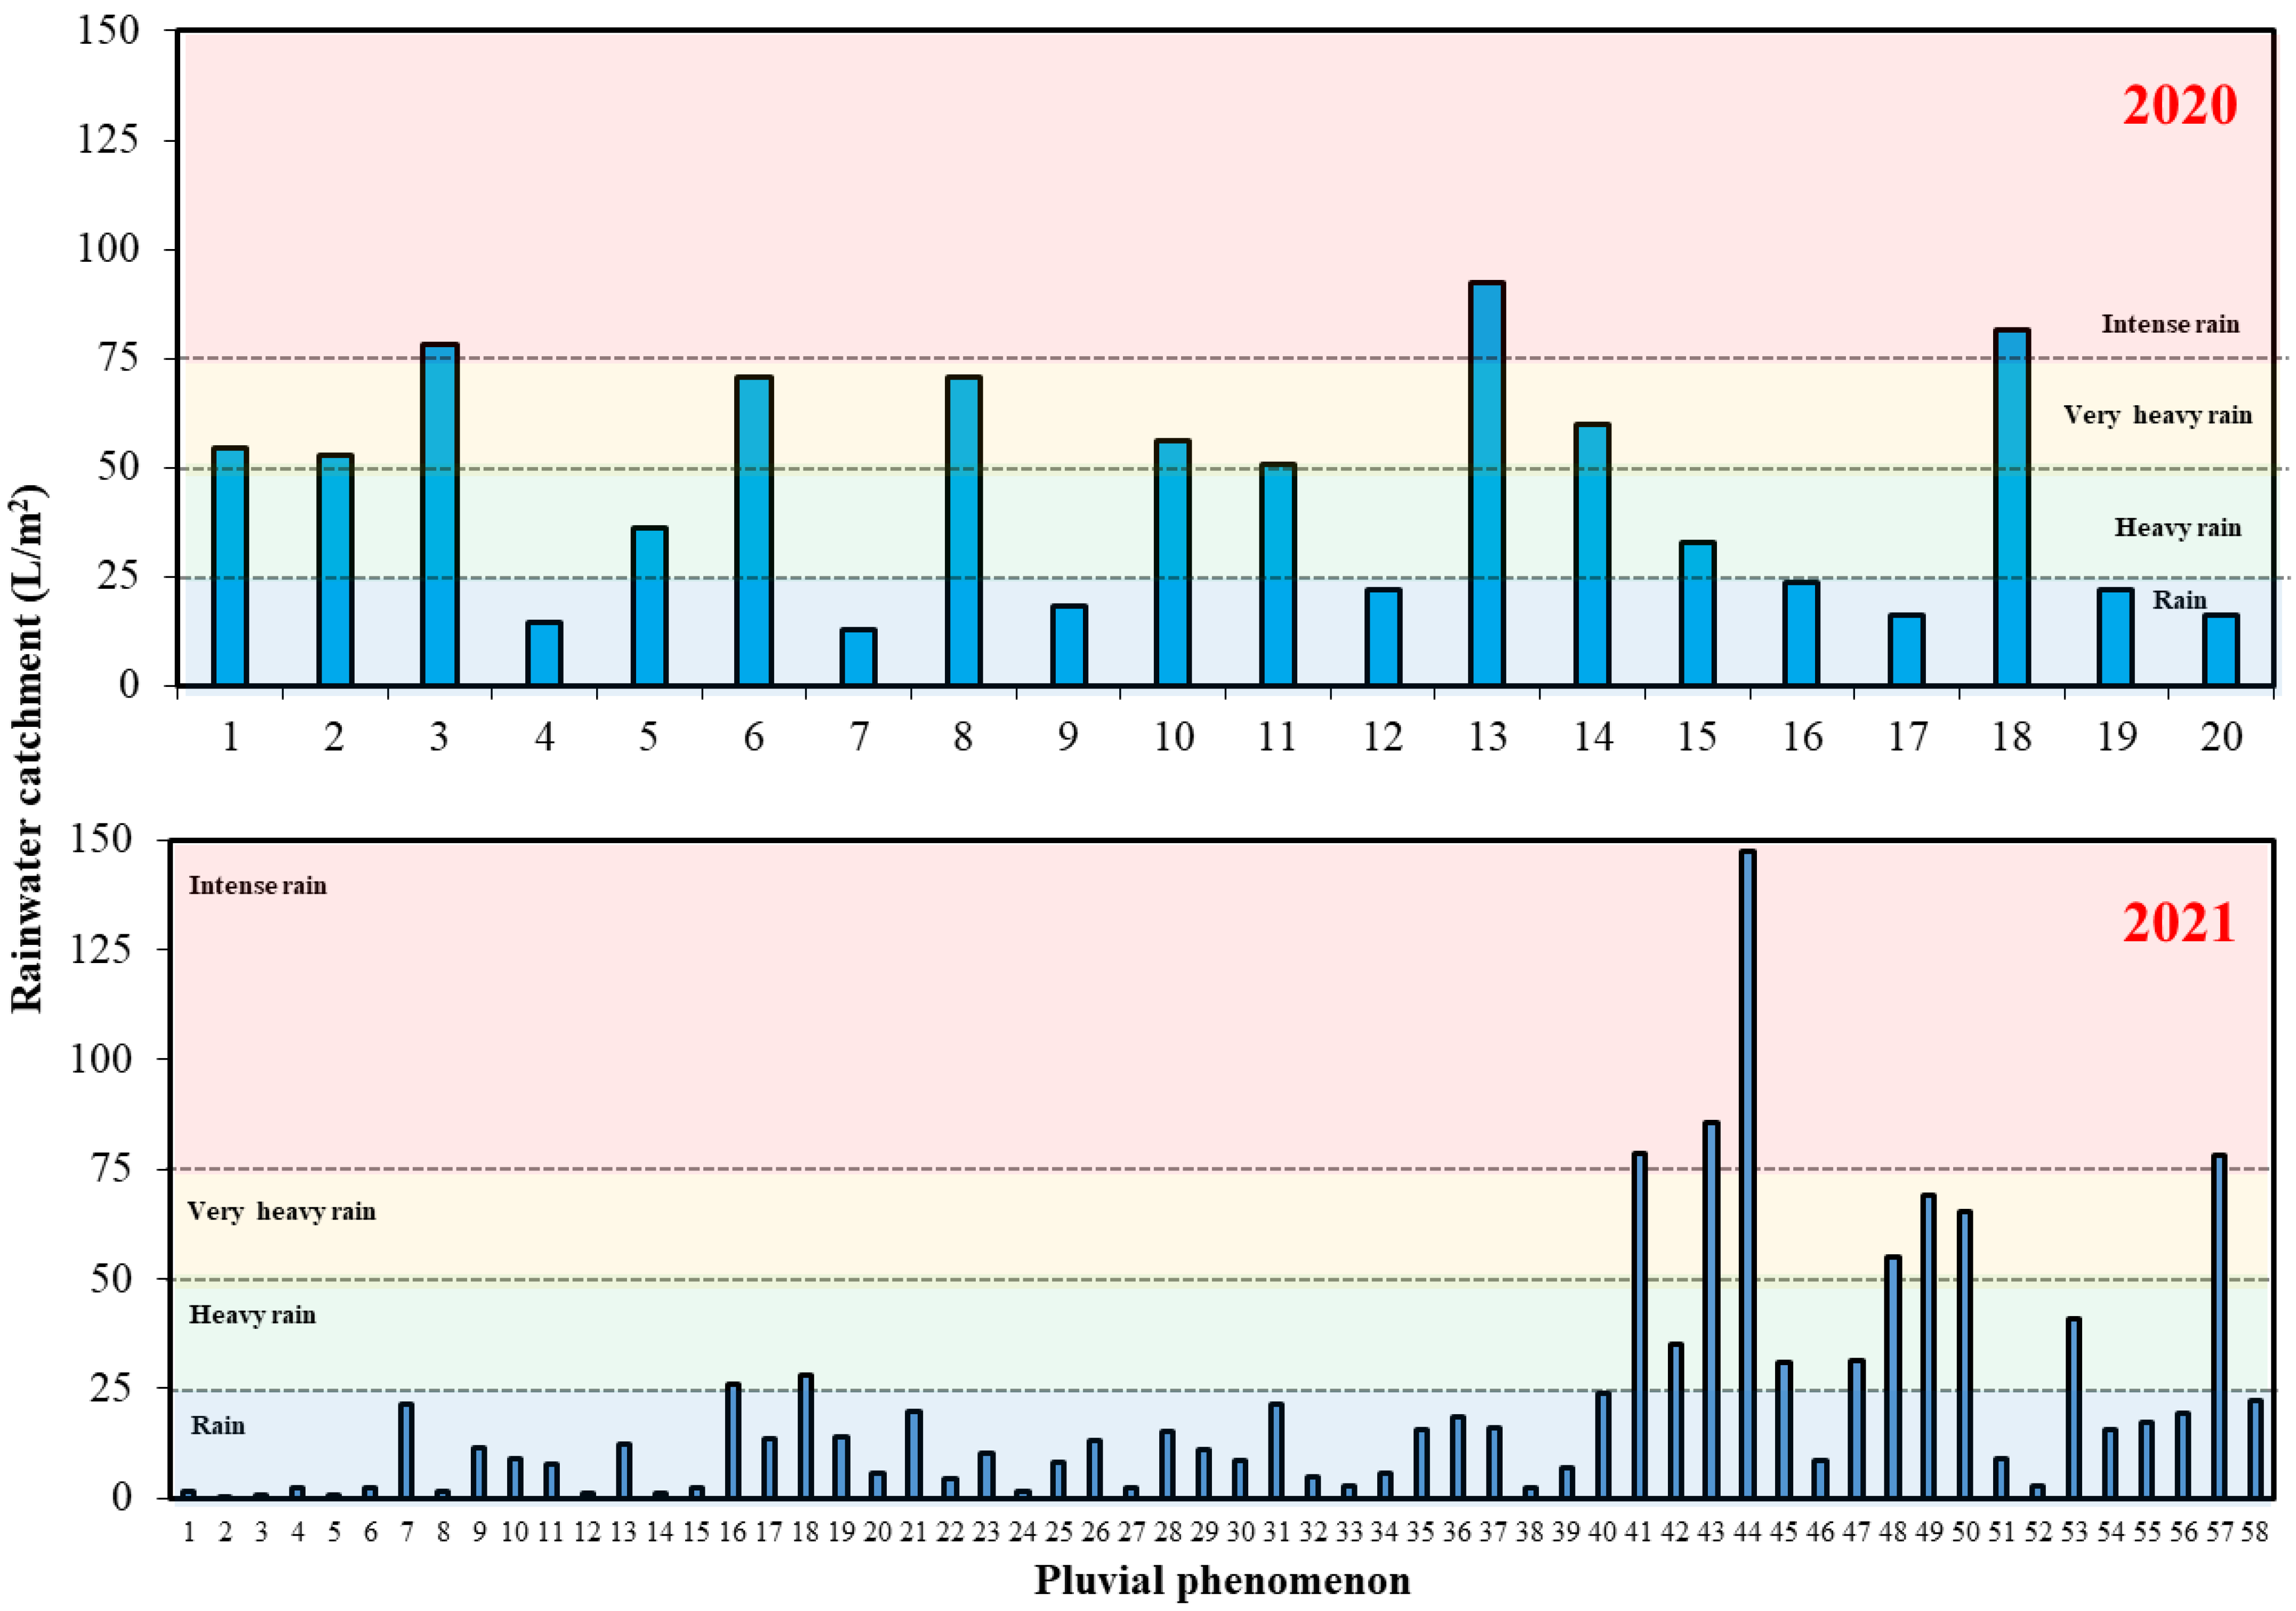
A total of 20 rainfall events were recorded in 2020; however, the P A v e r a g e in the BGA-2736 was ca. 44 L/m2 per rainfall. There is no meteorological station (MS) within the BGA-2736. The closest MS (No. 12142) reports an accumulated annual precipitation of 1449 L/m2 from 2000 to 2018, i.e., P A v e r a g e of 21.31 L/m2 (Table 1). However, there are no precipitation data for years 2019 and 2020. On the other hand, during the 2021 RS (Figure 6), 58 rainfall events occurred; this number was similar to the average reported by the national meteorological service (NMS). In this year, the P A v e r a g e was 20.51 L/m2, a value close to the P A v e r a g e reported by the NMS obtained by the MS closest to the sampling point (Table 1).
The NMS [38] classifies rainfall into six different categories (Table S1, Supplementary Material). During the 2020 RS within the BGA-2736 there were three intense, seven very heavy, two heavy, and eight slight rainfall events (Figure 6). The prevailing rainfall type in the BGA-2736 during 2020 is classified as from heavy to intense by 60% and implies an RWHP ≥25 L/m2. However, in 2020 the number of recorded rainfalls events was ca. one-third of the average rainfall events recorded by the nearest MS, and the annual accumulated rainfall was consequently lower. Despite this, the intensity of rainfall recorded for those few events magnifies the calculated P A v e r a g e (44.06 L/m2), unlike the higher number of precipitations recorded in 2021 but of lower intensity (Figure 6). This phenomenon can be explained because according to CONAGUA in 2020, Mexico experienced the most active tropical cyclone season in its history [39,40] (Table S2, Supplementary Material).

3.2. Rainwater Quality

3.2.1. pH

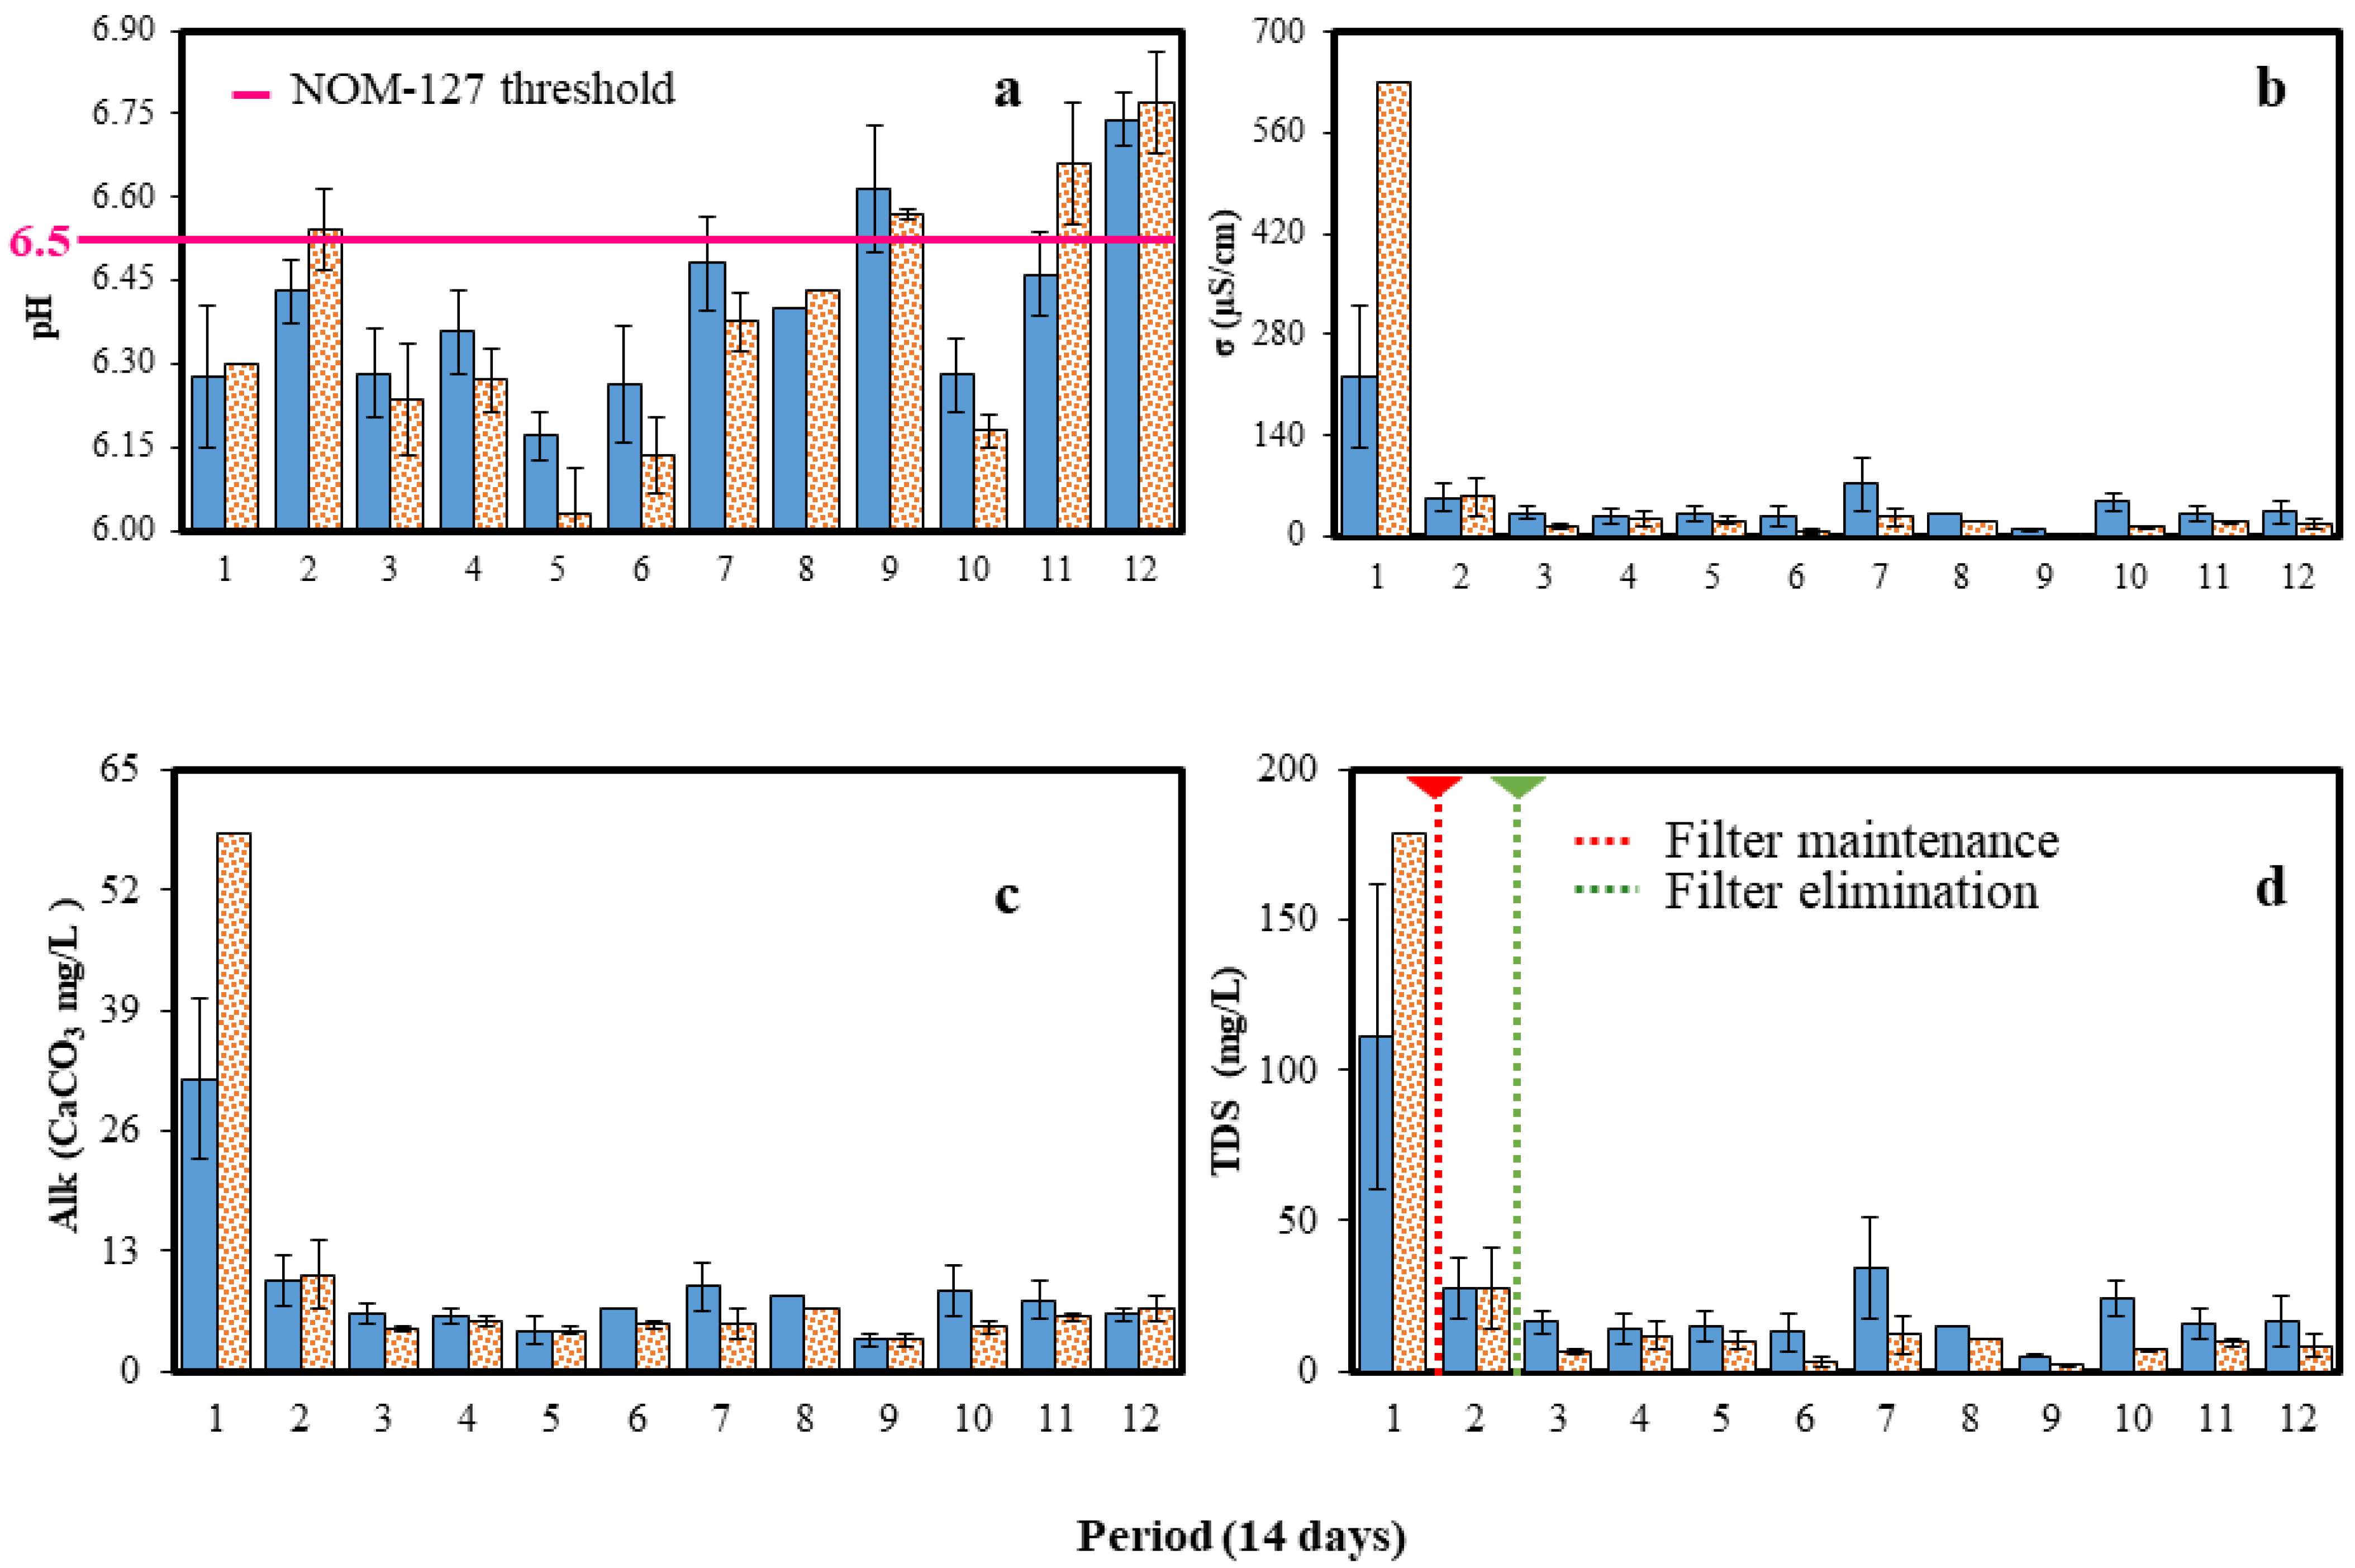
The RW collected during the first two weeks had an average pH of ca. 6.30. Afterwards, similar pH behavior was observed in the RW from the FRS and the ST (Table S3, Supplementary Material). From period 5 onwards, a slight increase in pH was observed at both sampling sites, except for period 10 (Figure 7a).
The RW sampled at the ST in periods 9, 11, and 12 presented pH values within the NOM-127- SSA1-2021, 6.57, 6.66, and 6.77, respectively. NOM-127-SSA1-2021 is the official Mexican standard that establishes the maximum permissible quality limits for water for human use and consumption [41]. NOM-127-SSA1-2021 establishes a desirable pH range of 6.5 to 8.5 units, whereas the World Health Organization (WHO) does not consider an optimal pH value [42] (Table 2). The RW collected in the PSFH was slightly below this range (Figure 7a). In general, an increase in pH was observed from the second half of the rainfall period sampled. This phenomenon can be attributed to the effect of “washing out of the atmosphere.” During the dry season, the concentration of gases emitted by different anthropogenic activities (e.g., N O 2 , S O 2 , C O 2 ) tends to increase in the atmosphere, causing air pollution problems [43]. The first rainfall events of the season favor the solubilization of the mentioned gases, and even in some cities favors the formation of acid rain; the concentration of these gases in the atmosphere decreases after the first rainfall [43]. The study site is not an industrial city; the topography and climate prevent the accumulation of gases associated with acid rain.
The pH values of 64 and 67% of the samples from the FRS and the ST were found below 6.5. The pH range in the FRS was 6.05–6.86, whereas in the ST, it was 5.81–6.87 (Table S3, Supplementary Material). None of the values fall within the classification of acid rain (Table S4, Supplementary Material) [44].

3.2.2. Electrical Conductivity

The highest conductivity values recorded were within the first rainfall period, 221 and 630 µS/cm for the FRS and the ST, respectively (Table S3, Supplementary Material). These values decreased drastically from the second rainfall period onwards, retaining a similar trend (Figure 7b). The σ ranges after the first rainfall period were 10–72 and 4–55 µS/cm for the FRS and the ST, respectively (Table S3, Supplementary Material). The σ is not among the parameters indicated by the NOM-127-SSA1-2021 or the WHO [41,42] (Table 2). However, Ward et al. [45] analyzed σ in RW and reported values from 44 to 261 µS/cm. Our study presents values close to the lower limit reported by Ward et al. [45].

3.2.3. Alkalinity

The results indicated that the maximum Alk presented by the RW within the BGA-2736 was 58.20 mg/L of C a C O 3 . This value was only within the first 15 days of the RS. Subsequently, a drastic decrease was observed registering values below C a C O 3 10 mg/L (Figure 7c).
Alk is not a parameter considered by NOM-127-SSA1-2021 (Table 2). However, this work considers it because it represents the capacity of water to avoid abrupt changes in pH [46] (Figure S4, Supplementary Material). If water does not possess Alk, changes in pH occur suddenly, reaching values that are unfavorable for life in most ecosystems [47].
On Earth, Alk measured in water is acquired mainly through water–rock interaction, mainly with limestone rocks, or by acid rain with other types of carbonate rock interactions, e.g., Equations (4) and (5), respectively [46].
C a C O 3 + H + C a 2 + + H C O 3
C a C O 3 + H 2 C O 3 C a 2 + + 2 H C O 3
In the case of RW, Alk is associated with the solubility of atmospheric C O 2 in RW, favoring the formation of acid rain in the form of carbonic acid ( H 2 C O 3 ), e.g., Equation (6) [43].
H 2 O + C O 2 H 2 C O 3
The H 2 C O 3 in aqueous solution is dissociated, and the dissociation provides H + and H C O 3 . Thus, Alk of RW collected in the BGA-2736 is due to the presence of H C O 3 .

3.2.4. Total Dissolved Solids

Collected water from the RWHS presented a transparent physical appearance. The absence of visible particles in the later RW samples may be due to the washing of the CSA derived from the entrainment of the first effluents. However, being unable to see suspended particles does not mean that water is free of contaminants [48]. The TDS concentration was analyzed instead of measuring total suspended solids (TSS). To remove TSS, a commercial filter was used in the RWHS configuration. This filter was replaced after the first period, and only a few retained particles were observed (Figure S5a, Supplementary Material). The new filter placed after the first period and removed in the second period showed that the harvested water had much lower TSS (Figure S5b, Supplementary Material). This result allowed for the decision to eliminate it from the system (Figure 7d).
On the other hand, the determined range of TDS was from 4.69 ± 0.52 to 111.51 ± 50.71 and from 3.32 ± 1.58 to 178.70 mg/L in the FRS and the ST, respectively (Table S3, Supplementary Material). Furthermore, a pattern similar to that observed for σ and Alk was appreciated in the evolution of the TDS concentration; after the first rainfall period, the concentration decreased drastically (Figure 7d). The TDS values recorded in RW are significantly below those established by NOM-127-SSA1-2021 (Table 2). The TDS are also not considered by WHO as well as pH, σ, and Alk (Table 2). However, analogous to NOM-127-SSA1-2021, the WHO recommends that water with a TDS concentration below 1000 mg/L be considered good-quality water [42].
Table 2. Quality of collected water compared to the parameters for different uses according to the World Health Organization and the Ministry of Health through the standards: NOM-127-SSA1-2021 and NOM-201-SSA1-2015.
ParameterSecretary of HealthWHOThis Study
NOM-127NOM-201Human ConsumptionSecond-NecessityFRSST
pH6.5–8.5NCSNCS6.44 ± 0.526.38 ± 0.08
σ (µS/cm)NCS46.21 ± 17.3986.70 ± 54.51
A l k   ( C a C O 3 mg/L)9.71 ± 2.9612.08 ± 5.16
TDS(mg/L)1000NCS22.99 ± 8.7332.00 ± 17.72
C l NCSNCS9.61 ± 2.637.30 ± 1.62
N O 3 11102.06 ± 0.541.81 ± 0.34
S O 4 2 400NCS2.08 ± 1.076.75 ± 4.58
Aluminum0.20NCS0.9018.000.016 ± 0.018<DL
Arsenic0.0250.010.010.200.006 ± 0.0010.013 ± 0.005
Barium1.30.70NCSNCS0.028 ± 0.020.053 ± 0.04
Cadmium0.0050.0030.0030.060.02 ± 0.0150.016 ± 0.005
Chromium0.050.050.051.000.007 ± 0.000.007 ± 0.00
Iron0.30NCSNCSNCS0.024 ± 0.0180.019 ± 0.008
Manganese0.150.400.408.000.006 ± 0.0030.007 ± 0.002
Nickel0.070.020.071.400.010 ± 0.000.009 ± 0.00
Lead0.010.010.010.200.006 ± 0.0010.010 ± 0.003
CopperNCS240.000.013 ± 0.0020.019 ± 0.005
Calcium NCS1.820 ± 1.13811.479 ± 7.332
Cobalt0.026 ± 0.0120.015 ± 0.005
Potassium5.303 ± 3.2562.206 ± 0.637
Magnesium0.478 ± 0.3092.37 ± 1.513
Silicium<DL0.629 ± 0.506
Strontium0.007 ± 0.0050.059 ± 0.063
Vanadium<DL
Zinc
Note(s): Data are presented as the average ± standard error, where for pH, σ, Alk, and TDS in the FRS, n = 49; whereas in the ST n = 39. For C l , N O 3 , and S O 4 2 , n = 12 from FRS and ST. Finally, for cations, n = 8 from FRS and 7 from the ST. WHO = World Health Organization [42]; NOM-201 = NOM-201-SSA1-2015 [49]; NOM-127 = NOM-127-SSA1-2021 [41]; FRS = first-rain separator; ST = storage tank; NCS = not considered by the standard; σ = electrical conductivity; Alk = alkalinity; TDS = total dissolved solids; DL = detection limit.

3.2.5. Major Anions

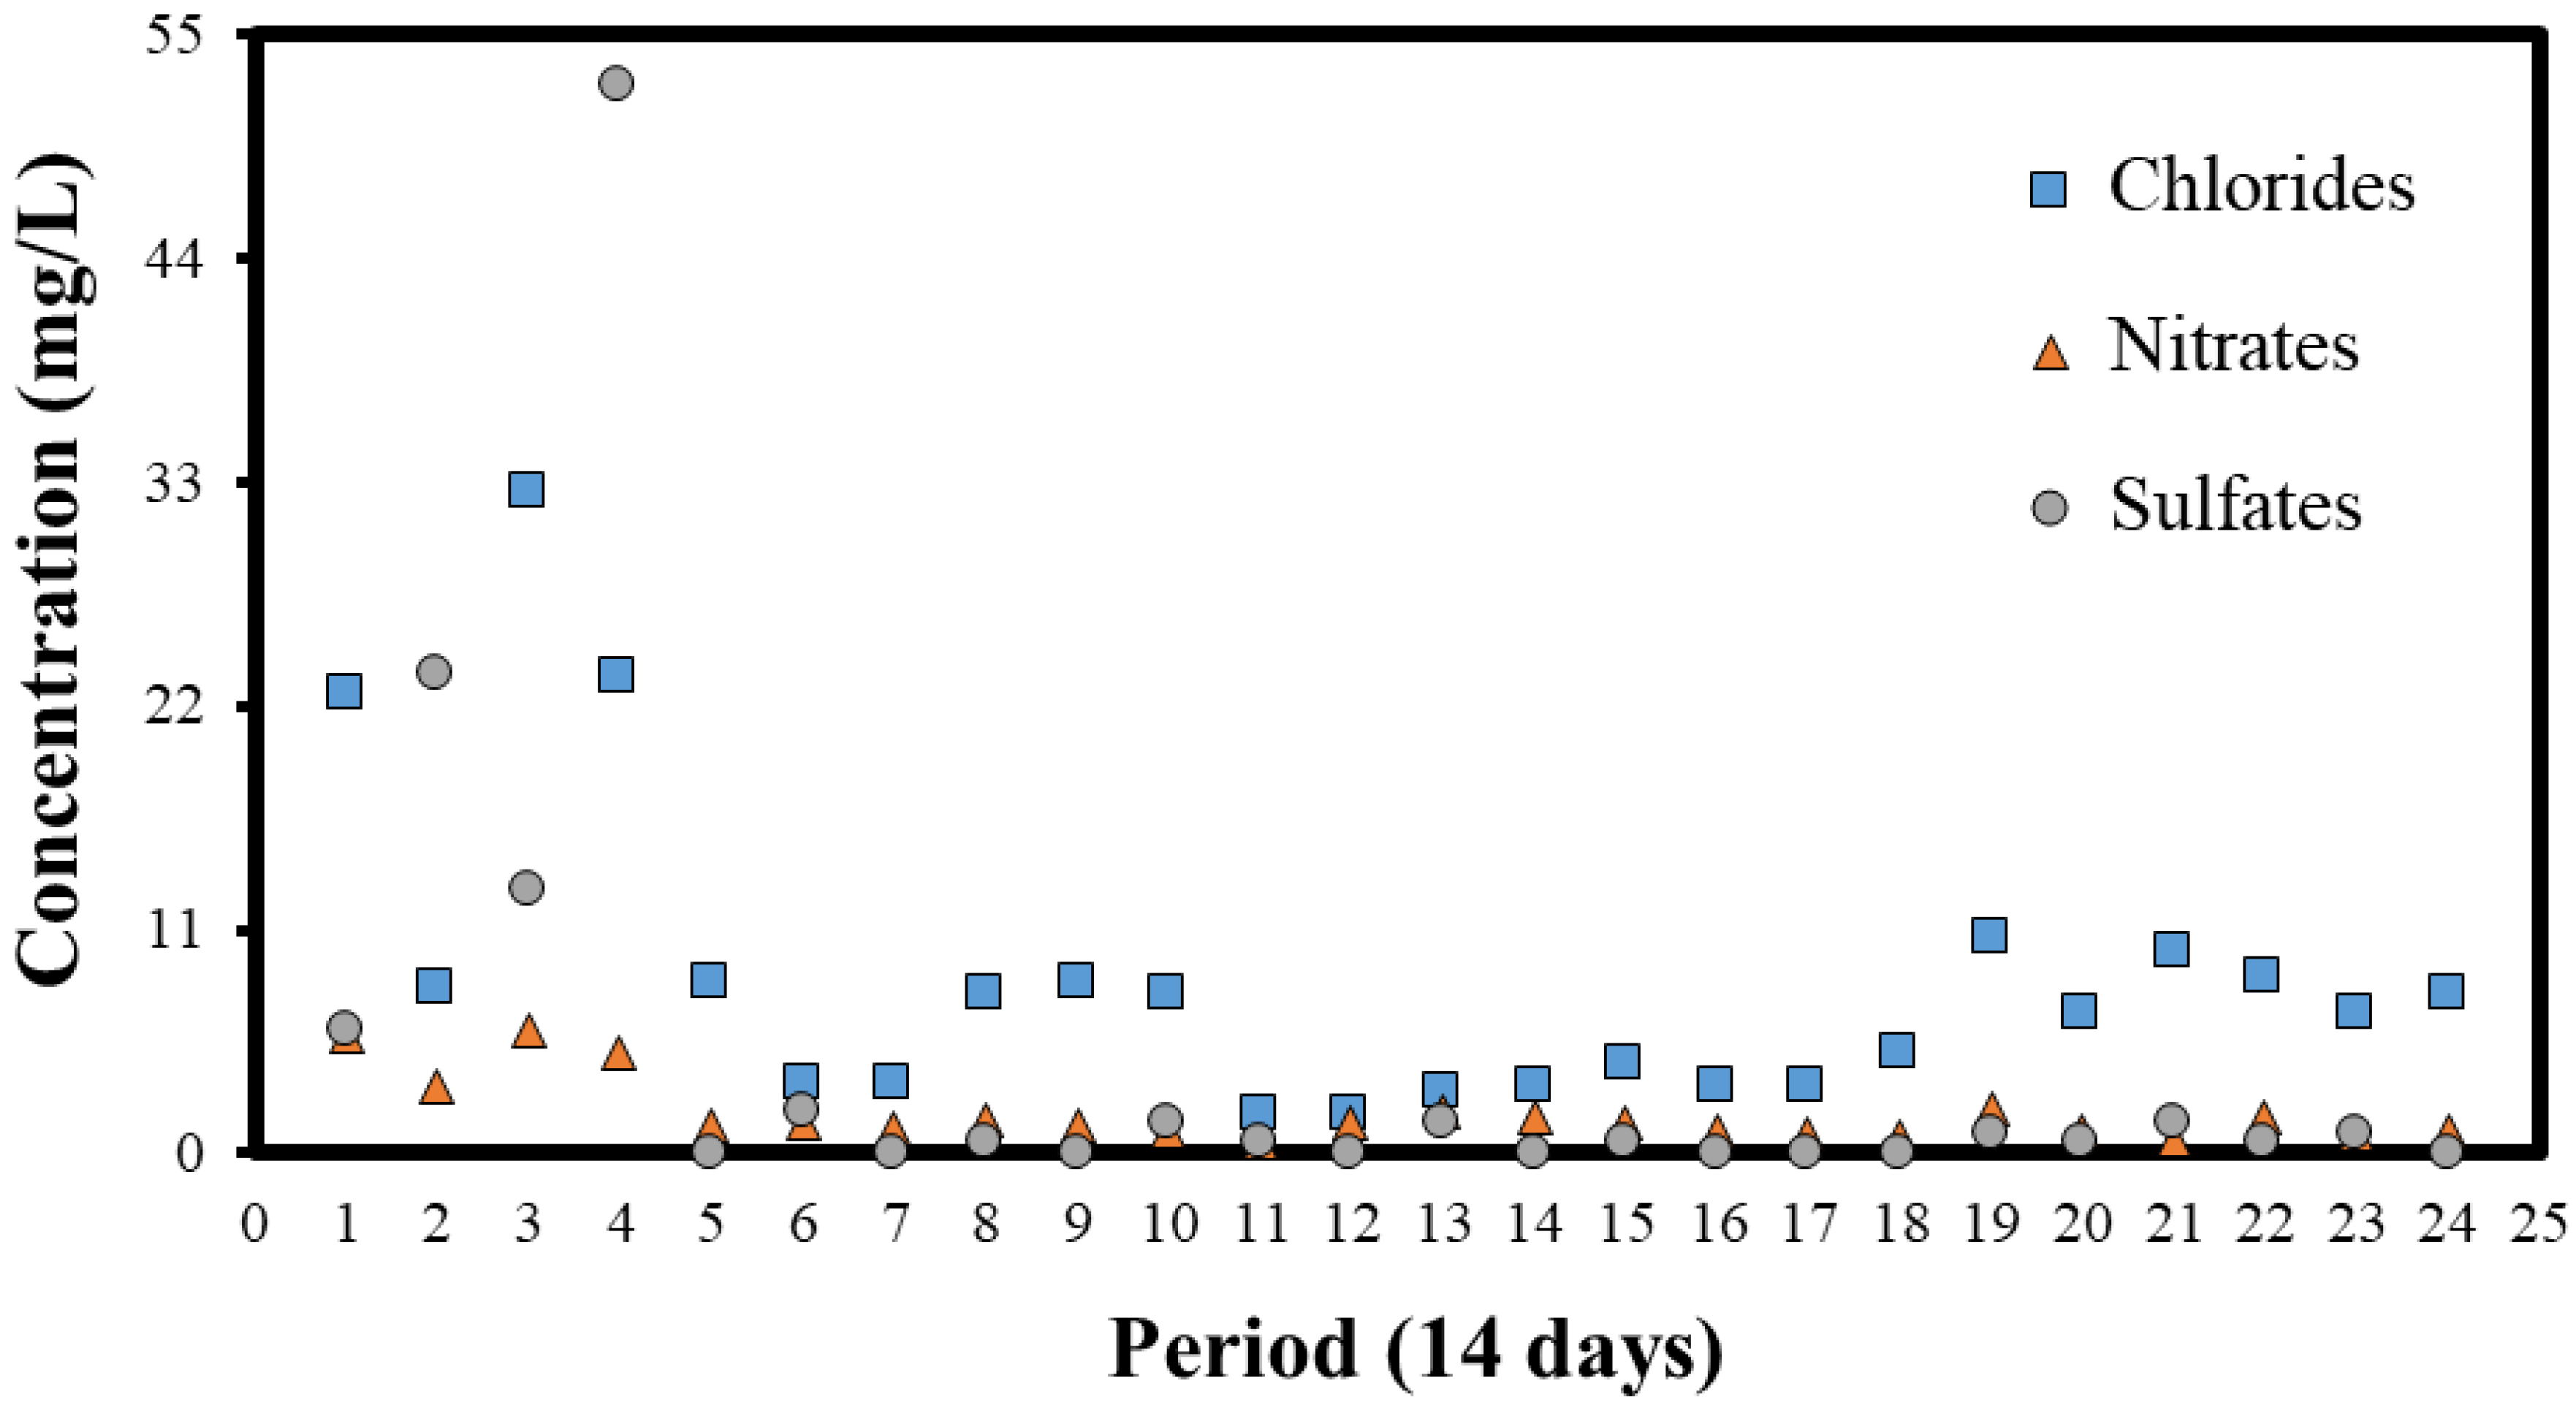
The major anions analyzed in RW were C l , N O 3 , and S O 4 (Table 3). The maximum concentration of C l was 32.51 and 23.44 mg/L in the samples collected from the FRS and the ST, respectively. These concentrations were recorded within the first two RW collection periods. After this period, the concentration of C l decreased considerably to values <10 mg/L (Table 3 and Figure 8).
In surface and groundwater, the C l content is associated with the interaction of water with minerals present in rocks and/or soil [50]. However, the minimum values of C l recorded in RW from the BGA-2736 can be explained by the atomized seawater transportation inland. The C l in moderate concentrations do not represent any danger to humans; however, the presence of C l in concentrations >250 mg/L contribute a salty taste to the water that makes it unpleasant. Ayers and Wescot [51] reported that water with a concentration of C l <140 mg/L presents no restrictions for human consumption, whereas in a range of 140–350 mg/L, the restrictions are moderate due to its unpleasant taste. Finally, the same source points out that when C l exceeds 350 mg/L, water use should be totally restricted. Despite the values mentioned by Ayers and Wescot [51] (1985), under extreme drought conditions, humans consume water containing up to 2000 mg/L of C l . Nevertheless, there are records showing that these high concentrations do not produce adverse effects due to the adaptability of the human body [52]. The WHO and NOM-127-SSA1-2021 do not establish a maximum permissible limit for C l in water for human use and consumption (Table 2).
The regulatory framework for water quality is left to the consideration of each country depending on the environmental, social, economic, and cultural context [16]. Accordingly, some parameters considered by NOM-127-SSA1-2021 [41] do not have a reference value issued by the WHO (Table S3, Supplementary Material).
RW collected within the BGA-2736 did not show evidence of N O 3 contamination (Table 3 and Figure 8). The N O 3 are other anions commonly found in surface and groundwater and are considered contaminants. This anion in elevated concentrations is associated with health problems such as methemoglobinemia, also known as “blue baby syndrome,” and some types of digestive tract cancers [53]. The maximum concentration recorded in this study was 6.03 mg/L and was observed in the FRS of the second sampling period and does not exceed the maximum permissible limit established by NOM-127-SSA1-2021 (Table 2). As the primary precursor of N O 3 , N O x origins include anthropogenic activities such as coal-fired power plants and vehicular traffic and natural inputs such as lightning and soil emissions [54,55].
Similar to C l , the WHO does not establish a reference value for N O 3 and S O 4 (Table 2). This last-mentioned anion was not found in concentrations that represent any health risk according to NOM-127-SSA1-2021 [41].
The S O 4 in the RW presented values considerably lower than the NOM-127-SSA1-2021 (Table S3, Supplementary Material). Values of up to 52.5 mg/L of S O 4 were recorded in the ST during the first two periods evaluated, values that do not represent any risk according to NOM-127-SSA1-2021 [41].
After the first month, the S O 4 values recorded decreased drastically (Table 3 and Figure 8). The S O 4 are among the most abundant ions in natural waters. In RW, they come from seawater as aerosol; S O 4 of marine origin contribute only a small fraction of the total S O 4 in rainfall.
On the other hand, from a concentration of 250 mg/L, drinking water has an undesirable taste, and in high concentrations can produce a laxative effect [42].
Overall, the concentration of major anions is significantly lower than the maximum permissible limits established by NOM-127-SSA1-2021 [41].

3.2.6. Major Cations

The presence and concentration of HMPTM were also analyzed in RW from the BGA-2736. All of the HMPTM analyzed in this work considered by NOM-127-SSA1-2021 presented concentrations below the maximum permissible limits, except for Cd (Table 2). In the RW of the BGA-2736, Cd was found in concentrations higher than the maximum concentrations established by the regulations.
Cd is an element characterized by generating health problems such as kidney damage when ingested orally and cancer when inhaled [56].
Chubaka et al. [57] evaluated the effect of ST materials on the quality of RW collected in Adelaide, Australia. The results indicated the presence of Cd at concentrations >0.003 mg/L in 11% of the RW samples. Galvanized steel and polyethylene were the materials conducive to the highest average concentration of Cd. Other HMPTM found in RW and associated with these materials were Pb, Zn, and Cu. Recent studies have shown that the construction materials of CSA play a fundamental role in the water quality collected by RWHSs. Tengan and Akoto [58] demonstrated that Aluzinc, aluminum, galvanized steel, and asbestos are adverse to preserving RW quality. Water collected using such catchment materials showed Cd, Fe, and Cr concentrations above WHO guidelines for drinking water.

3.2.7. Comparative Study of Rainwater Quality in Different Cities

Table 4 reports a series of RW quality studies conducted in Mexico. Sampling site strongly influences the physicochemical characteristics of RW since the atmosphere is an important receptor of gaseous pollutants (e.g., chemicals) and particulate matter. An example of the influence of the site on atmospheric conditions is the study carried out by Bravo et al. [59] in El Tajín, Veracruz, Mexico. They detected acidity in rainwater (pH 4.4) derived from the operation of thermoelectric plants and refineries, in addition to the transport of pollutants from nearby industrial and oil zones. Another parameter related to the precipitation site is the σ; in the case of RW characterization performed by García-Martínez et al. [14] with samples from 2006 to 2009 and by Gispert et al. [60] from 2014 to 2015 in Mexico City, it is possible to appreciate a significant σ increase over the years from 34.65 to 79.14 µS/cm. This phenomenon may be due to the population increase in the study area, which in turn increments the CO2 emissions and nitrogen compounds into the atmosphere. In contrast to this situation is the case of the characterizations carried out in rural areas, where the lower limits of σ are reported at 14.25 µS/cm. It is important to note that in cases where σ values in the rural context are elevated, it may be due to the application of pesticides and fertilizers in arable areas. In agreement with the conductivity values are the TDS. The highest TDS values are reported in densely populated areas.
Precipitation in liquid form plays a vital role in cleaning the atmosphere, i.e., it acts as a scavenging mechanism by the entrainment of pollutants present in the atmosphere [61]. Consequently, the removal of atmospheric pollutants by rainfall regulates the chemical composition and pH of RW [62]. Subsequently, these pollutants removed from the atmosphere through rainfall phenomena are deposited in surface water, soil, and plants, altering ecosystems and posing a risk to human health [63]. Other international studies present a similar pattern, i.e., HRWQ depends on the study site (Table 5). Global water quality has been deteriorated by human activity, decreasing its availability, and depending on precipitation zones is influenced by air quality [64].
The quality of the RW collected and stored depends on the characteristics of the area, such as topography, climatic conditions and proximity to pollution sources, and the construction material of the CSA and ST, as well as the management of the resource by the users. In other words, the composition of RW is influenced by the emitting source and the interaction of this vital liquid with specific components [65]. The physicochemical analyses conducted in this research showed that RW complies with most of the maximum permissible limits established by NOM-127-SSA1-2021 [41], water for human use and consumption, except for pH and Cd (Table 2). However, according to the WHO, the water in this study meets all the physicochemical quality characteristics; therefore, it can be used for all consumptive uses within a PSFH in the BGA-2736, except for human consumption.
Ward et al. [45] highlighted the importance and need to developing local-scale monitoring studies on RW quality, its interaction with specific RWHS designs, and potential health impacts. However, the authors point out that the design, roof construction, and the hydraulic materials with which the RWHS is connected are the main factors that influence the quality of the collected RW. The latter factors can be controlled by the social actors who decide to implement this nature-based solution as an RW supply mechanism.
Table 4. Quality of rainwater collected in Mexico.
ParameterStudy Site
Mexico City *Industrial AreaRural AreaCoastal Area
CU-UNAMGustavo A. MaderoNuevo León, MTYHidalgoMorelos, TlalnepantlaPuebla, San José XacxamayoHidalgoVeracruzGuerrero, Acapulco
TulaTulancingoPachucaAgua BlancaMolangoEl Tajín
Study period
2006–200920072014–20152016–201720072016–20172006–200920142016–20172002–20032021
pH5.445.86.32NR6.58NRNRNR5.017.70–10.42NRNR4.46.38
σ (µS/cm)34.65NR79.14NRNRNRNRNR14.2533–176NRNRNR 86.70
Alk ( C a C O 3 mg/L)44.79NR6.14NRNRNRNRNR36.03NRNRNRNR12.08
TDS(mg/L)NRNR52.71NRNRNRNRNRNR23–123NRNRNR32.00
C l 0.3240.3411.34NR0.625NRNRNR0.308NRNRNR0.497.30
N O 3 3.2422.641.90NR1.20NRNRNR1.30NRNRNR0.721.81
S O 4 2 6.725.9516.75NR4.29NRNRNR3.37NRNRNR0.666.75
AlNR0.910.042NRNRNRNRNRNRNRNRNRNR<LD
AsNRNR0.0030.003NR0.0040.0030.003NRNR0.0030.002NR0.01
BaNRNRNRNRNRNRNRNRNRNRNRNRNR0.05
CdNR0.02NR0.004NR0.0020.0020.001NRNR0.0020.001NR0.02
CrNR0.008NR0.035NR0.0360.0380.030NRNR0.0580.055NR0.01
FeNRNR0.0890.371NR0.4720.4060.292NRNR0.3790.448NR0.02
MnNR0.121NRNRNR0.0740.0980.075NRNR0.0530.148NR0.01
NiNR0.047NR0.019NR0.0330.0140.012NRNR0.0290.012NR0.01
PbNR0.1090.0020.033NR0.0280.0310.020NRNR0.0450.031NR0.01
Ca1.701.068.47NR9.73NRNRNR0.51NRNRNR0.2411.48
CoNRNRNR0.009NR0.0150.0170.013NRNR0.0140.013NR0.02
CuNRNR0.1060.037NRNR0.0460.041NRNR0.0320.047NR0.02
K0.0720.0840.50NR1.12NRNRNR0.017NRNRNR0.122.21
Mg0.1030.0601.820.0441.47NRNRNR0.019NRNRNR0.000962.37
SiNRNRNRNRNRNRNRNRNRNRNRNRNR0.63
SrNRNRNRNRNRNRNRNRNRNRNRNRNR0.06
VNR0.052NRNRNRNRNRNRNRNRNRNRNR<LD
ZnNRNR0.4680.952NR0.1371.8921.174NRNR0.7990.282NR<LD
References[14][66][60][67][68][67][14][69][67][59]This study
Note(s): * = Megacity; CU-UNAM = Ciudad Universitaria, Universidad Nacional Autónoma de México; MTY = Monterrey; NR = not reported; σ = electrical conductivity; Alk = alkalinity; TDS = total dissolved solids.
Table 5. Quality of rainwater harvested internationally.
ParameterStudy Site
MegacitiesRural AreaCoastal Area
ShanghaiIndiaBangladeshFranceGreeceUnited KingdomIran *China **Guerrero
pH4.696.86.726.57.63–8.87.6–10.47.24.566.38
σ (µS/cm)NR55NR56.2056–22043.5–261300NR86.70
Alk   ( C a C O 3 mg/L)NRNR500.106–48NRNRNR12.08
TDS(mg/L)NRNR12NRNR30.4–183315NR32.00
C l 0.7722.416.501.93–163–28NR0.7317.30
N O 3 2.47112.520.402.805.28–13.021.32–17.74NR1.361.81
S O 4 2 6.956.24NR1.91–13<2.5–5.3NR6.216.75
AlNR0.43NRNRNR0.08–0.11NRNR<DL
AsNRNRNRNRNRNRNRNR0.01
BaNRNRNRNRNRNRNRNR0.05
CdNR0.01NRNR<0.0001–0.0002<0.0004<0.001NR0.02
CrNR0.011NRNR<0.001–0.005<0.0005<0.001NR0.01
FeNR0.1210.11NR0.006–0.040.009–0.027NRNR0.02
MnNR0.09NRNR<0.0005–0.073<0.002–0.0032NRNR0.01
NiNR0.067NRNR<0.01–0.012<0.0015–0.0017<0.001NR0.01
PbNR0.03NRNR<0.002–0.0070.026–0.064<0.001NR0.01
Ca1.5249.24NR4.410.6–19.25.7–10NR1.4211.48
CoNRNRNRNRNRNRNRNR0.02
CuNR0.054NRNR<0.003–0.0130.22–0. 29NRNR0.02
K0.15NRNR1.200.7–3.61–2.4NR0.072.21
Mg0.2234.82NR0.270.4–2.40.36–0.58NR0.0792.37
SiNRNRNRNRNRNRNRNR0.63
SrNRNRNRNRNRNRNRNR0.06
VNR0.005NRNRNRNRNRNR<DL
ZnNR0.85NRNR<0.01–0.080.19–0.480NRNR<DL
References[70][71][72][73] [65][45][16] [74] This study
Note(s): * City on the edge of an oasis; ** coastal megacity; σ = electrical conductivity; NR = not reported; Alk = alkalinity; TDS = total dissolved solids; DL = detection limits.

3.3. Description of the Proposals for Converting the Roof Slab of the Pattern Single-Family Household to a Rainwater Harvesting Surface

The PSFH is in urgent need of an intervention to provide maintenance to the installations; this situation can be taken advantage of to retrofit the house and adapt the hydro-sanitary installations for the use of RW. Depending on the characteristics of the PSFH and the RWHP and the quality of the RW, three retrofit proposals were designed (Table 6). However, these three proposals are illustrative and mention the advantages and disadvantages for owners to decide which is best for them and fits their possibilities based on their perception.

3.4. Rainwater Harvesting System Design

The RWHS design consists of a 1100 L Rotoplas tricapa® or similar brand portable commercial ST with a fill and Kendrick valve, air jug, ball valve multiconnector, union nut, and an airtight lid. In addition, the system has a commercial filter installed at the outlet of the ST to the hydraulic distribution (Figure S9 and Table S5, Supplementary Material). It is important to highlight that one limitation in the present work and in RWHS research in general is the availability of empirical data on social behavior in specific seasons of the year or even daily. The more specific water consumption and precipitation data, the more accurate the quantification of savings and the sizing of the systems will be. On the other hand, in the design it is necessary to consider low-maintenance materials that preserve the excellent quality of RW. In addition, it is necessary to have a maintenance guide that can be understood by the entire population. The social acceptance of the systems will grow along with RW revalorization; and this will be achieved if citizens become co-managers of water together with the municipal operator [17].

3.5. Rainwater Harvesting Potential in the Pattern Single-Family Household

The average RWHP considering the rainfall of the years 2020 and 2021 is 1035 L/m2. On average, 39 rainy days occurred in the two years; this means that ~27 L of RW/m2 per precipitation can be captured in the PSFH.
However, to calculate the RWHP of the PSFH, it is necessary to consider the runoff coefficient ( K R u n o f f ) of the roof slab that will be in contact with rainfall. The retrofit prototype of the PSFH contemplates a waterproofed roof slab, for which NMX-AA-164-SCFI-2013 [29] sets a K R u n o f f = 0 .90. Applying Equation (1), we find that the RWHP in the PSFH = 26,653 L per RS. In other words, the average volume captured annually in the PSFH would be enough to fill ~24 commercial 1100 L tanks. According to INEGI, the dwellings in the study area have 3.02 inhabitants/housing; on the other hand, this study found that the average number of inhabitants per dwelling is 3.49 [27].
Taking these values into account, it has been determined that the calculated RWHP will be sufficient to satisfy the consumptive uses of the dwellings for ~59 and ~51 days, respectively, considering the minimum endowment required by the building regulations of the municipality of Acapulco [75]. On the other hand, the WHO considers that the volume required for optimal water needs satisfaction is 100 L/person per day. Considering this value, the RWHP of the PSFH would be sufficient to satisfy a 3.02-person dwelling for ~88 days, whereas 3.49-person dwellings would have the required volume for ~77 days. Annually, a 3.02/inhab/dwelling, considering the consumption established by the WHO (100 L/inhab/day), consumes 110,230 L/year; whereas considering the consumption set in the construction regulations, it is 165,345 L/year. In Acapulco, an RWHP of 26,653 L per RS has been estimated. Taking this into consideration and applying Equation (2), it is calculated that according to the consumptions established by the WHO and the municipal building regulations, the potable water saving by the system is 24 and 16%, respectively.
The ST sizing for harvested RW highlights the economic and operational implications involved, in addition to the structural challenge for the buildings due to the weight of the contained water. One of the challenges related to hydraulic design is the gravity operation of the system, which necessitates the implementation of a tank above the drainage level of the hydraulic furniture (cap. 1100 L recommended) for distribution to the furniture inside the houses, with these being devices of constant replenishment of the contained water.
On the other hand, design considerations for larger-capacity TS and longer water retention time involve subway locations, which prevent the incidence of sunlight to avoid eutrophication. In addition, the capacity of this type of storage has an important impact on the efficiency of rainwater harvesting systems because it allows or limits the capacity of users to contain harvested water, and therefore, to satisfy consumptive uses in times of scarcity [76].
The scientific community, attracted by the optimization of RW storage devices and their challenges, has evaluated various methods for calculating their capacity.
Ghisi et al. [77] based their calculation method on computer simulations using the software Neptune and considering daily RW precipitation data, potable water demand per capita, inhabitants per dwelling, roof area, RW demand per dwelling, RW tank capacity, and K R u n o f f . In this methodological approach, RW tank capacity is chosen by the user according to the potential for potable water savings determined by the software.
In the work by Coombes et al. [78], an analysis involving 6 min time steps and climate-dependent water demand, i.e., exhaustively detailed inputs, are proposed. This method is compared with a simpler continuous simulation method with daily time steps and average water, such as the one presented in this study. The results showed that the simplified rainwater storage tank sizing methods underestimated annual rainwater yields that depended on tank size, rain depth, seasonal rainfall distribution, water demand, and tank configuration.
Considering the study carried out by of Coombes et al. [78], a simplified method for sizing rainwater storage tanks proposed by a federal agency, i.e., CONAGUA, was applied for this study; however, rainfall data obtained from the daily behavior of the 2020 rainy season were used for its calculation. This decision was made because the ultimate objective of this work is to achieve the social revaluation of rainwater harvested through RWHSs. In this sense, it is more convenient to bring the calculations to the simplest possible terms.
In 2020, Mexico experienced the most active tropical RS in its history [36]. During this period, 46 rainfall events occurred: 29 tropical storms and 17 hurricanes, 9 of which were of great intensity [37]. Acapulco experienced three tropical storms and one category H4 hurricane during this season with high-intensity rainfall of up to 334 L/m2. Therefore, an additional tank is suggested to contain the volume likely to be collected in the event of heavy rainfalls (e.g., the year 2020). In order to take full advantage of the RWHP, an additional tank of at least 9 m3 is proposed. In the BGA-2736, in addition to the ST, 30% of the SFHs already have cisterns that can be used to have a greater collected volume, increasing water savings. This additional ST, improving foremost the users’ capability to disconnect from the municipal network, opens the possibility of treating collected RW using NaClO. This treatment is proposed because of its simplicity, affordability, and availability to the RWHS end users.

First Rainwater Separator Capacity

The volume of water to be separated from storage is 11.44 L; the volume is determined from Equation (7).
V F R S = A c a t c h m e t × K s
where V F R S is the volume of the FRS (L), A c a t c h m e n t   is the CSA (m2), and K s is a constant equivalent to 0.40 L/m2 of CSA at the beginning of each rainfall.
For the FRS prototype, a commercial 20 L cylindrical container with a lid is proposed, conditioned with an upper inlet to install a lift float adjusting the installation height to contain a total volume of 11.5 L. Depending on the quality of the harvested RW in the FRS, its operation after the first two rainfall periods may be suspended. However, its implementation is recommended for maintenance purposes for the CSA (washing) before the first rains or any unforeseen emergency.
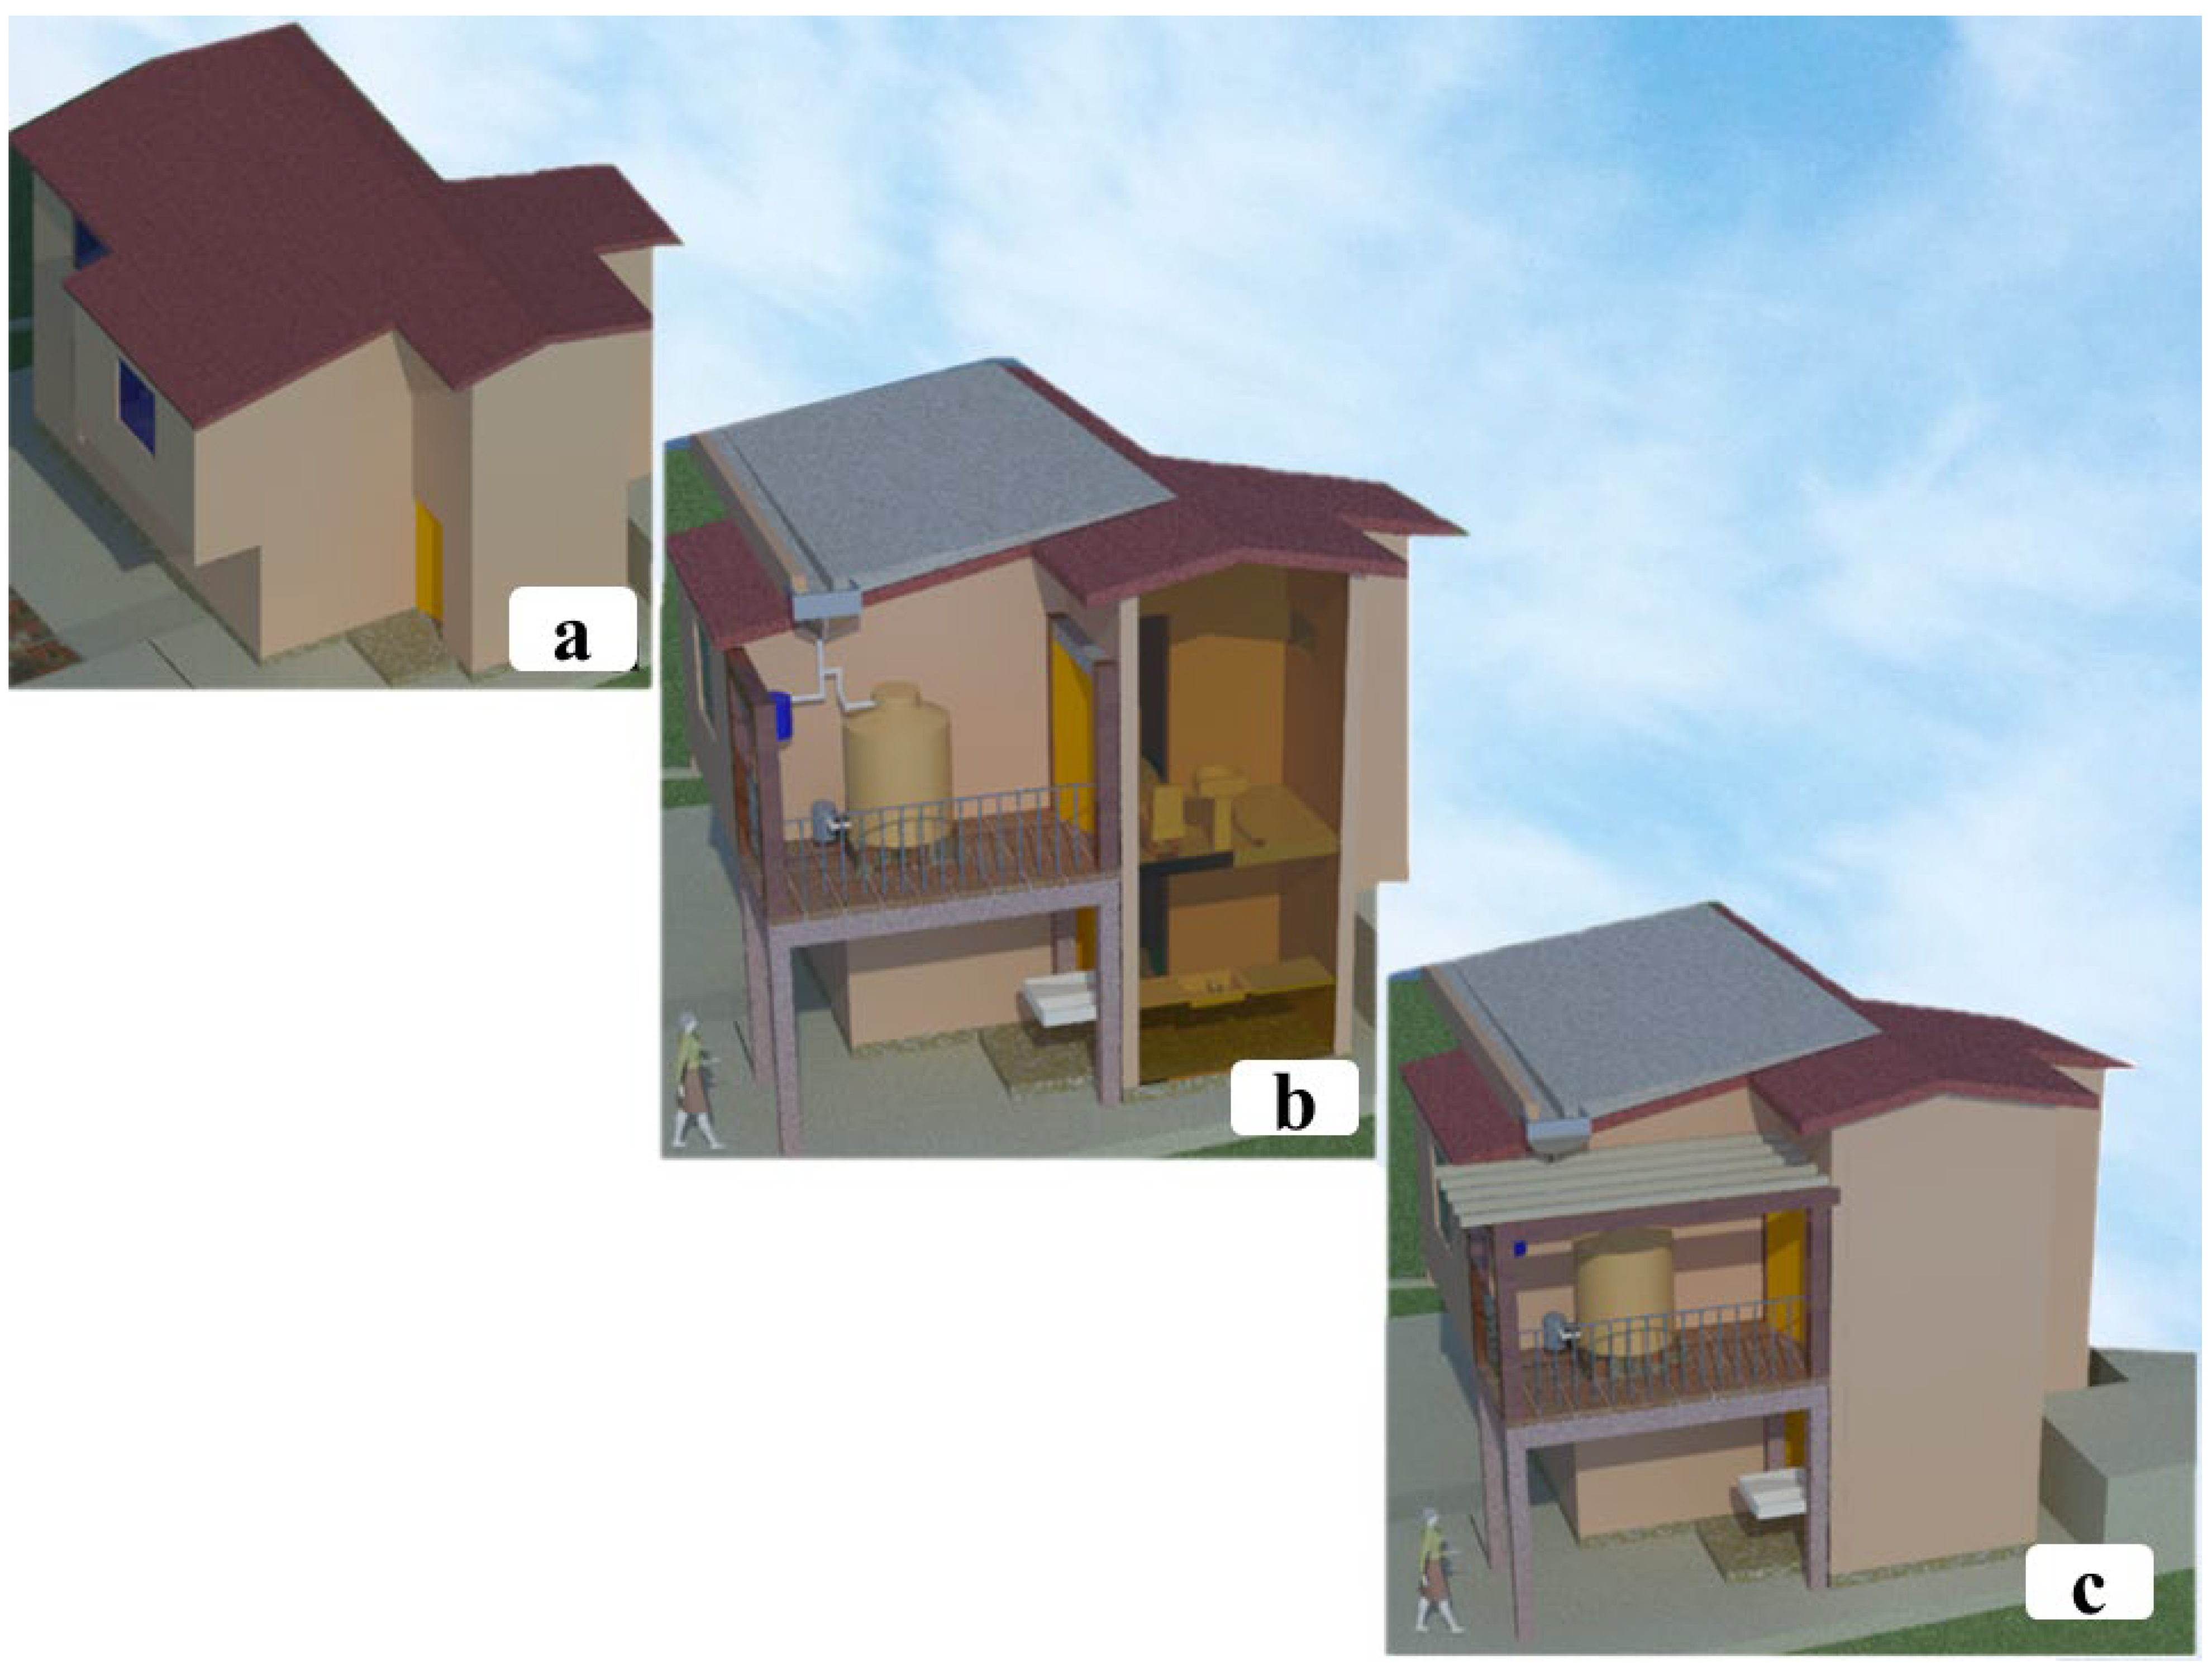
The installation of the RWHS in the PSFH will imply substantial modifications to the current morphology of the building (Figure 9). The +1.60 level of the roof slab is proposed to support the system. At this level, it is feasible to convey water by gravity to the hydraulic furniture of the kitchen and the service patio, located at the finished floor level of −0.75 (Figure 9).

3.6. Social Acceptance of Water Efficiency Retrofit Based on the Use of Rainwater as an Alternative Source for Consumptive Uses

Although RWHSs bring social, economic, and environmental benefits and are an ancestral technology with precedents worldwide [13], Acapulco has not successfully implemented these devices among the population yet.
Social studies are essential to understand the limitations of society and increase its receptivity to RWHS [79]. In the urban context of Acapulco, particularly in the study area, the population expresses its discontent with the inequitable distribution of water by CAPAMA. Citizens consider that the tourist zone receives the resource constantly, while the rest of the city suffers constant service cuts. Another social quote is the lack of potable water supply from the municipal network occurring particularly during the RS; the author of [22] argues that this situation is due to operational problems of the water treatment plants derived from the high content of suspended solids present in the supply source. In addition, the lack of maintenance in the drainage and drinking water networks and their high degree of obsolescence are resented. In official communications, the operating agency has publicly acknowledged the lack of resources to operate efficiently [80]. Given the limitations of the state to cover the social demand for water, RWHSs are emerging as a decentralized solution capable of complementing domestic demand. In general, RWHSs have positive social impacts and can be a nature-based solution as long as they have social acceptance [81]. The surveys conducted to find out the willingness of the inhabitants of BGA-2736 to give some consumptive use to RW within their households showed very encouraging results. The 97.6% of the surveyed population expressed their interest in recovering RW for consumptive uses within their households. This percentage is in line with the RW acceptance reported by Oviedo-Ocaña et al. [82] and Dominguez et al. [83], 97 and 91%, respectively, in the Latin American urban context. The acceptance of the RW shown by the Latin American population is also in line with that reported in the UK by Ward et al. [84]. The international acceptance strengthens RW as an alternative water source for urban domestic water supply. According to Campisano et al. [17], the social acceptance of RWHSs depends on the social perception of the quality of the harvested resource and the health risk, as well as economic aspects, i.e., savings in the water bill and system implementation and maintenance costs. In this sense, the results obtained from the surveys applied in this work showed that the most popular use of RW was flushing toilets (16.9%), and the second most popular use was watering green areas (16.4%), which are activities that involve little human contact. This RW valorization is consistent with the preferred uses among the Latin American population. Dominguez et al. [83] found that most of the studied population was willing to employ harvested RW to flush the toilet, clean the house, and water plants. In addition, Oviedo-Ocaña et al. [82] reported the same uses as priorities in their work. On the other hand, 5.3% of people surveyed in BGA-2736 would be willing to bathe with RW, and 0.9% would drink it. However, the latter option is not recommended due to the quality of RW and the low salt content recorded in the RW harvested within the BGA-2736. It would be necessary to implement additional purification and mineralization treatment for this water to be considered for human consumption. According to the inhabitants of the BGA-2736, the activities that consume the most water are in the first place, the use of the washing machine; and in the following position, the flushing of the toilet. In contrast, the activity that they consider the least water-consuming is the maintenance of outdoor areas. According to CONAGUA, Mexicans consume 66% of the water in their households by flushing the WC and shower [3].
In the study area, 50.60% of the people surveyed reported paying up to ca. USD 10.00 for drinking water and sewage per month. This means that their consumption is up to 21 m3 per month. Considering the average number of inhabitants per dwelling of 3.02, the average consumption of 17 m3 of potable water per dwelling, and a period of 30 days per month, it can be inferred that the average consumption per inhabitant per day is ~0.19 m3, i.e., 190 L/day. According to Howard and Bartram [85], the WHO considers this consumption at the optimal access level. On the other hand, the consumption obtained is higher than that determined by the building regulations in force for the municipality of Acapulco, which regulates the minimum water supply at 150 L/inhab/day.
Implementing NbS such as RWHSs in existing buildings, particularly in SFH, faces economic challenges that can be overcome through financial incentives such as tax deductions [86].

4. Conclusions

In the PSFH located within the BGA-2736, approximately 27 L of RW per m2 can be harvested every rainfall. It is feasible to carry out the WER integrating an RWHS in those houses that represent a niche of opportunity due to the deterioration of their hydrosanitary installations, and in those where—even though they do not need it—owners would like to implement it. The WER proposal has been proven to be an alternative to supply water to a PSFH for up to 88 days (3 months).
From the parameters measured for RW quality in this work, the harvested RW in the PSFH meets the requirements established by the WHO for recreational use (extensive contact with the human body, excluding consumption). On the other hand, according to NOM-127-SSA1-2021, RW does not meet the acidity and Cd concentration levels, i.e., similar to WHO, RW in its current state cannot be considered for human consumption. The Cd found in RW may have its source in the catchment surface material (galvanized sheet).
Considering other studies and the results of HRWQ in this work, it is observed that the RW quality is related to atmospheric contamination level. The first rains are characterized by a higher degree of acidity and higher concentration of ions; however, the acidity and concentration of ions decrease as the number of rains increases. Rainfall is the primary mechanism for “washing the atmosphere” and is a natural mechanism that removes gases and particles suspended in the air. In addition, dust particles, leaf litter, and organic matter accumulated in the catchment system between the different rainfall periods come into contact with the precipitated water, reducing its quality. Therefore, it is suggested to maintain and clean the CSA before the start of the RS or completely discard the first rainfall to clean the area with the first rains and avoid discarding water through the FRS. It was observed that after the natural flushing of the RWHS by the first rains, the quality of the water collected in the FRS and the ST was very similar, i.e., the water collected in the FRS can also be used, and the operation of the FRS can be omitted after the CSA has been washed. It is recommended to keep it within the configuration of the RWHS in order to divert the water used to manually wash the roof slab or any other pollutants that may be washed away during general maintenance.
Although WER proposal 1 is the costliest alternative, it shows the most significant benefits from the three presented; therefore, the final decision will be taken by the dwelling owners. It is suggested that society participates in the creation of public policies that facilitate WER.
The population has shown interest in implementing RWHSs to contribute to their water supply in the study area. In addition, they have expressed interest in using the water collected from these systems in activities with low human contact, for which RW is ideal due to its quality.
Finally, the implementation of NbS such as RWHSs brings lateral benefits to the satisfaction of anthropic water demand. These benefits are related to the management of the hydrological cycle because citizens become aware of the need for rain in the urban environment impacted by climate change. Their understanding derives from preserving vegetation and permeable land within the dwellings and managing the water-sensitive city. These are multidisciplinary efforts to pursue the common good both in the present and for future generations. RW represents an alternative source of good-quality water for on-site water supply, i.e., without extraction, distribution, or purification costs.

Supplementary Materials

The following supporting information can be downloaded at: https://www.mdpi.com/article/10.3390/w14182927/s1, Figure S1: Mayan chultun design; Figure S2: Location of BGA-2736 urban water and sanitary services equipment; Figure S3: Measuring rainfall device; Figure S4: pH variation over 24 hours in low and high alkalinity water; Figure S5: Commercial filters used in the prototype rainwater harvesting system; Figure S6: Roof slab retrofit using Foamular® to generate slopes and catchment gutter in the pattern single-family household; Figure S7: Roof slab retrofitting with tezontle to generate slopes and catchment gutter in the pattern single-family household; Figure S8: Roof slab retrofitting using a metal gutter without modifying the top slab in the pattern single-family household; Figure S9: Rainwater harvesting system proposal. Table S1: Classification of rainfall type; Table S2: Pluvial phenomena affecting Guerrero from May to November 2020, according to the National Meteorological Service of Mexico; Table S3: Physicochemical properties of rainwater samples from the basic geostatistical area-2736 collected in the year 2021; Table S4: Acid rain classification; Table S5: Materials required for the installation of the rainwater storage device in the pattern single-family household priced in 2021; Perception instrument S1: Survey for inhabitants of the basic geostatistical area -2736. Focused on the current state of the hydrosanitary installations in the homes, water consumption and management practices, and the willingness to adopt domestic hydraulic ecotechnologies; Perception instrument S2. Semi-structured interview for housewives living in basic geostatistical area -2736.

Author Contributions

M.M.-C. participated in the manuscript’s investigation, conceptualization, supervision, visualization, original draft writing, review, and editing; G.H.-F. participated in the manuscript’s supervision, conceptualization, visualization, original draft writing, review, and editing; E.J.F.-M. and J.A.L.-D. participated in the manuscript’s conceptualization and investigation; O.S.-F., O.T.-M., O.A.-M. and A.L.R.-H. participated in the manuscript’s conceptualization and in the supervision of the whole process. All authors have read and agreed to the published version of the manuscript.

Funding

This research was funded by CONACYT, Mexico. Mariana Martínez-Castrejón and Enrique de Jesús Flores Munguía received a graduate scholarship, registration numbers 733907 and 758303, respectively.

Data Availability Statement

All data presented in this study are contained within the article.

Acknowledgments

The authors acknowledge Laboratorio de Análisis Clínico Ambiental and Laboratorio de Geoquímica from Universidad Autónoma de Guerrero.

Conflicts of Interest

The authors declare no conflict of interest. The funders had no role in the design of the study; in the collection, analyses, or interpretation of data; in the writing of the manuscript; or in the decision to publish the results.

References

  1. Botkin, D.B.; Keller, E.A. Water Supply, Use, and Management. In Environmental Science, Earth as a Living Planet, 8th ed.; John Wiley & Sons, Inc.: Santa Barbara, CA, USA, 2011; Volume 2, pp. 368–427. [Google Scholar]
  2. Gleason, J.A.; Casiano Flores, C. Challenges of Water Sensitive Cities in Mexico: The Case of the Metropolitan Area of Guadalajara. Water 2021, 13, 601. [Google Scholar] [CrossRef]
  3. CONAGUA. Estadísticas del Agua en México 2018; Secretaría de Medio Ambiente y Recursos Naturales: Ciudad de México, México, 2018.
  4. Partzsch, L. Smart regulation for water innovation—The case of decentralized rainwater technology. J. Clean. Prod. 2009, 17, 985–991. [Google Scholar] [CrossRef]
  5. Abourached, C.; English, M.J.; Liu, H. Wastewater treatment by Microbial Fuel Cell (MFC) prior irrigation water reuse. J. Clean. Prod. 2016, 137, 144–149. [Google Scholar] [CrossRef]
  6. UNEP. Healthy Planet Healthy People. Global Environment Outlook GEO-6; UNEP & Cambridge University Press: New York, NY, USA, 2019. [Google Scholar] [CrossRef]
  7. Mukaromah, H. Rainwater Harvesting as an Alternative Water Source in Semarang, Indonesia: The Problems and Benefits. IOP Conf. Ser. Earth Environ. Sci. 2020, 447, 012059. [Google Scholar] [CrossRef]
  8. Reig, P.; Gassert, F.; Tianyi, L.; Maddoks, A.; World Resources Institute. Water Stress by Country. 2013. Available online: https://www.wri.org/data/water-stress-country (accessed on 15 September 2022).
  9. Willem-Hofste, R.; Reig, P.; Schleifer, L.; World Resources Institute. 17 Countries, Home to One-Quarter of the World’s Population, Face Extremely High Water Stress. 6 August 2019. Available online: https://www.wri.org/blog/2019/08/17-countries-home-one-quarter-world-population-face-extremely-high-water-stress (accessed on 15 September 2022).
  10. FAO. Water Report 38. Coping with Water Scarcity. An Action Framework for Agriculture and Food Security; Food and Agriculture Organization of the United Nations Water Reports: Rome, Italy, 2012. [Google Scholar]
  11. McDonald, R.L.; Weber, K.; Padowski, J.; Flörke, M.; Schneider, C.; Green, P.A.; Gleeson, T.; Eckman, S.; Lehner, B.; Balk, D.; et al. Water on an urban planet: Urbanization and the reach of urban water infrastructure. Glob. Environ. Chang. 2014, 27, 96–105. [Google Scholar] [CrossRef]
  12. Santos, C.; Taveira-Pinto, F. Analysis of different criteria to size rainwater storage tanks using detailed methods. Resour. Conserv. Recycl. 2013, 71, 1–6. [Google Scholar] [CrossRef]
  13. Gleason-Espíndola, J.A.; Corona-Sánchez, J.; Casiano-Flores, C.A. Mexican rainwater harvesting movement in recent years. In International Rainwater Catchment Systems Experiences: Towards Water Security, 1st ed.; Gleason-Espíndola, J.A., Casiano-Flores, C.A., Pacheco-Vega, R., Pacheco-Montes, M.R., Eds.; IWA Publishing: London, UK, 2020; pp. 73–82. [Google Scholar]
  14. García-Martínez, R.; Carrillo-Chavez, A.; Torres-Jardón, R.; Ramirez-Guzmán, A.; López-Carrasco, M. Chemical composition of rainwater collected from 2006 to 2009 in Mexico City and at a rural site at Morelos State, south central Mexico. Rev. Mex. Cienc. Geol. 2020, 37, 1–8. [Google Scholar] [CrossRef]
  15. Farreny, R.; Morales-Pinzón, T.; Guisasola, A.; Tayà, C.; Rieradevall, J.; Gabarrell, X. Roof selection for rainwater harvesting: Quantity and quality assessments in Spain. Water Res. 2011, 45, 3245–3254. [Google Scholar] [CrossRef]
  16. Ranaee, E.; Abbasi, A.A.; Tabatabaee Yazdi, J.; Ziyaee, M. Feasibility of Rainwater Harvesting and Consumption in a Middle Eastern Semiarid Urban Area. Water 2021, 13, 2130. [Google Scholar] [CrossRef]
  17. Campisano, A.; Butler, D.; Ward, S.; Burns, M.J.; Friedler, E.; DeBusk, K.; Fisher-Jeffes, L.N.; Ghisi, E.; Rahman, A.; Furumai, H.; et al. Urban rainwater harvesting systems: Research, implementation and future perspectives. Water Res. 2017, 115, 195–209. [Google Scholar] [CrossRef]
  18. Ward, S.; Memon, F.A.; Butler, D. Performance of a large building rainwater harvesting system. Water Res. 2012, 46, 5127–5134. [Google Scholar] [CrossRef] [PubMed]
  19. Abdulla, F.A.; Al-Shareef, A.W. Roof rainwater harvesting systems for household water supply in Jordan. Desalination 2009, 243, 195–207. [Google Scholar] [CrossRef]
  20. GhaffarianHoseini, A.; Tookey, J.; GhaffarianHoseini, A.; Yusoff, S.M.; Hassan, N.B. State of the art of rainwater harvesting systems towards promoting green built environments: A review. Desalin. Water Treat. 2015, 57, 95–104. [Google Scholar] [CrossRef]
  21. García-Monforte, G.; Cantú-Martínez, P.C. Escenario del agua en México. Cult. Cient. Tecnol. 2015, 6, 30. [Google Scholar]
  22. Salazar-Adams, A. Ineficiencia, escasez y el uso político del agua en Acapulco. In Fugas de Agua y Dinero: Factores Político-Institucionales que Inciden en el Desempeño de Organismos Operadores del Agua en México; Salazar-Adams, A., Ed.; El Colegio de Sonora: Hermosillo, México, 2016; ISBN 978-607-8480-15-9. [Google Scholar]
  23. SEDUOP. Actualización del Plan Director de Desarrollo Urbano de Acapulco de Juárez, Guerrero. Acapulco, Guerrero; Secretaría de Desarrollo Urbano y Obras Públicas: Acapulco, México, 2015. [Google Scholar]
  24. SMN. Servicio Meteorológico Nacional. 2018. Available online: https://smn.conagua.gob.mx/es/climatologia/informacion-climatologica/normales-climatologicas-por-estado?estado=gro (accessed on 12 September 2022).
  25. Televisa. Acapulco se Queda sin Agua Potable por Quiebra de CAPAMA y Colapso de Tuberías. 2020. Available online: https://noticieros.televisa.com/ultimas-noticias/acapulco-se-queda-sin-agua-potable-por-quiebra-de-capama-y-colapso-de-tuberias/ (accessed on 9 September 2022).
  26. El Sol de Acapulco. “Blas” Deja sin Agua a Más del 90% de Acapulco. 2022. Available online: https://www.elsoldeacapulco.com.mx/local/blas-deja-sin-agua-a-mas-del-90-de-acapulco-8446100.html (accessed on 9 September 2022).
  27. INEGI. Censo de Población y Vivienda 2020; Instituto Nacional de Estadística Geografía e Informática: Mexico City, Mexico, 2020. Available online: https://www.inegi.org.mx/programas/ccpv/2020/ (accessed on 10 March 2022).
  28. CONEVAL. Consejo Nacional de Evaluación de la Política de Desarrollo Social. 2020. Available online: https://www.coneval.org.mx/Medicion/Paginas/Criterios-ZAP.aspx (accessed on 15 March 2022).
  29. Google Earth; Intrinsic Graphics: Palo Alto, CA, USA, 2022.
  30. CAPAMA. Boletín de Prensa 714. 2022. Available online: https://www.capama.gob.mx/noticia/714 (accessed on 27 August 2022).
  31. CONAGUA. Lineamientos Técnicos: Sistema de Captación de Agua de Lluvia con Fines de Abasto de Agua Potable a Nivel Vivienda; Programa Nacional para Captación de Agua de Lluvia y Ecotecnias en Zonas Rurales (PROCAPTAR); Comisión Nacional del Agua: Mexico City, Mexico, 2016. [Google Scholar]
  32. NMX-AA-164-SCFI-2013; Edificación Sustentable—Criterios y Requerimientos Ambientales Mínimos. Secretaría de Economía, Subsecretaría de Comercio y Fomento Industrial, Diario Oficial de la Federación: Ciudad de México, México, 2013.
  33. NMX-AA-036-SCFI-2001; Análisis de Agua-Determinación de Acidez y Alcalinidad en Agua Naturales, Residuales y Residuales Tratadas. Secretaría de Economía, Subsecretaría de Comercio y Fomento Industrial, Diario Oficial de la Federación: Ciudad de México, Mexico, 2001.
  34. NMX-AA-073-SCFI-2001; Análisis de Agua—Determinación de Cloruros Totales en Aguas Naturales, Residuales y Residuales Tratadas. Secretaría de Economía, Subsecretaría de Comercio y Fomento Industrial, Diario Oficial de la Federación: Ciudad de México, Mexico, 2001.
  35. Vélez-Pérez, L.S.; Ramirez-Nava, J.; Hernández-Flores, G.; Talavera-Mendoza, O.; Escamilla-Alvarado, C.; Poggi-Varaldo, H.M.; Solorza-Feria, O.; López-Díaz, J.A. Industrial acid mine drainage and municipal wastewater co-treatment by dual-chamber microbial fuel cells. Int. J. Hydrogen Energy 2020, 45, 13757–13766. [Google Scholar] [CrossRef]
  36. Hernández-Sampieri, R.; Mendoza, C. Metodología de la Investigación. Las Rutas Cuantitativa, Cualitativa y Mixta; Editorial Mc Graw Hill Education: Ciudad de México, México, 2018; ISBN 978-1-4562-6096-5. [Google Scholar]
  37. Geertz, C. La Interpretación de las Culturas; Editorial Gedisa: Barcelona, Spain, 2003; ISBN 84-7432-090-9. [Google Scholar]
  38. SMN. Servicio Meteorológico Nacional. Análisis del Estado del Arte Sobre el Depósito Atmosférico en México y su Relación con el Cambio Climático. 2017. Available online: https://www.gob.mx/cms/uploads/attachment/file/410254/INFORME_FINAL_EADAM_V3_INECC.pdf (accessed on 27 August 2021).
  39. CONAGUA. Temporada de Ciclones Tropicales 2020, la Más Activa de la Historia. Comunicado de Prensa No. 993-20; Comisión Nacional del Agua: Mexico City, Mexico, 2020; Available online: https://smn.conagua.gob.mx/files/pdfs/comunicados-de-prensa/Comunicado993-20.pdf (accessed on 7 January 2021).
  40. Servicio Meteorológico Nacional. Información Histórica. 2020. Available online: https://smn.conagua.gob.mx/es/ciclones-tropicales/informacion-historica (accessed on 7 January 2021).
  41. NOM-127-SSA1-2021; Agua para uso y Consumo Humano. Límites Permisibles de la Calidad del Agua. Secretaría de Salud, Diario Oficial de la Federación: México City, México, 2022.
  42. WHO. Guidelines for Drinking-Water Quality; World Health Organization: Geneva, Switzerland, 2022; ISBN 978-92-4-004506-4. [Google Scholar]
  43. Singh, A.; Agrawal, M. Acid rain and its ecological consequences. J. Environ. Biol. 2008, 29, 15–24. [Google Scholar]
  44. Ospina-Zúñiga, Ó.E.; Ramírez-Arcila, H. Evaluación de la calidad del agua de lluvia para su aprovechamiento y uso doméstico en Ibagué, Tolima, Colombia. Ing. Solidar. 2014, 10, 125–138. [Google Scholar]
  45. Ward, S.; Memon, F.A.; Butler, D. Harvested rainwater quality: The importance of appropriate design. Water Sci. Technol. 2010, 61, 1707–1714. [Google Scholar] [CrossRef]
  46. Krauskopf, K.B.; Bird, D.K. Solution-Mineral Equilibria. Part 1: Carbonates. In Introduction to Geochemistry, 3rd ed.; Mc Graw-Hill, Inc.: Mexico City, Mexico, 1995; pp. 61–85. [Google Scholar]
  47. Wurst, W.A.; Durborow, R.M. Interactions of pH, Carbon Dioxide, Alkalinity and Hardness in Fishponds; No. 464; SRAC: Stoneville, MS, USA, 1992. [Google Scholar]
  48. Trivedi, P.; Patel, K.; Yasobant, S.; Kalpana, P.; Bhavsar, P.; Raval, D.; Saxena, D. Visually clean is not necessarily microbiologically safe: Learnings from WASH assessment of maternity units of Gujarat, India. J. Fam. Med. Prim. Care 2020, 9, 788. [Google Scholar] [CrossRef]
  49. NOM-201-SSA1-2015; Productos y Servicios. Agua y Hielo para Consumo Humano, Envasados y a Granel. Especificaciones Sanitarias. Secretaría de Salud, Diario Oficial de la Federación: Ciudad de México, México, 2015.
  50. Rosenthal, E. Thermomineral waters of Ca-chloride composition: Review of diagnostics and of brine evolution. Environ. Geol. 1997, 32, 245–250. [Google Scholar] [CrossRef]
  51. Ayers, R.S.; Wescot, D.W. Water Quality for Agricultural; Irrigation and Drainage Paper 29 Rev. 1; Food and Agriculture Organization of the United Nations: Rome, Italy, 1985. [Google Scholar]
  52. Sawyer, C.N.; McCarty, P.L.; Parkin, G.F. Chemistry for Environmental and Engineering Science, 5th ed.; McGraw Hill Inc.: New York, NY, USA, 2003; pp. 587–590. [Google Scholar]
  53. Powlson, D.S.; Addiscott, T.M.; Benjamin, N.; Cassman, K.G.; de Kok, T.M.; van Grinsven, H.; L’hirondel, J.-L.; Avery, A.A.; van Kessel, C. When Does Nitrate Become a Risk for Humans? J. Environ. Qual. 2008, 37, 291–295. [Google Scholar] [CrossRef] [PubMed]
  54. Hastings, M.G.; Sigman, D.M.; Lipschultz, F. Isotopic evidence for source changes of nitrate in rain at Bermuda. J. Geophys. Res. Atmos. 2003, 108, 790. [Google Scholar] [CrossRef] [Green Version]
  55. Elliott, E.M.; Kendall, C.; Wankel, S.D.; Burns, D.A.; Boyer, E.W.; Harlin, K.; Bain, D.J.; Butler, T.J. Nitrogen Isotopes as Indicators of NOx Source Contributions to Atmospheric Nitrate Deposition across the Midwestern and Northeastern United States. Environ. Sci. Technol. 2007, 41, 7661–7667. [Google Scholar] [CrossRef] [PubMed]
  56. Genchi, G.; Sinicropi, M.S.; Lauria, G.; Carocci, A.; Catalano, A. The Effects of Cadmium Toxicity. Int J. Environ. Res. Public Health 2020, 17, 3782. [Google Scholar] [CrossRef] [PubMed]
  57. Chubaka, C.; Whiley, H.; Edwards, J.; Ross, K. Lead, Zinc, Copper, and Cadmium Content of Water from South Australian Rainwater Tanks. Int. J. Environ. Res. Public Health 2018, 15, 1551. [Google Scholar] [CrossRef] [PubMed]
  58. Tengan, B.M.; Akaoto, O. Comprehensive evaluation of the possible impact of roofing materials on the quality of harvested rainwater for human consumption. Sci. Total Environ. 2022, 819, 152966. [Google Scholar] [CrossRef]
  59. Bravo, A.H.; Soto, A.R.; Sosa, E.R.; Sánchez, A.P.; Alarcón, A.; Kahl, J.; Ruíz, B.J. Effect of acid rain on building material of the El Tajín archaeological zone in Veracruz, Mexico. Environ. Pollut. 2006, 144, 655–660. [Google Scholar] [CrossRef]
  60. Gispert, M.; Hernández, M.; Climent, E.; Flores, M. Rainwater Harvesting as a Drinking Water Option for Mexico City. Sustainability 2018, 10, 3890. [Google Scholar] [CrossRef]
  61. Chung, Y.S. Durable press and antimicrobial finishing of cotton fabrics with a citric acid and chitosan treatment. In Proceedings of the 1st International Conference on Fog and Fog Collection, Vancouver, BC, Canada, 19–24 July 1998. [Google Scholar]
  62. Kulshrestha, U.C.; Sarkar, A.K.; Srivastava, S.S.; Parashar, D.C. Wet-only and bulk deposition studies at New Delhi (India). Water Air Soil Pollut. 1995, 85, 2137–2142. [Google Scholar] [CrossRef]
  63. Akubuenyi, F.C.; Uttah, E.C.; Enyi-Idoh, K.H. Microbiological and physicochemical assessment of major sources of water for domestic uses in Calabar Metropolis Cross River state, Nigeria. Transnatl. J. Sci. Technol. 2013, 3, 31–44. [Google Scholar]
  64. Parungo, F.; Nagamoto, C.; Hoyt, S.; Humberto Bravo, A. The investigation of air quality and acid rain over the Gulf of Mexico. Atmos. Environ. Part A Gen. Top. 1990, 24, 109–123. [Google Scholar] [CrossRef]
  65. Sazakli, E.; Alexopoulos, A.; Leotsinidis, M. Rainwater harvesting, quality assessment and utilization in Kefalonia Island, Greece. Water Res. 2007, 41, 2039–2047. [Google Scholar] [CrossRef] [PubMed]
  66. Báez, A.; Belmont, R.; García, R.; Padilla, H.; Torres, M.C. Chemical composition of rainwater collected at a southwest site of Mexico City, Mexico. Atmos. Res. 2007, 86, 61–65. [Google Scholar] [CrossRef]
  67. Rivera-Rivera, D.M.; Escobedo-Urías, D.C.; Jonathan, M.P.; Sujitha, S.B.; Chidambaram, S. Evidence of Natural and Anthropogenic Impacts on Rainwater Trace Metal Geochemistry in Central Mexico: A Statistical Approach. Water 2020, 12, 192. [Google Scholar] [CrossRef]
  68. Ramírez-Lara, E.; Guardiola, R.; Vásquez, Y.; Balderas-Rentería, I.; Torres, H.; Sosa-Echeverría, R.; Alvarez-Sanchez, P.; Alarcón, A.; Kahl, J. Chemical composition of rainwater in northeastern México. Atmósfera 2010, 23, 3. [Google Scholar]
  69. Neibaur, E.E.; Anderson, E.P. An examination of factors affecting sustainability of domestic rainwater harvesting systems in a rural, semi-arid region of Mexico. Water Sci. Technol. Water Supply 2016, 16, 1388–1397. [Google Scholar] [CrossRef]
  70. Meng, Y.; Zhao, Y.; Li, R.; Li, J.; Cui, L.; Kong, L.; Fu, H. Characterization of inorganic ions in rainwater in the megacity of Shanghai: Spatiotemporal variations and source apportionment. Atmos. Res. 2019, 222, 12–24. [Google Scholar] [CrossRef]
  71. Majumdar, A.; Satpathy, J.; Kayee, J.; Das, R. Trace metal composition of rainwater and aerosol from Kolkata, a megacity in eastern India. SN Appl. Sci. 2020, 2, 2122. [Google Scholar] [CrossRef]
  72. Biswas, B.K.; Mandal, B.H. Construction and Evaluation of Rainwater Harvesting System for Domestic Use in a Remote and Rural Area of Khulna, Bangladesh. Int. Sch. Res. Not. 2014, 2014, 751952. [Google Scholar] [CrossRef]
  73. Vialle, C.; Sablayrolles, C.; Lovera, M.; Jacob, S.; Huau, M.-C.; Montrejaud-Vignoles, M. Monitoring of water quality from roof runoff: Interpretation using multivariate analysis. Water Res. 2011, 45, 3765–3775. [Google Scholar] [CrossRef]
  74. Huang, X.-F.; Li, X.; He, L.-Y.; Feng, N.; Hu, M.; Niu, Y.-W.; Zeng, L.-W. 5-Year study of rainwater chemistry in a coastal mega-city in South China. Atmos. Res. 2010, 97, 185–193. [Google Scholar] [CrossRef]
  75. SEDUOP. Reglamento de Construcciones para el Municipio de Acapulco de Juárez, Guerrero; Secretaría de Desarrollo Urbano y Obras Públicas: Acapulco, México, 2015. [Google Scholar]
  76. Fewkes, A. A review of rainwater harvesting in the UK. Struct. Surv. 2012, 30, 174–194. [Google Scholar] [CrossRef]
  77. Ghisi, E.; Bressan, D.L.; Martini, M. Rainwater tank capacity and potential for potable water savings by using rainwater in the residential sector of southeastern Brazil. Build. Environ. 2007, 42, 1654–1666. [Google Scholar] [CrossRef]
  78. Coombes, P.J.; Barry, M.E. The effect of selection of time steps and average assumptions on the continuous simulation of rainwater harvesting strategies. Water Sci. Technol. 2007, 55, 125–133. [Google Scholar] [CrossRef]
  79. Rodrigues-de Sá Silva, A.C.; Mendonça-Bimbato, A.; Perrella-Balestieri, J.A.; Nogueira-Vilanova, M.R. Exploring environmental, economic and social aspects of rainwater harvesting systems: A review. Sustain. Cities Soc. 2022, 76, 103475. [Google Scholar] [CrossRef]
  80. CAPAMA. Boletín de Prensa 100. 2019. Available online: https://www.capama.gob.mx/noticia/100 (accessed on 27 August 2022).
  81. Nazer, S.; Van der Zaag, M.; Gijzen, H.J. A financial, environmental and social evaluation of domestic water management options in the west bank, Palestine. Water Resour. 2010, 24, 4445–4467. [Google Scholar] [CrossRef]
  82. Oviedo-Ocaña, E.R.; Dominguez, I.; Ward, S.; Rivera-Sanchez, M.L.; Zaraza-Peña, J.M. Financial feasibility of end-user designed rainwater harvesting and greywater reuse systems for high water use households. Environ. Sci. Pollut. Res. 2017, 25, 19200–19216. [Google Scholar] [CrossRef]
  83. Domínguez, I.; Ward, S.; Mendoza, J.; Rincón, C.; Oviedo-Ocaña, E. End-User Cost-Benefit Prioritization for Selecting Rainwater Harvesting and Greywater Reuse in Social Housing. Water 2017, 9, 516. [Google Scholar] [CrossRef]
  84. Ward, S.; Barr, S.; Memon, F.; Butler, D. Rainwater harvesting in the UK: Exploring water-user perceptions. Urban Water J. 2013, 10, 112–126. [Google Scholar] [CrossRef]
  85. Howard, G.; Bartram, J. Domestic Water Quantity, Service Level and Health; World Health Organization: Ginebra, Suiza, 2003; Available online: https://apps.who.int/iris/handle/10665/67884 (accessed on 26 July 2022).
  86. Domènech, L.; Saurí, D. A comparative appraisal of the use of rainwater harvesting in single and multi-family buildings of the Metropolitan Area of Barcelona (Spain): Social experience, drinking water savings and economic costs. J. Clean. Prod. 2011, 19, 598–608. [Google Scholar] [CrossRef]
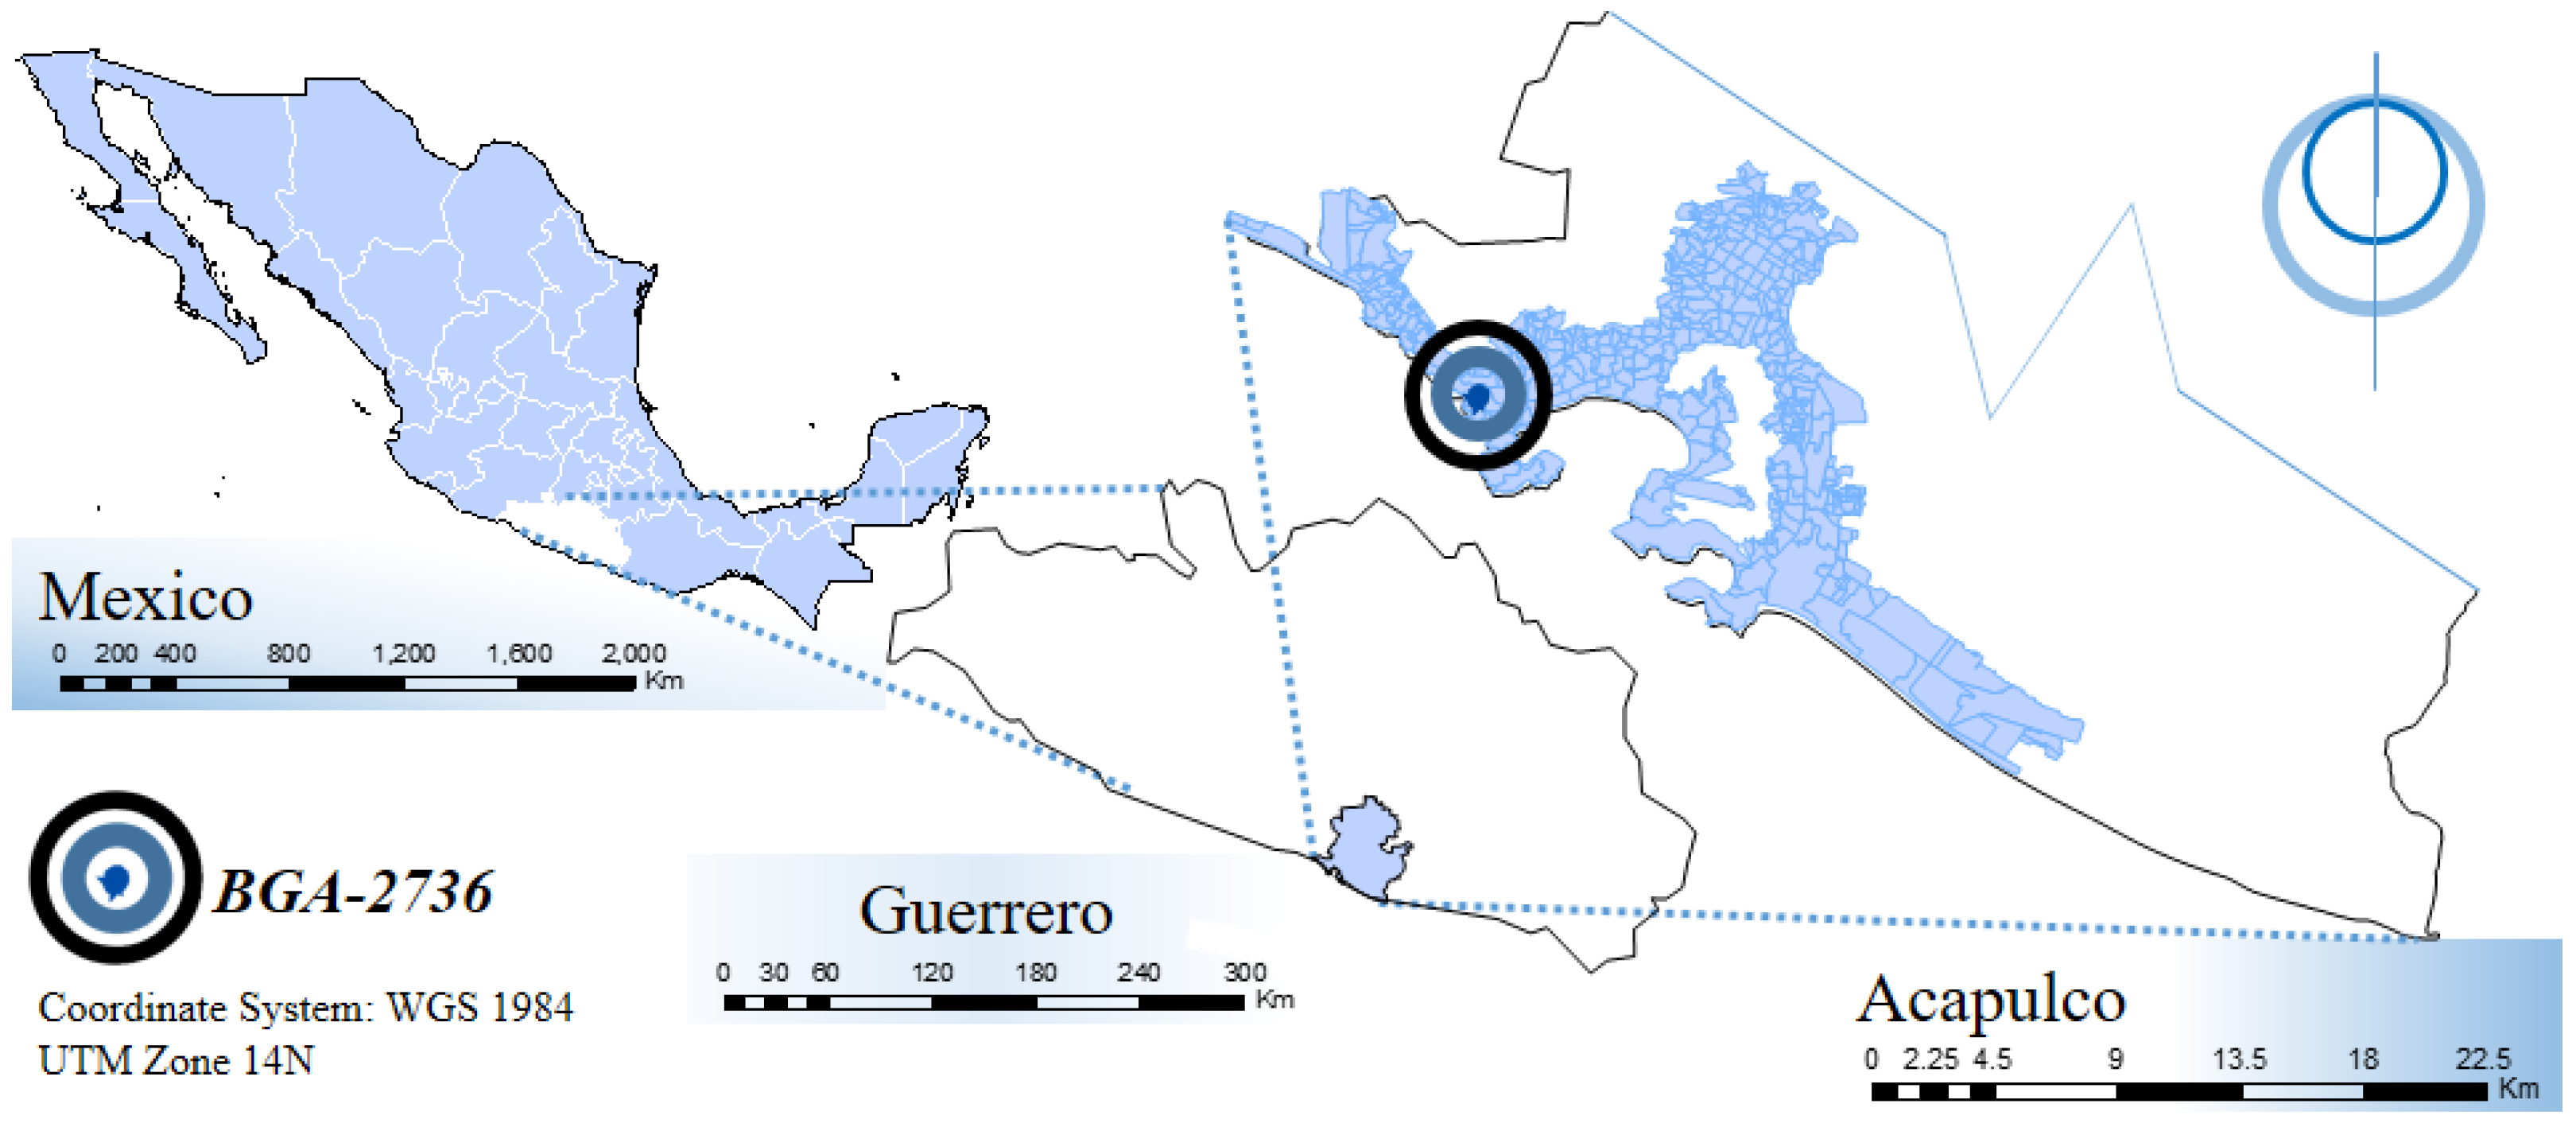
Figure 1. Basic geostatistical area 2736 location in Acapulco, Mexico.
Water 14 02927 g001
Figure 2. Historical behavior of the monthly precipitation reported by climatological station 12,142.
Water 14 02927 g002
Figure 3. Single-family household diagram.
Water 14 02927 g003
Figure 4. Single-family household obsolete plumbing installation affectations. (a) Interior dampness, (b) exposed structural reinforcement due to dampness, and (c) exterior dampness.
Water 14 02927 g004
Figure 5. In situ rainwater harvesting sampling system. (a) Catchment surface area; (b) conveyance; (c) first-rain separator; (d) separated effluent outlet; (e) rainwater storage; (f) Kerick valve; (g) filter; (h) treated effluent outlet.
Water 14 02927 g005
Figure 6. Rainfall event types in 2020 and 2021 recorded in the study area.
Water 14 02927 g006
Figure 7. Physicochemical parameters of rainwater collected in 2021. (a) pH, (b) electrical conductivity (σ), (c) alkalinity (Alk), and (d) total dissolved solids (TDS). NOM-127 = NOM-127-SSA1-2021. Data are presented as the average and the bars represent the standard error, where n = depends on the number of rainfall events recorded per period, except in periods 1 and 8 where n = 1 because only one sample was collected from the ST, whereas in period 8 only one sample was collected from FRS and ST. Blue bars represent FRS values and orange hatched bars represent ST values.
Water 14 02927 g007
Figure 8. Behavior of the concentration of major anions in the rainwater of the basic geostatistical area 2736, year 2021.
Water 14 02927 g008
Figure 9. Proposed modifications to the pattern single-family household based on installing the rainwater harvesting system. (a) SFH original condition, (b) Detail of RWHS installation, (c) SFH final volumetry.
Water 14 02927 g009
Table 1. Rainfall events per year.
YearRainfall EventsCumulative Annual
Rainfall (L/m2)
Average Rainfall
(L/m2)
2000–201868 a144921.31 b
202020881.1644.06
2021581189.7920.51
Note(s): a Average value reported by the NMS; b estimated by dividing the annual accumulated precipitation by the average number of rainfall events reported by the NMS.
Table 3. Concentration of major anions in rainwater samples from the basic geostatistical area 2736, year 2021.
WeekPluvial PhenomenaPeriodAnions (mg/L)
ChloridesNitratesSulfates
FRSSTFRSSTFRSST
11122.658.175.72 ± 0.223.25 ± 0.376.00 ± 1.0023.5 ± 0.50
22
37232.5123.446.03 ± 0.734.97 ± 0.1813 ± 0.0052.5 ± 1.50
46
5338.373.451.32 ± 0.391.47 ± 0.300 ± 0.002 ± 0.00
63
7243.457.881.29 ± 0.361.68 ± 0.090 ± 0.000.5 ± 0.50
84
9258.377.881.34 ± 0.261.14 ± 0.110 ± 0.001.5 ± 0.50
102
11361.971.970.57 ± 0.391.51 ± 0.350.5 ± 0.500 ± 0.00
120
13172.953.252.07 ± 0.161.83 ± 0.111.5 ± 0.500 ± 0.00
143
15184.433.251.53 ± 0.681.06 ± 0.330.5 ± 0.500 ± 0.00
162
17393.254.921.01 ± 0.470.85 ± 0.190.00 ± 0.000.00 ± 0.00
180
1921010.646.892.17 ± 0.201.12 ± 0.361.00 ± 0.000.50 ± 0.50
201
213119.858.670.72 ± 0.371.73 ± 0.031.50 ± 1.500.50 ± 0.50
222
232126.897.880.95 ± 0.091.09 ± 0.081.00 ± 0.000.00 ± 0.00
240
Note(s): Data are presented as the average ± standard error, where n = 2 for N O 3 and S O 4 2 , except for C l where n = 1. FRS = first-rain separator; ST = storage tank.
Table 6. Slab retrofit architectural proposal to adopt a rainwater harvesting system.
ProposalRoof Slab Retrofit MaterialCost (USD $)AdvantagesDisadvantages
1 AThermoinsulating (Foamular®)1369.57-High resistance against wind
-Quick installation-High thermal insulation
-High runoff coefficient (0.9)
-90% harvesting efficiency
High cost
2 BBank material (tezontle or tepetate)856.80-Cost
-High resistance against wind
-High runoff coefficient (0.9)
-90% harvesting efficiency
Medium thermal insulation
3 CNP *388.13-Cost
-High resistance against wind
-High runoff coefficient (0.9)
-90% harvesting efficiency
-No thermal insulation
-Low resistance against wind
-Requires constant maintenance
-Possible RW pollution by HMPTM
Note(s): A = Figure S6, Supplementary Material; B = Figure S7, Supplementary Material; C = Figure S8, Supplementary Material; NP= not proposed; RW = rainwater; HMPTM = heavy metals and potentially toxic metalloids; * rainwater conveyed by metallic gutters.
Publisher’s Note: MDPI stays neutral with regard to jurisdictional claims in published maps and institutional affiliations.