Article

Fenton Process for Treating Acrylic Manufacturing Wastewater: Parameter Optimization, Performance Evaluation, Degradation Mechanism

College of Chemistry and Environmental Engineering, China University of Mining and Technology (Beijing), Beijing 100083, China
*
Author to whom correspondence should be addressed.
Water 2022, 14(18), 2913; https://doi.org/10.3390/w14182913
Submission received: 19 August 2022 / Revised: 13 September 2022 / Accepted: 14 September 2022 / Published: 17 September 2022
(This article belongs to the Special Issue Advanced Oxidation Processes for Emerging Contaminant Removal)

Abstract

:
Acrylic manufacturing wastewater is characterized by high toxicity, poor biodegradability, high chemical oxygen demand (COD) and ammonia nitrogen. Herein, we exploited traditional Fenton technology to treat acrylic fiber manufacturing wastewater. The impacts of key operating variables including the initial concentration of H2O2 (CH2O2), the initial concentration of Fe2+ (DFe2+), and solution pH (pH) on the COD removal rate (RCOD) were explored and the treatment process was optimized by Response Surface Methodology (RSM). The results indicated that the optimum parameters are determined as pH 3.0, 7.44 mmol/L of Fe2+ and 60.90 mmol/L of H2O2 during Fenton process. For the actual acrylic manufacturing wastewater treatment shows that the removal rates for COD, TOC, NH4+-N and TN are 61.45%~66.51%, 67.82%~70.99%, 55.67%~60.97% and 56.45%~61.03%, respectively. It can meet the textile dyeing and finishing industry water pollutant discharge standard (GB4287-2012). During the Fenton reaction, the effective degradation and removal of organic matter is mainly achieved by HO• oxidation, supplemented by flocculation and sedimentation of Fe3+ complexes. This study will provide useful implications in the process parameters for the practical application of Fenton method in acrylic acid production wastewater.

1. Introduction

Acrylic fibers are one kinds of the significant manufacturing raw materials for the textile industry [1]. During the manufacture of acrylic fibers, a large volume of wastewater is inevitably generated. Owing to its high toxicity, poor biodegradability, high COD, and ammonia nitrogen, acrylic fiber manufacturing wastewater has been recognized as one of the problematic organic wastewaters [2]. In general, conventional biological methods have been used in the degradation of organic matters in acrylic fiber manufacturing wastewater. However, the effluent water quality treated by conventional biological processes such as A/O and A2/O alone usually cannot meet the national discharge standards [3]. Therefore, it is imperative to develop stable, effective, economical combined processes to treat acrylic manufacturing wastewater.
At present, the main approaches for the treatment of acrylic fiber manufacturing wastewater include but not limit to bio-enhanced treatment [4,5], membrane technology [6,7], advanced oxidation processes (AOP) [8,9], and coupled treatment processes [10]. C. Gong et al. [11] used an electro-coagulation (EC) process to pretreat acrylic fiber manufacturing wastewater. Under optimal conditions, the removal rate of total organic carbon was 44%, and the (Biochemical Oxygen Demand) BOD5/COD ratio was increased to 0.35. J. Wei et al. [12] combined Fenton-sequencing batch membrane bioreactor process for the treatment of acrylic fiber manufacturing wastewater. After Fenton oxidation treatment, the COD removal rate was 47.0%, and the ratio of BOD5/COD increased from 0.35 to 0.69. Microbubble-ozonation was used to treat refractory wet-spun acrylic fiber manufacturing wastewater with 42%, 21%, and 42% removal rates of COD, NH3-N, and UV254, respectively [13]. The degradation of refractory organics such as alkane aromatic compounds in wastewater was enhanced by microbubble ozone treatment, which resulted in improved biodegradability of the wastewater. J. Wei et al. [14] utilized the Fered-Fenton process to treat acrylic fiber manufacturing wastewater, resulting in an increase in the BOD5/COD ratio from 0.29 to over 0.68 after 180 min of treatment in which Ti was used as the cathode and RuO2/Ti as the anode. T. Zheng et al. [15] fabricated a three-dimensional electrochemical oxidation reactor to treat wet-spun acrylic fiber manufacturing wastewater, which significantly elevated the treatment efficiency of COD, NH3-N, TOC, and UV254 by 44.5%, 38.8%, 27.2%, and 10.9%, respectively. X. Xu and Z. Shao et al. [16] developed highly efficient peroxy monosulfate activated catalysts (e.g., LaSrCo0.8Fe0.2O4) that showed excellent performance in catalytic advanced oxidation applications of difficult to degrade organic pollutants. In terms of this, the enhanced pretreatment of acrylic fiber wastewater using advanced oxidation processes can achieve satisfactory treatment results.
Fenton advanced oxidation process, which is based on the generation of hydroxyl radicals (HO•), has the advantages of high oxidation and strong electron affinity [17]. The Fenton process can decompose refractory organic matter, and its by-product, Fe3+, have a favorable flocculation effect, which can simultaneously complete the degradation-coagulation-precipitation removal of organic matter. Therefore, the Fenton method is considered an effective method for treating refractory organic wastewater [18]. However, there are many intermediate products and side reactions in the Fenton reaction system. Once the reaction conditions are not adequately controlled, the utilization rate of H2O2 will decrease, resulting in insufficient mineralization of organic matter and a severe waste of raw materials [19]. Therefore, during the application of the Fenton method, the use of reagents, the conversion trend of H2O2, and the influence of operating parameters on the reaction system should be investigated to achieve the efficient utilization of the Fenton process and the economic degradation of pollutants. As mentioned above, this study adopts the response surface methodology to explore the effect of factors such as the concentration of H2O2, the amount of Fe2+ added, and the initial pH value on the degradation of organic matter. In addition, we discussed the interaction between various factors, the removal effect of refractory organic matter, and the mechanism of the reaction process. This research provides technical reference and a theoretical basis for applying the Fenton catalytic oxidation method in the treatment of acrylic fiber manufacturing wastewater.

2. Materials and Methods

2.1. Wastewater

The experimental acrylic fiber wastewater was obtained from the effluent of the secondary sedimentation tank after A/O process treatment in a sewage treatment plant in Jilin Province. The experimental wastewater was pretreated with concentrated sulfuric acid within 12 h after sampling. The main purpose of pretreatment of acrylic acid wastewater with concentrated sulfuric acid was to lower the pH of the solution to about 2. The storage time of acrylic wastewater was prolonged by lowering the pH of the water sample to slow down the microbial activity and inhibit the hydrolysis of ammonia-containing compounds. It is worth noting that the water samples must be used within 48 h. The physical and chemical indicators of wastewater are shown in Table 1.

2.2. Chemicals

All chemicals are of analytical grade. NaOH and H2SO4 (98%) were purchased from Beijing Chemical Reagent Co., Beijing, China. FeSO4·7H2O and H2O2 (30%) were purchased from Beijing Lanyi Chemical Co., Beijing, China.

2.3. Experimental Method

Since the degradation efficiency of COD by Fenton process was usually affected by the initial pH of the solution, the H2O2/FeSO4 ratio, the concentration of H2O2, FeSO4, reaction time, and temperature [20,21]. The initial concentrations of Fe2+ and H2O2 as well as the pH determined the amount of HO• production in the Fenton reaction, which was the active substance for the direct oxidation of COD [2,22,23,24]. The initial concentration of H2O2 (code A), the initial concentration of Fe2+ (code B), and the pH value (code C) was chosen as the primary factors. Firstly, single-factor experiments were conducted to explore the effect of COD degradation under different conditions. After that, response surface methodology was adopted to optimize conditions and analyze the interaction between factors to optimize the Fenton process. Taking the removal rate of COD as the response value, a three-factor and three-level Box-Behnken response surface design was carried out. The experimental factors, level codes, design schemes, and response values are shown in Table 2.
The experimental setup and procedure are shown in Figure 1. Firstly, 300.0 mL of acrylic fiber wastewater was added to the 500.0 mL beaker. The pH adjustment was achieved by titrating 0.1 or 1 mol/L of H2SO4 (or NaOH) solution under the condition of stirring intensity around 140 rpm. In which the pH of the solution was monitored by (LEICI PHB-4) portable pH meter to achieve precise regulation of the solution pH. Secondly, FeSO4·7H2O was added to the solution and stirred at 140.0 rpm. In addition, H2O2 (30% in mass fraction) was added to the solution to initiate the Fenton oxidation reaction. Finally, samples were taken at intervals to test the concentrations of Fe2+, COD, and H2O2.

2.4. Analytical Methods

The method of COD detection refers to the standard method “Water quality-Determination of the chemical oxygen demand-Dichromate method, HJ 828-2017” published by the Ministry of Ecology and Environment of the People’s Republic of China [25]. The detection method of ammonia nitrogen refers to the standard method “Water quali-ty-Determination of ammonia nitrogen-Nessler’s reagent spectrophotometry, HJ535-2009” published by the Ministry of Ecology and Environment of the People’s Republic of China [26]. The determination method of iron content refers to the standard method “Water quality-Determination of Iron-phenanthroline spectrophotometry, HJ/T 345-2007” published by the Ministry of Ecology and Environment of the People’s Republic of China [27]. The concentration of H2O2 was determined spectrophotometrically with potassium titanium oxalate. 5 mL of water sample was added to a 25 mL cuvette. 5 mL of potassium titanium oxalate solution (0.02 mol/L) was added. Deionized water was used to dilute to the scale. After standing for 8 min, the absorbance was determined at 385 nm. Deionized water was used as a reference during the determination [28,29].
GC-MS (Gas chromatograph-mass spectrometer) was used to detect the type (or concentration) of organics. The supernatant before and after the Fenton reaction was first filtered through a 0.45 mm membrane. Then the aqueous samples were then subjected to solid phase extraction, elution, dehydration and concentration procedures to complete the aqueous sample pretreatment. Samples were analyzed by GC-MS (GC (7890)-MS (5975), Agilent Technologies Inc.) equipped with a separation column (DB-5MS 30 m × 0.25 mm × 0.25 μm) with column template at 40 °C for 2 min. The inlet temperature was 290 °C for 4 min. Carrier gas conditions: high-purity nitrogen with a flow rate of 1.0 mL/min. MS conditions: ion source temperature 280 °C, interface temperature 280 °C, solvent delay time 5.0 min.

3. Results and Discussion

3.1. Examination of Main Factors That Affect the Removal of COD

In the Fenton reaction system, the initial concentration of Fe2+ and H2O2 as well as the pH value play a crucial role in the degradation of organic pollutants. [30]. Since they determine the amount of HO• production in the Fenton reaction, which is the active species for the direct oxidation of COD. Typically, the initial concentration of Fe2+ and pH was set to be 2~10 mmol/L and 3.0, respectively [31].

3.1.1. Initial Concentration of H2O2

Under this condition: (i) the initial concentration of Fe2+ was 6.25 mmol/L; (ii) the initial pH was 3.0; The effect of the initial concentration of H2O2 on the COD removal rate of acrylic fiber wastewater is shown in Figure 2a; The changes of Fe2+ and H2O2 concentration in the wastewater after the reaction are shown in Figure 2b,c.
As shown in Figure 2a, the COD removal efficiency increased from 41.03% to 62.39% as the initial concentration of H2O2 increased from 18.75 to 75.00 mmol/L. However, when the initial concentration of H2O2 increased to 93.75 mmol/L, the COD removal rate decreased slightly. The reason is that the increased H2O2 concentration can accelerate the reaction between H2O2 and Fe2+, leading to the generation of more HO• in the solution, thereby improving the COD removal rate. However, excess H2O2 will be quenched by HO•, causing the consumption of the HO• and the production of hydrogen peroxide radicals (HOO•) Equation (1) [32]. Simultaneously, the excess H2O2 will be self-decomposed to produce H2O and O2, reducing the utilization rate Equation (2).
Fe2+ + H2O2 → Fe3+ + OH + HO•
H2O2 + HO• → HOO• + H2O
The higher the concentration of H2O2 is, the lower the residual concentration of Fe2+ will be (Figure 2b). This trend was attributed to the increased H2O2 concentration promoting the conversion of Fe2+ to Fe3+. Notably, it can be observed that when the H2O2 concentration was added to 93.75 mmol/L, the residual amount of H2O2 in the solution at 30 min was 71.13 mg/L (or 2.09 mmol/L) (Figure 2c). This can be ascribed to the that the low Fe2+ concentration is hard to trigger the H2O2 reaction [33]. Therefore, it can be concluded that the initial concentration of H2O2 was not as high as possible, and the best initial concentration is 75.00 mmol/L.

3.1.2. The Initial Concentration of Fe2+

As shown in Figure 3a, the effect of Fe2+ concentration on the removal rate of COD at pH 3.0 and H2O2 concentration of 75 mmol/L. Figure 3b,c shows the changes of Fe2+ and H2O2 concentrations in the aqueous solution after the reaction.
As shown in Figure 3a, with the increase of initial concentration of Fe2+, the COD removal rate was increased gradually. The COD removal rate increased significantly from 51% to 65% when the initial concentration of Fe2+ increased from 2.50 mmol/L to 6.25 mmol/L. It can be observed that when the initial concentration of Fe2+ increases to 9.38 mmol/L, the COD removal rate decreases slightly. The trend of changes in the concentration of Fe2+ and H2O2 after the Fenton reaction was shown in Figure 3b,c. Within the reaction time of 0~5 min (Figure 3b), it was clearly observed that the Fe2+ concentration decreased rapidly, and then the curve gradually stabilizes. By comparing the slope of the reaction curve, it can be proved that the increased Fe2+ concentration can facilitate the reaction rate. Furthermore, the consumption rate of H2O2 increased with the increase of + the initial concentration of Fe2 (Figure 3c). Typically, at a low initial concentration of Fe2+, the rate of the reaction Equation (1) was slow and the amount of HO• produced was less than sufficient to oxidize the organic matter in water [17]. Meanwhile, the excess H2O2 reacted with the generated HO• Equation (2), which consumes H2O2 in the water that had not been catalytically decomposed, resulting in a lower COD removal rate [34]. However, when the initial concentration of Fe2+ was too high, too much HO• was produced at the beginning of the reaction. At the same time, a side reaction Equation (3) occurred, consuming HO• that had not yet participated in the oxidation reaction [35]. In addition, a large amount of HO• would react with each other to form H2O and O2 Equation (4) [35], which leaded to a decrease in COD removal rate. At a dose of 6.25 mmol/L of Fe2+, the H2O2 reacted completely within 30 min and the best COD removal was achieved. Therefore, the optimal initial concentration of Fe2+ was 6.25 mmol/L.
Fe2+ + HO• → Fe3+ + OH
4HO• → 2H2O + O2

3.1.3. Initial pH

The effect of initial pH on the COD removal rate of acrylic fiber wastewater is shown in Figure 4a. The change curve of the concentration of Fe2+ and H2O2 after the oxidation-reduction reaction is shown in Figure 4b,c. the initial concentration of Fe2+ was 6.25 mmol/L, and the initial concentration of H2O2 was 75 mmol/L.
The results presented in Figure 4a showed that it can be obtained the highest COD removal rate of 65.79% at a pH of 3.0, then the removal rate decreased slightly as the pH increased. According to the reaction mechanism of the Fenton reagent, the initial pH could directly interfere the complex equilibrium system of Fe2+ and Fe3+ in the solution, thereby affecting the oxidation ability of the Fenton reagent. As exhibited in Figure 4b,c, when the pH value was 2, the concentration of Fe2+ in the solution was relatively low while the concentration of H2O2 was relatively high within 30 min before the reaction. Due to the higher concentration of [H+], the reaction Equation (5) was in a reverse reaction state. Fe3+ reduction to Fe2+ was inhibited in this state, and the catalytic reaction could not proceed smoothly [36]. As a result, the generation rate of HO• was slowed down, and the oxidation capacity was reduced. When the pH value was > 3, it was obvious that the removal rate of COD gradually decreased, mainly due to the increase of OH- concentration, which leads to the decrease of reaction rate Equation (1), and thus the amount of HO• decreases. As shown in Figure 4b,c, most of the Fe2+ and H2O2 in the system reacted quickly and were consumed during the first 10 min. When the reaction time was between 10 and 30 min, the Fe2+ concentration gradually decreased and tended to be stable. When the pH was 2, 4, and 5, the concentration of H2O2 did not stabilize until 90 min. Notably, the highest utilization and reaction rate of H2O2 was achieved at pH 3, and the reaction equilibrium could be reached within 30 min. Therefore, the optimal pH value of this study was 3.0, which was consistent with the results of other research.
Fe3+ + H2O2 → Fe2+ + H+ + HOO•

3.2. Response Surface Analysis

3.2.1. Regression Model and Analysis of Variance

The results of the RSM model were presented in Table 3, giving the analysis of variance (ANOVA). It should be noted that the F value (Fisher variation ratio) and p value (probability value) in the analysis of the variance table were the leading indicators, showing the significance and adequacy of the model used. p value less than 0.05 means that the model was significant, while a value greater than 0.10 was usually regarded as a less critical factor [37]. The ANOVA of this model showed that the F value of lack of fit was 99.01, and the very low p value of lack of fit was 0.0003 (<0.05), indicating that these parameters in the model were highly significant. The F value of the regression model was 14.49, and p < 0.05, which also proved that the regression model was highly significant, and the experiment was reliable. As can be seen from Table 3, the R-Squared (R2) and Adjusted R-Squared (Raj2) of the model, respectively, were 0.95 and 0.89, indicating that the regression equation was highly reliable, which can explain 89% of the response value changes. Since p value was less than 0.05, A, B, B2, C2 can be regarded as vital terms. In addition, it was clear that C, A × B, and A × C were considered irrelevant terms. Therefore, the author obtained the equation relationship between the response and the variable, which was represented by the second-order polynomial equation fitting based on the coding factors (A, B, C):
R = 57.33 − 3.88 A + 2.86 B + 0.42 C − 0.29 A × B − 0.85 A × C − 2.87 B × C − 2.53 A2 − 5.76 B2 − 10.50 C2
where R is the removal of COD, A is the coded value of H2O2 concentration, B is the coded value of Fe2+ concentration, C is the coded value for pH.
The above regression equation can be used to predict the R-value within the range of the factors in this study. The value and sign of the regression coefficient indicated the influence of each item on the response. It can be seen from Equation (6) that the item with the highest regression coefficient in the interaction term was B*C, which indicated that the interaction term occupies a dominant position in the overall response. The positive sign of the coefficient indicated a synergistic effect, and the negative sign indicated an antagonistic effect.

3.2.2. Response Surface Optimization

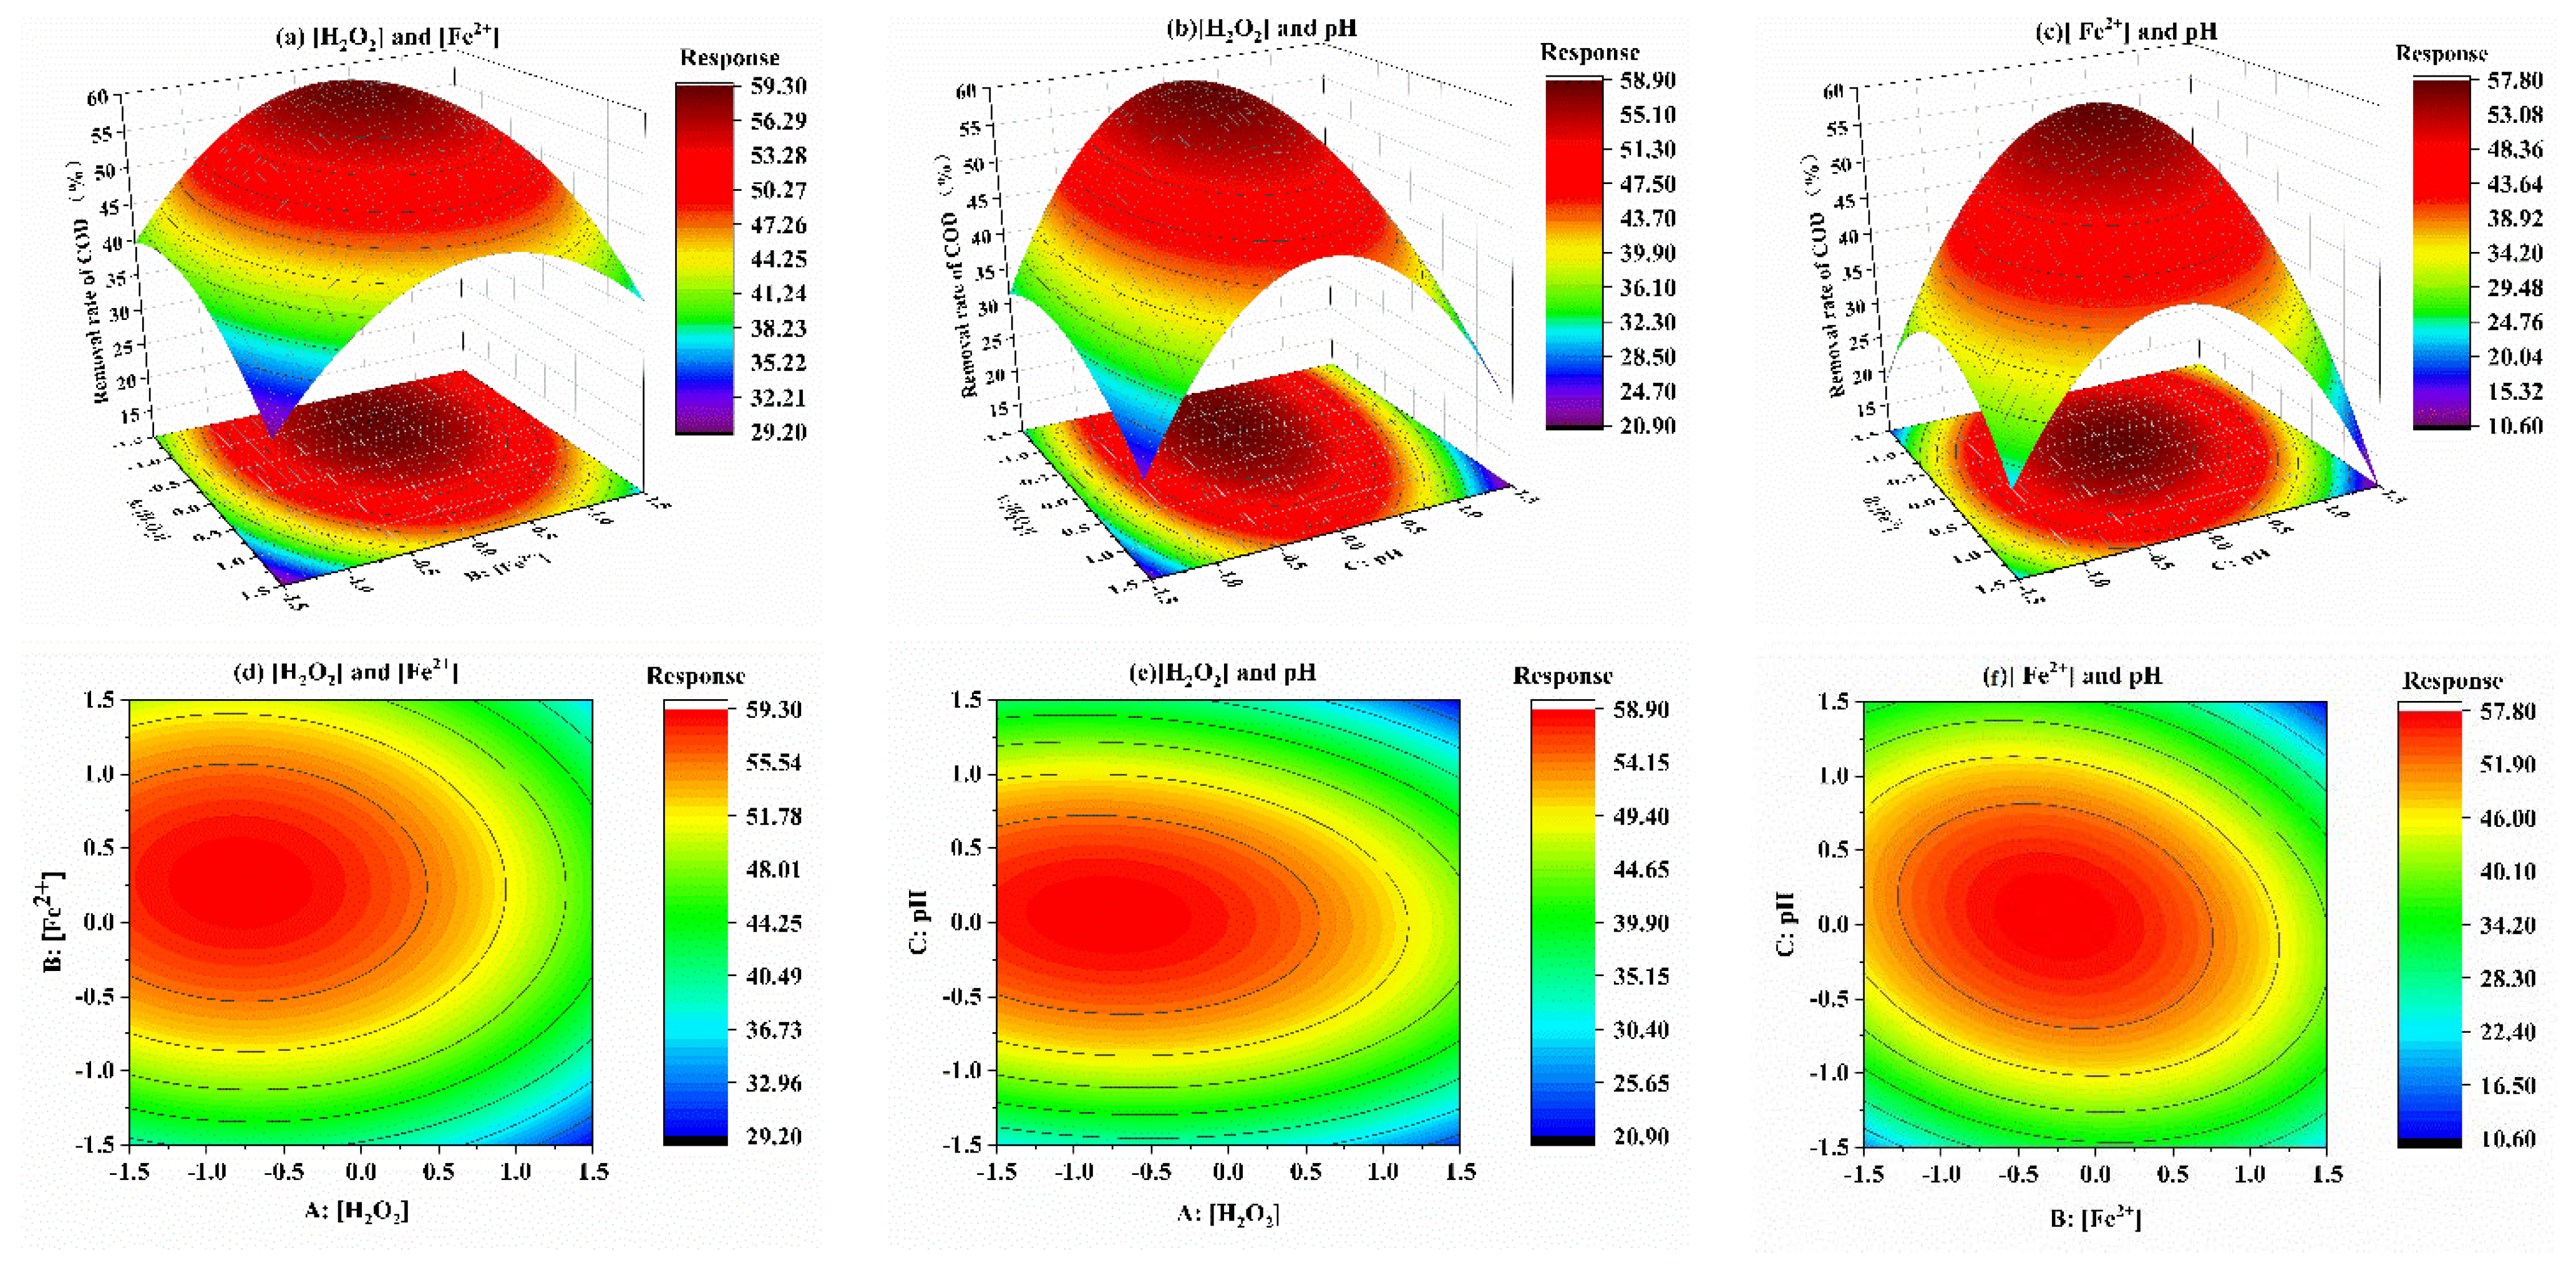
According to Table 2, the p value of A × B, A × C, and B × C were 0.831, 0.533, and 0.0623, respectively. To further determine the interaction between variables, the model Equation (1) was used for fitting, and the result was shown in Figure 5. It was clear that the removal rate of COD increased from 29.20% to 59.30% with the changes of A and B, when the pH was 3 (code value was 0). A view of Figure 5a,d, at the position of the center point, the range of A was near the −0.61 level and the range of B was near the 0.25 level. From Figure 5b,e, at the position of the center point, the range of A was near the −0.65 level and the range of pH was near the 0.10 level. As described in Figure 5c,f, at the position of the center point, the range of B was near the 0.25 level and the range of C was near the 0.1 level. The larger the difference between the coded value of the Center Point and the 0.00 level, the greater the interaction between the two factors [38]. As explained previously, the order of the influence of each variable on COD degradation was: A-[H2O2] > B-[Fe2+] > C-pH. In addition, it was apparent that the interaction between B-[Fe2+] and C-pH had a more substantial impact.

3.2.3. Verification of Optimal COD Degradation Conditions

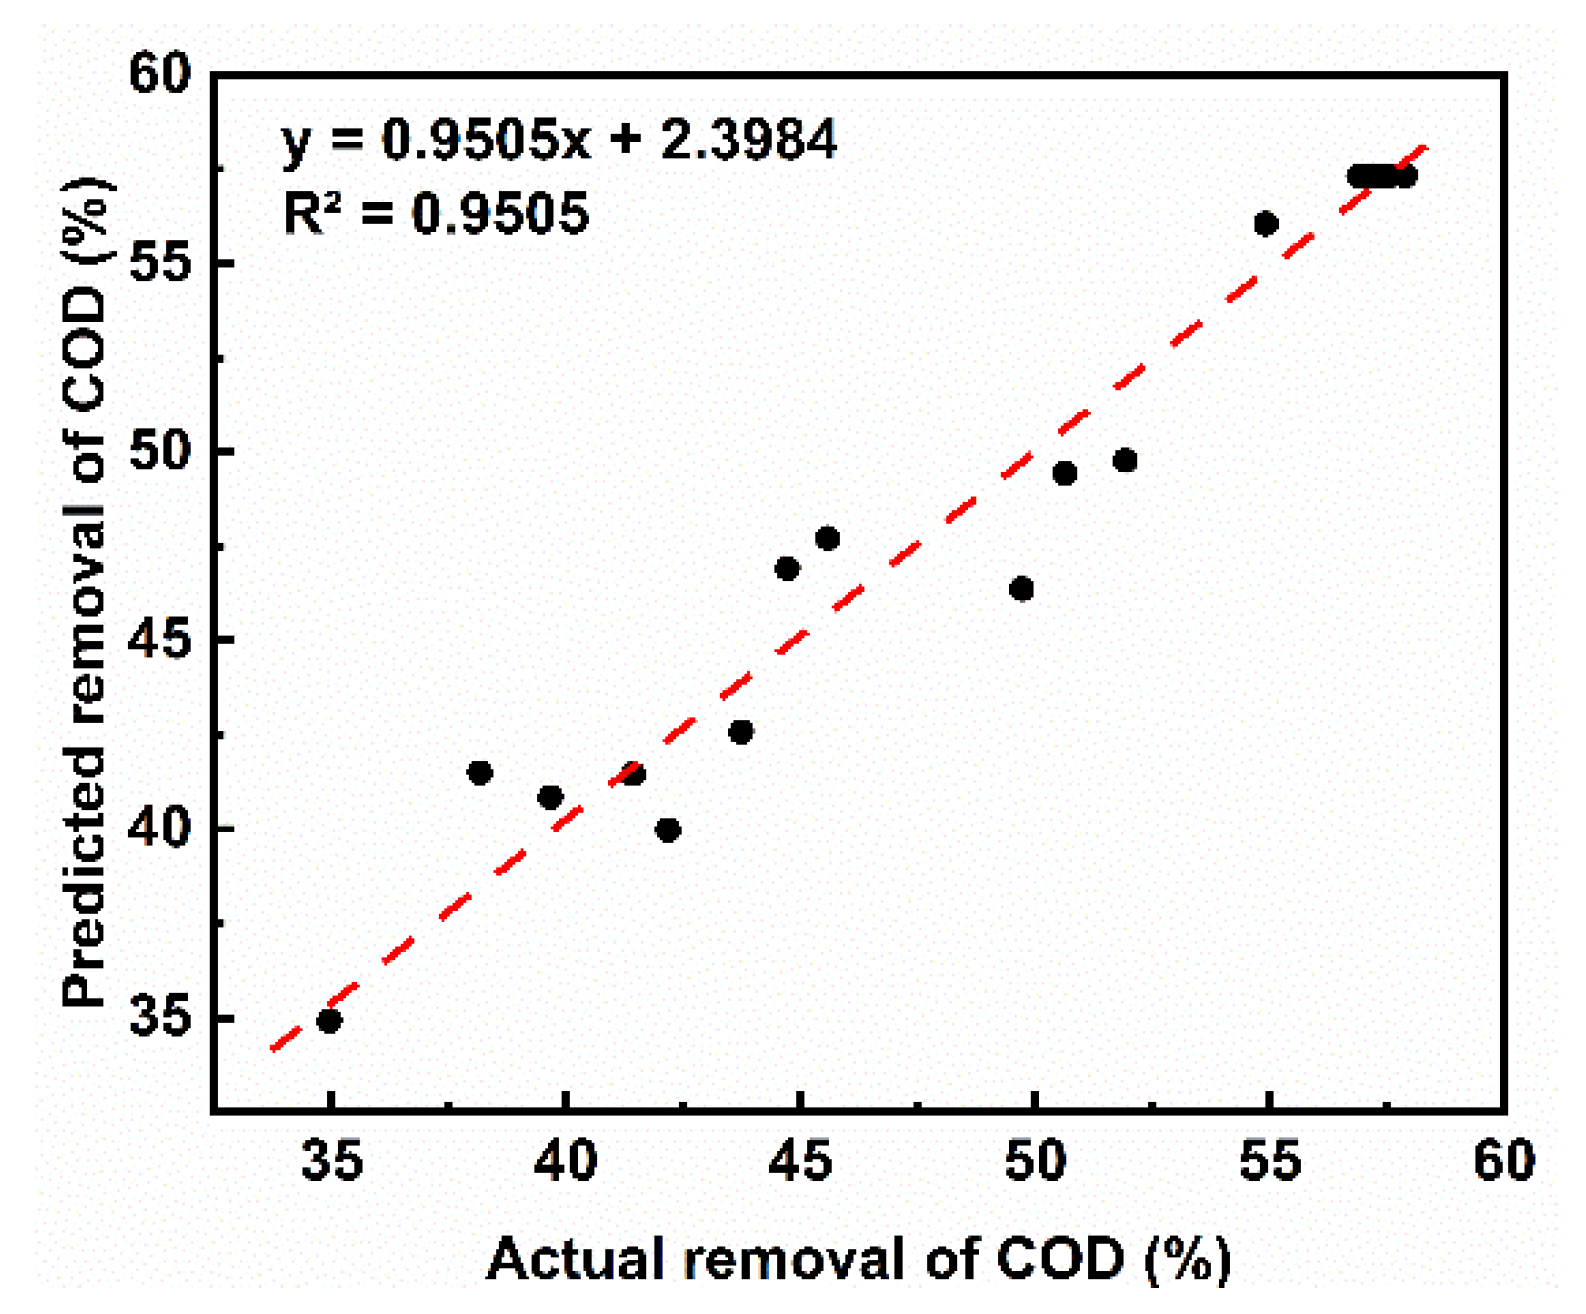
As shown in Figure 6, after linear fitting between the predicted and actual values, the R2 was 0.95, which showed that the predicted result had a high degree of credibility [39]. With the use of the Fenton process to degrade COD in acrylic fiber wastewater, and through response surface optimization analysis, the optimal degradation conditions were: (i)the initial concentration of H2O2 was 60.30 mmol/L; (ii) the initial concentration of Fe2+ was 7.46 mmol/L; (iii) the pH was 3; (iv) COD removal rate was 59.22%. The experiment was repeated three times under the above-optimized conditions, and the results were presented in Table 4. Obviously, it can be observed that after treatment, the acrylic fiber wastewater effluent can meet the secondary discharge requirements of the “Integrated Wastewater Discharge Standard” (GB4287-2012) [40].). The COD removal rate’s actual and predicted values were 63.2% and 59.8%, and the error was less than 5%. Therefore, the confidence of the obtained model was strong.

3.3. Removal Effect of Refractory Organic Matter

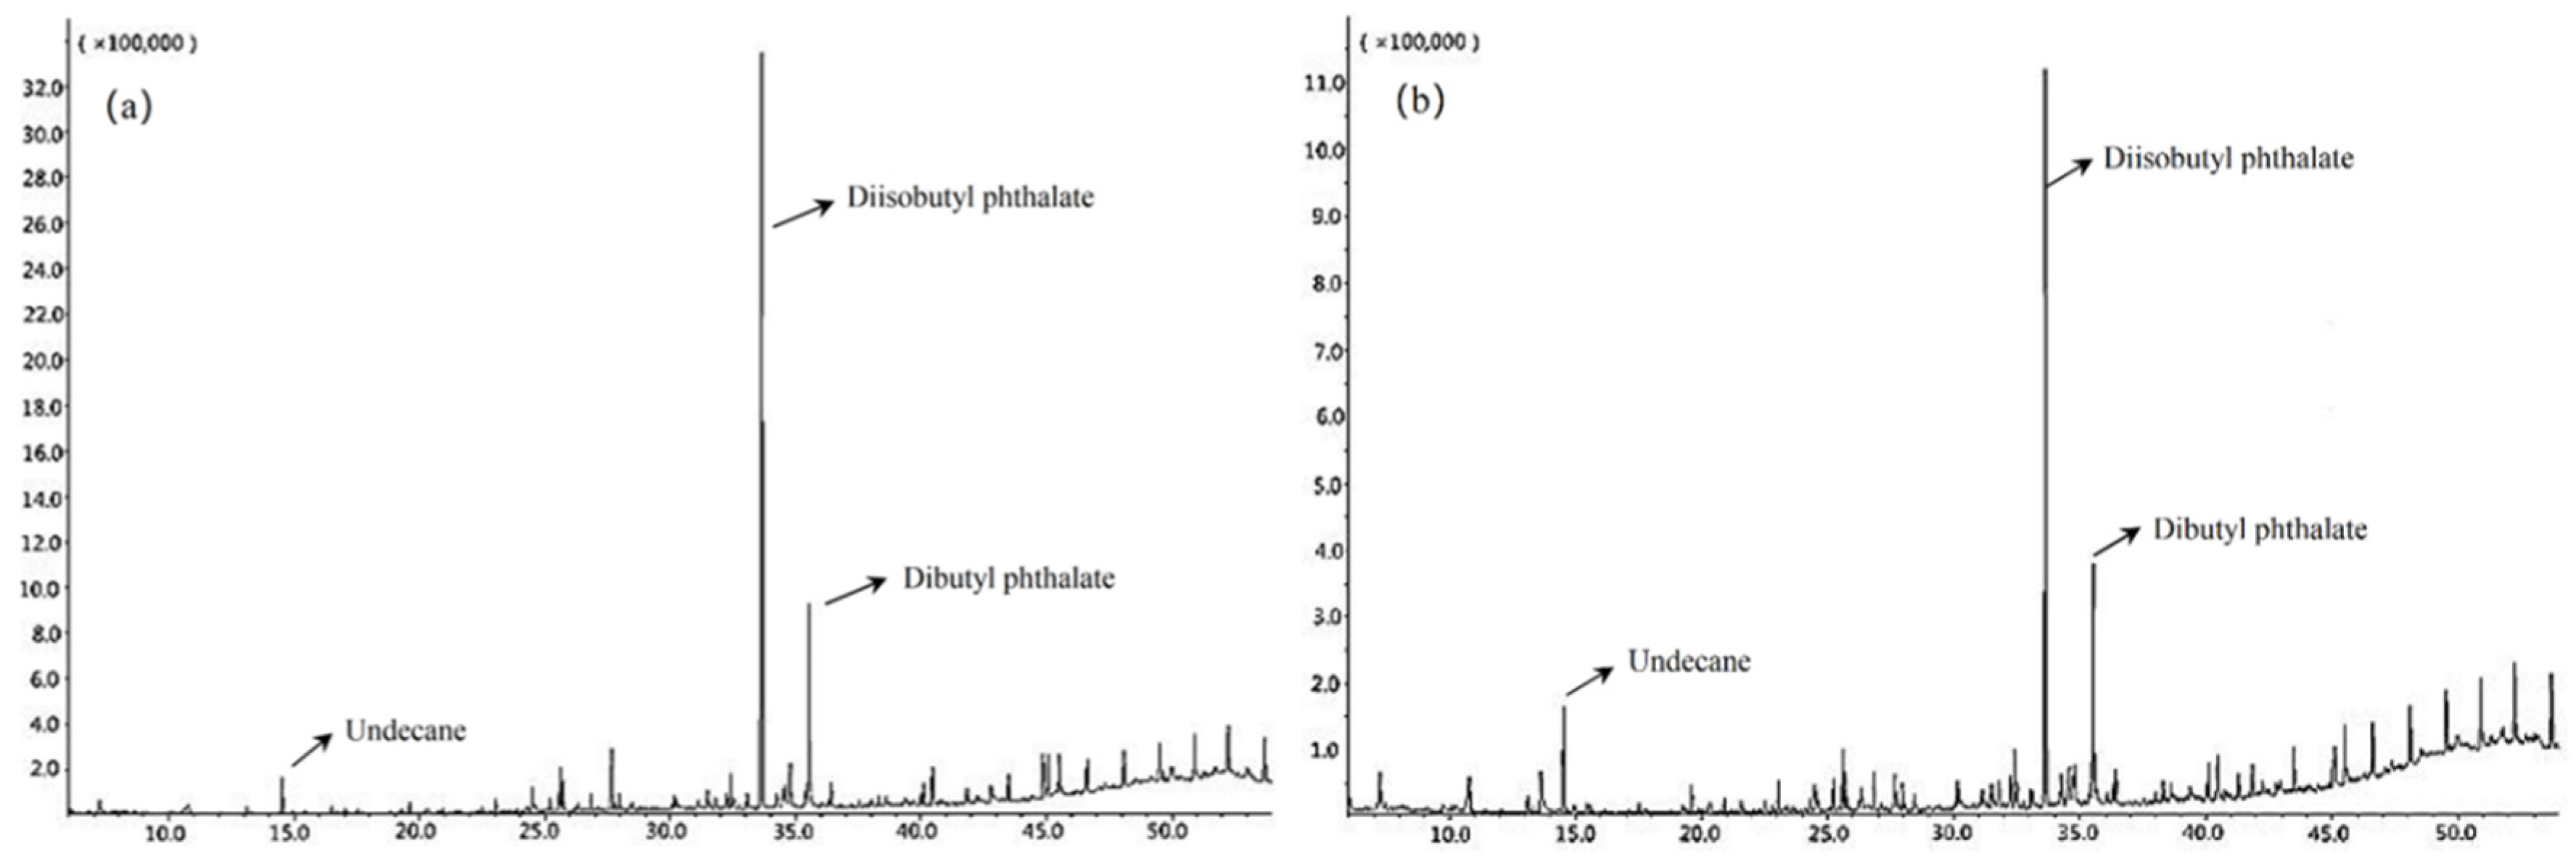
In order to evaluate the degradation effect of toxic and difficult-to-degrade organic pollutants in acrylic fiber wastewater, gas chromatography-mass spectrometry (GC-MS) was used to detect toxic and hazardous substances in the wastewater. Based on the optimal process conditions (The initial concentration of H2O2 was 60.30 mmol/L, the initial concentration of Fe2+ was 7.46 mmol/L, the pH was 3), the actual acrylic manufacturing wastewater was treated by the Fenton method. The results were presented in Figure 7. It was evident that the chromatographic peaks of most organics in the water after Fenton treatment were weakened. Moreover, the raw water contained 16 primary organic pollutants, mainly including aromatic hydrocarbons and long-chain alkanes. It can be seen that the concentration of organic pollutants had been significantly reduced after the Fenton process, demonstrating that the Fenton process can convert refractory organic matter into small molecular organics or inorganics [41]. In addition, as shown in Table 5, Undecane, Diisobutyl phthalate and Dibutyl phthalate still existed in the effluent. We speculated that Undecane might be the final product of the degradation of long-chain alkanes. In the Fenton oxidation process, HO• preferentially oxidized small molecular organic compounds, followed by other large molecular organic compounds [42]. Since Diisobutyl phthalate and Dibutyl phthalate were macromolecular organic compounds, and the concentration in the influent was relatively high. As a result, Diisobutyl phthalate and Dibutyl phthalate in the effluent was not wholly removed. Notably, the Fenton process can remove most of the refractory organic matter in acrylic fiber wastewater.

3.4. Mechanism Analysis

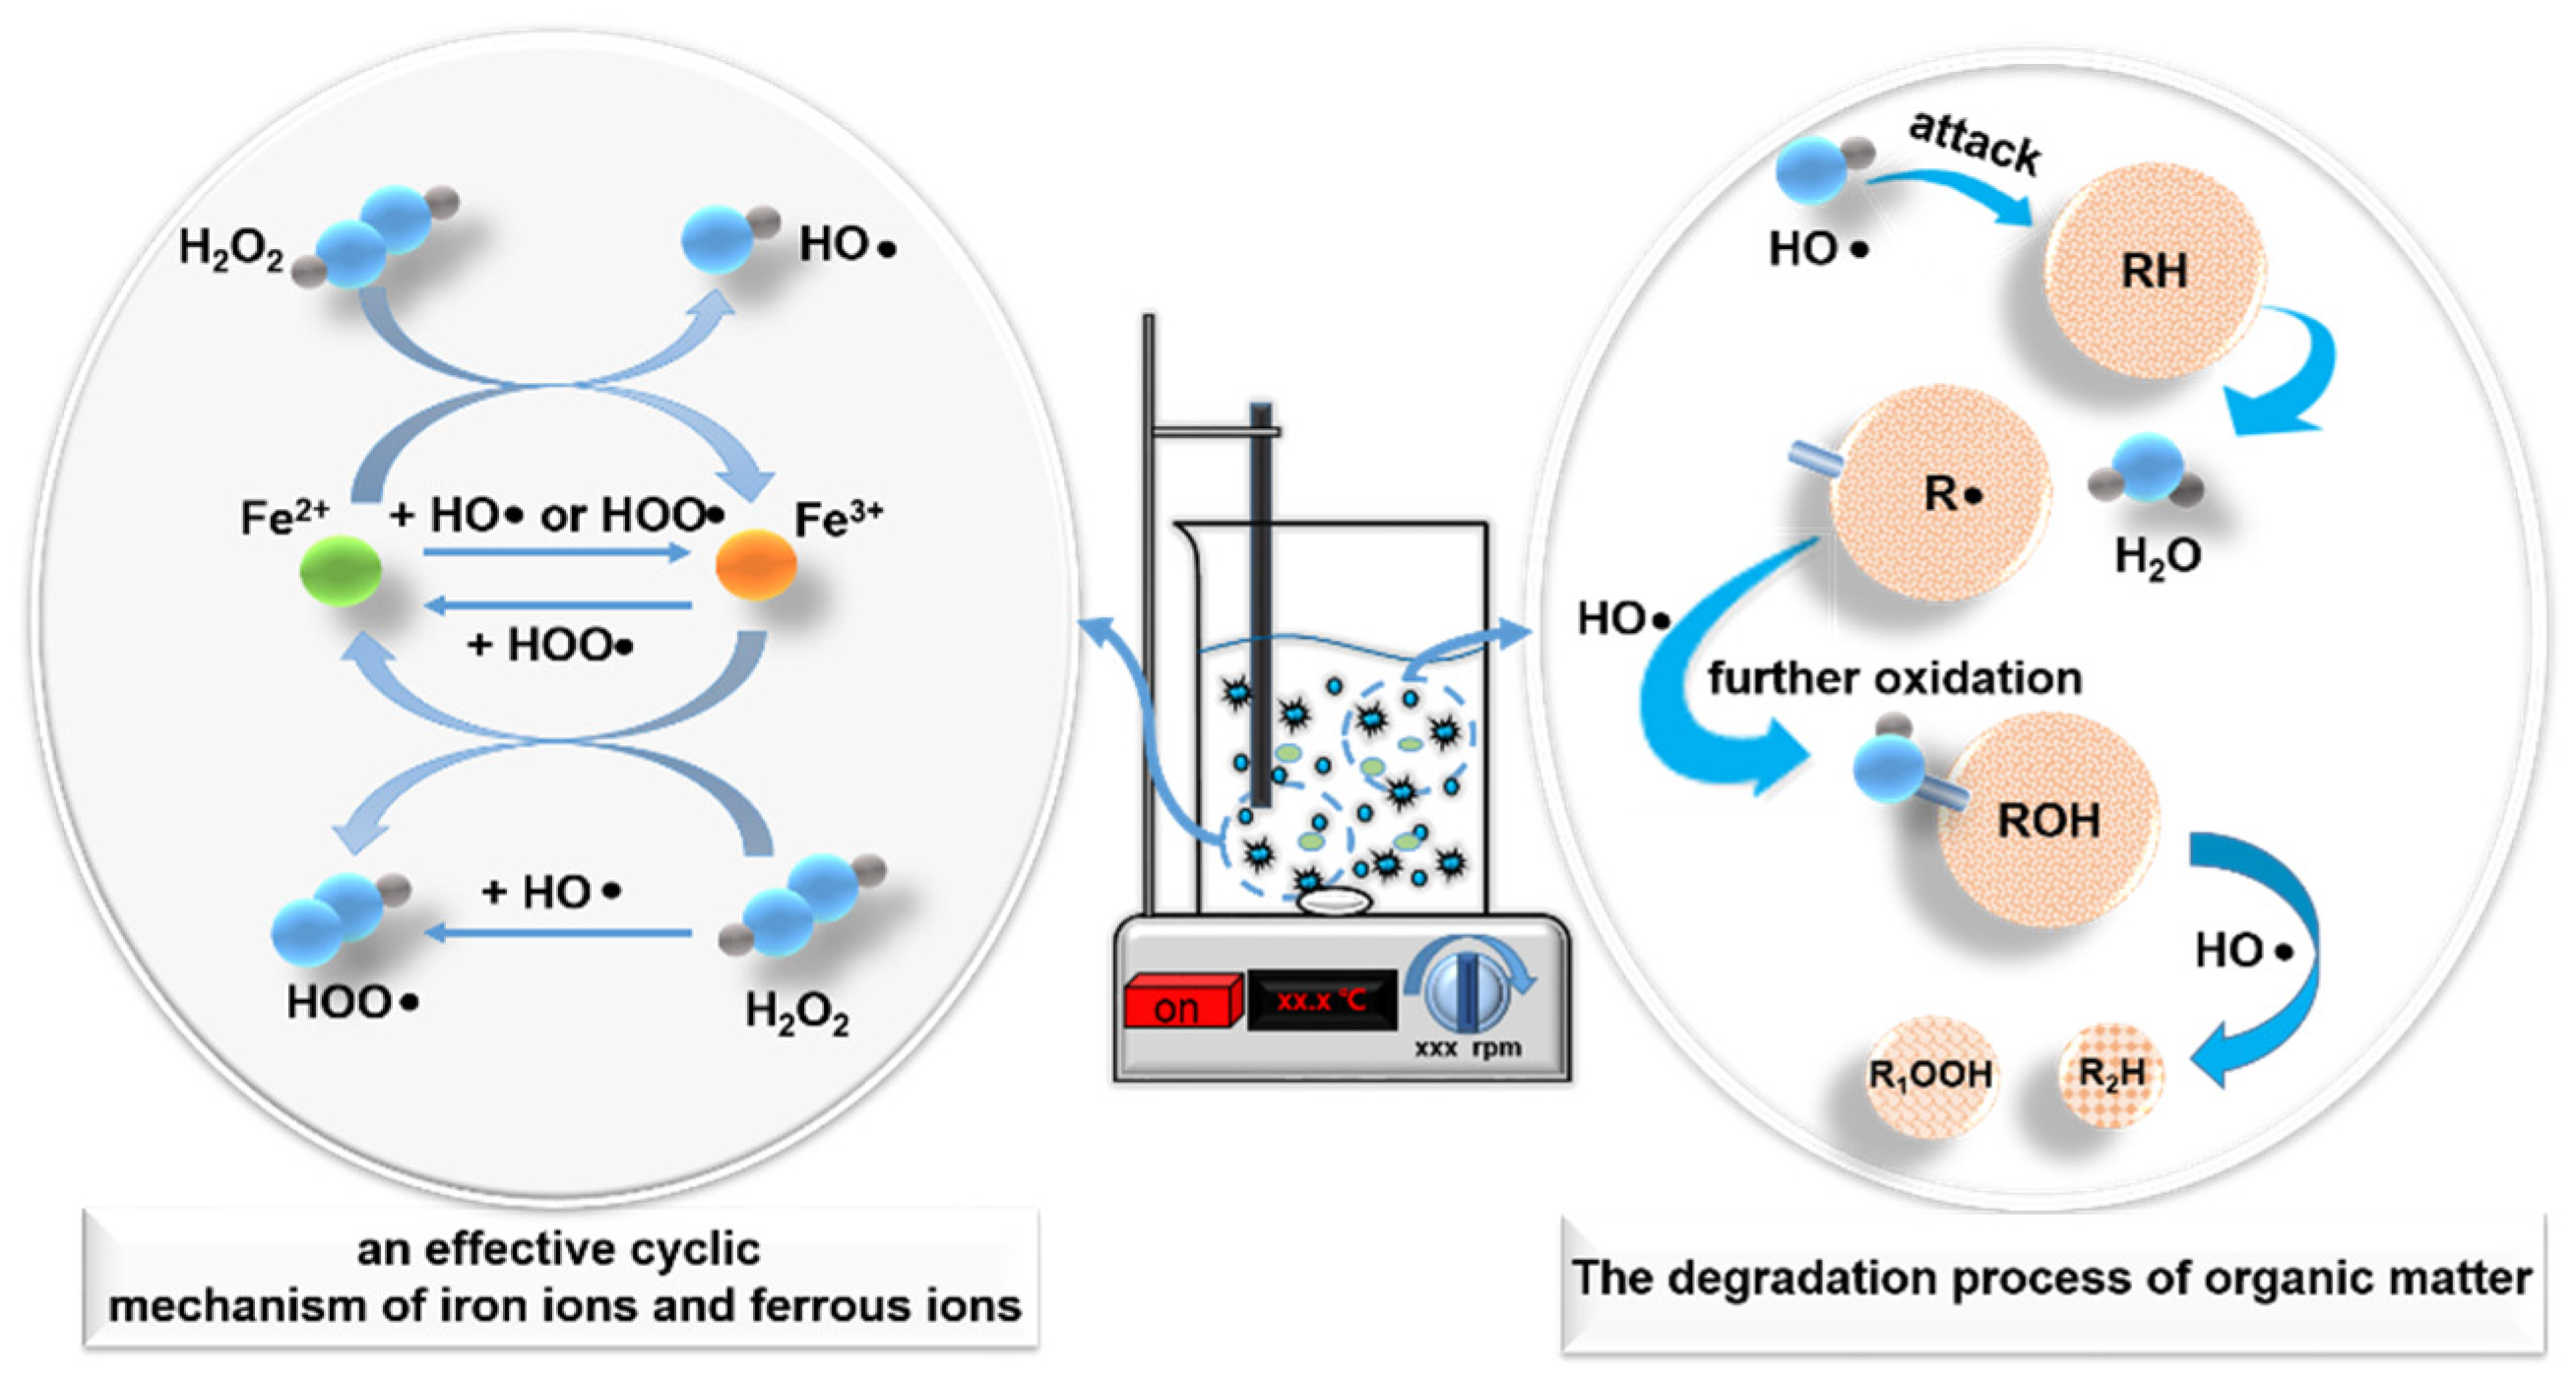
In brief, the degradation of acrylic fiber wastewater by the Fenton process was based on the HO•, which can degrade organic pollutants through oxidation, generated during the electron transfer process between H2O2 and a homogeneous metal catalyst (Fe2+) [43]. Equations (1)–(5), (7)–(9) described the essential reactions in the Fenton process [2,44,45,46,47]. The production of HO• represented the beginning of the process, which the interaction of Fe2+ with H2O2 Equation (1). Meanwhile, the generated Fe3+, which were reduced to Fe2+ by H2O2, undergo a Fenton-like reaction Equation (5). When there were too many Fe2+, it would react with HO• to produce Fe3+ Equation (3). Therefore, Equations (1) and (3) were the primary sources of Fe3+. Excessive H2O2 reacted with HO• to generate HOO•, which oxidation activity was lower than HO•.
A large amount of HOO• was consumed through reacting with Fe3+, Fe2+, and HO• Equations (7)–(9), enabling an effective cyclic mechanism of Fe3+ and Fe2+.
Fe3+ + HOO• → Fe2+ + H+ + O2
Fe2+ + HOO• → Fe3+ + HO2
HOO• + HO• → H2O + O2
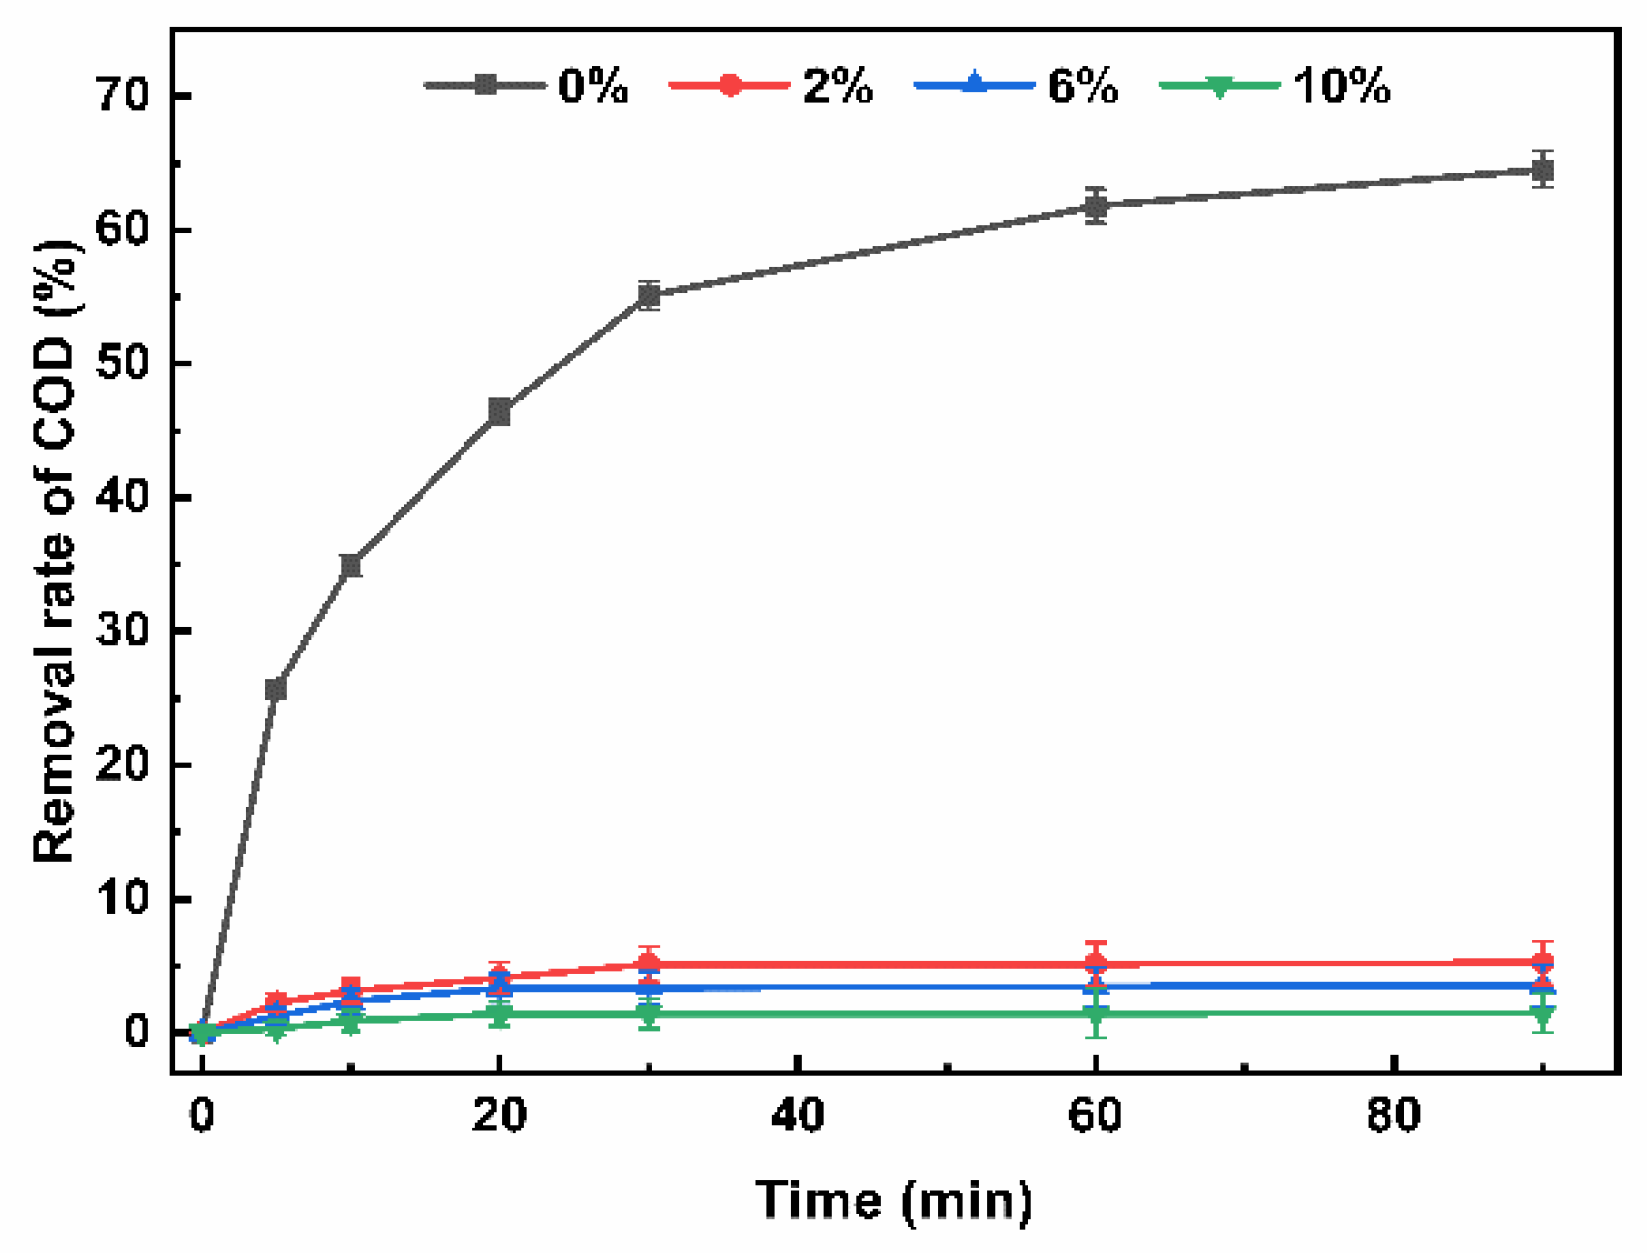
In addition, a great deal of HO•, which had high oxidation, was produced through the above reaction. In order to demonstrate that the degradation of acrylic acid wastewater is based on the oxidation of HO•, HO• scavenging experiments based on the degradation of acrylic acid wastewater by Fenton system were carried out. It has been shown that isopropyl alcohol reacts rapidly with HO- and competes with the target substrate, thus effectively inhibiting the reaction of the target substrate with HO• [48]. Therefore, in this experiment isopropyl alcohol (IPA) was used to remove the active species associated with the degradation of organic matter. Figure 8 shows the effect of using different concentrations (0%, 2%, 6%, 10%) of isopropanol on the degradation of organic matter in acrylic acid wastewater based on the optimal fenton process conditions (mentioned in Section 3.2.3). As can be seen from Figure 8, the inhibition effect of isopropanol is obvious, with 2%, 6%, and 10% isopropanol almost completely inhibiting the degradation of organics. It indicates that HO• is the main active species in this Fenton system for the degradation of organic matter. Therefore, the mechanism in the degradation process of organic matter in acrylic wastewater was speculated as follows. In the presence of organic molecules (RH) from acrylic manufacturing wastewater, the generated HO• attacked the organic molecules by absorbing protons, producing highly reactive organic radicals (R•), which could be further oxidized to generate ROH Equations (10) and (11) [20,43,49]. Further, ROH was oxidized by HO• to form R1OOH and R2H to achieve the conversion of organic macromolecules to organic small molecules Equations (10) and (11). In addition, R1OOH was easily oxidized by HO• to form smaller molecular weight organic matter (R3H), H2O and CO2 Equation (12). The efficient degradation of organic matter in acrylic wastewater was achieved through the oxidation reactions of Equations (10)–(13) (where R, R1, R2, and R3 represent one or more products in the degradation stage). Furthermore, H2O2 was generated via a reaction among HO• Equation (14).
HO• + RH → R• + H2O
HO• + R• → ROH
HO• + ROH → R1OOH + R2H
HO• + R1OOH → R3H + CO2 + H2O
HO• + HO• →H2O2
The mechanism for the degradation of acrylic manufacturing wastewater by the Fenton process is explained in Figure 9. The chain reaction can continue until the H2O2 was completely consumed because Fe2+ acted as a catalyst and transmitter in the reaction. Various free radicals and intermediate substances, such as HOO•, Fe3+ and HO•, were generated during the reaction as the nodes of the chemical reaction chain. In addition, Fe3+ was readily hydrolyzed and forms complexes. The flocculation and precipitation processes of these complexes also played an important role in removing organic matter. The degradation of organic matter was achieved through a series of reactions as described above.

4. Conclusions

(1)
The optimization analysis combined with the response surface method showed that the optimal degradation conditions for acrylic fiber wastewater using the Fenton method are: (i) initial H2O2 concentration of 60.90 mmol/L; (ii) initial Fe2+ concentration of 7.44 mmol/L; (iii) pH of 3. The predicted degradation efficiency of the model equation was 59.8%, and the actual COD degradation rate was 63.2%.
(2)
The deviation between the actual and fitted model values was less than 5%, indicating that the model equation had a high degree of credibility. According to the analysis of the influence of factors and variables, it can be seen that the influence order of the three factors was [H2O2] > [Fe2+] > pH. In addition, the interaction between [Fe2+] and pH had the most significant impact on the degradation of COD.
(3)
For the actual acrylic fiber wastewater treatment, the removal rate of COD, TOC, NH4+-N, TN is 61.45%~66.51%, 67.82%~70.99%, 55.67%~60.97%, 56.45%~61.03%, respectively. The effluent met the textile dyeing and finishing industry water pollutant discharge standard “GB4287-2012”. The COD, TOC, NH4+-N, and TN were decreased to 93.3 ± 3.5 mg/L, 28.2 ± 0.7 mg/L, 26.4 ± 0.6 mg/L, 34.5 ± 0.6 mg/L, respectively.
(4)
HO• generated during electron transfer between H2O2 and Fe2+ effectively decompose organic pollutants in acrylic production wastewater. In this case, 13 kinds of aromatic hydrocarbons and long-chain alkanes in acrylic fiber wastewater had been effectively removed.

Author Contributions

Conceptualization, Z.L. and C.Z.; methodology, Z.L.; software, Z.L., and P.S.; validation, Z.L., C.Z. and P.S.; formal analysis, Z.L.; investigation, Z.L.; resources, Z.L.; data curation, Z.L.; writing—original draft preparation, Z.L.; writing—review and editing, P.S. and Z.L.; visualization, W.L. and Z.Z.; supervision, Z.Z., X.W. and W.H.; project administration, C.Z.; funding acquisition, C.Z. All authors have read and agreed to the published version of the manuscript.

Funding

This research received no external funding.

Institutional Review Board Statement

“Not applicable” for studies not involving humans or animals.

Informed Consent Statement

“Not applicable.” for studies not involving humans.

Data Availability Statement

Data are contained within the article.

Acknowledgments

This research is supported by the National Research Foundation China, and China University of Mining and Technology (Beijing) under the laboratory of the Institute for Total Process Pollution Control and Circular Economy.

Conflicts of Interest

The authors declare no conflict of interest.

References

  1. Pattnaik, P.; Dangayach, G.S.; Bhardwaj, A.K. A review on the sustainability of textile industries wastewater with and without treatment methodologies. Rev. Environ. Health 2018, 33, 163–203. [Google Scholar] [CrossRef] [PubMed]
  2. Li, J.; Luan, Z.; Yu, L.; Ji, Z. Pretreatment of acrylic fiber manufacturing wastewater by the Fenton process. Desalination 2012, 284, 62–65. [Google Scholar] [CrossRef]
  3. Holkar, C.R.; Jadhav, A.J.; Pinjari, D.V.; Mahamuni, N.M.; Pandit, A.B. A critical review on textile wastewater treatments: Possible approaches. J. Environ. Manag. 2016, 182, 351–366. [Google Scholar] [CrossRef] [PubMed]
  4. Hai, F.I.; Yamamoto, K.; Nakajima, F.; Fukushi, K. Bioaugmented membrane bioreactor (MBR) with a GAC-packed zone for high rate textile wastewater treatment. Water Res. 2011, 45, 2199–2206. [Google Scholar] [CrossRef]
  5. Qin, L.; Zhang, G.; Meng, Q.; Xu, L.; Lv, B. Enhanced MBR by internal micro-electrolysis for degradation of anthraquinone dye wastewater. Chem. Eng. J. 2012, 210, 575–584. [Google Scholar] [CrossRef]
  6. Cinperi, N.C.; Ozturk, E.; Yigit, N.O.; Kitis, M. Treatment of woolen textile wastewater using membrane bioreactor, nanofiltration and reverse osmosis for reuse in production processes. J. Clean. Prod. 2019, 223, 837–848. [Google Scholar] [CrossRef]
  7. Deowan, S.A.; Galiano, F.; Hoinkis, J.; Johnson, D.; Altinkaya, S.A.; Gabriele, B.; Hilal, N.; Drioli, E.; Figoli, A. Novel low-fouling membrane bioreactor (MBR) for industrial wastewater treatment. J. Membr. Sci. 2016, 510, 524–532. [Google Scholar] [CrossRef]
  8. GilPavas, E.; Dobrosz-Gómez, I.; Gómez-García, M.Á. Coagulation-flocculation sequential with Fenton or Photo-Fenton processes as an alternative for the industrial textile wastewater treatment. J. Environ. Manag. 2017, 191, 189–197. [Google Scholar] [CrossRef]
  9. Giannakis, S.; Lin, K.-Y.A.; Ghanbari, F. A review of the recent advances on the treatment of industrial wastewaters by Sulfate Radical-based Advanced Oxidation Processes (SR-AOPs). Chem. Eng. J. 2021, 406, 127083. [Google Scholar] [CrossRef]
  10. Paździor, K.; Bilińska, L.; Ledakowicz, S. A review of the existing and emerging technologies in the combination of AOPs and biological processes in industrial textile wastewater treatment. Chem. Eng. J. 2019, 376, 120597. [Google Scholar] [CrossRef]
  11. Gong, C.; Zhang, Z.; Li, H.; Li, D.; Wu, B.; Sun, Y.; Cheng, Y. Electrocoagulation pretreatment of wet-spun acrylic fibers manufacturing wastewater to improve its biodegradability. J. Hazard. Mater. 2014, 274, 465–472. [Google Scholar] [CrossRef] [PubMed]
  12. Wei, J.; Song, Y.; Meng, X.; Pic, J.-S. Combination of Fenton oxidation and sequencing batch membrane bioreactor for treatment of dry-spun acrylic fiber wastewater. Environ. Earth Sci. 2015, 73, 4911–4921. [Google Scholar] [CrossRef]
  13. Zheng, T.; Wang, Q.; Zhang, T.; Shi, Z.; Tian, Y.; Shi, S.; Smale, N.; Wang, J. Microbubble enhanced ozonation process for advanced treatment of wastewater produced in acrylic fiber manufacturing industry. J. Hazard. Mater. 2015, 287, 412–420. [Google Scholar] [CrossRef] [PubMed]
  14. Wei, J.; Song, Y.; Meng, X.; Tu, X.; Pic, J.-S. Transformation characteristics of organic pollutants in Fered-Fenton process for dry-spun acrylic fiber wastewater treatment. Water Sci. Technol. 2014, 70, 1976–1982. [Google Scholar] [CrossRef]
  15. Zheng, T.; Wang, Q.; Shi, Z.; Fang, Y.; Shi, S.; Wang, J.; Wu, C. Advanced treatment of wet-spun acrylic fiber manufacturing wastewater using three-dimensional electrochemical oxidation. J. Environ. Sci. 2016, 50, 21–31. [Google Scholar] [CrossRef] [PubMed]
  16. Yang, L.; Jiao, Y.; Xu, X.; Pan, Y.; Su, C.; Duan, X.; Sun, H.; Liu, S.; Wang, S.; Shao, Z. Superstructures with Atomic-Level Arranged Perovskite and Oxide Layers for Advanced Oxidation with an Enhanced Non-Free Radical Pathway. ACS Sustain. Chem. Eng. 2022, 10, 1899–1909. [Google Scholar] [CrossRef]
  17. Han, X.; Lu, H.; Gao, Y.; Chen, X.; Yang, M. The role of in situ Fenton coagulation on the removal of benzoic acid. Chemosphere 2020, 238, 124632. [Google Scholar] [CrossRef]
  18. Pignatello, J.J.; Oliveros, E.; MacKay, A. Advanced Oxidation Processes for Organic Contaminant Destruction Based on the Fenton Reaction and Related Chemistry. Crit. Rev. Environ. Sci. Technol. 2006, 37, 273–275. [Google Scholar] [CrossRef]
  19. He, D.-Q.; Zhang, Y.-J.; Pei, D.-N.; Huang, G.-X.; Liu, C.; Li, J.; Yu, H.-Q. Degradation of benzoic acid in an advanced oxidation process: The effects of reducing agents. J. Hazard. Mater. 2020, 382, 121090. [Google Scholar] [CrossRef]
  20. Neyens, E.; Baeyens, J. A review of classic Fenton’s peroxidation as an advanced oxidation technique. J. Hazard. Mater. 2003, 98, 33–50. [Google Scholar] [CrossRef]
  21. Brillas, E.; Sirés, I.; Oturan, M.A. Electro-Fenton Process and Related Electrochemical Technologies Based on Fenton’s Reaction Chemistry. Chem. Rev. 2009, 109, 6570–6631. [Google Scholar] [CrossRef] [PubMed]
  22. Walha, K.; Amar, R.B.; Quemeneur, F.; Jaouen, P. Treatment by nanofiltration and reverse osmosis of high salinity drilling water for seafood washing and processing Abstract. Desalination 2008, 219, 231–239. [Google Scholar] [CrossRef]
  23. Wei, J.; Song, Y.; Tu, X.; Zhao, L.; Zhi, E. Pretreatment of dry-spun acrylic fiber manufacturing wastewater by Fenton process: Optimization, kinetics and mechanisms. Chem. Eng. J. 2013, 218, 319–326. [Google Scholar] [CrossRef]
  24. Pérez, M.; Torrades, F.; Domènech, X.; Peral, J. Fenton and photo-Fenton oxidation of textile effluents. Water Res. 2002, 36, 2703–2710. [Google Scholar] [CrossRef]
  25. NEPA. Water Quality-Determination of the Chemical Oxygen Demand-Dichromate Method. China National Standard HJ828-2017; China National Environmental Protection Administration(NEPA), 2017. Available online: https://www.mee.gov.cn/ywgz/fgbz/bz/bzwb/jcffbz/201704/W020170606398873416325.pdf (accessed on 1 May 2017).
  26. NEPA. Water Quality-Determination of Ammonia Nitrogen-Nessler’s Reagent Spectrophotometry. China National Standard HJ535-2009; China National Environmental Protection Administration(NEPA), 2009. Available online: https://www.mee.gov.cn/ywgz/fgbz/bz/bzwb/jcffbz/201001/W020180319535685015821.pdf (accessed on 1 April 2010).
  27. NEPA. Water Quality—Determination of Iron—Phenanthroline Spectrophotometry. China National Standard HJ/T 345—2007; China National Environmental Protection Administration(NEPA), 2007. Available online: https://www.mee.gov.cn/ywgz/fgbz/bz/bzwb/jcffbz/200703/W020120104561152753262.pdf (accessed on 1 May 2007).
  28. Zhao, H.; Dong, M.; Wang, Z.; Wang, H.; Qi, H. Roles of free radicals in NO oxidation by Fenton system and the enhancement on NO oxidation and H2O2 utilization efficiency. Environ. Technol. 2020, 41, 109–116. [Google Scholar] [CrossRef]
  29. LU, P. Spectrophotometric determination of hydrogen peroxide in Fenton advanced oxidation systems by potassium titanyl oxalate. Archit. Eng. Technol. Des. 2014, 582–582, 517. [Google Scholar] [CrossRef]
  30. Tekbaş, M.; Yatmaz, H.C.; Bektaş, N. Heterogeneous photo-Fenton oxidation of reactive azo dye solutions using iron exchanged zeolite as a catalyst. Microporous Mesoporous Mater. 2008, 115, 594–602. [Google Scholar] [CrossRef]
  31. Teel, A.L.; Warberg, C.R.; Atkinson, D.A.; Watts, R.J. Comparison of mineral and soluble iron Fenton’s catalysts for the treatment of trichloroethylene. Water Res. 2001, 35, 977–984. [Google Scholar] [CrossRef]
  32. Verma, M.; Haritash, A.K. Degradation of amoxicillin by Fenton and Fenton-integrated hybrid oxidation processes. J. Environ. Chem. Eng. 2019, 7, 102886. [Google Scholar] [CrossRef]
  33. Zazouli, M.A.; Yousefi, Z.; Eslami, A.; Ardebilian, M.B. Municipal solid waste landfill leachate treatment by fenton, photo-fenton and fenton-like processes: Effect of some variables. Iran. J. Environ. Health Sci. Eng. 2012, 9, 3. [Google Scholar] [CrossRef] [Green Version]
  34. Pera-Titus, M.; García-Molina, V.; Baños, M.A.; Giménez, J.; Esplugas, S. Degradation of chlorophenols by means of advanced oxidation processes: A general review. Appl. Catal. B: Environ. 2004, 47, 219–256. [Google Scholar] [CrossRef]
  35. Rott, E.; Minke, R.; Bali, U.; Steinmetz, H. Removal of phosphonates from industrial wastewater with UV/FeII, Fenton and UV/Fenton treatment. Water Res. 2017, 122, 345–354. [Google Scholar] [CrossRef] [PubMed]
  36. Yap, C.L.; Gan, S.; Ng, H.K. Fenton based remediation of polycyclic aromatic hydrocarbons-contaminated soils. Chemosphere 2011, 83, 1414–1430. [Google Scholar] [CrossRef] [PubMed]
  37. Hou, P.; Cannon, F.S.; Nieto-Delgado, C.; Brown, N.R.; Gu, X. Effect of preparation protocol on anchoring quaternary ammonium/epoxide-forming compound into granular activated carbon for perchlorate adsorption: Enhancement by Response Surface Methodology. Chem. Eng. J. 2013, 223, 309–317. [Google Scholar] [CrossRef]
  38. Luo, D. Optimization of total polysaccharide extraction from Dioscorea nipponica Makino using response surface methodology and uniform design. Carbohydr. Polym. 2012, 90, 284–288. [Google Scholar] [CrossRef]
  39. Behera, S.K.; Meena, H.; Chakraborty, S.; Meikap, B.C. Application of response surface methodology (RSM) for optimization of leaching parameters for ash reduction from low-grade coal. Int. J. Min. Sci. Technol. 2018, 28, 621–629. [Google Scholar] [CrossRef]
  40. NEPA. Discharge Standards of Water Pollutants for Dyeing and Finishing of Textile Industry. China National Standard GB4287-2012. China National Environmental Protection Administration(NEPA), 2012. Available online: https://www.doc88.com/p-998284323481.html?r=1 (accessed on 1 January 2013).
  41. Gogate, P.R.; Pandit, A.B. A review of imperative technologies for wastewater treatment I: Oxidation technologies at ambient conditions. Adv. Environ. Res. 2004, 8, 501–551. [Google Scholar] [CrossRef]
  42. Oller, I.; Malato, S.; Sánchez-Pérez, J.A. Combination of Advanced Oxidation Processes and biological treatments for wastewater decontamination—A review. Sci. Total Environ. 2011, 409, 4141–4166. [Google Scholar] [CrossRef]
  43. Cai, Q.Q.; Lee, B.C.Y.; Ong, S.L.; Hu, J.Y. Fluidized-bed Fenton technologies for recalcitrant industrial wastewater treatment–Recent advances, challenges and perspective. Water Res. 2021, 190, 116692. [Google Scholar] [CrossRef]
  44. Miklos, D.B.; Remy, C.; Jekel, M.; Linden, K.G.; Drewes, J.E.; Hübner, U. Evaluation of advanced oxidation processes for water and wastewater treatment—A critical review. Water Res. 2018, 139, 118–131. [Google Scholar] [CrossRef]
  45. Oturan, M.A.; Aaron, J.-J. Advanced Oxidation Processes in Water/Wastewater Treatment: Principles and Applications. A Review. Crit. Rev. Environ. Sci. Technol. 2014, 44, 2577–2641. [Google Scholar] [CrossRef]
  46. Andreozzi, R.; Caprio, V.; Insola, A.; Marotta, R. Advanced oxidation processes (AOP) for water purification and recovery. Catal. Today 1999, 53, 51–59. [Google Scholar] [CrossRef]
  47. Babuponnusami, A.; Muthukumar, K. Advanced oxidation of phenol: A comparison between Fenton, electro-Fenton, sono-electro-Fenton and photo-electro-Fenton processes. Chem. Eng. J. 2012, 183, 1–9. [Google Scholar] [CrossRef]
  48. Gu, X.; Qin, N.; Zhang, P.; Hu, Y.; Zhang, Y.-N.; Zhao, G. In-situ synthesis of {111}TiO2/Ti photoelectrode to boost efficient removal of dimethyl phthalate based on a bi-functional interface. Chem. Eng. J. 2021, 422, 129980. [Google Scholar] [CrossRef]
  49. Liang, D.; Li, N.; An, J.; Ma, J.; Wu, Y.; Liu, H. Fenton-based technologies as efficient advanced oxidation processes for microcystin-LR degradation. Sci. Total Environ. 2021, 753, 141809. [Google Scholar] [CrossRef] [PubMed]
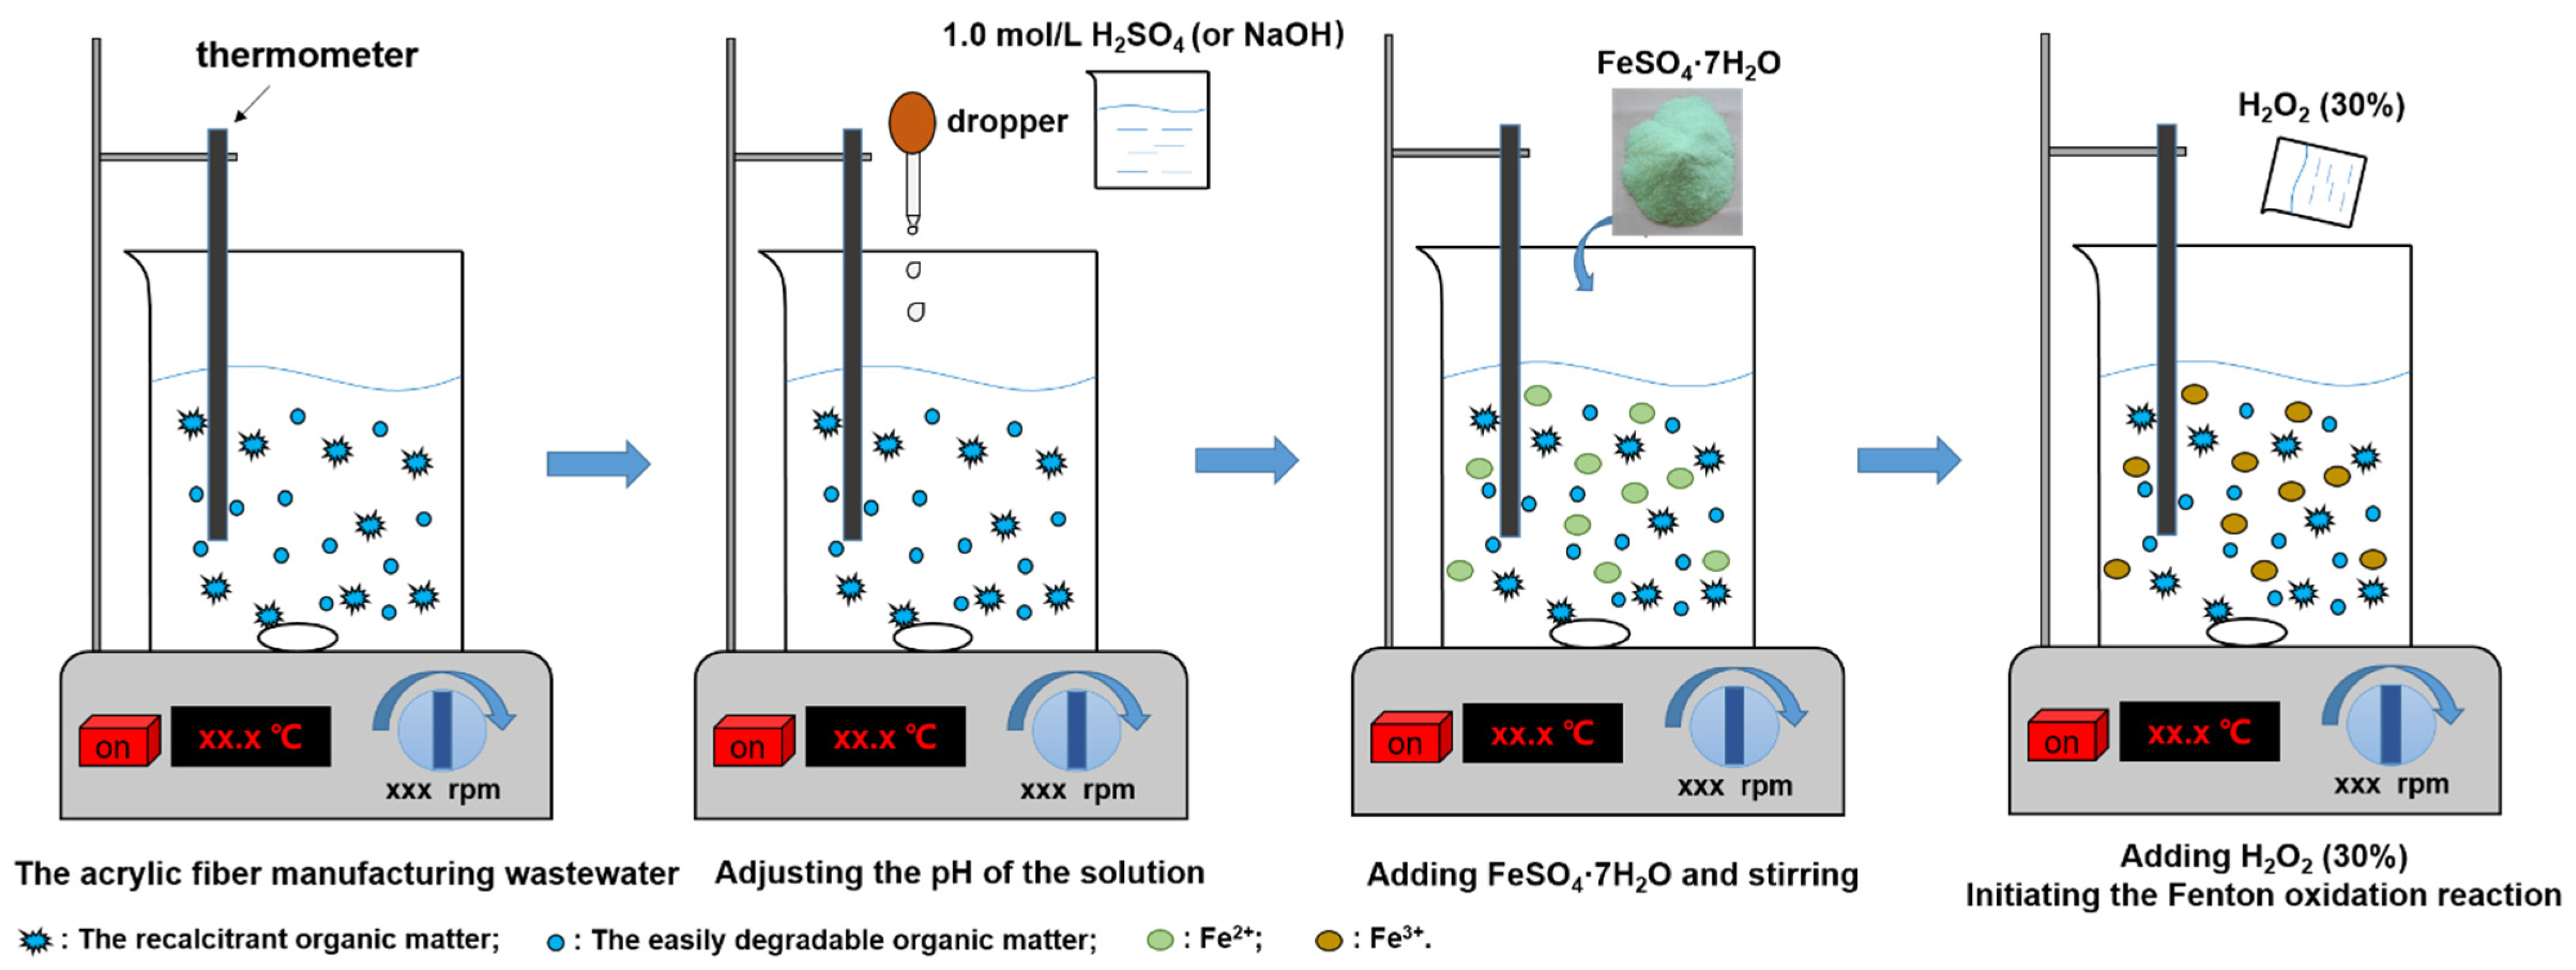
Figure 1. Fenton oxidation experiment.
Water 14 02913 g001
Figure 2. Influence of initial concentration of H2O2 on COD removal rate (a), the residual concentration of Fe2+ (b), and the residual concentration of H2O2 (c).
Water 14 02913 g002
Figure 3. Influence of initial concentration of Fe2+ on COD removal rate (a), the residual concentration of Fe2+ (b), and the residual concentration of H2O2 (c).
Water 14 02913 g003
Figure 4. Influence of initial pH on COD removal rate (a), the residual concentration of Fe2+ (b), and the residual concentration of H2O2 (c).
Water 14 02913 g004
Figure 5. A three-dimensional response surface for the response of COD removal rate in terms of coded A and B (a), coded A and c (b), coded B and C (c); The corresponding contour plots for the response of COD removal rate in terms of coded A and B (d), coded A and c (e), coded B and C (f).
Water 14 02913 g005
Figure 6. The removal of COD: Comparison of actual value and predicted value.
Water 14 02913 g006
Figure 7. GC-MS patterns: (a) raw water, (b) water samples treated by Fenton process.
Water 14 02913 g007
Figure 8. Effect of HO• scavenger on the degradation of organic matter in acrylic acid wastewater.
Water 14 02913 g008
Figure 9. Schematic diagram of Fenton reaction process.
Water 14 02913 g009
Table 1. Water quality indexes of water samples.
ParameterCOD
mg·L−1
BOD5
mg·L−1
TOC
mg·L−1
NH3-N
mg·L−1
TN
mg·L−1
BOD5/CODpH
Amount249–2708–1090–10060–6678–950.030–0.0405.4–5.8
Table 2. Coded levels and corresponding values for test factors in RSM experimental design.
RunFactorResponse, R (%)
A: [H2O2]B: [Fe2+]C: pH
Coded LevelCorresponding Value (mmol·L−1)Coded LevelCorresponding Value (mmol·L−1)Coded Level-
S1−156.25−14.160351.92 ± 1.25
S2193.75−14.160343.73 ± 1.02
S3−156.2519.380354.91 ± 1.28
S4193.7519.380345.57 ± 1.06
S5−156.2506.25−1244.72 ± 0.98
S6193.7506.25−1239.66 ± 0.89
S7−156.2506.251450.63 ± 1.05
S8193.7506.251442.17 ± 1.07
S9075.00−14.16−1234.95 ± 0.67
S10075.0019.38−1249.71 ± 1.09
S11075.00−14.161438.16 ± 0.88
S12075.0019.381441.42 ± 0.87
S13075.0006.250357.04 ± 1.35
S14075.0006.250357.88 ± 1.39
S15075.0006.250356.89 ± 1.38
S16075.0006.250357.28 ± 1.42
S17075.0006.250357.54 ± 1.36
Table 3. Covariance analysis of linear, quadratic and interaction variables of the regression model.
SourceSum of Squares (SS)Degree of Freedom (df)Mean Square (MS)F-Value (F)p-Value (p)
Model906.229100.6914.940.0009
A-[H2O2]120.511120.5117.890.0039
B-[Fe2+]65.27165.279.690.0170
C-pH1.3911.390.210.6629
A × B0.3310.330.0490.8310
A × C2.8912.890.430.5334
B × C33.06133.064.910.0623
A226.94126.944.000.0857
B2139.901139.9020.760.0026
C2464.371464.3768.92<0.0001
Residual47.1676.74
Lack of Fit46.54315.5199.010.0003
Pure Error0.6340.16
Cor Total953.3816
R20.95
Raj20.89
Table 4. Removing effect of acrylic fiber wastewater by Fenton process.
Water Quality IndexInfluentEffluentEmission Limit
pH5.5 ± 0.26.4 ± 0.26~9
COD/(mg·L−1)259.6 ± 8.593.3 ± 3.5200
TOC/(mg·L−1)92.3 ± 2.528.2 ± 0.730
NH4+-N/(mg·L−1)63.5 ± 2.626.4 ± 0.625
TN/(mg·L−1)83.8 ± 3.234.5 ± 0.650
Table 5. The main organic pollutants.
NumberPeak Time (min)Organic MatterStructural FormulaMolecular FormulaThe Degree of Match (%)Occasion
InfluentEffluent
114.532UndecaneWater 14 02913 i001C11H2494
224.5091,4,5-TrimethylnaphthaleneWater 14 02913 i002C13H1462
325.6432,6-Di-tert-butyl-4-methylphenolWater 14 02913 i003C15H24O96
425.7322,4-di- tert -butylphenolWater 14 02913 i004C14H22O94
527.6572,2,4-trimethyl-1,3-pentanediol diisobutyrateWater 14 02913 i005C16H30O459
632.404OctadecaneWater 14 02913 i006C18H3899
733.656Diisobutyl phthalateWater 14 02913 i007C16H22O490
835.535Dibutyl phthalateWater 14 02913 i008C16H22O494
940.4462,6-diphenylpyridineWater 14 02913 i009C17H13N97
1043.488TetracosaneWater 14 02913 i010C24H5098
1144.882Benzo(H)quinolineWater 14 02913 i011C15H13N50
1245.073HeneicosaneWater 14 02913 i012C21H4493
1345.51DEHP, di-(2-ethylhexyl) phthalate.Water 14 02913 i013C16H22O490
1446.617
48.100
49.528
HexacosaneWater 14 02913 i014C26H5498
1550.907
53.703
OctacosaneWater 14 02913 i015C28H5898
1652.240EicosaneWater 14 02913 i016C20H4298
Publisher’s Note: MDPI stays neutral with regard to jurisdictional claims in published maps and institutional affiliations.