Article

Application of Stable Isotopic Compositions of Rainfall Runoff for Evaporation Estimation in Thailand Mekong River Basin

by
Jeerapong Laonamsai
1,
Kimpei Ichiyanagi
2,
Supapap Patsinghasanee
3,
Kiattipong Kamdee
4 and
Nattapong Tomun
5,*
1
Department of Civil Engineering, Faculty of Engineering, Naresuan University, Phitsanulok 65000, Thailand
2
Department of Earth and Environmental Science, Faculty of Advanced Science and Technology, Kumamoto University, Kumamoto 860-8555, Japan
3
Department of Water Resources, Ministry of Natural Resources and Environment, Bangkok 10400, Thailand
4
Thailand Institute of Nuclear Technology, Nakonnayok 26120, Thailand
5
Department of Technical Education, Faculty of Industrial Education, Rajamangala University of Technology Thanyaburi, Pathumthani 12110, Thailand
*
Author to whom correspondence should be addressed.
Water 2022, 14(18), 2803; https://doi.org/10.3390/w14182803
Submission received: 16 August 2022 / Revised: 6 September 2022 / Accepted: 7 September 2022 / Published: 9 September 2022
(This article belongs to the Section Hydrology)

Abstract

:
The Mekong River Basin comprises approximately 38% of Southeast Asia. Our study area comprises the right-bank tributaries, which drain a substantial portion of Northeast Thailand. This study aimed to estimate the evaporative losses from streams during the 2013–2015 period. The normal and warm El Niño–Southern Oscillation (ENSO) phases caused higher temperatures and low rainfall in the 2014–2015 period. The results show that the local meteoric water line for precipitation isotopes had seasonal variation due to variable precipitation. The enrichment of river isotopes indicated that streams lost an average of 4% of their water through evaporation. During the cooling ENSO phase, significant evaporation occurs due to the deep convection that typically occurs in tropical regions. In contrast, evaporation was low during the warm ENSO phase because of its geographic location. The El Niño year’s isotope values were significantly more enriched than the La Niña year’s, showing that precipitation and positive temperature anomalies affected the isotopic compositions in the continental basin. Furthermore, the deuterium excess helped distinguish the relative contributions of the wet and dry seasonal sources to the moisture origin, indicating that the predominant source of moisture is inland evaporation, with a small contribution from the ocean.

1. Introduction

For over seven decades, environmental isotopes have been used to investigate hydrological and geological systems [1]. Understanding paleoclimate, moisture circulation, and groundwater–surface water interaction systems has benefited from their application. In isotope hydrology, hydrogen (2H (deuterium) and 3H (tritium)) and oxygen (18O) are the isotopes most commonly used as environmental tracers. Applications of stable hydrogen and oxygen isotope ratios are based on isotopic differences in atmospheric precipitation or the input to the studied hydrological system.
The stable isotopes of oxygen (δ18O) and hydrogen (δ2H) maintain the same proportions as meteoric water. It contains the status of the meteoric water that was initially created and is a permanent natural tracer [2,3,4]. By collecting meteoric water with stable isotopes, studies have frequently used the isotopic signature of natural waters to define the system of mixed moisture source areas among multiple monsoon activities and characterize circulation paths and mixing or exchange processes between land and ocean moisture [5]. The integrated study of oxygen and hydrogen isotopes in water sciences has proven effective for examining regional hydrological fluxes, including large-scale precipitation, hydrological interactions, and basin hydrology [6,7,8]. Furthermore, the deuterium excess (d-excess), defined as d-excess = δ2H − 8δ18O [6], is a representative moisture source tracer [3,9]. Precipitation d-excess is dependent on some variables: (1) the initial vapor composition, which reflects evaporation processes and the slope of the δ18O-δ2H correlation, and (2) kinetic and equilibrium fractionation effects, such as the rate of evaporation and condensation at the precipitation source. The d-excess in river water has been used to measure evaporation losses during runoff [10]. Unfortunately, the combination of stable isotopes in Thailand’s rivers and precipitation remains relatively limited.
Precipitation and evaporation, or water input and output, regulate the mass balance of surface water. Important components of the terrestrial hydrological cycle include evaporation losses from water bodies and subsequent water level fluctuations in rivers, lakes, canals, and surface water creeks. Using known transient stable hydrogen and oxygen isotope compositions of water or known inflowing and outflowing water, the degree of evaporative losses from individual pools and reaches of intermittent rivers can be easily calculated over a fixed period. The calculation requires the stable isotopes of two water samples, basic weather data, and an estimate of the stable isotopes in ambient air moisture. Previous studies have used this method in various regions at various scales [11,12,13,14,15]. However, there have been no comprehensive isotopic assessments of precipitation and river water in the Mekong highlands. This study expands upon prior research and tries to answer the following research questions: (1) How do variations in rainfall-runoff isotopic composition respond to the El Niño–Southern Oscillation (ENSO)? (2) How much river water is evaporated during runoff processes?
The tributaries of the Lower Mekong can be found in Northeast Thailand (the Kong, Mun, and Chi rivers). To improve the understanding of rainfall-runoff isotopes across the Thailand Mekong River basin, this study’s primary goals were to (1) observe the stable isotopic compositions of rainfall and river water and (2) identify the amount of water lost to evaporation from rivers and streams due to ENSO by comparing the stable isotopic profiles of the river and meteoric water. The stable isotopic fingerprints of precipitation and rivers from six stations over three years (2013–2015) were analyzed. The results provide previously unknown information on rainfall-runoff processes, such as the impact of ENSO on climate anomalies and isotopic variation and evaporation lost from streams. This information is helpful for government water agencies in their strategic planning and management efforts.

2. Materials and Methods
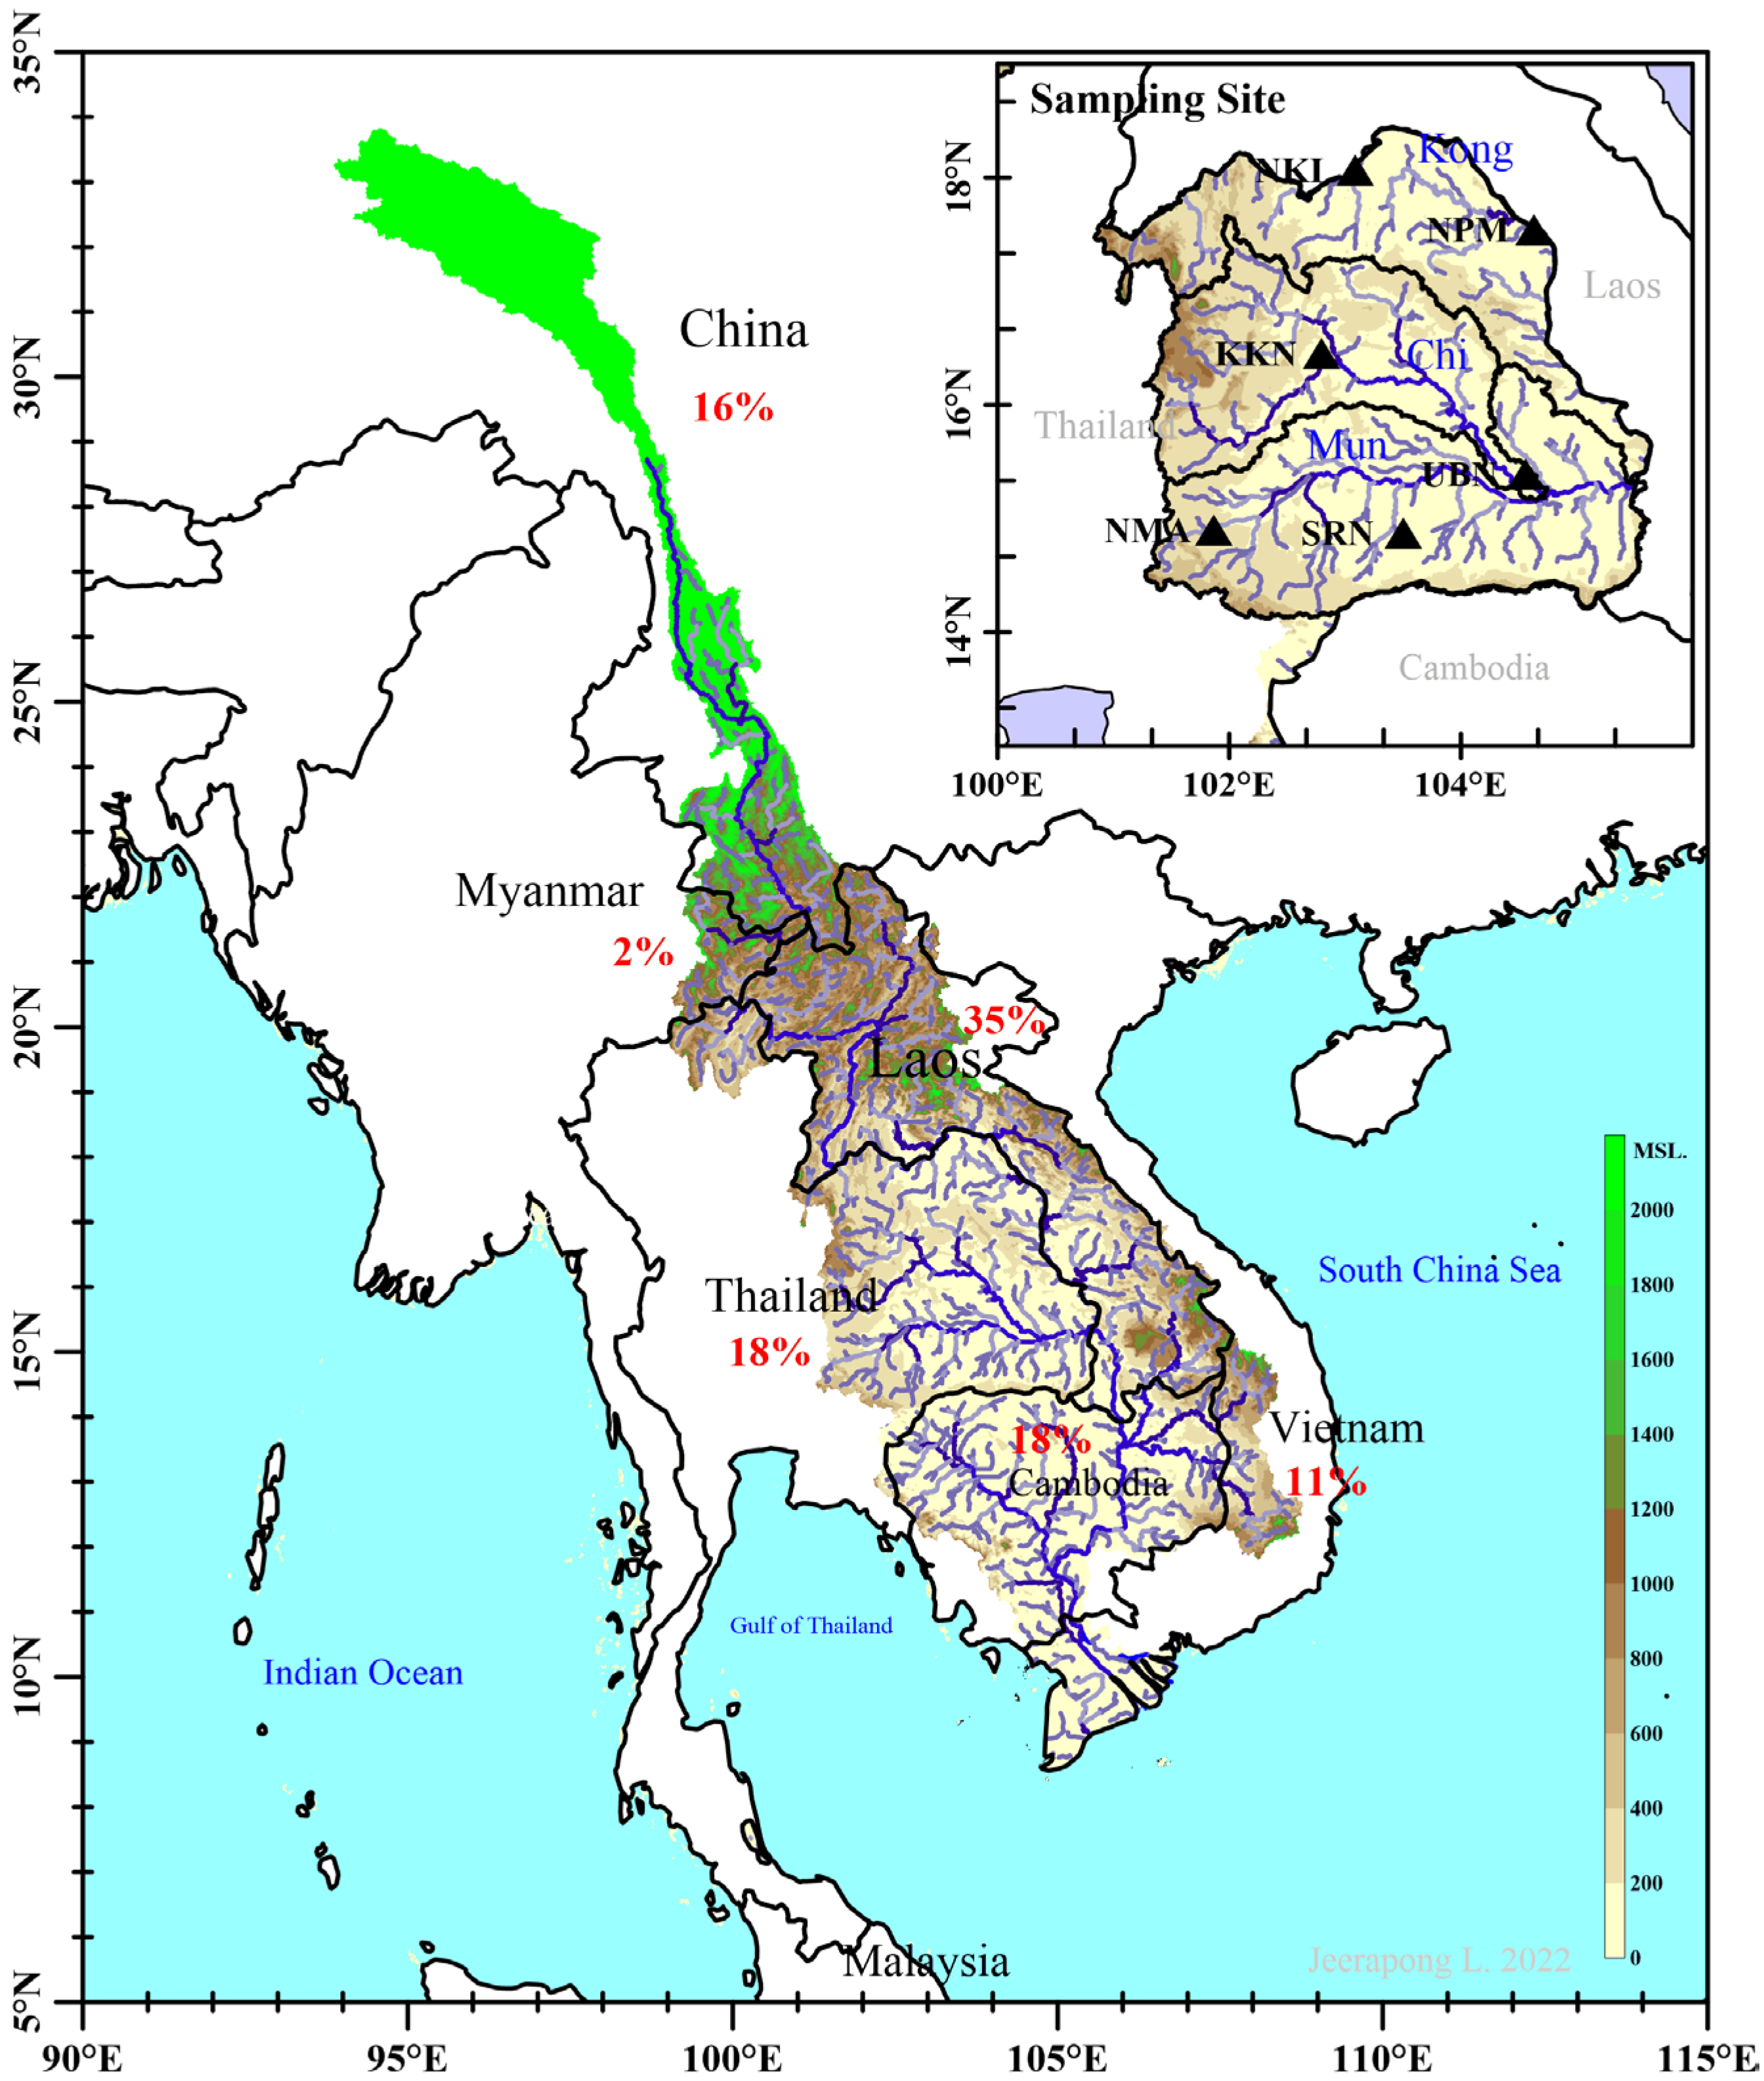
2.1. Study Area

The tributaries of the Lower Mekong River Basin in Northeast Thailand cover an area of 170,226 square kilometers, equivalent to one-third of the total area of Thailand (Figure 1). The high plateau is a common topographical feature comprising various landforms, including undulating hills, shallow valleys, and flat plains. An intricate network of small and abundant waterways, fertile floodplains, flooded forests, and hilly dryland areas are formed by the many rivers, streams, lakes, and ponds that crisscross the landscape.
The floodplains are dotted with natural depressions, which help absorb floodwaters during the rainy season (May–October). The high plateau sits at an elevation of roughly 800 m above mean sea level (meters a.s.l.), reducing to a height of only 200 m a.s.l. in the southeast. Through the center of the region is a mountain range that runs in a direction from northwest to southeast, dividing the lower area into two basins (Mun and Chi rivers). The Mun and Chi River Basins encompass over two-thirds of the total land area in Northeast Thailand. Rivers that discharge into the Mekong River can be divided into three distinct groups: the Kong River Basin, which is in the northwest and comprises streams and rivers that flow directly into the Mekong River and the lower area, which comprises two major river systems known as the Chi and Mun River Basins, which themselves comprise tributaries that flow into the Mekong River (Figure 1).
Six locations were selected across the study area to collect rainwater and river water data for upstream and downstream sub-basin areas (Figure 1). Each observing station had a standard rain gauge that consisted of a funnel that empties into a graduated cylinder fitted within a container that is 200 mm in diameter and 500 mm in height. A total of 428 water samples were collected monthly during the 2013–2015 period, including 212 precipitation and 216 river water samples. River water sampling for stable isotope analyses was performed from March 2013 to July 2015. Samples were collected at similar times of the day to minimize variation resulting from diurnal patterns. The river water was hand-dipped along the riverbank at a water depth of ~20 cm using a 500 mL bailor, where clean and flowing runoff was present. The precipitation isotopes were collected in the same catchment as each river sampling site from January 2013 to December 2015 to evaluate the relationships between precipitation and river runoff. These water samples were sealed in 125 mL high-density polyethylene bottles and immediately stored in a dry location, following the International Atomic Energy Agency (IAEA)/Global Network of Isotopes sampling guidelines [16] to prevent evaporation during preparation and analysis.

2.2. Laboratory Analysis

Oxygen and hydrogen isotope analyses were performed on the collected monthly precipitation and river water samples at the Thailand Institute of Nuclear Technology. The IAEA guidelines were followed during the sampling procedure, which reduced the water samples lost to evaporation and isotopic fractionation. After collecting the samples, they were placed in a plastic container with a 250 mL capacity and kept frozen in a storage freezer until analysis. The water samples were analyzed as soon as possible using a Picarro L2130i analyzer (cavity ring-down spectroscopy) to determine the isotope ratios of δ18O and δ2H. Samples and standards were injected six times, and only the final four injections were used to calculate the results to minimize any instrument memory effect. The analytical precision for δ18O is 0.15 and δ2H is 0.6. The isotope values were calibrated using reference waters provided by the IAEA, specifically Vienna Standard Mean Ocean Water and Standard Light Antarctic Precipitation. For each sample, the results are provided as an averaged notation, where δ = (Rsample/Rstandard − 1) × 1000, and R = 18O/16O or 2H/1H [1]. The relationship between δ18O and δ2H was plotted to generate the local meteoric water line (LMWL) for precipitation and the local river water line (LRWL) for river water [17]. Regression analysis was used to determine the significance of the intercept and slope of the LMWL and LRWL correlation considering a 95% confidence level and p-value of <0.05.

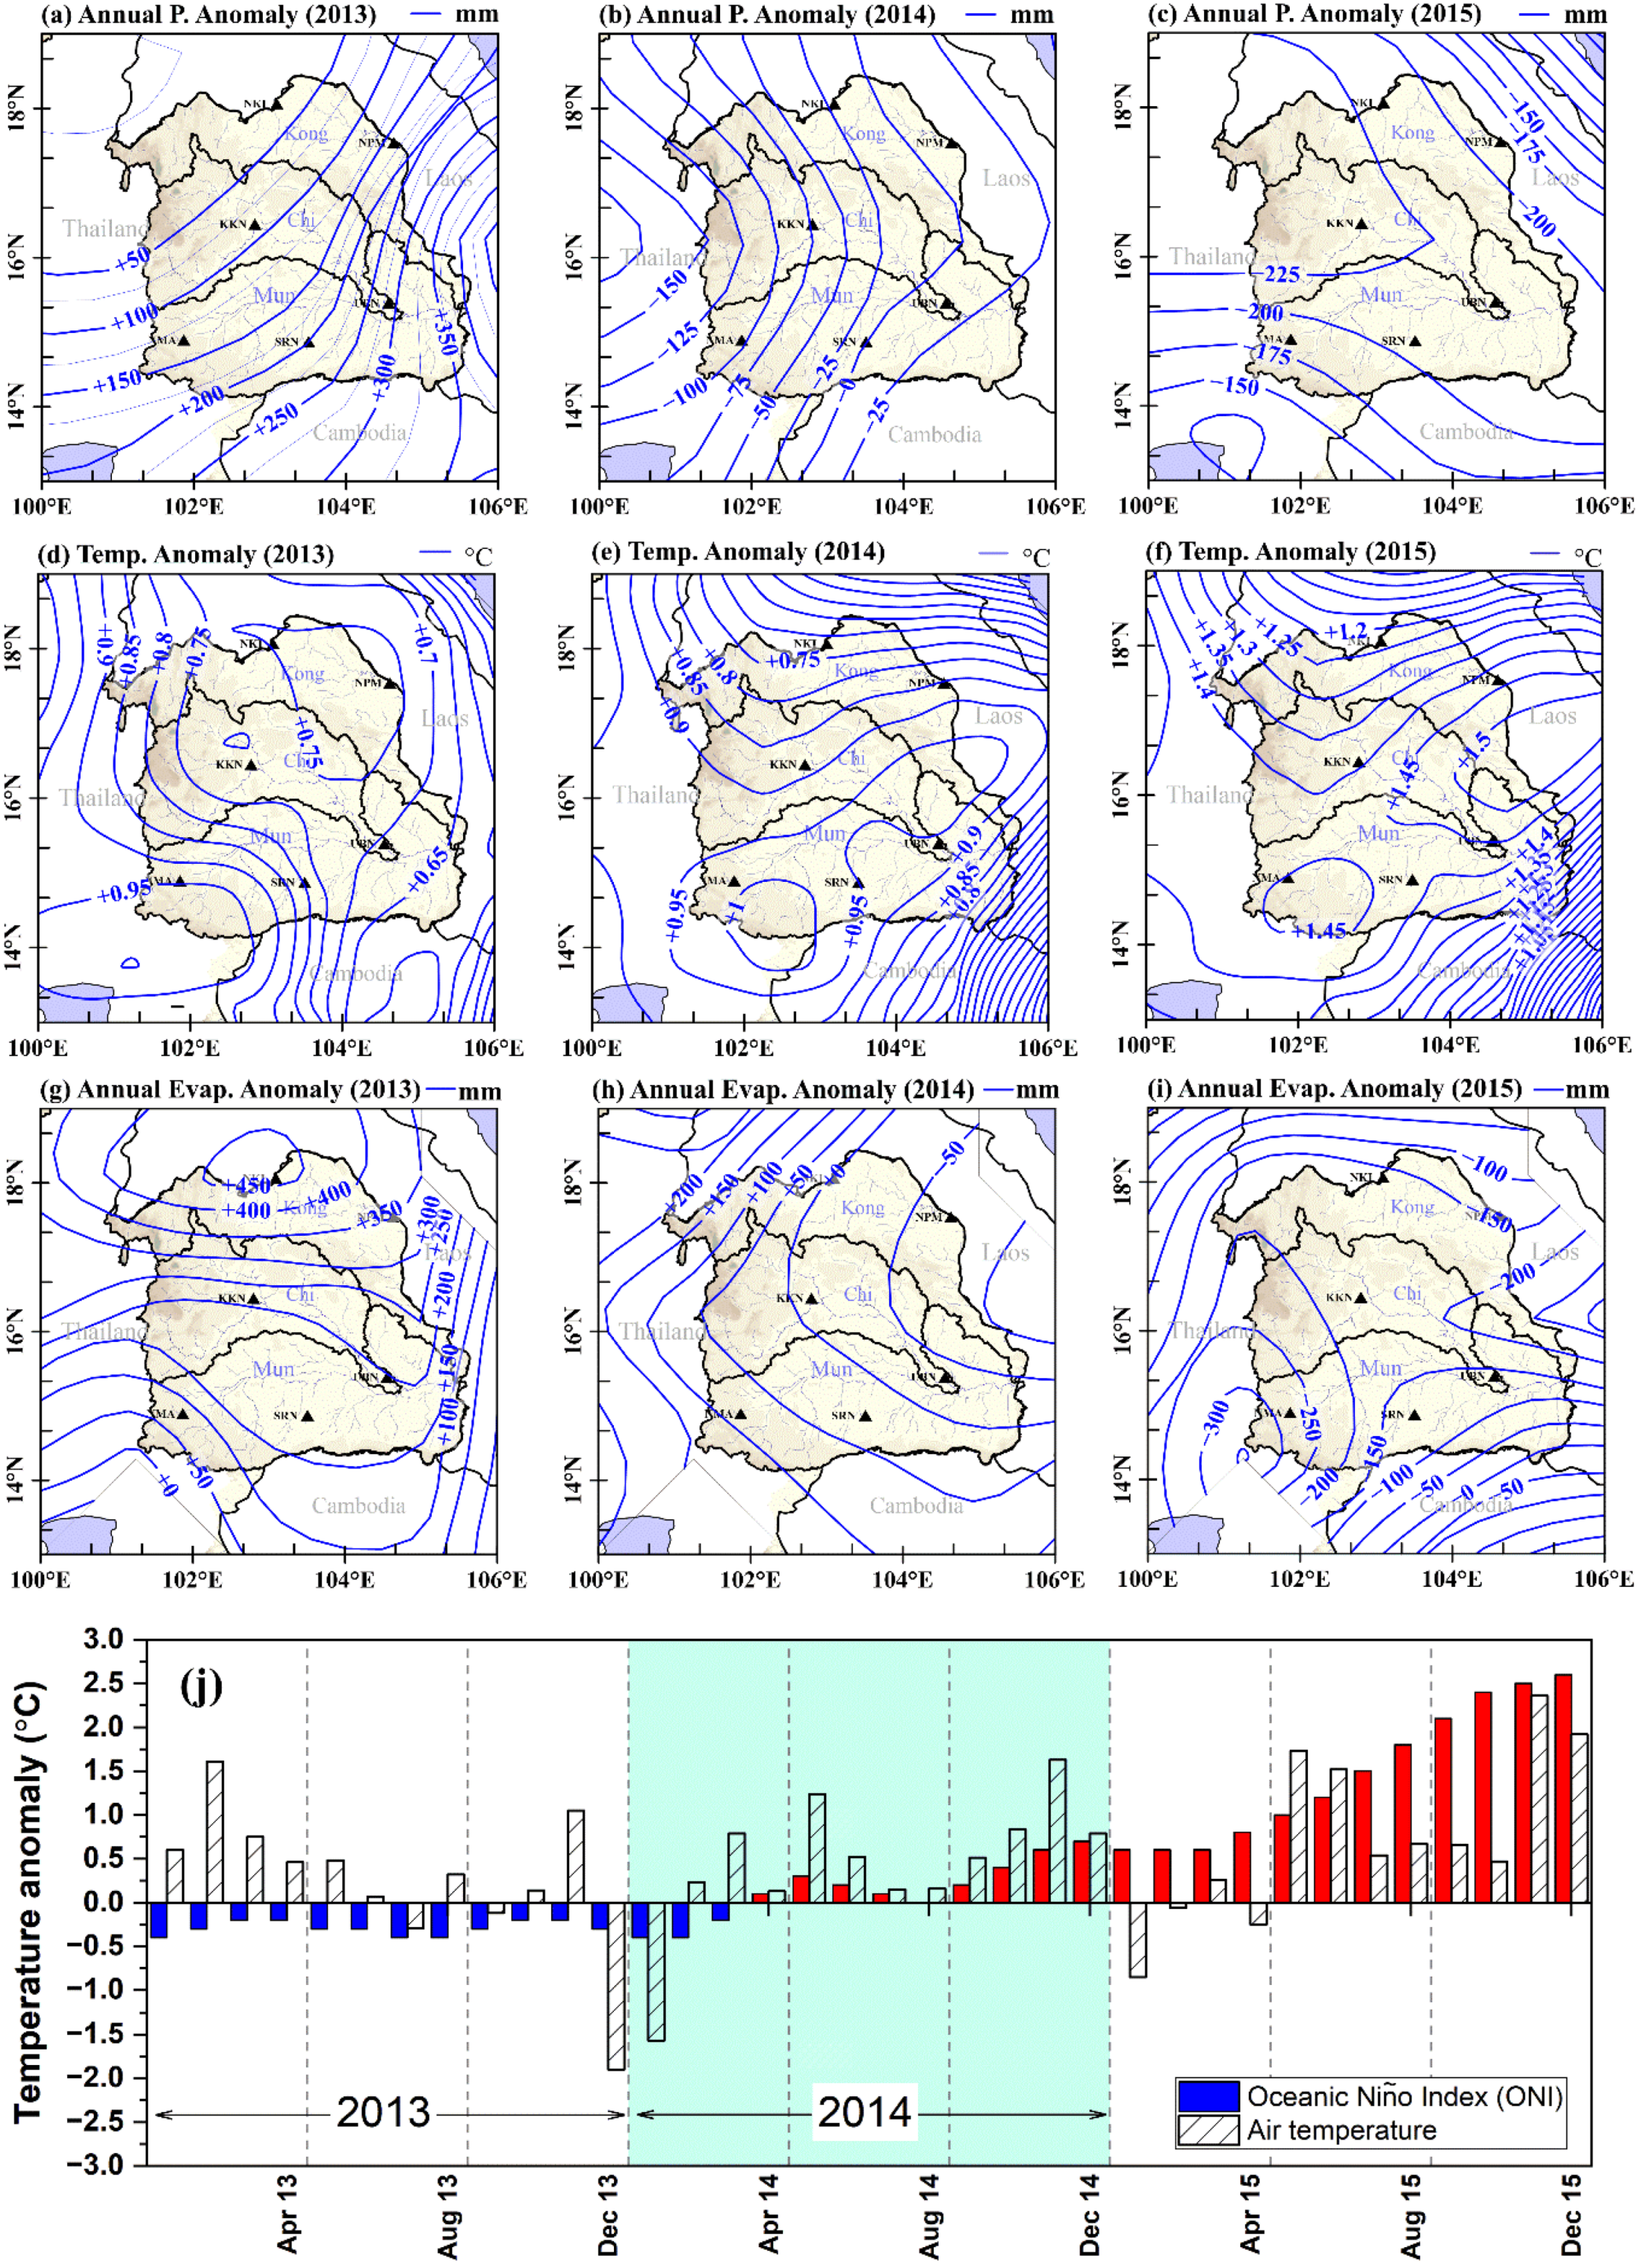
2.3. Climate Anomalies

The basin’s climate is governed by the southwest monsoon that typically occurs from May to October. In addition, tropical storms and the interconvergence zones are strongly affected in late September, resulting in prolonged periods of intense precipitation and flooding annually for a few months. Therefore, late-season tropical storms produce a double peak in the rainfall distribution across most of the basin. The three months with the most precipitation are July, August, and September. The mean annual precipitation and temperature are 1426 ± 419 mm and 25.9 ± 3.5 °C, respectively (based on 1981–2010). When it arrives in late October, the Northeast Monsoon brings cooler, drier air from the South China Sea into the basin. The basin experiences a significant drop in temperature from south to north by approximately 18–19 °C during winter, while summer temperatures remain constant throughout the basin from March to October. The annual evapotranspiration over the study basin ranged from 1255 to 1717 mm, with an annual average of 1504 ± 163 mm. There was minimal annual variation, probably because of the constant relative humidity that averaged 0.74 ± 0.06.
Climate anomalies, such as annual precipitation, mean temperature, and evapotranspiration, were further investigated throughout the study period (2013–2015). The La Niña effect was present during that period, as shown by the positive phases of annual precipitation and evaporation in 2013 (Figure 2a,g) and the negative phases of the Oceanic Nino Index (ONI; Figure 2j). Annual precipitation and evaporation were higher than the 30-year average (1981–2010), with inundation areas in the basin. Conversely, strongly negative phases of precipitation anomalies and evapotranspiration and a positive phase of ONI both appeared in 2015, showing an El Niño effect was occurring. El Niño produced little precipitation and evaporation between 2013 and 2015 compared with the La Niña effect in 2013. Moreover, the ENSO effect, consisting of both El Niño and La Niña, was a significant contributor to generating temperature anomalies, which show an upward trend from 2013 to 2015 (Figure 2d–f), similar to the ONI pattern (Figure 2j). Monthly air temperature anomalies showed that the temperature extremes occurred in winter (cold) and summer (hot), especially in 2013 and 2015 (Figure 2j), when a stronger ENSO effect occurred.

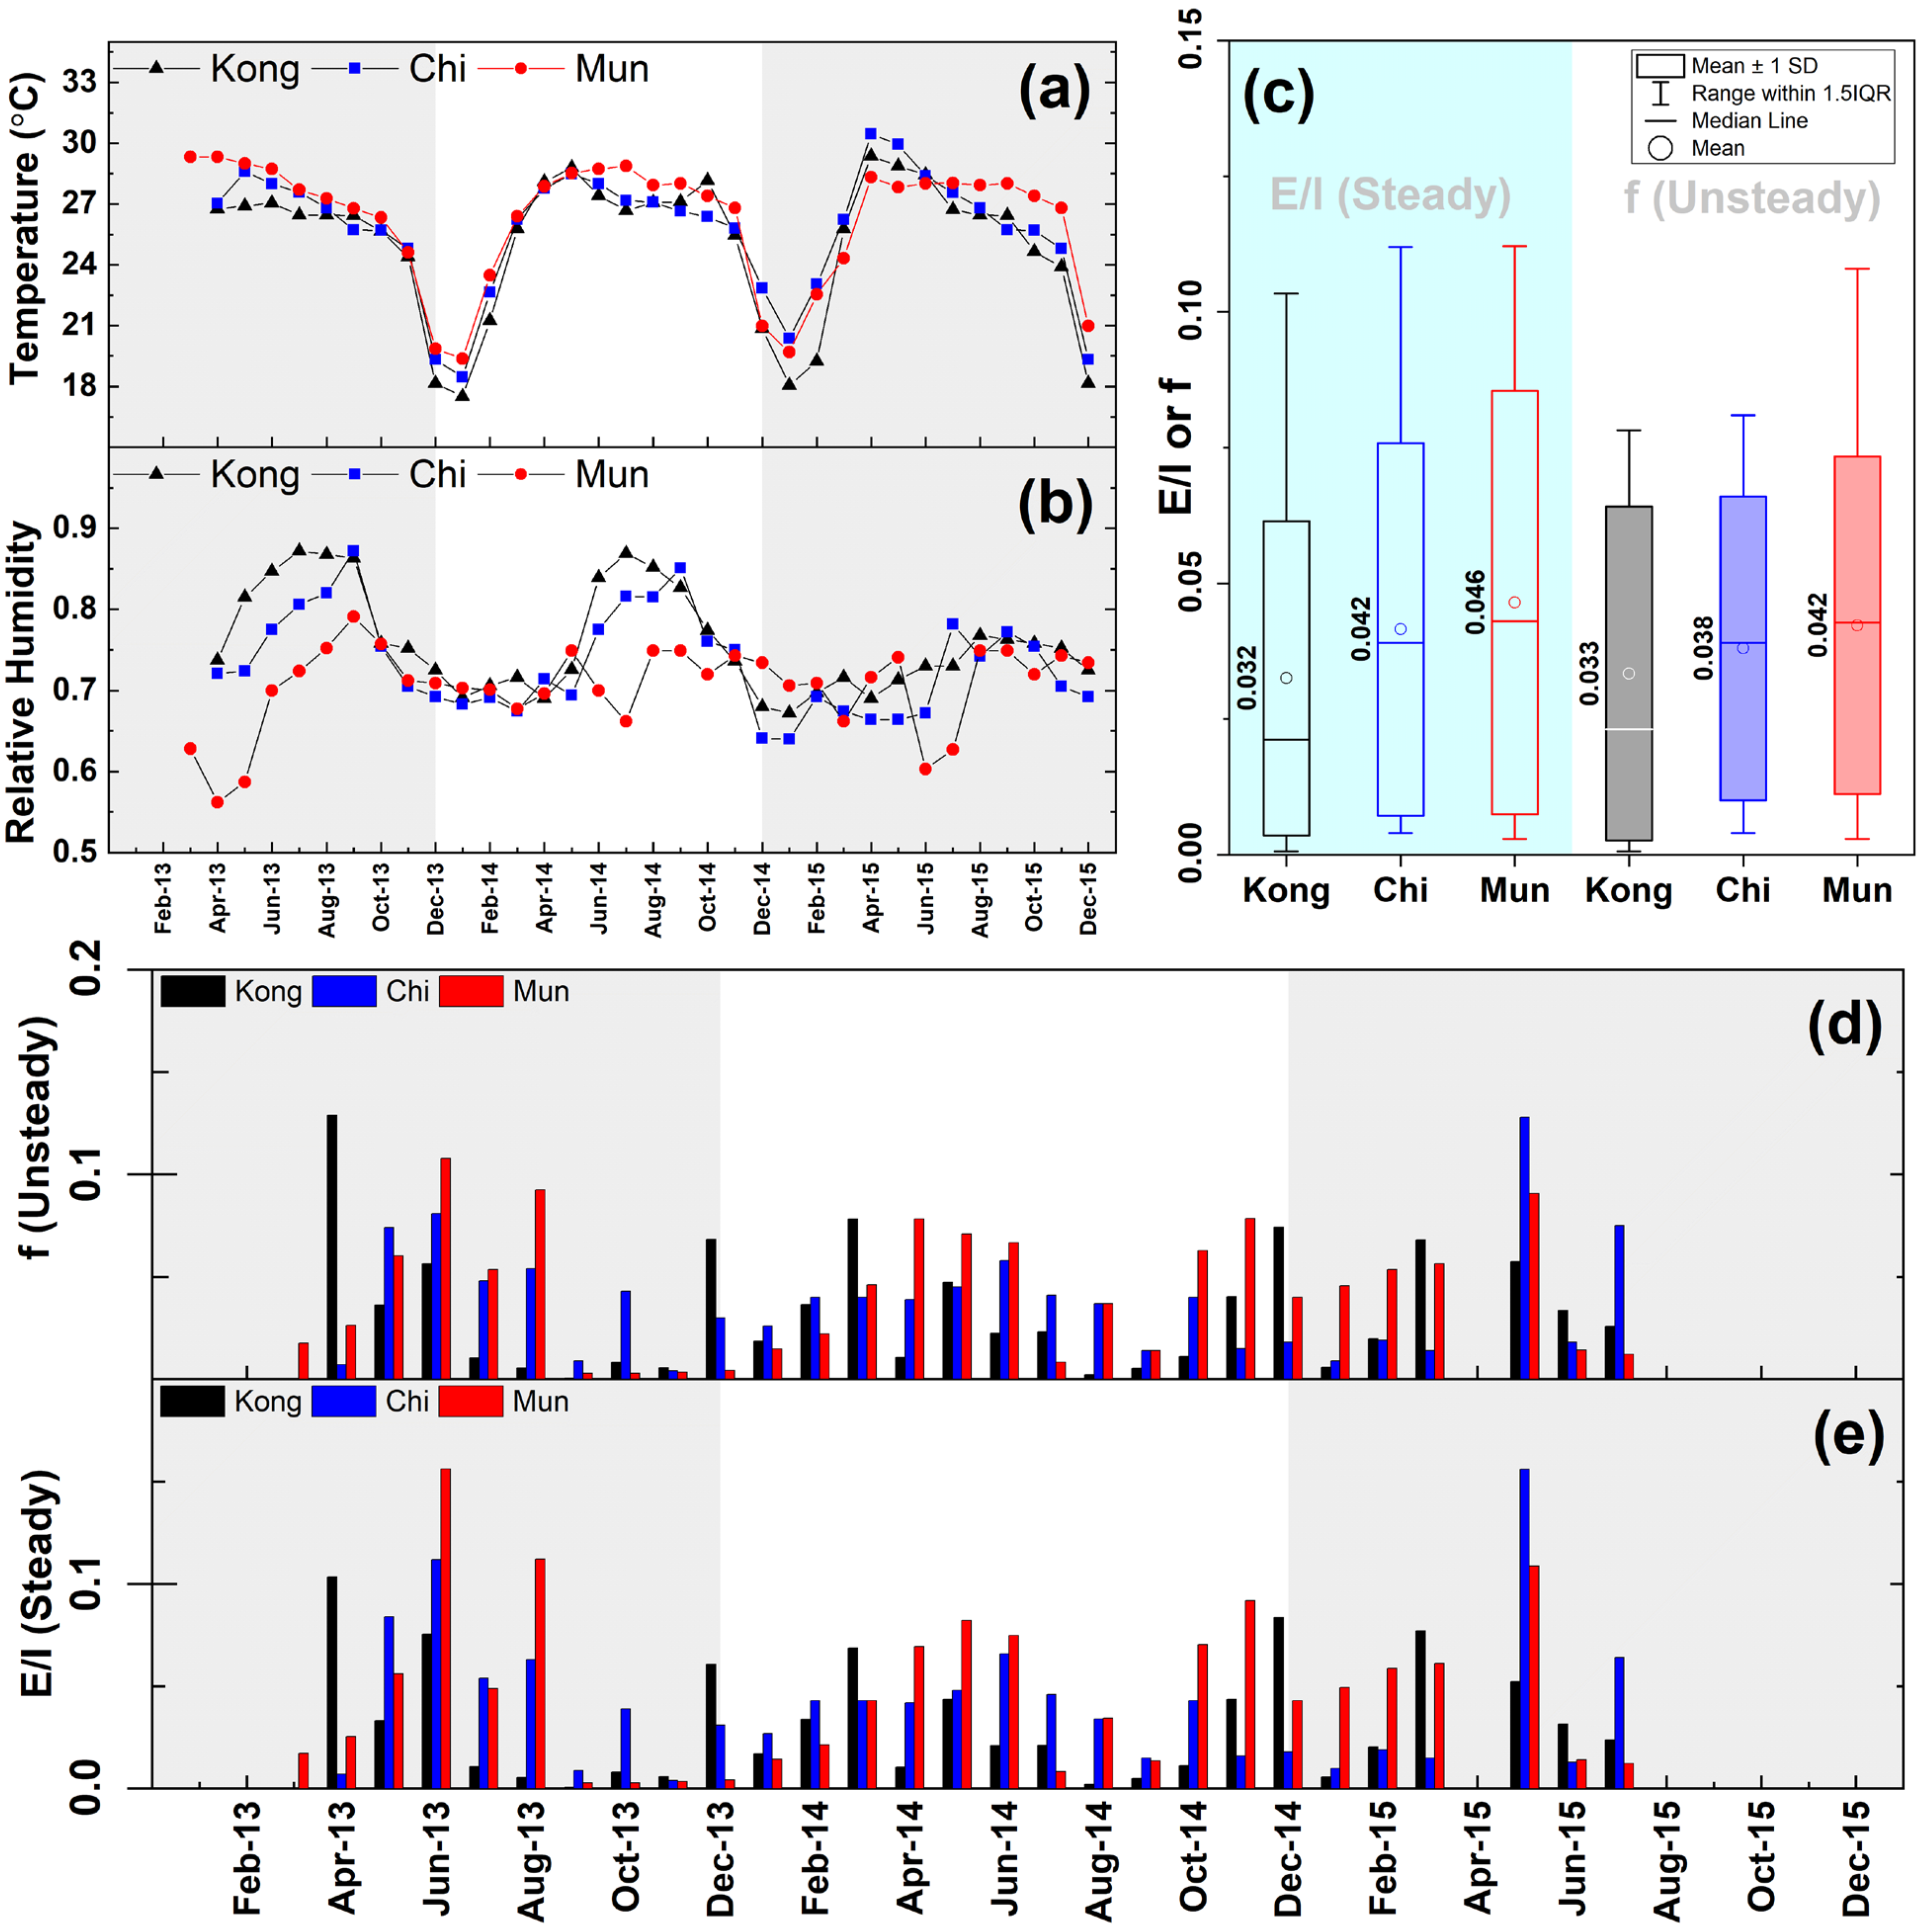
2.4. Evaporative Loss Estimation

A mathematical approach can calculate evaporation loss from a pool, lake, river, catchment, or irrigation channel over a fixed period. The so-called Craig–Gordon model [18] forms the basis for evaporative loss calculation principles. Since heavy isotopes are enriched by evaporation, Craig and Gordon [18] initially simulated the isotopic composition of evaporation flux under the assumption that the atmospheric vapor over the water body is in isotopic equilibrium with the precipitation of the region, assuming there is no divergence or convergence of air masses over the oceanic atmosphere [11,12].
Skrzypek, et al. [19] recently developed a program to estimate evaporation losses based on a revised Craig–Gordon model [13] called Hydrocalculator. Several environmental parameters control the isotopic composition of evaporating water, including the initial isotopic composition of the water and ambient vapor, temperature, relative humidity, diffusion or mixing at the water–air interface, and water salinity. The previous Craig–Gordon model considered these controlling variables separately [20]. Therefore, Horita, Rozanski, and Cohen [13] attempted to minimize several minor local parameters, allowing for the simultaneous quantification of all controlling variables in ocean and freshwater evaporation.
The Hydrocalculator simplified the boundary into a two-layer system, where the lower layer or waterbody system has surface inflow, and the upper layer is the water loss from the system, including the water surface in contact with the air moving or evaporating by kinetic processes. Therefore, the amount of water evaporated (E) relative to water inflow (I) into the stream can be determined. In this study, the evaporation over inflow ratio (E/I) was estimated based on the stable isotopic composition of inflowing and outflowing water under steady-state conditions (inflow equals evaporation and outflow). At the inflow station, an initial isotopic value for water is measured (NKI station for Kong River, KKN station for Chi River, and NMA station for Mun River; Figure 1). Any evaporation prior to the inflow station is not considered. At the outlet stations, the final water isotopic values were determined by sampling (NPM station for Kong River, UBN station for Chi River, and SRN River for Mun River). The evaporation between these two stations was estimated. It is possible to conduct a series of analyses over time, evaluating evaporation progression. However, there is no flow during the dry season because precipitation is minimal between December and February. Therefore, unsteady state conditions (no inflow or outflow to the stream, and the water level decreases due to progressive evaporation only) were used to calculate the evaporative loss fraction (f) over the dry period, which required at least two isotopic values for a water body sampled at the exact location but at different times.

3. Results and Discussions

3.1. Isotopic Composition in Precipitation
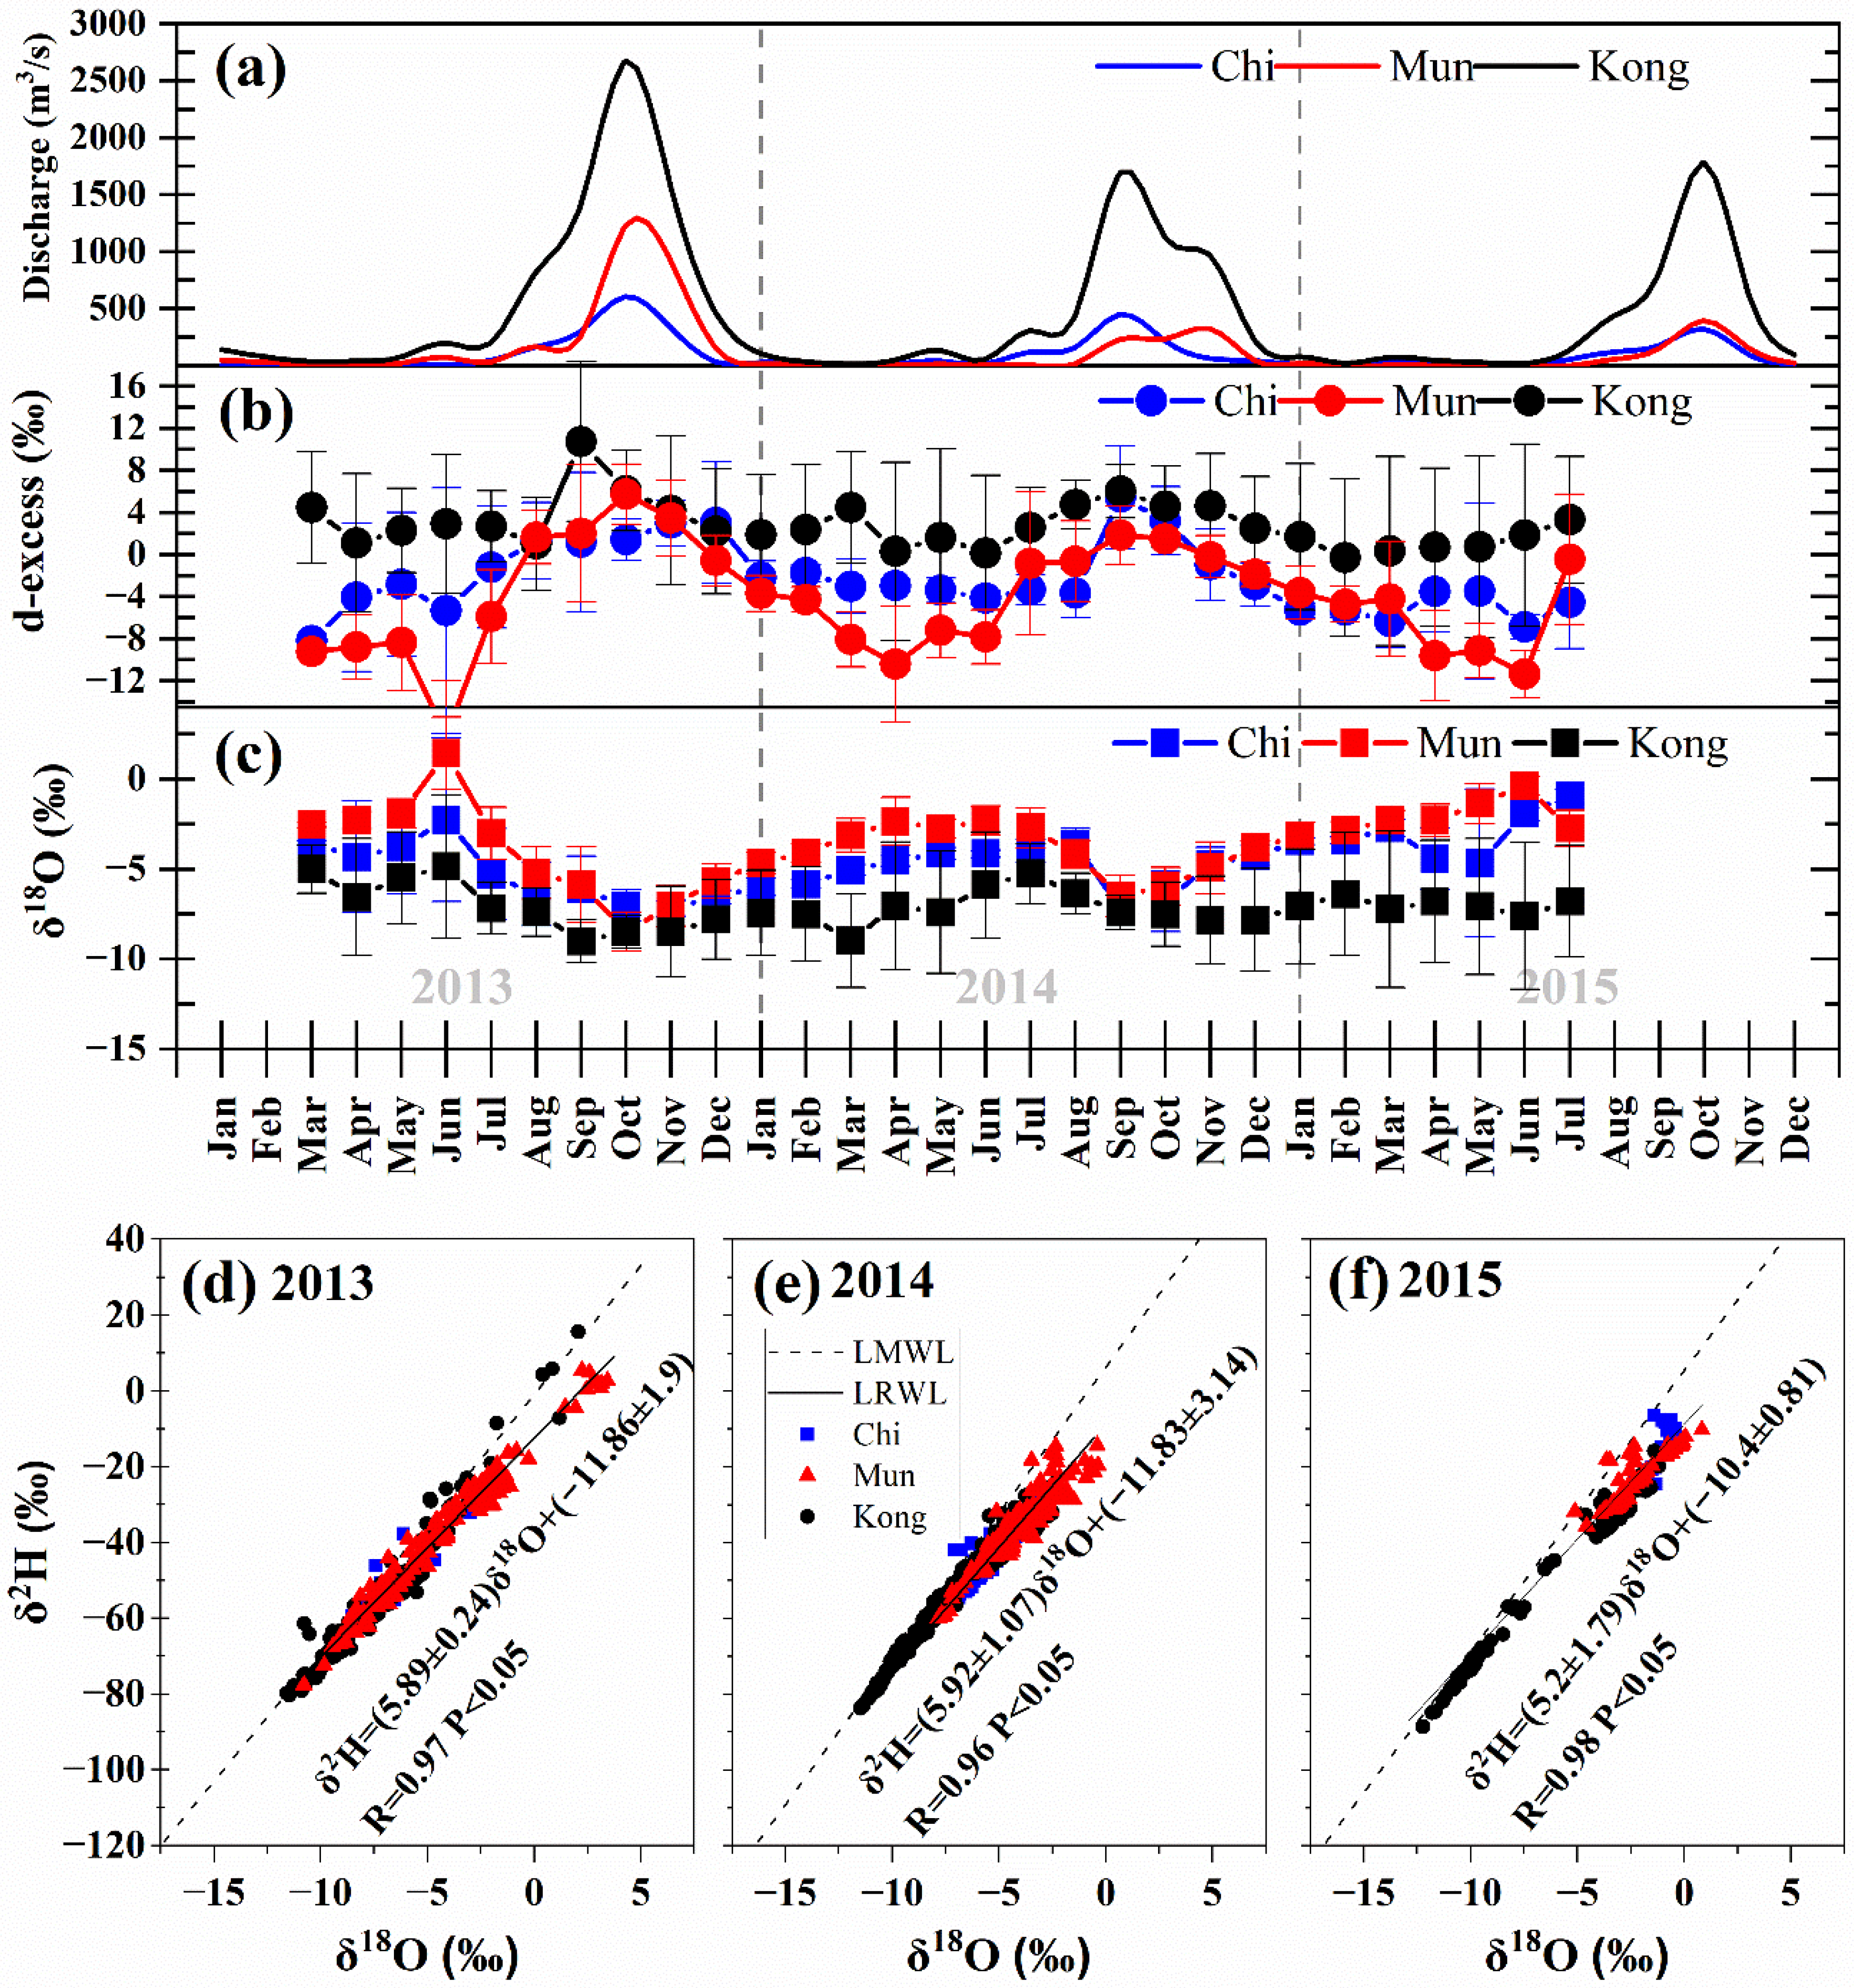
Precipitation samples were collected from six sites within the basin (Figure 3) to determine the isotopic signatures of meteoric water entering the system. The precipitation had a δ2H value of −3.76‰ to −81.87‰, with a mean of −35.91 ± 20.19‰, and a δ18O value of −11.34‰ to −0.05‰, with a mean of −5.43 ± 2.71‰. The 3-year average d-excess was 7.53 ± 4.56‰. Despite shifts in the monsoon, d-excess remained stable in 2014 and 2015 (Figure 3b), with a mean absolute deviation of 1.86‰, showing that there was only one source of air moisture throughout the year with an El Niño effect. However, there was a more significant variation in d-excess in 2013 (mean absolute deviation of 3.23‰), suggesting that various moisture sources influenced the basin during the La Niña period. The δ18O value was its lowest during the La Niña that occurred in July 201, while its highest value occurred in March 2014 (Figure 3c), when the El Niño began. Compared with the dry seasons, the wet season had more depleted compositions of oxygen isotopes (Figure 3c). This fluctuation in isotope values has been observed frequently in other regions [21,22,23], and its occurrence can be attributed to temperature effects. Because of higher temperatures, local precipitation isotope signatures may contain more abundant heavy isotopes [24,25].
It is expected that this temperature effect will only marginally impact a tropical monsoon region such as Thailand. The isotopic compositions of the rainwater can also be altered by rainfall amount [6]. This phenomenon, known as the “rainfall amount effect”, causes heavy hydrogen and oxygen isotopes in precipitation to be depleted because of their raining out or the presence of organized convective systems [26]. The temperature effect is typically noticeable in high-latitude continental regions, whereas the effect of the rainfall amount is typically more noticeable in tropical regions [27]. The isotopic signatures in the wet season can be explained by the influence of rainfall, with the La Niña in 2013 having a more significant effect than the El Niño in the 2014–2015 period. In addition, this finding supports the hypothesis that the pre-monsoon rains (i.e., those that fall during the dry season) originate from isotopically enriched local moisture sources (such as surface water bodies that have evaporated). In contrast, monsoon rain clouds have traveled a greater distance and experienced multiple fractionations prior to precipitation. Furthermore, no rainfall occurred during the highly negative temperature anomalies (more negative than −0.5 °C; Figure 2j). There was no rainfall in December 2013 and January 2014 (Figure 3a), coinciding with the negative temperature anomaly months in Figure 2j. The cold and dry air was brought from mainland China, and the Thailand Mekong Basin is on the leeward side of the Northeast Monsoon path.

3.2. LMWL

The linear slope between meteoric δ18O and δ2H reflects the processes occurring during condensation. The intercept values reflect evaporative conditions in the region where the water source is located. This pattern accounts for most precipitation that occurs worldwide. Another name for the intercept is the d-excess. According to the global regression line (δ2H = 8δ18O + 10; global meteoric water line (GMWL) [1]), the intercepts in most locations worldwide are approximately 10‰. However, regions that experience particular condensation and evaporation conditions (for example, temperature and humidity) or have a unique terrain environment can deviate from the slope and intercept of the GMWL (called LMWL). Slope and intercept deviations from the GMWL are typically caused by precipitation occurring during a warmer or colder climate than at present or by geochemical interactions occurring during underground passage [28]. The distinct rainfall evaporation characteristics or source evaporation conditions in different air mass sources can also influence slopes and intercepts. Intercepts are >10 when the evaporation rate is high or rainfall is followed by secondary precipitation evaporation [29]. Conversely, intercepts <10 are found in the tropics due to humid moisture sources or the predominated oceanic source producing precipitation [8]. In addition, high slopes tend to be found in tropical monsoon regions, while low slopes tend to be found in arid and seasonally hot and dry regions [30]. High slopes can be attributed to the remoistening of the atmosphere by rainfall or canopy evaporation intercepted by upstream precipitation [31]. Plant transpiration, sub-cloud evaporation, and mixed-phase cloud processes occurring in organized convective columns within tropical basins such as the Mekong River Basin are processes that can produce a high d-excess, leading to slopes closer to 8. The observed low slopes in arid regions can be produced by sub-cloud evaporation into dry air, a process that is enhanced by smaller droplet sizes [32] and limited by very small droplets not reaching the ground.
Figure 3d–f illustrates how the local paleoclimate was described more accurately using the LMWL during the study period (2013–2015). There were differences between the slope and intercept of these LMWLs and the GMWL. The slope and interception values were at their highest in 2014 and 2015 (El Niño year; Figure 3e,f), suggesting that this may be associated with rapid rainfall evaporation during those periods. The lowest slope and intercept values were observed in 2013 during La Niña (Figure 3d), indicating that heavy convective rain occurred during that period. The LMWL slope could be interpreted as representing the relative air humidity when rain was falling. Consequently, the relative air humidity was highest in 2014 compared with the other years. In addition, the intercepts are different under La Niña (2013) and El Niño (2014–2015), possibly due to the distinct air mass affecting the study area. There were various moisture sources during La Niña in 2013. Since there was high rainfall, both condensed inland moisture and traveled monsoon air masses dominated precipitation over the basin. In contrast, there was low rainfall and dryness in 2015, and re-evaporated air masses might be the only source of precipitation during the El Niño. These phenomena generally occur with dry air columns or small rain events in the continental basin [33,34]. As a secondary effect of this process, the re-evaporated water vapor had a high d-excess during the El Niño in the 2014–2015 period (Figure 3e–f). This re-evaporated vapor supplied subsequent precipitation, resulting in a higher LMWL intercept value than in 2013.

3.3. Isotopic Composition in River Water

Isotopic compositions were determined based on the collected and analyzed river water samples. The river δ2H varied from −97.19‰ to −8.49‰, with a mean value of −59.25 ± 9.62‰. The δ18O varied between −11.78‰ and 0.95‰, with a mean of −5.61 ± 2.19‰ (Figure 4). There was seasonal variation in the stable isotope ratio of the river water. Isotope values in surface water are depleted during the wetter months (defined in this study as April to August) and enriched during the warm–dry months (November to February). However, the river depletion trends (Figure 4c) occurred later than those of rainfall isotopes (Figure 3c) because of the basin’s lag time in producing surface runoff. River isotopes were relatively constant compared with rainfall isotopes, indicating groundwater discharge to the river. Furthermore, the δ18O values of the rivers change from basin to basin, which is especially noticeable in the surface water samples collected from the Kong River. These had δ18O values ranging from −11.78‰ to −3.93‰ and were more depleted (greater negative values) than the samples from the Chi and Mun Rivers, which had δ18O values ranging from −7.03‰ to 0.95‰. Most of the Kong River’s sources likely come from its upstream region, located a considerable distance from the coast, rather than from its sub-rivers. Therefore, our results show that runoff into the Kong River includes the depleted rainfall observed downstream from the entire upstream area.
The isotopic values obtained from multiple subsequent river water samplings taken from the same location should produce a robust regression line (called the LRWL) for the relationship between river δ2H and δ18O (Figure 4d–f). The LRWL slope ranged from 4.52 to 6.33, less steep than both the GMWL slope (8) and the LMWL slopes (6.81 in 2013, 7.70 in 2014, and 7.43 in 2015). The LRWL for all sub-basins had a shallower slope than GMWL and LMWL, mainly due to the moisture source and the mechanisms prior to precipitation determining the original river isotopes. The initial value of the stable composition of river water affects the LRWL intercept, which also depends on the value range. Furthermore, the LRWL slope will be determined by local environmental and climatic conditions because these factors control the variation in LMWL’s intercept and slope. It is common to associate shallower LMWL slopes with low humidity and evaporation levels [35,36]. River water has a longer residence time compared with rainwater. They experience evaporation during the rainfall-runoff processes or the return flow from the agricultural areas and as the result of irrigation systems. The LRWL line for surface water, influenced by evaporation, is shifted to the right of the LMWL line for meteoric water due to differences in how the two isotopes fractionate during evaporation [37,38].
Nevertheless, the LRWL slope should be consistent from year to year. However, additional water sources, such as precipitation events, surface runoff, and groundwater inputs between sampling times, might cause significant differences between LRWLs [39]. Depending on the amount of water added to the water bodies, these deviations may also add uncertainty to calculating evaporative losses. The steeper slope can be explained by the heavier isotopes of both elements being enriched by evaporation. Evaporation of surface water bodies or deep convection that causes lighter isotopes to rise can enrich the residual water for the heavier isotopes [40], resulting in LRWL slopes that fall in the 4-to-6 range. However, whether the evaporation occurs during rainfall, deep within the soil, or in the rivers remains unknown. Additional studies of the air mass isotopes in the studied area are needed to gain a deeper understanding of the evaporation process.
Precipitation might not be the primary water source in streams. The water in a river may have originated from watersheds or lakes further upstream, other large reservoirs or dams, or groundwater baseflow. The Ubonrattana Dam, which is very close to the KKN station, is located upstream of the Chi River. Evaporative enrichment might occur there. Furthermore, there is the possibility that during the dry season sample collection period (November to May), groundwater flow is the primary contributor to the river water in the studied area. It is widely believed that groundwater comprises most streamflow during baseflow periods in many watersheds, known as the gaining stream [41].

3.4. Evaporative Enrichment in Isotopic Water

In 2013, 2014, and 2015, the E/I ratio (for the wet season) and the f value (for the dry season) were calculated. Under steady-state conditions, the E/I ratio was 6.7% for 2013, 4.4% for 2014, and 4.8% for 2015. However, the overall ratio for the entire period was 5.2% (Figure 5e). Therefore, the fraction of river water lost due to evaporation was about 5%. Furthermore, since there is either no or very little flow during the dry season, unsteady state conditions were also considered, in which there is no additional water inflow (Figure 5a). We found that the f value was similar but slightly lower than the E/I ratio (Figure 5d). Evaporation causes a water loss proportional to the free surface area, the temperature of the surrounding air, and the amount of moisture in the air. For example, in another area of Thailand, the E/I value for the surface water creek in the central region was 12% [42]. In contrast, the E/I value of the Okanagan Basin in British Columbia, Canada, a mid-latitudinal catchment encompassing approximately 8200 km2 of land, was 35% [43]. The lake’s longer residence time compared with rivers may underlie its higher evaporation rate.
In addition, the Kong River experienced a lower evaporation rate than the Mun and Chi Rivers in the highland area of Thailand (Figure 5c). While the Kong River is the main river in the system, it has the greatest river area. Relative humidity was higher (Figure 5b), enabling the river water to evaporate to the greatest possible extent. Uncertainty in the estimated percentage of water lost to evaporation is primarily due to the uncertainty associated with the various model variables. Analytical uncertainty in the measurement of the stable isotope composition should be <0.1‰ for δ18O and <1‰ for δ2H. This uncertainty range might increase differences in inflow and outflow values by up to 0.2‰ for δ18O and 2.0‰ for δ2H, which are both possible potential outcomes. Therefore, validation requires the application of supplementary methods or direct observation in the field.

4. Conclusions

This study investigated the impact of ENSO oscillation, both La Niña and El Niño, on the isotope composition of meteoric and river water and estimated evaporation in the tributaries of Thailand’s Lower Mekong River Basin. The seasonal variation in rainfall caused by the ENSO effect (both La Niña and El Niño) can affect isotopic variation in the basin. Raining out during La Niña, which causes heavy rainfall, results in a significant depletion in hydrogen and oxygen isotopes in precipitation and river water. This finding supports the hypothesis that El Niño rains (i.e., those that fall through dry air) originate from isotopically enriched d-excess local moisture (e.g., resulting from evaporation of surface water bodies), producing higher LMWL and LRWL intercepts. In contrast, La Niña rain clouds have traveled a greater distance and experienced multiple fractionations prior to precipitation, producing lower LMWL and LRWL intercepts than El Niño in the 2014–2015 period. Despite high relative humidity during La Niña, a shallower LMWL slope was found, potentially reflecting a deep convective system and secondary evaporation in an unsaturated downdraft. Furthermore, this study provides valuable insights into the dynamic contributions of watershed systems using the software Hydrocalculator based on isotope composition, ambient temperature, and relative humidity data. An estimate of the amount of water lost to evaporation was obtained. The E/I ratio and the f value were estimated to be approximately 4% for the Thailand Mekong River Basin. Validation, however, requires the use of additional techniques or direct observation in the field. Furthermore, our findings also showed spatial and temporal hydrological variation associated with ENSO oscillation and isotopic water composition, facilitating the future development of a better extreme water signal.

Author Contributions

Conceptualization, J.L. and K.I.; methodology, K.K. and S.P.; software, S.P.; validation, J.L., K.I. and N.T.; formal analysis, J.L.; investigation, J.L. and K.I.; resources, K.K. and S.P.; data curation, K.K. and J.L.; original manuscript writing, J.L.; manuscript review and editing, S.P. and N.T.; visualization, J.L.; supervision, K.I.; project administration, N.T.; funding acquisition, N.T. All authors have read and agreed to the published version of the manuscript.

Funding

This research received no external funding.

Institutional Review Board Statement

Not applicable.

Informed Consent Statement

Not applicable.

Data Availability Statement

Not applicable.

Acknowledgments

The authors acknowledge the Department of Water Resources for supporting the hydrological data collection. The authors also thank the Hydro-Informatics Institute for providing stable isotope data.

Conflicts of Interest

The authors declare no conflict of interest.

References

  1. Craig, H. Isotopic variations in meteoric waters. Science 1961, 133, 1702–1703. [Google Scholar] [CrossRef] [PubMed]
  2. Clark, I.D.; Fritz, P. Environmental Isotopes in Hydrogeology; CRC Press: Boca Raton, FL, USA, 2013. [Google Scholar]
  3. Gat, J.R. Oxygen and hydrogen isotopes in the hydrologic cycle. Annu. Rev. Earth Planet. Sci. 1996, 24, 225–262. [Google Scholar] [CrossRef]
  4. Xia, C.; Liu, G.; Mei, J.; Meng, Y.; Liu, W.; Hu, Y. Characteristics of hydrogen and oxygen stable isotopes in precipitation and the environmental controls in tropical monsoon climatic zone. Int. J. Hydrog. Energy 2019, 44, 5417–5427. [Google Scholar] [CrossRef]
  5. Gibson, J.J.; Edwards, T.W.D.; Birks, S.J.; St Amour, N.A.; Buhay, W.M.; McEachern, P.; Wolfe, B.B.; Peters, D.L. Progress in isotope tracer hydrology in Canada. Hydrol. Processes 2005, 19, 303–327. [Google Scholar] [CrossRef]
  6. Dansgaard, W. Stable isotopes in precipitation. Tellus 1964, 16, 436–468. [Google Scholar] [CrossRef]
  7. Stewart, M.K. Stable isotope fractionation due to evaporation and isotopic exchange of falling waterdrops: Applications to atmospheric processes and evaporation of lakes. J. Geophys. Res. 1975, 80, 1133–1146. [Google Scholar] [CrossRef]
  8. Laonamsai, J.; Ichiyanagi, K.; Kamdee, K.; Putthividhya, A.; Tanoue, M. Spatial and temporal distributions of stable isotopes in precipitation over Thailand. Hydrol. Processes 2021, 35, e13995. [Google Scholar] [CrossRef]
  9. He, S.; Goodkin, N.F.; Jackisch, D.; Ong, M.R.; Samanta, D. Continuous real-time analysis of the isotopic composition of precipitation during tropical rain events: Insights into tropical convection. Hydrol. Processes Int. J. 2018, 32, 1531–1545. [Google Scholar] [CrossRef]
  10. Laonamsai, J.; Ichiyanagi, K.; Patsinghasanee, S. Isotopic temporal and spatial variations of tropical rivers in Thailand reflect monsoon precipitation signals. Hydrol. Processes 2021, 35, e14068. [Google Scholar] [CrossRef]
  11. Gibson, J.J.; Edwards, T.W.D.; Bursey, G.G.; Prowse, T.D. Estimating Evaporation Using Stable Isotopes: Quantitative Results and Sensitivity Analysis for Two Catchments in Northern Canada: Paper presented at the 9th Northern Res. Basin Symposium/Workshop (Whitehorse/Dawson/Inuvik, Canada-August 1992). Hydrol. Res. 1993, 24, 79–94. [Google Scholar] [CrossRef]
  12. Gibson, J.J.; Reid, R. Stable isotope fingerprint of open-water evaporation losses and effective drainage area fluctuations in a subarctic shield watershed. J. Hydrol. 2010, 381, 142–150. [Google Scholar] [CrossRef]
  13. Horita, J.; Rozanski, K.; Cohen, S. Isotope effects in the evaporation of water: A status report of the Craig–Gordon model. Isot. Environ. Health Stud. 2008, 44, 23–49. [Google Scholar] [CrossRef] [PubMed]
  14. Salamalikis, V.; Argiriou, A.A.; Dotsika, E. Isotopic modeling of the sub-cloud evaporation effect in precipitation. Sci. Total Environ. 2016, 544, 1059–1072. [Google Scholar] [CrossRef]
  15. Yamanaka, M.; Yabusaki, S. Influence of Evaporation on River Water in Arid and Semi-arid Australia: Relationships between Stable Isotope Ratios and Climatic Factors. Inst. Nat. Sci. Fac. Arts Sci. Nihon Univ. 2017, 52, 225–236. [Google Scholar]
  16. International Atomic Energy Agency. IAEA/GNIP Precipitation Sampling Guide V2; International Atomic Energy Agency: Vienna, Austria, 2014. [Google Scholar]
  17. Hughes, C.E.; Crawford, J. A new precipitation weighted method for determining the meteoric water line for hydrological applications demonstrated using Australian and global GNIP data. J. Hydrol. 2012, 464, 344–351. [Google Scholar] [CrossRef]
  18. Craig, H.; Gordon, L.I. Deuterium and Oxygen 18 Variations in the Ocean and the Marine Atmosphere; Laboratorio di Geologia Nucleare: Pisa, Italy, 1965. [Google Scholar]
  19. Skrzypek, G.; Mydłowski, A.; Dogramaci, S.; Hedley, P.; Gibson, J.J.; Grierson, P.F. Estimation of evaporative loss based on the stable isotope composition of water using Hydrocalculator. J. Hydrol. 2015, 523, 781–789. [Google Scholar] [CrossRef]
  20. Gonfiantini, R.; Wassenaar, L.I.; Araguas-Araguas, L.; Aggarwal, P.K. A unified Craig-Gordon isotope model of stable hydrogen and oxygen isotope fractionation during fresh or saltwater evaporation. Geochim. Cosmochim. Acta 2018, 235, 224–236. [Google Scholar] [CrossRef]
  21. Aggarwal, P.K.; Alduchov, O.A.; Froehlich, K.O.; Araguas-Araguas, L.J.; Sturchio, N.C.; Kurita, N. Stable isotopes in global precipitation: A unified interpretation based on atmospheric moisture residence time. Geophys. Res. Lett. 2012, 39. [Google Scholar] [CrossRef]
  22. Hughes, C.E.; Crawford, J. Spatial and temporal variation in precipitation isotopes in the Sydney Basin, Australia. J. Hydrol. 2013, 489, 42–55. [Google Scholar] [CrossRef]
  23. Ichiyanagi, K. Studies and applications of stable isotopes in precipitation. J. Jpn. Assoc. Hydrol. Sci. 2007, 37, 165–185. [Google Scholar] [CrossRef]
  24. Siegenthaler, U.; Oeschger, H. Correlation of 18O in precipitation with temperature and altitude. Nature 1980, 285, 314. [Google Scholar] [CrossRef]
  25. Yang, Q.; Mu, H.; Guo, J.; Bao, X.; Martín, J.D. Temperature and rainfall amount effects on hydrogen and oxygen stable isotope in precipitation. Quat. Int. 2019, 519, 25–31. [Google Scholar] [CrossRef]
  26. Kurita, N.; Ichiyanagi, K.; Matsumoto, J.; Yamanaka, M.D.; Ohata, T. The relationship between the isotopic content of precipitation and the precipitation amount in tropical regions. J. Geochem. Explor. 2009, 102, 113–122. [Google Scholar] [CrossRef]
  27. Yurtsever, Y.; Gat, J.R. Stable isotope hydrology: Deuterium and oxygen-18 in the water cycle. Atmos. Waters 1981, 210, 103–142. [Google Scholar]
  28. Araguás-Araguás, L.; Froehlich, K.; Rozanski, K. Stable isotope composition of precipitation over southeast Asia. J. Geophys. Res. Atmos. 1998, 103, 28721–28742. [Google Scholar] [CrossRef]
  29. Kondoh, A.; Shimada, J. The origin of precipitation in eastern Asia by deuterium excess. J. Jpn. Soc. Hydrol. Water Resour. 1997, 10, 627–629. [Google Scholar] [CrossRef]
  30. Putman, A.L.; Fiorella, R.P.; Bowen, G.J.; Cai, Z. A global perspective on local meteoric water lines: Meta-analytic insight into fundamental controls and practical constraints. Water Resour. Res. 2019, 55, 6896–6910. [Google Scholar] [CrossRef]
  31. Noone, D. Pairing measurements of the water vapor isotope ratio with humidity to deduce atmospheric moistening and dehydration in the tropical midtroposphere. J. Clim. 2012, 25, 4476–4494. [Google Scholar] [CrossRef]
  32. Lee, J.E.; Fung, I. “Amount effect” of water isotopes and quantitative analysis of post-condensation processes. Hydrol. Processes Int. J. 2008, 22, 1–8. [Google Scholar] [CrossRef]
  33. Noone, D.; Galewsky, J.; Sharp, Z.D.; Worden, J.; Barnes, J.; Baer, D.; Bailey, A.; Brown, D.P.; Christensen, L.; Crosson, E. Properties of air mass mixing and humidity in the subtropics from measurements of the D/H isotope ratio of water vapor at the Mauna Loa Observatory. J. Geophys. Res. Atmos. 2011, 116. [Google Scholar] [CrossRef]
  34. Risi, C.; Noone, D.; Frankenberg, C.; Worden, J. Role of continental recycling in intraseasonal variations of continental moisture as deduced from model simulations and water vapor isotopic measurements. Water Resour. Res. 2013, 49, 4136–4156. [Google Scholar] [CrossRef]
  35. Nan, Y.; Tian, F.; Hu, H.; Wang, L.; Zhao, S. Stable isotope composition of river waters across the world. Water 2019, 11, 1760. [Google Scholar] [CrossRef] [Green Version]
  36. Wang, B.; Zhang, H.; Liang, X.; Li, X.; Wang, F. Cumulative effects of cascade dams on river water cycle: Evidence from hydrogen and oxygen isotopes. J. Hydrol. 2019, 568, 604–610. [Google Scholar] [CrossRef]
  37. Xia, C.; Liu, G.; Meng, Y.; Wang, Z.; Zhang, X. Impact of human activities on urban river system and its implication for water-environment risks: An isotope-based investigation in Chengdu, China. Hum. Ecol. Risk Assess. Int. J. 2020, 27, 1416–1439. [Google Scholar] [CrossRef]
  38. Xia, C.; Liu, G.; Meng, Y.; Jiang, F. Reveal the threat of water quality risks in Yellow River Delta based on evidences from isotopic and hydrochemical analyses. Mar. Pollut. Bull. 2022, 177, 113532. [Google Scholar] [CrossRef] [PubMed]
  39. Fellman, J.B.; Dogramaci, S.; Skrzypek, G.; Dodson, W.; Grierson, P.F. Hydrologic control of dissolved organic matter biogeochemistry in pools of a subtropical dryland river. Water Resour. Res. 2011, 47, 71–81. [Google Scholar] [CrossRef]
  40. Koeniger, P.; Leibundgut, C.; Stichler, W. Spatial and temporal characterization of stable isotopes in river water as indicators of groundwater contribution and confirmation of modelling results; a study of the Weser river, Germany. Isot. Environ. Health Stud. 2009, 45, 289–302. [Google Scholar] [CrossRef]
  41. Oh, Y.H.; Koh, D.-C.; Kwon, H.-I.; Jung, Y.-Y.; Lee, K.Y.; Yoon, Y.-Y.; Kim, D.-H.; Moon, H.S.; Ha, K. Identifying and quantifying groundwater inflow to a stream using 220Rn and 222Rn as natural tracers. J. Hydrol. Reg. Stud. 2021, 33, 100773. [Google Scholar] [CrossRef]
  42. Porntepkasemsan, B.; Kulsawat, W.; Nochit, P. Estimation of Evaporative Loss of Surface Water Using Stable Isotopes in a Lowland Rice Field, Suphanburi, Thailand. In Applied Mechanics and Materials; Trans Tech Publications Ltd.: Bäch, Switzerland, 2019; pp. 8–13. [Google Scholar]
  43. Wassenaar, L.I.; Athanasopoulos, P.; Hendry, M.J. Isotope hydrology of precipitation, surface and ground waters in the Okanagan Valley, British Columbia, Canada. J. Hydrol. 2011, 411, 37–48. [Google Scholar] [CrossRef]
Figure 1. Tributaries of the Lower Mekong River Basin in Thailand. The percentage values denote the area of each country in the Mekong River Basin. Triangular points denote sampling locations (Nongkhai station (NKI), Nakhon Phanom station (NPM), KhonKaen station (KKN), Nakhon Ratchasima station (NMA), Surin station (SRN), and Ubon Ratchathani station (UBN)).
Water 14 02803 g001
Figure 2. Climate anomalies relative to the 30-year average (1981–2010). (ac) Annual precipitation anomaly (PA; mm). (df) Mean temperature anomaly (Temp.; °C). (gi) Annual evaporation anomaly (Evap.; mm). (j) Monthly Oceanic Nino Index (ONI; full bars) and the air temperature anomaly (slashed bars). Plus (+) or minus (−) show higher or lower than the 30-year average (1981–2010). Blue and red ONI bars in (j) denote La Niña and El Niño, respectively.
Water 14 02803 g002
Figure 3. (a) Mean monthly rainfall (mm). (b,c) Mean monthly isotope variation. (df) LMWL.
Water 14 02803 g003
Figure 4. (a) River discharge (m3/s). (b,c) Monthly river isotope. (df) LRWL.
Water 14 02803 g004
Figure 5. (a) Observed monthly air temperature (°C). (b) Observed monthly relative humidity (%). (c) Mean estimated E/I ratio and f values under steady and unsteady state conditions. (d) Estimated f values. (e) Estimated E/I ratios.
Water 14 02803 g005
Publisher’s Note: MDPI stays neutral with regard to jurisdictional claims in published maps and institutional affiliations.

