The Effect of Rainfall on Escherichia coli and Chemical Oxygen Demand in the Effluent Discharge from the Crocodile River Wastewater Treatment; South Africa
Abstract
:1. Introduction
2. Materials and Methods
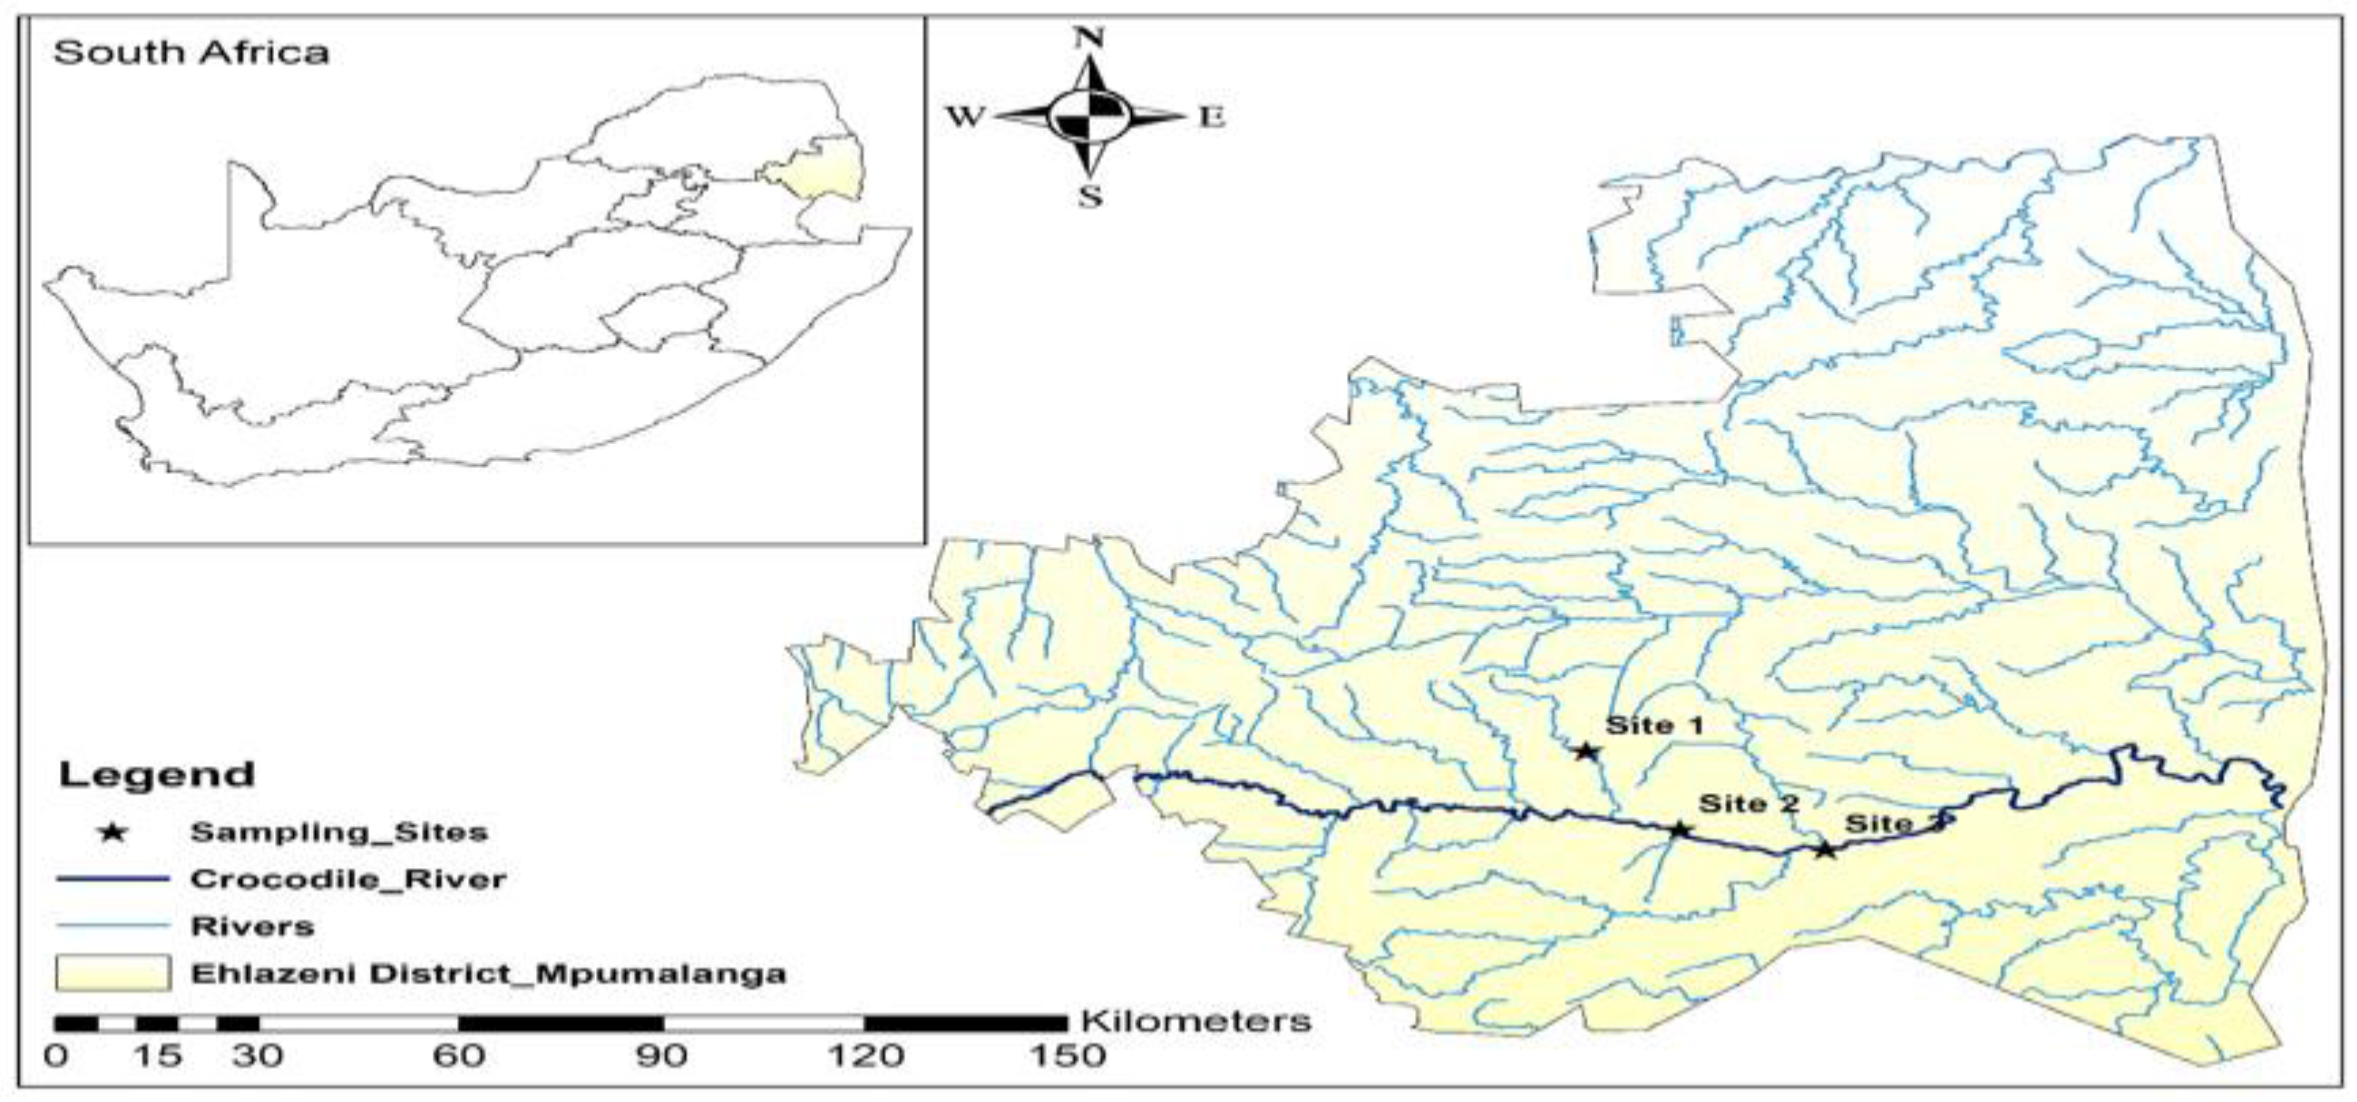
2.1. Study Area
2.2. Sampling Site Descriptions
2.2.1. White River WWTP (Site 1)
2.2.2. Kanyamazane WWTP (Site 2)
2.2.3. Matsulu WWTP (Site 3)
2.3. Sampling Methodology
2.4. Rainfall Data
2.5. Physicochemical Parameters
3. Data Analysis
3.1. Analysis of Physicochemical Parameters
3.2. Statistical Analysis
4. Results
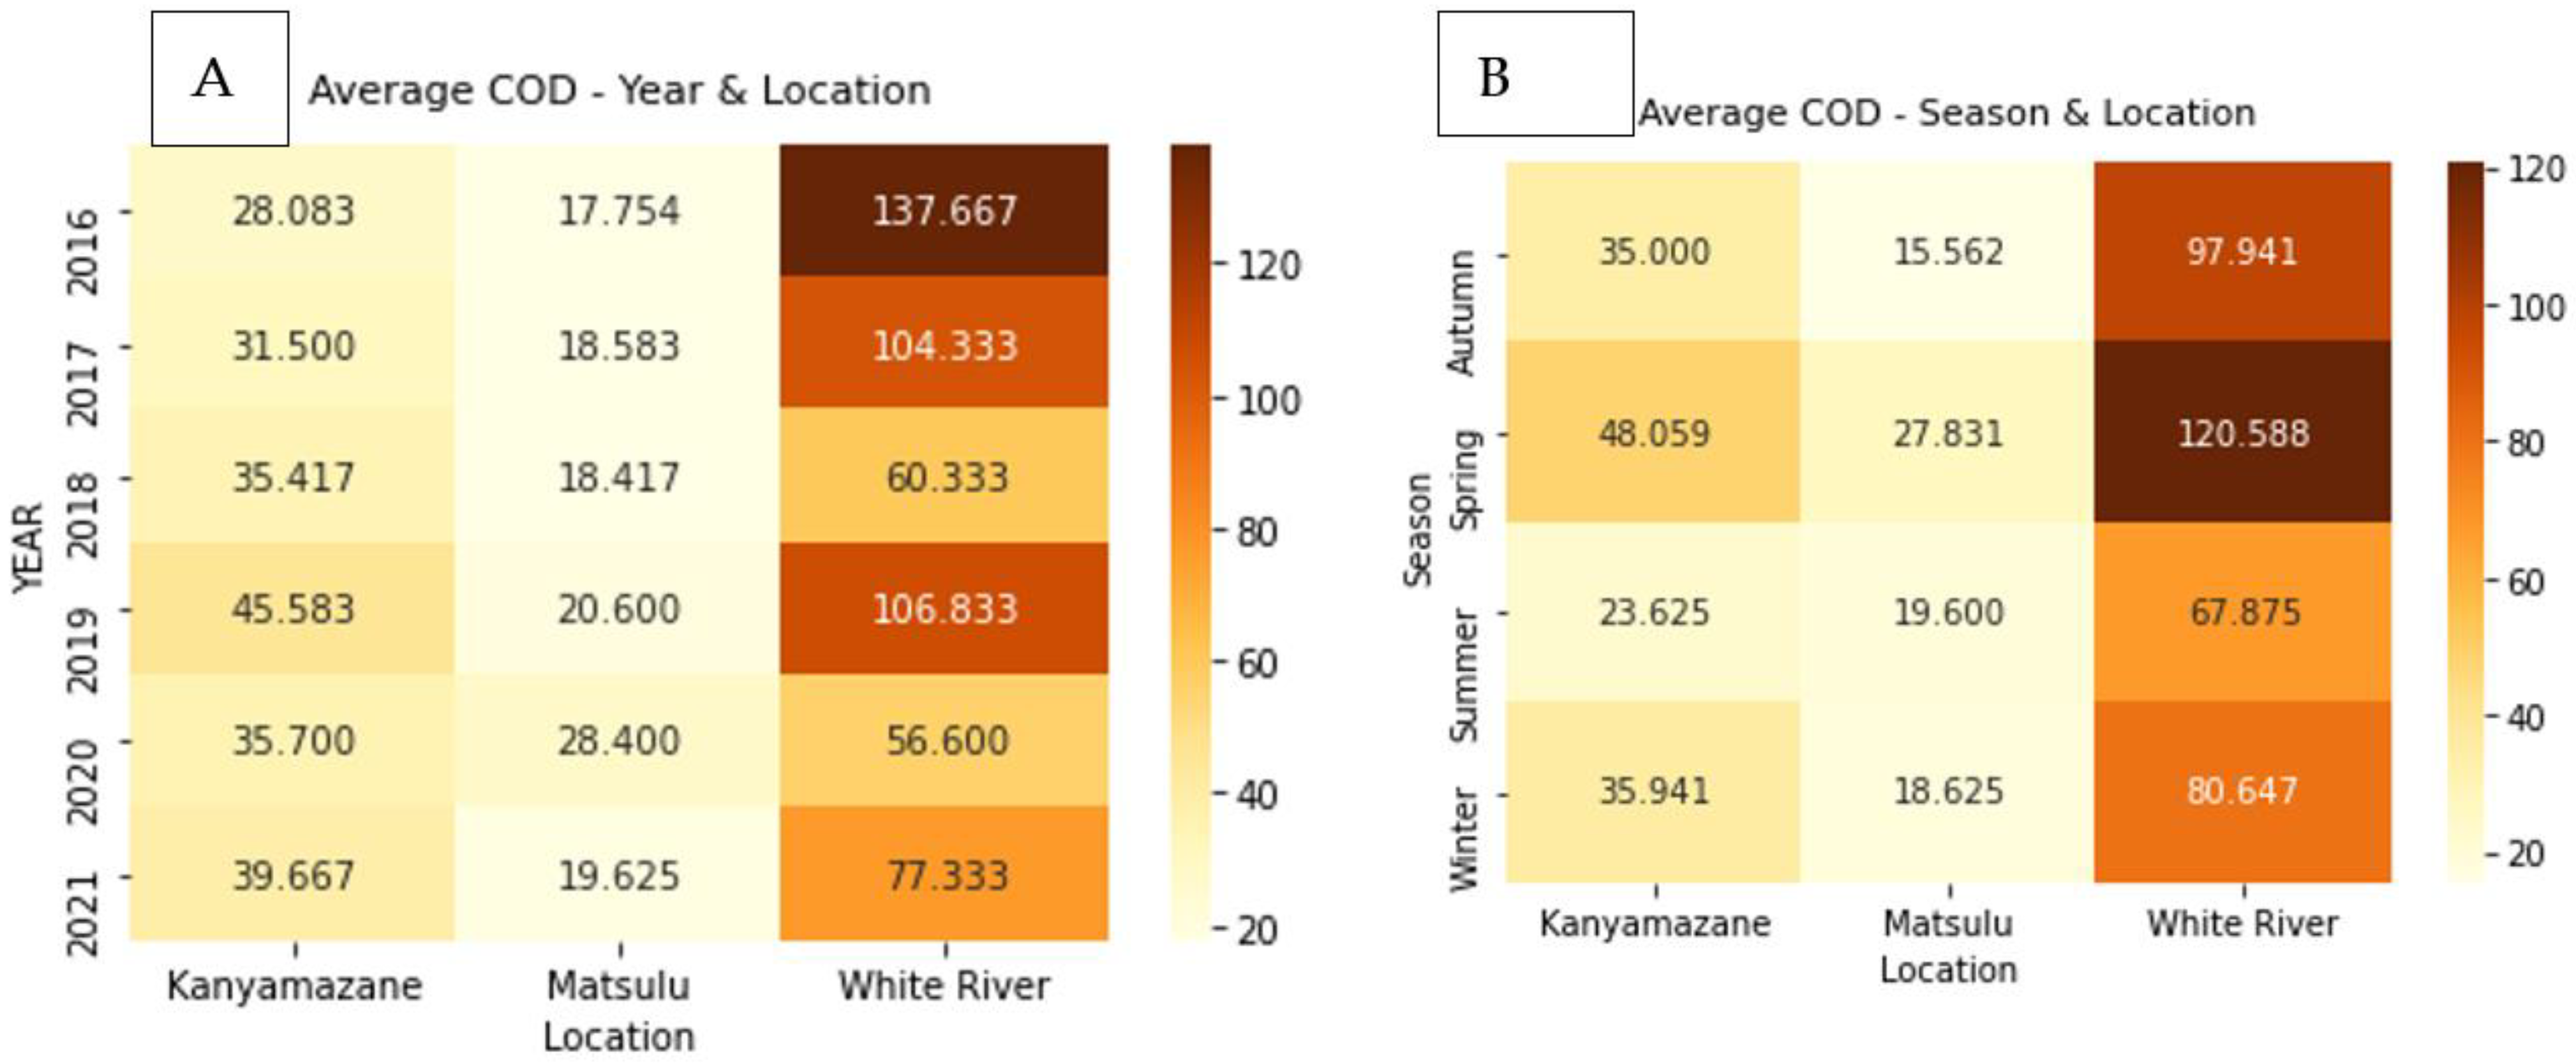
4.1. Spatial-Temporal Distribution of Chemical Oxygen Demand (COD) in Three Strategic Sites of the Crocodile River
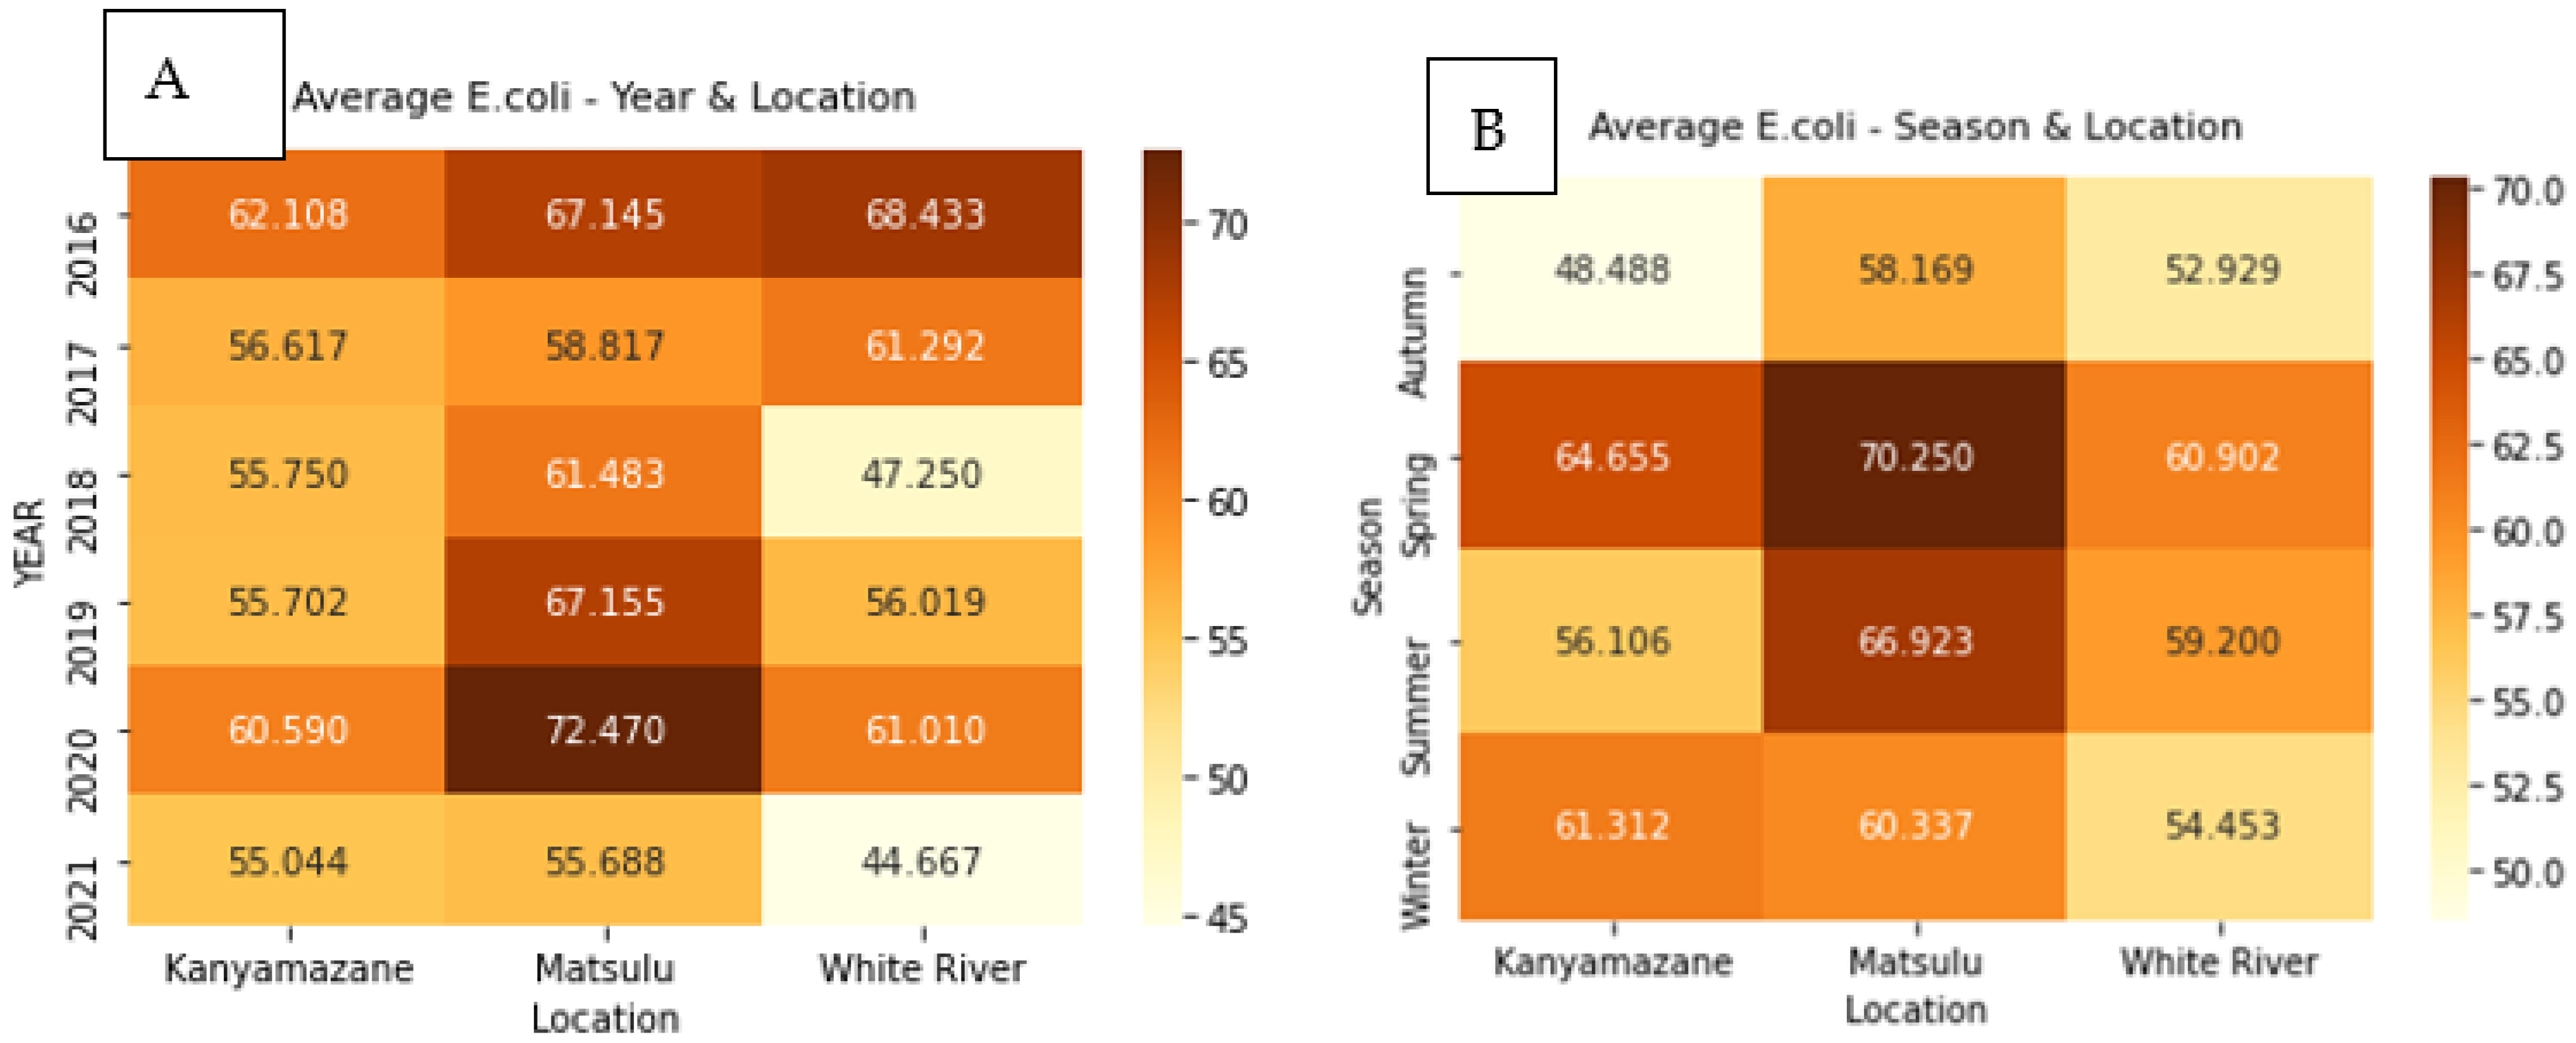
4.2. Spatio-Temporal Distribution of Escherichia coli Levels from the Three WWTP Sampled in the Crocodile River
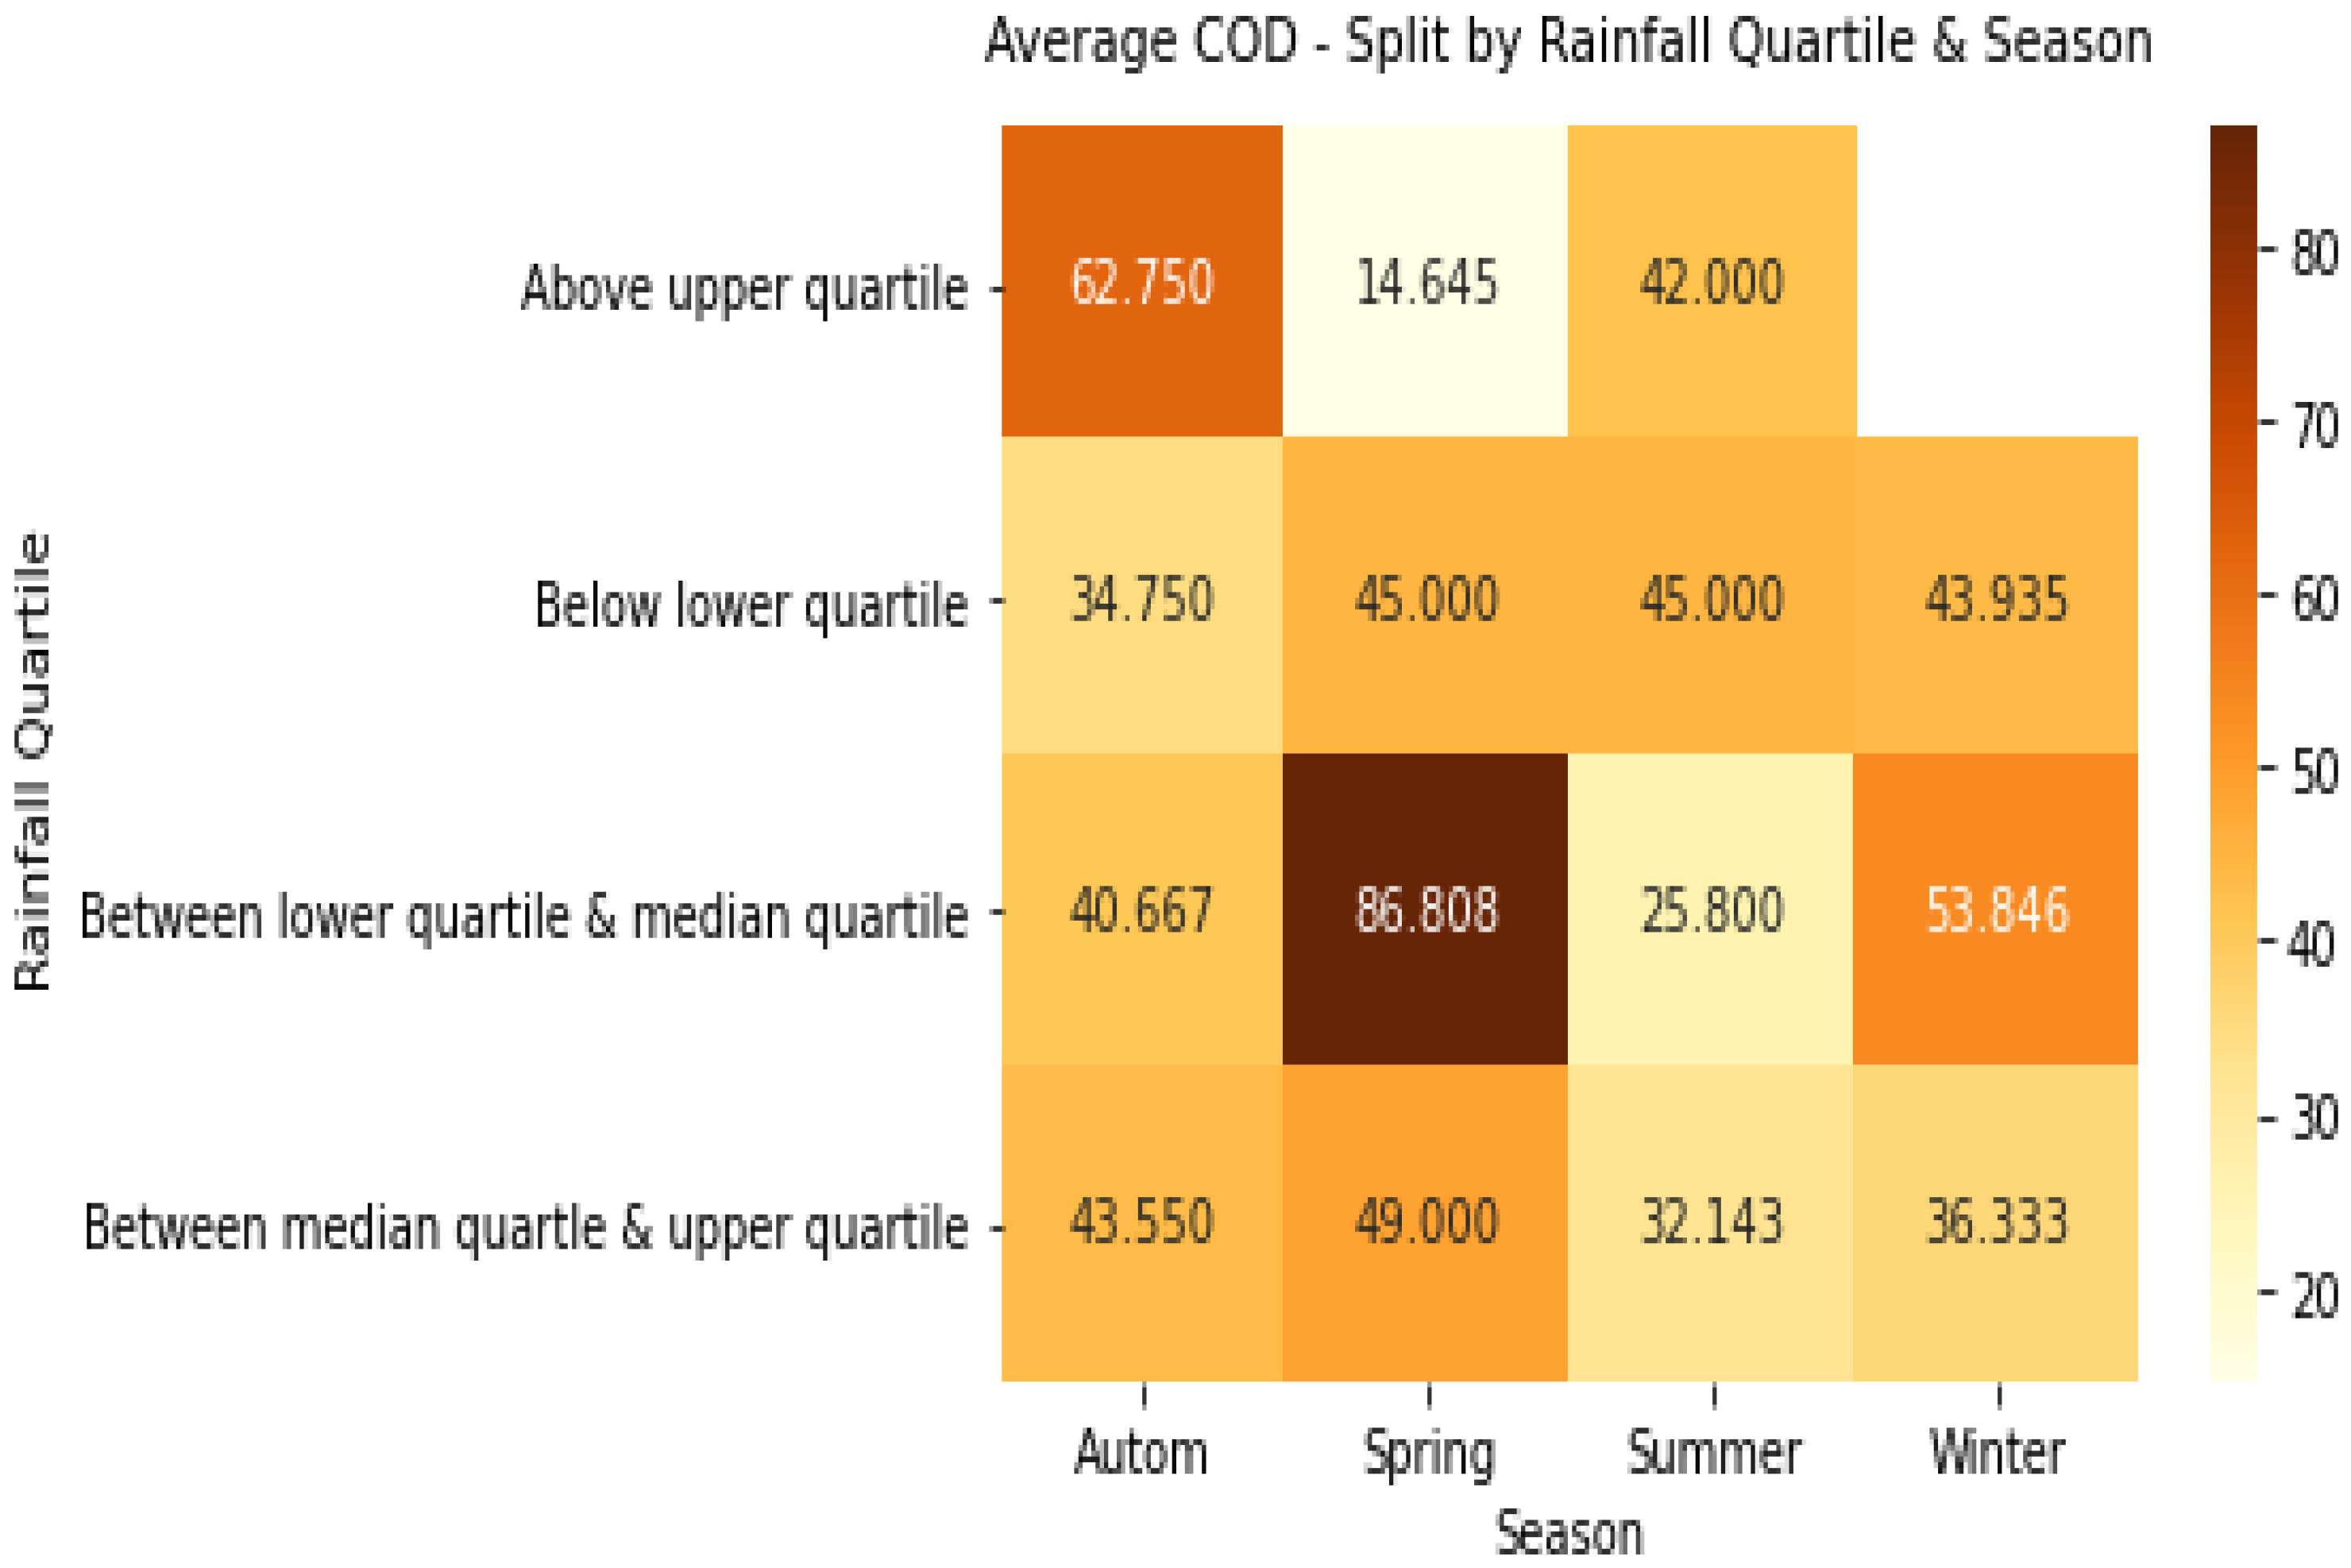
4.3. Spatio-Temporal Distribution of Chemical Oxygen Demand (COD) by Rainfall in the Three Sites
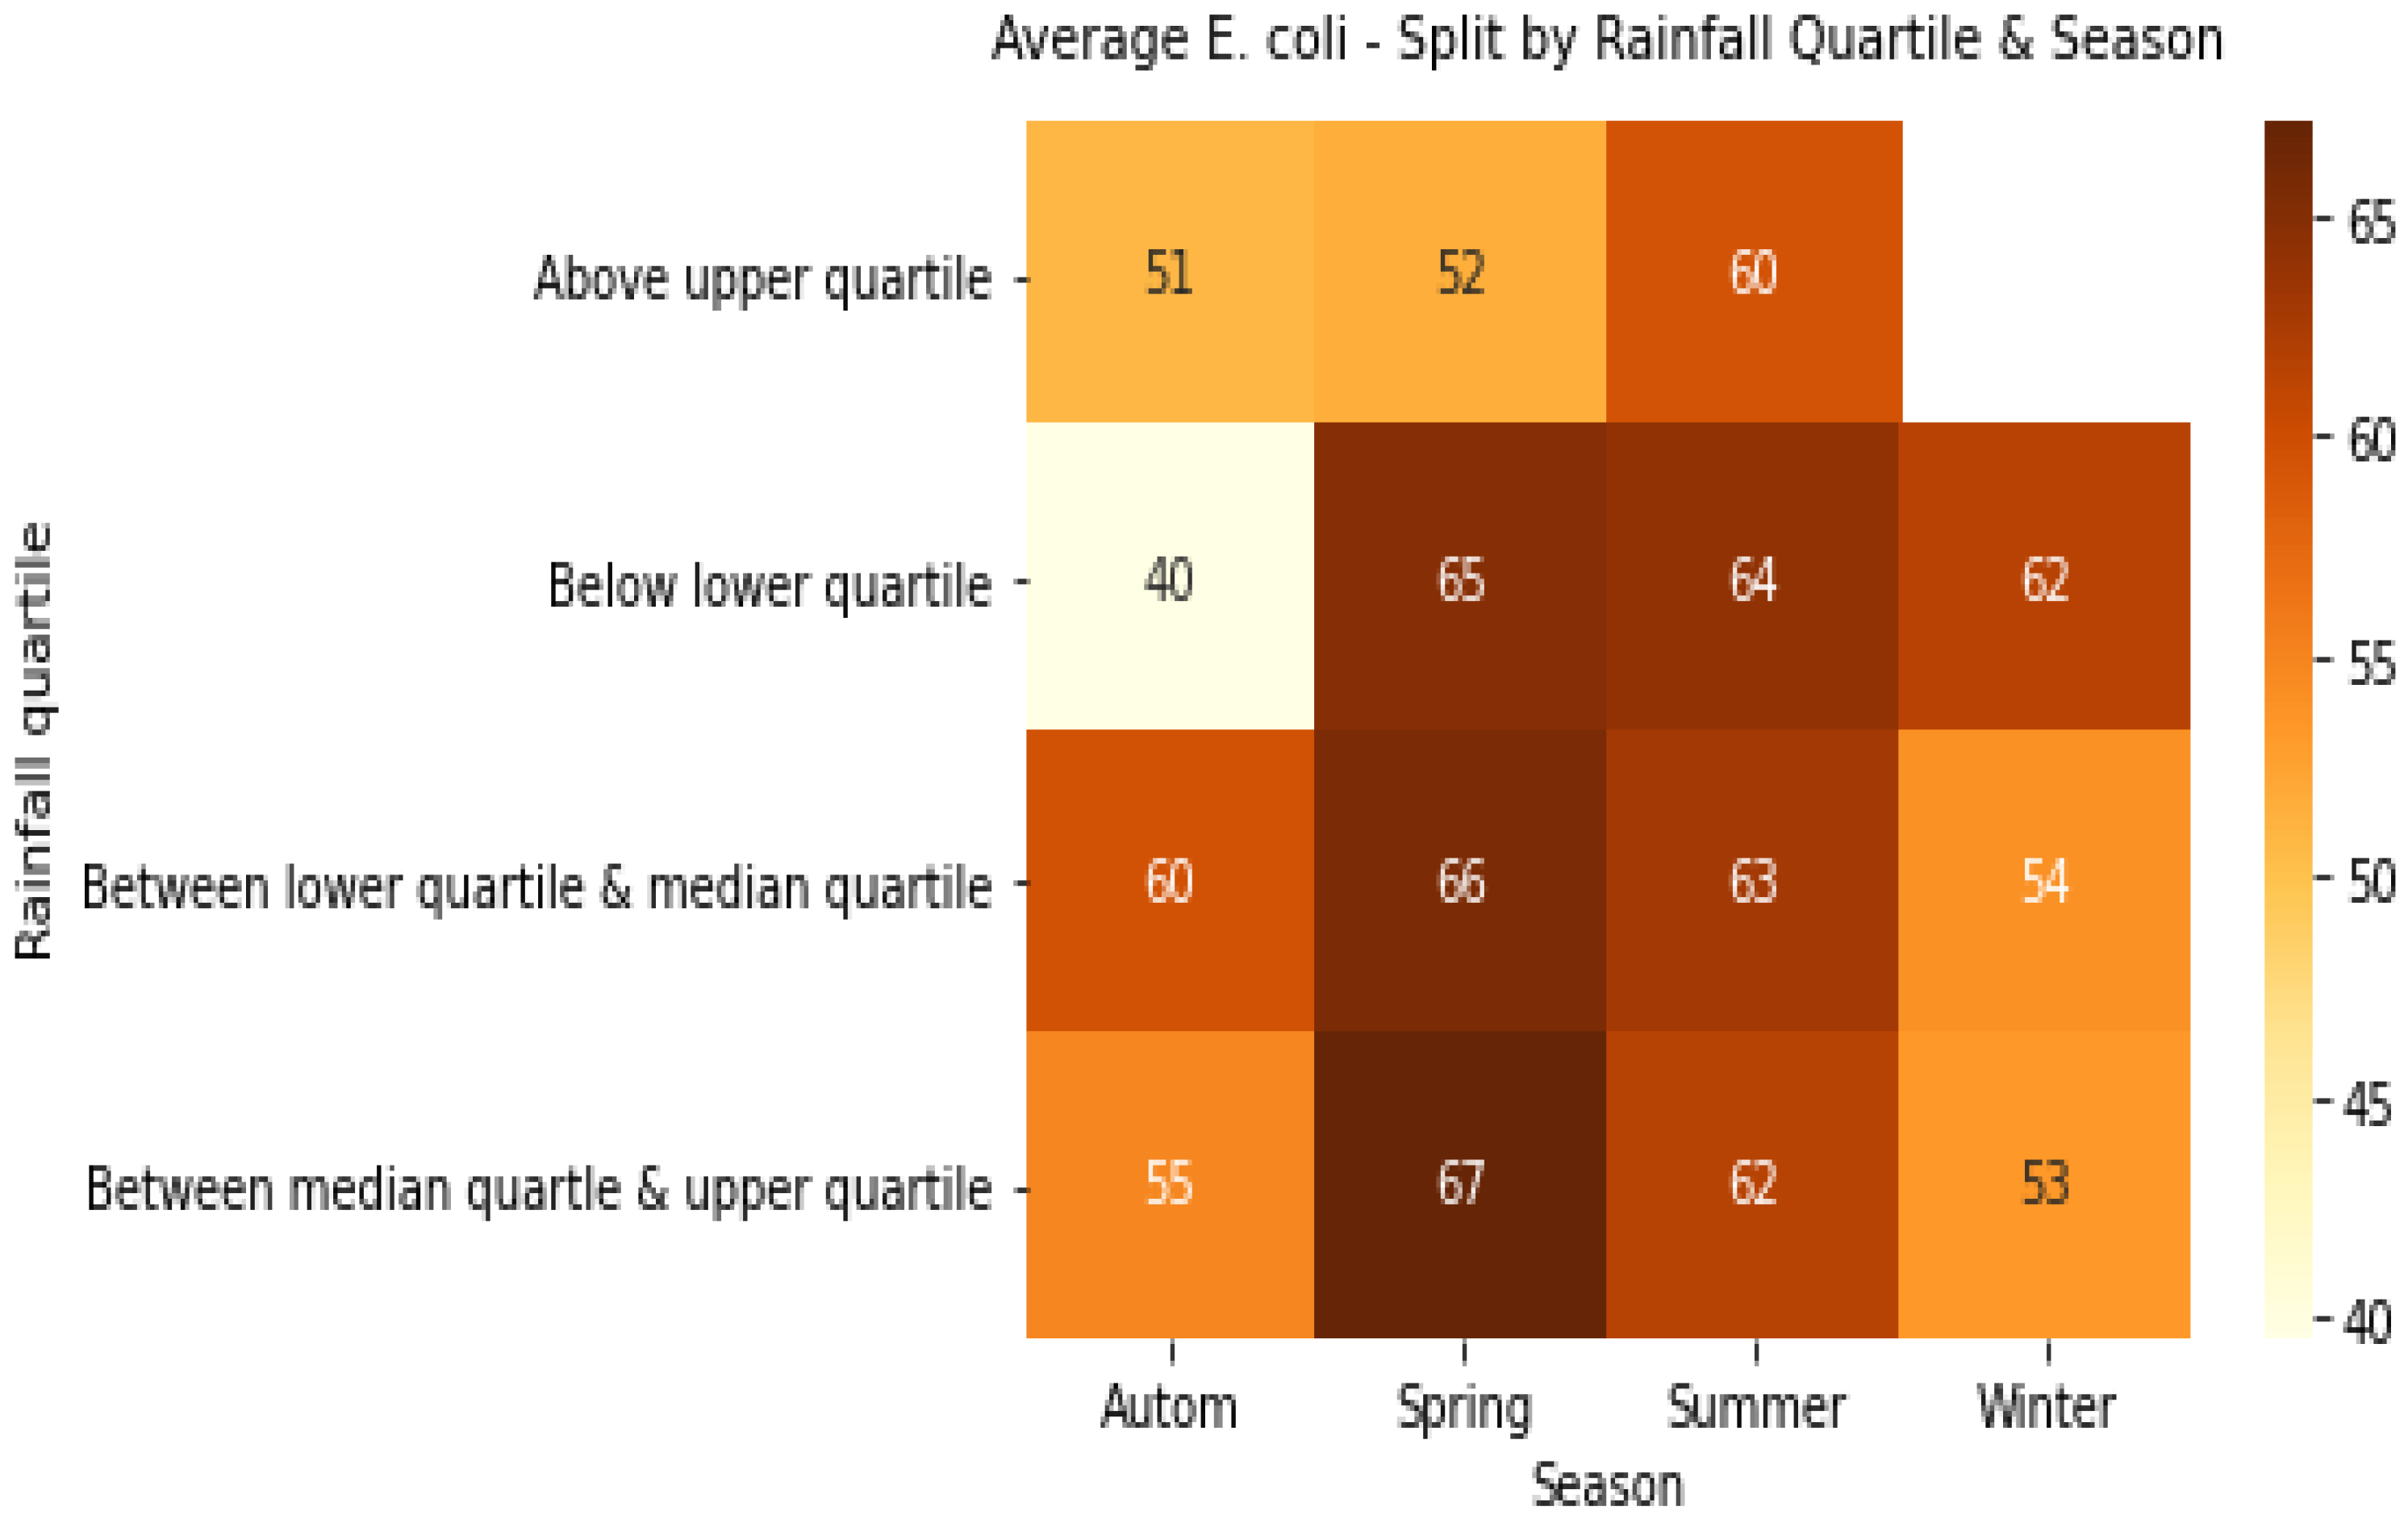
4.4. The Effect of Rainfall on E. coli in the Crocodile River across Four Seasons
5. Discussion
5.1. Spatio-Temporal Distribution of Chemical Oxygen Demand (COD) in Three Strategic Sites of the Crocodile River
5.2. Spatio-Temporal Distribution of Escherichia coli Levels from the Three WWTP Sampled in the Crocodile River
6. Conclusions
Supplementary Materials
Author Contributions
Funding
Institutional Review Board Statement
Informed Consent Statement
Data Availability Statement
Acknowledgments
Conflicts of Interest
Appendix A
| Average of E. coli | Column Labels | |||
|---|---|---|---|---|
| Row Labels | Kanyamazane | Matsulu | White River | Grand Total |
| 2016 | 62.108 | 67.145 | 68.433 | 65.860 |
| Above upper quartile | 59.90 | 67.37 | 64.37 | 64.38 |
| Below lower quartile | 67.10 | 63.55 | 74.43 | 69.57 |
| Between lower quartile & median quartile | 62.93 | 69.78 | 74.40 | 68.65 |
| Between median quartle & upper quartile | 57.50 | 60.50 | 53.60 | 56.70 |
| 2017 | 56.62 | 58.82 | 61.29 | 58.91 |
| Above upper quartile | 53.34 | 58.48 | 53.75 | 55.05 |
| Below lower quartile | 60.40 | 58.66 | 60.06 | 59.53 |
| Between lower quartile & median quartile | 59.23 | 63.05 | 79.25 | 66.04 |
| Between median quartle & upper quartile | 57.10 | 52.50 | 61.70 | 57.10 |
| 2018 | 55.75 | 61.48 | 47.25 | 54.83 |
| Above upper quartile | 55.25 | 44.10 | 48.56 | |
| Below lower quartile | 56.90 | 60.70 | 49.17 | 55.43 |
| Between lower quartile & median quartile | 59.70 | 62.33 | 52.15 | 59.19 |
| Between median quartle & upper quartile | 53.12 | 61.28 | 45.73 | 53.92 |
| 2019 | 55.70 | 67.16 | 56.02 | 59.18 |
| Above upper quartile | 52.90 | 60.23 | 52.77 | 55.99 |
| Below lower quartile | 61.57 | 70.80 | 53.73 | 62.91 |
| Between lower quartile & median quartile | 53.84 | 68.12 | 59.55 | |
| Between median quartle & upper quartile | 53.86 | 69.22 | 54.13 | 57.79 |
| 2020 | 60.59 | 72.47 | 61.01 | 64.69 |
| Above upper quartile | 48.60 | 77.70 | 56.62 | 59.52 |
| Below lower quartile | 63.70 | 76.30 | 71.26 | |
| Between lower quartile & median quartile | 70.00 | 66.70 | 51.63 | 59.99 |
| Between median quartle & upper quartile | 60.33 | 69.00 | 120.50 | 71.10 |
| 2021 | 55.04 | 55.69 | 44.67 | 51.65 |
| Above upper quartile | 30.23 | 73.75 | 44.45 | 46.73 |
| Below lower quartile | 71.40 | 40.15 | 46.40 | |
| Between lower quartile & median quartile | 67.85 | 75.00 | 45.73 | 53.90 |
| Between median quartle & upper quartile | 65.87 | 62.40 | 38.70 | 59.74 |
| Grand Total | 57.66 | 63.87 | 56.84 | 59.37 |
Appendix B
| Average of COD | Column Labels | |||
|---|---|---|---|---|
| Row Labels | Kanyamazane | Matsulu | White River | Grand Total |
| 2016 | 28.083 | 17.754 | 137.667 | 62.408 |
| Above upper quartile | 23.00 | 15.43 | 88.67 | 44.79 |
| Below lower quartile | 26.67 | 27.50 | 87.00 | 53.67 |
| Between lower quartile & median quartile | 30.25 | 16.80 | 319.33 | 96.92 |
| Between median quartle & upper quartile | 30.00 | 10.00 | 40.00 | 30.00 |
| 2017 | 31.50 | 18.58 | 104.33 | 51.47 |
| Above upper quartile | 20.00 | 14.50 | 200.75 | 73.92 |
| Below lower quartile | 47.00 | 22.00 | 55.80 | 40.25 |
| Between lower quartile & median quartile | 37.67 | 18.50 | 47.00 | 34.86 |
| Between median quartle & upper quartile | 35.50 | 18.00 | 76.00 | 41.25 |
| 2018 | 35.42 | 18.42 | 60.33 | 38.06 |
| Above upper quartile | 32.50 | 51.67 | 44.00 | |
| Below lower quartile | 33.00 | 15.33 | 40.00 | 29.00 |
| Between lower quartile & median quartile | 41.00 | 16.75 | 93.00 | 41.78 |
| Between median quartle & upper quartile | 34.20 | 21.60 | 65.75 | 38.71 |
| 2019 | 45.58 | 20.60 | 106.83 | 59.85 |
| Above upper quartile | 10.00 | 12.00 | 89.00 | 44.71 |
| Below lower quartile | 46.67 | 18.75 | 110.67 | 54.70 |
| Between lower quartile & median quartile | 47.67 | 149.00 | 88.20 | |
| Between median quartle & upper quartile | 50.80 | 31.67 | 96.25 | 61.17 |
| 2020 | 35.70 | 28.40 | 56.60 | 40.23 |
| Above upper quartile | 29.00 | 12.00 | 58.00 | 41.33 |
| Below lower quartile | 39.50 | 56.33 | 49.60 | |
| Between lower quartile & median quartile | 62.50 | 22.50 | 55.50 | 49.00 |
| Between median quartle & upper quartile | 23.75 | 15.33 | 54.00 | 24.38 |
| 2021 | 39.67 | 19.63 | 77.33 | 46.54 |
| Above upper quartile | 27.67 | 15.50 | 40.00 | 27.71 |
| Below lower quartile | 34.00 | 26.00 | 27.60 | |
| Between lower quartile & median quartile | 47.00 | 16.00 | 100.67 | 79.33 |
| Between median quartle & upper quartile | 48.67 | 6.00 | 12.00 | 32.80 |
| Grand Total | 35.84 | 20.42 | 92.12 | 50.05 |
References
- Wang, Y.; Wang, P.; Bai, Y.; Tian, Z.; Li, J.; Shao, X.; Mustavich, L.F.; Li, B.L. Assessment of surface water quality via multivariate statistical techniques: A case study of the Songhua River Harbin region, China. J. Hydro. Environ. Res. 2013, 7, 30–40. [Google Scholar] [CrossRef]
- Gasim, M.B.; Khalid, N.A.; Muhamad, H. The influence of tidal activities on water quality of Paka River Terengganu, Malaysia. Malays. J. Anal. Sci. 2015, 19, 979–990. [Google Scholar]
- Abia, A.L.; Ubomba-Jaswa, E.; Momba, M.N. Impact of seasonal variation on Escherichia coli concentrations in the riverbed sediments in the Apies River, South Africa. Sci. Total Environ. 2015, 537, 462–469. [Google Scholar] [CrossRef]
- Edokpayi, J.N.; Odiyo, J.O.; Durowoju, O.S. Impact of wastewater on surface water quality in developing countries: A case study of South Africa. Water Qual. 2017, 10, 66561. [Google Scholar]
- Phungela, T.T.; Maphanga, T.; Chidi, B.S.; Madonsela, B.S.; Shale, K. The impact of wastewater treatment effluent on Crocodile River quality in Ehlanzeni District, Mpumalanga Province, South Africa. S. Afr. J. Sci. 2022, 118, 8. [Google Scholar] [CrossRef]
- Amoah, I.D.; Kumari, S.; Reddy, P.; Stenström, T.A.; Bux, F. Impact of informal settlements and wastewater treatment plants on helminth egg contamination of urban rivers and risks associated with exposure. Environ. Monit. Assess. 2020, 192, 1–13. [Google Scholar] [CrossRef] [PubMed]
- Gqomfa, B.; Maphanga, T.; Shale, K. The impact of informal settlement on water quality of Diep River in Dunoon. Sustain. Water Resour. Manag. 2022, 8, 27. [Google Scholar] [CrossRef]
- Iloms, E.; Ololade, O.O.; Ogola, H.J.; Selvarajan, R. Investigating industrial effluent impact on municipal wastewater treatment plant in Vaal, South Africa. Int. J. Environ. Res. Public Health 2020, 17, 1096. [Google Scholar] [CrossRef]
- Mema, V. Impact of poorly maintained wastewater sewage treatment plants-lessons from South Africa: Wastewater management. ReSource 2010, 12, 60–65. [Google Scholar]
- Guo, H.; Jiao, T.; Zhang, Q.; Guo, W.; Peng, Q.; Yan, X. Preparation of graphene oxide-based hydrogels as efficient dye adsorbents for wastewater treatment. Nanoscale Res. Lett. 2015, 10, 272. [Google Scholar] [CrossRef]
- Medeiros, R.C.; Sammarro Silva, K.J.; Daniel, L.A. Wastewater treatment performance in microbiological removal and (oo) cyst viability assessed comparatively to fluorescence decay. Environ. Technol. 2022, 43, 962–970. [Google Scholar] [CrossRef] [PubMed]
- Mbanga, J.; Abia, A.L.; Amoako, D.G.; Essack, S. Quantitative microbial risk assessment for waterborne pathogens in a wastewater treatment plant and its receiving surface water body. BMC Microbiol. 2020, 20, 346. [Google Scholar] [CrossRef] [PubMed]
- Shuliakevich, A.; Schroeder, K.; Nagengast, L.; Wolf, Y.; Brückner, I.; Muz, M.; Behnisch, P.A.; Hollert, H.; Schiwy, S. Extensive rain events have a more substantial impact than advanced effluent treatment on the endocrine-disrupting activity in an effluent-dominated small river. Sci. Total Environ. 2022, 807, 150887. [Google Scholar] [CrossRef]
- Makuwa, S.; Tlou, M.; Fosso-Kankeu, E.; Green, E. The effects of dry versus wet season on the performance of a wastewater treatment plant in North West Province, South Africa. Water S.A. 2022, 48, 40–49. [Google Scholar] [CrossRef]
- Münze, R.; Hannemann, C.; Orlinskiy, P.; Gunold, R.; Paschke, A.; Foit, K.; Becker, J.; Kaske, O.; Paulsson, E.; Peterson, M.; et al. Pesticides from wastewater treatment plant effluents affect invertebrate communities. Sci. Total Environ. 2017, 599, 387–399. [Google Scholar] [CrossRef] [PubMed]
- Bezuidenhout, C.C.; Mthembu, N.; Puckree, T.; Lin, J. Microbiological evaluation of the Mhlathuze river, KwaZulu-natal (RSA). Water SA 2002, 28, 281–286. [Google Scholar] [CrossRef]
- Chokwe, T.B.; Magubane, M.N.; Abafe, O.A.; Okonkwo, J.O.; Sibiya, I.V. Levels, distributions, and ecological risk assessments of polybrominated diphenyl ethers and alternative flame retardants in river sediments from Vaal River, South Africa. Environ. Sci. Pollut. Res. 2019, 26, 7156–7163. [Google Scholar] [CrossRef]
- Jin, Z.; Zhang, X.; Li, J.; Yang, F.; Kong, D.; Wei, R.; Huang, K.; Zhou, B. Impact of wastewater treatment plant effluent on an urban river. J. Freshw. Ecol. 2017, 32, 697–710. [Google Scholar] [CrossRef]
- Luyt, C.D.; Tandlich, R.; Muller, W.J.; Wilhelmi, B.S. Microbial monitoring of surface water in South Africa: An overview. Int. J. Environ. Res. Public Health 2012, 9, 2669–2693. [Google Scholar] [CrossRef]
- Masindi, V.; Duncker, L. State of Water and Sanitation in South Africa; Council for Scientific and Industrial Research (CSIR): Pretoria, South Africa, 2016; Available online: https://www.researchgate.net/publication/311451788_State_of_Water_and_Sanitation_in_South_Africa (accessed on 20 April 2022).
- Narciso-da-Rocha, C.; Rocha, J.; Vaz-Moreira, I.; Lira, F.; Tamames, J.; Henriques, I.; Martinez, J.L.; Manaia, C.M. Bacterial lineages putatively associated with the dissemination of antibiotic resistance genes in a full-scale urban wastewater treatment plant. Environ. Int. 2018, 118, 179–188. [Google Scholar] [CrossRef]
- Edokpayi, J.N.; Odiyo, J.O.; Msagati, T.A.; Potgieter, N. Temporal variations in physico-chemical and microbiological characteristics of Mvudi River, South Africa. Int. J. Environ. Res. Public Health 2015, 12, 4128–4140. [Google Scholar] [CrossRef] [PubMed]
- Delanka-Pedige, H.M.; Munasinghe-Arachchige, S.P.; Abeysiriwardana-Arachchige, I.S.; Nirmalakhandan, N. Wastewater infrastructure for sustainable cities: Assessment based on UN sustainable development goals (SDGs). Int. J. Sustain. Dev. 2021, 28, 203–209. [Google Scholar] [CrossRef]
- Kanu, I.; Achi, O.K. Industrial effluents and their impact on water quality of receiving rivers in Nigeria. JATES 2011, 1, 75–86. [Google Scholar]
- Ngwira, L.; Lakudzala, D. Assessment of the quality of SOBO industrial wastewater and its impact on water quality in Nankhaka River. Phys. Chem. Earth 2018, 108, 9–12. [Google Scholar] [CrossRef]
- Ebrahimi, M.; Gerber, E.L.; Rockaway, T.D. Temporal performance assessment of wastewater treatment plants by using multivariate statistical analysis. J. Environ. Manag. 2017, 193, 234–246. [Google Scholar] [CrossRef] [PubMed]
- Department of Water Affairs. Report on the Status of Sanitation Services in South Africa; Department of Environmental Affairs: Pretoria, South Africa, 2012. Available online: https://www.dpme.gov.za/publications/Reports%20and%20Other%20Information%20Products/Sanitation%20Report.pdf (accessed on 17 June 2022).
- Ntombela, C.; Funke, N.; Meissner, R.; Steyn, M.; Masangane, W. A critical look at South Africa’s green drop programme. Water SA 2016, 42, 703–710. [Google Scholar] [CrossRef]
- Bunce, J.T.; Ndam, E.; Ofiteru, I.D.; Moore, A.; Graham, D.W. A review of phosphorus removal technologies and their applicability to small-scale domestic wastewater treatment systems. Front. Environ. Sci. 2018, 6, 8. [Google Scholar] [CrossRef]
- Cai, H.; Liang, J.; Ning, X.A.; Lai, X.; Li, Y. Algal toxicity induced by effluents from textile-dyeing wastewater treatment plants. J. Environ. Sci. 2020, 91, 199–208. [Google Scholar] [CrossRef]
- Islam, M.M.; Iqbal, M.S.; D’Souza, N.; Islam, M.A. A review on present and future microbial surface water quality worldwide. Environ. Nanotechnol. Monit. Manag. 2021, 16, 100523. [Google Scholar] [CrossRef]
- Song, H.M.; Zhu, L.J.; Wang, Y.; Wang, G.; Zeng, Z.X. Fe-based Prussian blue cubes confined in graphene oxide nanosheets for the catalytic degradation of dyes in wastewater. Sep. Purif. Technol. 2022, 288, 120676. [Google Scholar] [CrossRef]
- United State Environmental Protection Agency. Wastewater Sampling—US Environmental Protection Agency; Environmental Protection Agency: Athens, GA, USA, 2013. Available online: https://www.epa.gov/sites/default/files/2015-06/documents/Wastewater-Sampling.pdf (accessed on 25 April 2022).
- Department of Water and Sanitation. Planning Level Review of Water Quality in South Africa; Department of Water and Sanitation: Pretoria, South Africa, 2013. Available online: https://www.dws.gov.za/iwrp/iwqms/Documents/Report%201.1_Inception%20Report.pdf (accessed on 5 May 2022).
- Alberto, W.D.; del Pilar, D.M.; Valeria, A.M.; Fabiana, P.S.; Cecilia, H.A.; de Los Ángeles, B.M. Pattern recognition techniques for the evaluation of spatial and temporal variations in water quality. A case study: Suquía River Basin (Córdoba—Argentina). Water Res. 2001, 35, 2881–2894. [Google Scholar] [CrossRef]
- Singh, K.P.; Malik, A.; Mohan, D.; Sinha, S. Multivariate statistical techniques for the evaluation of spatial and temporal variations in water quality of Gomti River (India)—A case study. Water Res. 2004, 38, 3980–3992. [Google Scholar] [CrossRef] [PubMed]
- Joel, C.; Kiprop, E.K.; Mwamburi, L.A. Effect of seasonal variation on performance of conventional wastewater treatment system. J. Appl. Environ. Microbiol. 2017, 5, 1–7. [Google Scholar]
- Abagale, F.K. Seasonal Variation and Removal of Organic Pollutants in Wastewater Using Low-Cost Treatment Technologies in Tamale Metropolis, Ghana. J. Water Resour. Prot. 2021, 13, 271–282. [Google Scholar] [CrossRef]
- Osuolale, O.; Okoh, A. Assessment of the physicochemical qualities and prevalence of Escherichia coli and vibrios in the final effluents of two wastewater treatment plants in South Africa: Ecological and public health implications. Int. J. Environ. Res. Public Health 2015, 12, 13399–13412. [Google Scholar] [CrossRef] [Green Version]
- Edokpayi, J.N.; Enitan-Folami, A.M.; Adeeyo, A.O.; Durowoju, O.S.; Jegede, A.O.; Odiyo, J.O. Recent trends and national policies for water provision and wastewater treatment in South Africa. In Water Conservation and Wastewater Treatment in BRICS Nations Technologies, Challenges, Strategies and Policies; Singh, Y., Milshina, Y., Eds.; Elsevier: Amsterdam, The Netherlands, 2020; pp. 187–211. [Google Scholar]
- De Oliveira, M.; Frihling, B.E.; Velasques, J.; Magalhães Filho, F.J.; Cavalheri, P.S.; Migliolo, L. Pharmaceuticals residues and xenobiotics contaminants: Occurrence, analytical techniques and sustainable alternatives for wastewater treatment. Sci. Total Environ. 2020, 705, 135568. [Google Scholar] [CrossRef]
- Dehghani, M.; Sorooshian, A.; Ghorbani, M.; Fazlzadeh, M.; Miri, M.; Badiee, P.; Parvizi, A.; Ansari, M.; Baghani, A.N.; Delikhoon, M. Seasonal variation in culturable bioaerosols in a wastewater treatment plant. Aerosol. Air Qual. Res. 2018, 18, 2826. [Google Scholar] [CrossRef]
- Liu, G.; Chen, L.; Wang, W.; Sun, C.; Shen, Z. A water quality management methodology for optimizing best management practices considering changes in long-term efficiency. Sci. Total Environ. 2020, 725, 138091. [Google Scholar] [CrossRef]
- Li, X.; Jin, X.; Zhao, N.; Angelidaki, I.; Zhang, Y. Efficient treatment of aniline containing wastewater in bipolar membrane microbial electrolysis cell-Fenton system. Water Res. 2017, 119, 67–72. [Google Scholar] [CrossRef] [Green Version]
| pH | EC mS/cm | + | E. coli (cfu)/100 mL | SS (mg/L) | PO4 mg/dL | COD mg/L | ||
|---|---|---|---|---|---|---|---|---|
| White River WWTP | 5.5–9.5 | 70 | 15 | 0 | 25 | 1 | 1 | 75 |
| Kanyamazane WWTP | 5.5–9.5 | 75 | 15 | 0 | 25 | 1 | 6 | 75 |
| Matsulu WWTP | 5.5–9.5 | 70 | 15 | 0 | 25 | 1 | 3 | 75 |
| OLS Regression Results | ||||||
|---|---|---|---|---|---|---|
| Dep. Variable: | y | R-squared: | 0.001 | |||
| Model: | OLS | Adj. R-squared: | −0.004 | |||
| Method: | Least Squares | F-statistic: | 0.2278 | |||
| Date: | Thu, 8 September 2022 | Prob (F-statistic): | 0.634 | |||
| Time: | 10:34:29 | Log-Likelihood: | −1125 | |||
| No. Observations: | 195 | AIC: | 2254 | |||
| Df Residuals: | 193 | BIC: | 2261 | |||
| Df Model: | 1 | |||||
| Covariance Type: | nonrobust | |||||
| coef | std err | t | P > |t| | [0.025 | 0.975] | |
| const | 48.0056 | 6.809 | 7.051 | 0 | 34.577 | 61.434 |
| Rainfall | 1.0628 | 2.227 | 0.477 | 0.634 | −3.329 | 5.455 |
| Omnibus: | 280.229 | Durbin-Watson: | 1.648 | |||
| Prob (Omnibus): | 0 | Jarque-Bera (JB): | 22,262.47 | |||
| Skew: | 6.433 | Prob (JB): | 0 | |||
| Kurtosis: | 53.739 | Cond. No. | 3.87 | |||
| OLS Regression Results | ||||||
|---|---|---|---|---|---|---|
| Dep. Variable: | y | R-squared: | 0.043 | |||
| Model: | OLS | Adj. R-squared: | 0.038 | |||
| Method: | Least Squares | F-statistic: | 8.738 | |||
| Date: | Thu, 8 September 2022 | Prob (F-statistic): | 0.00351 | |||
| Time: | 11:45:03 | Log-Likelihood: | −776.46 | |||
| No. Observations: | 195 | AIC: | 1557 | |||
| Df Residuals: | 193 | BIC: | 1563 | |||
| Df Model: | 1 | |||||
| Covariance Type: | nonrobust | |||||
| coef | std err | t | P > |t| | [0.025 | 0.975] | |
| const | 61.2524 | 1.14 | 53.75 | 0 | 59.005 | 63.5 |
| Rainfall | −1.1017 | 0.037 | −2.956 | 0.004 | −1.837 | −0.367 |
| Omnibus: | 33.863 | Durbin-Watson: | 1.174 | |||
| Prob (Omnibus): | 0 | Jarque-Bera (JB): | 218.581 | |||
| Skew: | −0.347 | Prob (JB): | 3.43 × 10 −48 | |||
| Kurtosis: | 8.14 | Cond. No. | 3.87 | |||
Publisher’s Note: MDPI stays neutral with regard to jurisdictional claims in published maps and institutional affiliations. |
© 2022 by the authors. Licensee MDPI, Basel, Switzerland. This article is an open access article distributed under the terms and conditions of the Creative Commons Attribution (CC BY) license (https://creativecommons.org/licenses/by/4.0/).
Share and Cite
Maphanga, T.; Madonsela, B.S.; Chidi, B.S.; Shale, K.; Munjonji, L.; Lekata, S. The Effect of Rainfall on Escherichia coli and Chemical Oxygen Demand in the Effluent Discharge from the Crocodile River Wastewater Treatment; South Africa. Water 2022, 14, 2802. https://doi.org/10.3390/w14182802
Maphanga T, Madonsela BS, Chidi BS, Shale K, Munjonji L, Lekata S. The Effect of Rainfall on Escherichia coli and Chemical Oxygen Demand in the Effluent Discharge from the Crocodile River Wastewater Treatment; South Africa. Water. 2022; 14(18):2802. https://doi.org/10.3390/w14182802
Chicago/Turabian StyleMaphanga, Thabang, Benett S. Madonsela, Boredi S. Chidi, Karabo Shale, Lawrence Munjonji, and Stanley Lekata. 2022. "The Effect of Rainfall on Escherichia coli and Chemical Oxygen Demand in the Effluent Discharge from the Crocodile River Wastewater Treatment; South Africa" Water 14, no. 18: 2802. https://doi.org/10.3390/w14182802


