Article

Distribution of Microplastics in Beach Sand on the Can Gio Coast, Ho Chi Minh City, Vietnam

by
Nguyen Thi Thanh Nhon
1,2,
Nguyen Thao Nguyen
1,2,
Ho Truong Nam Hai
1,2 and
To Thi Hien
1,2,*
1
Faculty of Environment, University of Science, 227 Nguyen Van Cu Street, District 5, Ho Chi Minh City 700000, Vietnam
2
Vietnam National University, Ho Chi Minh City 700000, Vietnam
*
Author to whom correspondence should be addressed.
Water 2022, 14(18), 2779; https://doi.org/10.3390/w14182779
Submission received: 28 July 2022 / Revised: 30 August 2022 / Accepted: 2 September 2022 / Published: 7 September 2022
(This article belongs to the Section Water Quality and Contamination)

Abstract

:
Microplastics pollution in Vietnam has received significant attention in recent years because of its adverse effects on the environment. This study examined the abundance, physical characteristics, and chemical composition of microplastics in beach sand from the Can Gio Coast, Ho Chi Minh City, Vietnam for the first time. Five beaches with different features and anthropogenic activities along the Can Gio Coast were selected. Ninety sand samples were collected from the edge of the water to the upper shoreline at different depths to assess the spatial distribution of microplastics. Microplastics were extracted by density separation in a solution of sodium chloride (NaCl) and zinc chloride (ZnCl2) and examined by attenuated total reflection Fourier transform infrared spectroscopy (FTIR-ATR). The abundance of microplastics varied from 0 to 6.58 pieces/kg d.w. Microplastics were detected mostly along the upper shoreline and in the surface sand layer. The dimension of the microplastics ranged from 2.8 to 5 mm (71.4%), granules accounted for the highest proportion of shape (42.9%), and white and blue were the two most prevalent colors (81%). Polypropylene, polystyrene, and polyethylene were the three most common polymer types. The characteristics of microplastics indicate that their origin may be from resin pellets, tourism activities, and aquacultural activities.

1. Introduction

Plastic production first appeared in the 1950s, with about 1.5 million tons of plastic generated annually [1]. As of 2015, worldwide plastic production has increased significantly to 381 million tons per year [2]. The total amount of plastic manufactured from 1950 to 2015 is estimated to be 8.3 billion tons, which is equivalent to more than 1 ton per person, whereas 5.8 billion tons (71.6%) are no longer in use. Plastic waste ends up in landfills or is incinerated and discarded. Each year, 8 million tons of plastic waste go straight into the ocean [2,3,4]. Land-based plastic waste flows into oceans and accumulates into large garbage patches, which are found in the Pacific Ocean (at least 79 tons) [5]. If current plastic production and waste management policies are prolonged, approximately 12 billion tons of plastic will be discharged by 2050 [3]. While the benefits of plastics are undeniable, their popularity and convenience in terms of their various uses and disposal, such as for packaging, have quickly resulted in their accumulation in the environment [6]. Floating plastic debris is continually affected by wind and waves, resulting in its rapid distribution across the water surface in a large area [7,8]. In addition to the negative impact on environmental aesthetics, rampant plastic waste also causes economic consequences on tourism. Moreover, the effects of plastic particles include obstruction of the digestive and respiratory system of wildlife and habitat encroachment, and floating plastic debris can promote invasive species [9,10,11]. An important issue caused by plastic waste is the appearance of microplastics [12], for example: microplastics were found in the mid-west Pacific Ocean with a mean concentration of 34,039 ± 25,101 pieces/km2 [13], 50 ± 30 particles/m3 in the tropical Indian Ocean [14]; or from 0.029 to 0.310 item/m2 in the Mediterranean Sea [15].
There are various definitions of microplastics. In general, they are pieces of plastic with a size smaller than 5 mm in length [16,17,18]. Microplastics readily enter the food chain because of their tiny size and accumulate in marine species because they are mistaken as prey and consumed. The bioaccumulation pathway of microplastics was described by a model marine food web. The model shows that Neocalanus cristatus (0.026 MPs/org) is the prey of Crangon crangon (0.64 ± 0.53 MPs/g w.w.), while Crangon crangon is a type of food for Mixied fish species (0.27 ± 0.63–83 MPs/fish) [19]. Whenever microplastics enter a marine organism, they may cause damage, such as obstruction of the digestion tract and other internal injuries that lead to starvation and the death of these animals. In some instances, they may reduce the respiratory capacity of animals [20]. Besides the physical effects, because of the chemical composition and the large surface area, microplastics also have toxic effects on the ecosystem. The increase in plastic production has resulted in the use of additives in commercial plastics to enhance their appearance and performance [21]. Many additives, such as flame retardants and plasticizers, are lipophilic. They easily penetrate cell membranes, causing significant effects on the consumer’s health [10,22]. Moreover, toxins and pathogenic microorganisms can adhere to the surface of microplastics. Some persistent organic pollutants, such as polybrominated diphenyl ethers, polychlorinated biphenyls, and pesticides, mimic the activity of natural hormones. Following consumption, they may induce reproductive disorders [23]. These microplastic pieces may also be generated secondarily by physical, biological, or chemical effects of the environment, such as the fragmentation of plastic wastes [18,24]. Besides, microplastics are also manufactured in small sizes, such as resin pellets, which are the primary ingredient in the production of plastic items, personal care products, cosmetics, and toothpaste, which contain microplastics and nanoplastics that readily enter the sewage system and, ultimately, the ocean [8,9,25]. Because microplastics cause significant adverse effects on the environment and organisms, from the 2000s, the issue of microplastics has received attention, which has led to a number of studies investigating on microplastics and their impacts. The first studies mainly focused on analyzing methods and the distribution of microplastics [16,17,26]. Microplastics have been detected everywhere including surface water, marine creatures, and sediment [20,27,28,29,30]. Coastal areas are a prominent area for microplastic accumulation because their location is the intersection between estuaries and the ocean. In addition, these sites are affected by anthropogenic activities including aquaculture, tourism, and transportation. Research on microplastics in beach sand around the world indicates that garbage discharged from inland and marine activities causes large amounts of plastic waste to drift into the coastal environment [31,32]. The number of studies on microplastics in beach sand has also increased over time. Some studies have reported that the concentration of microplastics in beach sand and sea sediment is significant [33,34,35]. Recently, a number of studies on microplastics in mangroves and estuarine ecosystems concluded that wetland flora are a potential storage depot for microplastics [36,37,38,39]. The concentration of microplastics in beach sand varies in different studies, ranging from 1 piece/kg d.w. to more than 2000 pieces/kg d.w. [40,41,42]. The size of microplastics can be measured down to tens of micrometers as demonstrated in a Belgium and Korean study [36,40]. The distribution of microplastics also varies in tidal lines. According to some studies, the majority of microplastics are found in the upper shoreline [35,36]. The impact of coastal commercial tourism on sampling sites was also surveyed, and the results indicate significant levels at bathing sites frequented by tourists. The number of microplastics observed was significantly higher compared with that in deserted areas or steep beaches [43,44]. These differences may be explained by the application of different methods of sampling and separating microplastics as well as the manner in which microplastics are identified [45].
Vietnam contains a long coastline with many anthropogenic activities. It is also one of the top countries that discharge plastic waste into the environment, which leads to a high potential for microplastic contamination [2]. In recent years, microplastic pollution has gained significant attention from scholars. Several studies were conducted in the inland waters, marine animals, road dust, and beach sand [43,46,47,48,49]. However, there are no data with respect to the microplastics in beach sand from Can Gio, a coastal suburban district of Ho Chi Minh City, which is the most populous city in Vietnam. Can Gio is where many rivers transport wastes from the inland and mangrove forests. Here the ocean and sea currents affect the diverse shoreline, which hosts a variety of anthropogenic activities, such as aquaculture, trading, and tourism. Therefore, this study was done to verify the physical and chemical characteristics of microplastics in beach sand from the Can Gio Coast. This is the first report of microplastics in beach sand from Can Gio, Vietnam.

2. Materials and Methods

2.1. Study Area

Can Gio is approximately 50 km away from the center of Ho Chi Minh City (HCMC), Vietnam. The Can Gio district stretches for 20 km along the coastline, where inland water discharges into the East Sea through different rivers. Can Gio is located in a funnel-shaped area and is indented to the mainland, compared with the Go Cong Coast to the west and the Vung Tau Cape to the east. In Can Gio, 56.7% of its area is covered by saline soil. The coast is composed of fine sand mixed with clay, which yields gray-colored beach sand. The coast also contains a large amount of vegetation from Sac mangroves, which are transferred by rivers from the inland. The area receives Southeast to Southwest winds on windy days, with sea waves entering the shallow seabed and breaking waves with a strong destructive power disturbing the bottom, resulting in cloudy seawater [50]. Waves climb up the shoreline and continuously erode the coastal dunes. Along the Can Gio Coast, embankments and groins are constructed at a uniform 100 m distance to prevent eroding, which results in significant accretion along with construction. The study area is highly exposed to storms, rising sea levels, high tide, drought, erratic weather, and irregular semi-diurnal tides [51]. The present study was conducted along a 13 km segment of the Can Gio Coast from Dong Tranh Cape to Can Gio Cape (Figure 1). Beach sand samples were collected from five areas along the coast: Dong Hoa Market (DHM), Phuong Nam Pearl Resort (PNPR), 30 April Beach (30AB), Agriculture Area (AA), and Can Gio Park (CGP). Each sampling area had different characteristics representing the various anthropogenic activities on the beach. DHM is a beach behind a local seafood market, PNPR area is near a popular resort in Can Gio, 30AB is a famous tourist beach, AA is a clam farming area, and the Can Gio Part is in CGP’s beach. Sand samples were collected in November 2019 in the intertidal zone during low tide. In each sampling area, sand samples were collected at three tidal lines (upper shoreline, water-edge line, and a middle line between these two lines). There were three sampling sites on each tidal line and samples were collected at two different depths (Figure 1).

2.2. Sampling Method

The selection of sampling sites impacts the abundance and types of polymers found [52], because contamination of beach sand by microplastics occurs through rivers, sea currents, and anthropogenic activities along the coast, as well as transport by water movement or by air emissions. Transects were commonly used when surveying microplastics in beach sand and quadrats were used in many previous studies [53]. The strandline is known for containing a higher abundance of marine debris. Therefore, many studies target this tidal line to survey microplastics [45,54,55]. However, this may lead to bias in the results, because the studies are aimed at finding microplastics, rather than designing a systematic measurement of microplastics distribution on the beach. Therefore, we conducted a microplastics study at three different tidal lines for each sampling area. The abundance and level of accumulation of microplastics were also affected by the thickness of the collected sand layer. Many studies only focus on the surface layer of the sand. However, understanding the vertical distribution of microplastics may reveal their fate and the potential pollution of the sampled areas. Some studies found a different distribution of microplastics with depth [40,56,57]. The distribution of microplastics decreased from the surface to the deeper layer; however, the proportion at each layer varied depending on the study. Therefore, in our study, collecting sand samples vertically was done to evaluate the accumulation of microplastics in the sand. We applied a standardized protocol for monitoring microplastics in sediments [58] with some modifications. The sampling area was defined by a 100 m transect in width (parallel to the shoreline) from the water-edge line to the upper shoreline (Figure 1). On each tidal line, sand samples were collected using a 0.25 m2 (0.5 m × 0.5 m) quadrat placed at the 0th, 50th, and 100th m points of the line (Figure 1). Materials pushed ashore by waves were mainly concentrated in the intertidal zone from the shoreline to the upper shoreline. Therefore, samples collected in this area may contain microplastics from the ocean [24,36]. The deposition and accumulation of microplastics in the cross-sectional area of the beach by depth were heterogeneous [58]. At each sampling site, two depths were selected for sample collection: the surface layer (the top 2 cm) and a 5–7 cm layer. The layer of sand was homogeneously mixed and approximately 3 kg of sand was transferred into a labeled zip-lock bag. By sampling the sand samples vertically and horizontally, the study evaluated the spatial distribution of microplastics. In summary, from each sampling area, 18 samples were collected. In total, 90 sand samples from five beaches were collected. All samples were stored in zip-lock bags and shipped to the laboratory for further analysis.

2.3. Microplastic Analysis

The analysis method was based on previous studies of microplastics from beach sand [26,36,43]. The extraction of microplastics from the beach sand included sieving, flotation, oxidation, and filtration steps. Microplastics were identified by FTIR-ATR.
After sampling and sieving (0.5 mm and 5 mm mesh size), subsamples of beach sand were transferred into a beaker for density separation. In the previous studies, depending on the research area, 50–500 g of sand was selected as a subsample [24,27,59]. In this study, we conducted trial experiments to determine a suitable mass for subsample analysis. We started with 20 g of subsample and then increased the mass until microplastics were detected in approximately 200 g of the sample. The microplastic extraction was based on a density separation method using salt solutions with a higher density than that of polymers [6,10]. To extract microplastics from beach sand, sodium chloride (d = 1.2 g/mL) is commonly used, because many polymers float in this solution. However, to ensure the most common polymer types were extracted, a solution of 1.5 g/mL NaCl and ZnCl2 was used. The sand was well mixed and approximately 200 g of the subsample was transferred randomly into a petri dish. The subsample was weighed to obtain the exacted mass and dried in an oven at 60 °C for 24 h or to a constant mass and re-weighed. A sieving system (5 mm, 2.8 mm, and 0.5 mm sieves) was used for sifting the dried sand. Plastic pieces larger than 5 mm (macroplastics) were also weighed and analyzed. The microplastic extraction was based on a density separation method using salt solutions with a higher density than that of polymers [6,10,60]. A salt solution (mixture of NaCl and ZnCl2; d = 1.5 g/mL) was used for separating the plastic pieces from beach sand by flotation. Next, 500 mL of flotation solution was poured into the subsample in a beaker. The mixture was then stirred with a glass rod for 2 min and allowed to settle for 24 h. The supernatant was collected, and the above process was repeated until no more floating pieces were observed. The supernatant was treated with hydroperoxide H2O2 and Fe (II) solution to eliminate organic matter adhered to the suspected microplastic particles [6]. The reaction finished when the liquid became clear. The solids in the beaker were obtained and rinsed with distilled water to remove the excess reactants. A second density separation was done to obtain microplastics from the oxidizing solution. Then, 100 mL of the flotation solution was added to the beaker containing the solids from the above step. The mixture was transferred to a glass funnel connected to a rubber hose, which was locked at the end of the tube. The samples were left to settle overnight, and the glass funnel was covered with foil. The settled solids from the separator were drained and discarded, whereas the floating solids were collected and filtered through Whatman 0.45 µm filter paper. They were then rinsed with distilled water and dried for 24 h at 60 °C [61].
The physical characteristics of the microplastics were assessed using an “Embedded Systems connecting with Microscopes” (NHV–CAM) for number, shape, size, and color. The number of microplastics was counted in three replicates. They were dimensioned and classified into three size groups: 0.5–1.0 mm, 1.0–2.8 mm, and 2.8–5.0 mm. Based on the morphological features, they were grouped as fragments (irregular-shaped fragmented from larger plastic pieces), fibers (fibrous plastic from clothes washing, fishing net, …), and granules (small particles). In this step, the suspected microplastics were discarded if some candidates had cellular and organic structures or they were not homogeneous in color.
After measuring and recording the physical characteristics of all microplastics, we selected representative candidates from each sand sample for polymer analysis. The representatives were chosen if they had the same color, shape, and surface properties as the others in one sample. Approximately 74% of the microplastic candidates were analyzed for polymer composition by infrared spectroscopy (FTIR–4700 type A infrared spectrometer with Accessory Attenuated Total Reflection PRO ONE). The macroplastics found in each sample were also assessed for the polymer type by FTIR.

2.4. Quality Assurance and Quality Control

The containers used for the analytical process were made of glass to avoid microplastic contamination. They were washed with distilled water and dried before use. To determine the extraction efficiency of the microplastic analytical process, plastic pieces of different types and sizes were prepared for the extraction efficiency test. Polyethylene terephthalate (PET) d = 1.38 g/mL, polyethylene (PE) d = 0.91–0.94 g/mL, and expanded polystyrene (EPS) d = 0.001–0.003 g/mL are plastics with different density ranges. These plastic samples were derived from disposable daily plastic items such as mineral water bottles (PET), garbage bags (PE), and styrofoam containers (EPS). For each type, plastic pieces were prepared in two sizes: smaller than 1 mm and 1–5 mm. For each size and type of plastic, five pieces were selected. A total of 30 microplastics were evaluated in the test. The microplastic samples were added to sand and separated for the analytical process. The separation efficiency ranged from 83.3% to 90%, with an average of 88% after three repetitions.

3. Results

3.1. Abundance of Microplastics

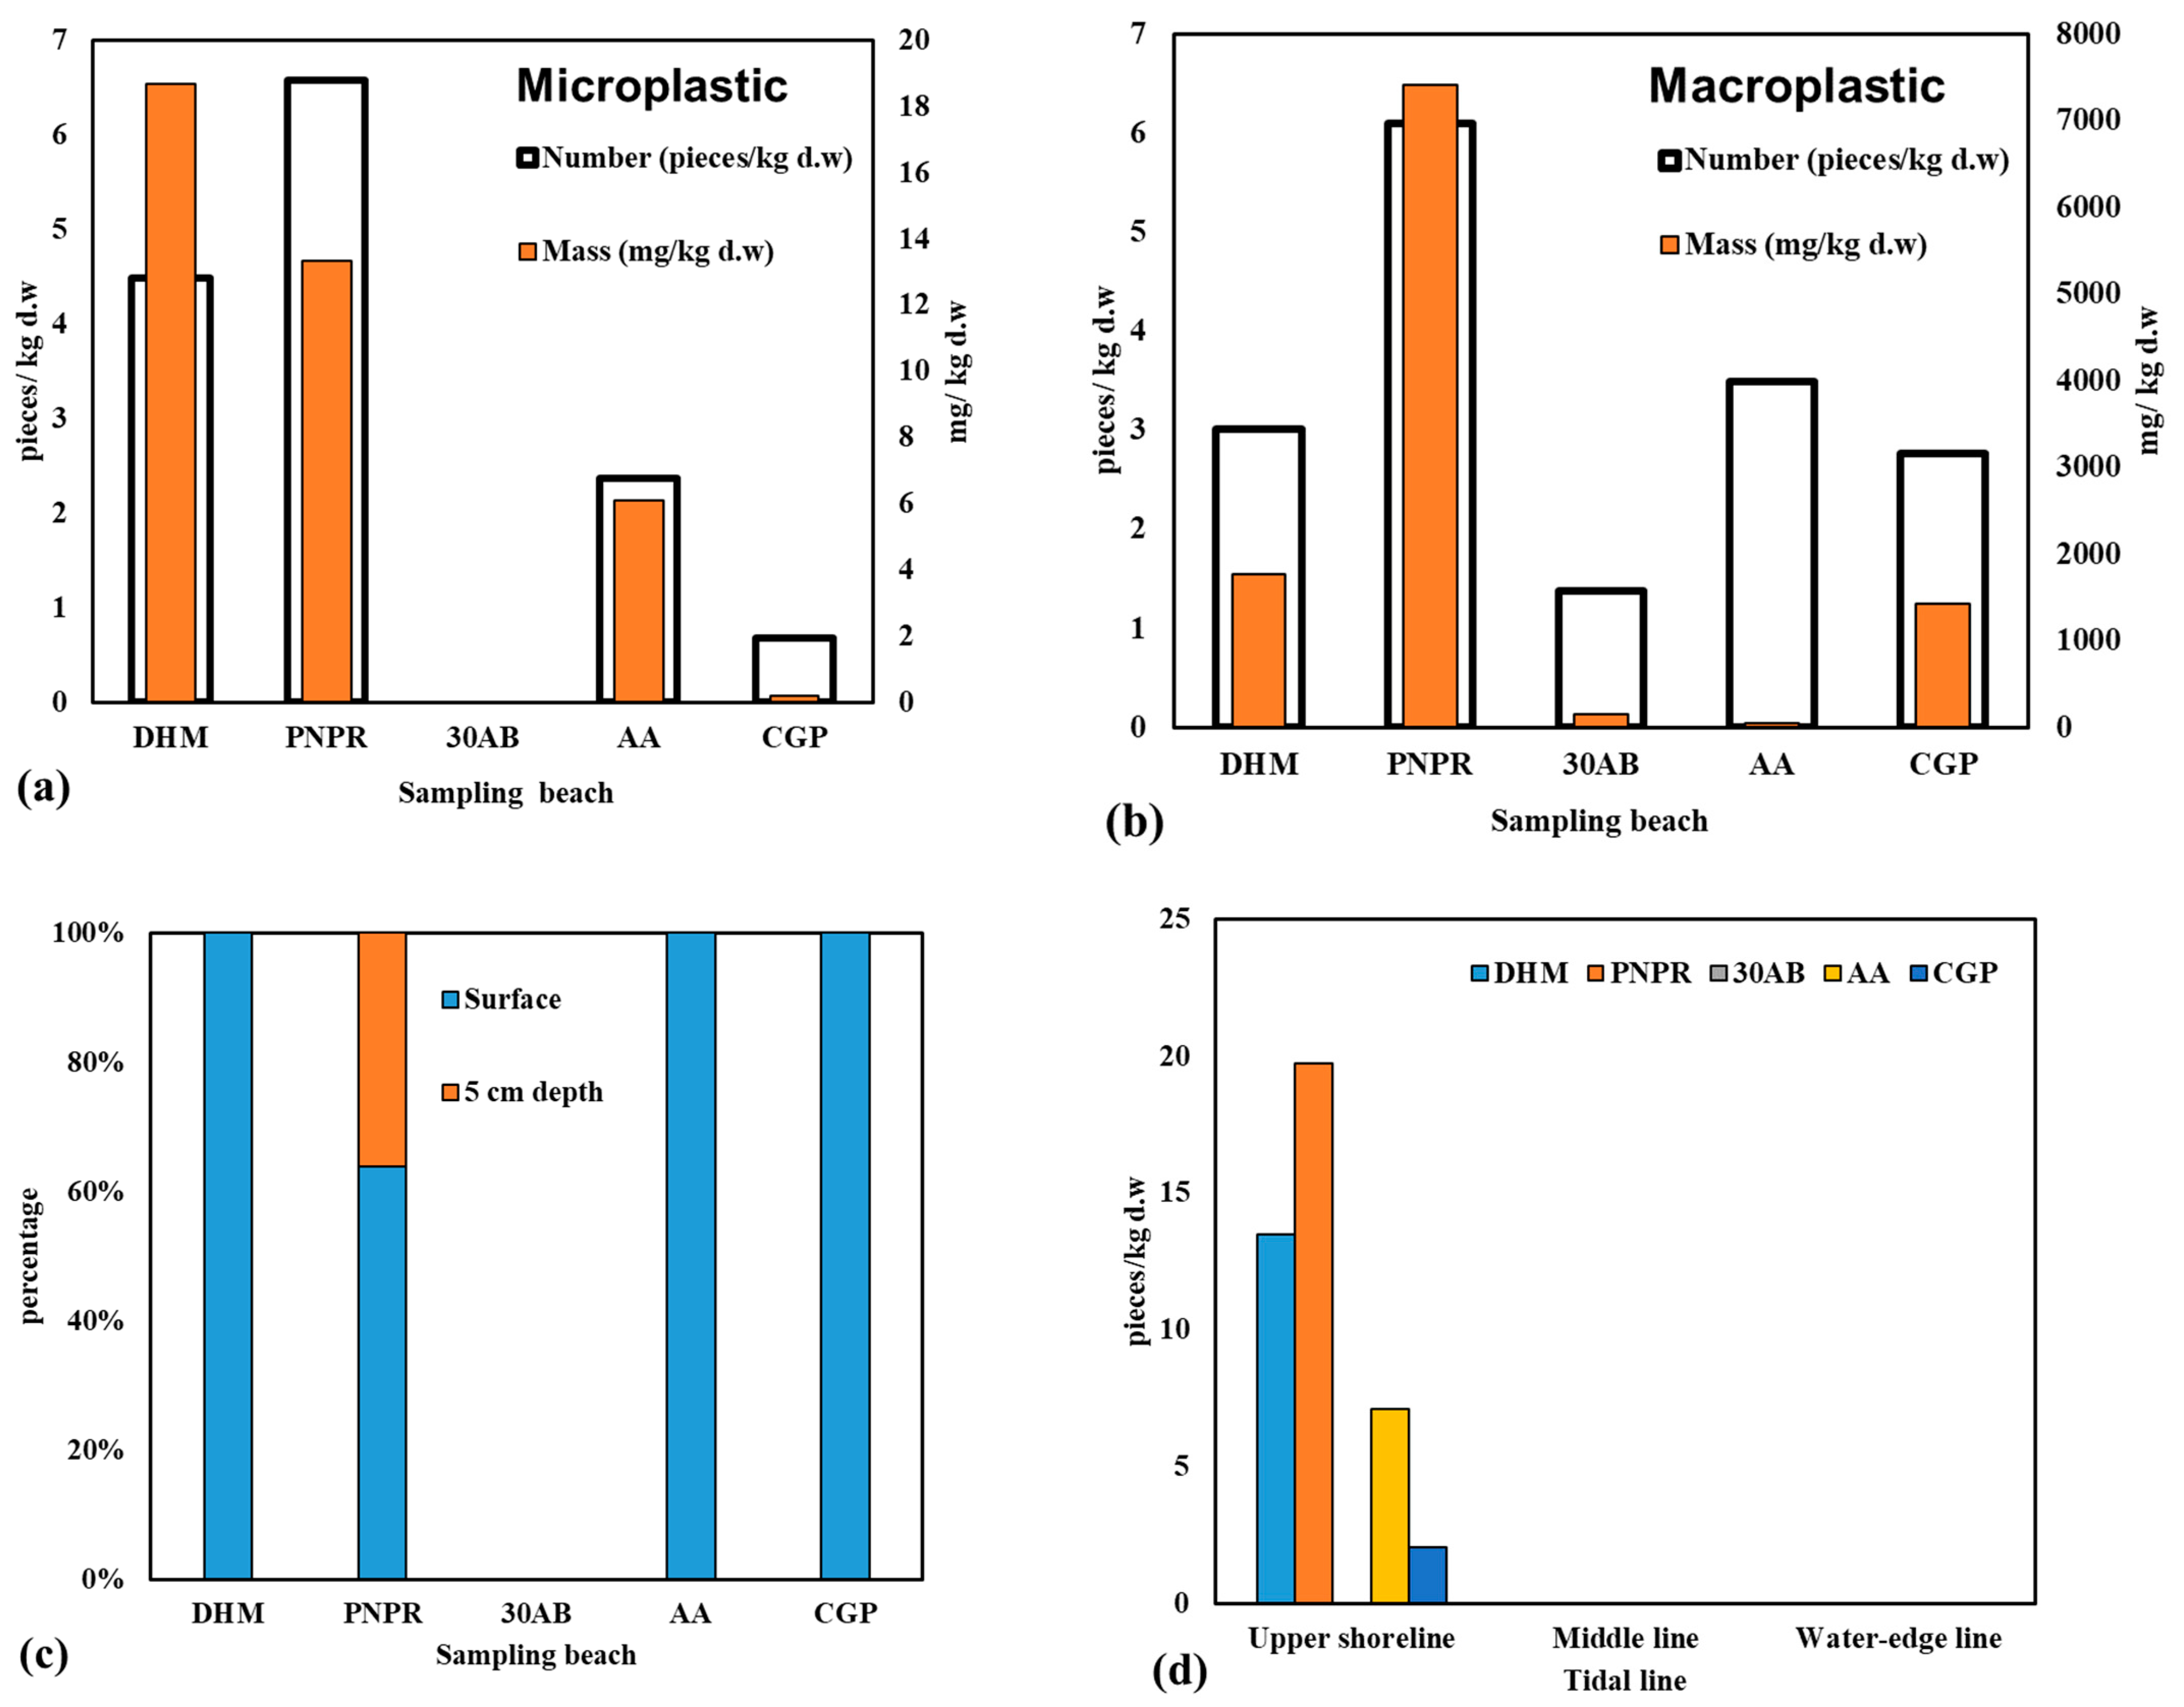
Microplastics were detected at four of five sampling areas (except 30AB). The abundance of microplastics ranged from 0 pieces/kg d.w. to 6.58 pieces/kg d.w. (0–26.32 pieces/m2). The average mass of the microplastics from the sampling areas ranged from 0 to 18.66 mg/kg d.w. Table 1 and Figure 2a show the distribution of the microplastics in different areas. PNPR had the highest average abundance of microplastics with 6.58 pieces/kg d.w., followed by DHM with 4.49 pieces/kg d.w., whereas no microplastics were collected from 30AB. With respect to mass, DHM was the most contaminated with 18.66 mg/kg d.w. of microplastics found, followed by PNPR with 13.33 mg/ kg d.w. Microplastics in this study were only found in the upper shoreline (Figure 2d). Microplastics were mostly found at the surface layer, which accounted for 81.8% of the total microplastics (Figure 2c). The abundance of microplastics in the surface layer and the upper shoreline is presented in Table 2.
The abundance of macroplastics is presented in Table 1 and Figure 2b. In general, macroplastics were detected at all sampling beaches. In total, 81.3% of them were found in the upper shoreline, and 85.4% of macroplastics were detected in the surface layer of sand. PNPR was the beach showing the highest abundance of macroplastics with 6.10 pieces/kg d.w. (7403.80 mg/kg d.w.). At the beaches with higher anthropogenic activities (DHM, PNPR, and CGP), the mass of the macroplastics was significantly high (more than 1000 mg/ kg d.w.).

3.2. Physical Characteristics of Microplastics

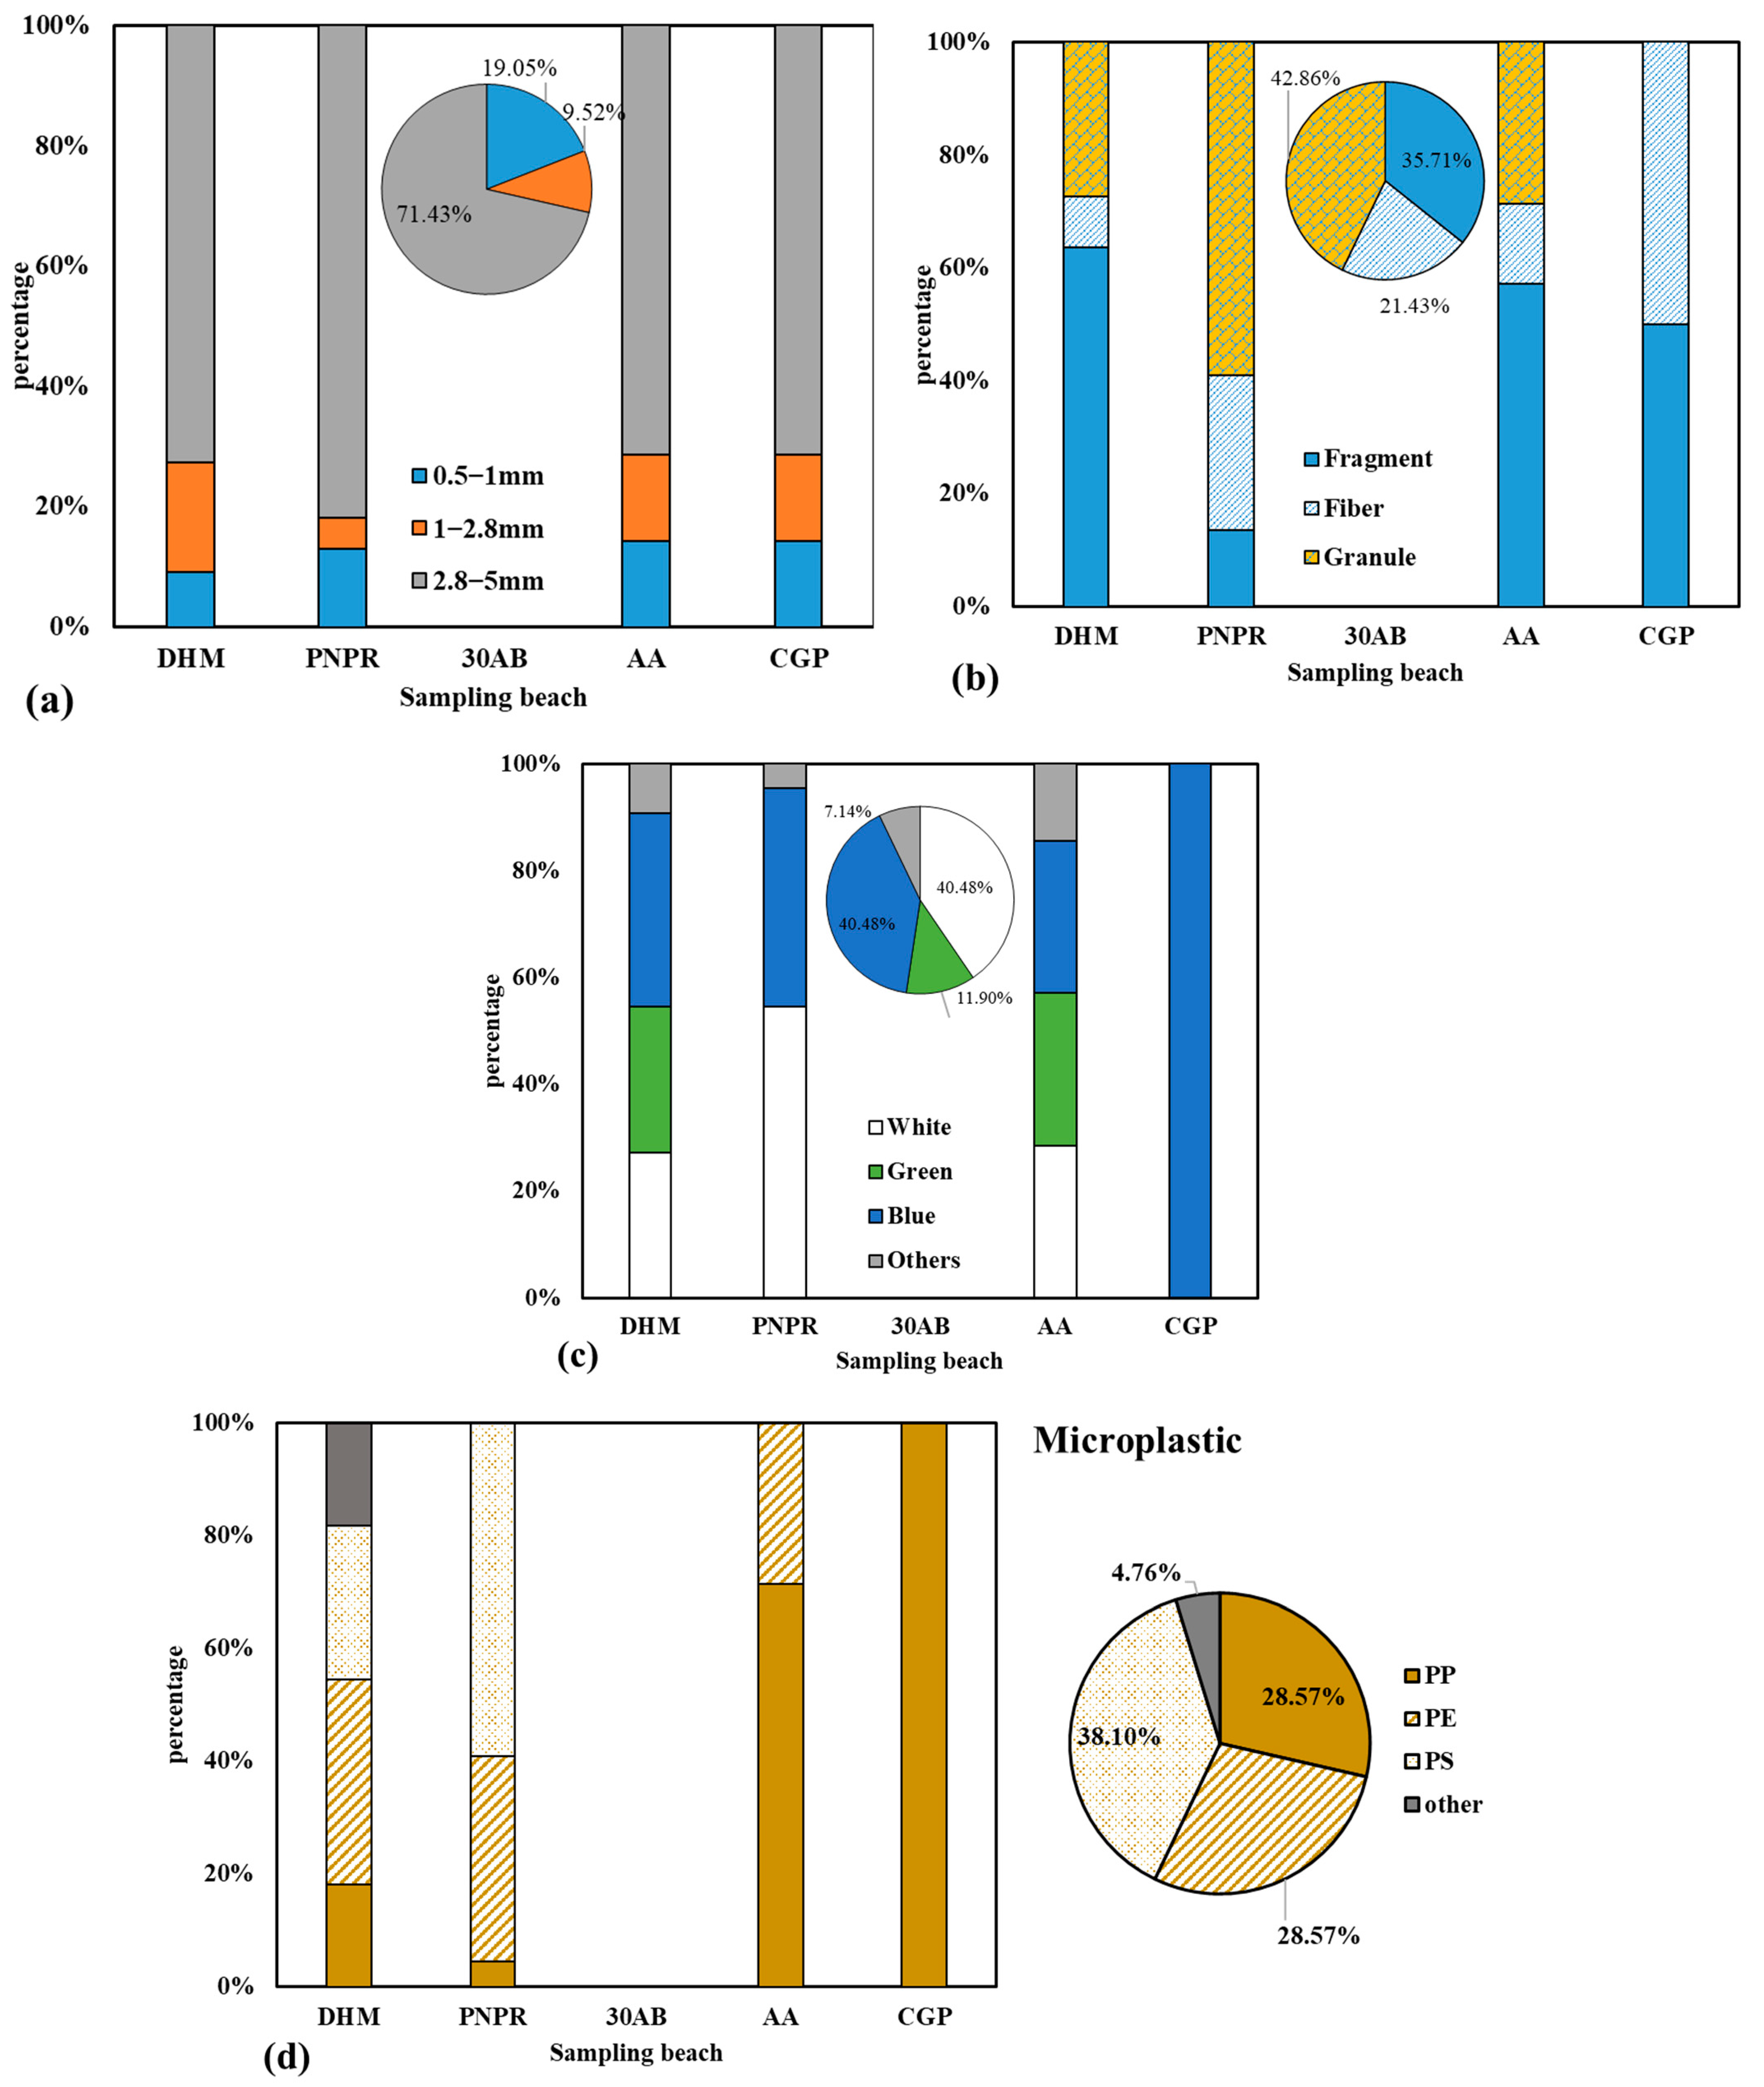
The size of microplastics was classified into three ranges: from 0.5 mm to 1 mm; 1 mm to 2.8 mm; and 2.8 mm to 5 mm. Figure 3a shows that microplastics with a size from 2.8 mm to 5 mm accounted for the highest proportion at all sampling areas (71.4%). Microplastics with a size of 1–2.8 mm represented the smallest percentage (9.5%). Microplastics smaller than 1 mm (19.0%) were often found fragmented from larger pieces, such as filaments or fragmented pieces.
Three shapes of microplastics were identified: fragment (35.7%), fiber (21.4%), and granule (42.9%) (Figure 3b). Among the four areas in which microplastics were detected, DHM and AA showed the highest abundance of microplastics with respect to the fragment shape (63.6% of the total DHM and 57.1% of the total AA). In PNPR, granules were predominant at 59.1%. On average, for all of the sampling areas, granules accounted for the highest proportion at 42.9%.
White and blue microplastic pieces were equally the predominant colors (40.5%), followed by green (11.9%), whereas the remaining colors were orange, gray, and red at 7.1% (Figure 3c). Blue-colored pieces were detected in sand samples at all beaches (CGP only contained blue microplastics), green-colored pieces were found at DHM and AA, and white pieces were observed at DHM, PNPR, and AA.

3.3. Composition of Microplastics

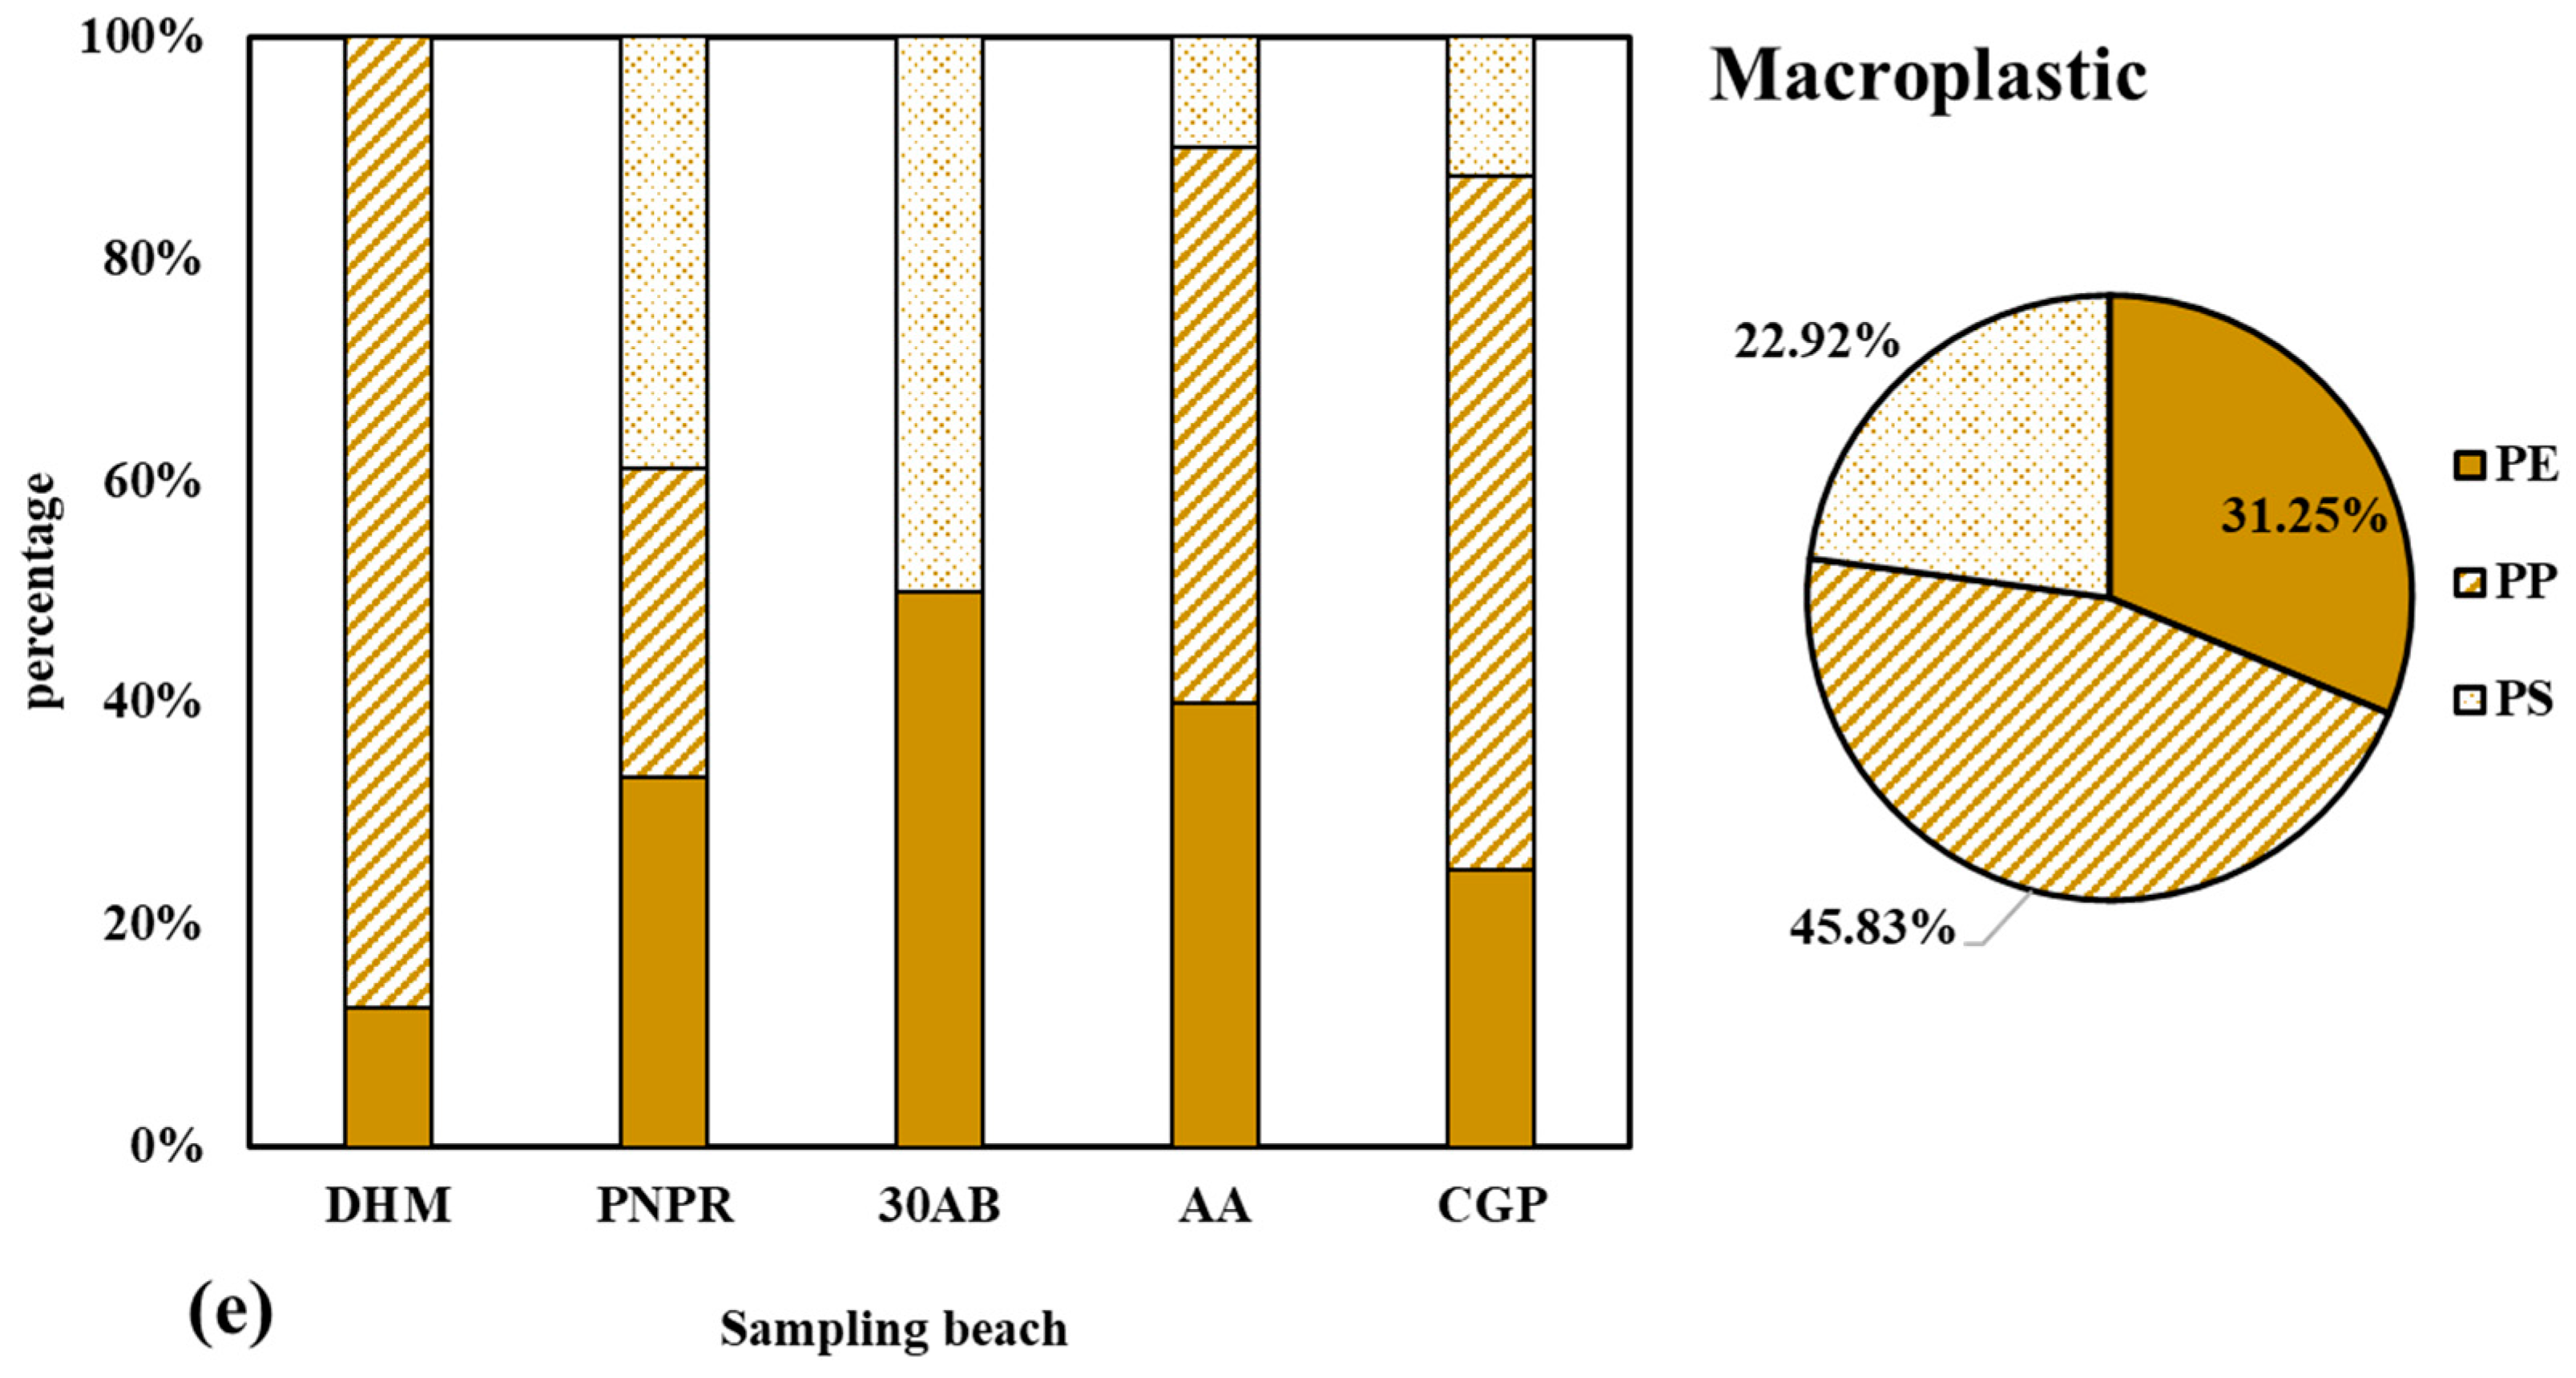
The composition of microplastics was determined by polymer types using FTIR-ATR. Polypropylene (PP), polyethylene (PE), and polystyrene (PS) were abundant. PS accounted for the majority of the microplastics (38.1%) and was detected at DHM and PNPR, followed by PE and PP at the same relative abundance (28.6%) (Figure 3d). DHM contained the most polymer types, whereas only PP was observed at CGP. Macroplastics were also analyzed for polymer type. PP, PE, and PS also represented the three polymers found (Figure 3e). PP (45.8%) accounted for the highest proportion, particularly at the DHM, AA, and CGP beaches. PE (31.3%) was detected at all sampling sites with the highest percentage at 30AB. PS (22.9%) was found at four of the beaches, except DHM.

4. Discussion

4.1. Abundance of Microplastics in Beach Sand

Microplastics were found in beach sand at four sampling areas as described in Section 3.1. The occurrence of microplastics in beach sand may be explained by the geography of Can Gio compared with other areas. In addition, Can Gio is a suburban agricultural area of HCMC. Therefore, plastic waste and microplastics can be transported by rivers from inland regions and accumulate on the beach.

4.1.1. Comparison with Other Beaches

In this study, sand samples were collected along three tidal lines at two different depths. The abundance of microplastics ranged from 0 to 6.58 pieces/kg d.w. and these results were compared with those of other published studies (Table 3).
Some studies selected sampling sites along three 100 m stretches of the tidal lines (upper shoreline, middle line, and water-edge line) and used 0.5 × 0.5 m2 quadrats and one layer of sand (upper 2.5–5 cm) [36,62]. Therefore, the abundance of microplastics in our study, which was consistent with this sampling method, was 0–9.55 pieces/kg d.w. (0–38.2 pieces/m2). The abundance was much lower than that of studies in South Korea (1400–62,800 pieces/m2 small microplastics; 0–2088 pieces/m2 large microplastics) and China (106.50 ± 34.41 items/kg) [36,62]. Other studies sampled the strandline (or high tide line) and also collected only one layer of sand (upper 1–6 cm of sand) [27,59,63,64]. The abundance in the our study was 0–26.94 pieces/kg d.w. (0–107.76 pieces/m2) following the above sampling method. Compared with the results in the Netherlands (261 ± 6 pieces/kg d.w.) [63], the abundance in Can Gio, Vietnam was lower and was similar to the abundance of microplastics observed in the USA (5–117 pieces/m2) [64] and higher than that of the Maldives (22.8 ± 10.5 pieces/m2) [59] and Slovenia (0.5 ± 0.5 pieces/kg d.w. to 1.0 ± 0.8 pieces/kg d.w.) [27]. Several studies collected sand at two depths (0–5 cm and 5–10 cm), but with different collection sites on the beach (Table 3) [48,65]. The abundance of microplastics in these studies (0.23–30.4 pieces/ kg d.w., Northern Taiwan; 9238 ± 2097 items/kg d.w. synthetic fibers, Danang, Vietnam) was higher than that of this study (0 to 6.58 pieces/kg d.w.). The results indicate that microplastics in Can Gio are less abundant than those in the Mangrove Ecosystems of Singapore [38], the Ciénaga Grande de Santa Marta mangroves in the Caribbean of Colombia [37], and China’s Southeast mangroves [67]. The lower abundance of MPs in Can Gio compared with other areas may be explained by the following reasons. First, Can Gio is a suburban agricultural area of HCMC. Despite its large area, it has a low population density and is primarily used for growing rice, fruit trees, salt making, and aquaculture. Tourism activities, such as swimming, do not occur much, so this may be an explanation for the low abundance of microplastics (0.5–5 mm) in Can Gio compared with other studies. Second, beach sand in Can Gio is small and fine because the beach is accreted by alluvium from the Sac mangrove. Furthermore, erosion frequently occurs so the accumulation of microplastics may be low.

4.1.2. Distribution of MPs at Different Sampling Areas and Sand Depths

In this study, DHM is at the intersection between the Dong Tranh River and the Can Gio Sea, located near the Dong Hoa market and receiving water flow from inland regions. These are probably the sources of plastic and microplastic emissions, resulting in a high concentration of microplastics (4.49 pieces/kg d.w. or 18.66 mg/kg d.w.). PNPR (6.58 pieces/kg d.w. or 13.33 mg/kg d.w.) is one of Can Gio’s most famous tourist resorts and the plastic wastes found at the sampling sites were primarily styrofoam boxes, plastic instant noodle cups, spoons, forks, and plastic straws. 30AB is the most famous beach in Can Gio, which is in the middle of the Can Gio coastline. Compared with other sites in which stone embankments were built at a 100 m distance along the coast to prevent erosion, 30AB has no such construction. As a result, waves usually climb up the coast and erode the coastal dunes. In recent years, volunteer beach cleaning campaigns are regularly held in this area, so this may contribute to a lower abundance of microplastics. AA (2.37 pieces/kg d.w. or 6.09 mg/kg d.w.) is located near Ghenh Rai Bay and the microplastics found there were primarily in the form of fibers, such as fishing gear. The sources of plastic and microplastic emissions may be from coastal aquaculture and sea waves. CGP is an area receiving waste flowing out of the Ghenh Rai Bay and from swimming activity. The plastic waste found has similarities with PNPR, such as sausage packaging and instant noodle containers. This beach hosts cleaning activities, which results in a lower concentration of microplastics (0.68 pieces/kg d.w.). In conclusion, the source of microplastics at the sampling sites in Can Gio may be from livelihood activities, aquaculture, coastal tourism, and waste percolating from the Dong Tranh River and Ghenh Rai Bay, as well as waves washing ashore.
If the abundance of microplastics was only assessed at the upper shoreline, the highest abundance of microplastics would be 19.74 pieces/kg d.w. at PNPR. The method of determining the sampling location was different for each study. Samples can be collected along the upper shoreline where a lot of plastic wastes accumulate [68,69], in the middle of the intertidal zone [65], or along the water-edge line and the upper shoreline [36]. The number of sand samples collected in each study was different but ranged from 1 to 12 sand samples per site [36,68,69]. The number of sand samples and sampling sites can affect the reliability of the study [70]. According to Besley, among 22 studies of beach sand, the sampling process was optimal when the number of sand samples collected per 100 m of each tidal line was from three to five sites, depending on the desired reliability. In the present study, Figure 2c shows that most of the detected microplastics distributed at the surface layer of sand (0–2 cm) accounted for 83.3% of the total microplastics found. Only one sample of PNPR showed the presence of microplastics at a 5 cm depth. There is no consensus on sand sampling depth in the literature. Some studies collected one surface sand layer with a 2–5 cm thickness to identify microplastics [36,68,71]. Other studies examined the distribution of microplastics by depth [69,70]. The results indicated that the distribution of microplastics in beach sand at different depths is heterogeneous, but microplastics tend to accumulate closer to the surface. The results of this study on the distribution of microplastics at two depths in beach sand from Can Gio are similar to those of other published studies.

4.2. Physical Characteristics of Microplastics

Compared with other studies, the shape distribution of microplastics in the present study was similar to that published in Singapore [38] and the Maldives [59]. The fragments accounted for a significant proportion, whereas fibrous microplastics accounted for the smallest percentage (21.4%) (Figure 3b). The shape of microplastics may relate to their emission sources (primary or secondary microplastics). For example, according to Zhou et al. [67], a high percentage of the fiber will be found at the sampling sites, receiving effluent discharge containing a lot of microfibers. More than 93% of the microplastics in beach sand and sea sediments of mangroves are fragmented, which indicates that the origins of these microplastics are fragments of larger plastics. Besides, the impacts of other pollutants and environmental processes also affect the appearance of microplastics. They may be found in coastal areas and can have a basic shape or deformation resulting from erosion, solar radiation, or biodegradation [67]. The basic shapes are discharged directly as primary microplastics, such as pellets, granules, and spheres. Others are caused primarily by the decomposition of plastic items (secondary source) consisting of fibers and unspecified shapes. During cracking, the surface morphologies of plastic can change significantly, because of erosion or adherence of organisms [17]. Differences in surface morphologies relate to the longevity in the environment, the physical and chemical properties of the plastic, and other environmental factors. Therefore, to obtain more insights into the origin of microplastics, the chemical composition of macroplastics was also determined in the same samples including foam boxes, disintegrated polystyrene, or small pieces of plastic broken down from ropes.
The predominant colors of microplastics identified in the present study were white, blue, and green. White and blue were the two predominant colors (Figure 3c) with a percentage of 40.5%. Blue microplastics were detected at all sampling sites. CGP only contained blue microplastics, which may be fragments of the plastic ropes used to tie sandbags to prevent corrosion along the coastline in this area. White granular microplastics found in DHM had intact and smooth surfaces that looked like resin pellets (possibly primary microplastics). However, the white microplastics found in PNPR were fragments and shards from styrofoam (Figure 4). Microplastics with similar colors were detected in other studies, such as in the Taiwan study [39], in which 60% of the microplastics were white and translucent. White is also a common color for styrofoam fragments found in mangroves in China [67], whereas green (23.1%) and blue (19.2%) were two common colors associated with fibrous microplastics. Blue fibrous microplastics accounted for 34.7% of the total. Other studies also showed a diversity of microplastics. For example, in the mangroves of Iran, black, blue, and white were the most common colors, with black representing the highest percentage at 41% [66].

4.3. Composition of Microplastics

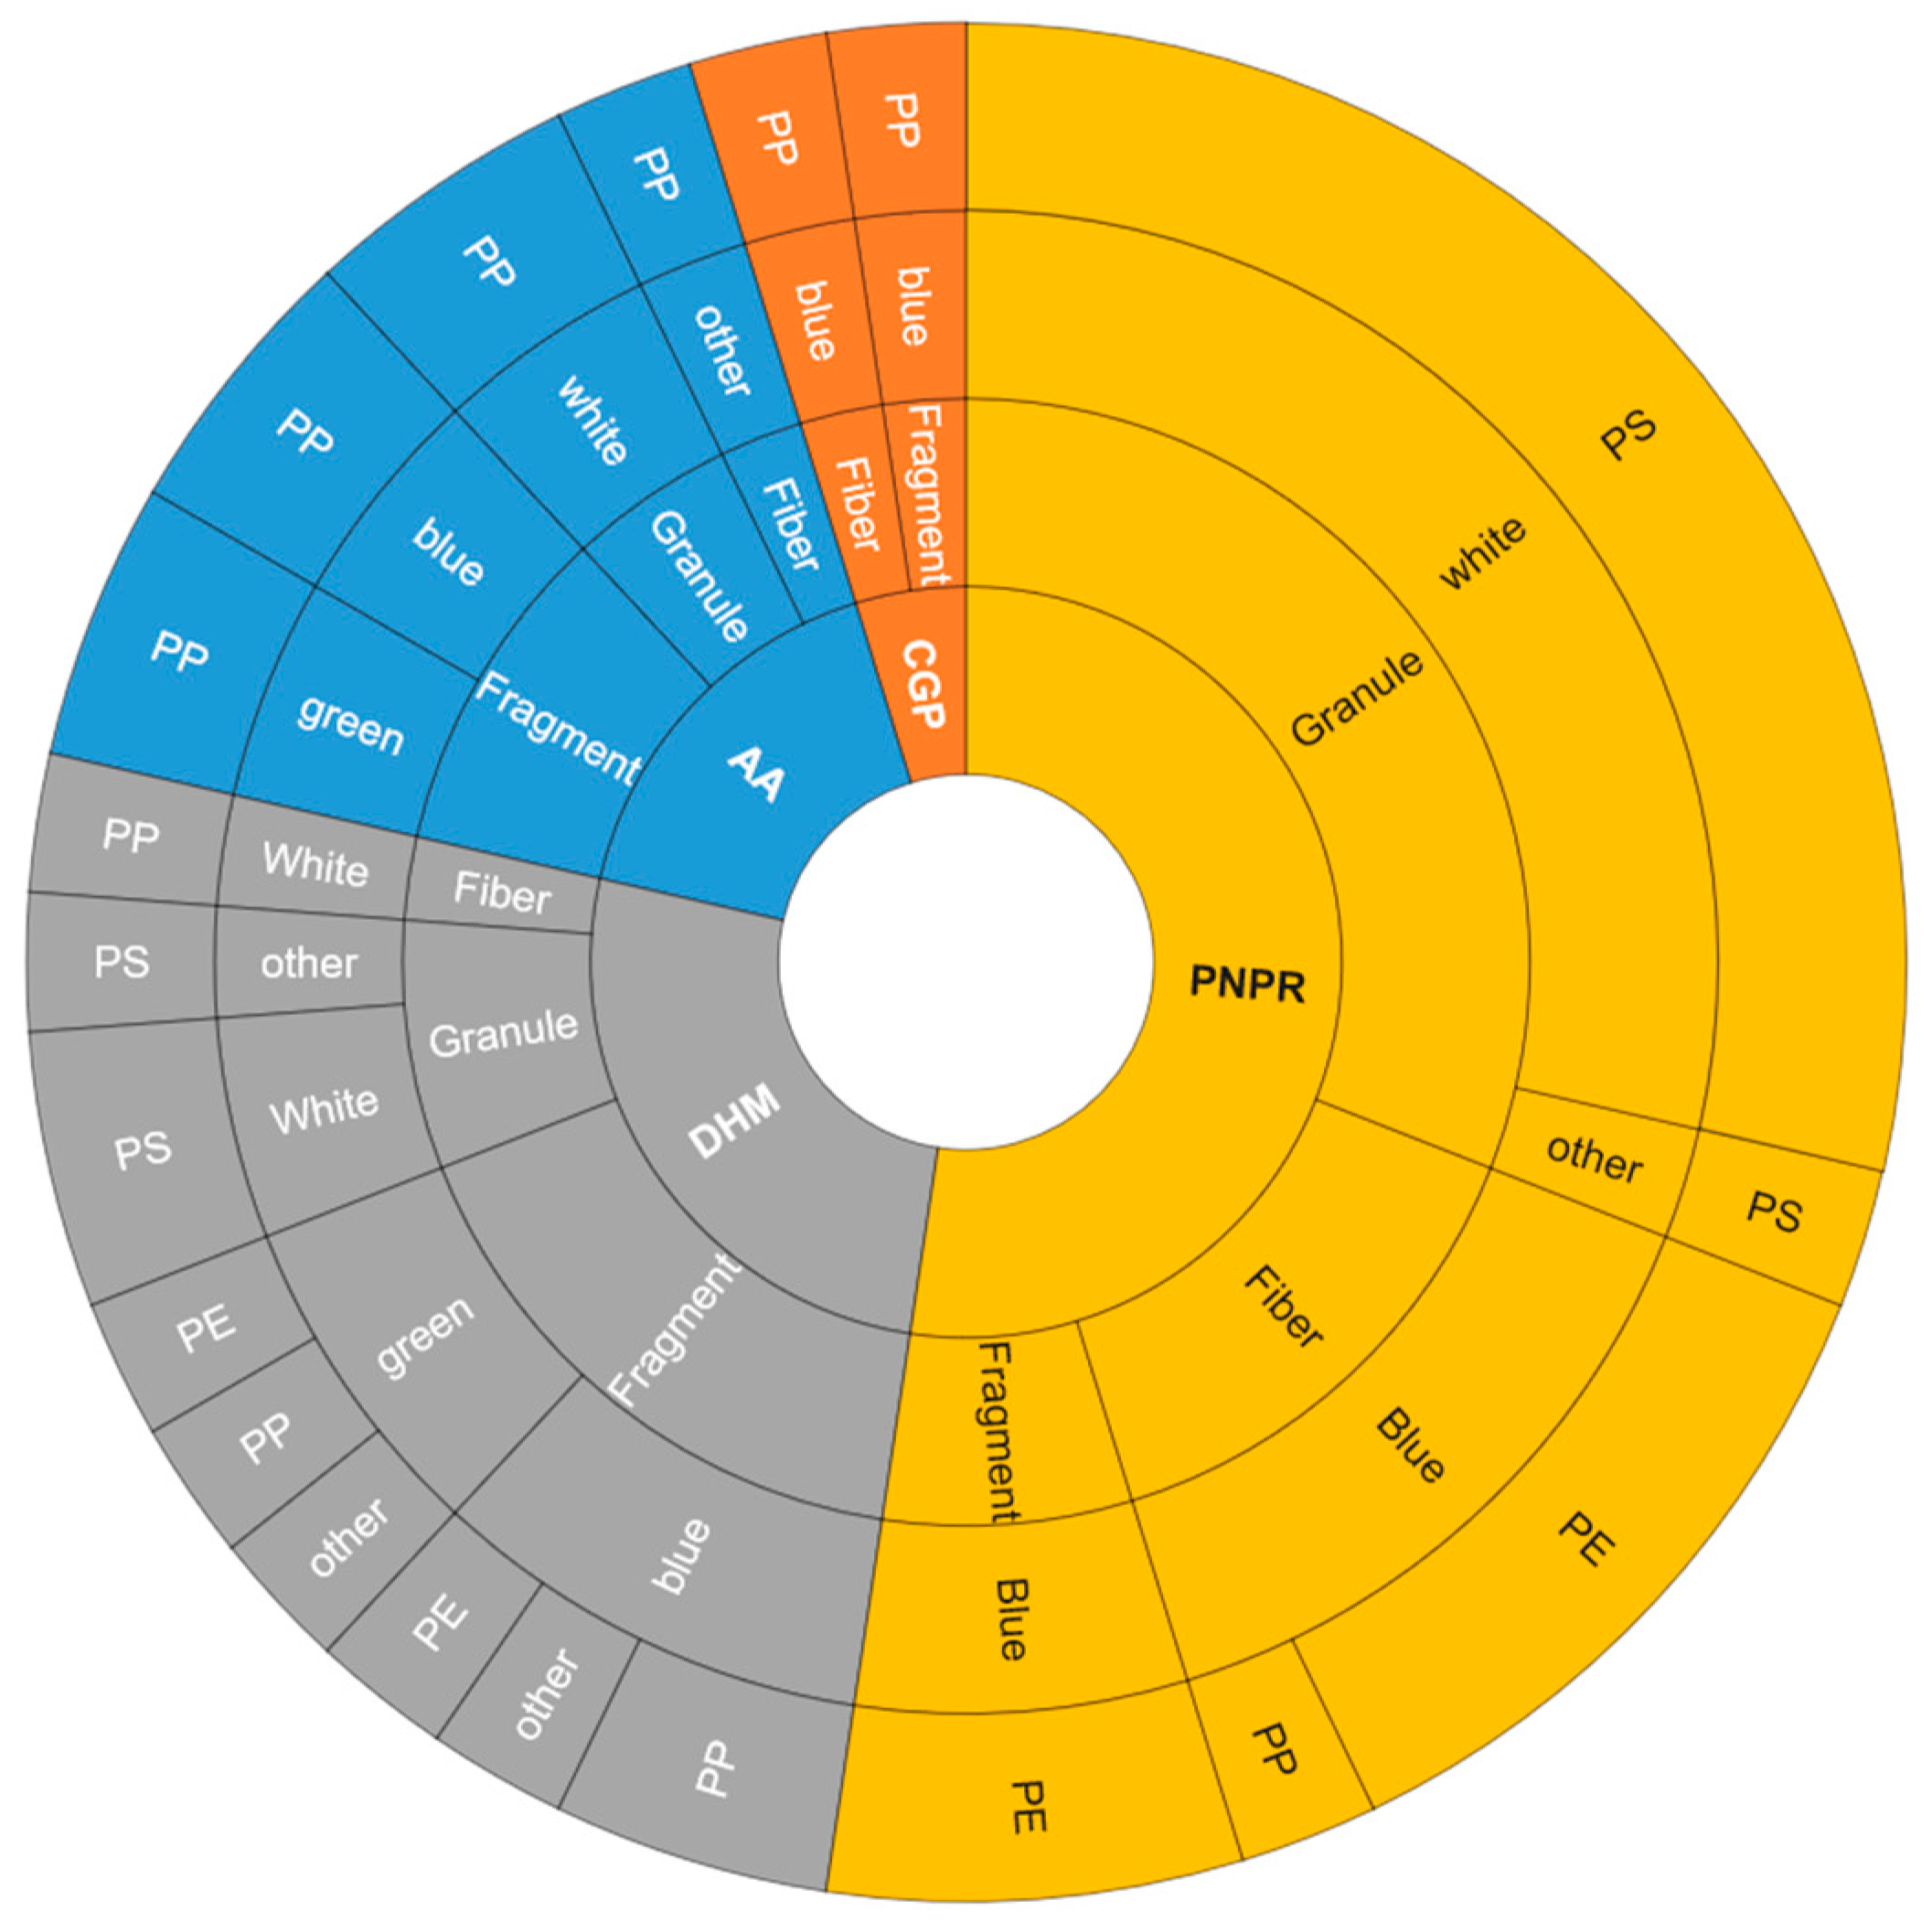
In general, PS was detected near tourist attraction areas without regular cleaning activity (PNPR) (Figure 3d). PNPR contained predominantly PS at 59.1% (most of the microplastic pieces obtained were fragmented styrofoam packaging). PP and PE were common in the aquaculture location (AA) or near the market (DHM), possibly originating from plastic ropes or food packaging. There were differences in microplastics distribution among the beaches; however, the results indicated that the shape, color, and chemical composition may be related. Figure 5 shows the distribution of the shape, color, and chemical composition of microplastics, as well as the relationship between these characteristics. The majority of PS microplastics were white and had a granular shape. Moreover, PE and PP microplastics were observed in green or blue and had a fragmented or fiber shape. From these characteristics, the possible origins could be predicted as discussed below.

4.4. Prediction of Microplastic Origins

Besides determining the presence of microplastics in sand samples, identifying macroplastic pieces (>5 mm) was also performed. Macroplastics (>5 mm) found in all sampling sites had an average abundance ranging from 1.37 pieces/kg d.w. (30AB) to 6.10 pieces/kg d.w. (PNPR) (Figure 2b and Table 1). The mass of macroplastic waste was quite high, up to 7403.80 mg/kg d.w. (PNPR area). The abundance of macroplastics and microplastics at the same sampling site was compared and the results indicated that macroplastics were mostly present in a 2 cm surface layer. In addition, the distribution of macroplastics at the three tidal lines was similar to that of microplastics, in which 73.7% of the macroplastics were found at the upper shoreline. Macroplastics were also identified by FTIR-ATR analysis and the results showed that PP accounted for the highest percentage at 45.8%, followed by 31.3% for PE, whereas PS accounted for 22.9%. PP, PE, and PS are the three popular plastic types used worldwide. Macroplastics in the sand samples were primarily plastic bags, confectionery packaging, spoons, and forks. These are common items found on the beach in which anthropogenic activities occur. They are primarily made from PP and PE, which explains their abundance. The PS pieces found were mostly styrofoam packaging, which may be the source of the corresponding microplastics in the same sand samples.
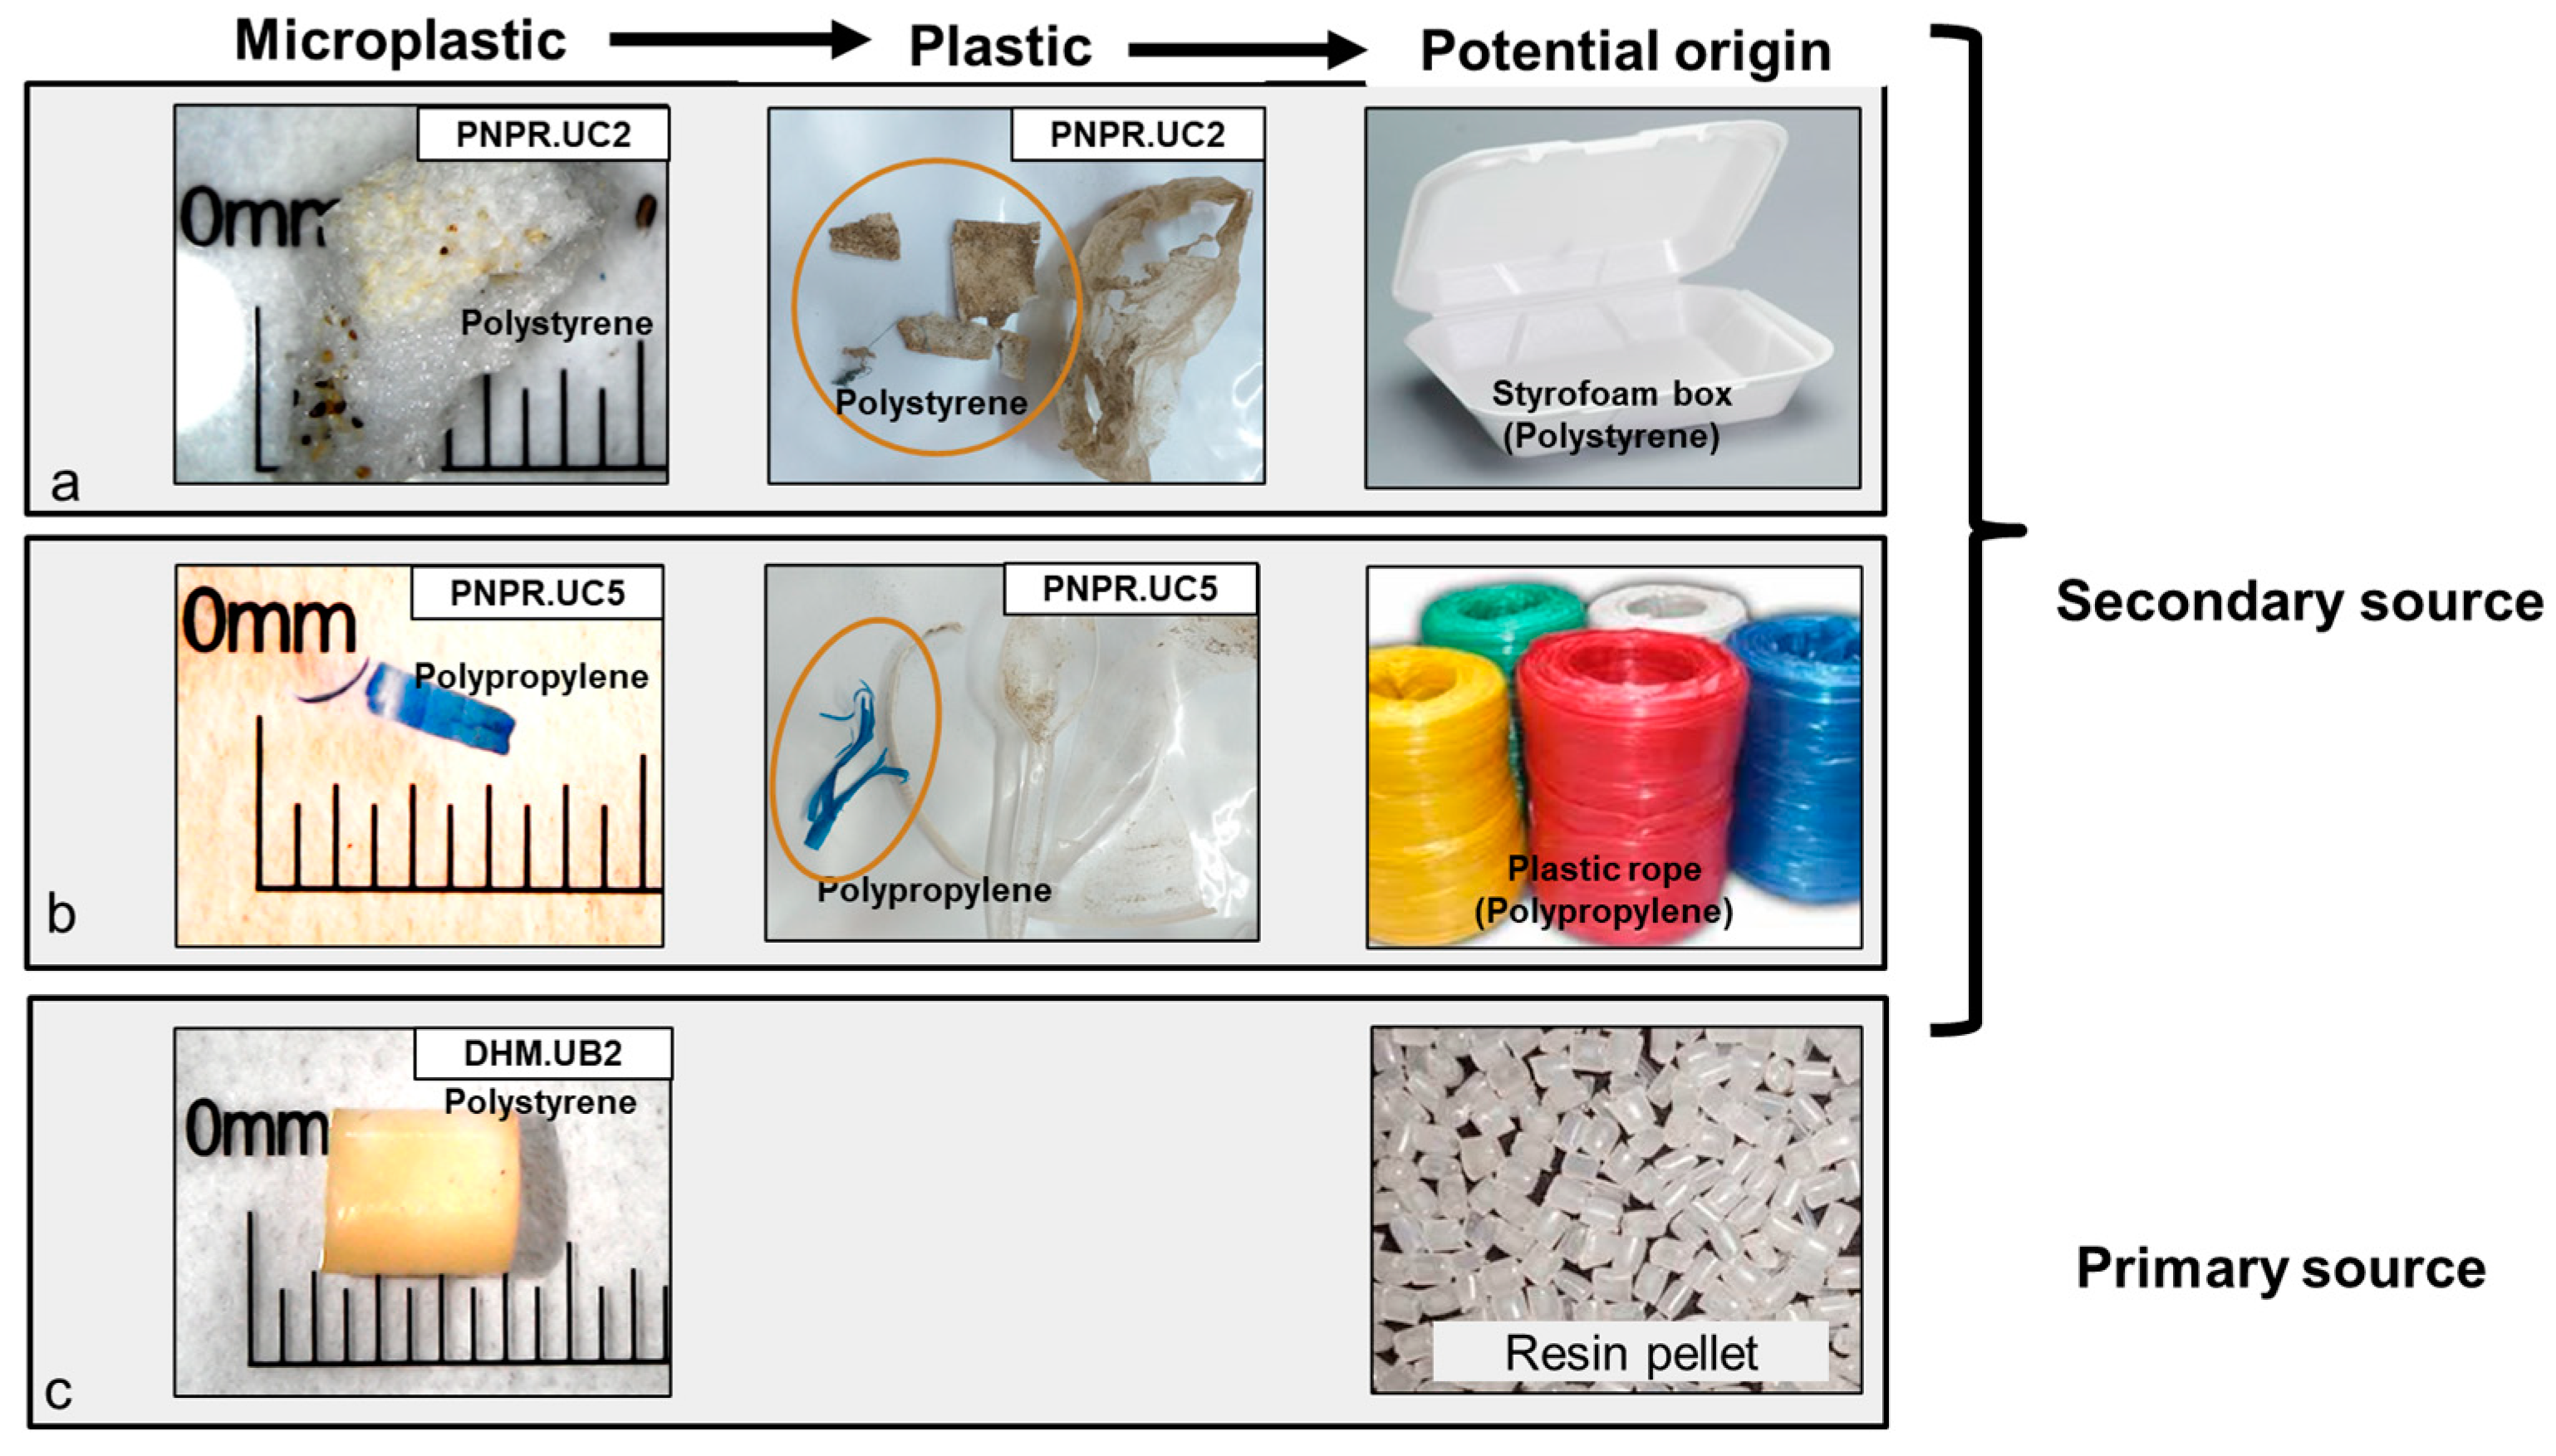
The preliminary origin of the microplastics and macroplastics was predicted based on the shape, color, and composition found in the same sand sample. In some samples, microplastics were found as fragments or fibrous shapes (Figure 4a,b). They had the same color, composition, and surface morphologies as some of the macroplastics. These microplastics are created secondarily from the environmental degradation of larger pieces. Therefore, microplastics are possibly degraded from macroplastics in the same sand sample with similar characteristics and composition. Meanwhile, in some sand samples of DHM, microplastics had a cylindrical shape with a smooth surface (Figure 4c). These pieces were of the original shape and identified as resin pellets (classified as granules in this study), which are the raw material for manufacturing plastic products. These microplastics were likely brought ashore by ocean waves after falling off ships during transportation.
DHM, PNPR, and AA had a higher abundance of microplastics and macroplastics. This may have occurred because DHM received water flow from the Dong Tranh River, which carried plant residues of the Sac mangrove, whereas PNPR was located next to the Ngoc Phuong Nam tourist area and the plastic wastes were primarily single-use products, such as foam packaging and plastic cups. AA is an aquaculture area that has agricultural tools. On the other hand, 30AB and CGP exhibited much lower concentrations of microplastics compared with the other areas. Common characteristics of these places were tourism and frequent visits from local residents. However, these places often have beach cleaning campaigns, which resulted in a smaller number of plastic waste. In addition, DHM, PNPR, and AA were constructed with stone embankments to prevent erosion, leading to more microplastic accumulation compared with other areas. The results showed some similarities to the research in the same region by Tien Giang and Vung Tau [43]. Microplastics in both studies shared some common characteristics in terms of distribution and chemical composition of the plastic. Tien Giang, Vung Tau, and Can Gio had similar characteristics of windiness, tidal regime, and water flow from the Dong Nai and Saigon rivers. Therefore, studies on the effect of marine dynamics on microplastics migration should be carried out to provide more insight into the fate of microplastics in the environment.

5. Conclusions

From the results of this study on five beaches along the Can Gio Coast, we conclude the following microplastics were detected in four of five sampling areas at different abundance levels. The distribution of microplastics on the coast of Can Gio may be explained by coastal morphologies, wind, waves, and coastal anthropogenic activities. Overall, 81.8% of the microplastics were concentrated mainly in the surface layer of sand. All of the microplastics found in this study were concentrated in the upper shoreline. Microplastics with sizes from 2.8 to 5 mm were found in most of the sampling areas. Granules accounted for the majority of the microplastics. White and blue were the two colors that made up a large proportion of the microplastics. The typical chemical compositions of the microplastics included PP, PE, and PS. PS accounted for the majority of the microplastics. The results indicated that granules predominantly contained a PS composition, whereas the other shapes predominantly contained PP or PE. Further investigations should focus on analyzing small microplastics to minimize the underestimation of microplastic abundance in beach sand. Studies on the effect of marine dynamics (by combining meteorological data, hydrological models) on microplastics migration should be also conducted to provide more insight into the fate of microplastics in the environment. Moreover, solutions should be implied to tackle the issue of microplastic pollution, such as new biological materials policies to reduce single-use plastic.

Author Contributions

Conceptualization, N.T.T.N. and T.T.H.; methodology, N.T.T.N. and T.T.H.; formal analysis, N.T.T.N.; investigation, N.T.T.N., N.T.N., and H.T.N.H.; data curation, N.T.T.N.; writing—original draft preparation, N.T.T.N.; writing—review and editing, N.T.T.N. and T.T.H.; visualization, N.T.T.N., N.T.N., and H.T.N.H.; supervision, T.T.H.; project administration, T.T.H.; funding acquisition, T.T.H. All authors have read and agreed to the published version of the manuscript.

Funding

This research is funded by Vietnam National University, Ho Chi Minh City (VNUHCM) under grant number B2020-18-04.

Institutional Review Board Statement

Not applicable.

Data Availability Statement

Not applicable.

Acknowledgments

This research is funded by Vietnam National University, Ho Chi Minh City (VNUHCM) under grant number B2020-18-04. We also thank the Air and water pollution—Human Health—Climate Change research group of Faculty of Environment, University of Science, VNUHCM for all support in this study. We gratefully thank Nguyen Huong Viet—Faculty of Electronics and Telecommunications; Faculty of Chemistry, University of Science, VNUHCM; Institute of Applied Materials Science; and Biotechnology Center of Ho Chi Minh City, Ho Chi Minh City, Vietnam for the supports in terms of machinery and equipment.

Conflicts of Interest

The authors declare no conflict of interest.

References

  1. Li, P.; Wang, X.; Su, M.; Zou, X.; Duan, L.; Zhang, H. Characteristics of Plastic Pollution in the Environment: A Review. Bull. Environ. Contam. Toxicol. 2020, 107, 577–584. [Google Scholar] [CrossRef] [PubMed]
  2. Hannah Ritchie and Max Roser, Plastic Pollution, Our World Data. 2018. Available online: https://ourworldindata.org/plastic-pollution (accessed on 28 May 2021).
  3. Geyer, R.; Jambeck, J.R.; Law, K.L. Production, use, and fate of all plastics ever made. Sci. Adv. 2017, 3, e1700782. [Google Scholar] [CrossRef]
  4. Lebreton, L.C.M.; Van Der Zwet, J.; Damsteeg, J.-W.; Slat, B.; Andrady, A.; Reisser, J. River plastic emissions to the world’s oceans. Nat. Commun. 2017, 8, 15611. [Google Scholar] [CrossRef] [PubMed]
  5. Lebreton, L.; Slat, B.; Ferrari, F.; Sainte-Rose, B.; Aitken, J.; Marthouse, R.; Hajbane, S.; Cunsolo, S.; Schwarz, A.; Levivier, A.; et al. Evidence that the Great Pacific Garbage Patch is rapidly accumulating plastic. Sci. Rep. 2018, 8, 4666. [Google Scholar] [CrossRef] [PubMed]
  6. Crawford, C.B.; Quinn, B. Microplastic Pollutants. Elsevier Gezondheidszorg: 2016. Available online: https://research-portal.uws.ac.uk/en/publications/microplastic-pollutants (accessed on 1 September 2022).
  7. Chenillat, F.; Huck, T.; Maes, C.; Grima, N.; Blanke, B. Fate of floating plastic debris released along the coasts in a global ocean model. Mar. Pollut. Bull. 2021, 165, 112116. [Google Scholar] [CrossRef]
  8. Everaert, G.; De Rijcke, M.; Lonneville, B.; Janssen, C.; Backhaus, T.; Mees, J.; van Sebille, E.; Koelmans, A.; Catarino, A.; Vandegehuchte, M. Risks of floating microplastic in the global ocean. Environ. Pollut. 2020, 267, 115499. [Google Scholar] [CrossRef]
  9. Hu, Y.; Gong, M.; Wang, J.; Bassi, A. Current research trends on microplastic pollution from wastewater systems: A critical review. Rev. Environ. Sci. Bio/Technol. 2019, 18, 207–230. [Google Scholar] [CrossRef]
  10. Rocha-Santos, T.A.; Duarte, A.C. Characterization and Analysis of Microplastics; Elsevier: Amsterdam, The Netherlands, 2017. [Google Scholar]
  11. Wang, F.; Wang, B.; Duan, L.; Zhang, Y.; Zhou, Y.; Sui, Q.; Xu, D.; Qu, H.; Yu, G. Occurrence and distribution of microplastics in domestic, industrial, agricultural and aquacultural wastewater sources: A case study in Changzhou, China. Water Res. 2020, 182, 115956. [Google Scholar] [CrossRef]
  12. Sharma, S.; Chatterjee, S. Microplastic pollution, a threat to marine ecosystem and human health: A short review. Environ. Sci. Pollut. Res. 2017, 24, 21530–21547. [Google Scholar] [CrossRef] [PubMed]
  13. Wang, S.; Chen, H.; Zhou, X.; Tian, Y.; Lin, C.; Wang, W.; Zhou, K.; Zhang, Y.; Lin, H. Microplastic abundance, distribution and composition in the mid-west Pacific Ocean. Environ. Pollut. 2020, 264, 114125. [Google Scholar] [CrossRef]
  14. Hildebrandt, L.; El Gareb, F.; Zimmermann, T.; Klein, O.; Kerstan, A.; Emeis, K.-C.; Pröfrock, D. Spatial distribution of microplastics in the tropical Indian Ocean based on laser direct infrared imaging and microwave-assisted matrix digestion. Environ. Pollut. 2022, 307, 119547. [Google Scholar] [CrossRef] [PubMed]
  15. Tsiaras, K.; Costa, E.; Morgana, S.; Gambardella, C.; Piazza, V.; Faimali, M.; Minetti, R.; Zeri, C.; Thyssen, M.; Ben Ismail, S.; et al. Microplastics in the Mediterranean: Variability from Observations and Model Analysis. Front. Mar. Sci. 2022, 9, 784937. [Google Scholar] [CrossRef]
  16. Cole, M.; Lindeque, P.; Halsband, C.; Galloway, T.S. Microplastics as contaminants in the marine environment: A review. Mar. Pollut. Bull. 2011, 62, 2588–2597. [Google Scholar] [CrossRef] [PubMed]
  17. Imhof, H.K.; Ivleva, N.P.; Schmid, J.; Niessner, R.; Laforsch, C. Contamination of beach sediments of a subalpine lake with microplastic particles. Curr. Biol. 2013, 23, R867–R868. [Google Scholar] [CrossRef]
  18. NOAA. What Are Microplastics? 2021. Available online: https://oceanservice.noaa.gov/facts/microplastics.html (accessed on 14 May 2021).
  19. Carbery, M.; O’Connor, W.; Palanisami, T. Trophic transfer of microplastics and mixed contaminants in the marine food web and implications for human health. Environ. Int. 2018, 115, 400–409. [Google Scholar] [CrossRef] [PubMed]
  20. Digka, N.; Tsangaris, C.; Torre, M.; Anastasopoulou, A.; Zeri, C. Microplastics in mussels and fish from the Northern Ionian Sea. Mar. Pollut. Bull. 2018, 135, 30–40. [Google Scholar] [CrossRef]
  21. Al-Malaika, S.; Axtell, F.; Rothon, R.; Gilbert, M. Additives for Plastics. In Brydson’s Plastics Materials (pp. 127–168). Butterworth-Heinemann. 2017. Available online: https://books.google.com.sg/books?hl=zh-TW&lr=&id=ERWKCgAAQBAJ&oi=fnd&pg=PP1&dq=21.%09Al-Malaika,+S.,+Axtell,+F.,+Rothon,+R.,+%26+Gilbert,+M.+Additives+for+plastics.+In+Brydson%27s+plastics+materials+(pp.+127-168).+But-ter-worth-Heinemann&ots=QQugdY1Srv&sig=cGEnZce6EEtUuYpQc4YvGnkpYWE&redir_esc=y#v=onepage&q&f=false (accessed on 1 September 2022).
  22. Lambert, S.; Sinclair, C.; Boxall, A. Occurrence, Degradation, and Effect of Polymer-Based Materials in the Environment. Reviews of Environmental Contamination and Toxicology, Volume Springer 227, 1–53. 2014. Available online: https://link.springer.com/chapter/10.1007/978-3-319-01327-5_1 (accessed on 1 September 2022).
  23. Bergmann, M.; Gutow, L.; Klages, M. Marine Anthropogenic Litter (p. 447). Springer Nature. 2015. Available online: file:///C:/Users/MDPI/Downloads/1001966.pdf (accessed on 1 September 2022).
  24. Lots, F.A.; Behrens, P.; Vijver, M.G.; Horton, A.A.; Bosker, T. A large-scale investigation of microplastic contamination: Abundance and characteristics of microplastics in European beach sediment. Mar. Pollut. Bull. 2017, 123, 219–226. [Google Scholar] [CrossRef] [PubMed]
  25. Praveena, S.M.; Shaifuddin, S.N.M.; Akizuki, S. Exploration of microplastics from personal care and cosmetic products and its estimated emissions to marine environment: An evidence from Malaysia. Mar. Pollut. Bull. 2018, 136, 135–140. [Google Scholar] [CrossRef] [PubMed]
  26. Richard, C.T.; Olsen, Y.S.; Mitchell, R.P.; Davis, A.; Rowland, S.J.; John, A.W.G.; Mcgonigle, D.F.; Russell, A.E. Lost at Sea: Where Is All the Plastic? Science 2004, 304, 838. [Google Scholar]
  27. Korez, Š.; Gutow, L.; Saborowski, R. Microplastics at the strandlines of Slovenian beaches. Mar. Pollut. Bull. 2019, 145, 334–342. [Google Scholar] [CrossRef]
  28. Reed, S.; Clark, M.; Thompson, R.; Hughes, K.A. Microplastics in marine sediments near Rothera Research Station, Antarctica. Mar. Pollut. Bull. 2018, 133, 460–463. [Google Scholar] [CrossRef]
  29. Sighicelli, M.; Pietrelli, L.; Lecce, F.; Iannilli, V.; Falconieri, M.; Coscia, L.; Di Vito, S.; Nuglio, S.; Zampetti, G. Microplastic pollution in the surface waters of Italian Subalpine Lakes. Environ. Pollut. 2018, 236, 645–651. [Google Scholar] [CrossRef]
  30. Zhao, J.; Ran, W.; Teng, J.; Liu, Y.; Liu, H.; Yin, X.; Cao, R.; Wang, Q. Microplastic pollution in sediments from the Bohai Sea and the Yellow Sea, China. Sci. Total Environ. 2018, 640–641, 637–645. [Google Scholar] [CrossRef]
  31. Auta, H.; Emenike, C.; Fauziah, S. Screening of Bacillus strains isolated from mangrove ecosystems in Peninsular Malaysia for microplastic degradation. Environ. Pollut. 2017, 231, 1552–1559. [Google Scholar] [CrossRef] [PubMed]
  32. Li, W.C.; Tse, H.; Fok, L. Plastic waste in the marine environment: A review of sources, occurrence and effects. Sci. Total Environ. 2016, 566–567, 333–349. [Google Scholar] [CrossRef]
  33. Dekiff, J.H.; Remy, D.; Klasmeier, J.; Fries, E. Occurrence and spatial distribution of microplastics in sediments from Norderney. Environ. Pollut. 2014, 186, 248–256. [Google Scholar] [CrossRef] [PubMed]
  34. Lee, J.; Hong, S.; Song, Y.K.; Hong, S.H.; Jang, Y.C.; Jang, M.; Heo, N.W.; Han, G.M.; Lee, M.J.; Kang, D.; et al. Relationships among the abundances of plastic debris in different size classes on beaches in South Korea. Mar. Pollut. Bull. 2013, 77, 349–354. [Google Scholar] [CrossRef] [PubMed]
  35. Mathalon, A.; Hill, P. Microplastic fibers in the intertidal ecosystem surrounding Halifax Harbor, Nova Scotia. Mar. Pollut. Bull. 2014, 81, 69–79. [Google Scholar] [CrossRef] [PubMed]
  36. Eo, S.; Hong, S.H.; Song, Y.K.; Lee, J.; Lee, J.; Shim, W.J. Abundance, composition, and distribution of microplastics larger than 20 μm in sand beaches of South Korea. Environ. Pollut. 2018, 238, 894–902. [Google Scholar] [CrossRef] [PubMed]
  37. Garcés-Ordóñez, O.; Castillo-Olaya, V.A.; Granados-Briceño, A.F.; García, L.M.B.; Díaz, L.F.E. Marine litter and microplastic pollution on mangrove soils of the Ciénaga Grande de Santa Marta, Colombian Caribbean. Mar. Pollut. Bull. 2019, 145, 455–462. [Google Scholar] [CrossRef] [PubMed]
  38. Nor, N.H.M.; Obbard, J.P. Microplastics in Singapore’s coastal mangrove ecosystems. Mar. Pollut. Bull. 2014, 79, 278–283. [Google Scholar] [CrossRef] [PubMed]
  39. Walther, B.A.; Kunz, A.; Hu, C.-S. Type and quantity of coastal debris pollution in Taiwan: A 12-year nationwide assessment using citizen science data. Mar. Pollut. Bull. 2018, 135, 862–872. [Google Scholar] [CrossRef] [PubMed]
  40. Claessens, M.; De Meester, S.; Van Landuyt, L.; De Clerck, K.; Janssen, C. Occurrence and distribution of microplastics in marine sediments along the Belgian coast. Mar. Pollut. Bull. 2011, 62, 2199–2204. [Google Scholar] [CrossRef]
  41. Leslie, H.; Brandsma, S.; Van Velzen, M.; Vethaak, A. Microplastics en route: Field measurements in the Dutch river delta and Amsterdam canals, wastewater treatment plants, North Sea sediments and biota. Environ. Int. 2017, 101, 133–142. [Google Scholar] [CrossRef] [PubMed]
  42. Vianello, A.; Boldrin, A.; Guerriero, P.; Moschino, V.; Rella, R.; Sturaro, A.; Da Ros, L. Microplastic particles in sediments of Lagoon of Venice, Italy: First observations on occurrence, spatial patterns and identification. Estuar. Coast. Shelf Sci. 2013, 130, 54–61. [Google Scholar] [CrossRef]
  43. Hien, T.T.; Nhon, N.T.T.; Thu, V.T.M.; Quyen, D.T.T.; Nguyen, N.T. The Distribution of Microplastics in Beach Sand in Tien Giang Province and Vung Tau City, Vietnam. J. Eng. Technol. Sci. 2020, 52, 208–221. [Google Scholar] [CrossRef]
  44. Yu, X.; Peng, J.; Wang, J.; Wang, K.; Bao, S. Occurrence of microplastics in the beach sand of the Chinese inner sea: The Bohai Sea. Environ. Pollut. 2016, 214, 722–730. [Google Scholar] [CrossRef]
  45. Song, Y.K.; Hong, S.H.; Jang, M.; Han, G.M.; Rani, M.; Lee, J.; Shim, W.J. A comparison of microscopic and spectroscopic identification methods for analysis of microplastics in environmental samples. Mar. Pollut. Bull. 2015, 93, 202–209. [Google Scholar] [CrossRef] [PubMed]
  46. Lahens, L.; Strady, E.; Kieu-Le, T.-C.; Dris, R.; Boukerma, K.; Rinnert, E.; Gasperi, J.; Tassin, B. Macroplastic and microplastic contamination assessment of a tropical river (Saigon River, Vietnam) transversed by a developing megacity. Environ. Pollut. 2018, 236, 661–671. [Google Scholar] [CrossRef] [PubMed]
  47. Mỹ, T.T.Á.; Dũng, P.T. Analytical conditions for determination of microplastics in fish. Hue Univ. J. Sci. Nat. Sci. 2020, 129, 85–92. [Google Scholar]
  48. Nguyen, Q.A.T.; Nguyen, H.N.Y.; Strady, E.; Nguyen, Q.T.; Trinh-Dang, M.; Vo, V.M. Characteristics of microplastics in shoreline sediments from a tropical and urbanized beach (Da Nang, Vietnam). Mar. Pollut. Bull. 2020, 161, 111768. [Google Scholar] [CrossRef] [PubMed]
  49. Yukioka, S.; Tanaka, S.; Nabetani, Y.; Suzuki, Y.; Ushijima, T.; Fujii, S.; Takada, H.; Van Tran, Q.; Singh, S. Occurrence and characteristics of microplastics in surface road dust in Kusatsu (Japan), Da Nang (Vietnam), and Kathmandu (Nepal). Environ. Pollut. 2019, 256, 113447. [Google Scholar] [CrossRef] [PubMed]
  50. Chan, H.T.; Cohen, M. Studies in Can Gio Mangrove Biosphere Reserve, Ho Chi Minh City, Vietnam; ISME Mangrove Ecosystems Technical Reports; International Society for Mangrove Ecosystems (ISME): Okinawa, Japan, 2014; Volume 6, p. 75. [Google Scholar]
  51. Le Nguyen, H.T.; Luong, H.P.V. Erosion and deposition processes from field experiments of hydrodynamics in the coastal mangrove area of Can Gio, Vietnam. Oceanologia 2018, 61, 252–264. [Google Scholar] [CrossRef]
  52. Kim, I.-S.; Chae, D.-H.; Kim, S.-K.; Choi, S.; Woo, S.-B. Factors Influencing the Spatial Variation of Microplastics on High-Tidal Coastal Beaches in Korea. Arch. Environ. Contam. Toxicol. 2015, 69, 299–309. [Google Scholar] [CrossRef]
  53. Hanvey, J.S.; Lewis, P.; Lavers, J.; Crosbie, N.D.; Pozo, K.; Clarke, B.O. A review of analytical techniques for quantifying microplastics in sediments. Anal. Methods 2016, 9, 1369–1383. [Google Scholar] [CrossRef]
  54. Faure, F.; Demars, C.; Wieser, O.; Kunz, M.; de Alencastro, L.F. Plastic pollution in Swiss surface waters: Nature and concentrations, interaction with pollutants. Environ. Chem. 2015, 12, 582. [Google Scholar] [CrossRef]
  55. Nel, H.A.; Froneman, P.W. A quantitative analysis of microplastic pollution along the south-eastern coastline of South Africa. Mar. Pollut. Bull. 2015, 101, 274–279. [Google Scholar] [CrossRef]
  56. Carson, H.S.; Colbert, S.L.; Kaylor, M.J.; McDermid, K.J. Small plastic debris changes water movement and heat transfer through beach sediments. Mar. Pollut. Bull. 2011, 62, 1708–1713. [Google Scholar] [CrossRef] [PubMed]
  57. Turra, A.; Manzano, A.B.; Dias, R.J.S.; Mahiques, M.; Barbosa, L.; Balthazar-Silva, D.; Moreira, F.T. Three-dimensional distribution of plastic pellets in sandy beaches: Shifting paradigms. Sci. Rep. 2014, 4, 4435. [Google Scholar] [CrossRef]
  58. Frias, J.; Pagter, E.; Nash, R.; O’Connor, I.; Carretero, O.; Filgueiras, A.; Gerdts, G. Standardised Protocol for Monitoring Microplastics in Sediments; Deliverable 4.2. 2018. Available online: https://repository.oceanbestpractices.org/handle/11329/1206 (accessed on 1 September 2022).
  59. Saliu, F.; Montano, S.; Garavaglia, M.G.; Lasagni, M.; Seveso, D.; Galli, P. Microplastic and charred microplastic in the Faafu Atoll, Maldives. Mar. Pollut. Bull. 2018, 136, 464–471. [Google Scholar] [CrossRef] [PubMed]
  60. Li, Y.; Lu, Z.; Zheng, H.; Wang, J.; Chen, C. Microplastics in surface water and sediments of Chongming Island in the Yangtze Estuary, China. Environ. Sci. Eur. 2020, 32, 15. [Google Scholar] [CrossRef]
  61. Masura, J.; Baker, J.; Foster, G.; Arthur, C. Laboratory Methods for the Analysis of Microplastics in the Marine Environment: Recommendations for Quantifying Synthetic Particles in Waters and Sediments. 2015. Available online: https://scholar.google.com.hk/scholar?hl=zh-TW&as_sdt=0%2C5&q=61.%09Masura%2C+J.%2C+Baker%2C+J.%2C+Foster%2C+G.%2C+%26+Arthur%2C+C.+%282015%29.+Laboratory+Methods+for+the+Analysis+of+Microplas-tics+in+the+Marine+En-vironment%3A+Recommendations+for+quantifying+synthetic+particles+in+waters+and+sediments&btnG= (accessed on 1 September 2022).
  62. Wu, X.; Zhong, C.; Wang, T.; Zou, X.; Zang, Z.; Li, Q.; Chenglong, W. Occurrence and distribution of microplastics on recreational beaches of Haichow Bay, China. Environ. Sci. Pollut. Res. 2020, 28, 6132–6145. [Google Scholar] [CrossRef] [PubMed]
  63. Bosker, T.; Guaita, L.; Behrens, P. Microplastic pollution on Caribbean beaches in the Lesser Antilles. Mar. Pollut. Bull. 2018, 133, 442–447. [Google Scholar] [CrossRef]
  64. Wessel, C.C.; Lockridge, G.R.; Battiste, D.; Cebrian, J. Abundance and characteristics of microplastics in beach sediments: Insights into microplastic accumulation in northern Gulf of Mexico estuaries. Mar. Pollut. Bull. 2016, 109, 178–183. [Google Scholar] [CrossRef]
  65. Kunz, A.; Walther, B.A.; Löwemark, L.; Lee, Y.-C. Distribution and quantity of microplastic on sandy beaches along the northern coast of Taiwan. Mar. Pollut. Bull. 2016, 111, 126–135. [Google Scholar] [CrossRef] [PubMed]
  66. Naji, A.; Nuri, M.; Amiri, P.; Niyogi, S. Small microplastic particles (S-MPPs) in sediments of mangrove ecosystem on the northern coast of the Persian Gulf. Mar. Pollut. Bull. 2019, 146, 305–311. [Google Scholar] [CrossRef] [PubMed]
  67. Zhou, Q.; Tu, C.; Fu, C.; Li, Y.; Zhang, H.; Xiong, K.; Zhao, X.; Li, L.; Waniek, J.J.; Luo, Y. Characteristics and distribution of microplastics in the coastal mangrove sediments of China. Sci. Total Environ. 2019, 703, 134807. [Google Scholar] [CrossRef] [PubMed]
  68. Piñon-Colin, T.D.J.; Rodriguez-Jimenez, R.; Pastrana-Corral, M.A.; Rogel-Hernandez, E.; Wakida, F.T. Microplastics on sandy beaches of the Baja California Peninsula, Mexico. Mar. Pollut. Bull. 2018, 131, 63–71. [Google Scholar] [CrossRef]
  69. Young, A.M.; Elliott, J.A. Characterization of microplastic and mesoplastic debris in sediments from Kamilo Beach and Kahuku Beach, Hawai’i. Mar. Pollut. Bull. 2016, 113, 477–482. [Google Scholar] [CrossRef] [PubMed]
  70. Besley, A.; Vijver, M.G.; Behrens, P.; Bosker, T. A standardized method for sampling and extraction methods for quantifying microplastics in beach sand. Mar. Pollut. Bull. 2017, 114, 77–83. [Google Scholar] [CrossRef] [PubMed]
  71. Li, J.; Zhang, H.; Zhang, K.; Yang, R.; Li, R.; Li, Y. Characterization, source, and retention of microplastic in sandy beaches and mangrove wetlands of the Qinzhou Bay, China. Mar. Pollut. Bull. 2018, 136, 401–406. [Google Scholar] [CrossRef] [PubMed]
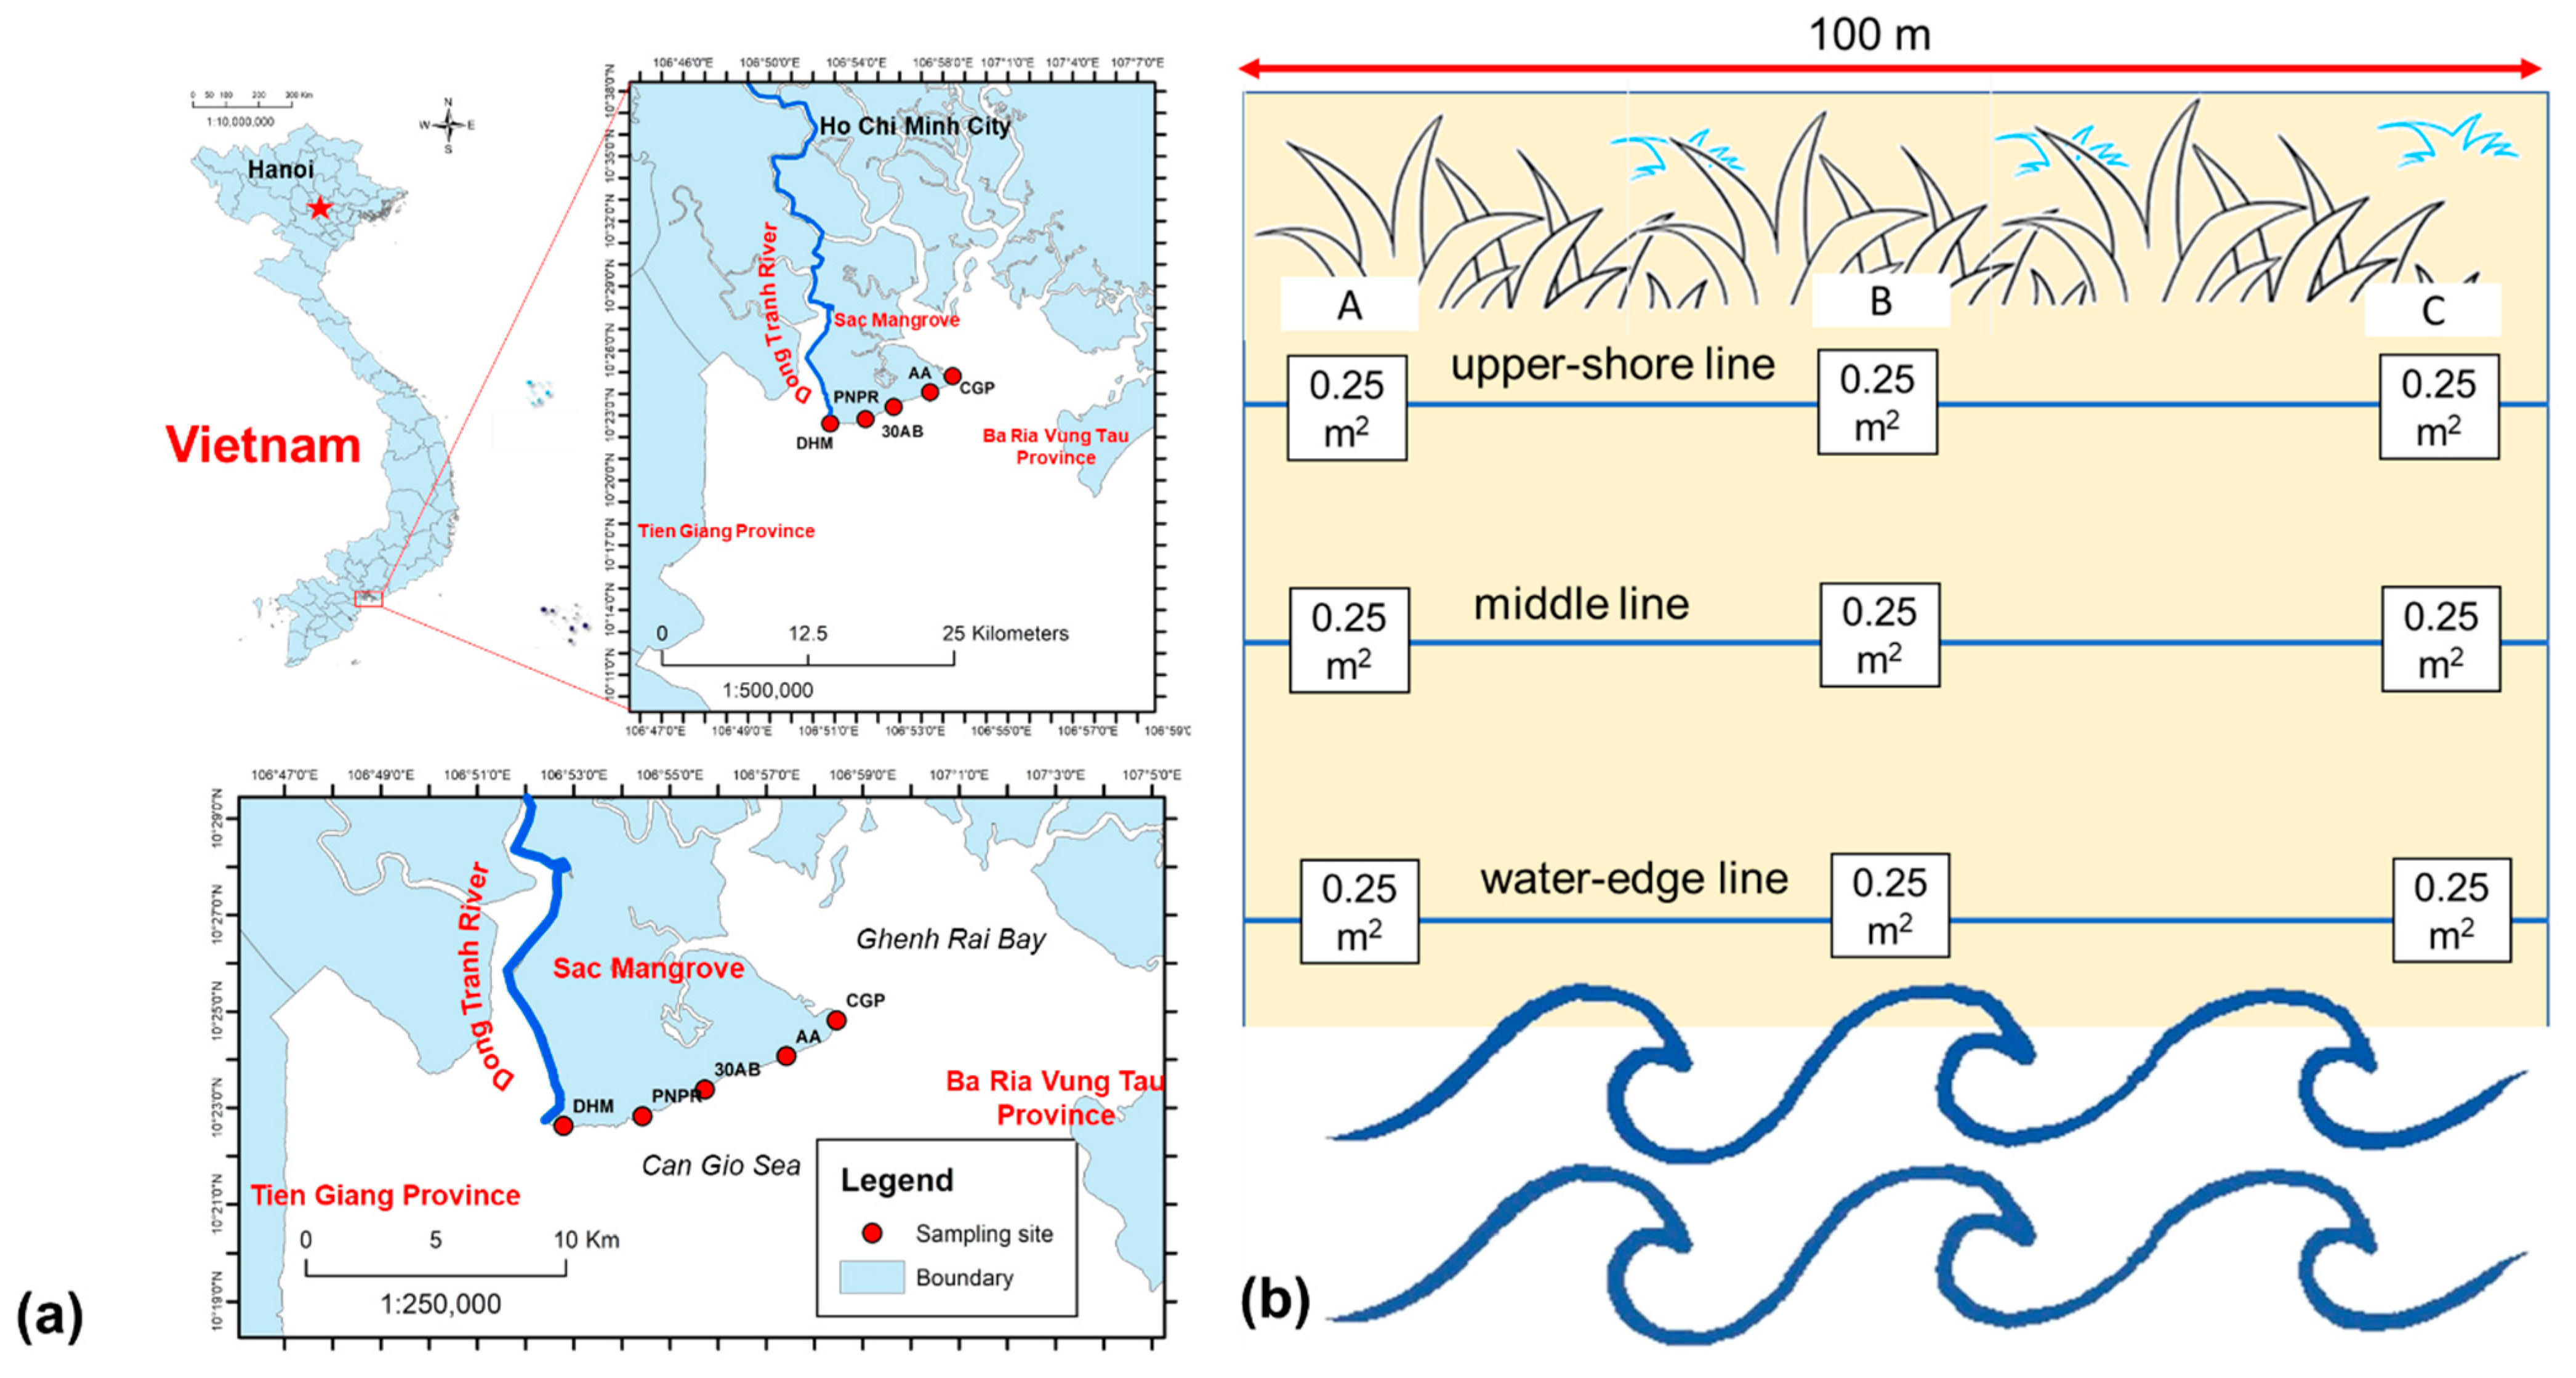
Figure 1. Sampling areas. (a) Five sampling areas of beach sand on Can Gio Coast, Ho Chi Minh City, Vietnam in November 2019 (DHM: Dong Hoa Market, PNPR: Phuong Nam Pearl Resort, 30AB: 30 April Beach, AA: Aquaculture Area, CGP: Can Gio Park); (b) the sampling area at each beach.
Water 14 02779 g001
Figure 2. Abundance of microplastics in Can Gio, Ho Chi Minh City, in 2019. (a) Abundance of microplastics of different beaches; (b) abundance of macroplastics of different beaches; (c) abundance of microplastics at different tidal lines; (d) abundance of microplastics at different depths.
Water 14 02779 g002
Figure 3. Physical characteristics and composition of microplastics in beach sand of this study. (a) Percentage of different sizes of microplastics; (b) Percentage of different shapes of microplastics; (c) Percentage of different sizes of microplastics; (d) Percentage of different compositions of microplastics; (e) Percentage of different compositions of macroplastics.
Water 14 02779 g003aWater 14 02779 g003b
Figure 4. Potential origin of microplastic and plastic in beach sand in this study (PNPR.UC2, PNPR.UC5, DHM.UB2: beach sand sample code); (a,b): examples of secondary sources of microplastics found in this study; (c): example of primary source of microplastics found in this study.
Water 14 02779 g004
Figure 5. Relationship of chemical composition, shape, and color of microplastics in this study.
Water 14 02779 g005
Table 1. Abundance of microplastics and macroplastics in beach sand samples in Can Gio, Ho Chi Minh City, Vietnam in November 2019.
Site SymbolLocationCoordinateMicroplastic AbundanceMacroplastic Abundance
Pieces/kg d.w.mg/kg d.w.Pieces/kg d.w.mg/kg d.w.
DHMDong Hoa Market10.376830, 106.8799964.4918.663.011766.24
PNPRPhuong Nam Pearl Resort10.377025, 106.8942046.5813.336.107403.80
30AB30 April Beach10.389663, 106.928722NDND1.37157.84
AAAquaculture area10.400064, 106.9541302.376.093.4952.28
CGPCan Gio Park10.413471, 106.9743380.680.202.761423.70
Note(s): ND: Not Detected.
Table 2. Abundance of microplastics (quantity and mass) in the surface layer and upper shoreline in beach sand samples in Can Gio, Ho Chi Minh City, Vietnam in November 2019.
Sampling Beachn = 18
(Pieces/kg d.w.)
Surface Layer Upper ShorlineSurface Layer of the Upper ShorelineSurface Layer of the Upper Shoreline
n = 9
(Pieces/kg d.w.)
n = 6
(Pieces/kg d.w.)
n = 3
(Pieces/kg d.w.)
n = 3
(Pieces/m2)
DHM4.498.3413.4726.94107.76
PNPR6.589.5519.7425.33101.32
30ABNDNDNDNDND
AA2.374.937.1114.2256.88
CGP0.681.402.054.116.4
Min-Max0–6.580–9.550–19.740–26.940–107.76
Median2.374.937.1114.2256.88
Average2.824.848.4714.1256.47
Note(s): ND: Not Detected. n: number of samples.
Table 3. Different researches in beach sand in the world in comparison with this study.
ReferenceResearch AreaSampling Sampling Area’s CharacteristicsMicroplastics Abundance
[36]South Korea3 tidal lines
100 m stretch
0.5 × 0.5 m2 quadrat
Upper 2.5 cm of sand
beaches with different features:
  • polluted beach.
  • deserted peninsula.
  • Port area, residential.
The beaches have different geomorphologies and tidal regimes.
1400–62,800 pieces/m2 (small microplastics)
0–2088 pieces/m2 (large microplastics)
[62]China3 tidal lines
100 m stretch
0.5 × 0.5 m2 quadrat
Upper 5 cm of sand
Recreational beaches with different levels of impact.106.50 ± 34.41 items/kg
[63]NetherlandStrandline
0.5 × 0.5 m2 quadrat
Upper 5 cm of sand
highly exposed area to seasonal extreme events (tropical hurricanes).68 ± 19–620 ± 96 pieces/kg d.w.
(261 ± 6 pieces/kg d.w.)
[64]USAWrack line
0.25 × 0.25 quadrat
Upper 3–6 cm of sand
  • Gulf of Mexico
Fourth largest estuary in the USA.
5–117
pieces/m2
[59]MaldivesDrift line
1 × 1 m2 grid
Upper 1 cm of sand
2 beaches with different characteristics:
  • An area has coral, the banks are gentle, shallow, and polluted.
  • An area has strong, deep waves, no anthropogenic activities.
22.8 ± 10.5 pieces/m2
[27]SloveniaStrandline
Upper 4 cm of sand
Slovenian beaches0.5 ± 0.5 pieces/kg d.w. to 1.0 ± 0.8 pieces/kg d.w.
[65]Northern TaiwanMiddle of tidal zone
0.5 × 0.5 m2 quadrat
2 layers of sand (0–5 cm, 5–10 cm)
  • rocky shore, narrow sandy beach.
Sampling beaches proximity to industrial zones, residential areas, estuaries, aquaculture zones, and seaports.
0.23–30.4 pieces/kg d.w.
[48]Danang, VietnamTransect from water-edge to vegetation zone
2 layers of sand (0–5 cm, 5–10 cm)
  • one of biggest and major coastal cities of Vietnam.
  • sandy beaches
9238 ± 2097 items/kg d.w. synthetic fibers
[37]Colombia CaribbeanRandom sites
1 m2
Ciénaga Grande de Santa Marta mangrove31–2863 pieces/kg d.w.
[38]SingaporeLow tide
Upper 3–4 cm of sand
1.5 × 1.5 m2 quadrat
Mangrove Ecosystems60.7 ± 27.2 pieces/kg d.w.
[66]IranRandom sites
Upper 5 cm of sand
The Iranian mangrove forest is located between the Persian Gulf and the Oman Sea.19.5 ± 6.36 to 34.5 ± 0.71 pieces/kg d.w.
[67]ChinaRandom sites
0.3 × 0.3 m2 quadrat
Upper 2 cm of sand
China’s Southeast mangroves8.3–5738.3 pieces/kg d.w.
This study, 2019Vietnam3 tidal lines
100 m stretch
0.5 × 0.5 m2 quadrat
2 layers of 2 cm (surface and 5 cm depth)
  • Frequently affected by erosion
  • Receive the flow from mangrove
  • Beaches with different anthropogenic activities
0 to 6.58 pieces/kg d.w. (0–26.32 pieces/m2)
Publisher’s Note: MDPI stays neutral with regard to jurisdictional claims in published maps and institutional affiliations.