Article

Analyzing the Impacts of Sewer Type and Spatial Distribution of LID Facilities on Urban Runoff and Non-Point Source Pollution Using the Storm Water Management Model (SWMM)

Water Environmental Research Department, National Institute of Environmental Research (NIER), Hwangyong-ro 42, Seogu, Incheon 22689, Korea
*
Author to whom correspondence should be addressed.
Water 2022, 14(18), 2776; https://doi.org/10.3390/w14182776
Submission received: 20 July 2022 / Revised: 31 August 2022 / Accepted: 1 September 2022 / Published: 6 September 2022
(This article belongs to the Special Issue Stormwater Management in Urban and Rural Areas)

Abstract

:
The negative changes in the hydrological cycle are increasing due to climate change and urbanization, resulting in deterioration of water quality and environmental issues. Although Low-Impact Development (LID) techniques studies have been conducted to solve this problem, the spatial distribution of LID facilities and sewer types has received less attention. In this study, it is proposed to analyze the effects of sewer type, the spatial distribution of LID facilities, and LID type on runoff and water quality using the Storm Water Management Model and to identify effective ways of improving the hydrological cycle and Non-Point Source (NPS) pollution associated with urbanization. As a result of the runoff reduction analysis, 68% of the rainfall was discharged at the outlet for separate sewers, 79% for combined sewers without storage tank, and 49% for combined sewers with storage tank. The LID scenario results showed the distributed LID application method has higher reduction efficiency of runoff and NPS pollution than the intensive application method. Moreover, intensive application of LID in downstream areas resulted in higher runoff reduction efficiency than the application of LID in upstream areas. It will be used not only in the hydrological cycle plan but also in NPS pollution management.

1. Introduction

Climate change and urbanization are global problems that increase hydrological variability in watersheds and cause the instability of human societies and aquatic ecosystems [1,2]. In the process of urbanization, the water quantity and quality deteriorated due to the increase in impervious areas such as roads, building roofs, and parking lots and intensive rainfall, and the management of urban runoff became complicated [3,4]. In particular, an increase in impervious areas causes a short lag time of runoff and an increase in peak flow, causing flooding at the bottleneck of the sewage pipe in lowland areas, and adversely affecting the management of sewage and rainwater management. Moreover, in urban areas, a decrease in infiltration rates can produce negative effects such as a decrease in the amount of water infiltrated into the soil as well as groundwater resource depletion. This causes the stream depletion phenomenon, and the problem of urban non-point source (NPS) pollution [5,6,7,8]. These phenomena have distorted the hydrological cycle structure in watersheds and caused environmental issues, and management is urgently required. Schueler [9] reported if the impervious area ratio in a watershed exceeds 8–10%, the health status of the watershed becomes lower than average; whereas if it is 25% or above, the health status is significantly impaired. This indicates that an increase in impervious areas is correlated with the deterioration of water quality and a reduction in the number of aquatic organisms. Recognizing the seriousness of these hydrological, water quality, and ecological problems in cities, many countries such as European countries, the United States, and South Korea have analyzed hydrological patterns due to urbanization and made efforts to systematize efficient hydrological cycle management plans [10,11]. Especially, in South Korea, the impervious area ratio increased by approximately 2.6 times from 3.0% in 1970 to 7.6% in 2017 [12]. Accordingly, government policies to manage the hydrological cycle and impervious areas have been implemented across the country to reduce rainfall runoff and NPSs. Since Seoul in South Korea has an impervious area ratio of 52.84% in 2017 which is the highest ratio compared to other watersheds in South Korea, it is necessary to manage and control the hydrological cycle in Seoul [13].
Low impact development (LID) has been recently proposed as a method to solve problems that may occur due to urbanization [14]. The LID technique can maintain the hydrological function before development by decreasing the peak discharge and total flow and is also effective in reducing pollutants. Studies on LID have been conducted for various purposes [15,16]. For instance, Perez-Pedini et al. [17] proposed an optimal management technique by applying the LID technique to restore the hydrological cycle before urban development, using storage facilities and permeable pavements in urban watersheds. Joo et al. [18] indicated analyzed the effect of improving the hydrological cycle by developing and applying a Tree Box type infiltration facility. Shin et al. [19] analyzed the reduction effect of applying the LID technique in a sewage treatment zone and suggested a method for calculating the LID installation area. It is difficult, however, to analyze the runoff variability caused by an increase in the urban area, and there are limitations in collecting water quality data with discontinuity [20]. To overcome this difficulty, various computer models corresponding to changes in watershed conditions have been developed and applied to the estimation of hydrological responses and water quality.
Many researchers have simulated changes in runoff and water quality caused by urbanization by applying LID to the Storm Water Management Model (SWMM). The SWMM has been widely used in many environmental and hydrological applications over the world. Lee et al. [21] explained that he applied various LID techniques to suggest measures to reduce the runoff caused by climate change and urbanization. Jemberie et al. [22] suggested an LID-setting method considering the land-use characteristics of each sub-watershed for the Addis Ababa region in Ethiopia. Yeon et al. [23] explained and analyzed runoff reduction efficiency in urban watersheds by applying the LID techniques of permeable pavements and vegetative swales to SWMM. Lee et al. [24] proposed and predicted the water cycle restoration effect by applying LID to SWMM for an urban watershed under development, and compared it with the actual water cycle restoration effect after field application. Kim [25] conducted sensitivity analysis according to short-term rainfall events using the parameters of six LID technologies for watersheds, and selected LID technologies that are sensitive to runoff. In other previous studies, runoff characteristics were analyzed according to land-use changes caused by urban growth [26,27], runoff and pollution loads were analyzed for sewer management [28,29], and the effect of LID application on hydrological cycle improvement was investigated [30].
In the previous studies, however, LID application efficiency for short-term rainfall events was analyzed and the analysis of runoff by sewer type was insufficient. Although LID was applied in consideration of land-use characteristics of the drainage area, the LID has been applied without considering the facility type and facility installation location. To evaluate the hydrological cycle improvement, it is necessary to determine the detailed runoff characteristics according to the sewer type. A customized management plan should be presented according to the installation of effective NPS pollution reduction facilities.
Accordingly, the objective of this study: (1) long-term runoff and water quality simulations were evaluated for each sewer type using SWMM; and (2) the optimal management method to improve the hydrological cycle distortion and NPS pollution problems caused by urbanization was proposed, with consideration of the spatial distribution application of LID and the LID type. The procedure used in this study is shown in Figure 1.

2. Methods

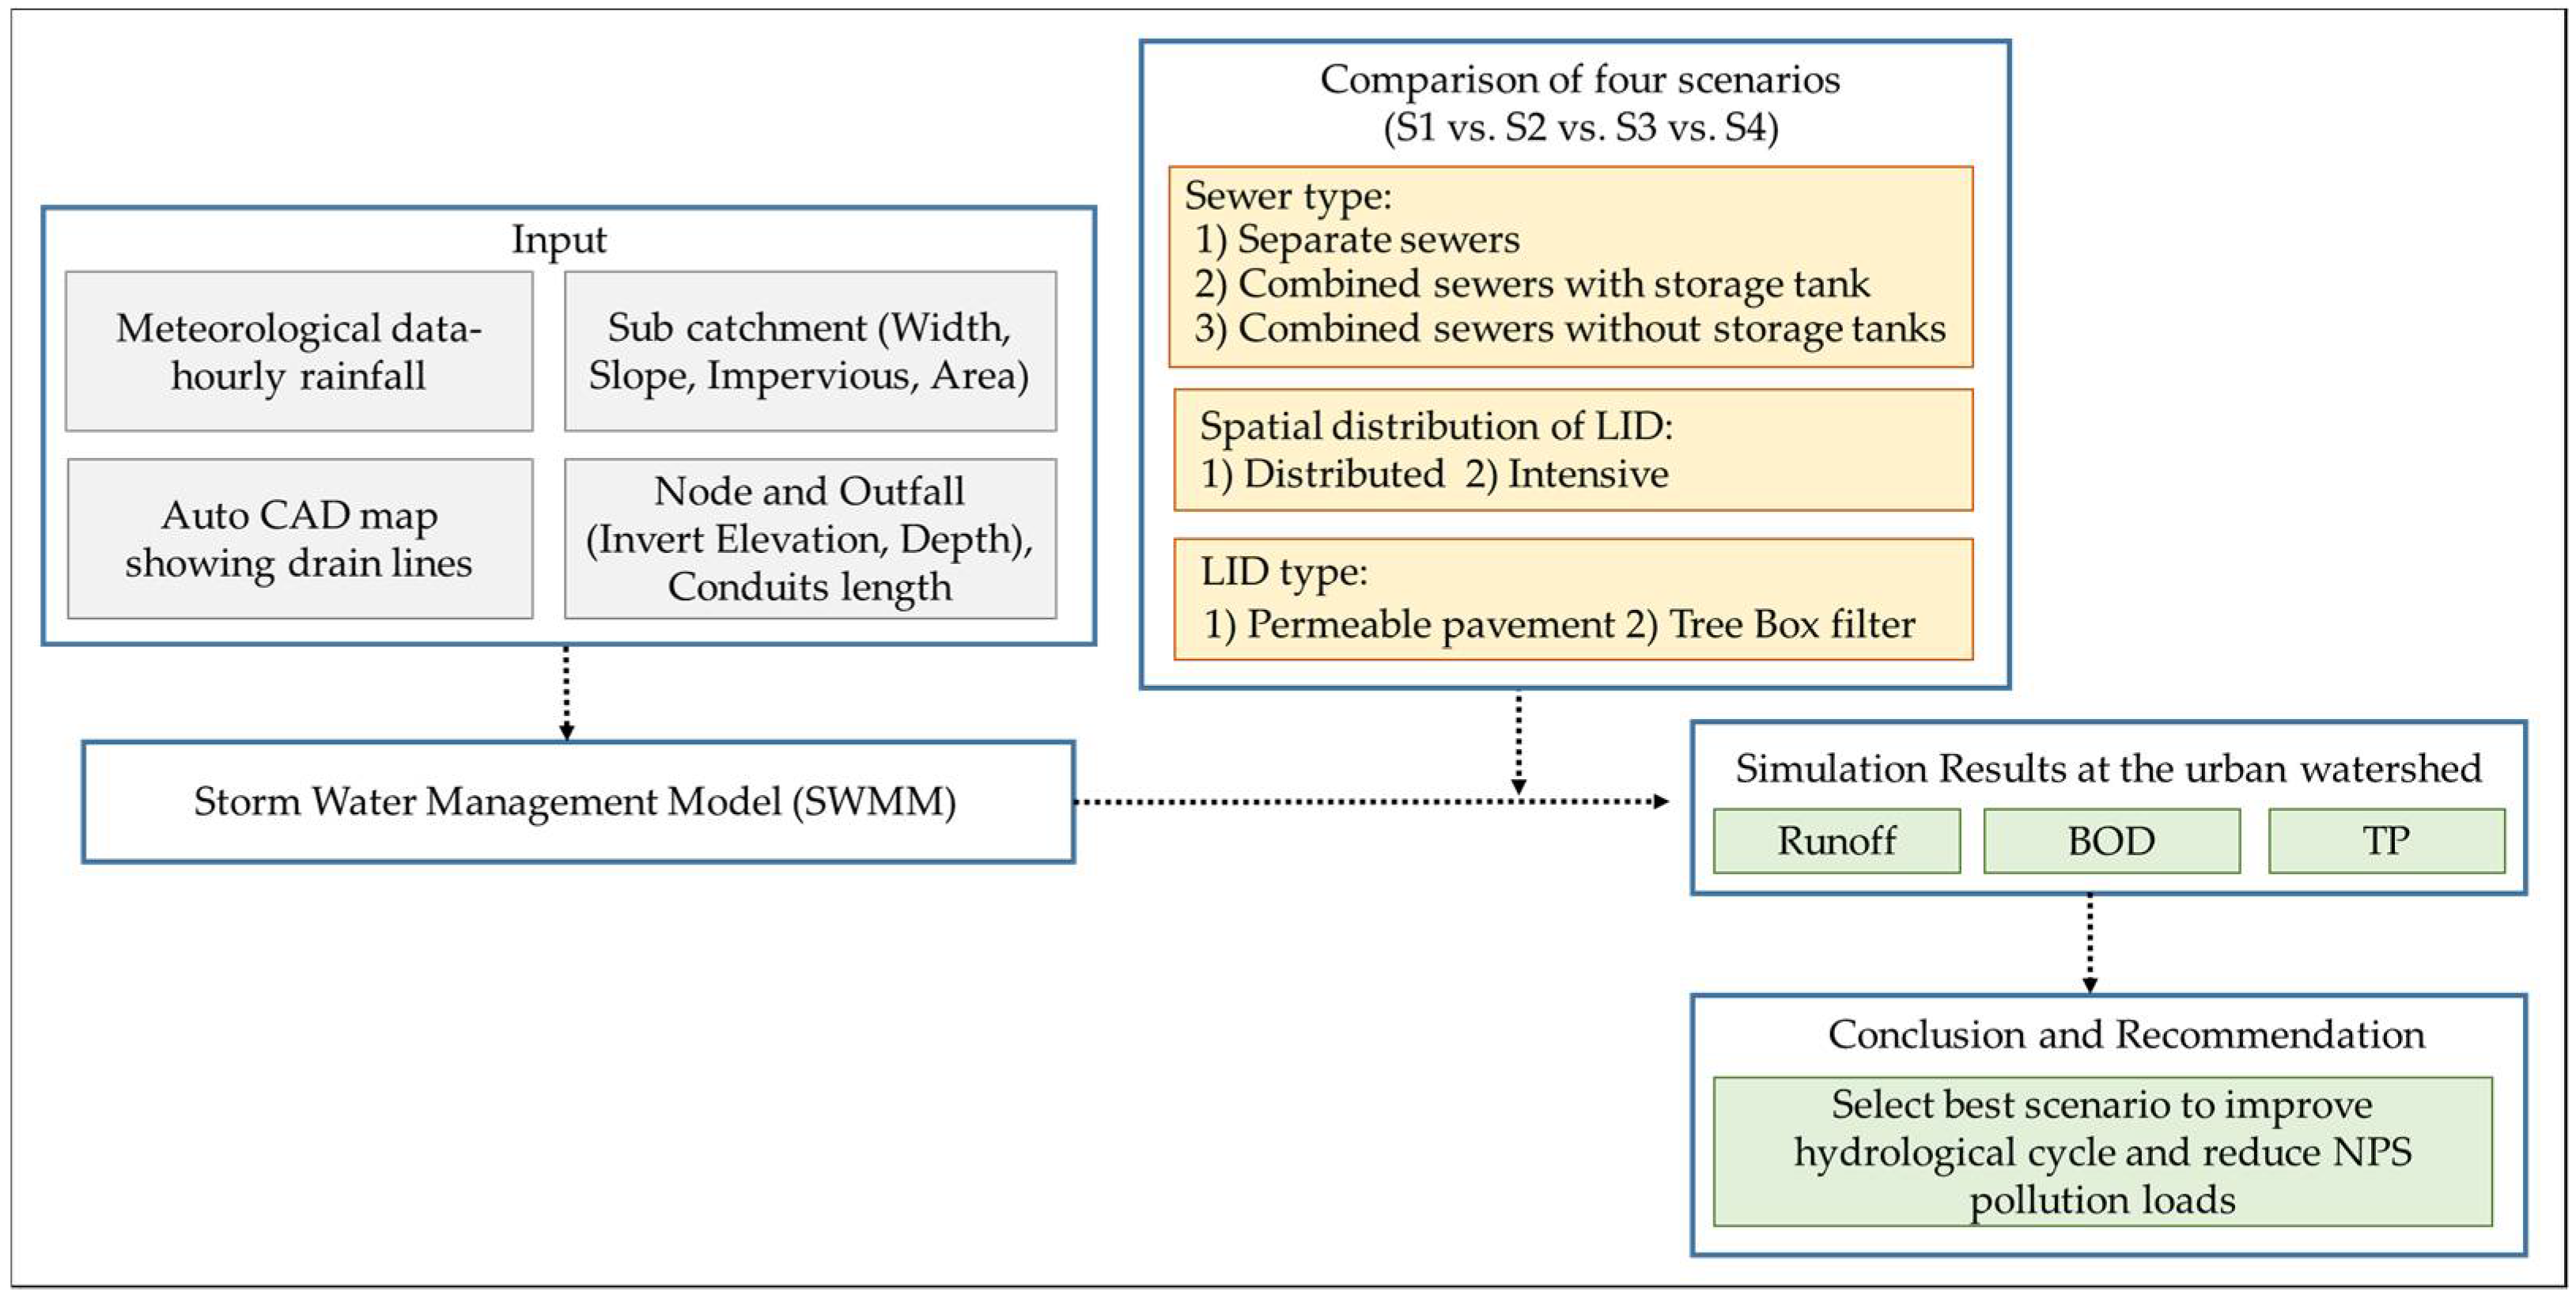
2.1. Description of SWMM

The Environmental Protection Agency developed SWMM to simulate the flow rate and water quality in the hydrological cycle of an urban watershed [31]. Runoff simulation consists of the RUNOFF BLOCK, EXTRAN BLOCK, and TRANSPORT BLOCK, and the hydrograph and pollution curve for drainage area runoff are traced [32]. SWMM, which can be applied to urban watersheds, can simulate single and continuous rainfall events and combine/separate drainage areas [33]. It is a widely used model because it can analyze the runoff and treatment of various pollutants considering combined sewer overflows (CSOs) and sanitary sewer overflows (SSOs). It is possible to simulate the quantitative hydrological characteristics of infiltration, storage, and LID facilities using SWMM. Applying LID in SWMM makes it possible to simulate bio-retention cells, infiltration trenches, porous pavements, rain barrels, rain gardens, and vegetative swales. In addition, LID can be applied to sub-catchments with different land-cover characteristics, and it is possible to simulate and analyze storage and circulation in each layer while maintaining the water balance. In this study, SWMM (Version 5.1.15) was used.

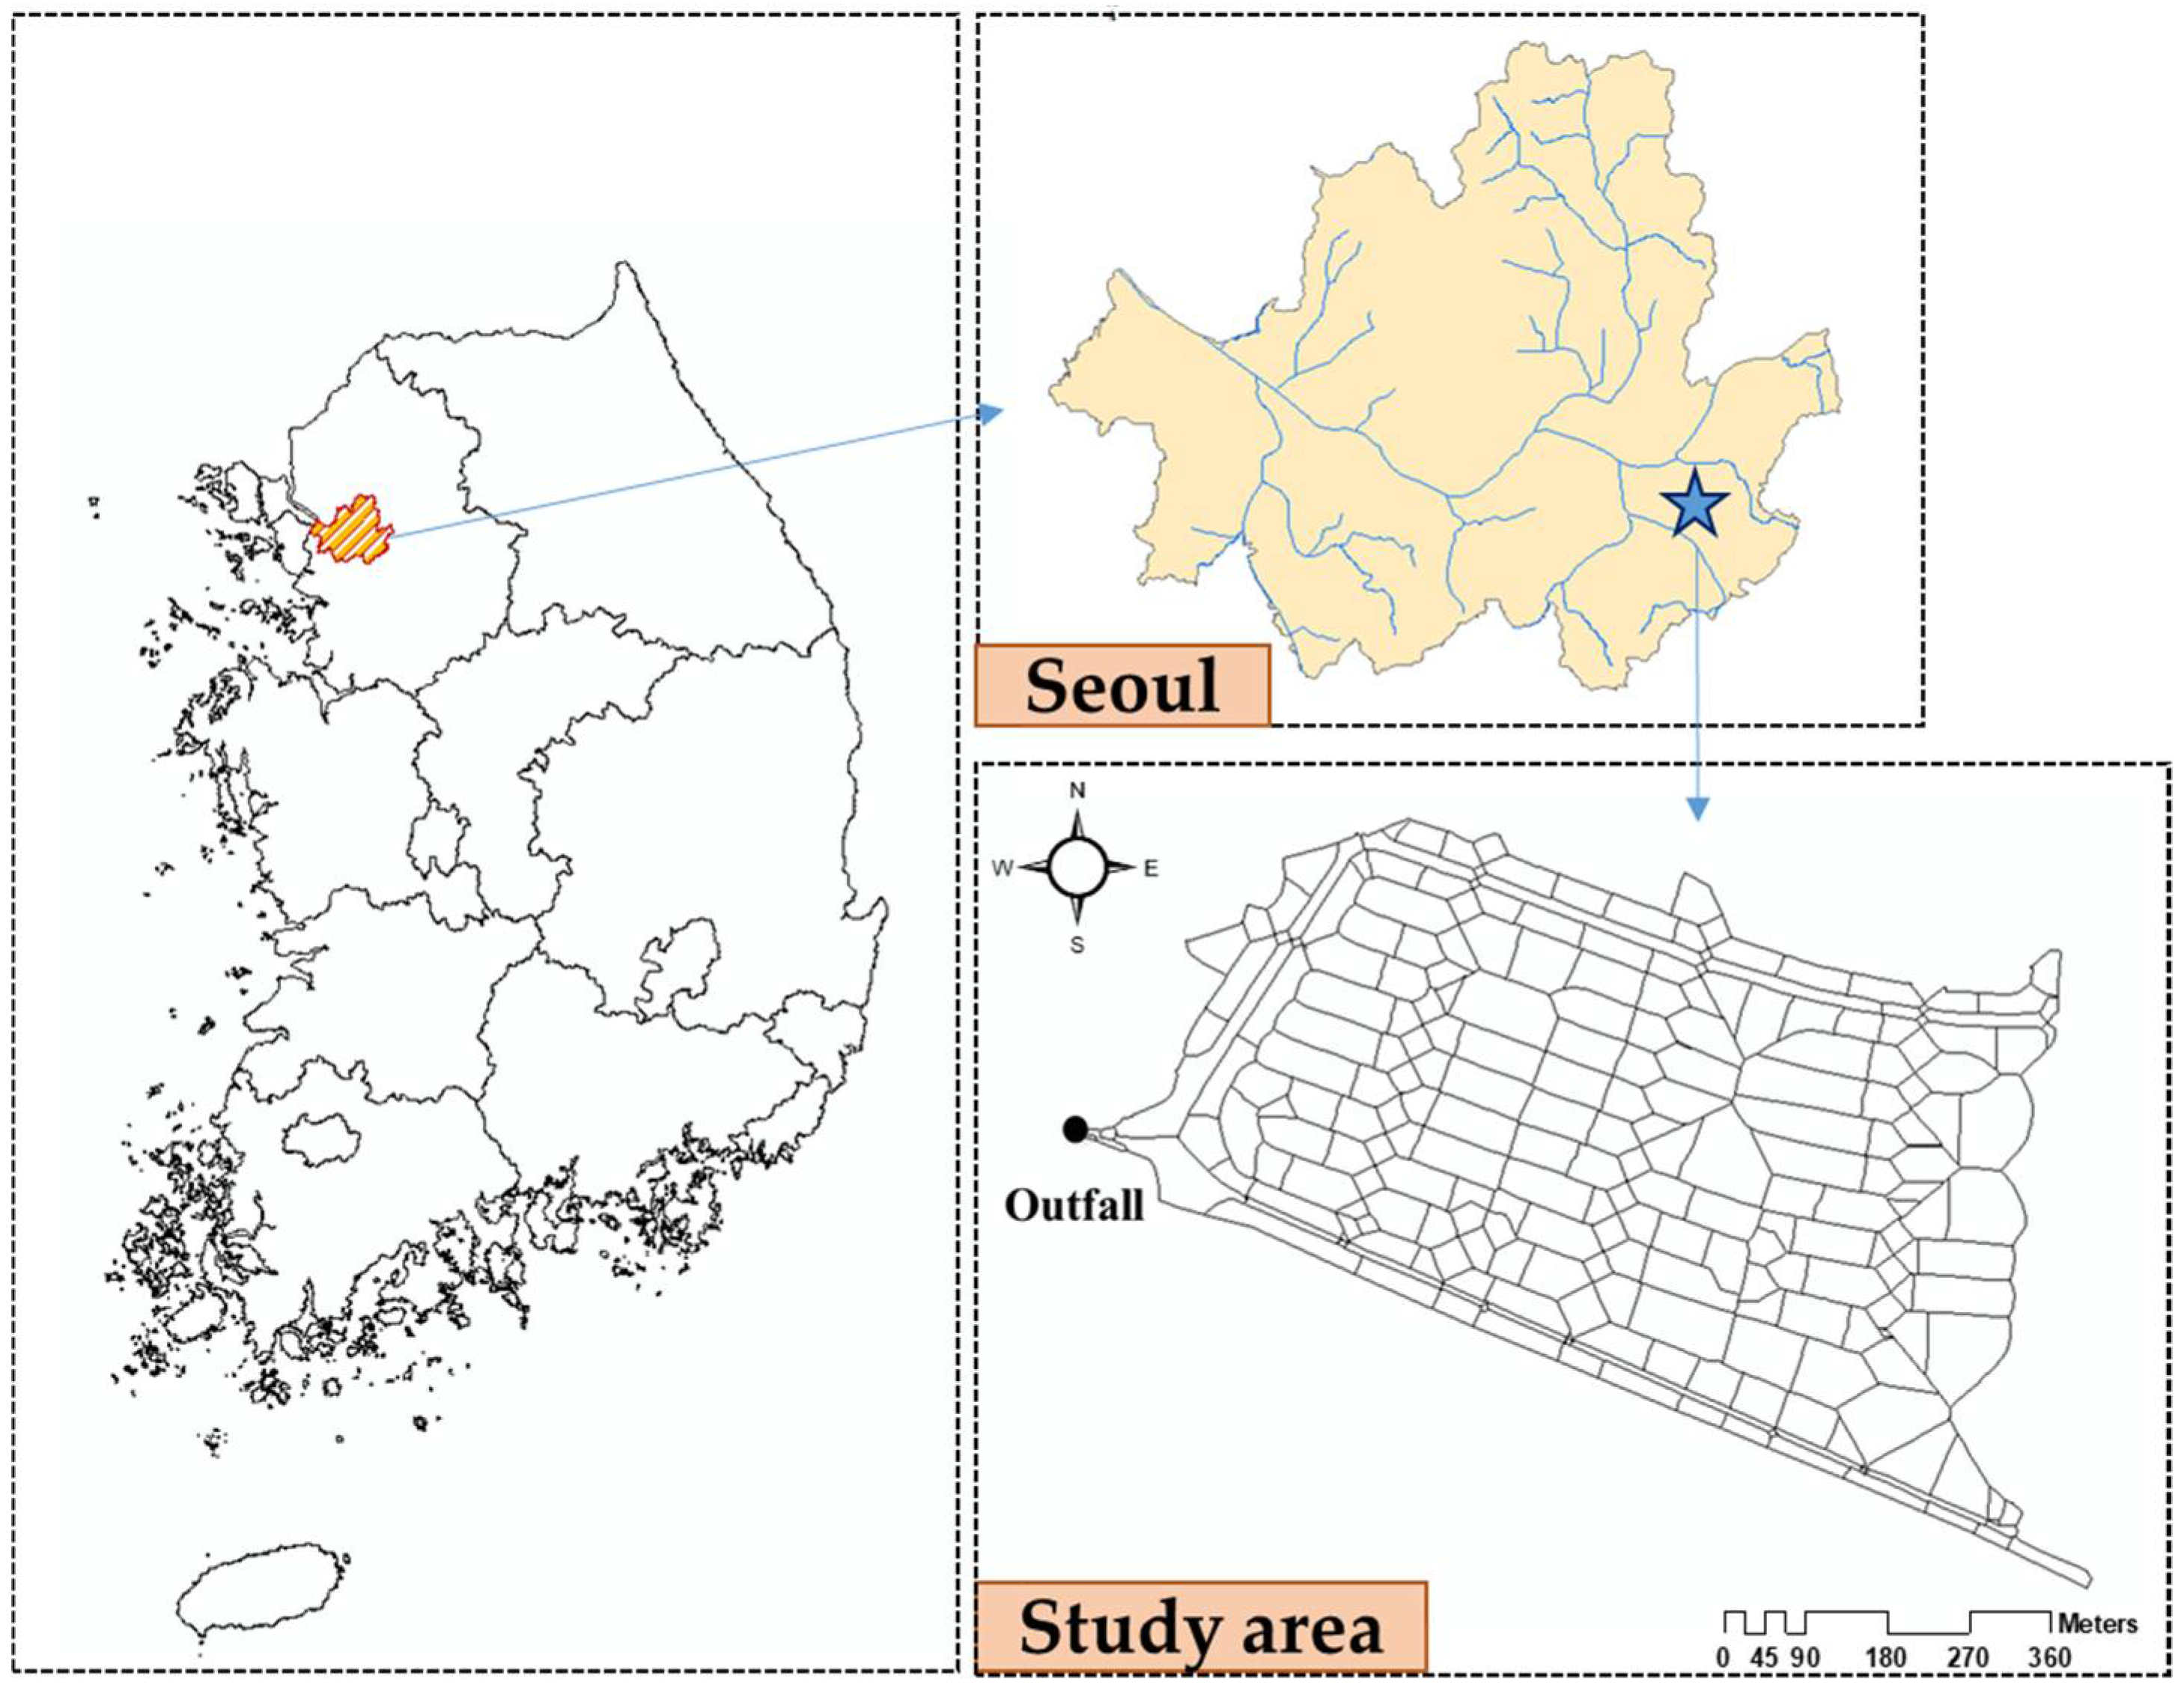
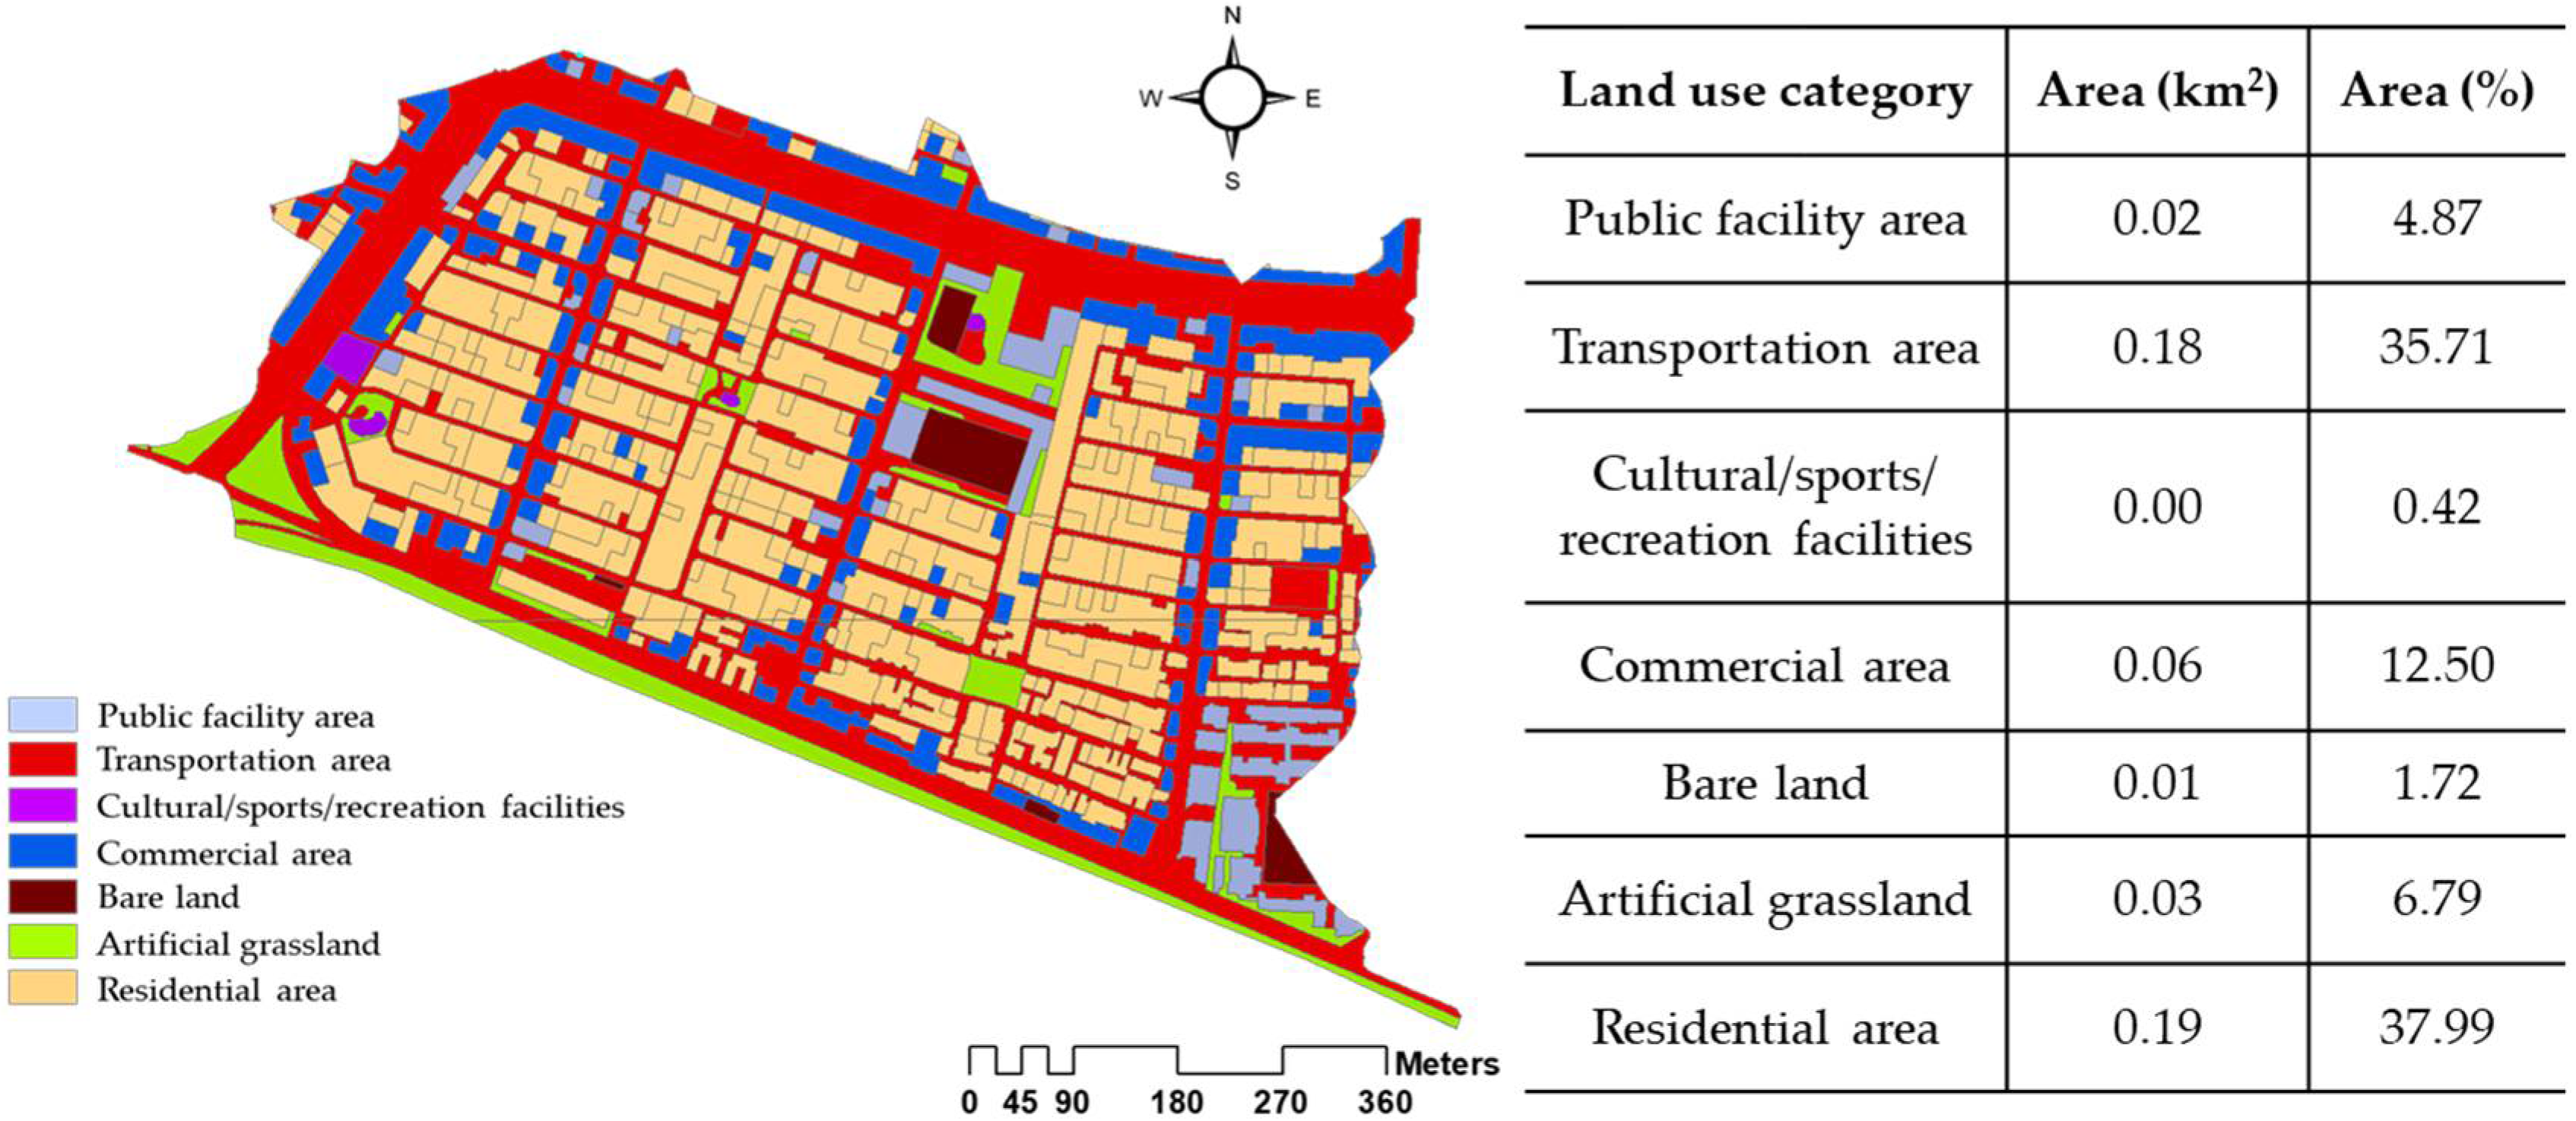
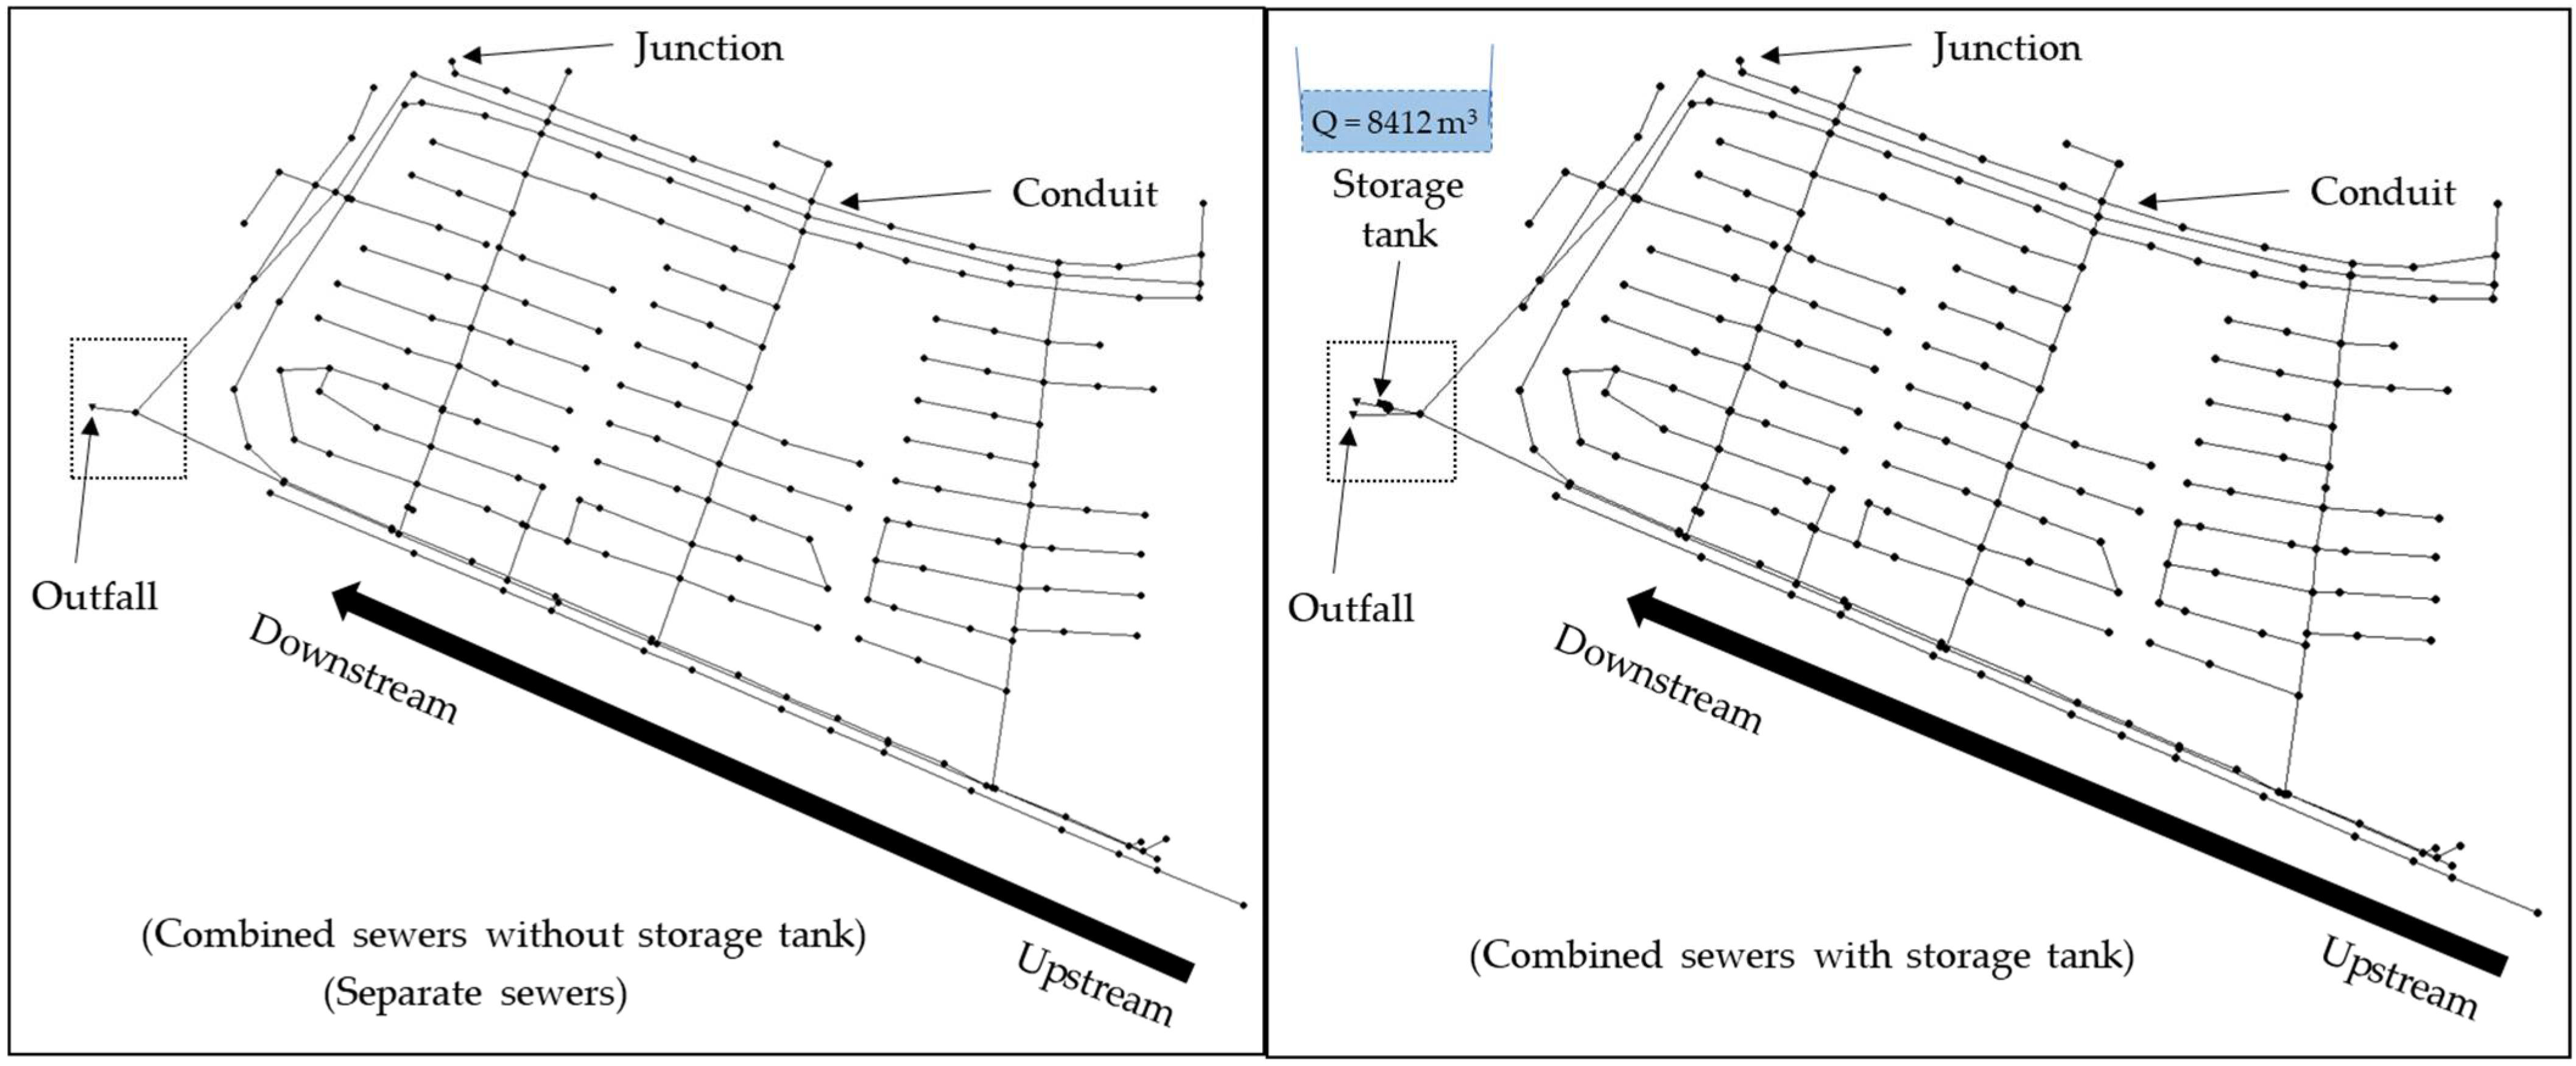
2.2. Study Area and Input Data

Seoul had an impervious area ratio of 52.84% in 2017, which was the highest of all regions in South Korea [13]. As such, in this study, the Songpa area in Seoul was selected as the target area, which has a total area of 0.50 km2 as shown in Figure 2. In the area, residential areas account for 37.99%, transportation areas account for 35.71%, and commercial areas account for 12.50% (Figure 3). The area has an overall impervious area ratio of 79% in Seoul.
To distinguish subcatchments and extract the topographic element, such as the area, river length, and slope of each subcatchment, the 30 m × 30 m digital elevation model provided by the National Geographic Information Institute (https://www.ngii.go.kr/eng/main.do, accessed on 2017) was used as data. Data provided by the Environmental Geographic Information Service (https://egis.me.go.kr, accessed on 2018) were used for the land-use map. Land-use was classified into urbanization areas, agricultural areas, forest areas, grasslands, wetlands, bare lands, and waters. The urbanization areas were subdivided into industrial, transportation, public facility, commercial areas, etc. The time-series rainfall data at Seoul meteorological sites from 1 January to December in 2018 provided by the Korea Meteorological Administration (https://www.kma.go.kr/eng/index.jsp, accessed on 1 January 2018) were used, and the total rainfall was 1284.1 mm.
As for the map of the pipe network, which is the input data of SWMM, the Urban Information System (UIS) data for the rainwater pipe network of Seoul were used. It was considered for the topography in watersheds and the artificial drainage system in each area. A total of 242 subcatchments were divided, and 243 manhole outlets and a sewer length of 14.8 km were constructed. Input parameters were divided into physical and hydrological parameters. The physical parameters included: subcatchment-related parameters, such as the subcatchment, average watershed slope, and area of impervious surfaces; and drainage system-related parameters, such as the length of the channel and pipe network, pipe diameter, channel width, and channel slope. The hydrological parameters included the Manning roughness coefficient of pervious and impervious watersheds, surface depression, infiltration-related parameters, and characteristic width. Runoff was calculated using the runoff curve number (CN), which is able to consider physical and hydrological parameters, such as the hydrological soil groups of watersheds, land-cover types, hydrological conditions, impervious areas, and antecedent moisture conditions.

2.3. Evaluation of Runoff and NPS Pollution Loads Estimation by Using Sewer Type

The Environmental Protection Agency developed SWMM to simulate the flow rate and water quality in the hydrological cycle of an urban watershed [31]. Runoff simulation consists of impervious area management and is an efficient method to reduce the discharge of untreated sewage during rainfall and improve the water quality environment of water discharge areas [34]. Sewers can be divided into combined and separate sewers. Combined sewers treat both sewage and rainwater. When the intercepting capacity of a sewage treatment plant is exceeded, CSOs occur and adversely affect water quality in urban areas. To reduce such CSOs, storage tanks are installed, and water is discharged to rivers after treatment. Separate sewers allow sewage and rainwater to flow separately. Rainwater flows into separate pipes and, thus, there is no inflow of rainwater into sewage pipes.
To compare runoff and NPS pollution loads with sewer types, the model parameters regarding meteorological conditions were the same in the study area. This means that, since the characteristics of each sewer type cannot be compared under the same watershed conditions in actual watersheds, a virtual watershed was used, and it was assumed that only the characteristics of each sewer type were different. To compare the facility installation effect according to the presence or absence of storage tank for combined sewers, the following three sewer types were assumed (Figure 4): (1) combined sewers with storage tank; (2) combined sewers without storage tank; and (3) separate sewers that carry rainwater and sewage separately.
To estimate sewage in combined sewers, the treatment area data of the Seonam sewage treatment center in Seoul were used. In addition, the flow rate of influent into the Seonam sewage treatment center and the total phosphorus (TP) and biochemical oxygen demand (BOD) concentrations were applied. The intercepting capacity and final overflows at the end of the watershed were calculated by applying the area ratio of the study area to the planned amount of sewage during rainfall and the storage capacity of reservoirs [35]. The design flow of rainwater pipelines in sewer types is shown in Figure 4. In addition, one storage tank was installed with combined sewers, and the storage tank was located near the outfall, as shown in Figure 4. The storage tank was set to a structure in which overflow occurs when the storage tank capacity (Q = 8412 m3) is exceeded.
Since the study area has a large impervious area, Power-Exponential, which can describe the initial washing well, was applied [36]. To activate the Build-up function and Wash-off function of pollution loads, we referred to the suggestions of previous studies [37,38,39,40]. The amount of load generated for each land-use type in Korea was used. As for the maximum buildup, the range corresponding to 30 times the accumulation rate factor was applied considering 30 days of no rainfall. The initial buildup was applied considering 0–30 days of no rainfall. During the setting of the virtual watershed, model calibration and validation were not evaluated to analyze correlations between runoff-related variables and the runoff reduction effect. Lee et al. [41] explained that five virtual watersheds were set, and the runoff reduction effect and the location of the optimal reservoir were analyzed using the HEC-HMS. Yeon et al. [42] proposed to set a virtual watershed and analyzed runoff characteristics by varying the LID application depending on the location and number of sub-watersheds without model calibration and validation. Bae et al. [43] also analyzed the relationship between the watershed width, which can consider the flow in pipelines, and runoff variability by setting four virtual watersheds without model calibration and validation in SWMM. Lee et al. [44] proposed by classifying the reservoir location into upstream, midstream, and downstream in the virtual watershed, SWMM was used to analyze the relationship between the peak flow rate at the outlet and the location of the reservoir. This means that without model calibration and validation, many previous studies analyzed the relationship between runoff and runoff reduction effect for the purpose of analysis. Therefore, in this study, the virtual watershed setting method was also referred to, and the runoff and TP/BOD loads were analyzed for each point (upstream, midstream, downstream, and outlet).

2.4. Application of LID Techniques in SWMM

LID technologies refer to facilities and design methods to manage hydrological cycle systems in urban areas through the functions of storage, infiltration, and filtration. Various LID technologies exist, such as bio-retention cells, infiltration trenches, permeable pavements, rain gardens, rainwater tanks, rooftop connection facilities, roof planting, and vegetative swales [45]. When the Center for Watershed Protection Technical Memorandum [46] analyzed the rainfall-runoff reduction effect of each LID technique, the results were 10–20% for grass channels, 45–60% for green rooftops, 50–90% for infiltration facilities, 45–70% for permeable pavement, and 25–50% for rooftop disconnection facilities (Table 1).
Among the LID technologies, permeable pavements are a specialized technology for roads or sidewalks, where permeable pavement materials are applied and consist of a surface layer, a pavement layer, a soil layer, and a storage layer. The infiltration function can be applied through permeable pavement materials, and rainwater storage is possible through the soil and storage layers. Such permeable pavements have been widely applied to various urban watersheds and are highly applicable to parking lots and sidewalks [47]. Since they allow the storage and infiltration of rainwater into the soil, a high runoff reduction effect can be expected [48,49,50].
The Tree Box filter in LID technologies is suitable for urban watersheds because it can implement the water quality improvement capacity according to the watershed area and the rainfall-runoff characteristics [51]. Since it is installed in the street tree landscape space before manhole facilities, it requires no additional site and is suitable for application to roads. The Tree Box filter does not allow the infiltration of rainfall runoff into the soil, and thus it is not necessary to consider the infiltration rate of the soil. When LID is applied to SWMM, only the surface water generated from the impervious area is set as influent, and the scale of the influent into the LID facility is determined according to the impervious area ratio. The LID structure applied to SWMM is divided into a surface layer, a soil layer, and a storage layer. Since each layer can reflect the design drawings of LID facilities, actual on-site facility scale characteristics can be reflected [52]. In this study, the runoff and pollution load reduction effect for each sewer type were analyzed by applying permeable pavements and the Tree Box filter, which are suitable LID facilities for urban areas, to SWMM. Table 2 shows the parameters of the permeable pavements and Tree Box filter applied to SWMM.

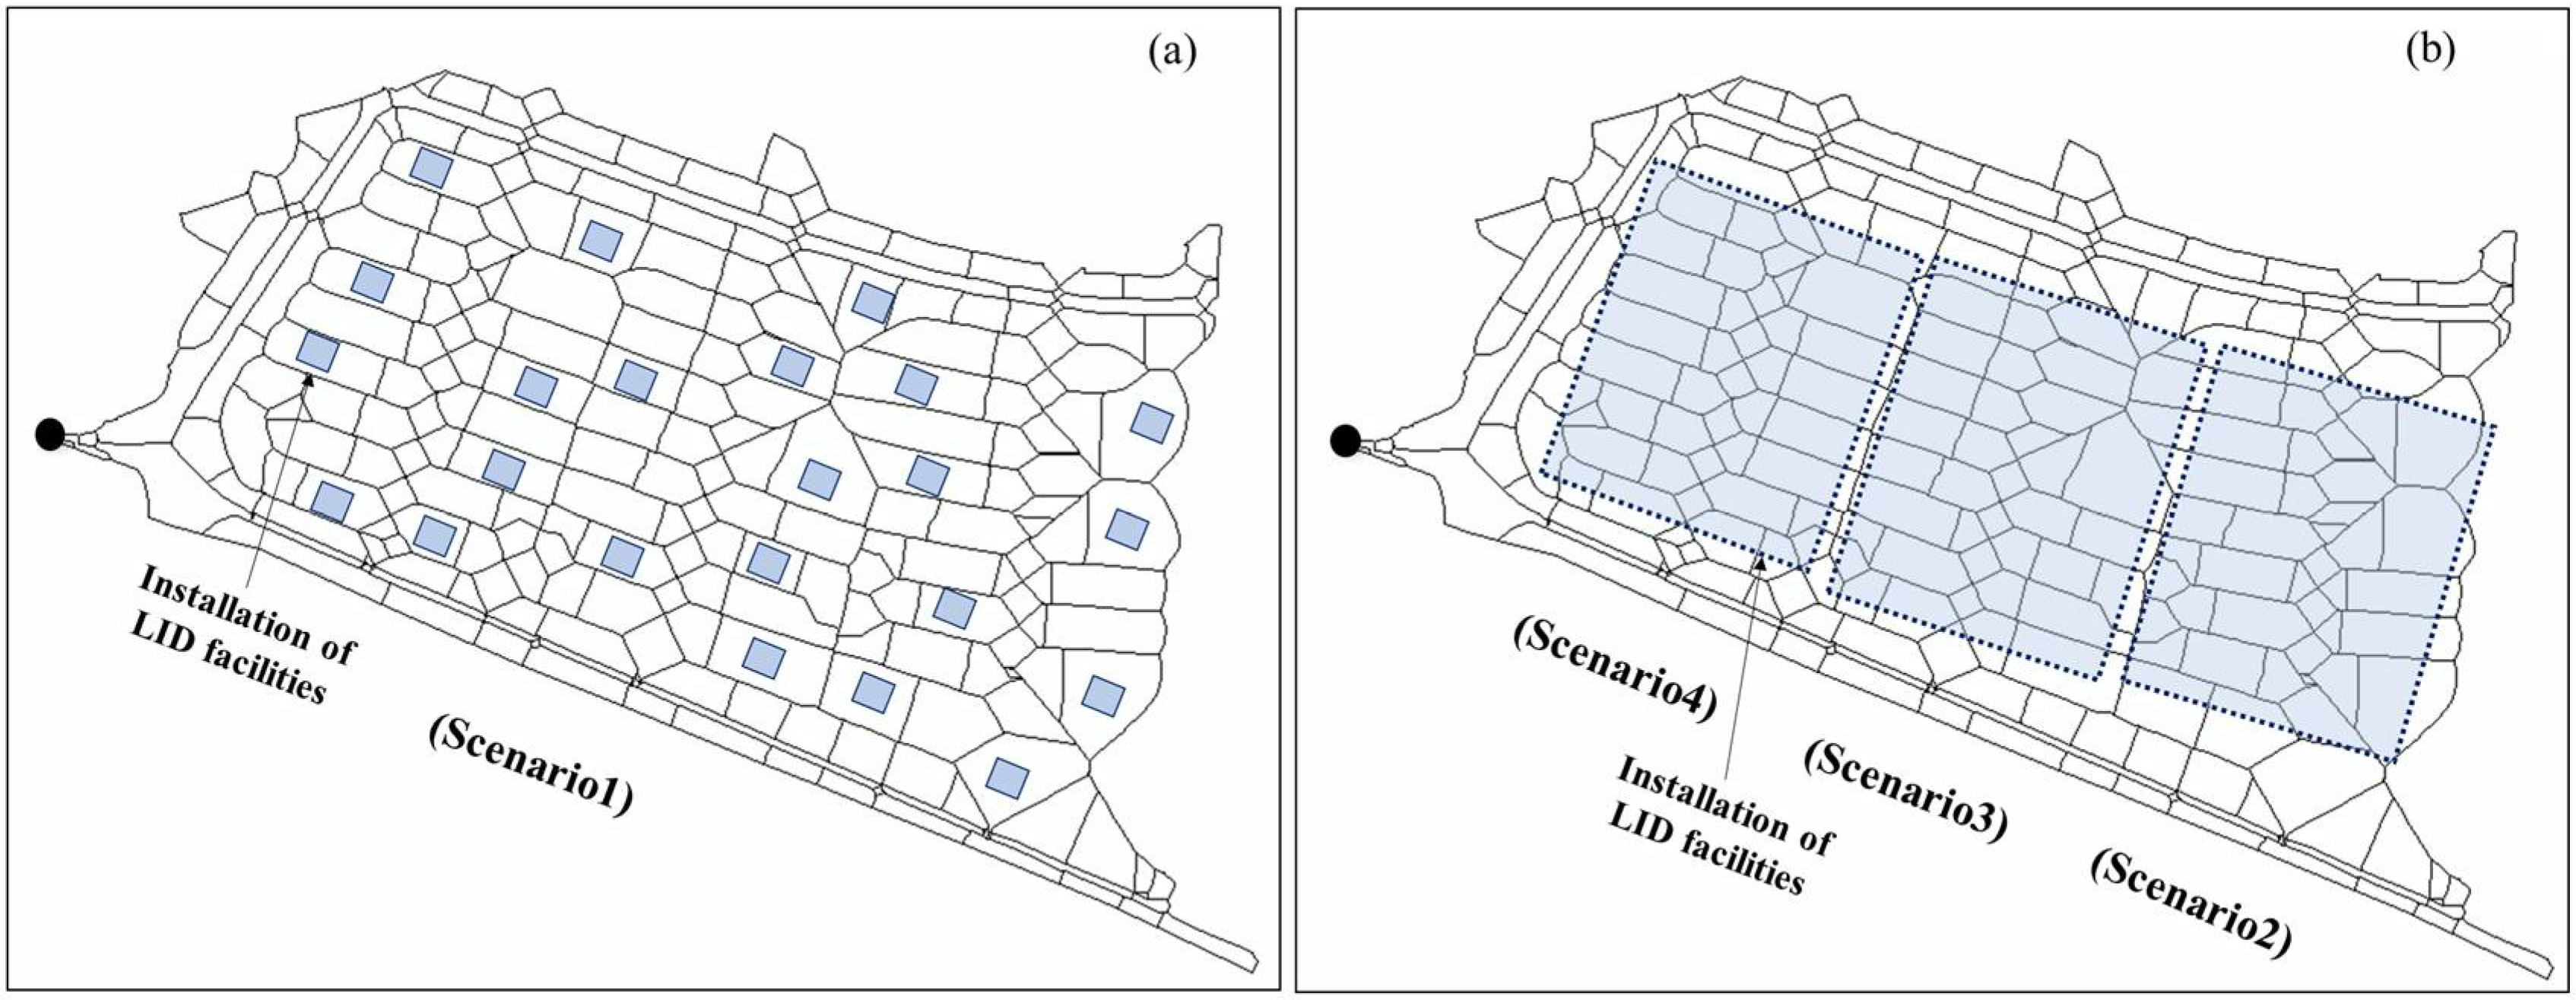
2.5. Evaluation of Runoff and NPS Pollution Loads Estimation from LID Scenarios Application

When NPS pollution reduction facilities are planned, even the same facilities have different amounts of rainfall-runoff and pollution loads depending on the installation location. Thus, the NPS pollution reduction effect may vary. For the effective application of LID facilities in urban areas, they were divided according to the sewer type (combined and separate sewers). Permeable pavements and the Tree Box filter were applied as LID techniques. To compare the spatial distribution of LID facilities, scenarios were divided into the distributed LID application method (scenario 1) and the methods of intensively applying LID at upstream, middle stream, and downstream points used (scenarios 2–4) (Figure 5). In the study area, the LID facilities were applied evenly in the same area (approximately 0.1 km2), as shown in scenarios 1–4. In Scenario 1, LID facilities were applied by distribution, considering the area of each subcatchment in the same area (approximately 0.1 km2). Scenarios 2–4 were divided into upstream, middle stream, and downstream, and the LID facility was applied to the same area (approximately 0.1 km2). The location of LID facilities was applied in the study area, as shown in Figure 5. Therefore, the reduction efficiency under each LID scenario was analyzed for each sewer type, and the runoff and pollution loads were compared.
The scenario reduction rate was applied by referring to the target impervious area ratio (3%) of the third (2021–2025) comprehensive measure for rainfall-runoff NPS management, which has been implemented as a policy task in South Korea [10]. After calculating the impervious area ratio of a total of 242 subcatchments, only the area ratio of 3% was applied by converting the impervious area into the pervious area.

3. Results and Discussion

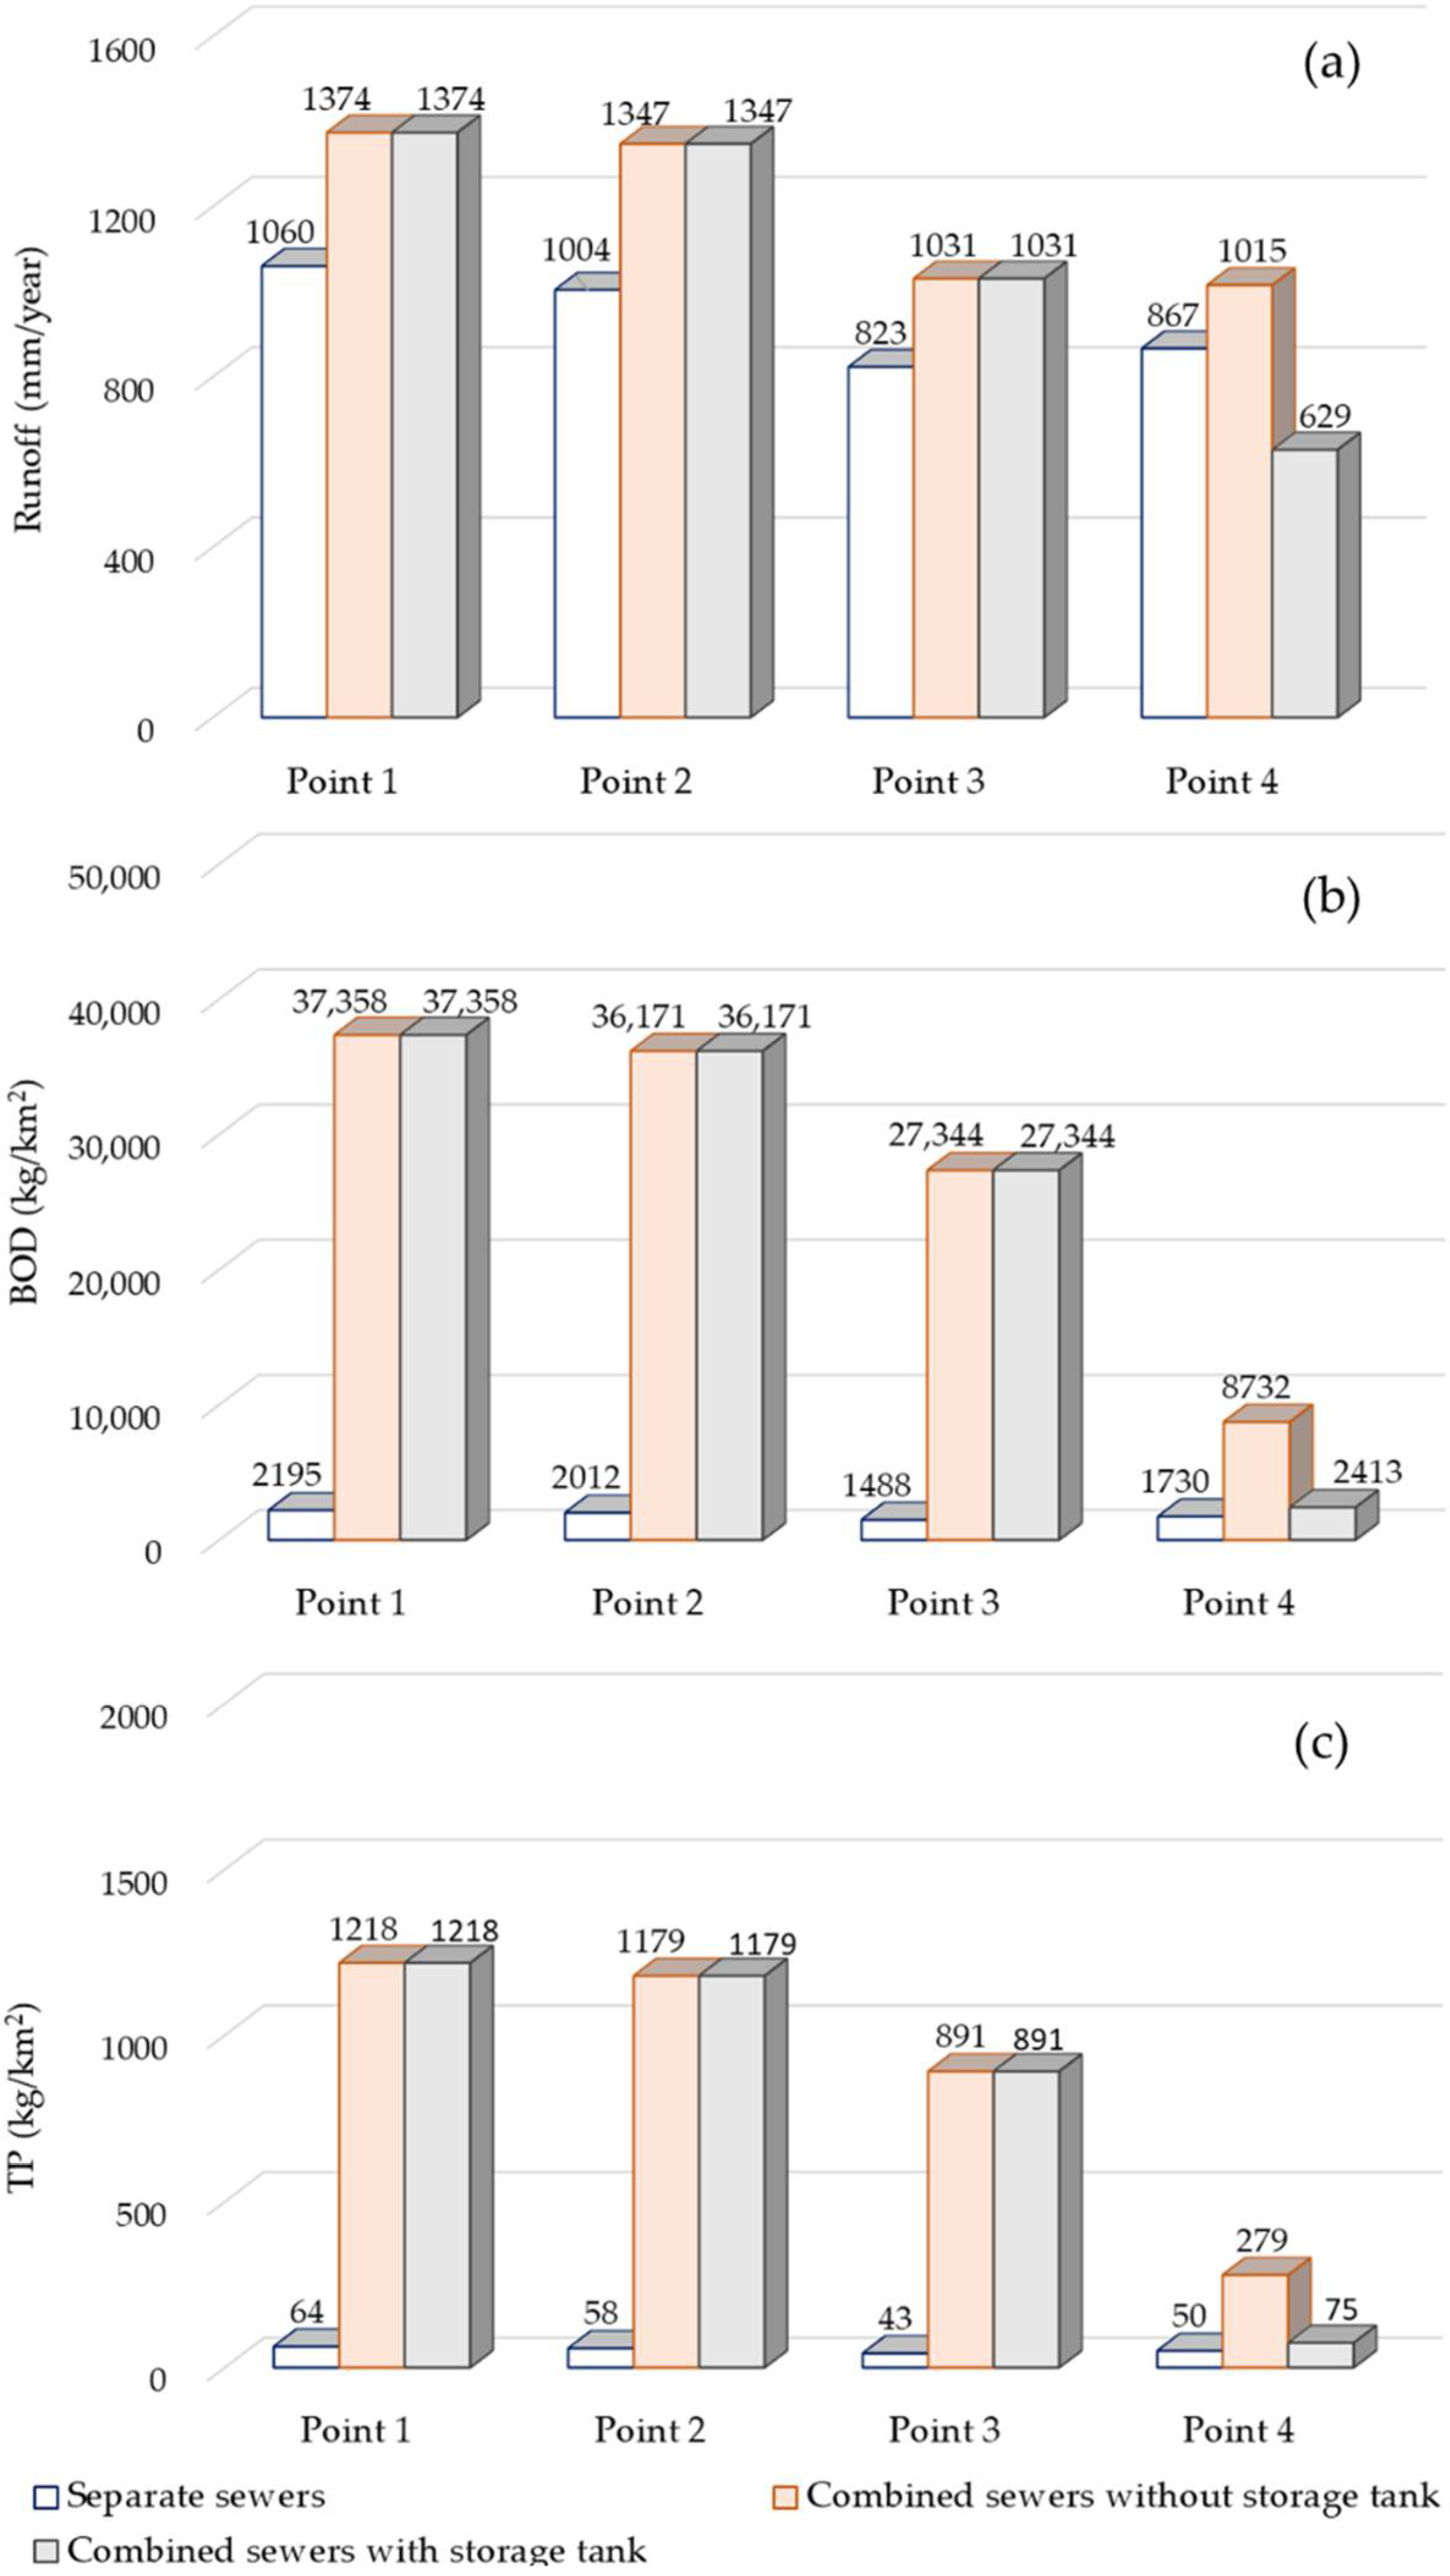
3.1. Comparison of Runoff and NPS Pollution Load by Sewer Type

For the Songpa area in Seoul, which is an urban area, the variability of runoff and pollution loads at each point was simulated considering the characteristics of each sewer type (Figure 6).
Figure 7 shows the results of long-term simulation by SWMM, using the total rainfall of 1284.1 mm in 2018. These results showed that 68% of the rainfall was discharged at the end of the watershed for separate sewers and 49% for combined sewers with storage tank. In the case of combined sewers without storage tank, 79% of the rainfall was discharged at the end of the watershed. Based on the end of the watershed, combined sewers without storage tank showed the highest BOD load followed by combined sewers with storage tank and separate sewers. The TP load results also showed a similar tendency to that of the BOD loads. The results show that the pollution loads of combined sewers were calculated to be higher than those of separate sewers due to the influence of deposited pollutants.
When each drainage area runoff point was analyzed, the runoff and pollution loads were calculated to be large at upstream and midstream points (points 1–3) in the case of combined sewers due to the discharge of sewage into the pipe network. At point 4, the runoff of combined sewers was reduced compared to that of separate sewers due to the influence of the storage tank.

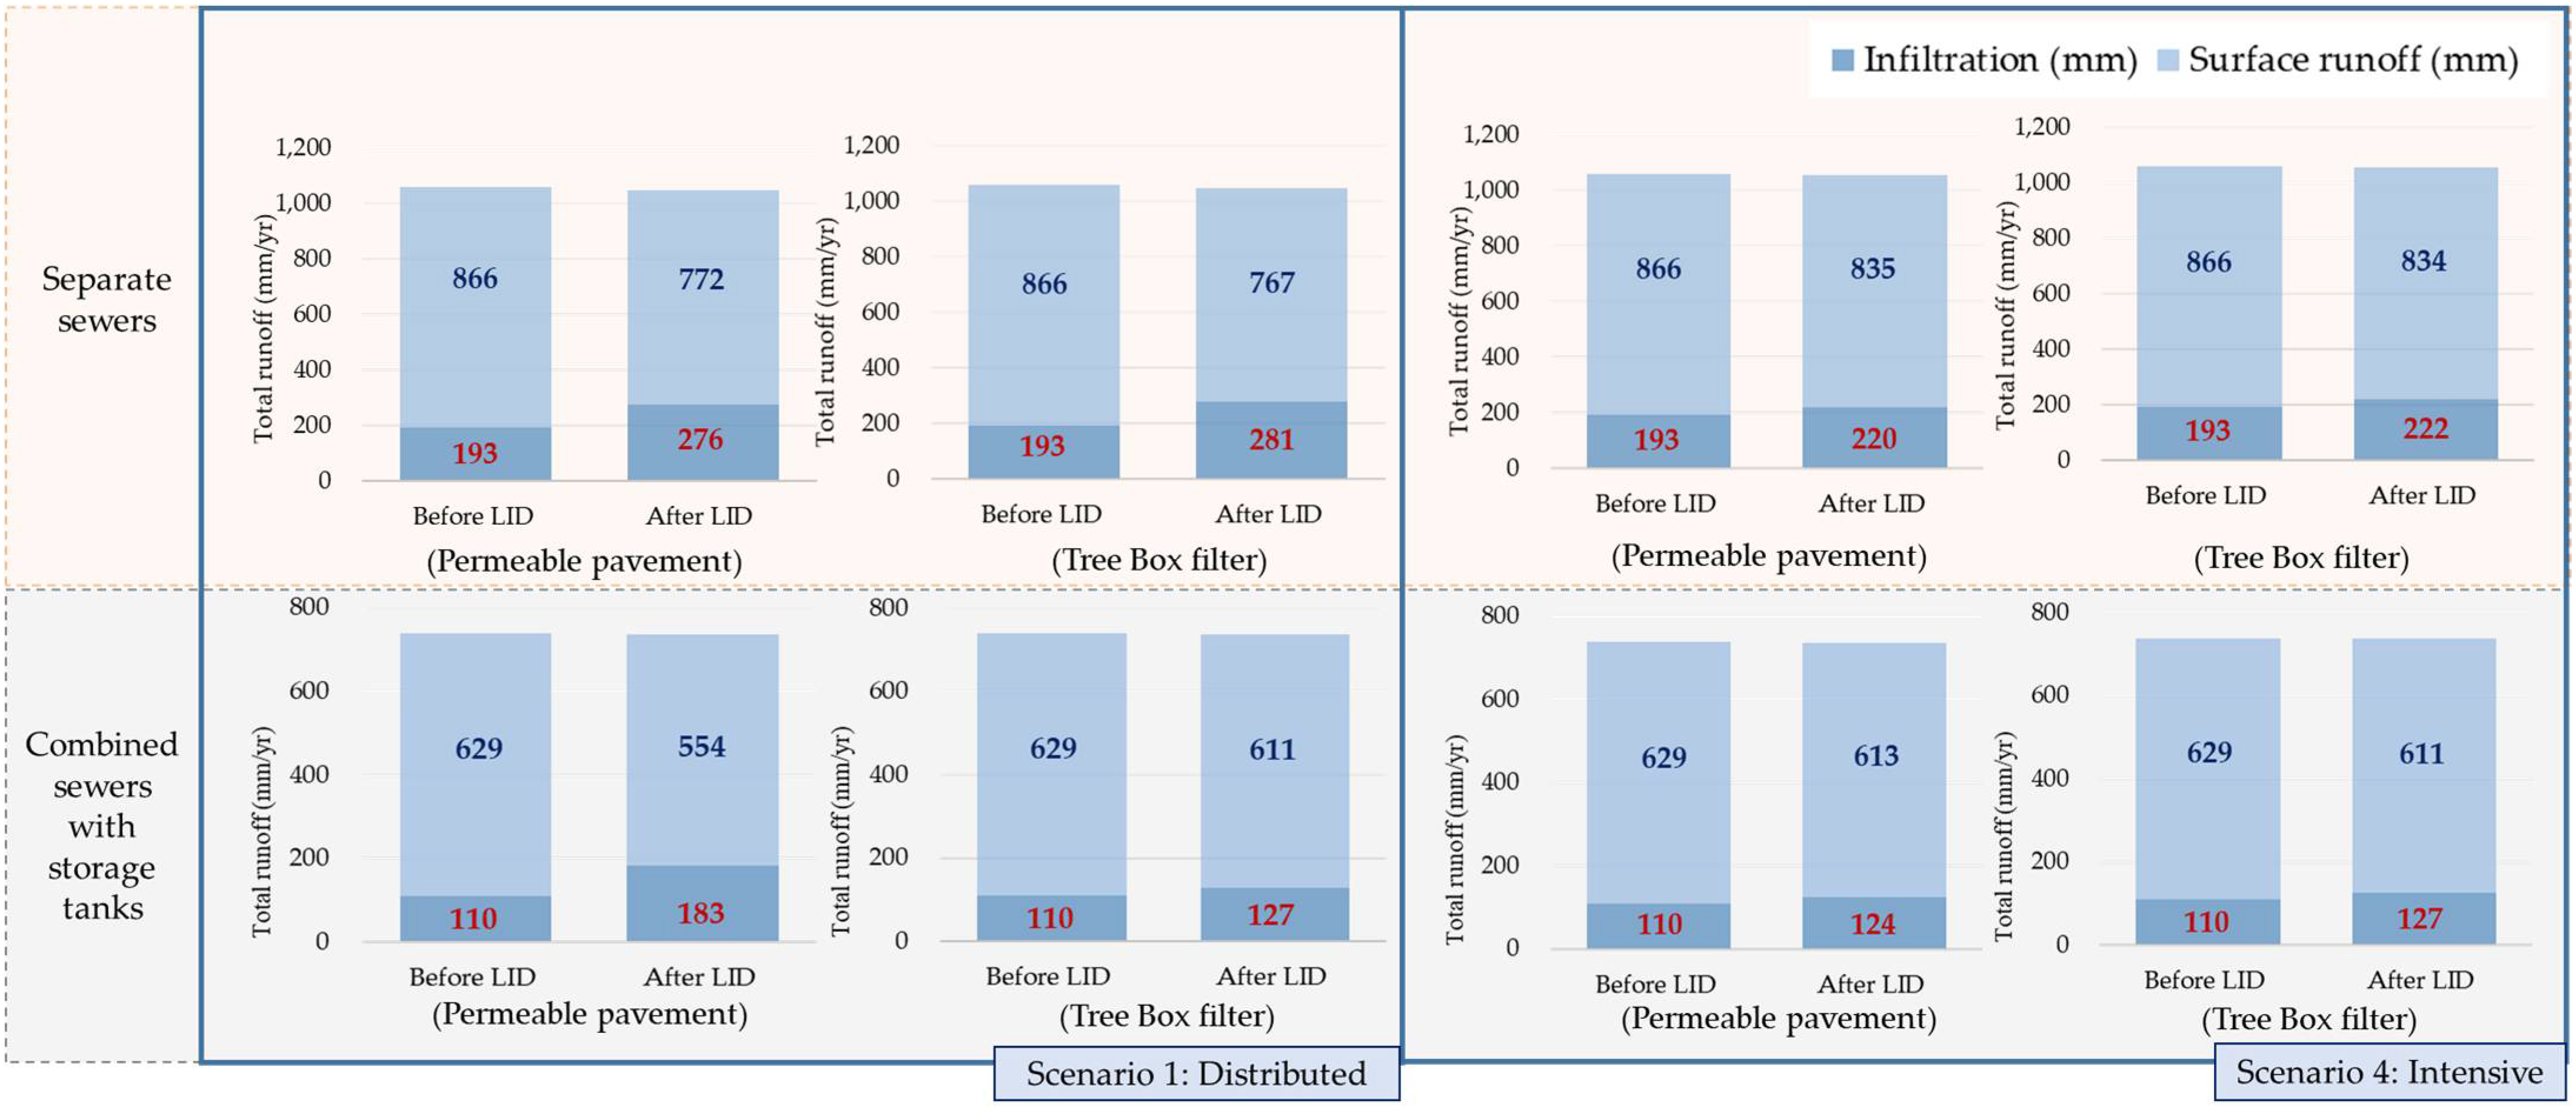
3.2. Analysis of Runoff and NPS Pollution Loads Impacts in LID Scenarios

Table 3 shows the results of analyzing the optimal effect scenarios for the hydrological cycle considering the characteristics of each sewer type and the spatial LID facility distribution. When scenario 1 (distributed LID facility installation in the entire watershed) was applied, the runoff reduction was calculated to be larger than that in scenarios 2–4 (intensive LID facility installation) regardless of the sewer (combined/separate) type. Under scenario 1, the BOD load was reduced by approximately 59–67% for separate sewers, by 76–81% for combined sewers without storage tank, and by 69–76% for combined sewers with storage tank, compared to other scenarios. The TP load reduction showed a similar tendency.
The comparative analysis results for permeable pavements and the Tree Box filter also showed that the reduction of runoff and non-point source pollution load under scenario 1 was more than twice that of other scenarios. Scenario 1 mostly showed a larger runoff reduction when the Tree Box filter was applied than when permeable pavements were applied, and the other scenarios showed no significant difference in reduction. In the virtual watershed, where only different sewer types were applied under the same conditions, combined sewers exhibited larger reductions in runoff and pollution loads than separate sewers under scenario 1. Among scenarios 2–4, larger reductions were observed under scenario 4 (facility installation at downstream areas) than under scenarios 2 and 3 for both separate and combined sewers.
To analyze the hydrological cycle improvement effect, scenarios 1 and 4 were selected, and cases before and after LID application were compared (Figure 8). Under scenario 1, runoff decreased by approximately 12% and infiltration increased by approximately 43–67% after the application of permeable pavements. The Tree Box filter showed hydrological cycle improvement efficiency similar to that of permeable pavements. Under scenario 4, runoff decreased by approximately 3%, and infiltration increased by approximately 13% after the application of permeable pavements. After the application of the Tree Box filter, runoff decreased by approximately 3%, and infiltration increased by approximately 14%. The hydrological cycle improvement effect of scenario 1 was up to four times higher than that of scenario 4. LID application proved effective for recovering the hydrological function as it decreased runoff due to its infiltration and storage functions.
Based on the results of this study, it can be determined that distributed LID rather than intensive LID installation is the optimal NPS management measure. Previous studies have also shown that the peak capacity and pollution loads can be efficiently improved when distributed LID installation is applied to urban areas with a high impervious area ratio [53,54,55,56,57]. Therefore, if the LID installation location is selected in areas with high urban density and a large impervious area in a watershed, reductions in runoff and pollution loads are expected to be high.
If distributed LID application is difficult due to the watershed characteristics, intensive LID application in downstream areas of the watershed is effective. Baek et al. [58] also reported that intensive LID application in downstream areas of an urban-rural watershed is effective. It is necessary to verify the reduction efficiency shown by the results of this study in other areas in future studies.

4. Conclusions

In this study, a virtual watershed was set, and the runoff and pollution loads were evaluated according to the sewer type to respond to the hydrological cycle distortion and NPS problems caused by urbanization in Seoul, South Korea. In addition, the amount of reduction according to the spatial application of LID was analyzed to propose the optimal location and efficiency improvement measures. Therefore, the following conclusions were drawn in this study.
(1)
When the characteristics of each sewer type were simulated, 68% of the rainfall (1284.1 mm) was discharged for separate sewers, 49% for combined sewers with storage tanks, and 79% for combined sewers without a storage tank. Combined sewers without storage tank showed the highest BOD and TP loads, followed by combined sewers with storage tank and separate sewers. Combined sewers exhibited higher pollution loads than separate sewers due to the influence of sewage during rainfall.
(2)
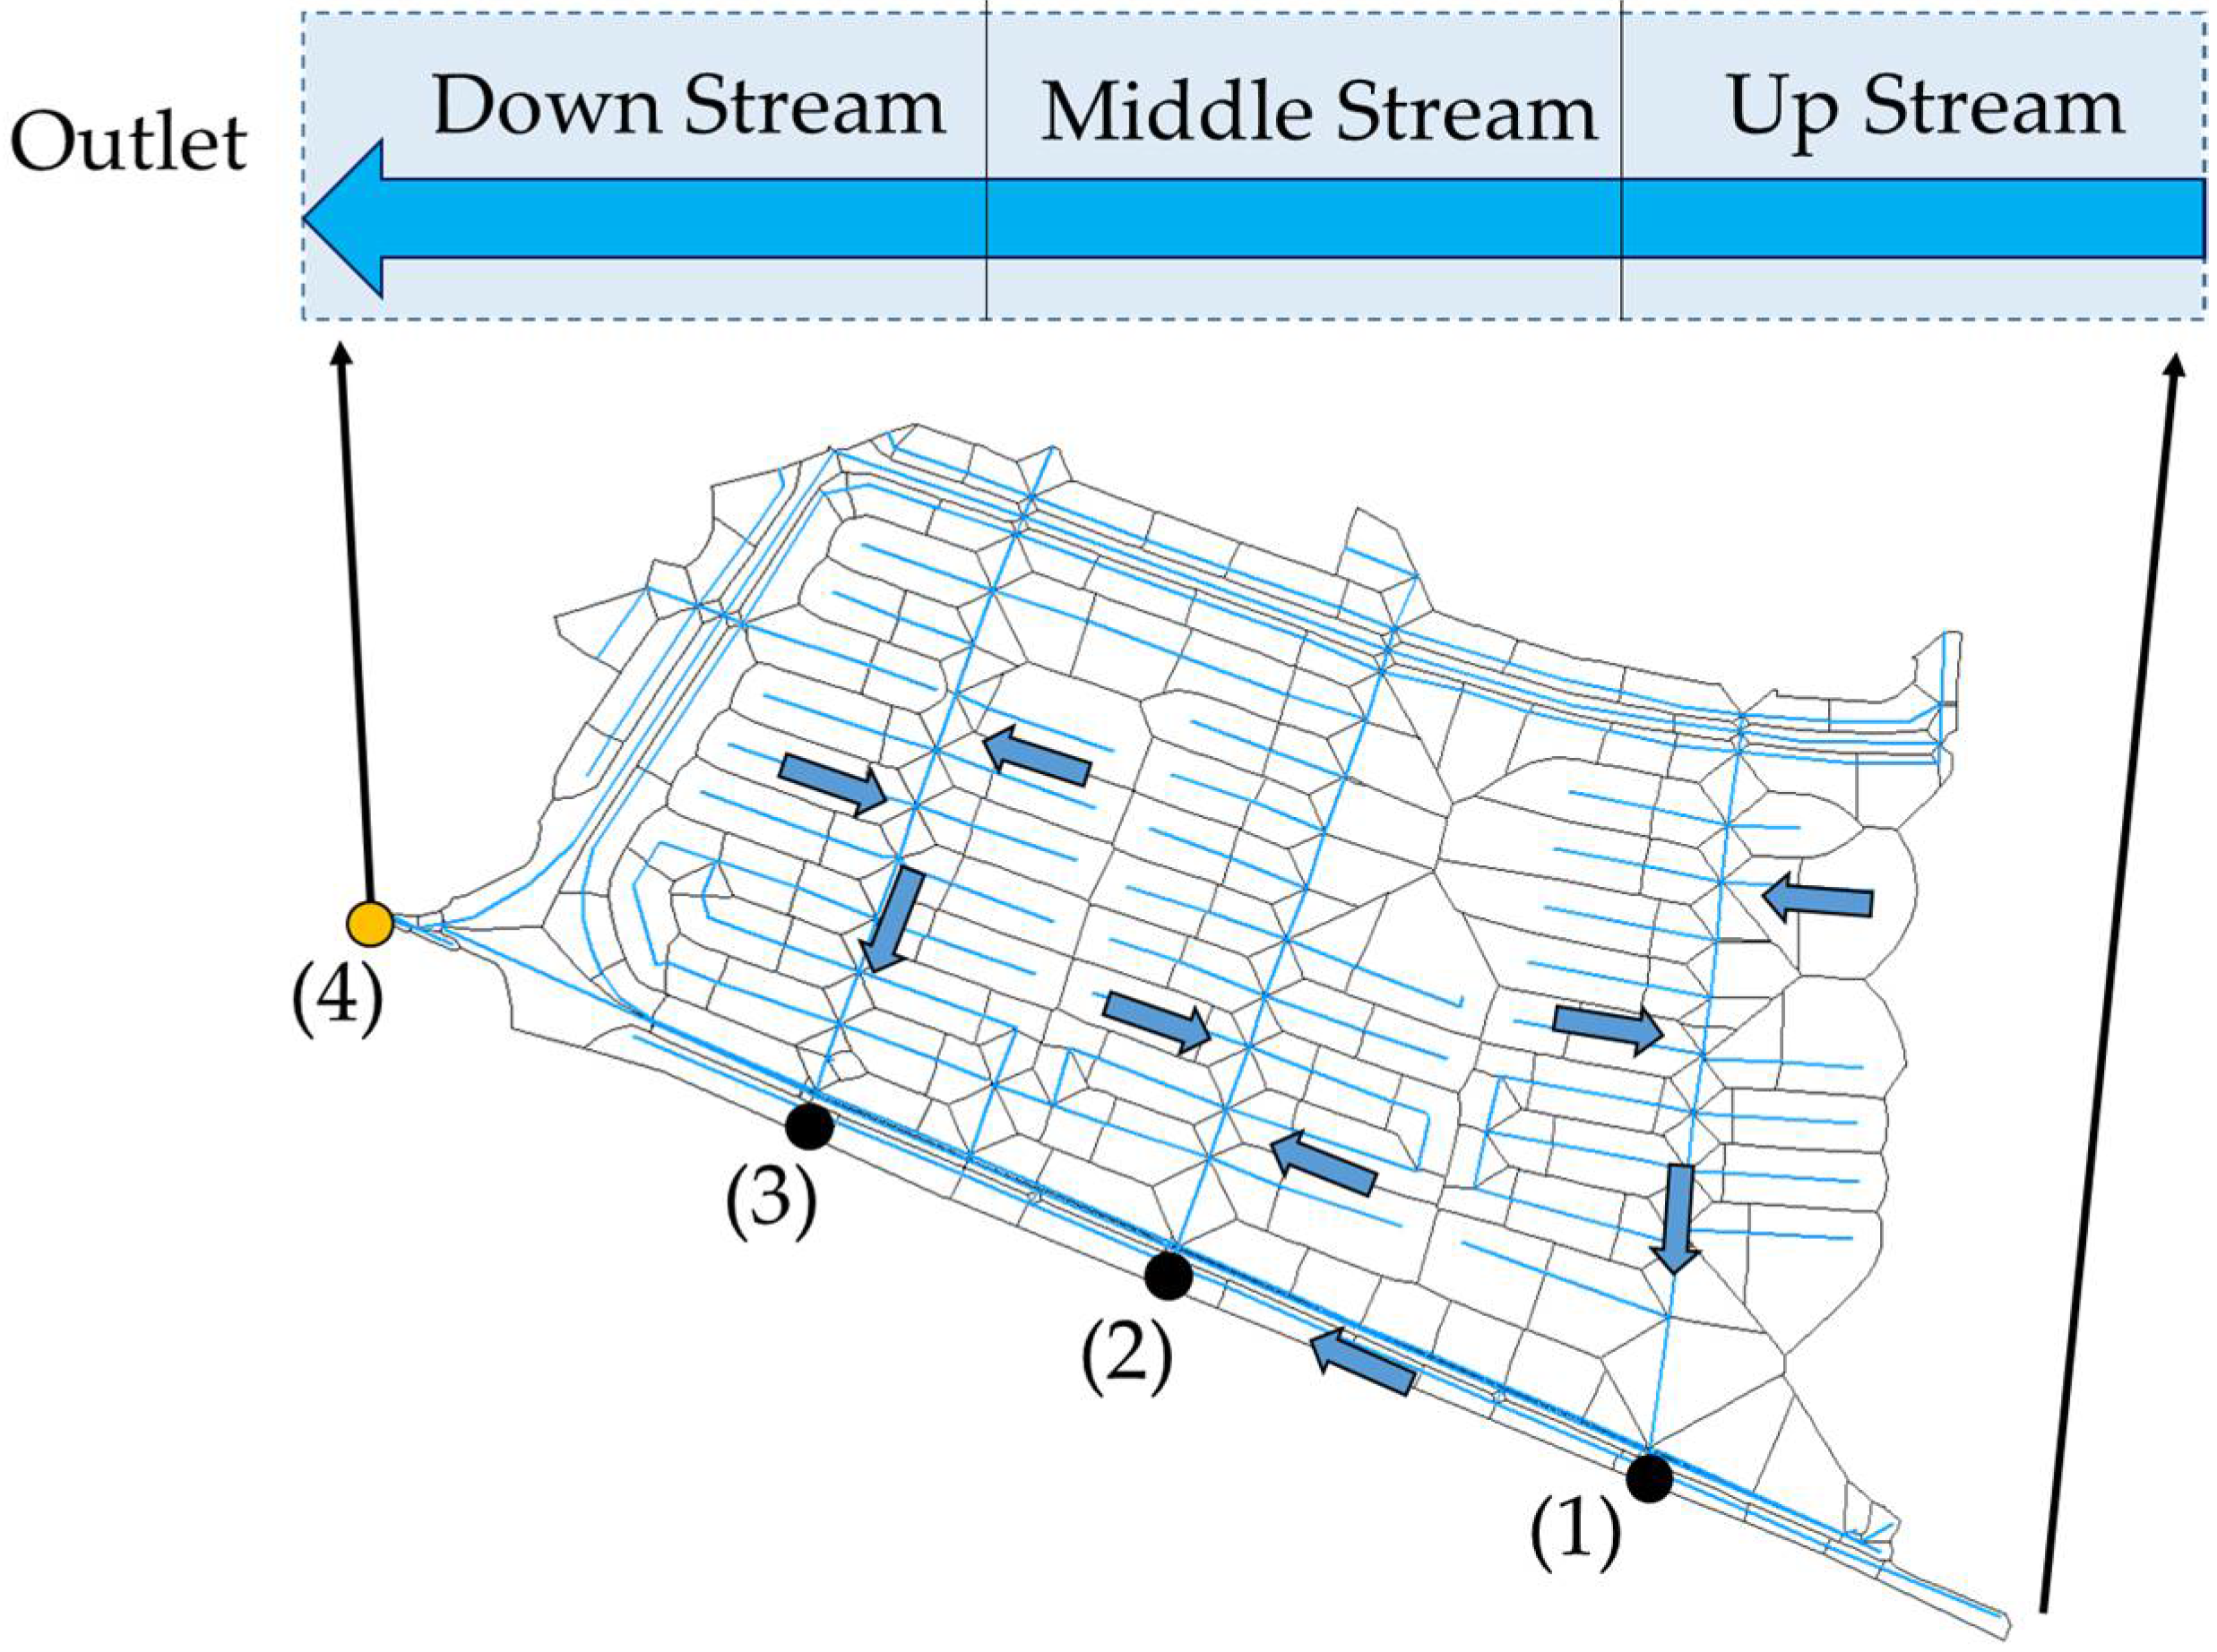
The LID scenario analysis results showed that distributed LID installation, as in scenario 1, was the most effective for minimizing the flow and pollution loads introduced into sewer pipes. Despite differences depending on the sewer type, the hydrological cycle improvement effect was up to four times higher when LID facilities were uniformly distributed in the watershed compared to when they were intensively installed. Furthermore, distributed installation of LID facilities in the combined sewer watershed showed the highest reduction efficiency. When LID facilities were intensively installed in the watershed, installation in downstream areas was more effective than in upstream and midstream areas.
(3)
The application of permeable pavements and the Tree Box filter contributed to the recovery of the hydrological cycle by reducing the runoff, due to infiltration and storage. Under the parameter conditions applied in this study, there was no significant difference in the runoff reduction and water quality improvement effect between permeable pavements and the Tree Box filter. Therefore, future studies will additionally evaluate the effectiveness of permeable pavement and Tree Box filters in other watersheds.
(4)
The results of this study indicate the hydrological cycle improvement effect can be enhanced through the effective installation of LID facilities along with the understanding of sewer characteristics in a watershed. This means that this study contributes a new approach that will use for future urban planning, guide the effective type and distribution of LID facilities, and alleviate runoff and NPS pollution load. These findings can be applied to other areas with a high ratio of impervious surfaces. In future studies, research on effective hydrological cycle improvement will be conducted through further verification in other watersheds, such as dense urban and urban-rural areas. In this study, there is a limitation in analyzing the sewer types and LID facilities with the setting of the virtual watershed compared to the actual watershed. Therefore, In the future study, in the case of an actual watershed, studies on the reasonable parameter estimation of SWMM and watershed characteristics will be considered. The economic effect of LID facility selection planning compared to its cost will be analyzed for each sewer type.

Author Contributions

All authors contributed meaningfully to this study. Conceptualization and methodology, J.L., M.P. and J.H.M.; formal analysis, J.K. and J.M.L.; investigation, J.K. and H.S.J.; writing—original draft preparation, J.L.; writing—review and editing, M.P. and J.H.M.; supervision: J.H.M.; project administration, E.H.N. All authors have read and agreed to the published version of the manuscript.

Funding

This work was supported by a grant from the National Institute of Environmental Research (NIER), funded by the Ministry of Environment (ME) of the Republic of Korea (NIER-2021-01-01-029).

Institutional Review Board Statement

Not applicable.

Informed Consent Statement

Not applicable.

Data Availability Statement

Not applicable.

Conflicts of Interest

The authors declare no conflict of interest.

References

  1. Kaykhoravi, S.; Khan, U.; Jadidi, M. The effect of climate change and urbanization on the demand for low-impact development for three Canadian cities. Water 2020, 12, 1280. [Google Scholar] [CrossRef]
  2. Lee, J.; Lee, S.; Hong, J.; Lee, D.; Bae, J.H.; Yang, J.E.; Kim, J.; Lim, K.J. Evaluation of rainfall erosivity factor estimation using machine and deep learning models. Water 2021, 13, 382. [Google Scholar] [CrossRef]
  3. Lee, J.; Park, Y.S.; Jung, Y.; Cho, J.; Yang, J.E.; Lee, G.; Kim, K.S.; Lim, K.J. Analysis of spatiotemporal changes in groundwater recharge and baseflow using SWAT and BFlow Models. J. Korean Soc. Water Environ. 2014, 30, 549–558. [Google Scholar] [CrossRef]
  4. Lee, J.; Shin, Y.; Park, Y.S.; Kum, D.; Lim, K.J.; Lee, S.O.; Kim, H.; Jung, Y. Estimation and assessment of baseflow at an ungauged watershed according to land use change. Wetl. Res. 2014, 16, 303–318. [Google Scholar]
  5. Xue, J.; Wang, Q.; Zhang, M. A review of non-point source water pollution modeling for the urban-rural transitional areas of China: Research status and prospect. Sci. Total Environ. 2022, 826, 1–13. [Google Scholar] [CrossRef]
  6. Armstrong, D.S.; Richards, T.A.; Levin, S.B. Factor Influencing Riverine Fish Assemblages in Massachusetts; U.S. Geological Survey Scientific Investigations Report; U.S. Geological Survey: Reston, VA, USA, 2011; pp. 2011–5193.
  7. Bellucci, C. Stormwater and aquatic life: Making the connection between impervious cover and aquatic life impairments for TMDL development in Connecticut streams. In Proceedings of the Water Environment Federation TDML Conference, Bellevue, WA, USA, 24–27 June 2007; Water Environment Federation: Alexandria, VA, USA, 2007; pp. 1003–1018. [Google Scholar]
  8. Fogaca, F.N.; Gomes, L.C.; Higuti, J. Percentage of impervious surface soil as indicator of urbanization impacts in neotropical aquatic insects. Neotrop. Entomol. 2013, 42, 483–491. [Google Scholar] [CrossRef]
  9. Scheler, T. The Importance of imperviousness. Watershed Protect. Tech. 1994, 1, 100–111. [Google Scholar]
  10. Zheng, Q.; Hao, L.; Huang, X.; Sun, L.; Sun, G. Effects of urbanization on watershed evapotranspiration and its components in Southern China. Water 2020, 12, 645. [Google Scholar] [CrossRef]
  11. Cosgrove, W.; Loucks, D. Water management: Current and future challenges and research directions. Water Resour. Res. 2015, 51, 4823–4839. [Google Scholar] [CrossRef]
  12. Ryu, J.; Choi, J.Y.; Lee, J.M.; Shin, D.S.; Kim, J.S.; Jang, H.S.; Park, J.H.; Jeong, Y.J.; Ryu, H.D.; Lee, J.K. Customized Policy Support for Nonpoint Pollution Management and Water Circulation Improvement (III); NIER-RP2018–248; National Institute of Environmental Research: Incheon, Korea, 2018; pp. 1–97. [Google Scholar]
  13. Park, M.; Lee, J.M.; Choi, J.Y.; Kim, J.S.; Park, B.K.; Ryu, J.; Lee, S.Y.; Kim, K.H.; Lee, J.K. Customized Policy Support for Nonpoint Pollution Management and Water Circulation Improvement (V); NIER-RP2020-289; National Institute of Environmental Research: Incheon, Korea, 2020; pp. 1–30. [Google Scholar]
  14. Lin, J.Y.; Yuan, T.C.; Chen, C.F. Water retention performance at low-impact development (LID) field sites in Taipei, Taiwan. Sustainability 2021, 13, 759. [Google Scholar] [CrossRef]
  15. Kim, J.M.; Baek, J.S.; Shin, H.S. A study on improvement of hydrologic cycle by selection of LID technology application area. Korea Acad. Ind. 2021, 22, 545–553. [Google Scholar]
  16. Kim, B.S.; Kim, J.M.; Kim, S.S.; Shin, G.W.; Lee, S.J. A study on runoff reduction according to the calculation method of the LID scale considering the land use area and the application of stormwater storage basin. Civ. Environ. Eng. Res. 2021, 41, 229–235. [Google Scholar]
  17. Perez-Pedini, C.; Limbrunner, J.; Vogel, R. Optimal location of infiltration based best management practices for storm water management. J. Water Resour. Plan. Manag. 2005, 131, 441–448. [Google Scholar] [CrossRef]
  18. Joo, J.; Lee, Y.; Cho, H.; Kim, J. Analysis of long-term runoff reduction effects by installation of street tree box. J. Korean Soc. Hazard Mitig. 2012, 12, 193–197. [Google Scholar] [CrossRef] [Green Version]
  19. Shin, H.; Kim, M.; Kim, J.; Jang, J. Study on analysis of the proper ratio and the effects of low impact development application to sewage treatment district. J. Korea Water Resour. Assoc. 2013, 46, 1193–1207. [Google Scholar] [CrossRef]
  20. Park, Y.S.; Lee, J.; Jung, Y.; Shin, M.H.; Park, J.H.; Ryu, J.; Park, J.; Kim, K.S. Evaluation of regression models in LOADEST to estimate suspended solid load in Hangang waterbody. J. Korean Soc. Agric. Eng. 2015, 57, 37–45. [Google Scholar]
  21. Lee, S.; Kim, D.; Maeng, S.; Azam, M.; Lee, B. Runoff reduction effects at installation of LID facilities under different climate change scenarios. Water 2022, 25, 1301. [Google Scholar] [CrossRef]
  22. Jemberie, M.; Melesse, A. Urban flood management through urban land use optimization using LID techniques, city of Addis Ababa, Ethiopia. Water 2021, 13, 1721. [Google Scholar] [CrossRef]
  23. Yeon, J.S.; Kim, S.D.; Choi, H.I.; Shin, H.S.; Kim, E.S. Rainfall runoff reduction analysis for the construction and maintenance costs of LID facilities. J. Korean Soc. Hazard Mitig. 2015, 15, 281–287. [Google Scholar] [CrossRef]
  24. Lee, J.M.; Lee, Y.S.; Choi, J.S. Analysis of water cycle effect according to application of LID techniques. J. Wetl. Res. 2014, 16, 411–421. [Google Scholar] [CrossRef]
  25. Kim, E.S. Analysis of runoff according to application of SWMM_LID element technology (1): Parameter sensitivity analysis. J. Korean Soc. Hazard Mitig. 2020, 20, 437–444. [Google Scholar] [CrossRef]
  26. Park, S.Y.; Lee, K.W.; Park, I.H.; Ha, S.R. Effect of the aggregation level of surface runoff fields and sewer network for a SWMM simulation. Desalination 2008, 226, 328–337. [Google Scholar] [CrossRef]
  27. Kim, J.K.; Son, K.H.; Noh, J.W.; Jang, C.L.; Ko, I.H. Evaluation of urbanization effect and analysis of hydrological characteristics in the Gap River catchment using SWAT. J. Korea Water Resour. Assoc. 2006, 39, 881–901. [Google Scholar]
  28. Duchesne, S.; Mailhot, A.; Dequidt, E.; Villeneuve, J.P. Mathematical modeling of sewer overflows. Urban Water 2001, 3, 241–252. [Google Scholar] [CrossRef]
  29. Temprano, J.; Arango, O.; Cagiao, J.; Suarez, J.; Tejero, I. Stormwater quality calibration by SWMM: A case study in Northern Spain. Water SA 2006, 32, 55–63. [Google Scholar] [CrossRef]
  30. Montalto, F.; Behr, C.; Alfredo, K.; Wolf, M.; Arye, M.; Walsh, M. Rapid assessment of the cost effectiveness of low impact development for CSO Control. Landsc. Urban Plan. 2007, 82, 117–131. [Google Scholar] [CrossRef]
  31. Barco, J.; Wong, K.M.; Stenstorm, M.K. Automatic calibration of the US EPA SWMM model for a large urban catchment. J. Hydraul. Eng. 2008, 134, 466–474. [Google Scholar] [CrossRef]
  32. U.S. Environmental Protection Agency. Storm Water Management Model User’s Manual Version 5.1; U.S. Environmental Protection Agency: Washington, DC, USA, 2015; pp. 1–353.
  33. Abdy Aad, M.P.; Suidan, M.T.; Shuster, W.D. Modeling techniques of best management practices: Rain barrels and rain gardens using EPA SWMM-5. J. Hydrol. Eng. 2009, 15, 434–443. [Google Scholar] [CrossRef]
  34. Lee, Y.J.; Lee, C.Y. Analysis of the inflow characteristics of separate sewer systems for rainfall using an XP-SWMM Model and the SSOAP toolbox. J. Korean Soc. Hazard Mitig. 2021, 21, 271–280. [Google Scholar] [CrossRef]
  35. Park, M.; Lee, J.M.; Kim, J.S.; Lee, J.; Jang, H.S.; Shin, D.S.; Min, J.H.; Kim, K.H.; Kim, Y.S. Customized Policy Support for Nonpoint Pollution Management and Water Circulation Improvement (VI); NIER-RP2020-289; National Institute of Environmental Research: Incheon, Korea, 2021; pp. 1–30. [Google Scholar]
  36. Lee, H.W.; Choi, J.H. Analysis of rainfall-runoff characteristics in Shiwha industrial watershed using SWMM. J. Korean Soc. Environ. Eng. 2015, 37, 14–22. [Google Scholar] [CrossRef]
  37. Chae, J.Y. Study of Runoff Management Scheme in Urbanization Area Using XP-SWMM. Master’s Thesis, Paichai University, Daejeon, Korea, 2004. [Google Scholar]
  38. National Institute of Environmental Research. Evaluation of Non-Point Sources Loading (1) Impervious Land; NIER NO. 2006-34-816; Environmental Cap System Research Department, National Institute of Environmental Research: Incheon, Korea, 2006; p. 18. [Google Scholar]
  39. James, W.; Huber, W.C.; Dickinson, R.E.; Pitt, R.E.; James, W.R.C.; Roesner, L.A.; Aldrich, J.A. Users Guide to SWMM; CHI: Toronto, ON, Canada, 2005. [Google Scholar]
  40. Kang, T.; Lee, S. Development on an automatic calibration module of the SWMM for watershed runoff simulation and water quality simulation. J. Korea Water Resour. Assoc. 2014, 47, 343–356. [Google Scholar] [CrossRef]
  41. Lee, J.J.; Kim, H.N. Analysis of rainfall runoff reduction effect depending upon the location of detention pond in urban area. J. Korea Water Resour. Assoc. 2008, 28, 535–546. [Google Scholar]
  42. Yeon, J.S.; Jang, Y.S.; Lee, J.H.; Shin, H.S.; Kim, E.S. Analysis of stormwater runoff characteristics for spatial distribution of LID element techniques using SWMM. J. Korea Acad. Ind. Coop. Soc. 2014, 15, 3983–3989. [Google Scholar]
  43. Bae, D.H.; Jang, M.S. Development of adjusted subcatchment with equation in SWMM. J. Korea Water Resour. Assoc. 2009, 42, 105–115. [Google Scholar] [CrossRef]
  44. Lee, S.H.; Yoon, S.E.; Lee, J.J. A study on the determination of location of the detention pond in trunk sewer for reducing runoff amounts. J. Korea Water Resour. Assoc. 2017, 50, 223–232. [Google Scholar]
  45. Rossman, L.A. Storm Water Management Model User’s Manual Version 5.1; United States Environmental Protection Agency, Water Supply and Water Resources Division, National Risk Management Research Laboratory: Cincinnati, OH, USA, 2015.
  46. Center for Watershed Protection Technical Memorandum. The Runoff Reduction Method (CWPCSN). Appendix B—Derivation of Runoff Reduction Rates for Select BMPs; Center for Watershed Protection & Stormwater Network: Ellicott City, MD, USA, 2008; pp. B1–B11. [Google Scholar]
  47. Curtis, H. Low Impact Development Technical Guidance Manual for Puget Sound; Washington State University Pierce county Extension, Puget Sound Action Team: Tacoma, WA, USA, 2005; pp. 1–246.
  48. Geronimo, F.K.; Hong, J.; Kim, L.H. Hydrologic and hydraulic factors affecting the long term treatment performance of an urban stormwater tree box filter. J. Korean Soc. Water Environ. 2017, 33, 715–721. [Google Scholar]
  49. Brattebo, B.O.; Booth, D.B. Long-term stormwater quantity and quality performance of permeable pavement systems. Water Res. 2003, 37, 4369–4376. [Google Scholar] [CrossRef]
  50. Abbott, C.L.; Comino-Mateos, L. In-situ hydraulic performance of a permeable pavement sustainable urban drainage system. Water Environ. J. 2003, 17, 187–190. [Google Scholar] [CrossRef]
  51. Vailancourt, C.; Duchesne, S.; Pelletier, G. Hydrologic performance of permeable pavement as an adaptive measure in urban areas: Case studies near Montreal, Canada. J. Hydrol. Eng. 2019, 24, 1–10. [Google Scholar] [CrossRef]
  52. Geronimo, F.K.; Maniquiz-Redillas, M.C.; Hong, J.; Kim, L.H. Investigation on the factors affecting urban stormwater management performance of bioretention systems. J. Korean Soc. Water Environ. 2017, 33, 1–7. [Google Scholar]
  53. Hyun, K.H.; Kim, J.G.; Lee, J.M.; Lee, E.Y.; Kim, S.G.; Choo, Y.W.; Yoo, J.E. Installation Manual and Monitoring of LID-Decentralized Rainwater Management Facilities in Asan Tangjung; Land & Housing Institute: Daejeon, Korea, 2012. [Google Scholar]
  54. Zhang, K.; Chui, T.F.M. A comprehensive review of spatial allocation of LID=BMP-GI practices: Strategies and optimization tools. Sci. Total Environ. 2018, 621, 915–929. [Google Scholar] [CrossRef] [PubMed]
  55. Bakhshipour, A.E.; Dittmer, U.; Haghighi, A.; Nowak, W. Hybrid green-blue-gray decentralized urban drainage system design, a simulation-optimization framework. J. Environ. Manag. 2019, 249, 109364. [Google Scholar] [CrossRef] [PubMed]
  56. Wang, M.; Zhang, Y.; Zhang, D.; Zheng, Y.; Li, S.; Tan, S.K. Life-cycle cost analysis and resilience consideration for coupled grey infrastructure and low impact development practices. Sustain. Cities Soc. 2021, 75, 103358. [Google Scholar] [CrossRef]
  57. Roseen, R.; Ballestero, T.; Houle, J.; Avelleneda, P.; Wildey, R.; Briggs, J. Storm water low impact development, conventional structural, and manufactured treatment strategies for parking lot runoff: Performance evaluations under varied mass loading conditions. Transp. Res. Rec. 2006, 1984, 135–147. [Google Scholar] [CrossRef]
  58. Baek, J.; Kim, B.; Lee, S.; Kim, H. A study on application of LID technology for improvement of drainage capacity of sewer network in urban watershed. J. Korean Soc. Water Environ. 2017, 33, 617–625. [Google Scholar]
Figure 1. The procedure of this study.
Water 14 02776 g001
Figure 2. Location and boundaries of the study area.
Water 14 02776 g002
Figure 3. Land-use of the study area.
Water 14 02776 g003
Figure 4. Sewer types (Combined sewers without storage tank, separate sewers, Combined sewers with storage tank) network.
Water 14 02776 g004
Figure 5. Application of scenarios for optimal effects analysis. (a) Distributed low intensity development (LID) installation (scenario 1) and (b) intensive LID installation (scenarios 2–4).
Water 14 02776 g005
Figure 6. Runoff and NPS pollution loads at each point.
Water 14 02776 g006
Figure 7. Simulation results of runoff and NPS pollutant load with different sewer types. (a) runoff; (b) BOD pollutant load; (c) TP pollutant load.
Water 14 02776 g007
Figure 8. Comparison of improvement for hydrological components by using LID.
Water 14 02776 g008
Table 1. Runoff Reduction for various LID facilities.
LID FacilitiesGrass ChannelGreen RooftopInfiltrationPermeable PavementRooftop
Disconnection
Runoff
Reduction (%)
10 to 2045 to 6050 to 9045 to 7525 to 50
Table 2. LID parameters in SWMM.
LayerParameterPermeable
Pavement
Tree Box Filter
SurfaceBerm height (mm)100100
Vegetation volume fraction00
Surface roughness0.0120.13
Surface slope (%)21
Swale side slope55
PavementThickness (mm)60Not applicable
Void ratio (voids/solids)0.2
Impervious surface fraction0
Permeability (mm/h)13
Clogging factor0
SoilThickness (mm)Not applicable800
Porosity0.437
Field capacity0.062
Wilting point0.024
Conductivity (mm/h)120
Conductivity slope30
Suction head (mm)49
StorageThickness (mm)200300
Void ratio (voids/solids)0.50.5
Seepage rate (mm/h)1313
Clogging factor00
Table 3. Reduction efficiency analysis results by LID scenario.
ItemScenarioClassificationSeparate SewersCombined Sewers
with Storage Tank
Combined Sewers
without Storage Tank
Permeable PavementTree
Box Filter
Permeable PavementTree
Box Filter
Permeable PavementTree
Box Filter
Runoff
(mm)
1Distributed92.9 98.5 93.7 100.6 114.2 121.2
2IntensiveUpstream41.0 42.319.2 20.623.625.0
3Midstream39.3 40.818.9 20.4 23.324.8
4Downstream46.4 48.022.6 24.4 28.030.0
BOD
(kg/km2)
1Distributed192.3 204.0250.7263.4435.7450.6
2IntensiveUpstream66.669.3 61 64 84.687.8
3Midstream63.3 66.7 59 63 83.286.9
4Downstream77.3 80.7 78 82 104.0107.1
TP
(kg/km2)
1Distributed5.6 5.9 8.1 8.5 14.114.6
2IntensiveUpstream1.9 2.0 1.9 2.0 2.72.8
3Midstream1.8 2.0 1.8 1.9 2.62.7
4Downstream2.2 2.3 2.4 2.53.43.5
Publisher’s Note: MDPI stays neutral with regard to jurisdictional claims in published maps and institutional affiliations.

