


Implementation of Quantitative Resilience Measurement Criteria in Irrigation Systems


 and
and 
Abstract
:1. Introduction
2. Methodology
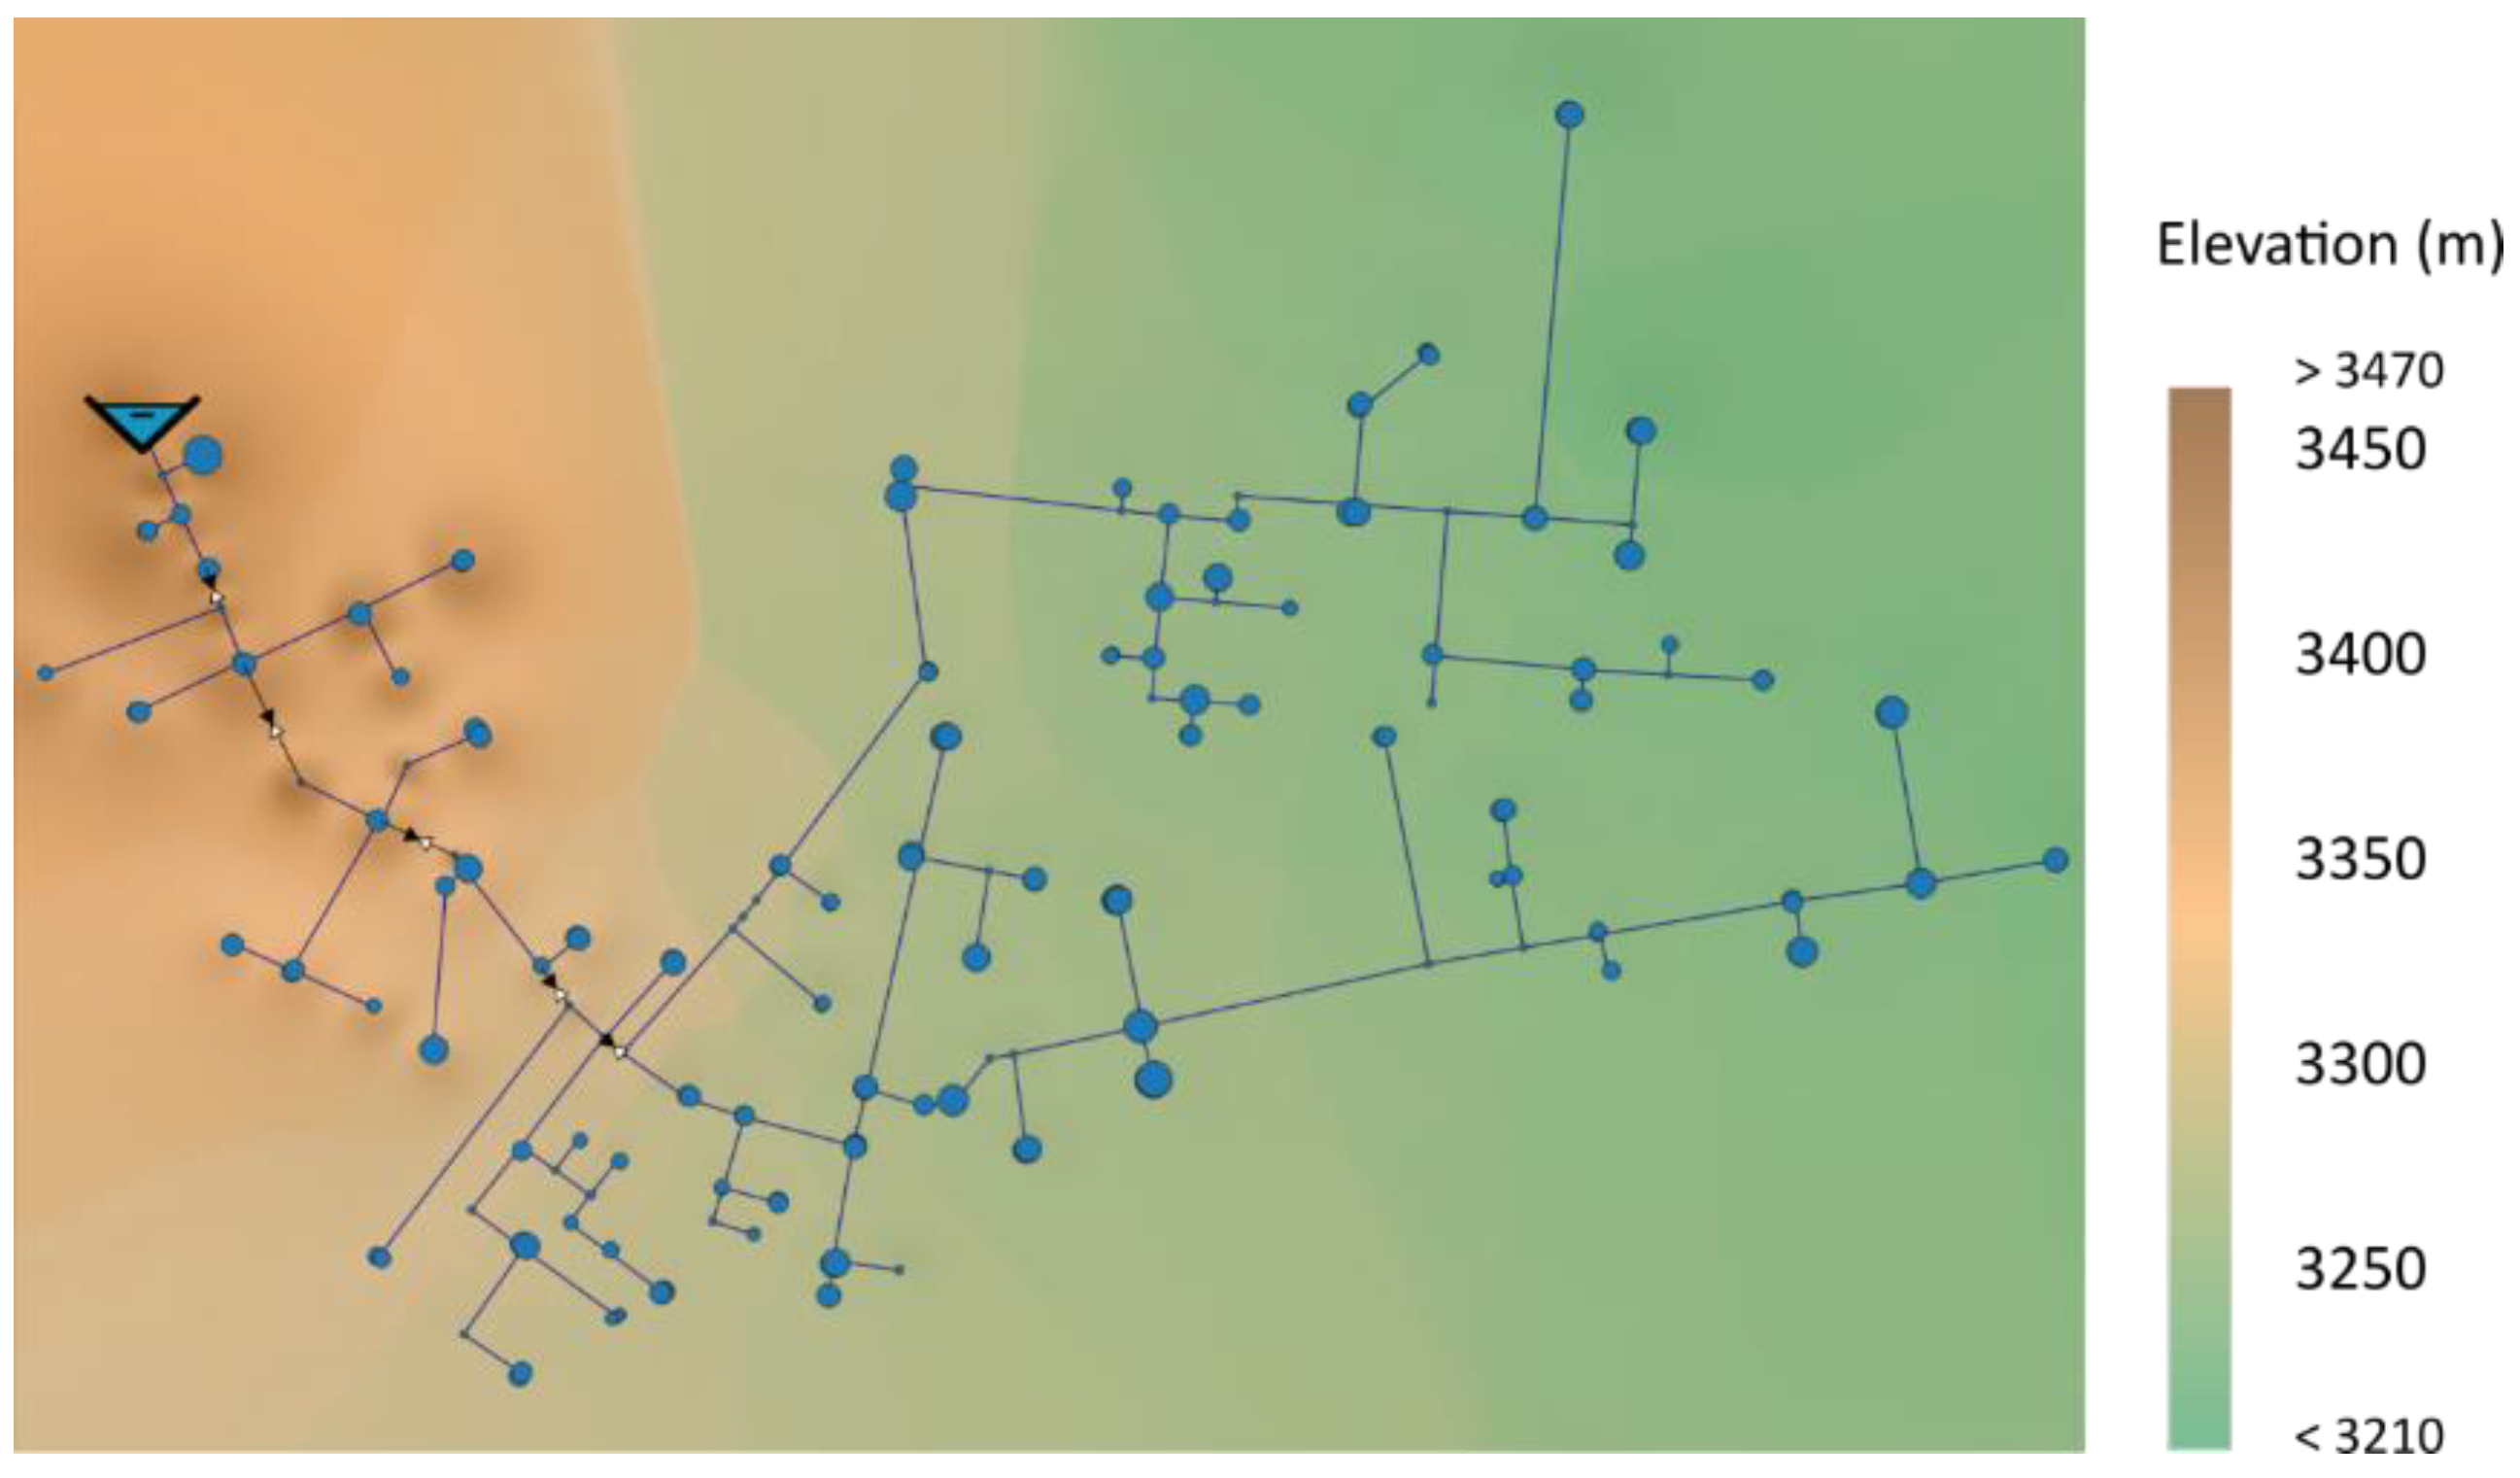
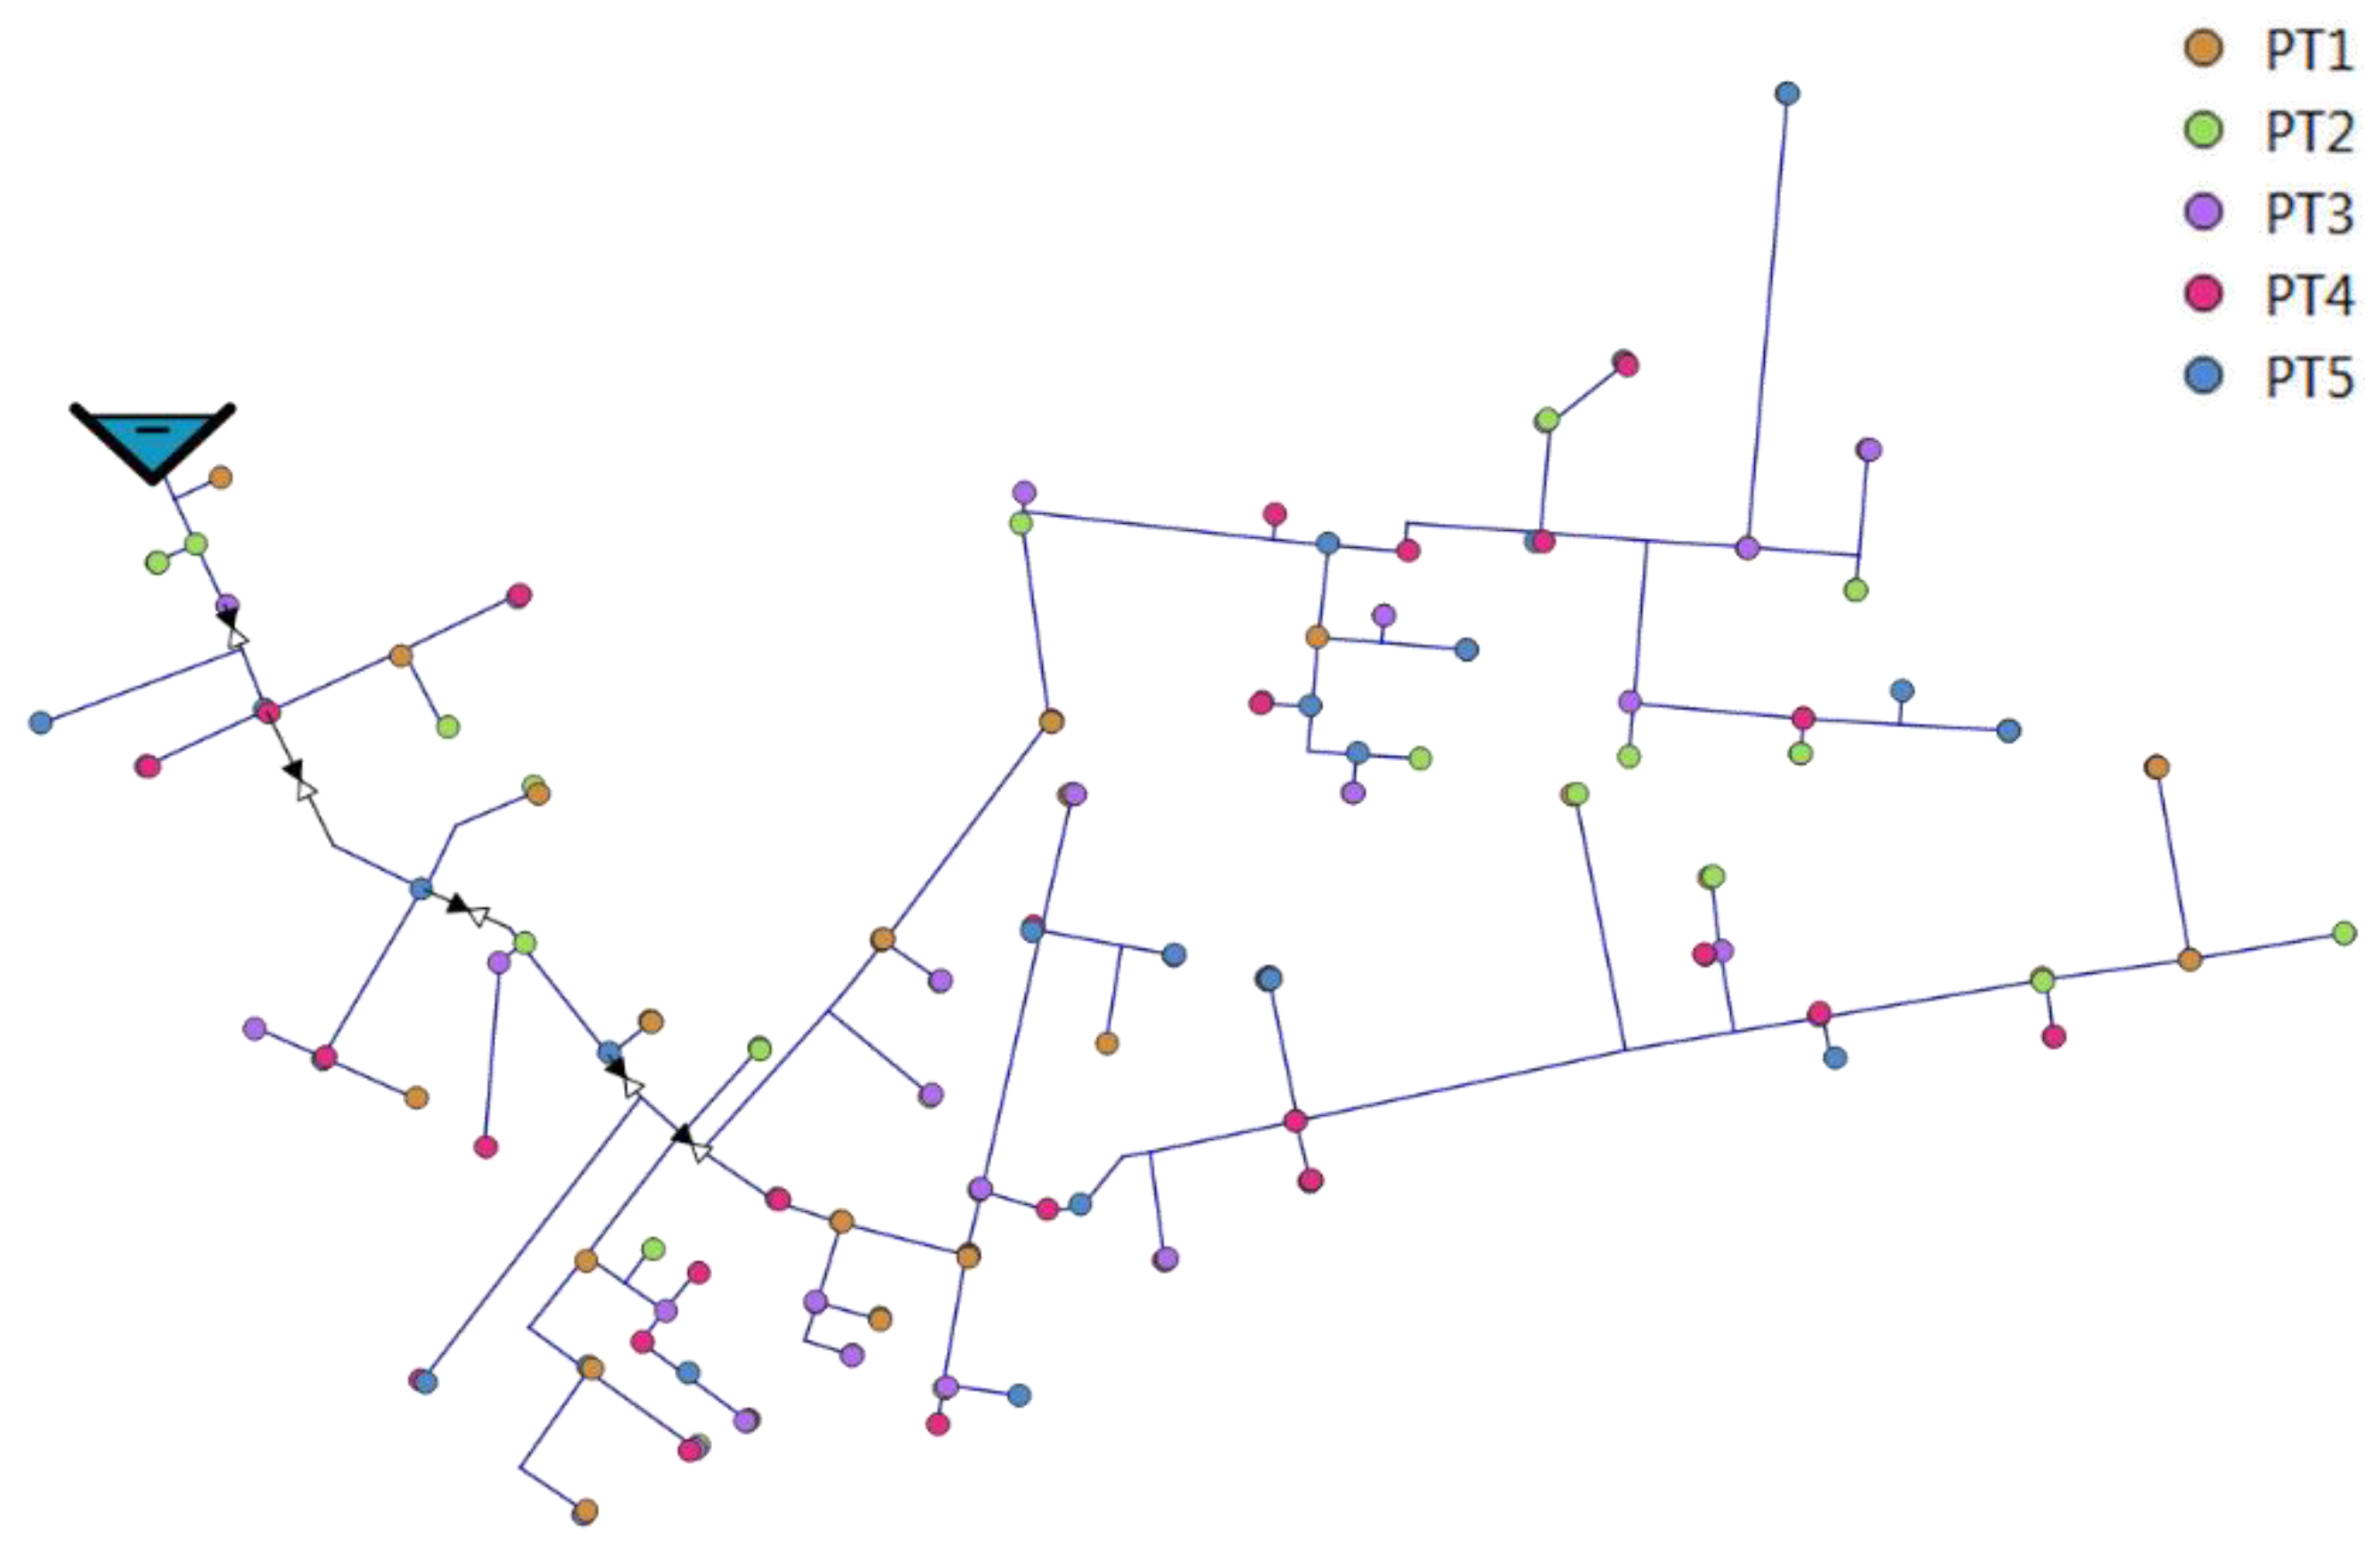
2.1. Field of Study
2.2. Data and Materials
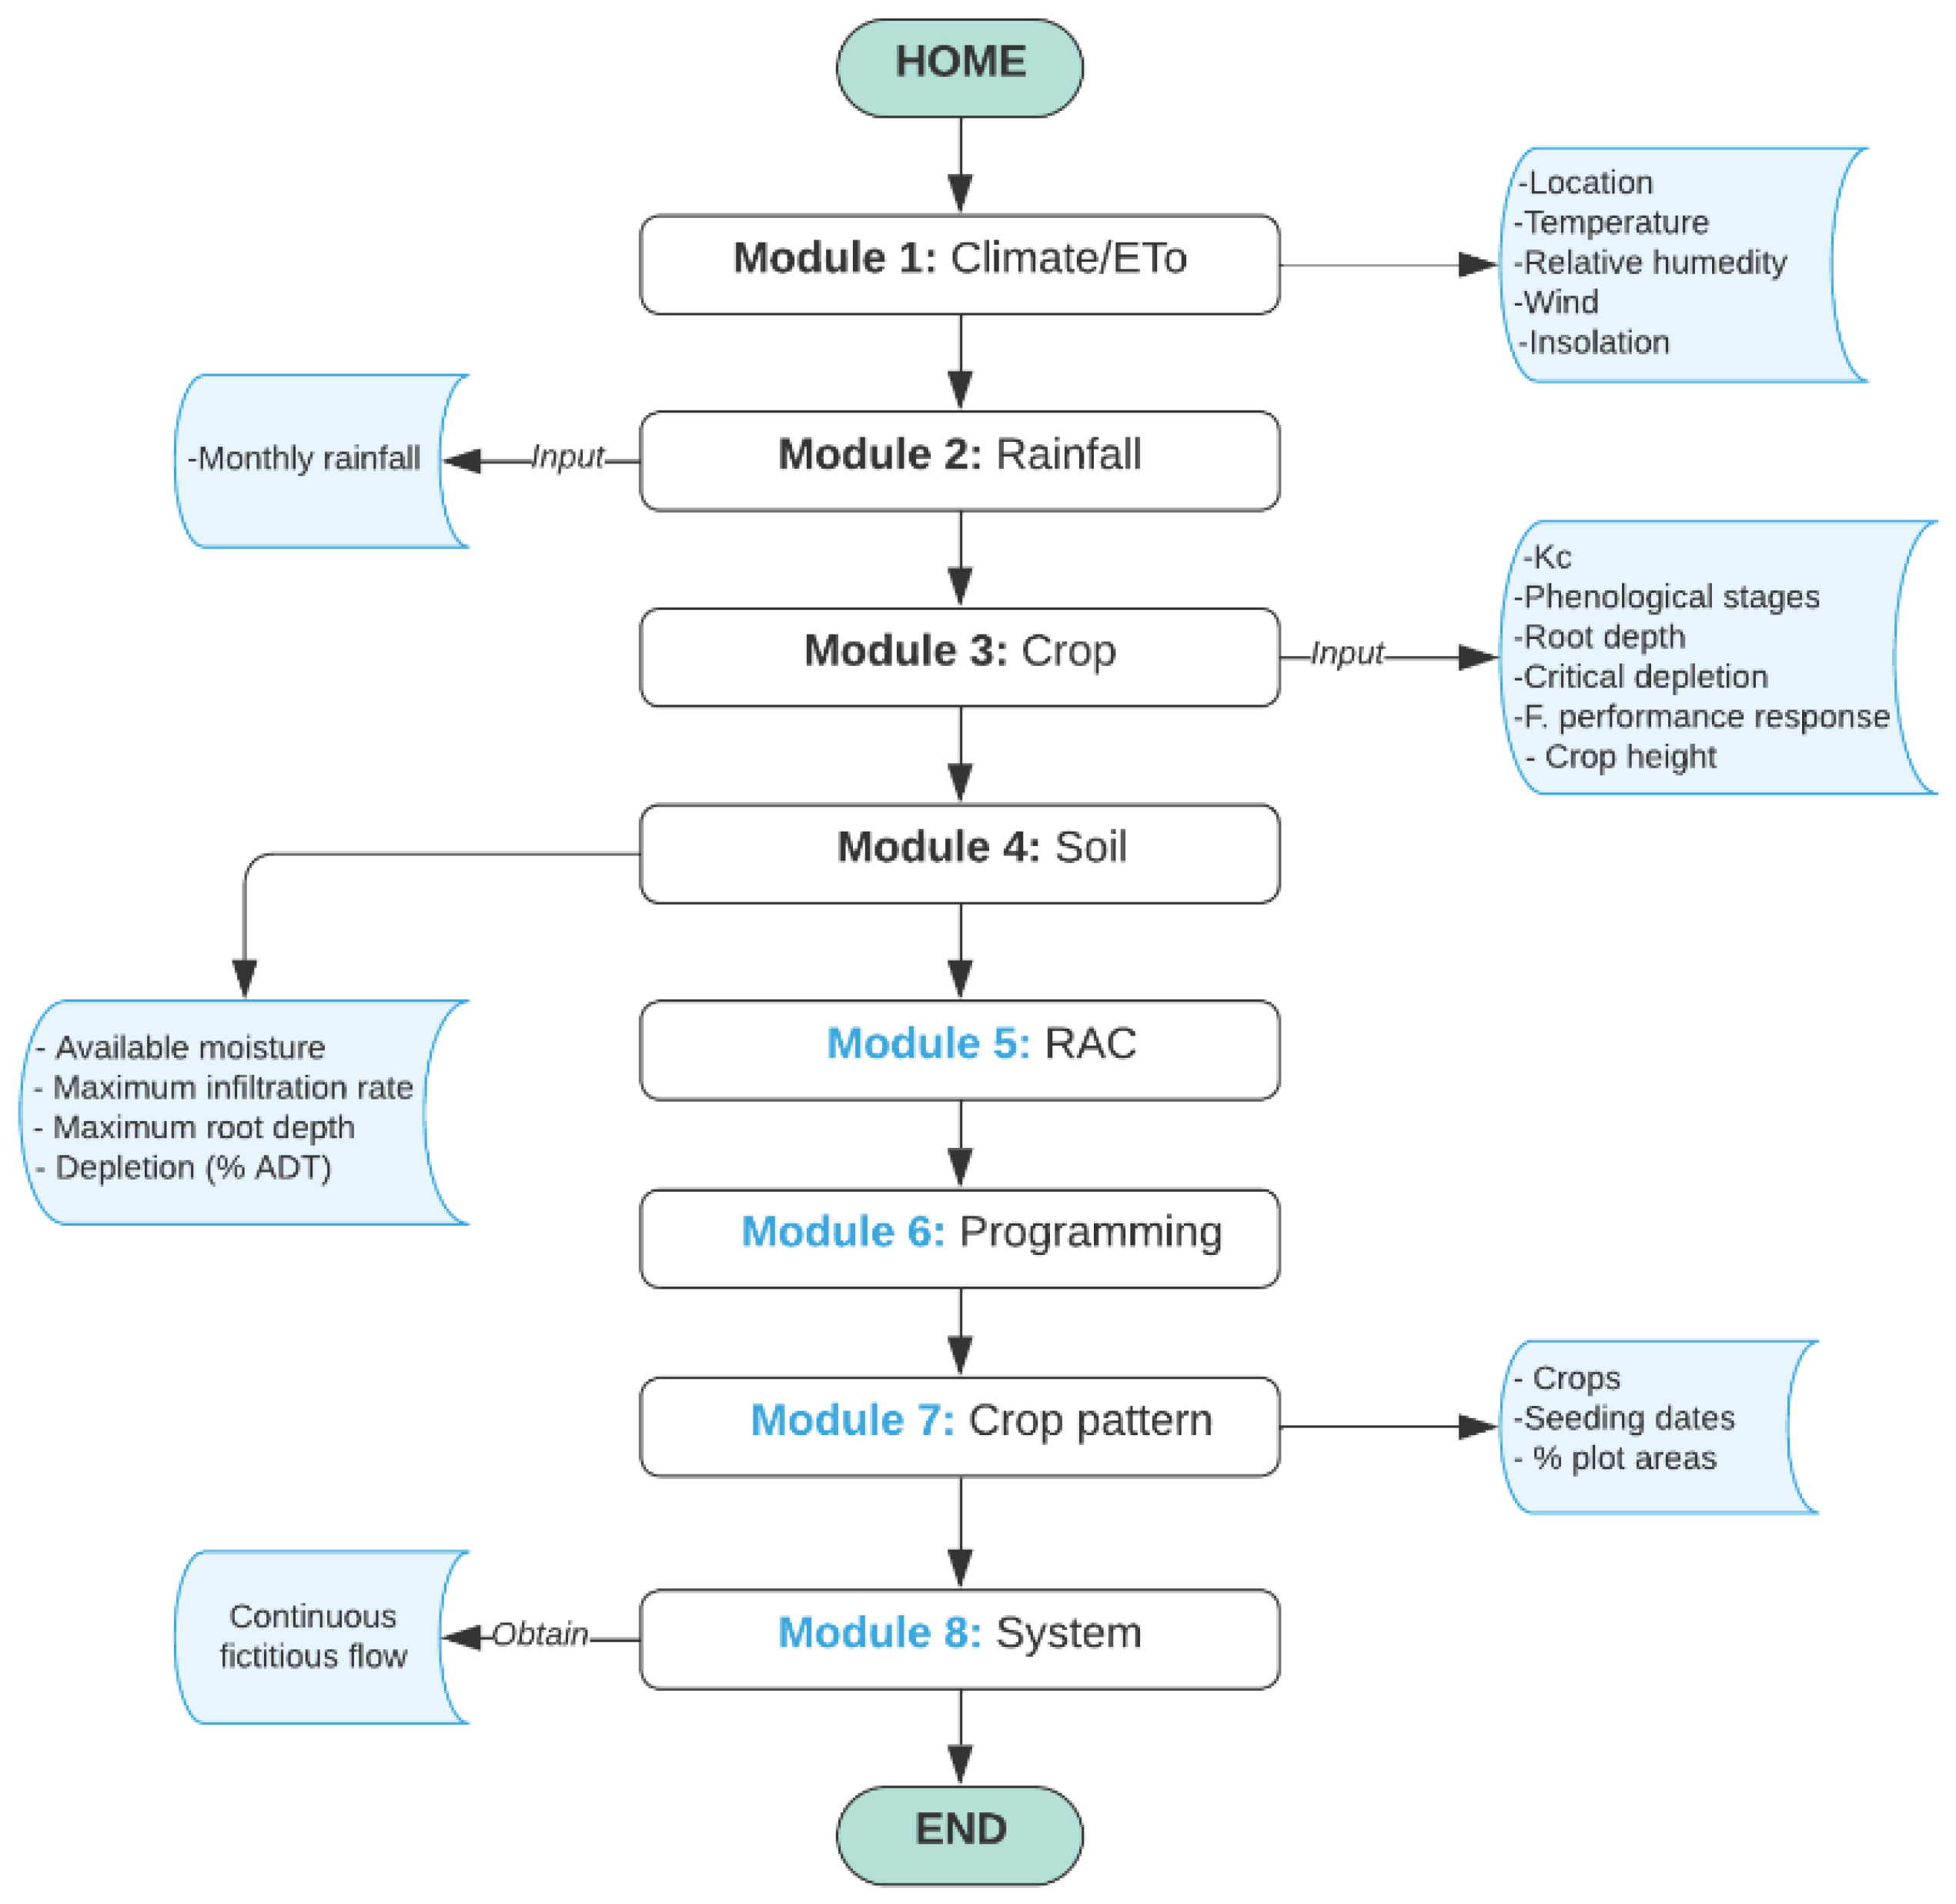
2.3. Methodology
2.3.1. Phase 1
2.3.2. Phase 2
2.3.3. Phase 3
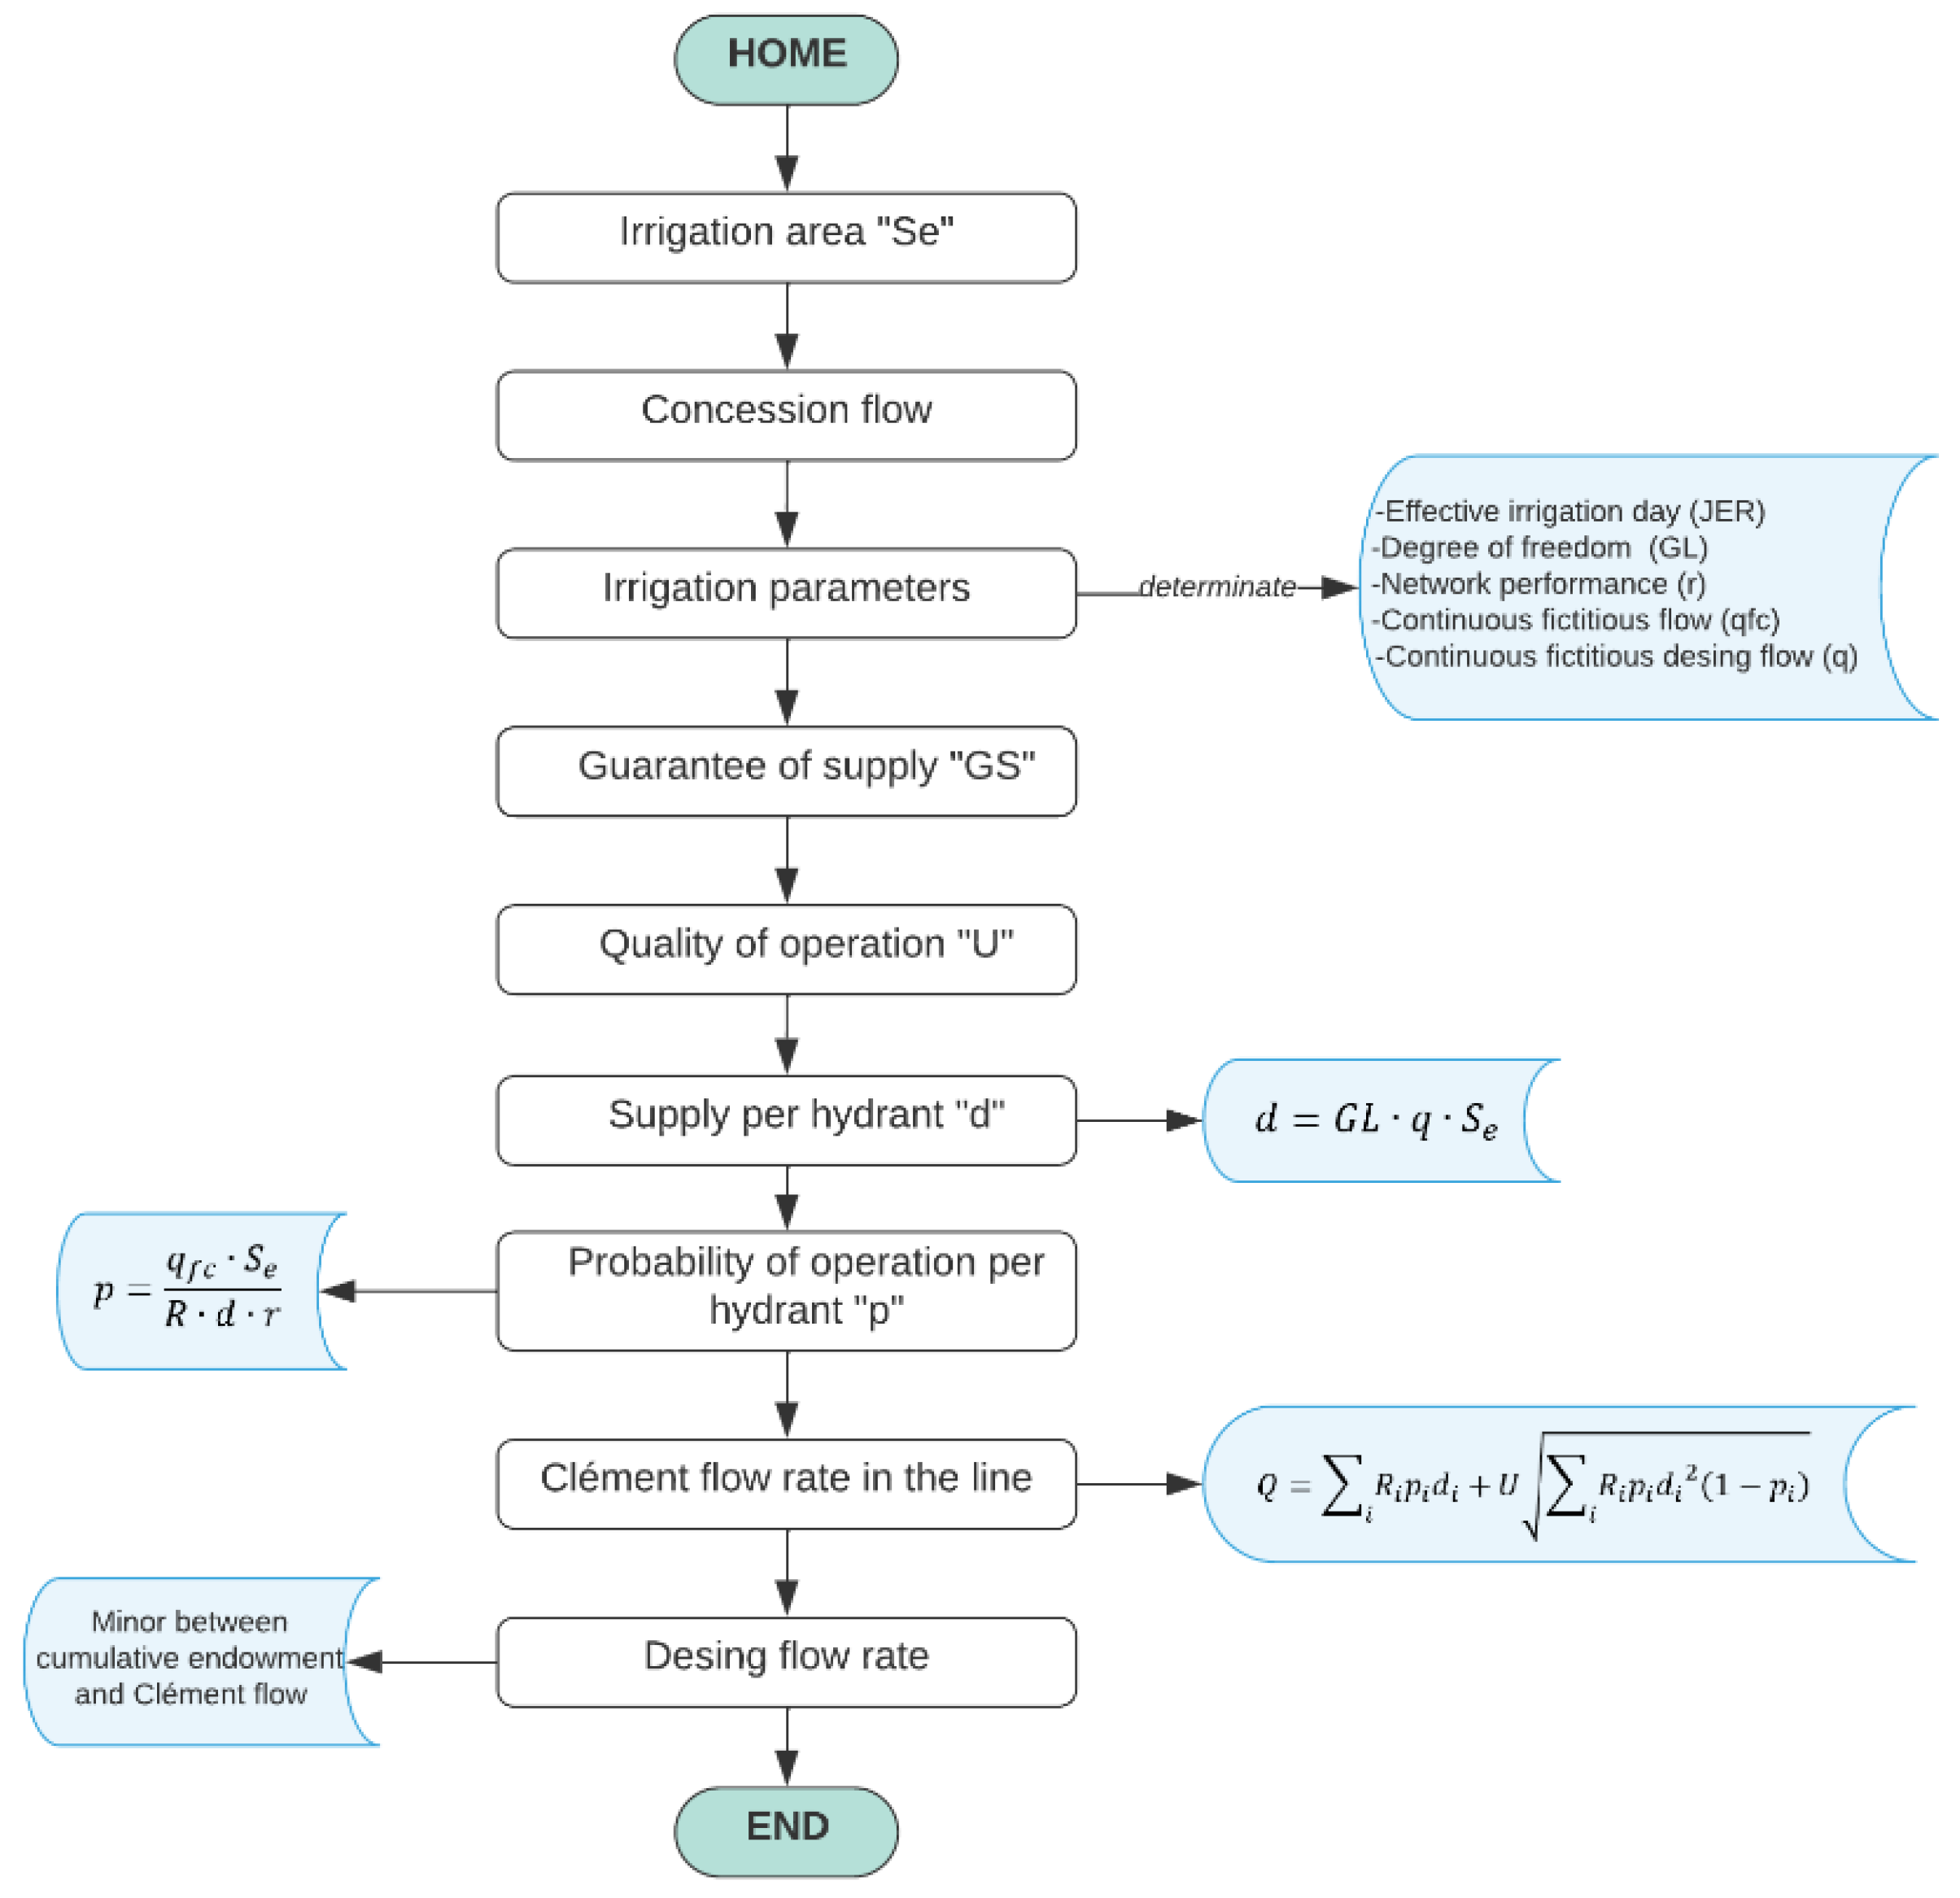
2.3.4. On-Demand Mode of Operation
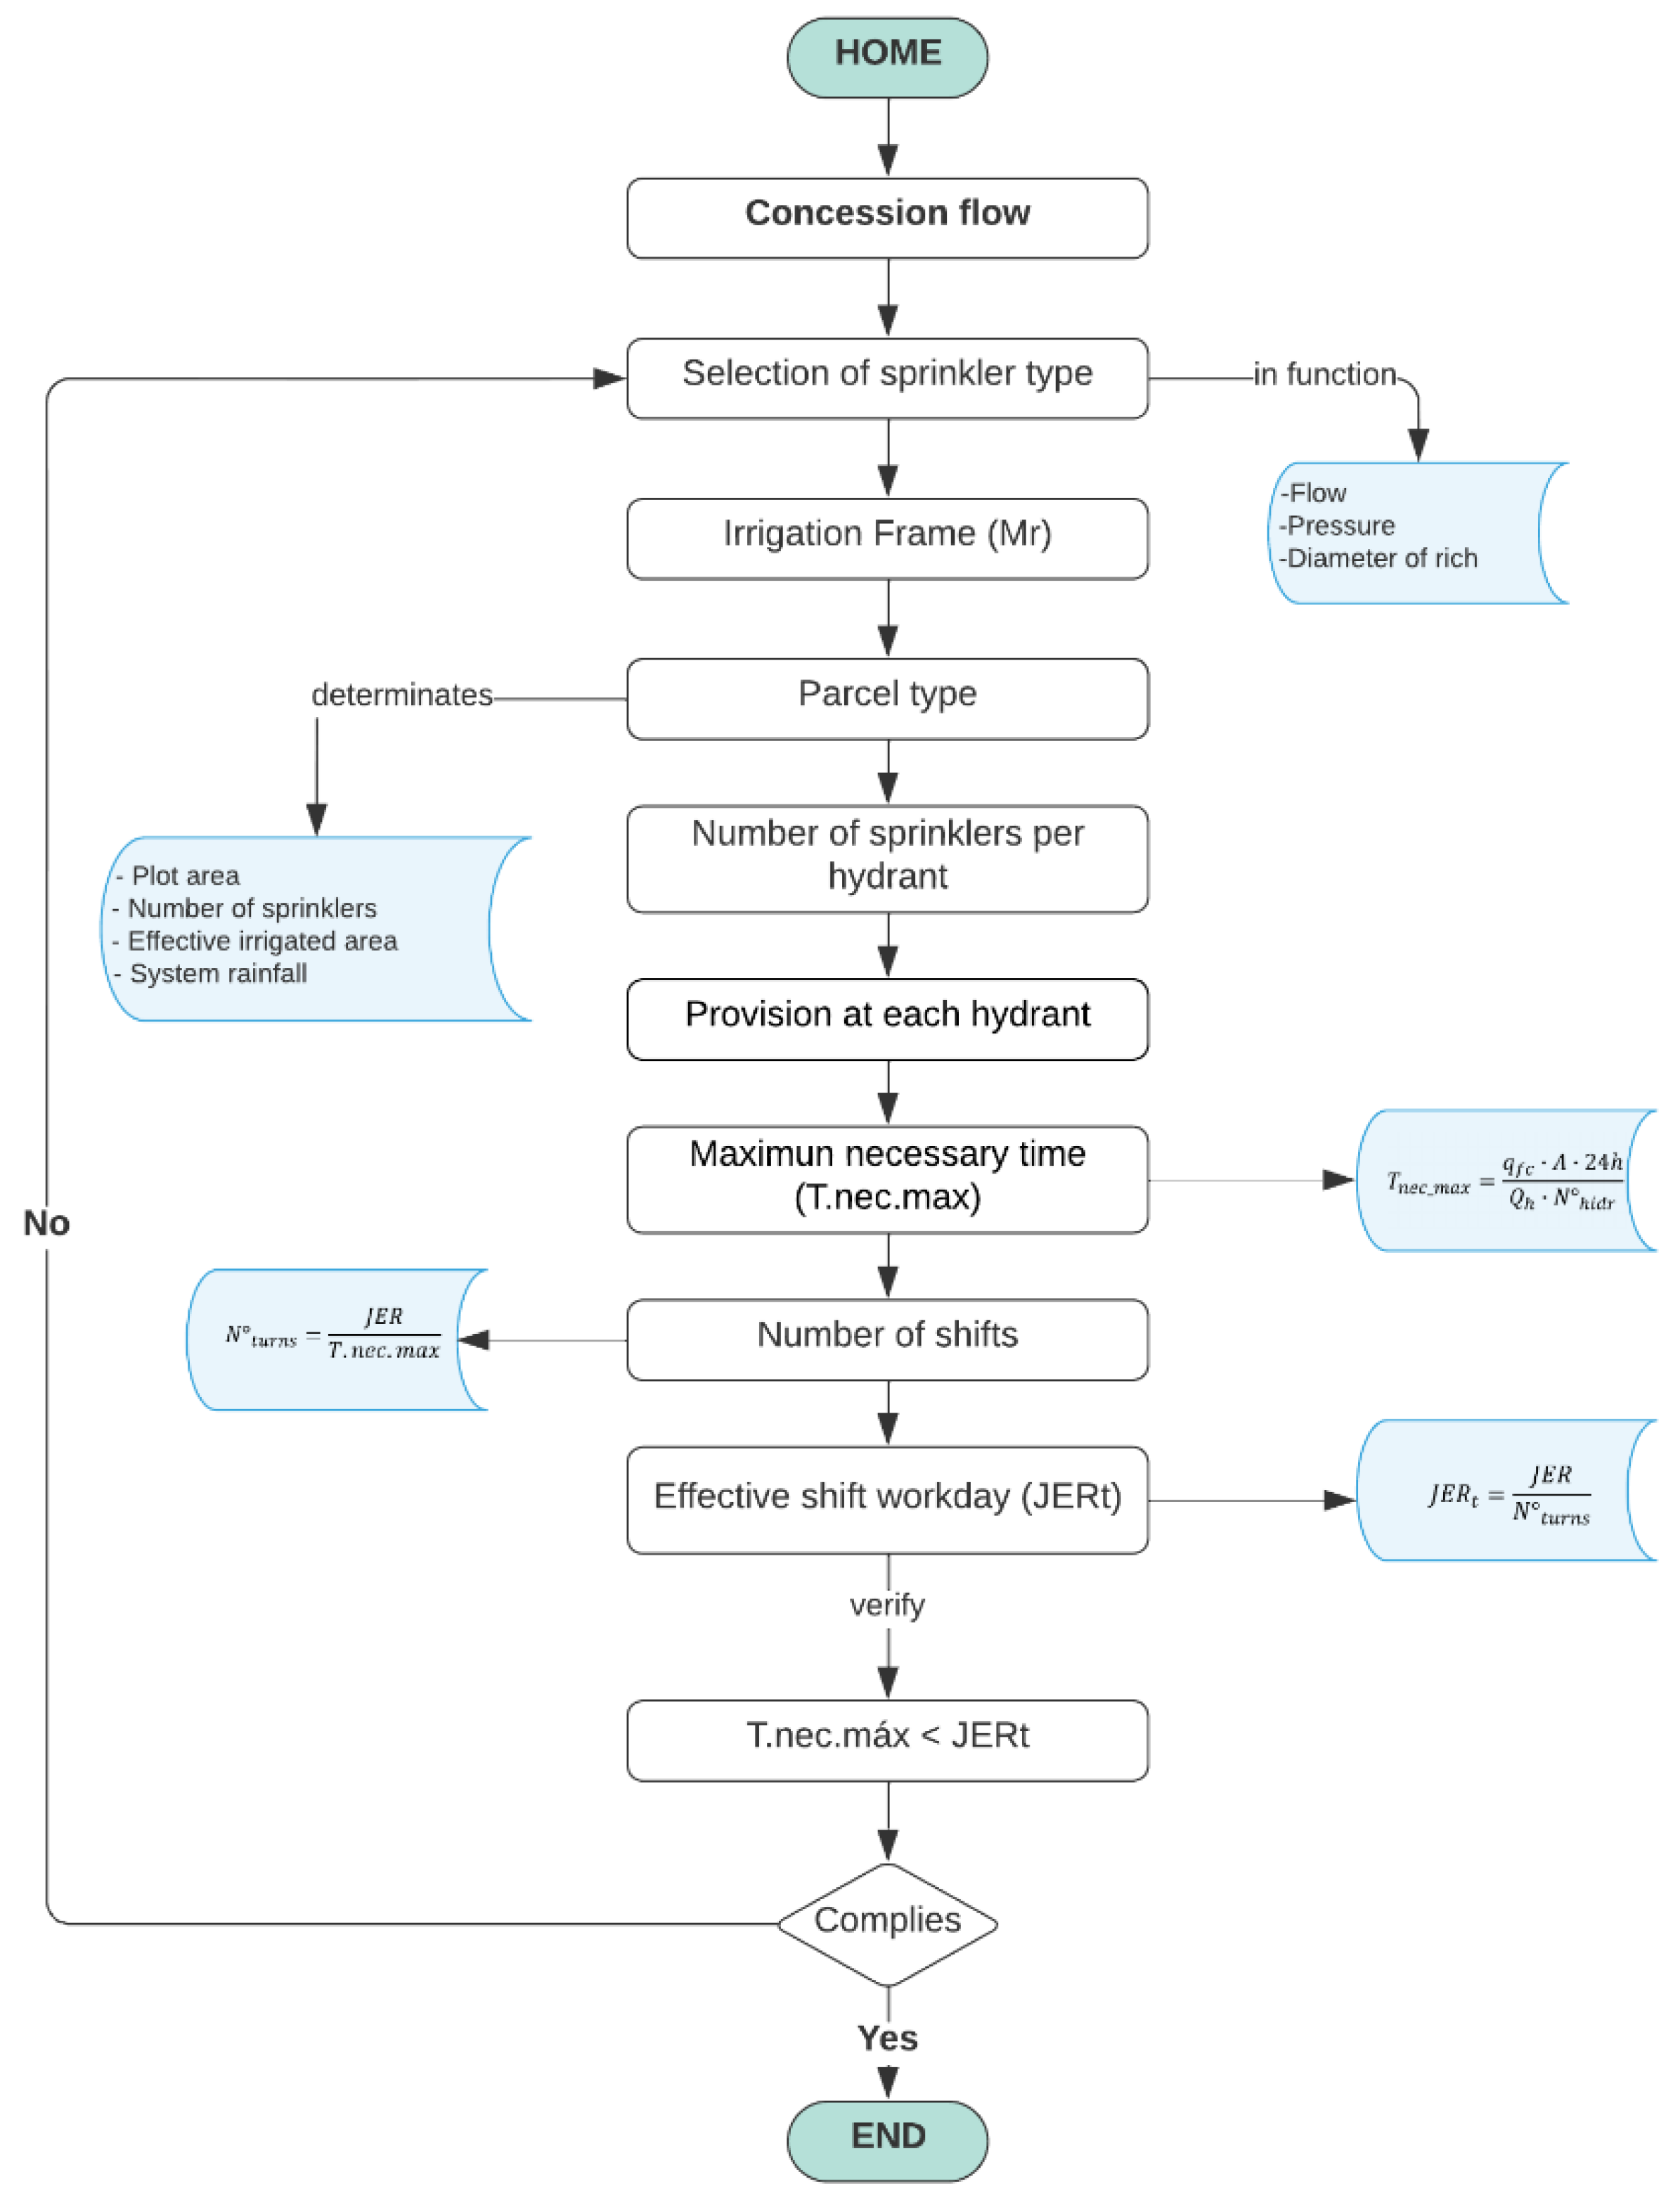
2.3.5. Shift Operation Mode
3. Results
3.1. Continuous Notional Flow (Agronomic Design)
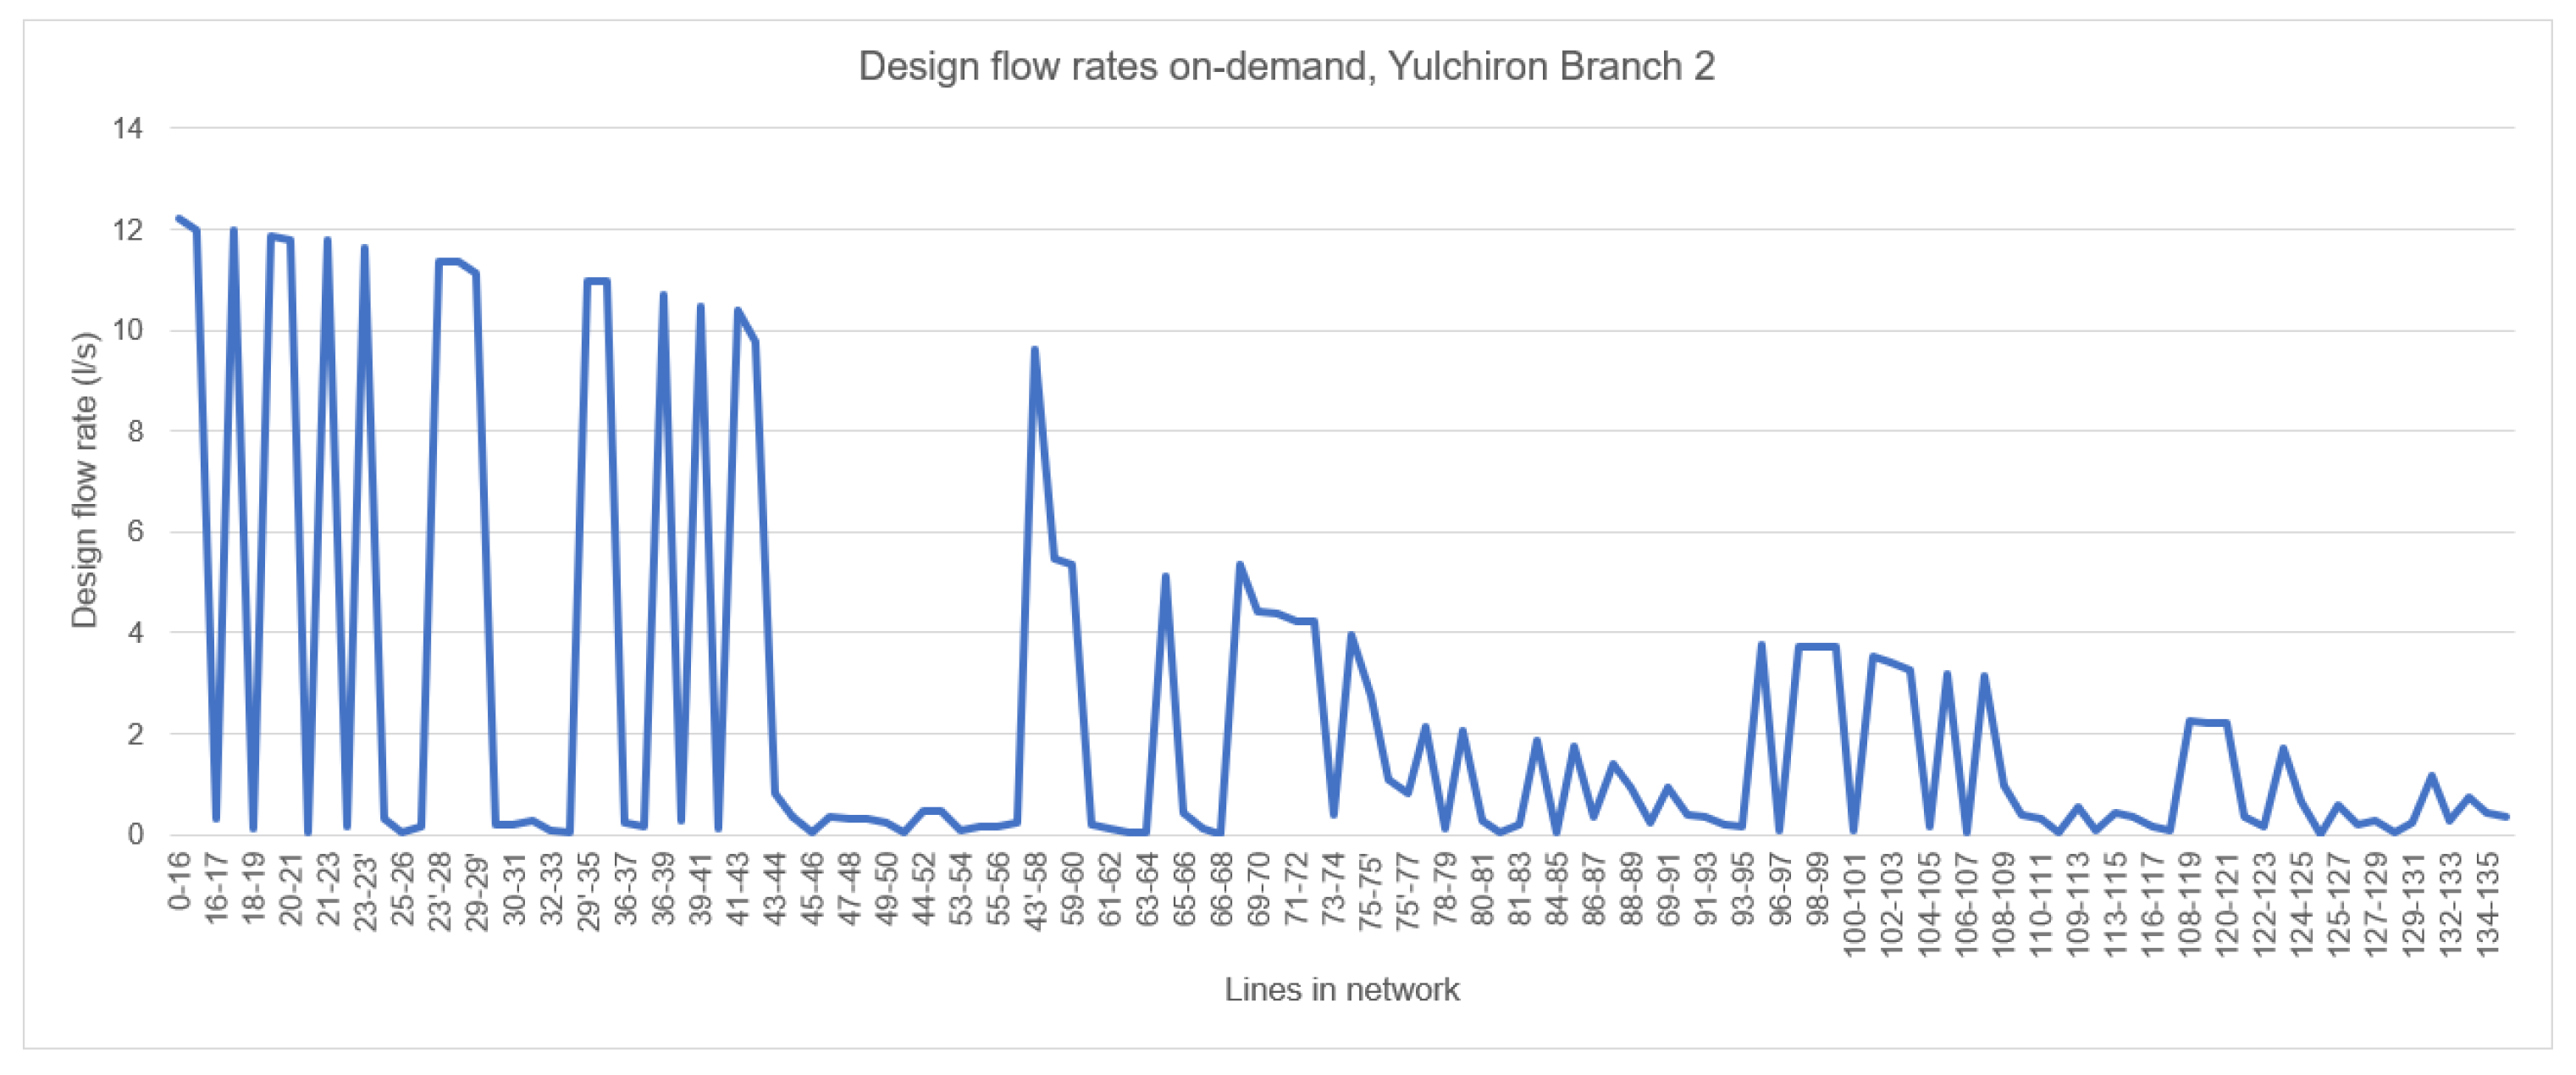
3.2. Design Flow On-Demand
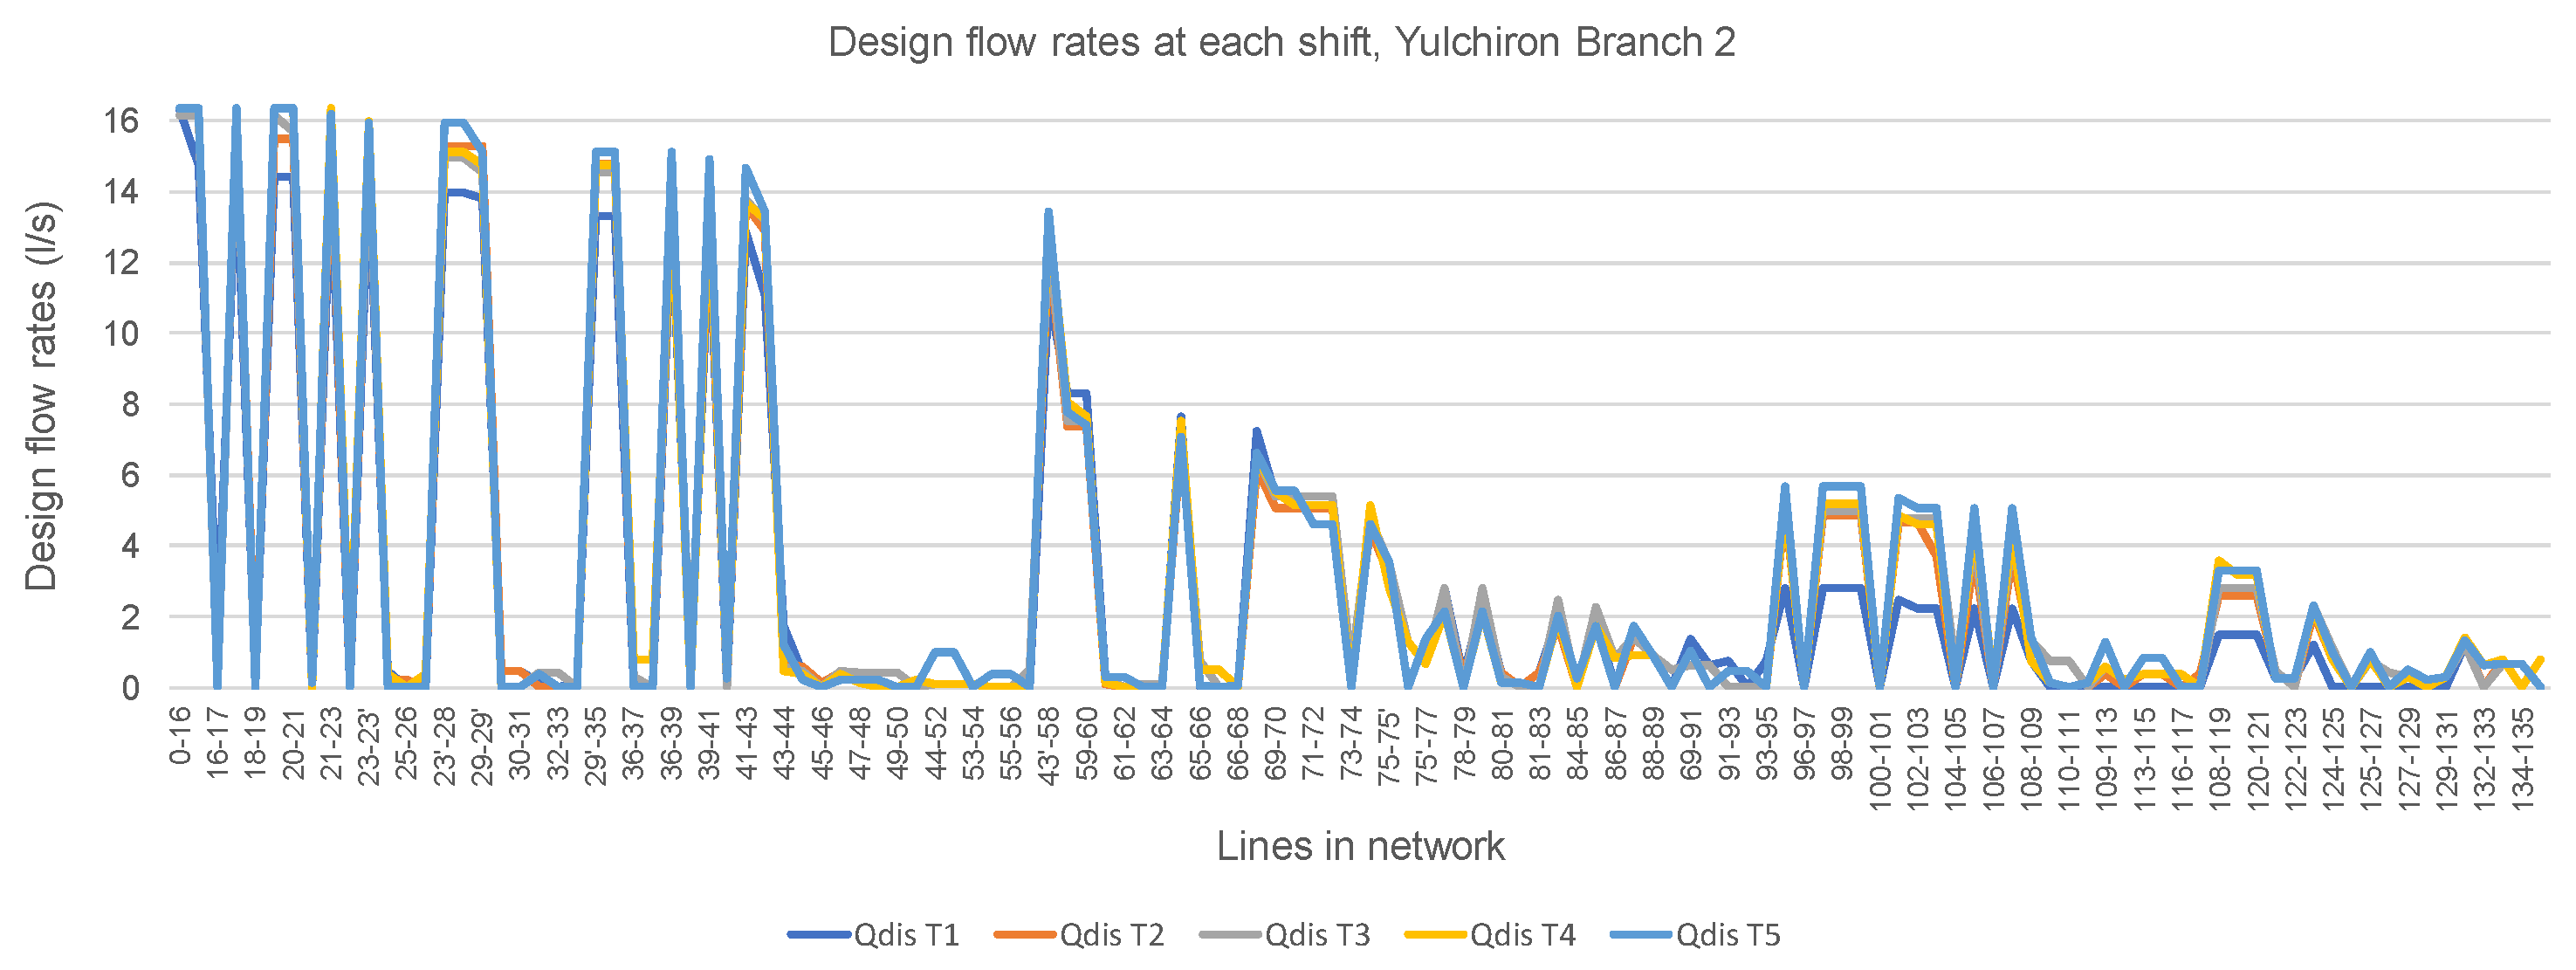
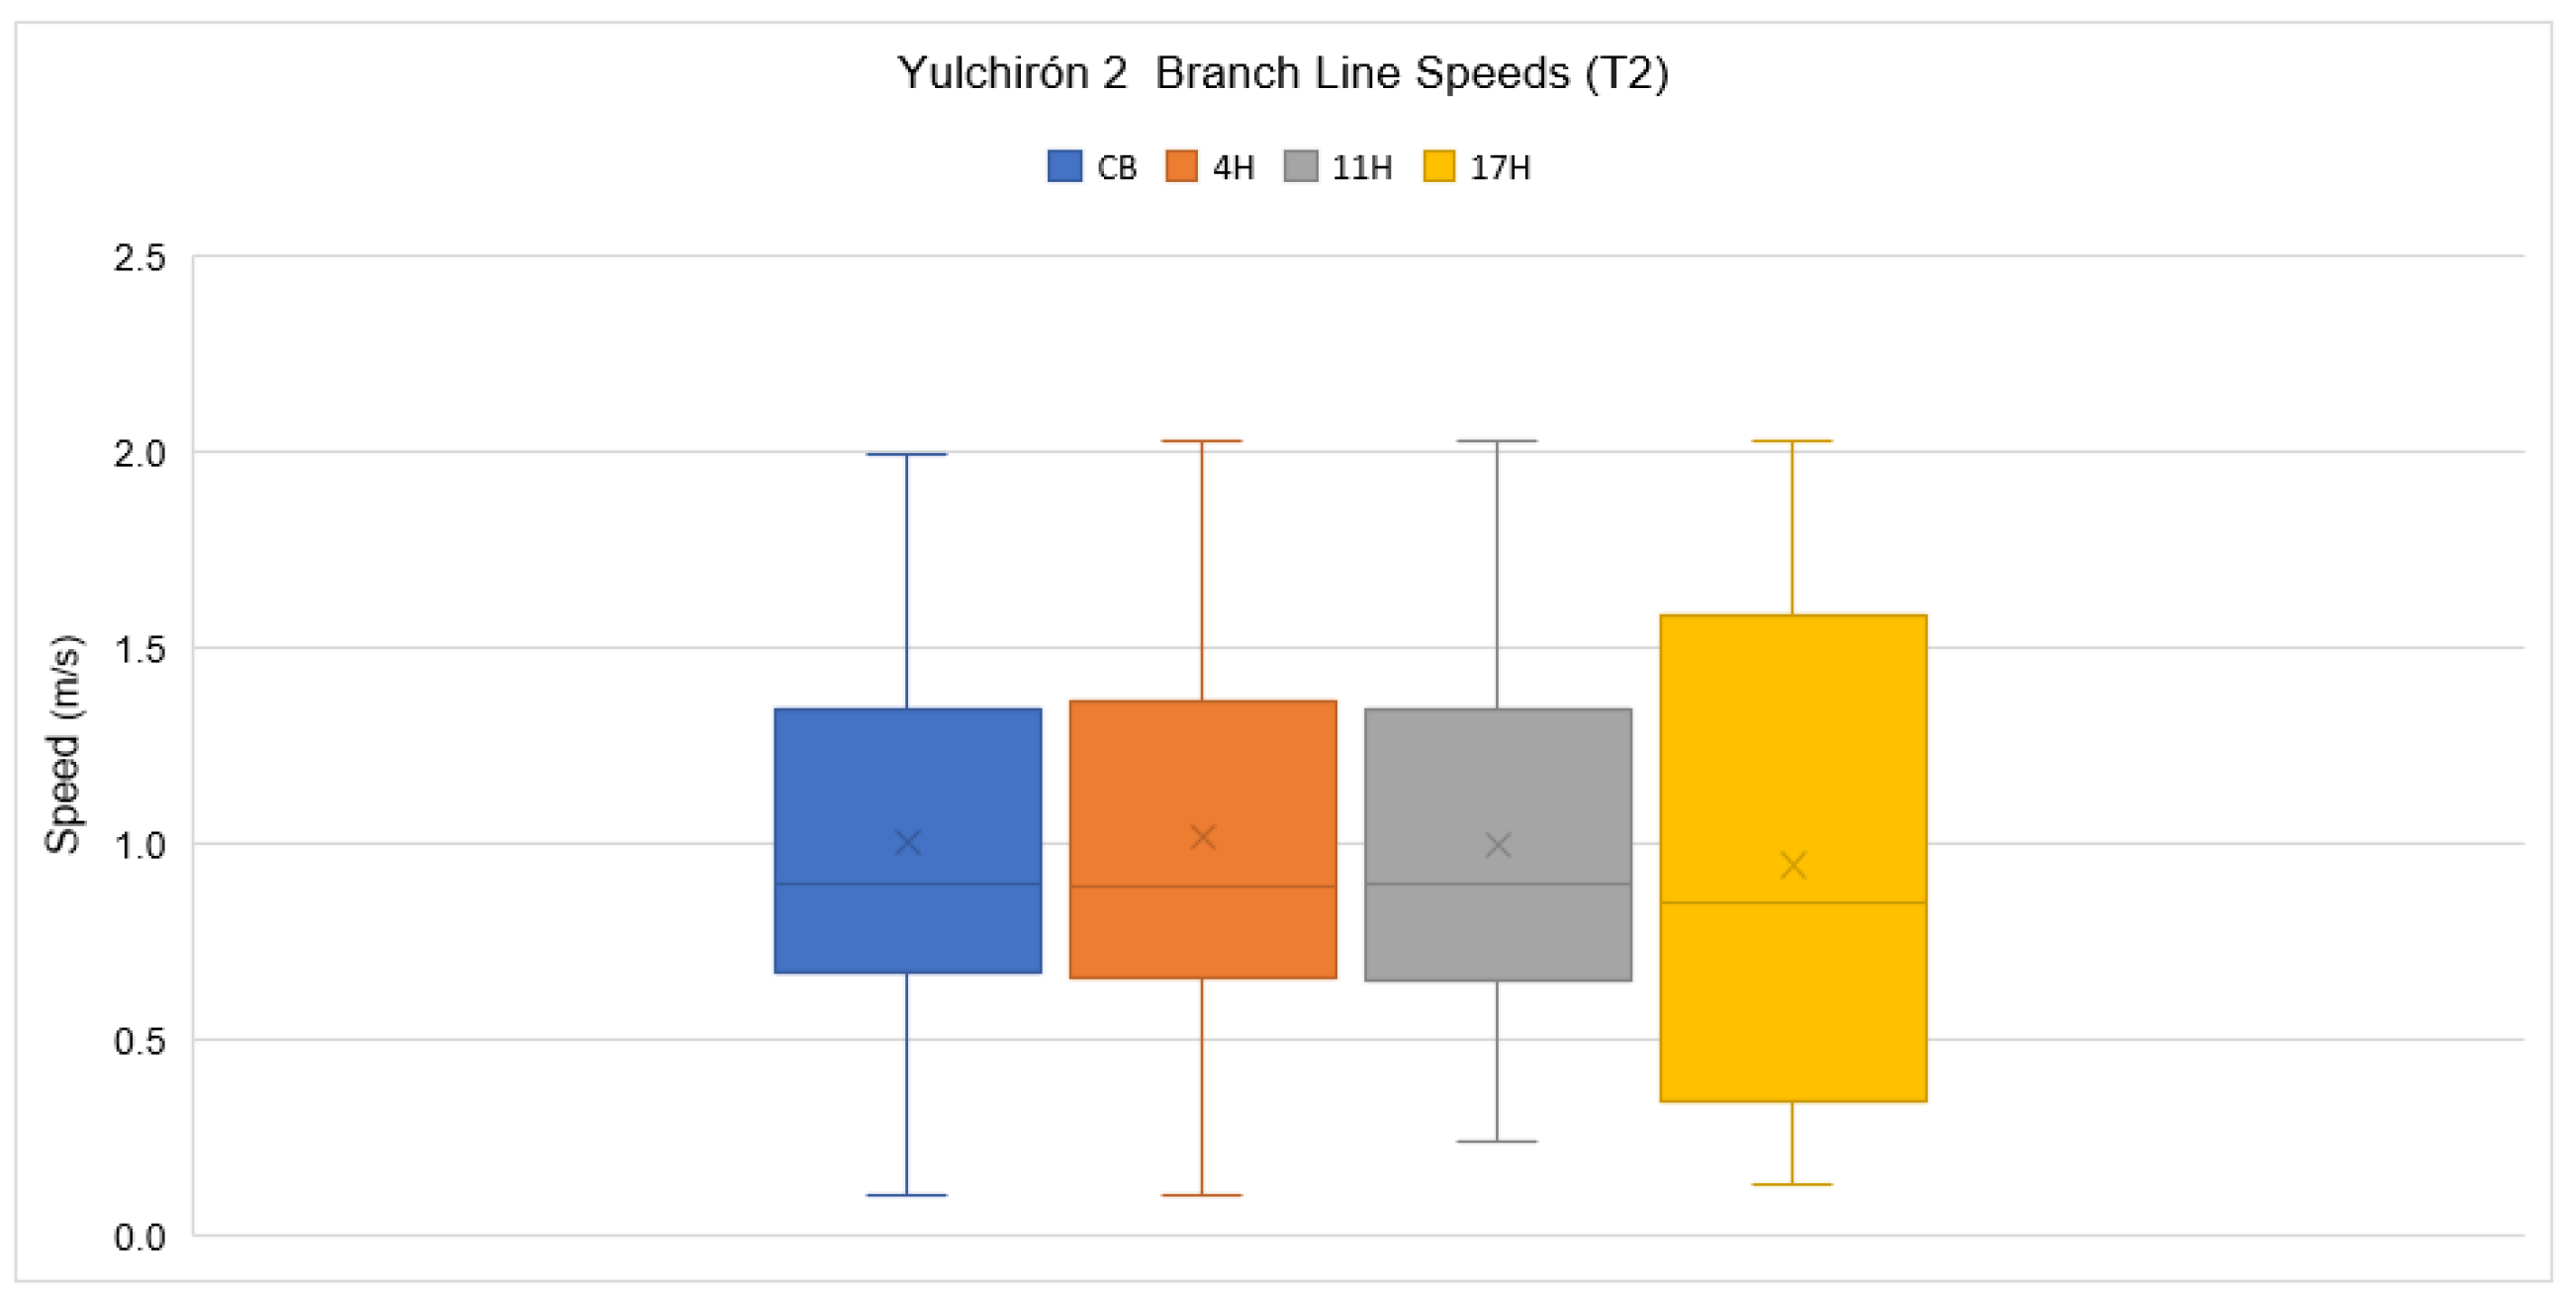
3.3. Shift Design Flow
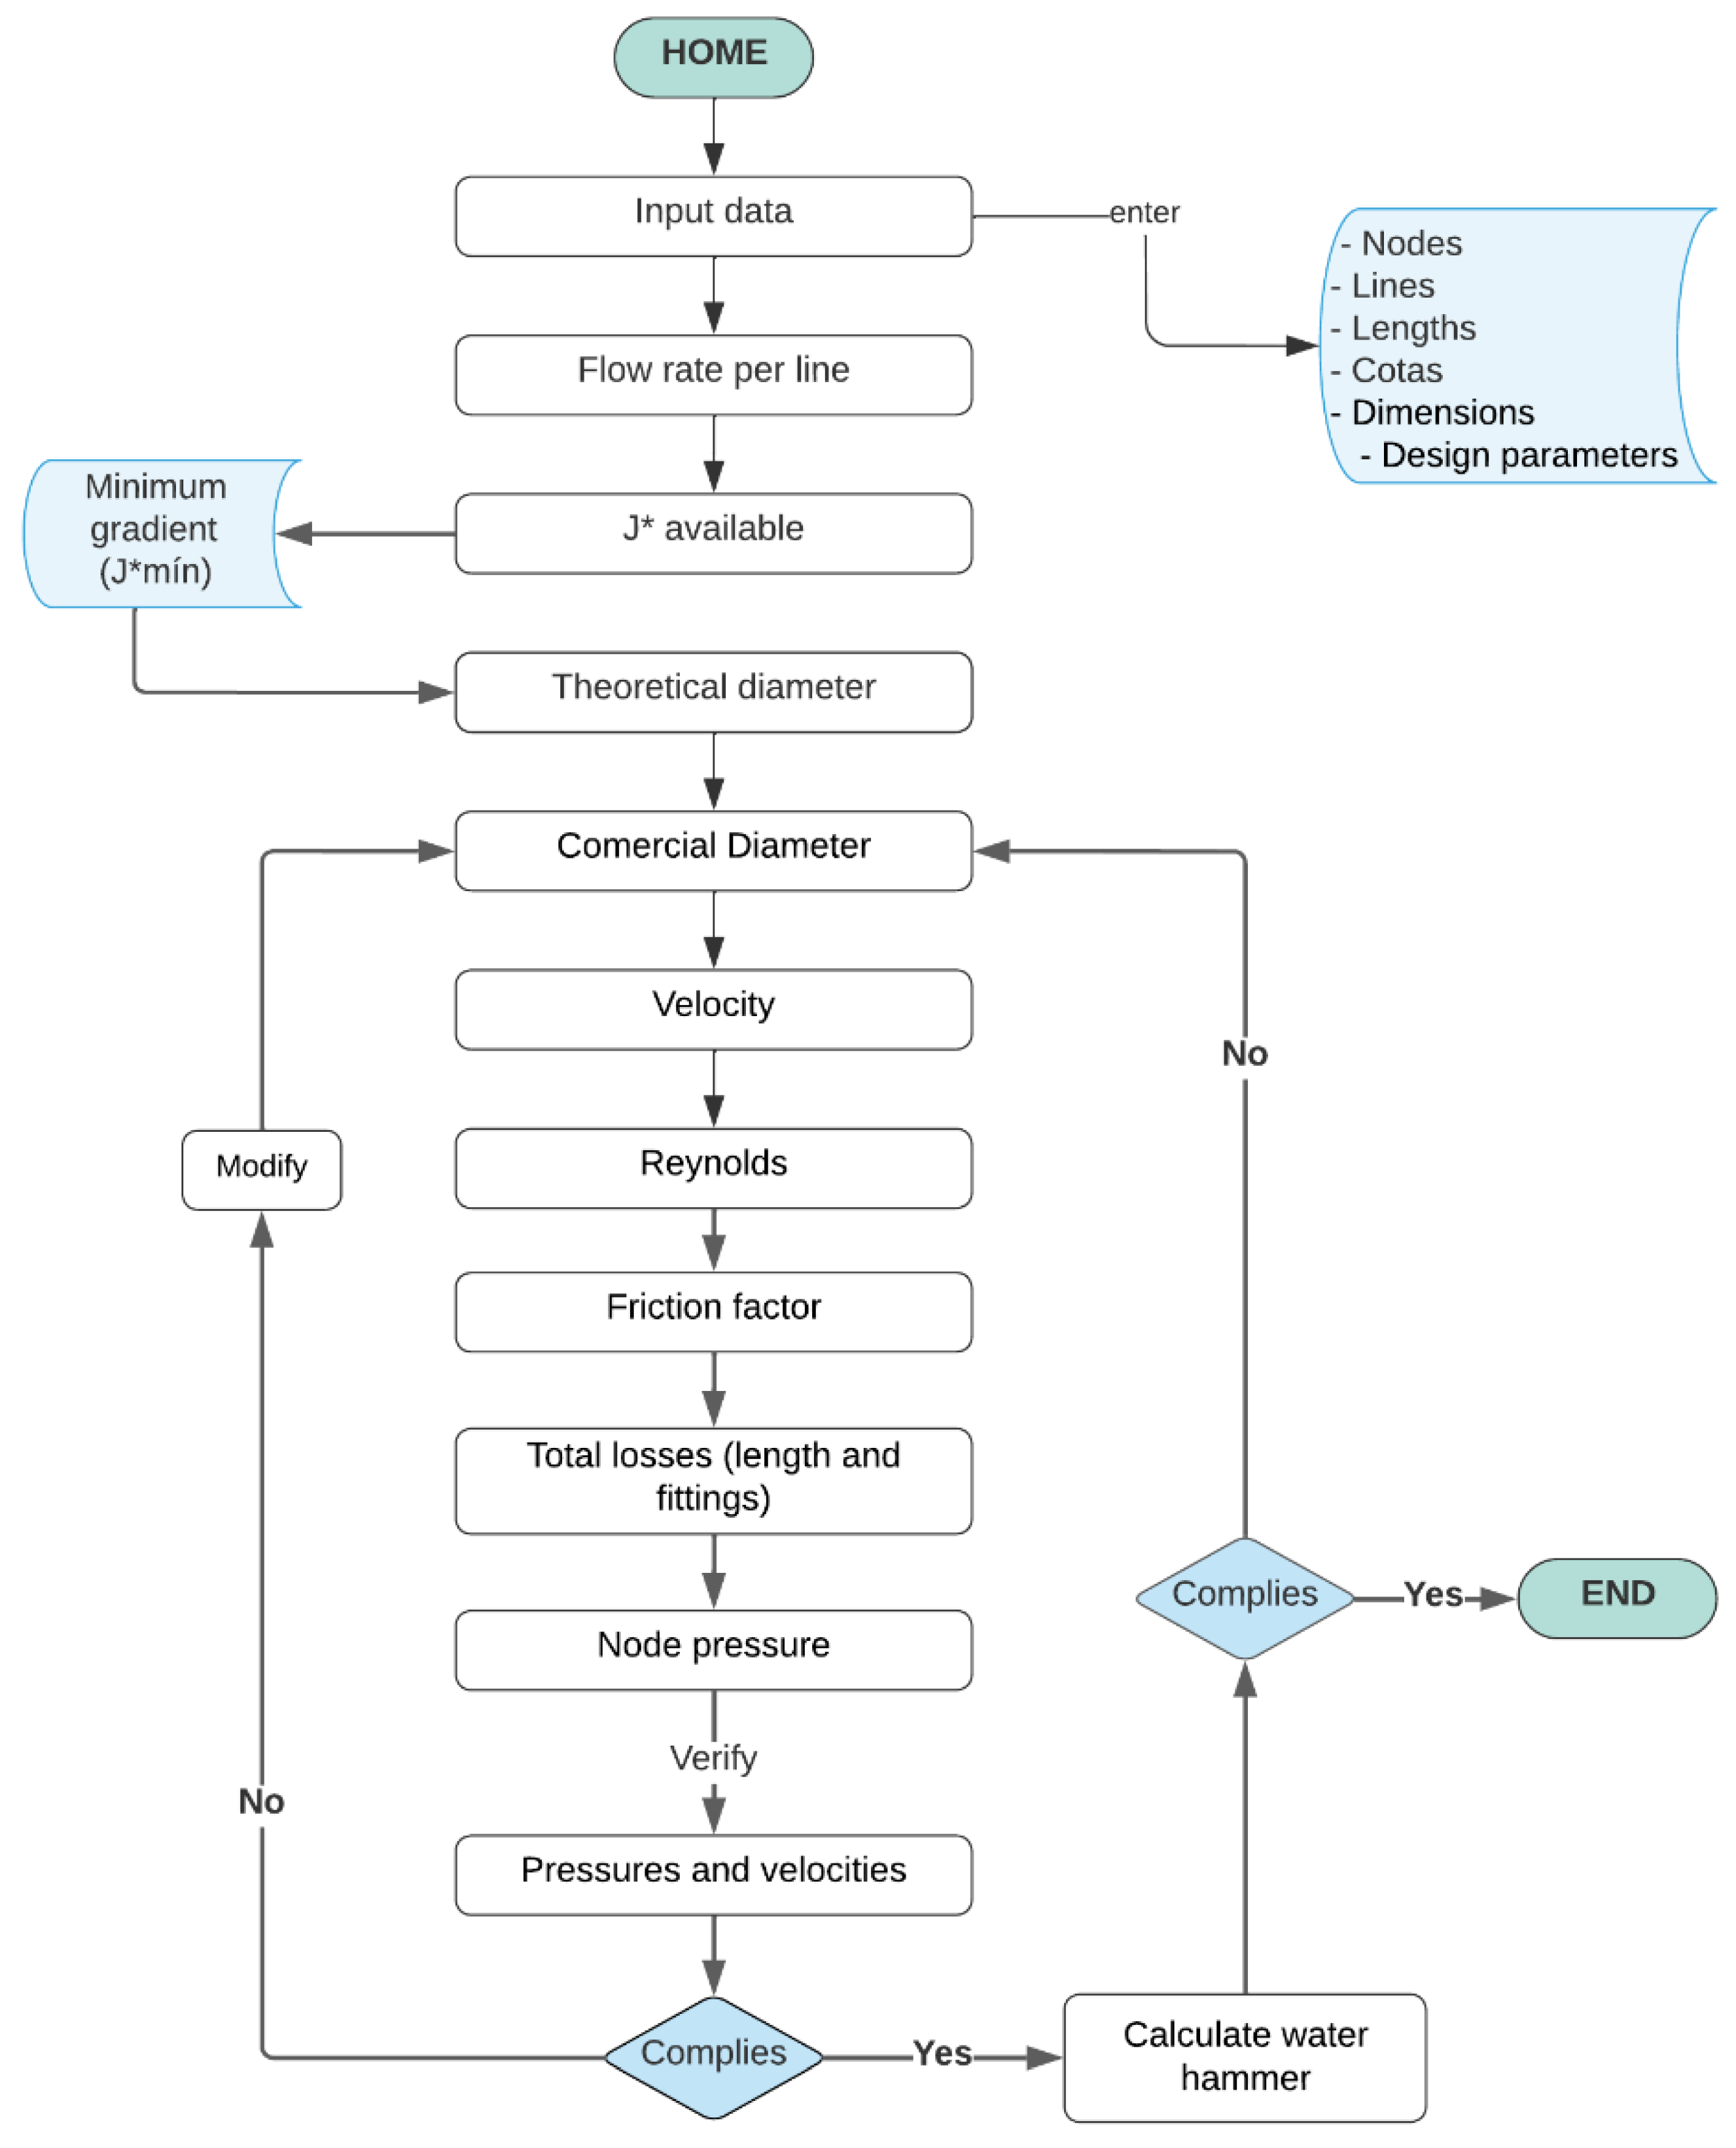
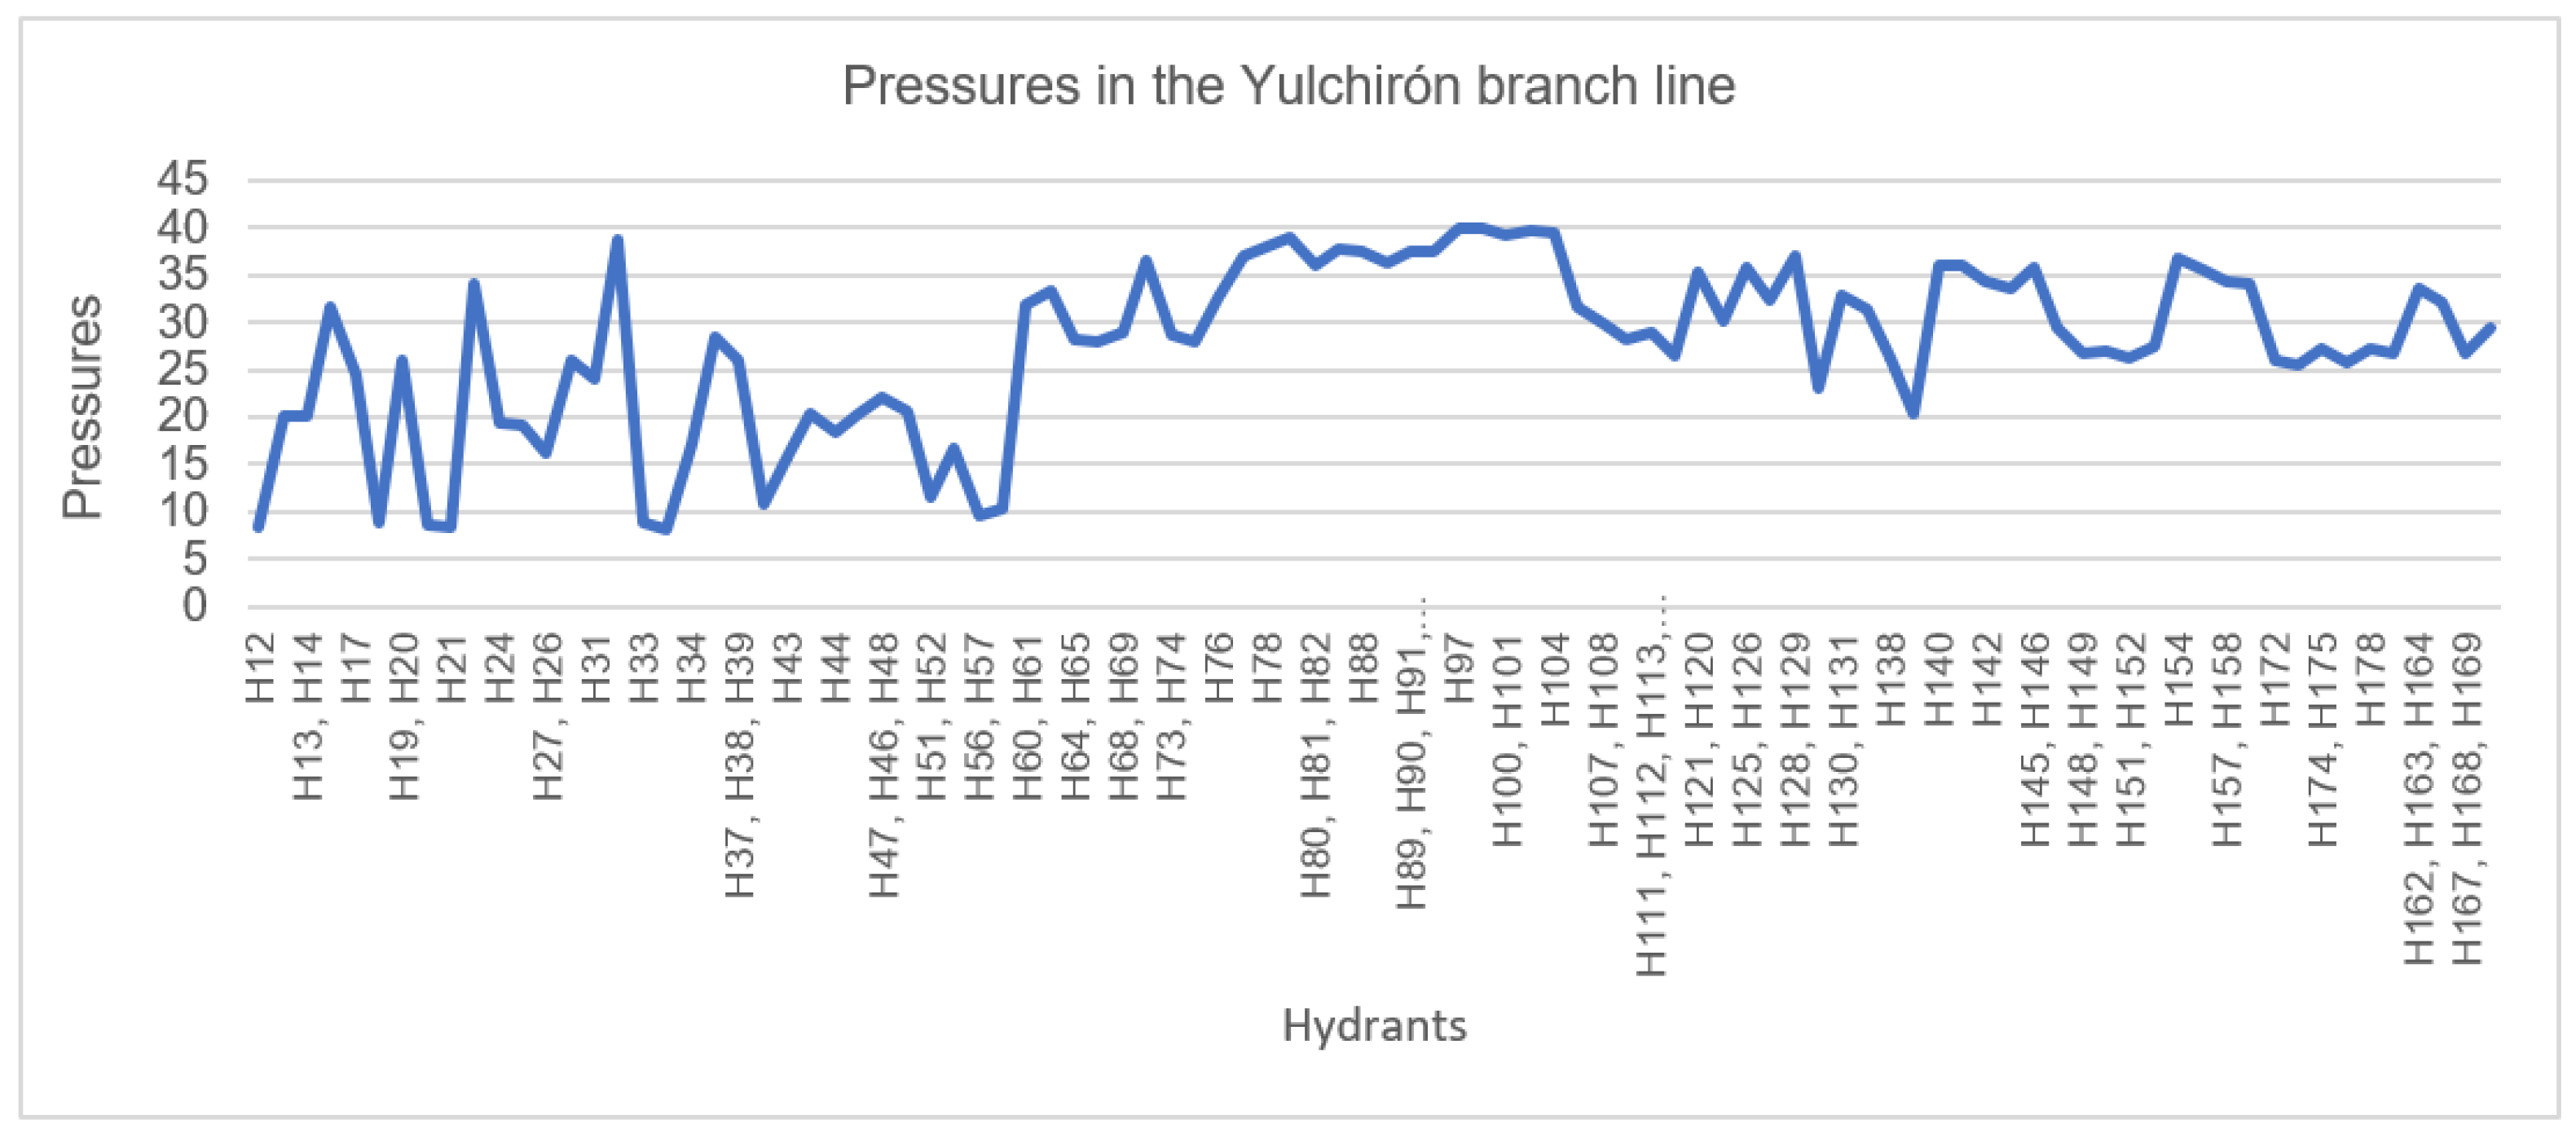
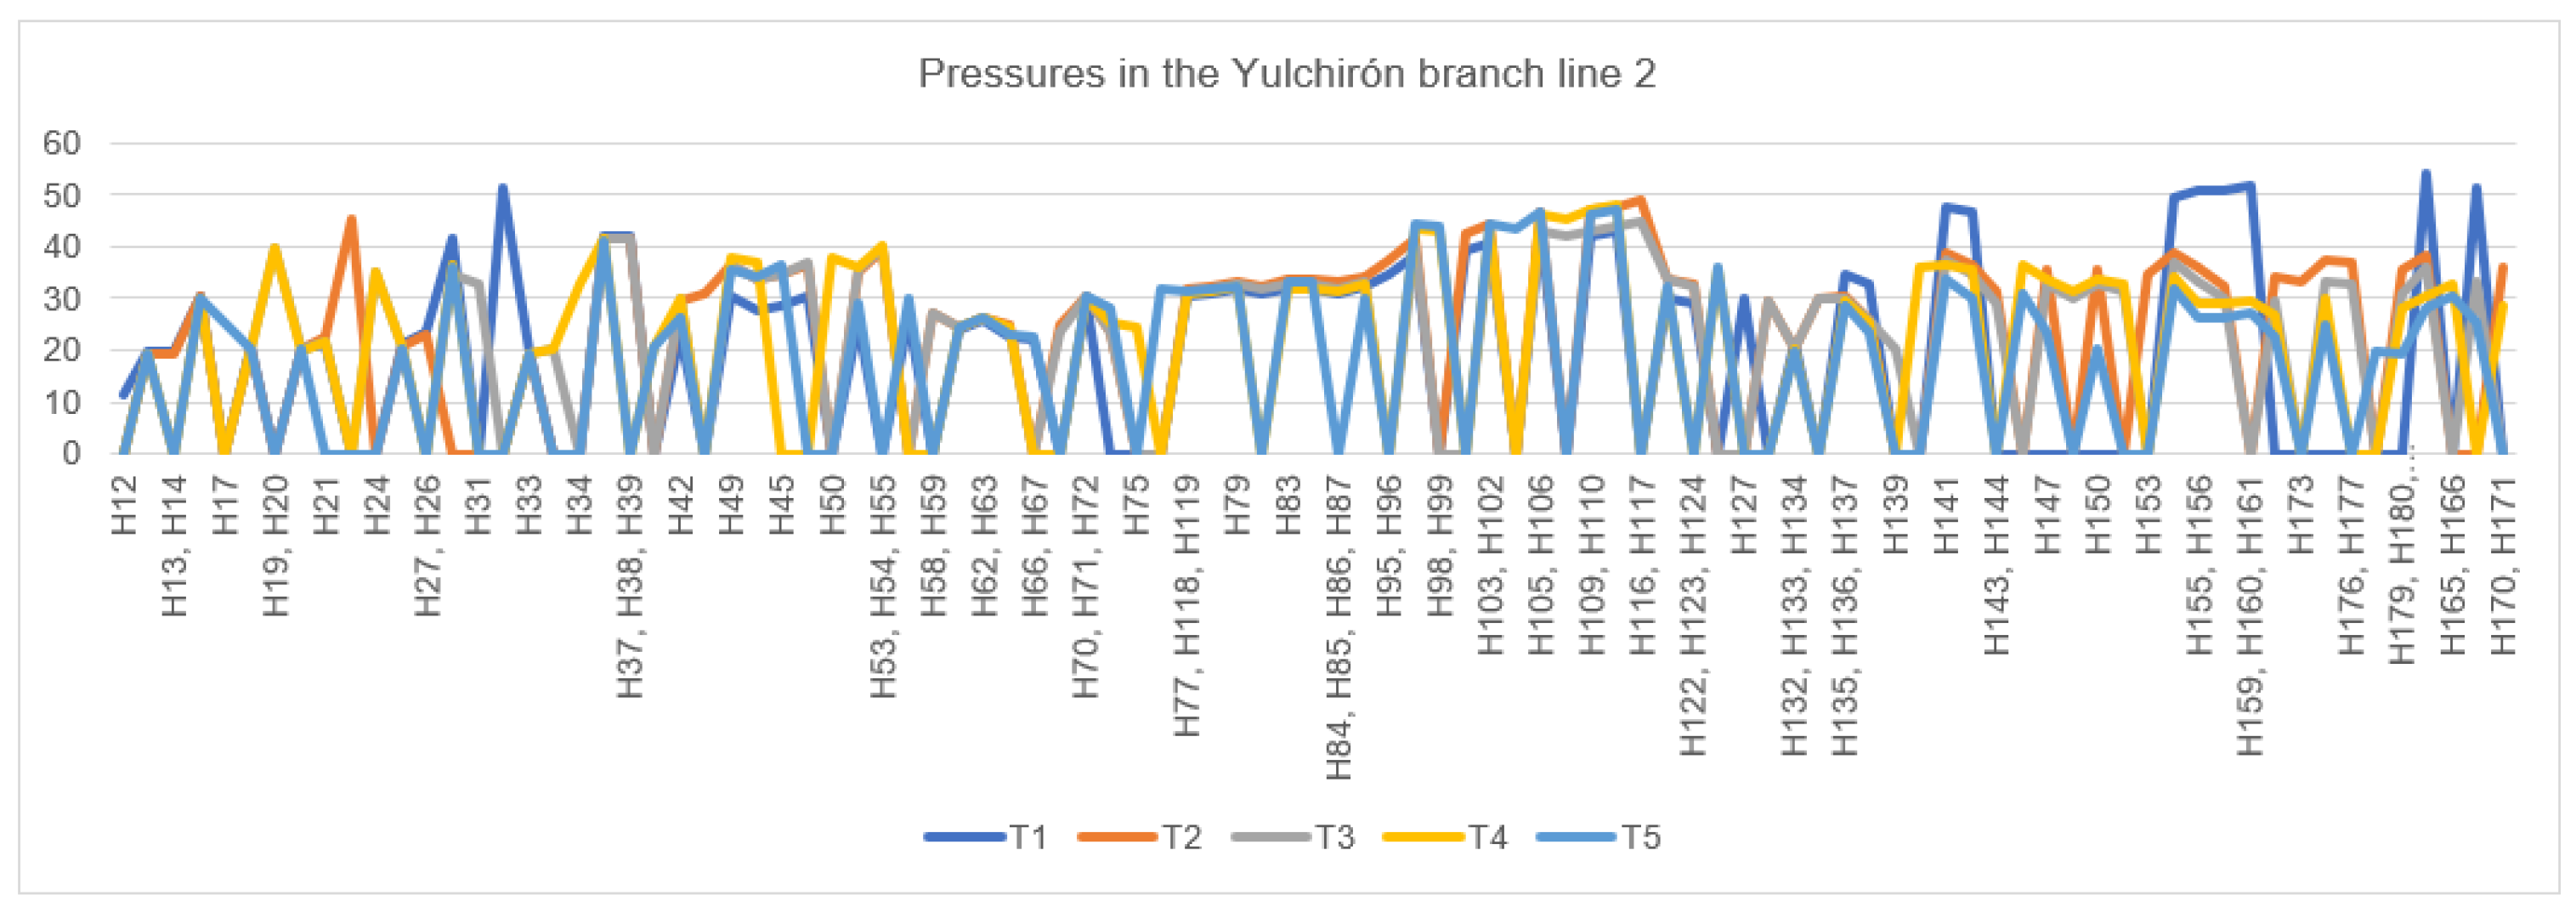
3.4. Results of the Hydraulic Design of the Network Operating On-Demand and in Shifts
3.5. Results of the Calculation of the Indicators
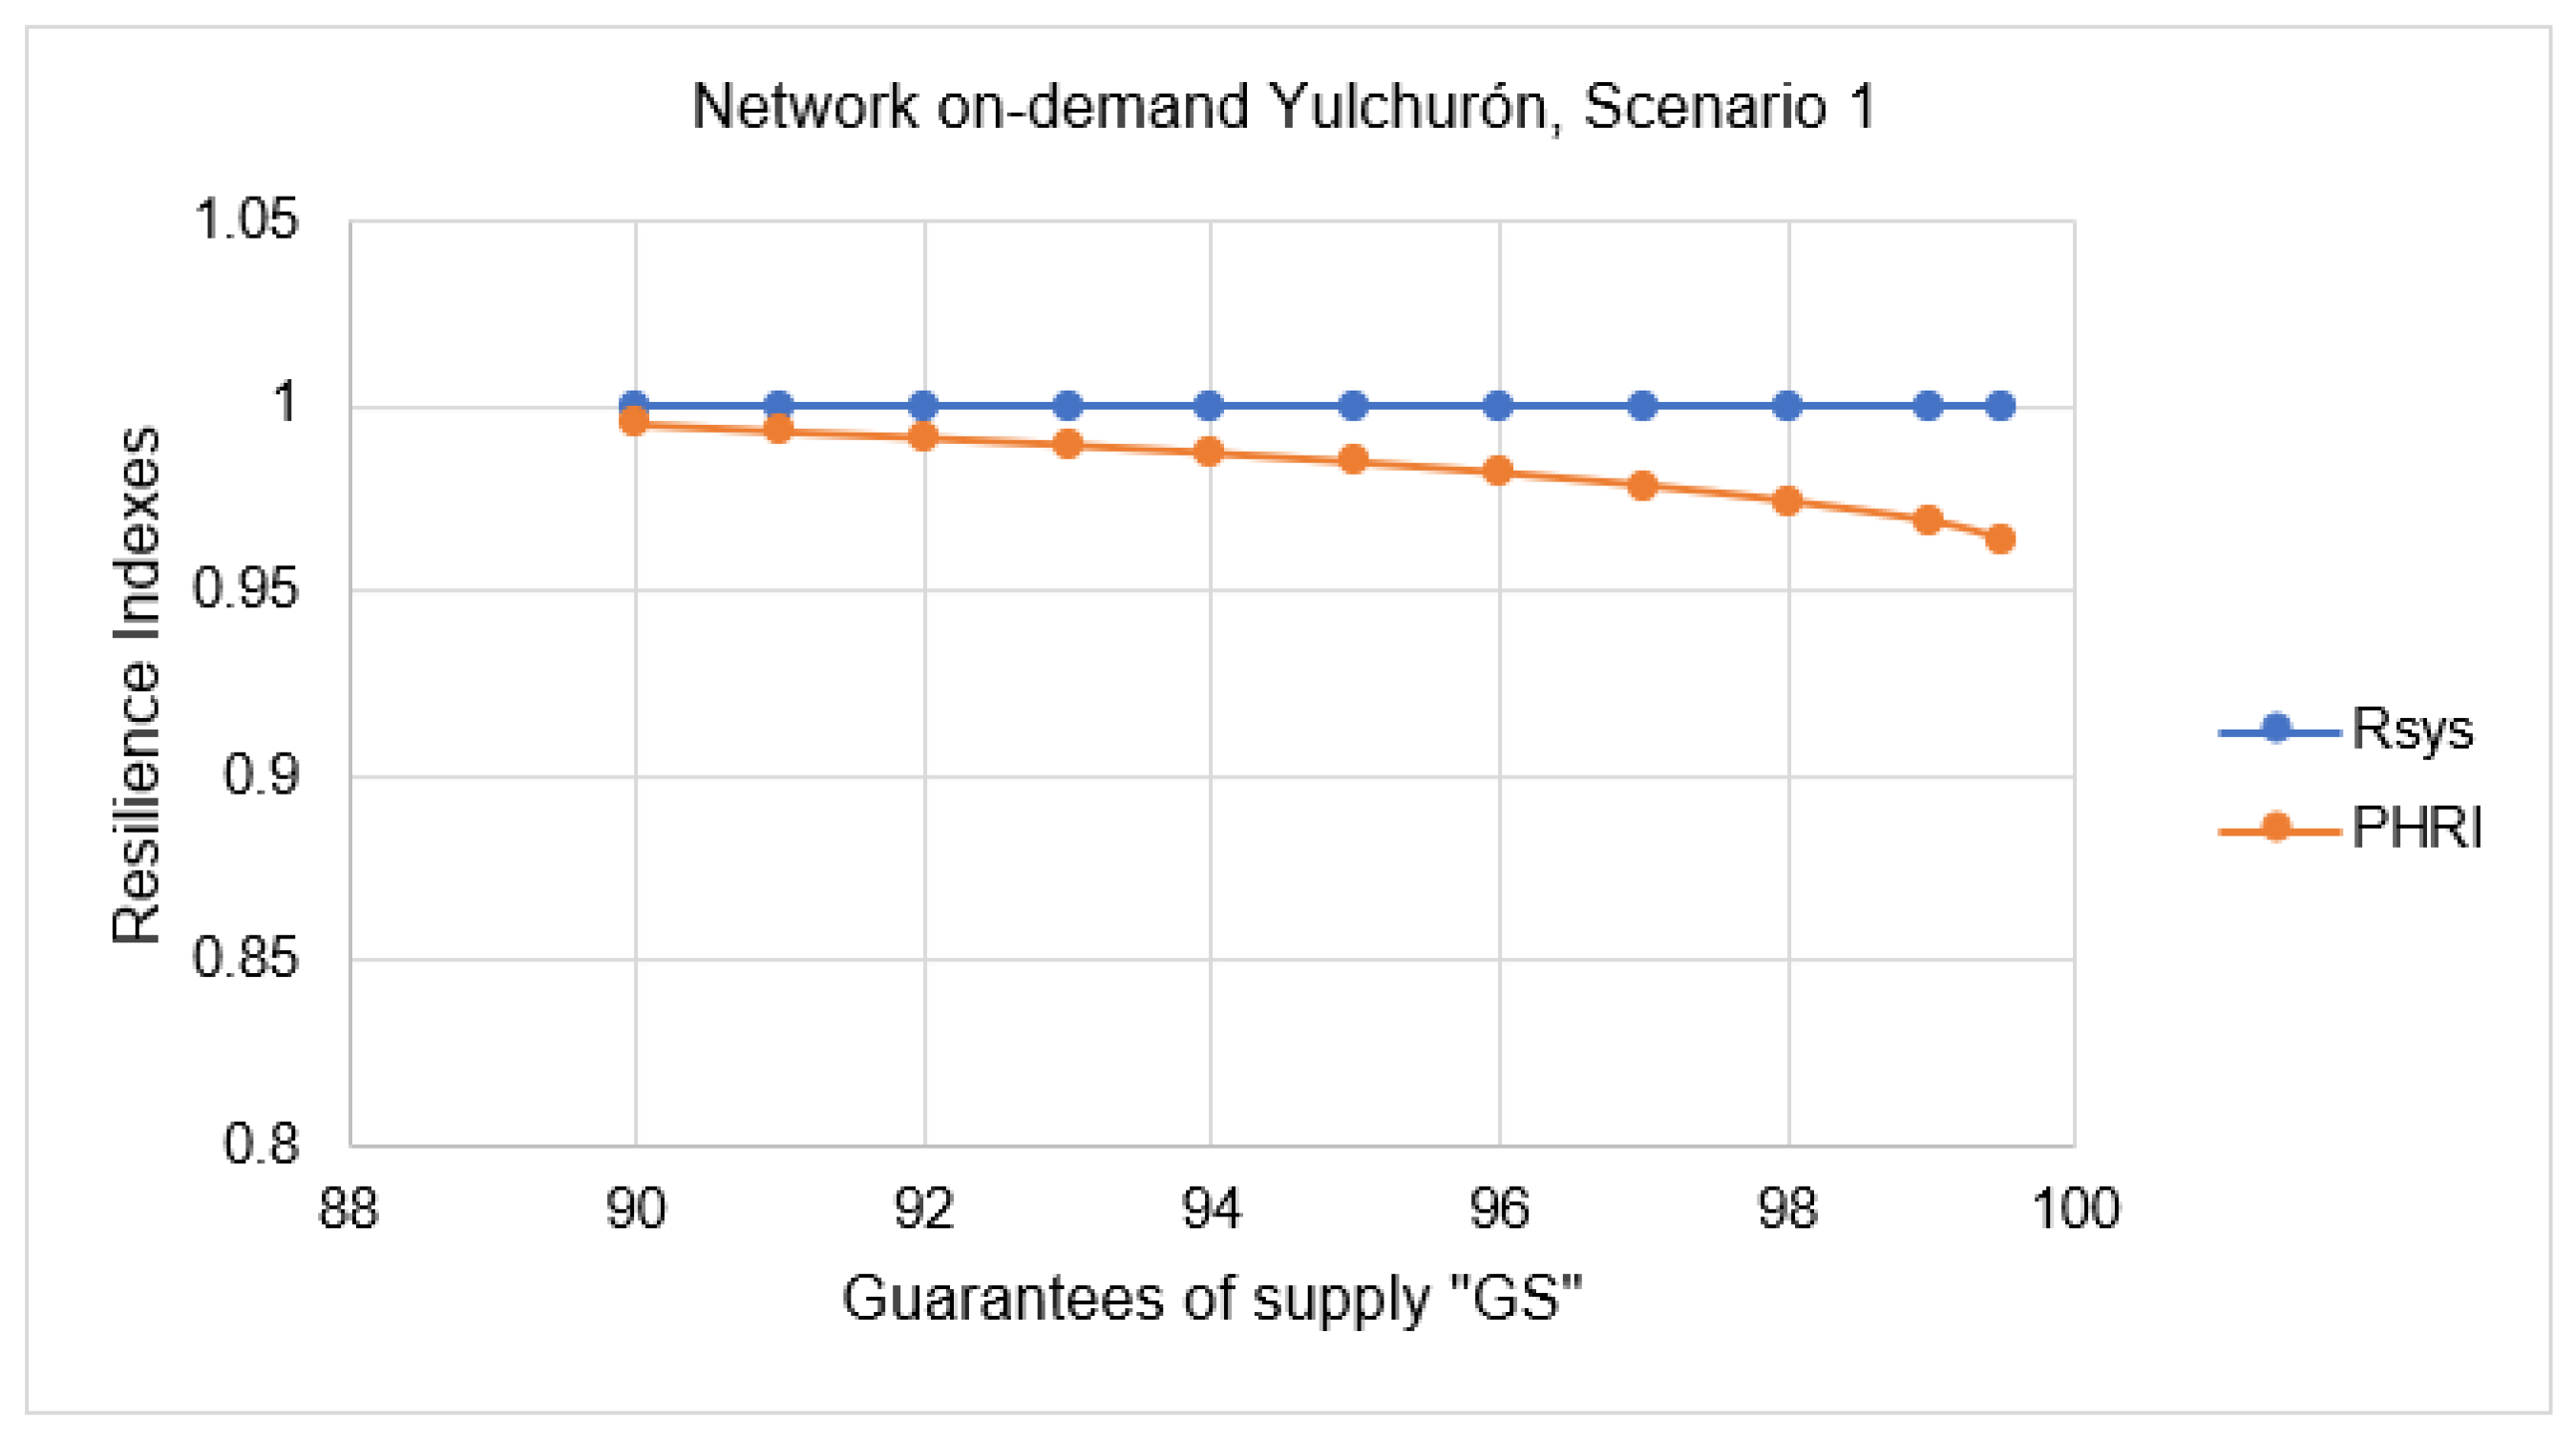
3.5.1. Network Operating On-Demand, Scenario 1
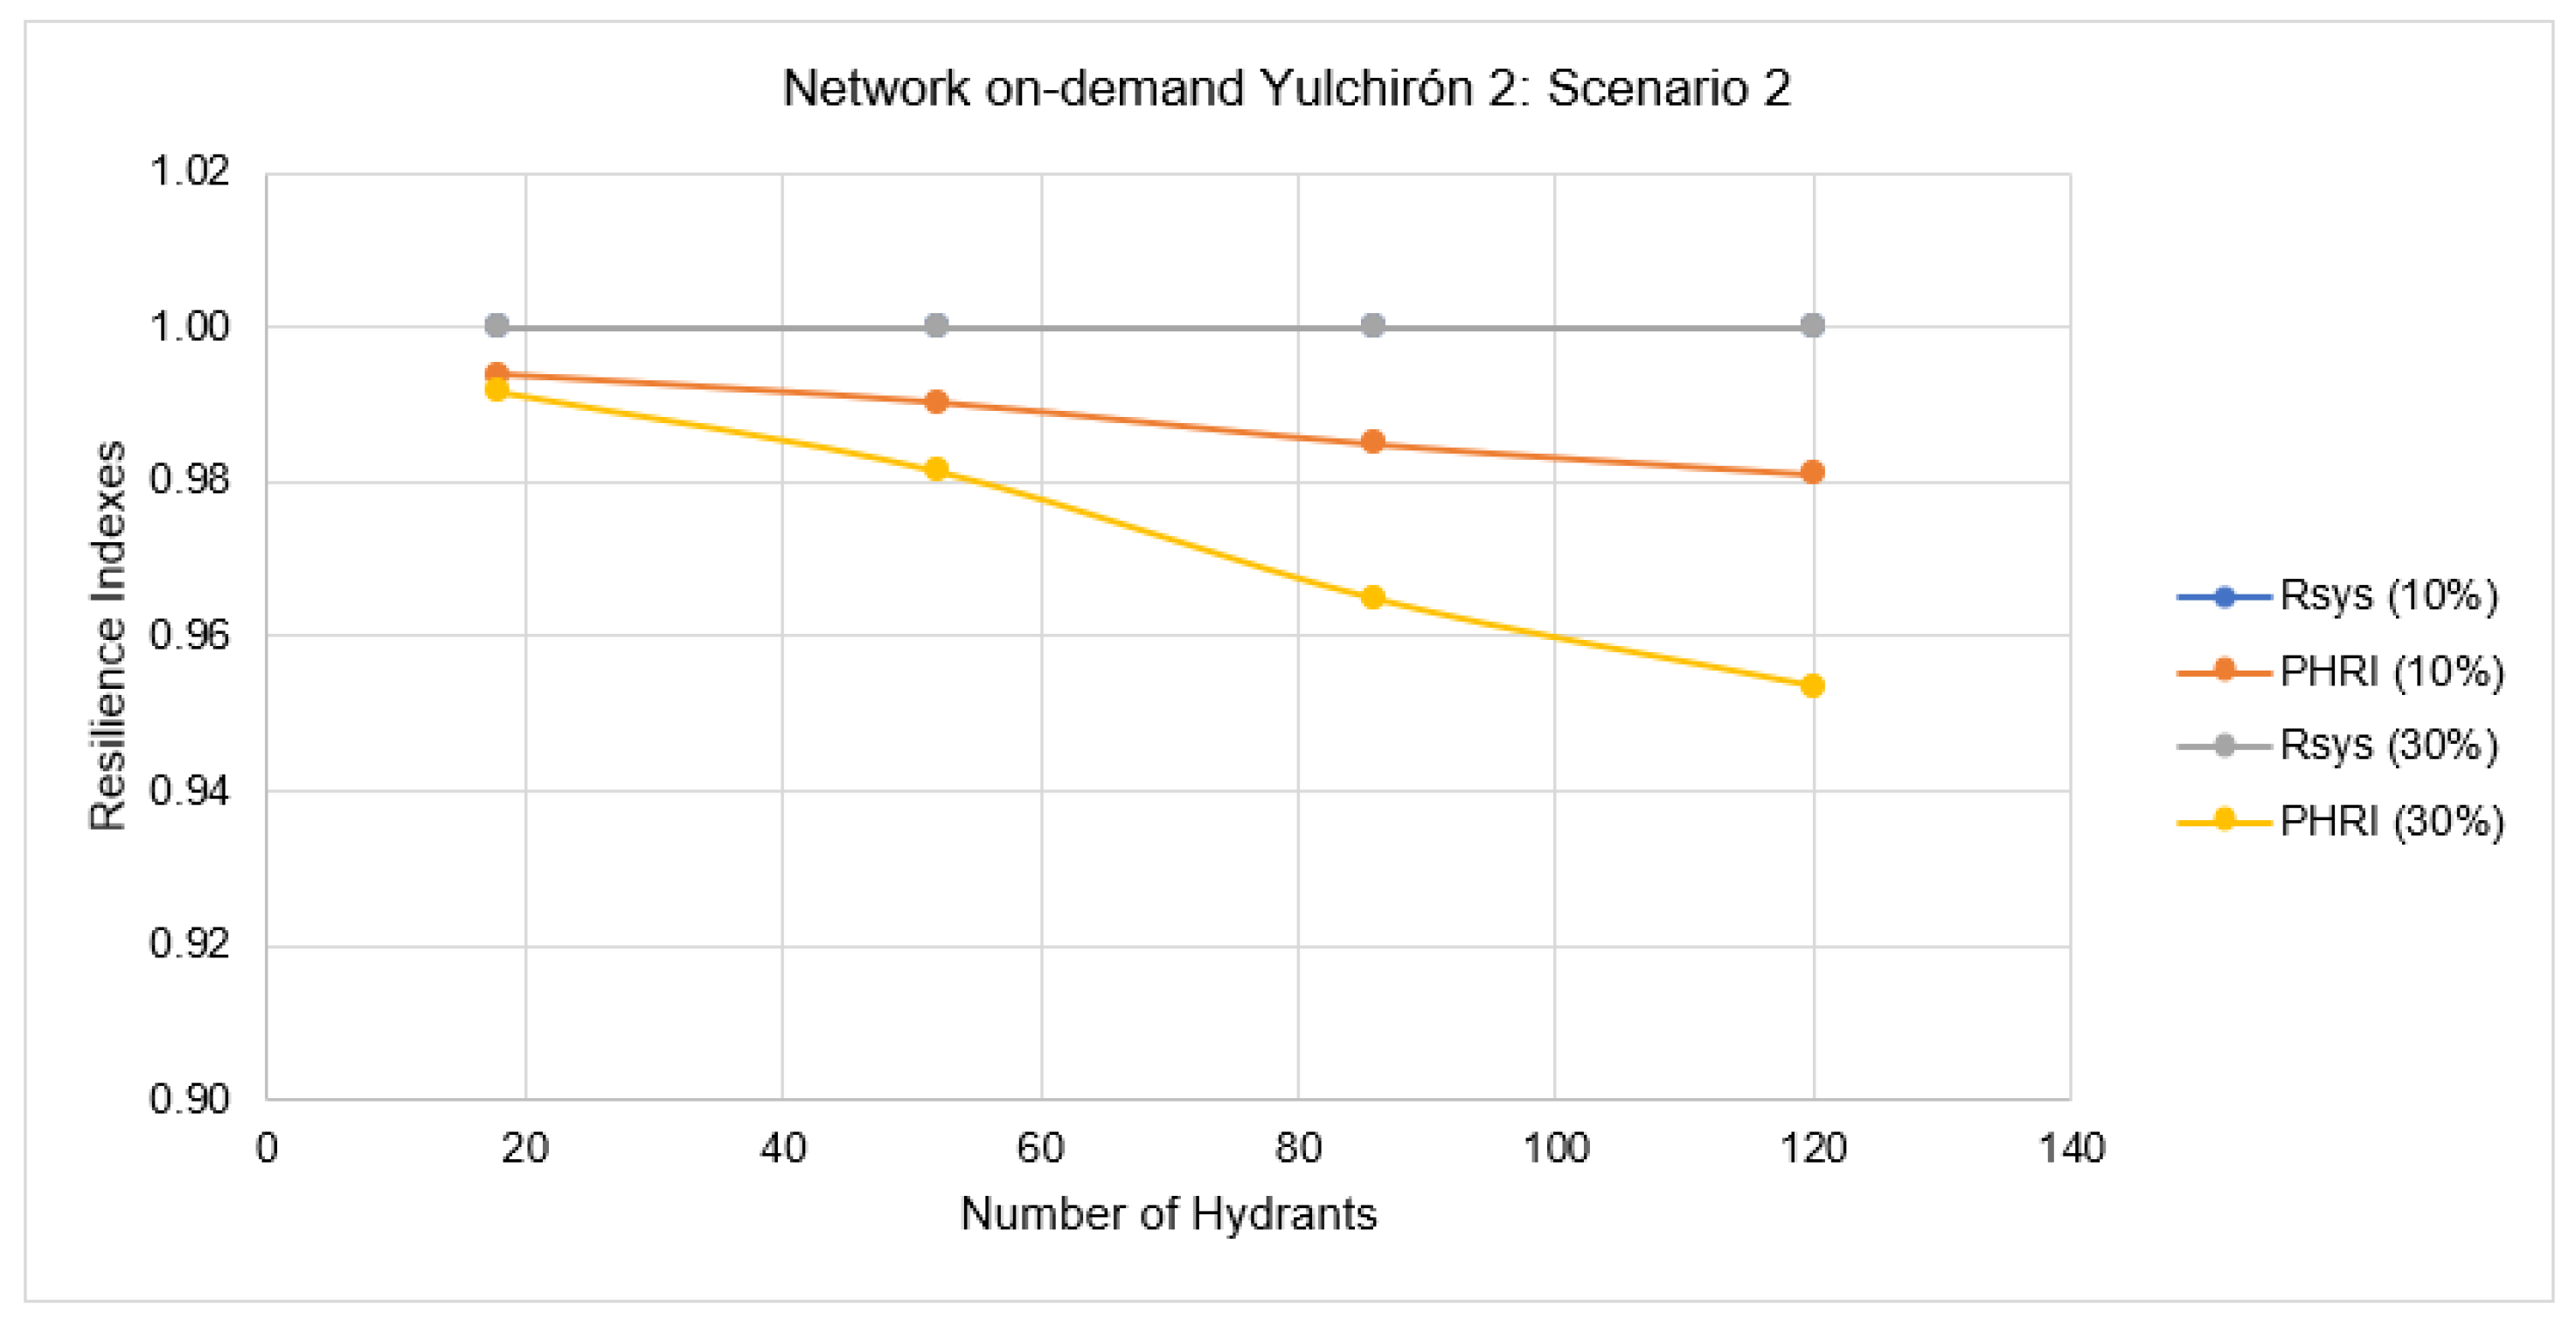
3.5.2. Network Operating On-Demand, Scenario 2
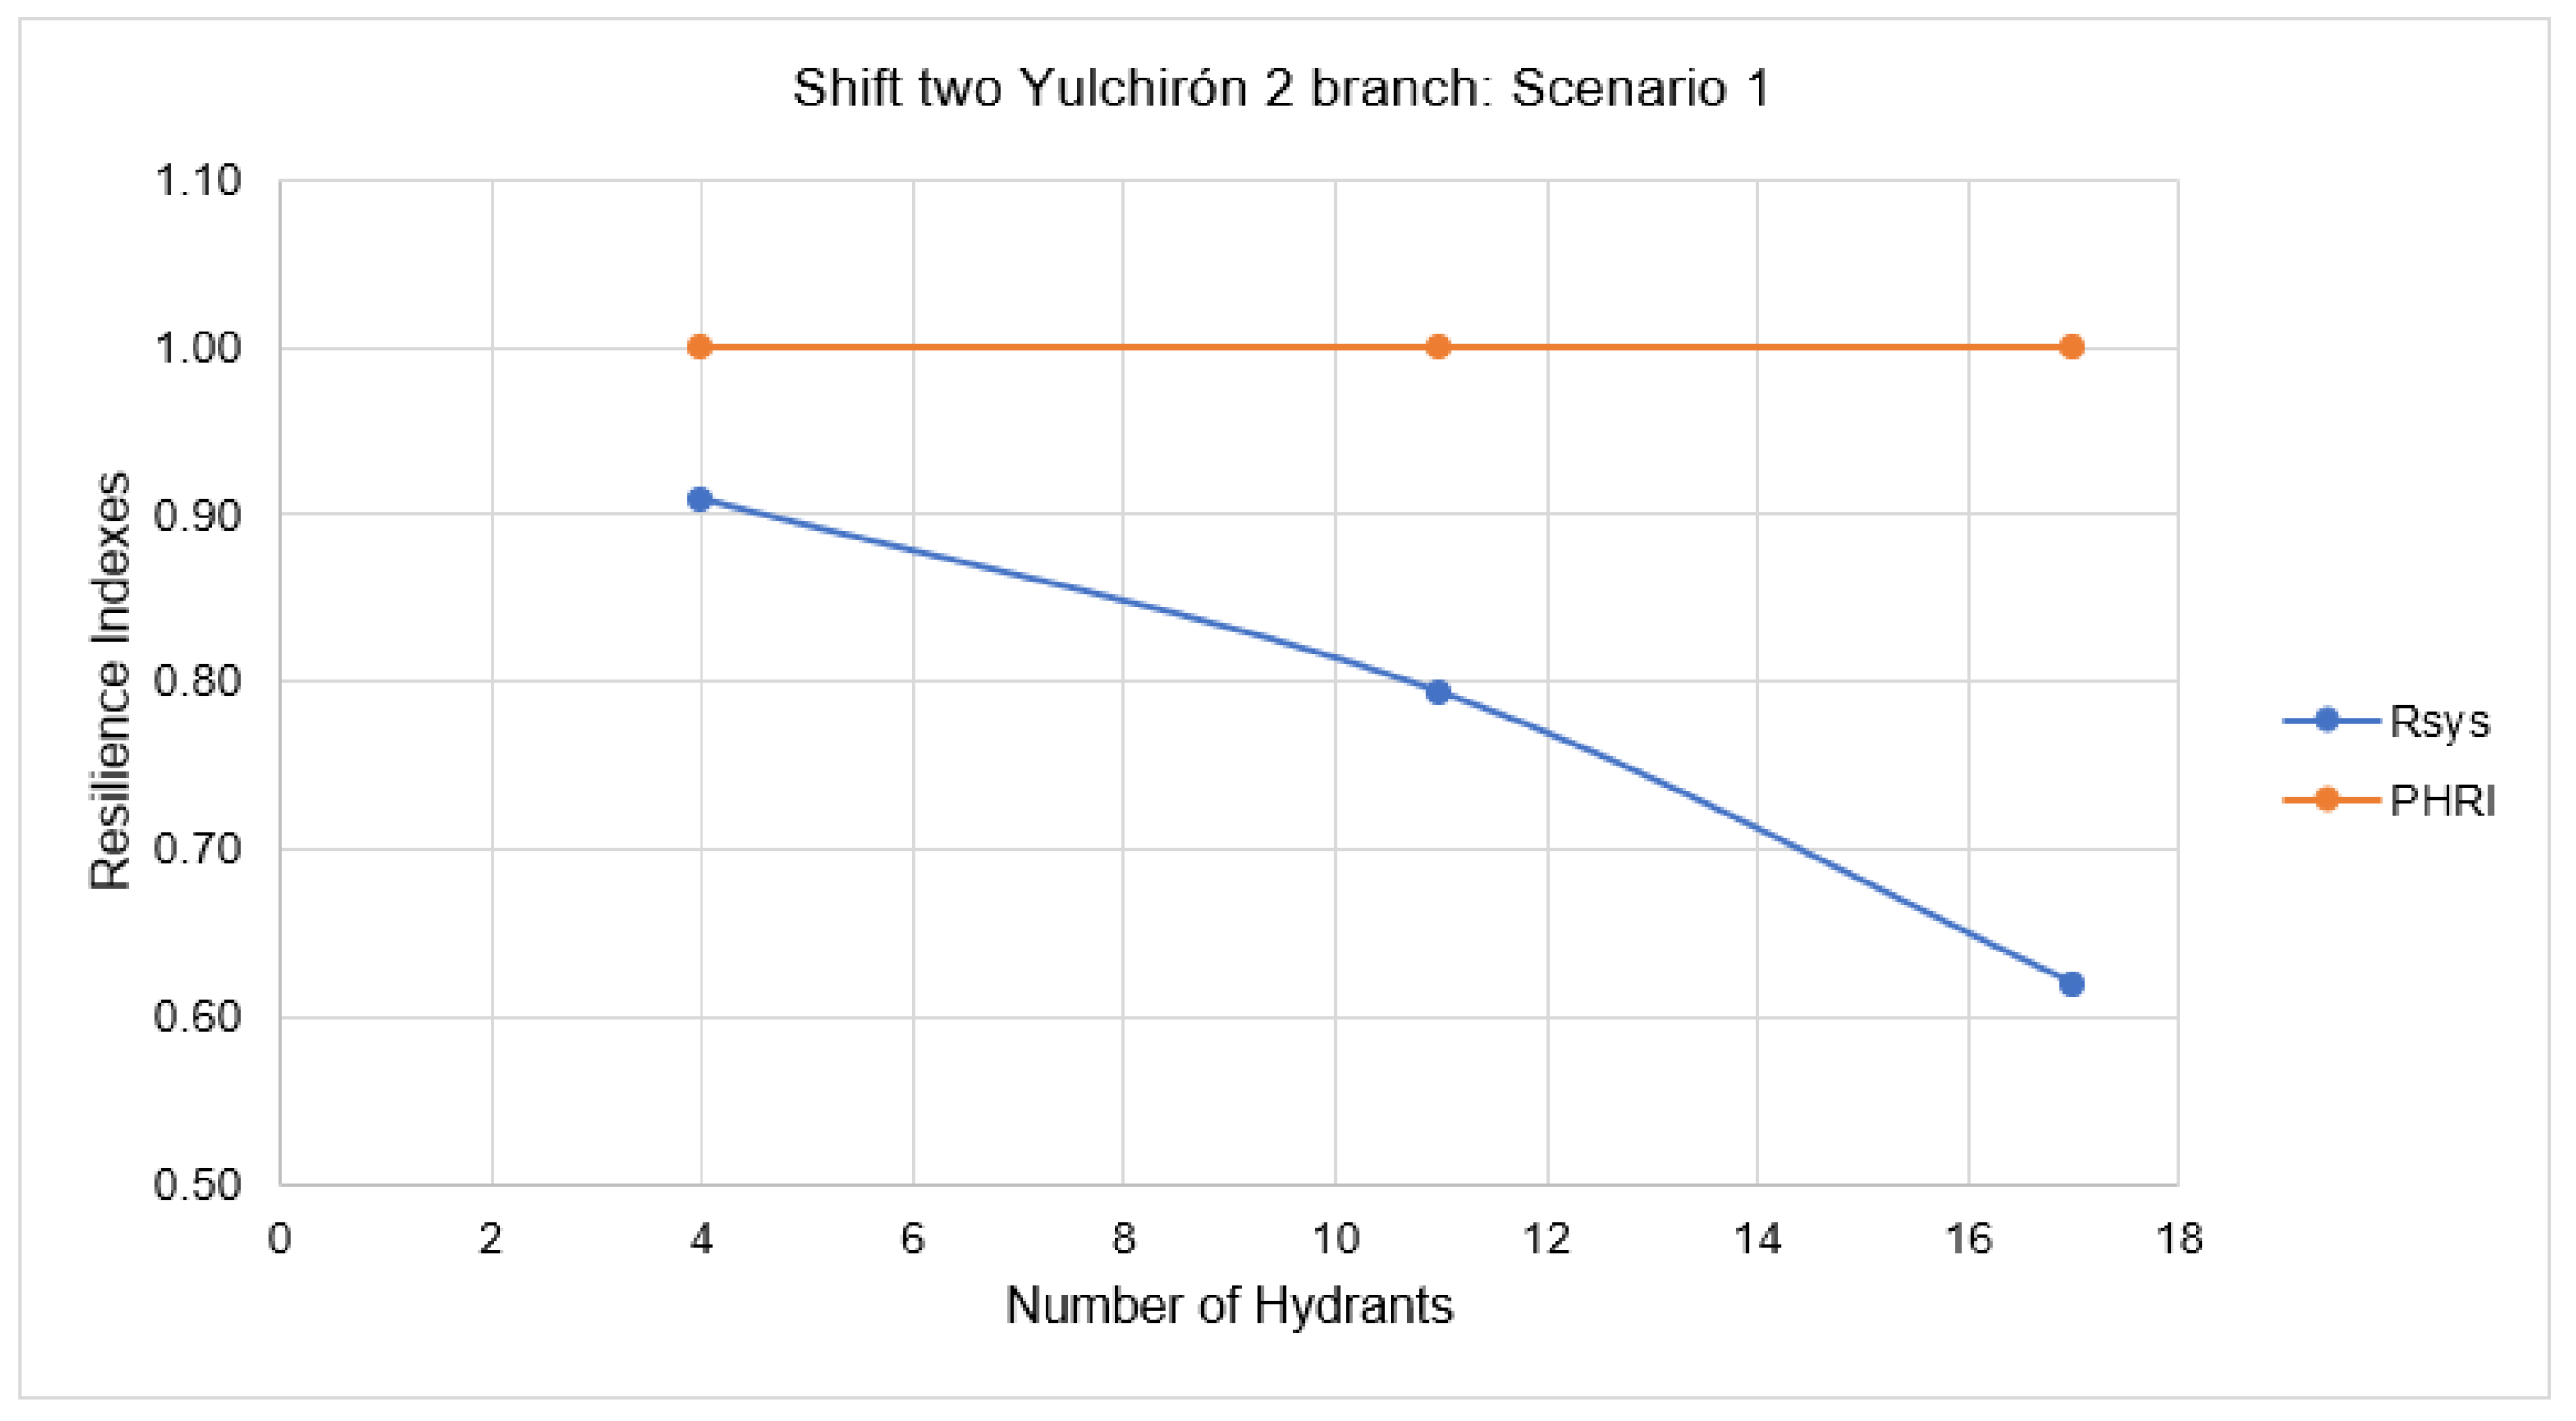
3.5.3. Network Operating in Shifts, Scenario 1
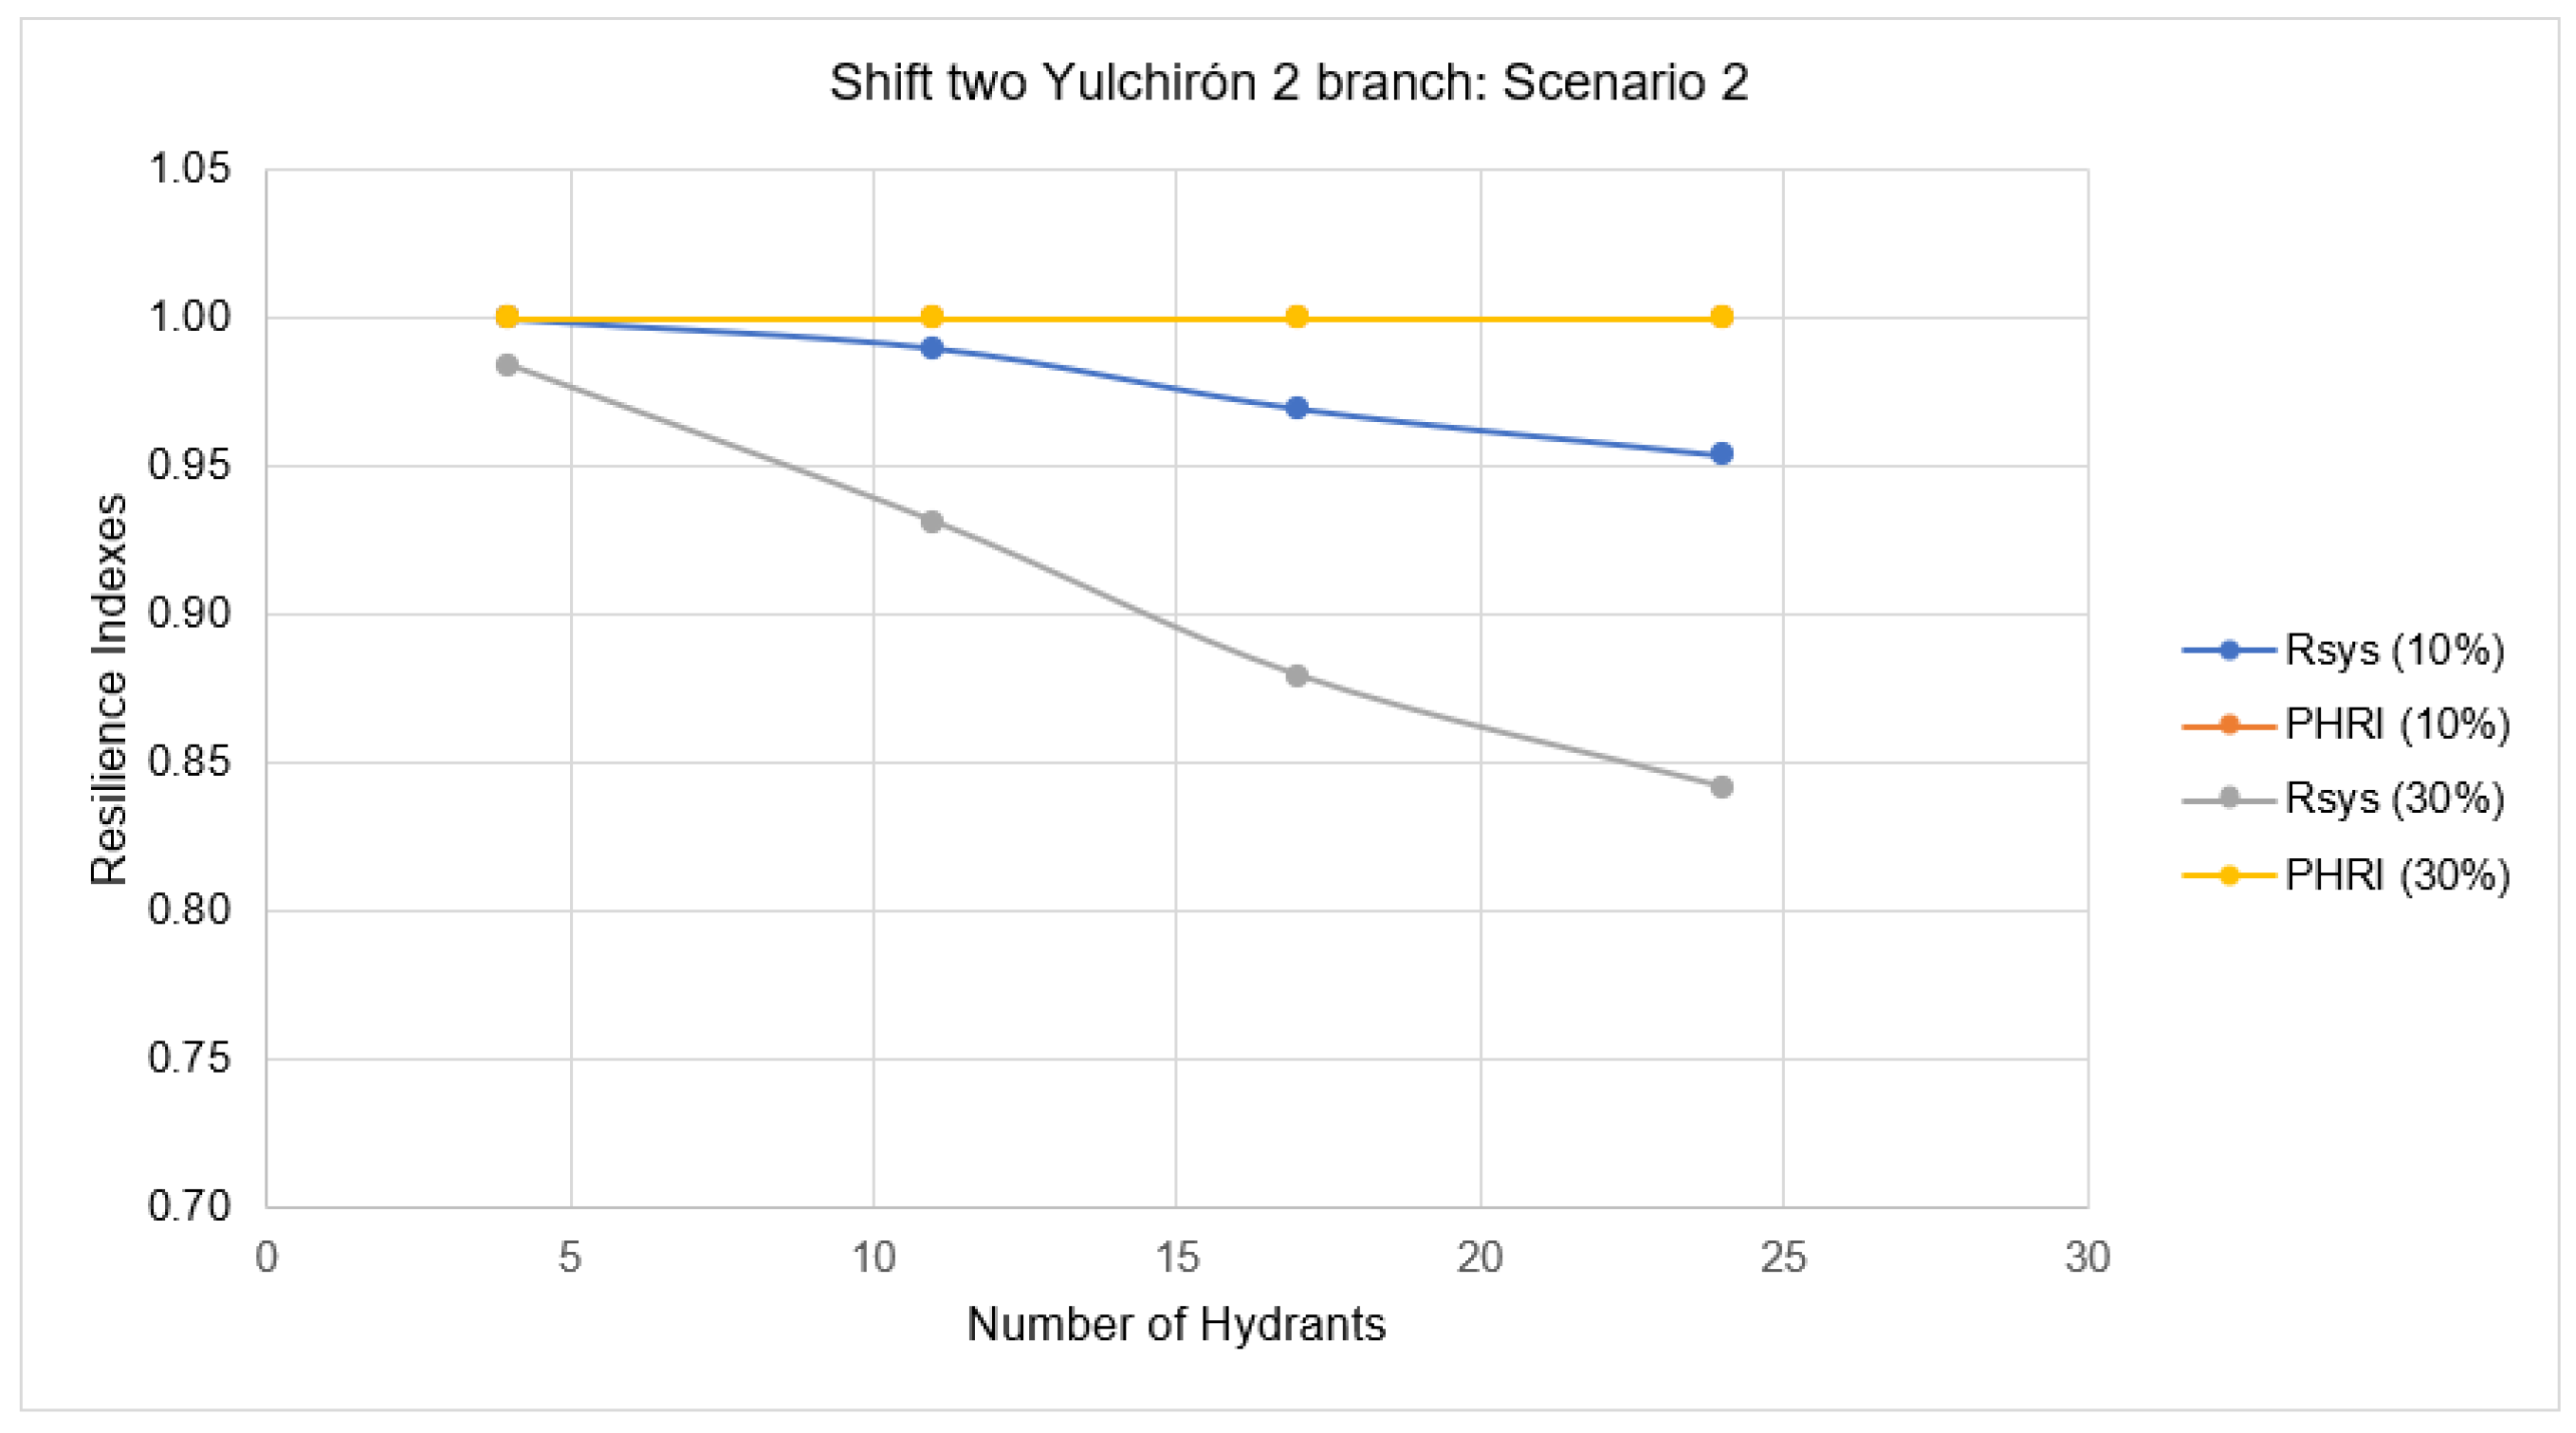
3.5.4. Network Operating in Shifts, Scenario 2
4. Discussion of Results
5. Conclusions
- Irrigation networks operated on demand work in a more flexible way. Hence On demand operated networks do not have disadvantages when water demands are modified. The demand indicator Rsys reach optimal values in the different scenarios proposed for this research.
- Irrigation networks operated in rotation using shifts have a very low flexibility. Whenever there is a disruptive event requiring an increase in flow rate, problems associated with demands arise; this fact is shown by the value of the Rsys indicator, taking much smaller values with respect to those in an on-demand operation.
- The resilience indicators based on demand (Rsys) and on pressure (PHRI) allow to assessing the resilience of both operation modes. The pressure resilience indicator (PHRI)is ideal for assessing an irrigation network operated on demand since the hydraulic behaviour of the network is not affected by changes in operation.
- The demand resilience indicator (Rsys) makes evident the effect that changes in demands have on the consumption nodes of the network.
Author Contributions
Funding
Institutional Review Board Statement
Informed Consent Statement
Data Availability Statement
Conflicts of Interest
References
- FAO. Water for Sustainable Food and Agriculture: A Report Produced for the G20 Presidency of Germany; Food and Agriculture Organization of the United Nations: Roma, Italy, 2017. [Google Scholar]
- Playán, E.; Mateos, L. Modernization and optimization of irrigation systems to increase water productivity. Agric. Water Manag. 2006, 80, 110–116. [Google Scholar] [CrossRef]
- D’Urso, G.; Richter, K.; Calera, A.; Osann, M.A.; Escadafal, R.; Garatuza-Pajan, J.; Hanich, L.; Perdigão, A.; Tapia, J.B.; Vuolo, F. Earth Observation products for operational irrigation management in the context of the PLEIADeS project. Agric. Water Manag. 2010, 98, 271–282. [Google Scholar] [CrossRef]
- Ministerio de Agricultura, Ganadería, Acuacultura y Pesca—MAGAP. La Política Agropecuaria Ecuatoriana: Hacia el Desarrollo Territorial Rural Sostenible: 2015–2025; MAGAP: Quito, Ecuador, 2016.
- Shin, S.; Lee, S.; Judi, D.R.; Parvania, M.; Goharian, E.; McPherson, T.; Burian, S.J. A systematic review of quantitative resilience measures for water infrastructure systems. Water 2018, 10, 164. [Google Scholar] [CrossRef]
- Hosseini, S.; Barker, K.; Ramirez-Marquez, J.E. A review of definitions and measures of system resilience. Reliab. Eng. Syst. Saf. 2016, 145, 47–61. [Google Scholar] [CrossRef]
- Liu, D.; Chen, X.; Nakato, T. Resilience Assessment of Water Resources System. Water Resour. Manag. 2012, 26, 3743–3755. [Google Scholar] [CrossRef]
- Butler, D.; Farmani, R.; Fu, G.; Ward, S.; Diao, K.; Astaraie-Imani, M. A new approach to urban water management: Safe and sure. Procedia Eng. 2014, 89, 347–354. [Google Scholar] [CrossRef]
- Ayala Cabrera, D.; Piller, O.; Herrera, M.; Gilbert, D.; Deuerlein, J. Absorptive resilience phase assessment based on criticality performance indicators for water distribution networks. J. Water Resour. Plan. Manag. 2019, 145, 04019037. [Google Scholar] [CrossRef]
- Liu, H.; Savić, D.A.; Kapelan, Z.; Creaco, E.; Yuan, Y. Reliability surrogate measures for water distribution system design: Comparative analysis. J. Water Resour. Plan. Manag. 2017, 143, 1–14. [Google Scholar] [CrossRef]
- Smith, M.; Allen, R.; Pereira, L. Revised FAO Methodology for Crop-Water Requirements. 1998. Available online: https://www.osti.gov/etdeweb/servlets/purl/676839 (accessed on 30 May 2022).
- Lamaddalena, N.; Sagardoy, J. Performance Analysis of On-Demand Pressurized Irrigation Systems; FAO—CIHEAM Bari Institute: Rome, Italy, 2000. [Google Scholar]
- Lapo, P.C.M.; Pérez-García, R.; Aliod-Sebastián, R.; Martínez-Solano, F.J. Optimal design of irrigation network shifts and characterization of their flexibility. Tecnol. Cienc. Agua 2020, 11, 266–314. [Google Scholar]
- Consejo Provincial De Chimborazo. Estudio de Factibilidad y Diseño Definitivo para el Sistema de Riego de la Comunidad San Francisco de Cunuguachay—Vertiente Chinigua; CPCH: Chimborazo, Ecuador, 2010.
- Instituto Nacional de Meteorología e Hidrología (INAMHI). Anuarios Metereológicos; INAMHI: Quito, Ecuador, 2012.
- Smith, M. CROPWAT: A computer program for irrigation planning and management. FAO Irrig. Drain. 1996, 46, 127. [Google Scholar]
- Rossman, L.A. EPANET 2 Users Manual; EPA/600/R-00/057; U.S. Environmental Protection Agency: Cincinnati, OH, USA, 2000.
- Estrada, C.; González, C.; Aliod, R.; Paño, J. Improved pressurized pipe network hydraulic solver for applications in irrigation systems. J. Irrig. Drain. Eng. 2009, 135, 421–430. [Google Scholar] [CrossRef]
- Carrazón Alocén, J. Manual Práctico para el Diseño de Sistemas de Minirriego; FAO: Roma, Italy, 2007. [Google Scholar]
- Pérez-Sánchez, M.; Carrero, L.M.; Sánchez-Romero, F.J.; López-Jiménez, A. Comparison between Clément’s First Formula and other statistical distributions in a real irrigation network. Irrig. Drain. 2018, 67, 429–440. [Google Scholar] [CrossRef]
- Benavides Muñoz, H.; Cueva Torres, J. Laboratorio virtual para el cálculo de fenómenos transitorios en redes de agua a presión por el método de las características. AXIOMA 2017, 17, 28–44. [Google Scholar]
- Robalino Quizhpe, B.G.; Lapo Pauta, C.M. Caracterización de Parámetros para el Diseño Hidráulico de Redes de Riego a Presión y Redes de Abastecimiento, con Empleo de Software de Aplicación. Bachelor’s Thesis, Universidad Técnica Particular de Loja, Loja, Ecuador, 2018. [Google Scholar]
- Derardja, B.; Lamaddalena, N.; Fratino, U. Perturbation indicators for on-demand pressurized irrigation systems. Water 2019, 11, 558. [Google Scholar] [CrossRef]
- Granados, A. Criterios para el Dimensionamiento de Redes de Riego Robustas Frente a Cambios en la Alternativa de Cultivos; UPM: Madrid, Spain, 2013. [Google Scholar]
- Moosavian, N.; Lence, B.J. Flow-Uniformity Index for Reliable-Based Optimal Design of Water-Distribution Networks. J. Water Resour. Plan. Manag. 2020, 146, 04020005. [Google Scholar] [CrossRef]
- Zhuang, B.; Lansey, K.; Kang, D. Resilience/availability analysis of municipal water distribution system incorporating adaptive pump operation. J. Hydraul. Eng. 2013, 139, 527–537. [Google Scholar] [CrossRef]
- Lapo Pauta, C.M. Diseño Óptimo de Redes de Riego a Presión Para su Explotación a Turnos. Ph.D. Thesis, Universidad Politécnica de Valencia, Valencia, Spain, 2019. Available online: https://riunet.upv.es/handle/10251/130210 (accessed on 25 September 2019).
- Mena Trelles, Y.C.; Lapo Pauta, C.M. Herramienta Virtual para Cálculo de Caudales Circulantes en Redes de Riego a Presión y su Aplicación en el Diseño. Bachelor’s Thesis, Universidad Técnica Particular de Loja, Loja, Ecuador, 2019. [Google Scholar]
- Saldarriaga, J.; Páez, D.; Salcedo, C.; Cuero, P.; López, L.L.; León, N.; Celeita, D. A Direct Approach for the Near-Optimal Design of Water Distribution Networks Based on Power Use. Water 2020, 12, 1037. [Google Scholar] [CrossRef] [Green Version]
- Cambisaca Díaz, D.A. Valoración de Déficit de Energía con Varias Casuísticas en una red de Riego, con uso de Software de Aplicación; Universidad Técnica Particular de Loja: Loja, Ecuador, 2016. [Google Scholar]


| Phase | Procedure |
|---|---|
| Phase 1 Agronomic design | |
| Phase 2 Hydraulic design | |
| Phase 3 Indicators |
|
| Month | Temperatures °C | Relative Humidity % | Wind | ||
|---|---|---|---|---|---|
| Maximum | Minimum | As (m/s) | As (km/day) | ||
| January | 19.883 | 7.339 | 73.652 | 2.256 | 194.884 |
| February | 19.483 | 7.787 | 75.217 | 2.241 | 193.588 |
| March | 19.300 | 7.643 | 76.087 | 2.139 | 184.814 |
| April | 19.148 | 8.083 | 77.217 | 2.120 | 183.192 |
| May | 18.622 | 8.043 | 77.565 | 2.307 | 199.316 |
| June | 17.291 | 7.478 | 77.826 | 2.185 | 188.815 |
| July | 16.670 | 6.735 | 77.478 | 2.189 | 189.145 |
| August | 16.674 | 6.378 | 73.565 | 2.074 | 179.174 |
| September | 17.974 | 6.552 | 74.609 | 2.020 | 174.552 |
| October | 19.900 | 7.074 | 73.043 | 2.180 | 188.329 |
| November | 20.574 | 7.309 | 72.913 | 2.111 | 182.377 |
| December | 20.283 | 7.561 | 74.174 | 2.186 | 188.882 |
| Month | Average Precipitation | Reliable Precipitation |
|---|---|---|
| (mm) | (mm) | |
| January | 48.491 | 40.248 |
| February | 68.117 | 56.537 |
| March | 82.757 | 68.688 |
| April | 102.117 | 84.757 |
| May | 63.657 | 52.835 |
| June | 32.657 | 27.105 |
| July | 17.530 | 14.550 |
| August | 15.635 | 12.977 |
| September | 35.950 | 29.839 |
| October | 68.787 | 57.093 |
| November | 83.032 | 68.916 |
| December | 60.465 | 50.186 |
| GS (%) | Rsys Index | PHRI Index | ||||
|---|---|---|---|---|---|---|
| Qi,t_avl | Qi,t_req | Rsys | ∑Si | ∑(Si + Ai) | PHRI | |
| 90 | 12.231 | 12.231 | 1 | 78,594.440 | 78,984.500 | 0.995 |
| 91 | 12.279 | 12.279 | 1 | 77,506.494 | 78,047.475 | 0.993 |
| 92 | 12.326 | 12.326 | 1 | 76,472.780 | 77,136.721 | 0.991 |
| 93 | 12.381 | 12.381 | 1 | 75,269.272 | 76,072.311 | 0.989 |
| 94 | 12.443 | 12.443 | 1 | 73,902.112 | 74,856.687 | 0.987 |
| 95 | 12.514 | 12.514 | 1 | 72,363.169 | 73,484.345 | 0.985 |
| 96 | 12.600 | 12.600 | 1 | 70,547.172 | 71,848.231 | 0.982 |
| 97 | 12.702 | 12.702 | 1 | 68,400.052 | 69,906.837 | 0.978 |
| 98 | 12.836 | 12.836 | 1 | 65,665.644 | 67,409.900 | 0.974 |
| 99 | 13.047 | 13.047 | 1 | 61,826.454 | 63,832.090 | 0.969 |
| 99.5 | 13.248 | 13.248 | 1 | 58,464.554 | 60,666.293 | 0.964 |
| Q Increase (%) | Hydrants | Rsys Index | PHRI Index | |||||
|---|---|---|---|---|---|---|---|---|
| % | N° | ∑Qi,t_avl | ∑Qi,t_req | Rsys | ∑Si | ∑(Si + Ai) | PHRI | |
| 10 | 10 | 18 | 12.253 | 12.253 | 1 | 78,199.678 | 78,678.481 | 0.994 |
| 30 | 52 | 12.270 | 12.270 | 1 | 77,483.850 | 78,242.717 | 0.990 | |
| 50 | 86 | 12.300 | 12.300 | 1 | 76,132.388 | 77,297.521 | 0.985 | |
| 70 | 120 | 12.327 | 12.327 | 1 | 75,402.729 | 76,858.710 | 0.981 | |
| 30 | 10 | 18 | 12.296 | 12.296 | 1 | 77,433.7742 | 78,082.858 | 0.992 |
| 30 | 52 | 12.344 | 12.344 | 1 | 75,428.2806 | 76,858.457 | 0.981 | |
| 50 | 86 | 12.426 | 12.426 | 1 | 71,595.8103 | 74,205.955 | 0.965 | |
| 70 | 120 | 12.498 | 12.498 | 1 | 69,657.4641 | 73,052.714 | 0.954 | |
| Hydrants | Rsys Index | PHRI Index | |||||
|---|---|---|---|---|---|---|---|
| % | No. | Qi,t_avl | Qi,t_req | Rsys | ∑Si | ∑(Si + Ai) | PHRI |
| 10 | 4 | 16.50 | 18.15 | 0.91 | 71135.28 | 66292.87 | 1 |
| 30 | 11 | 16.50 | 20.80 | 0.79 | 69702.12 | 63414.69 | 1 |
| 50 | 17 | 16.50 | 26.67 | 0.62 | 67779.32 | 63297.18 | 1 |
| Q Increase (%) | Hydrants | Rsys Index | PHRI Index | |||||
|---|---|---|---|---|---|---|---|---|
| % | No. | ∑Qi,t_avl | ∑Qi,t_req | Rsys | ∑Si | ∑(Si + Ai) | PHRI | |
| 10 | 10 | 4 | 16.35 | 16.35 | 1.00 | 98,314.23 | 84,738.20 | 1 |
| 30 | 11 | 16.50 | 16.66 | 0.99 | 96,547.80 | 83,311.77 | 1 | |
| 50 | 17 | 16.50 | 17.01 | 0.97 | 98,411.55 | 84,744.42 | 1 | |
| 70 | 24 | 16.50 | 17.29 | 0.95 | 95,601.72 | 82,489.91 | 1 | |
| 30 | 10 | 4 | 16.50 | 16.76 | 0.98 | 97,885.49 | 84,375.59 | 1 |
| 30 | 11 | 16.50 | 17.71 | 0.93 | 94,910.36 | 82,293.16 | 1 | |
| 50 | 17 | 16.50 | 18.76 | 0.88 | 100,742.10 | 86,670.37 | 1 | |
| 70 | 24 | 16.50 | 19.60 | 0.84 | 90,904.40 | 78,916.17 | 1 | |
Publisher’s Note: MDPI stays neutral with regard to jurisdictional claims in published maps and institutional affiliations. |
© 2022 by the authors. Licensee MDPI, Basel, Switzerland. This article is an open access article distributed under the terms and conditions of the Creative Commons Attribution (CC BY) license (https://creativecommons.org/licenses/by/4.0/).
Share and Cite
Lapo Pauta, C.M.; Briceño Ojeda, V.A.; Martínez-Solano, F.J.; Benavides Muñoz, H. Implementation of Quantitative Resilience Measurement Criteria in Irrigation Systems. Water 2022, 14, 2698. https://doi.org/10.3390/w14172698
Lapo Pauta CM, Briceño Ojeda VA, Martínez-Solano FJ, Benavides Muñoz H. Implementation of Quantitative Resilience Measurement Criteria in Irrigation Systems. Water. 2022; 14(17):2698. https://doi.org/10.3390/w14172698
Chicago/Turabian StyleLapo Pauta, Carmen Mireya, Viviana A. Briceño Ojeda, Francisco Javier Martínez-Solano, and Holger Benavides Muñoz. 2022. "Implementation of Quantitative Resilience Measurement Criteria in Irrigation Systems" Water 14, no. 17: 2698. https://doi.org/10.3390/w14172698
APA StyleLapo Pauta, C. M., Briceño Ojeda, V. A., Martínez-Solano, F. J., & Benavides Muñoz, H. (2022). Implementation of Quantitative Resilience Measurement Criteria in Irrigation Systems. Water, 14(17), 2698. https://doi.org/10.3390/w14172698