Article

Velocity Measurements in Highly Aerated Flow on a Stepped Chute without Sidewall Constraint Using a BIV Technique

by
Martí Sánchez-Juny
1,*,
Soledad Estrella
1,
Jorge Matos
2,
Ernest Bladé
1,
Eduardo Martínez-Gomariz
1 and
Enrique Bonet Gil
1
1
Flumen Institute, Universitat Politècnica de Catalunya-CIMNE, 08034 Barcelona, Spain
2
CERIS, Instituto Superior Técnico, Universidade de Lisboa, 1049-001 Lisboa, Portugal
*
Author to whom correspondence should be addressed.
Water 2022, 14(16), 2587; https://doi.org/10.3390/w14162587
Submission received: 8 July 2022 / Revised: 18 August 2022 / Accepted: 19 August 2022 / Published: 22 August 2022
(This article belongs to the Special Issue Advances in Experimental Hydraulics, Coast and Ocean Hydrodynamics)

Abstract

:
The lack of sidewalls in a spillway leads to lateral expansion of the flow and, consequently, a non-uniform transversal flow rate distribution along the chute. The present work shows the velocity field measured in a physical model of a 1 V:0.8 H steeply sloping stepped spillway without sidewalls. An application of a Bubble Image Velocimetry (BIV) technique in the self-aerated region is shown, using air bubbles entrained into the flow downstream of the inception point as tracers. The results indicate that, for small dimensionless discharges and sufficiently downstream of the point of inception, the free-surface velocity compares relatively well with the corresponding air–water interfacial velocity previously obtained with a double-tip fiber optical probe in the same facility. In turn, the velocity profiles along the normal to the pseudo-bottom, far downstream of the inception point, are reasonably in agreement with the air–water interfacial velocity profiles in the inner part of the skimming flow, with the largest differences being verified in the upper skimming flow region near the free-surface.

1. Introduction

Since the early 1980s, when systematic laboratory investigations into the hydraulic performance of stepped spillways were begun, there has been a significant interest in the design of stepped spillways [1,2,3,4].
The use of classical and state-of-the-art metrology in laboratory studies has greatly contributed to the understanding of both macroscopic and microscopic properties of the highly turbulent flow over stepped spillways. Examples of application of such techniques include piezoresistive pressure transducers with high sampling frequency for measuring pressure fluctuations and extreme pressures on the step faces [5,6,7,8,9,10,11], acoustic emission technology for detecting cavitation characteristics, along with high-speed videography to provide additional insight into the flow features that drive the formation of cavitation [12], conductivity probes and fiber-optical probes for measuring local air concentration along with other microscopic air–water flow properties, and/or velocity [13,14,15,16,17,18,19,20,21,22], conductivity probes along with back-flushing Pitot tubes for estimating the local air concentration and velocity [23,24,25,26,27], and Laser Doppler Anemometry (LDA) [28] or PIV [29] for measuring the turbulent flow properties in the non-aerated flow region.
In addition, the advancements of non-intrusive flow visualization techniques lead to novel procedures, such as ultrasonic sensors or Light Detection and Ranging system (LiDAR), for estimating free-surface turbulence or air–water flow properties [30,31]. Bubble Image Velocimetry (BIV) and Optical Flow methods have also been applied to highly aerated flows, namely in stepped spillways. Different applications of those techniques in the aerated region of stepped chutes were shown in [32,33,34,35] and [36]. In particular, [32] applied the BIV technique to measure the void fraction and velocity profiles in a stepped spillway with a 1 V:2 H slope, [34] and [35] applied the same in a 1 V:1 H stepped chute; they showed that results tend to underestimate flow velocities when compared to the conductivity and phase detection probes data. In turn, [36] calibrated a 3D numerical model using an ultrasonic sensor and Bubble Image Velocimetry in a 0.5 m wide, 1 V:2 H stepped flume. Image-based analysis of free-surface flows on a stepped spillway was also conducted at model and prototype scales [37,38]. In [37], a robust optical flow (OF) technique was applied to video movies taken from a downstream observation platform. The OF data provided physically meaningful surface velocities in the non-aerated flow region upstream of the inception of free-surface aeration. A novel conceptual model of a 3D entrapment mechanism was also proposed, based upon the prototype observations. In [38], an image-based analysis of free-surface flows on a stepped spillway was conducted from a top-view perspective at laboratory scale (fixed camera installation) and prototype scale (drone footage). The drone videos were obtained from citizen science data. Analyses were used to estimate the location of the point of inception, air–water surface velocities, and their fluctuations, as well as the residual energy at the downstream end of the chute. Those studies highlighted the feasibility of image-based measurements at prototype spillways.
In the present work, image processing techniques have also been applied. Images have been recorded using a high-speed video camera, and later processed using particle image velocimetry (PIV) techniques. The application of PIV in any sort of flow relies on the ability of tracer particles to follow the flow. In the present study, PIVlab [39,40] has been used, which is an open-source toolbox available in MATLAB©. This application obtains the flow velocity field through image processing using the classical non-intrusive PIV technique [41,42,43,44]. A PIV analysis usually consists of three parts: pre-processing, evaluation, and post-processing of the images. Image pre-processing is done to improve the quality of the images before correlating them. The image evaluation is based on the comparison of overlapped regions of a pair of consecutive images, called interrogation areas, in order to obtain the most probable displacement of a particle within these zones. This evaluation is mathematically expressed as a cross-correlation algorithm. Usually, it is necessary to post-process the images in order to obtain reliable results. A basic method for filtering outliers is to manually choose acceptable velocity limits. However, they can also be filtered semi-automatically by comparing each velocity component with previously set lower and upper thresholds. After removing these atypical values, the deleted vectors are replaced by interpolated values.
The scope of this paper is to illustrate the velocity field measured in highly aerated flow on a stepped spillway without side constraint using its own air bubbles trapped in the flow as tracers by means of the BIV technique. The results obtained for distinct flow rates, image acquisition rates, and size of the interrogation areas are presented and analyzed.

2. Experimental Set-Up

2.1. Physical Model

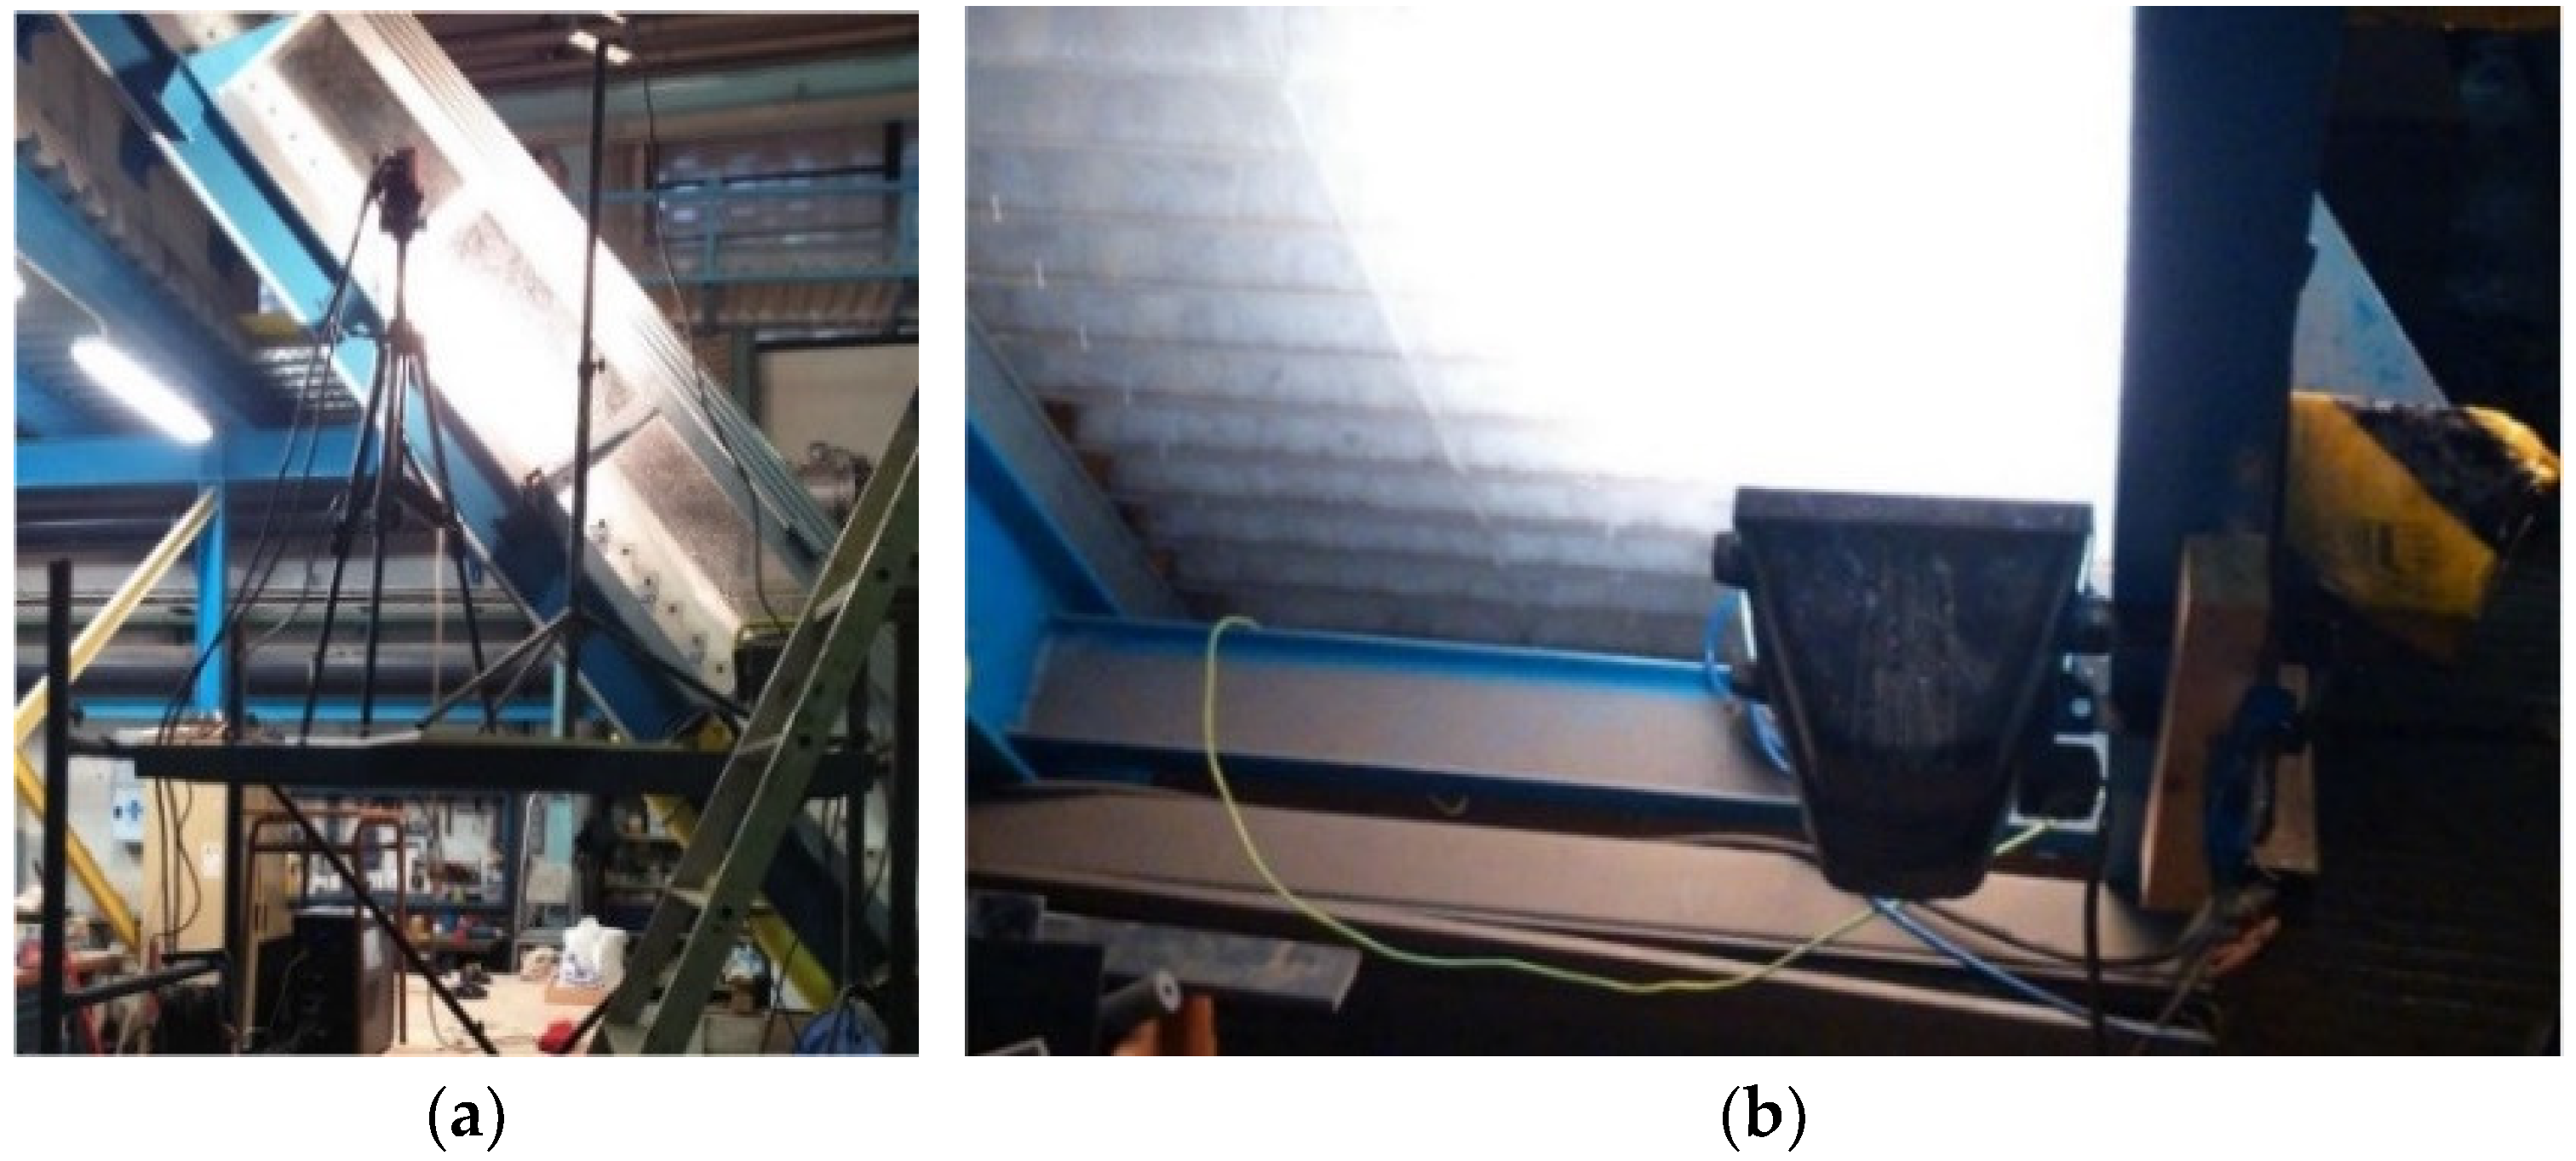
The experimental data presented in this paper were gathered on a stepped chute assembled at the Hydraulics and Fluid Mechanics Laboratory of the Civil Engineering School at the Universitat Politècnica de Catalunya (UPC), in the framework of [45]. The model is 5 m high (from crest to toe), with a slope of 1 V:0.8 H and a total width of 3.0 m (Figure 1). It consists of 57 identical steps 0.08 m high ( h ), 0.064 m long ( l ), and 8 additional steps at the top of the model fitted to a Creager profile [17]. In its upper part, the spillway includes a 0.75 m long guiding wall at 1 m of the right side of the chute (view from upstream). Downstream of this wall, the flow is allowed to spread across the width of the chute. The model is built of transparent methacrylate in order to allow visual inspection of the flow. The hydraulic behavior of stepped spillways without sidewalls was studied in [17,45]. In these studies, results such as the point of inception of air entrainment, the transversal flow rate distribution due to lateral expansion, the development along the chute of the characteristic flow depth, and the air concentration or the velocity and pressure fields were presented.
In the present study, the discharge varied between 85 and 260 l/s, and the dimensionless flow rate d c / h , varied between 1.13 and 2.38, where d c is the critical depth and h is the step height.

2.2. Video Recording Apparatus

The images were recorded with a high-speed video camera positioned in front of the model. The camcorder used in this work was the MV2-D1280-640 CMOS model from the Photonfocus company (Lachen, Switzerland). This camera has a resolution of 1.3 megapixels and can record up to 490 fps (frames per second) at its maximum resolution of 1280 × 1024 pixels.
Additionally, the camcorder needs a high-capacity computer, as the camera generates a significant amount of information. Therefore, an Intel Core i7 processor and 12 GB of RAM was used.
An image is made up of a set of illuminated dots, called pixels. The light intensity of each point in the actual image is captured by the digital camera, storing each pixel as a combination of 8 bit. Therefore, 28 = 256 light intensity values can be obtained, where the value 0 corresponds to black and the value 255 to white.

3. Methodology

3.1. Position of the Camera

Two different views of the flow have been recorded: frontal and lateral. From the frontal images, the velocity field near the complex free-surface of the flow (hereinafter referred to simply as free-surface) has been determined. On the other hand, from the lateral recordings, a characteristic flow depth and the depth-wise velocity profile on the chute have been estimated.

3.1.1. Frontal View

The high-speed video camera was positioned at the front of the stepped chute, on a platform of about 3.5 m high. Given the dimensions of the experimental facility and the characteristics of the camera used, only images of an initial reach of the stepped chute were obtained, as shown in Figure 2. This area goes, longitudinally, from L / L t = 0.17 to 0.44, that is from step 11 to step 29, and transversely, up to 2.25 m from the right side of spillway ( L being the streamwise distance along the chute to the outer edge of the step and L t being the total length of the chute).
Dimensionless discharge ( d c / h ) of 1.13, 1.83, and 2.38 was recorded at 200 fps and 400 fps. The recorded videos were fragmented, that is, 1000 images of 1280 × 1024 pixels were obtained from each video.

3.1.2. Lateral View

In this case, the images collected correspond to the right side of the chute, on the step corresponding to L / L t = 0.49 . This step is located shortly downstream of the field of view used in the frontal videos. Additionally, a third group of images were obtained on the locations corresponding to L / L t = 0.88 and 0.89. Figure 3 shows the image collection apparatus used to obtain video recordings on L / L t = 0.49 with frontal illumination (equivalent to that on L / L t = 0.88   and   0.89 ). Either way, due to the lighting system, this method in contrast to the PIV does not discern the velocity field exactly in the same plane.

3.2. Folding Images

3.2.1. Frontal View

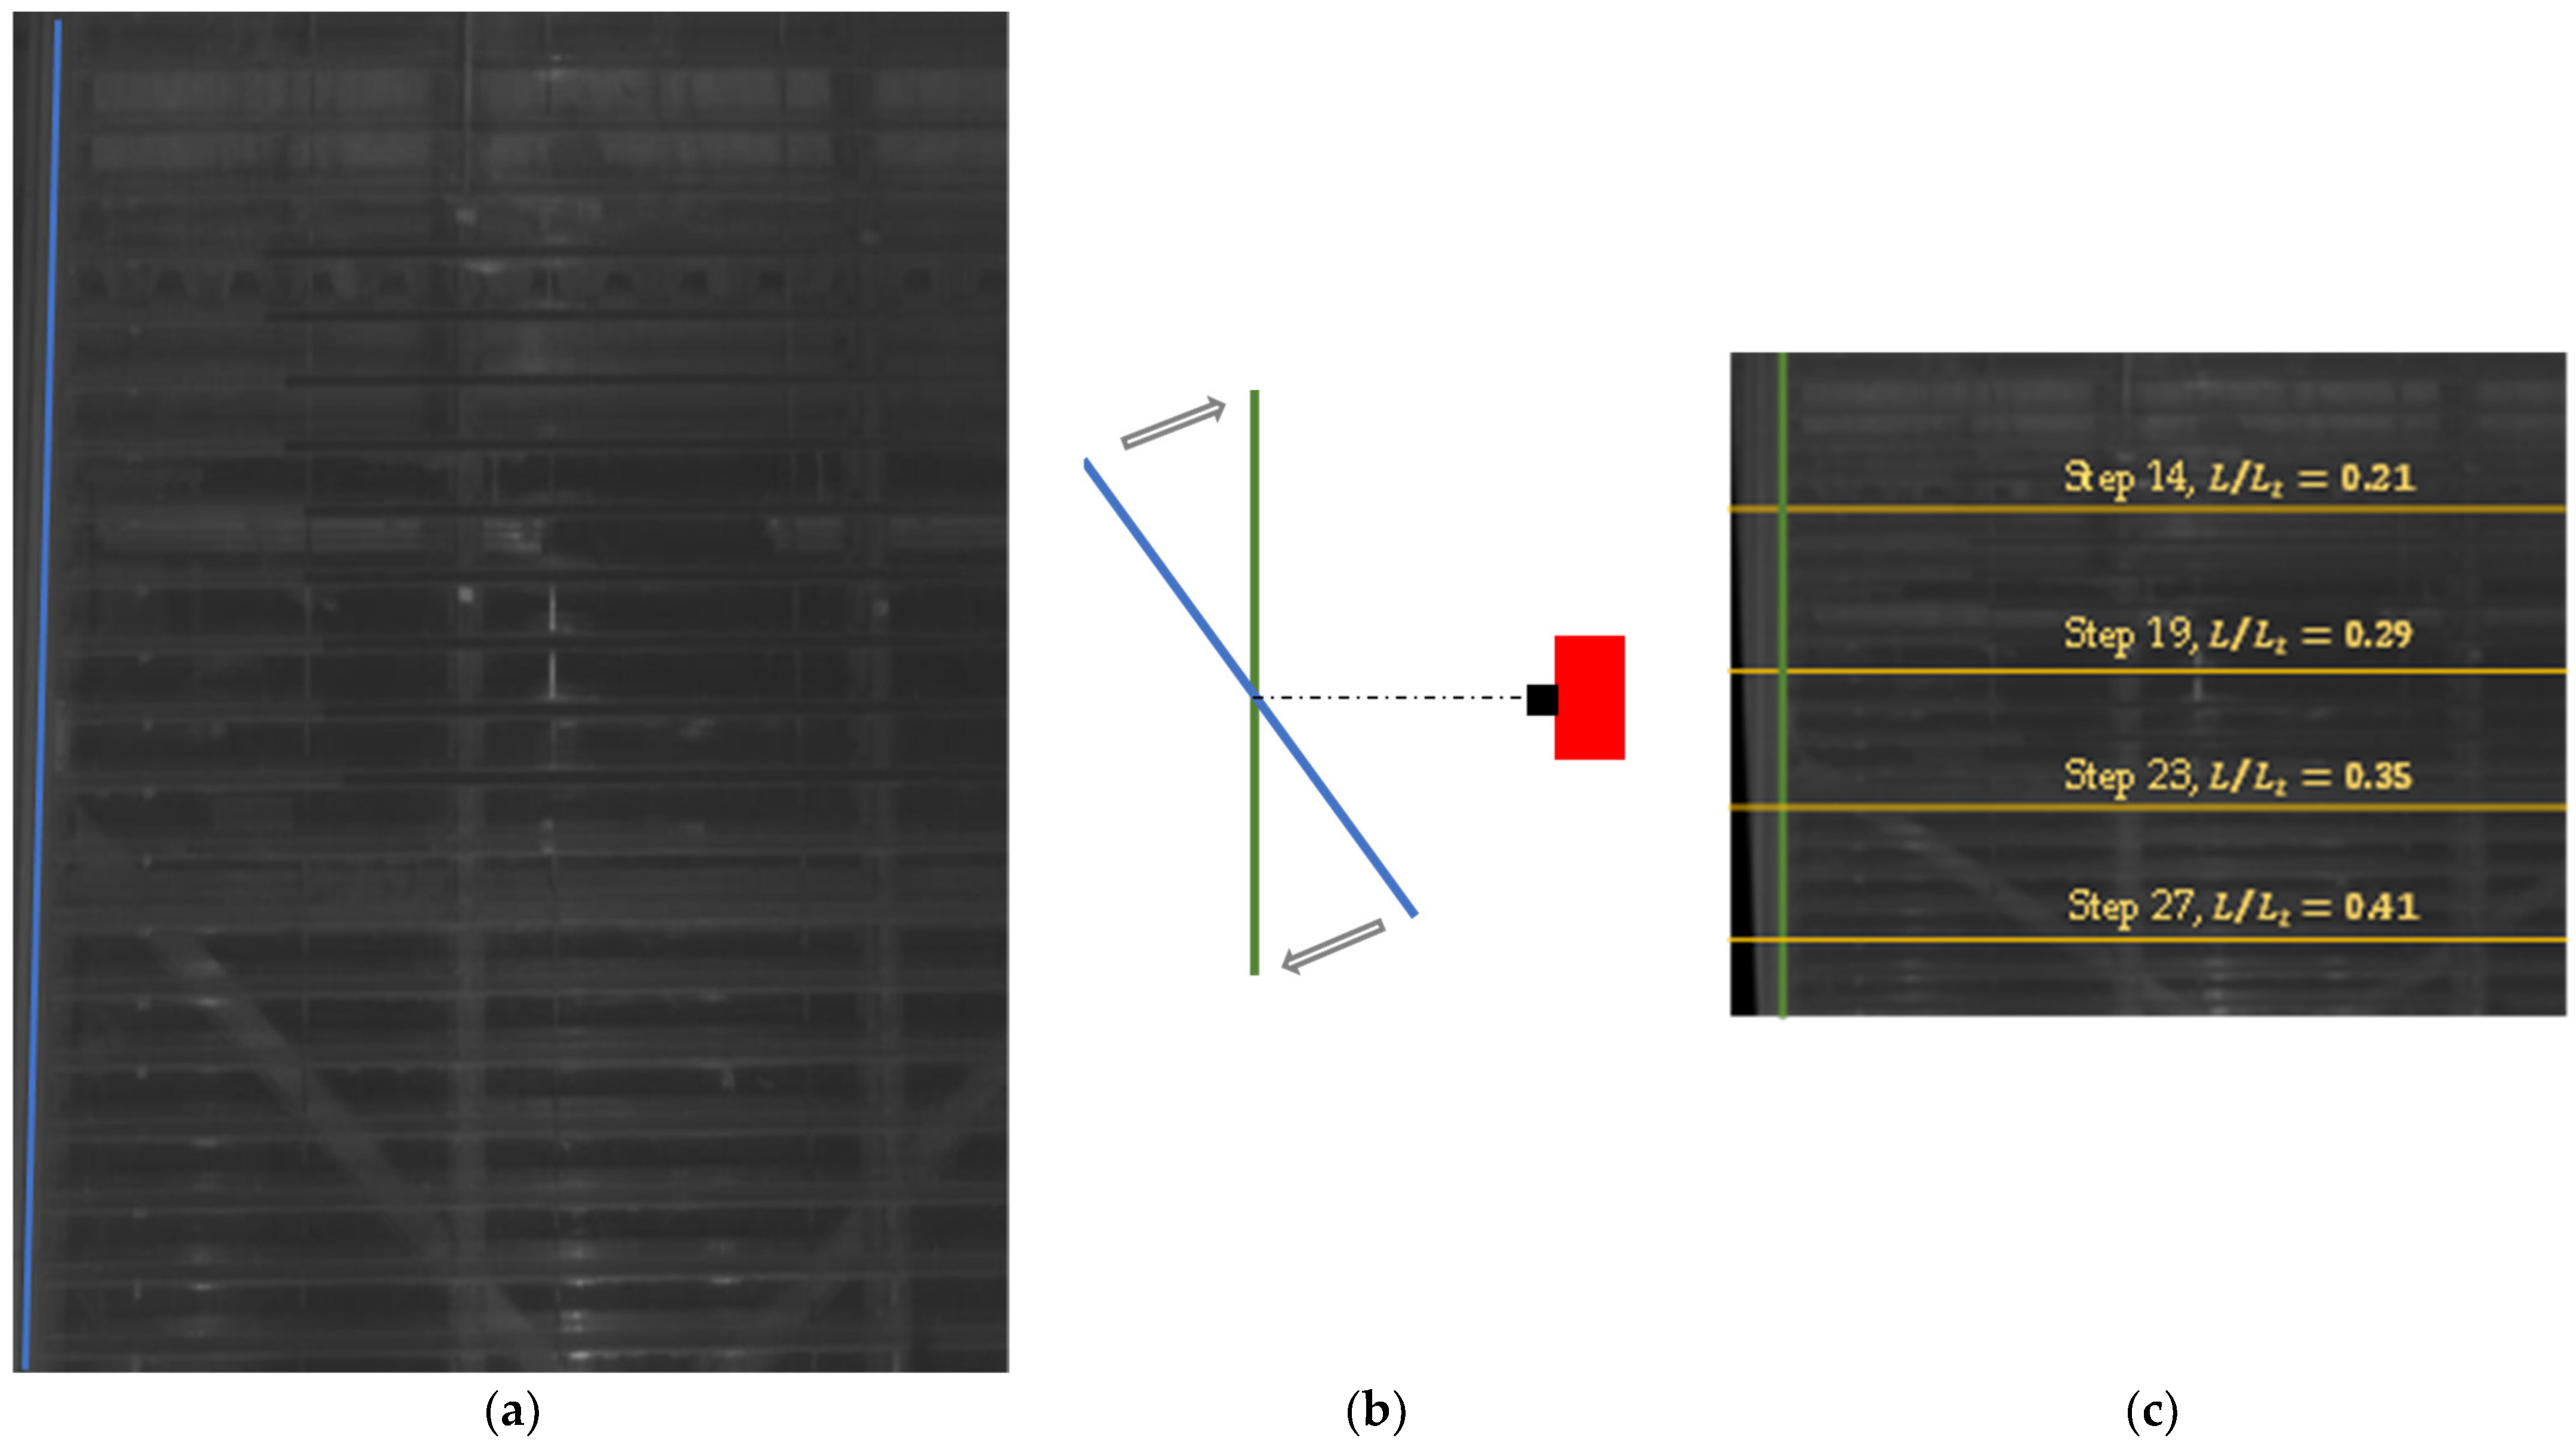
Once the images were obtained, it could be observed that the lens of the camera is not completely parallel to the plane of the stepped chute, as it is shown looking at the blue line in the left image of Figure 4. This fact can distort the velocity field values estimated from the recorded images. For this reason, it was necessary to fold all the images in order to position the blue auxiliary line vertically, as per Pons [46].

3.2.2. Lateral View

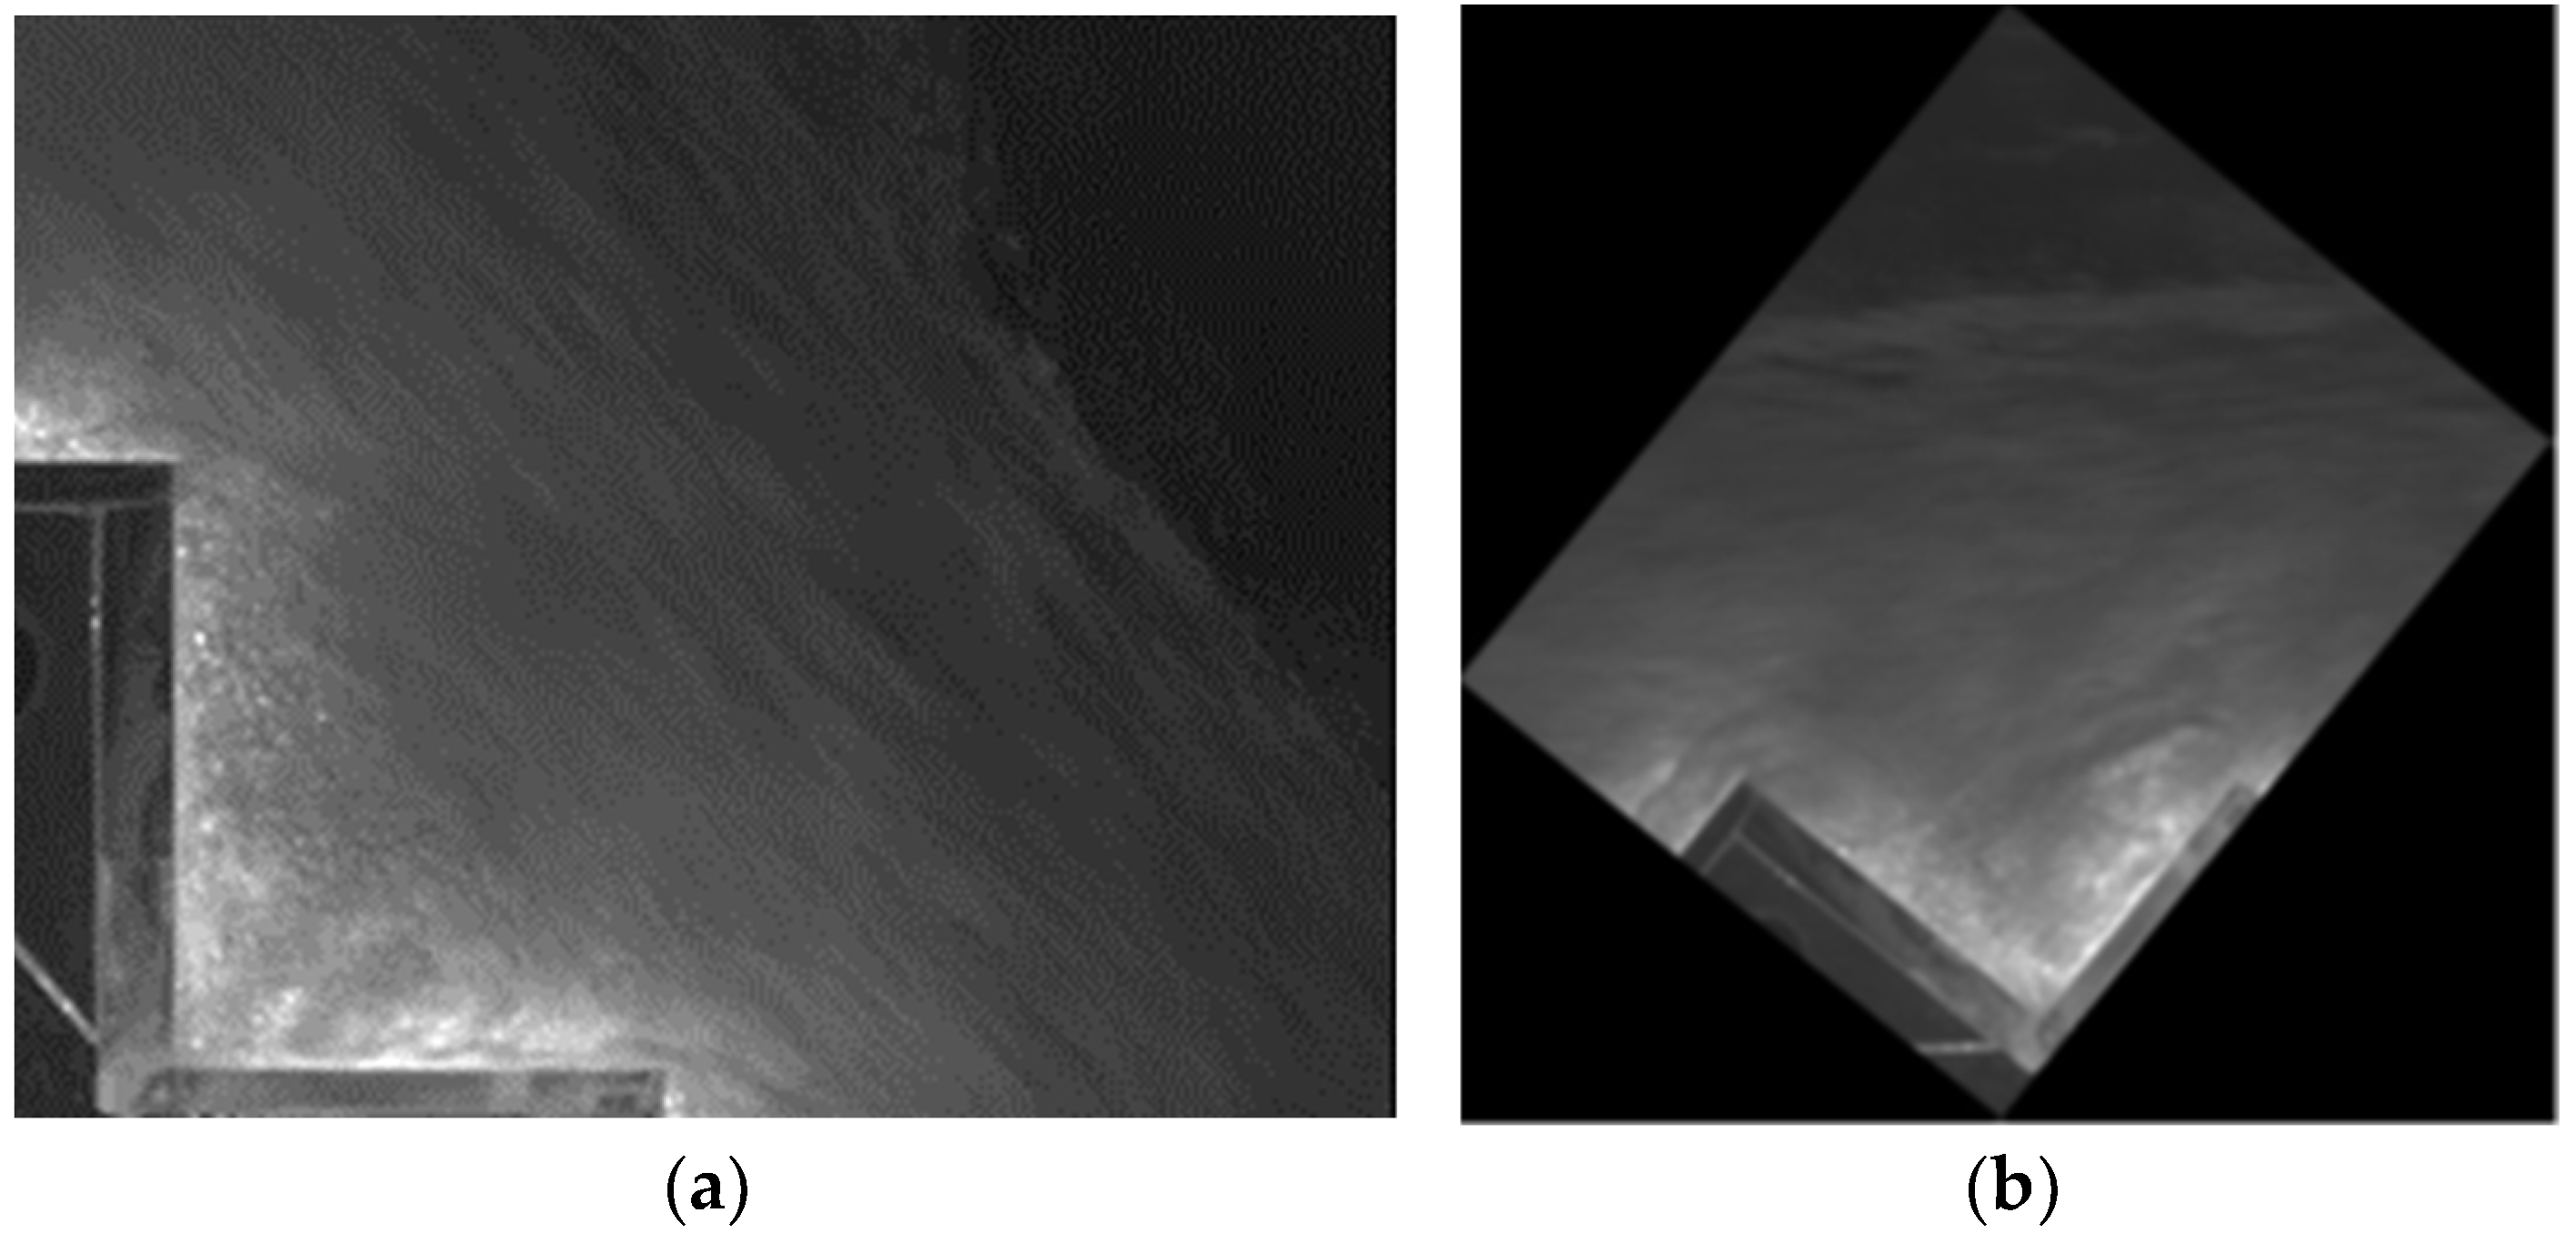
The images were taken in such a way that their base matches with the footprint of the step (Figure 5a). Therefore, the image offers a visualization of the flow in which the skimming flow zone is not horizontal. In order to achieve a more comfortable procedure to analyze the images, all the recordings have been rotated 51.3° counterclockwise, transforming the pseudo-bottom into a horizontal line (Figure 5b). For example, this rotation on the video frames allowed us to perform an easier screening of the velocity outliers in the skimming flow zone, as there, the dominant velocities should be practically horizontal.

3.3. Preprocessing Frames in PIVlab

In the case of lateral video recordings, the backlighting used, as shown in Figure 3, creates areas that are practically saturated with light next to the solid contour of the steps, and at the same time, the high concentration of air in the flow makes the areas farthest from the flow dark (Figure 5). This requires pre-processing of the images to highlight the air bubbles so that they can be good flow tracers.
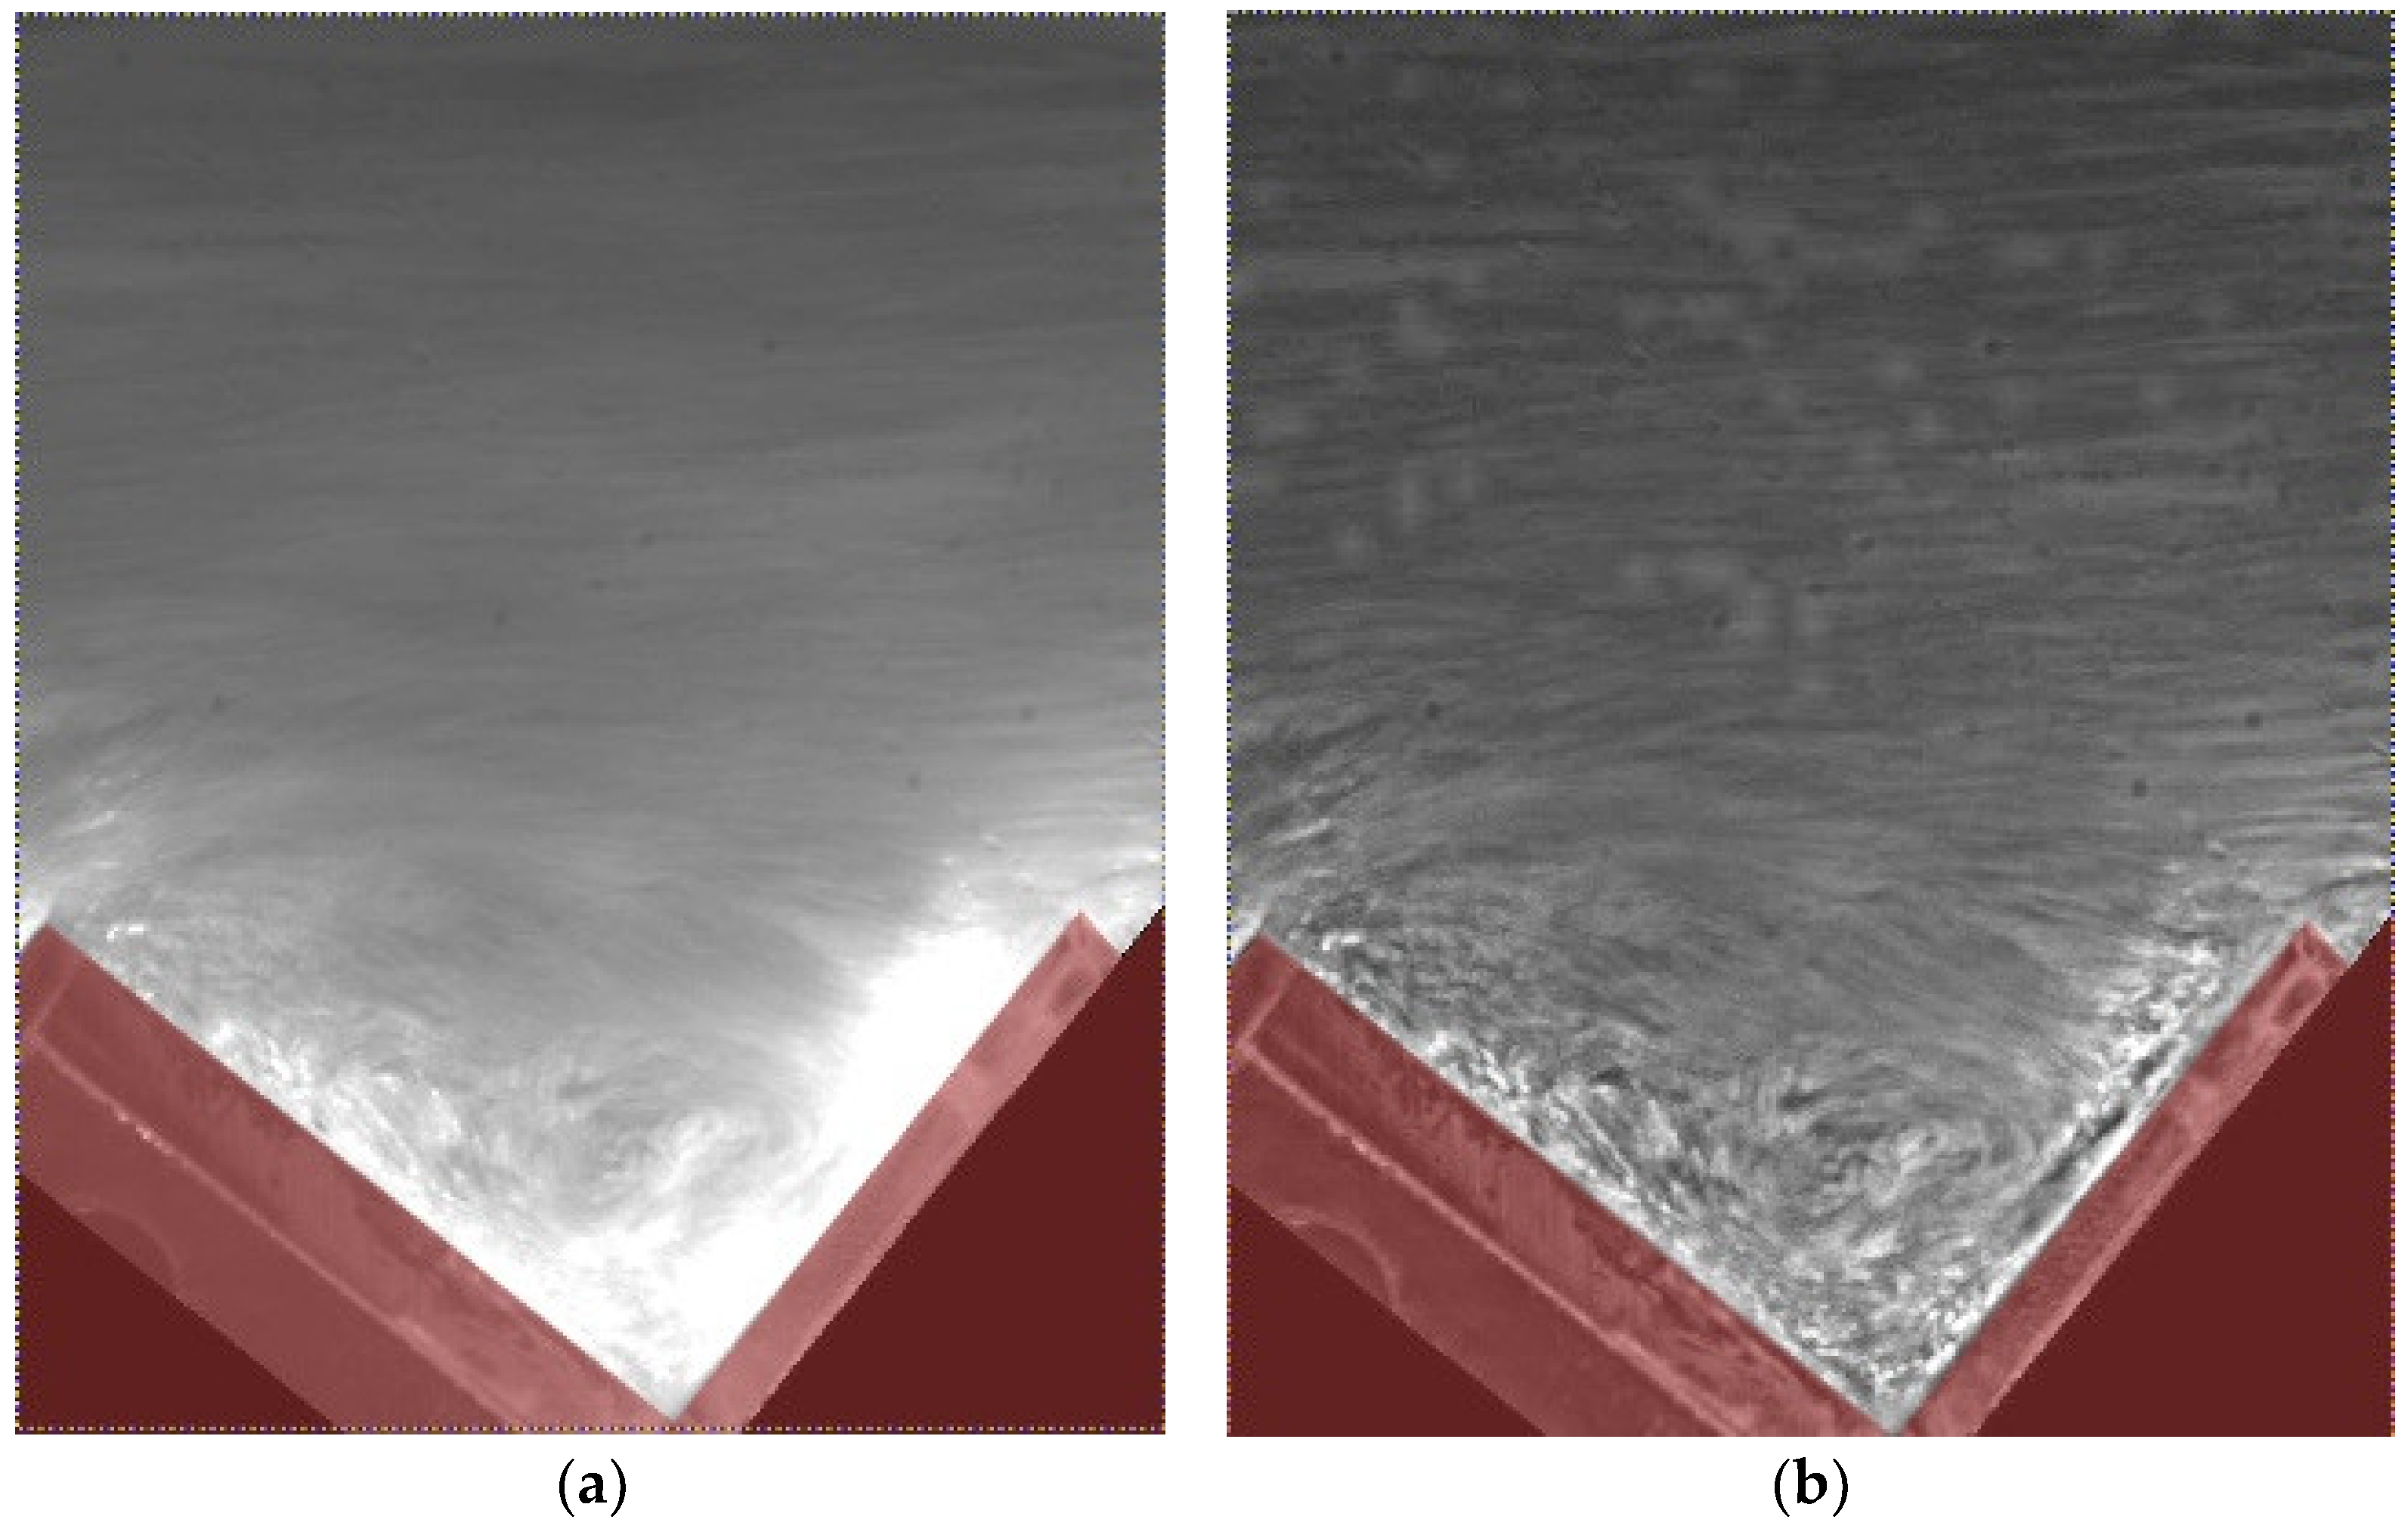
In both frontal and lateral analysis of the respective velocity fields, a Contrast Limited Adaptive Histogram Equalization (CLAHE) filter was applied [39]. The CLAHE filter is used to enhance the images by spreading out the most frequent intensities in the images to the full range from 0 to 255. Usually, CLAHE filter improves the probability of detecting valid vectors. In Figure 6 and Figure 7, examples of the application of CLAHE filter are shown, with contrast improvement for the latter.

3.4. Interrogation Areas in PIVlab

The displacement vectors are estimated by means of a 2D cross-correlation function of the discrete Fourier transformation (DFT) of two consecutive frames. Both images are analyzed by subdividing them into partially overlapped interrogation areas. There is a strict relationship between the size of the interrogation areas and the region of interest where the velocity field will be analyzed. The density of vectors to be obtained in the velocity field is also dependent on the size of the interrogation areas [29,39]. Thus, the smaller the size of the interrogation areas, the greater the amount of information obtained. However, the reduction in the size of the interrogation areas has a negative effect on the computational time and also decreases the values of the obtained correlation. In general, it was observed that a reduction in the size of the interrogation areas worsens the quality of the results. What actually happens is that, by reducing the size of the interrogation areas, the probability of coincidence in the pixel values of the analyzed areas is reduced, thereby leading to outlier correlations. This method usually increases the noise in the correlation matrix which induces some loss of information. This effect decreases accuracy, as it entangles the detection of the intensity peak. For that reason, it is advisable to run several passes of the DFT on the same two consecutive frames by reducing the interrogation area [39].

3.4.1. Frontal View Velocity Field

In the case of the frontal view, the size of the interrogation areas that minimized the amount of non-valid velocity vectors was obtained, with 4 steps using decreasing size areas from 300 px to 50 px.
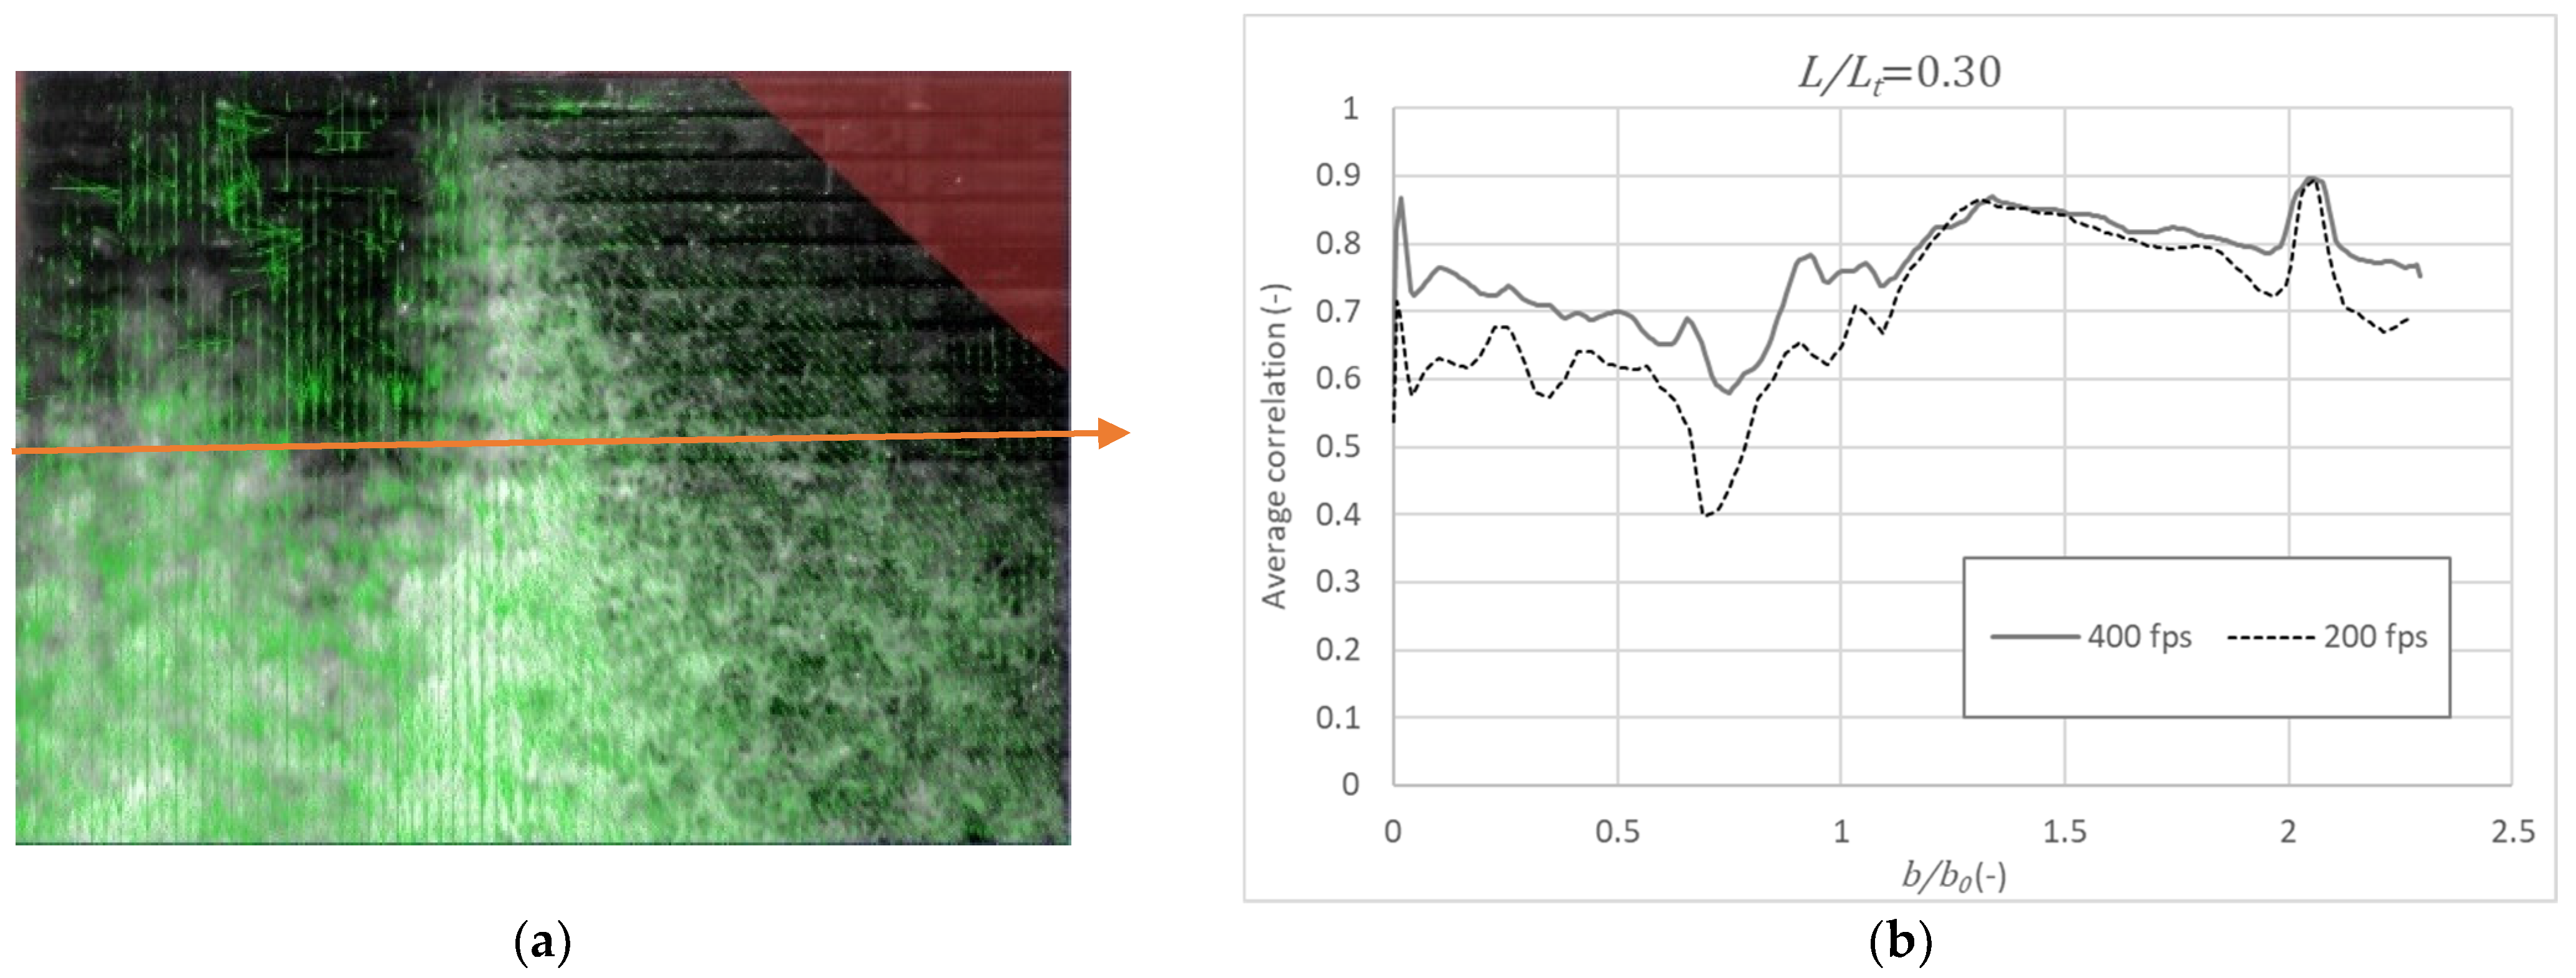
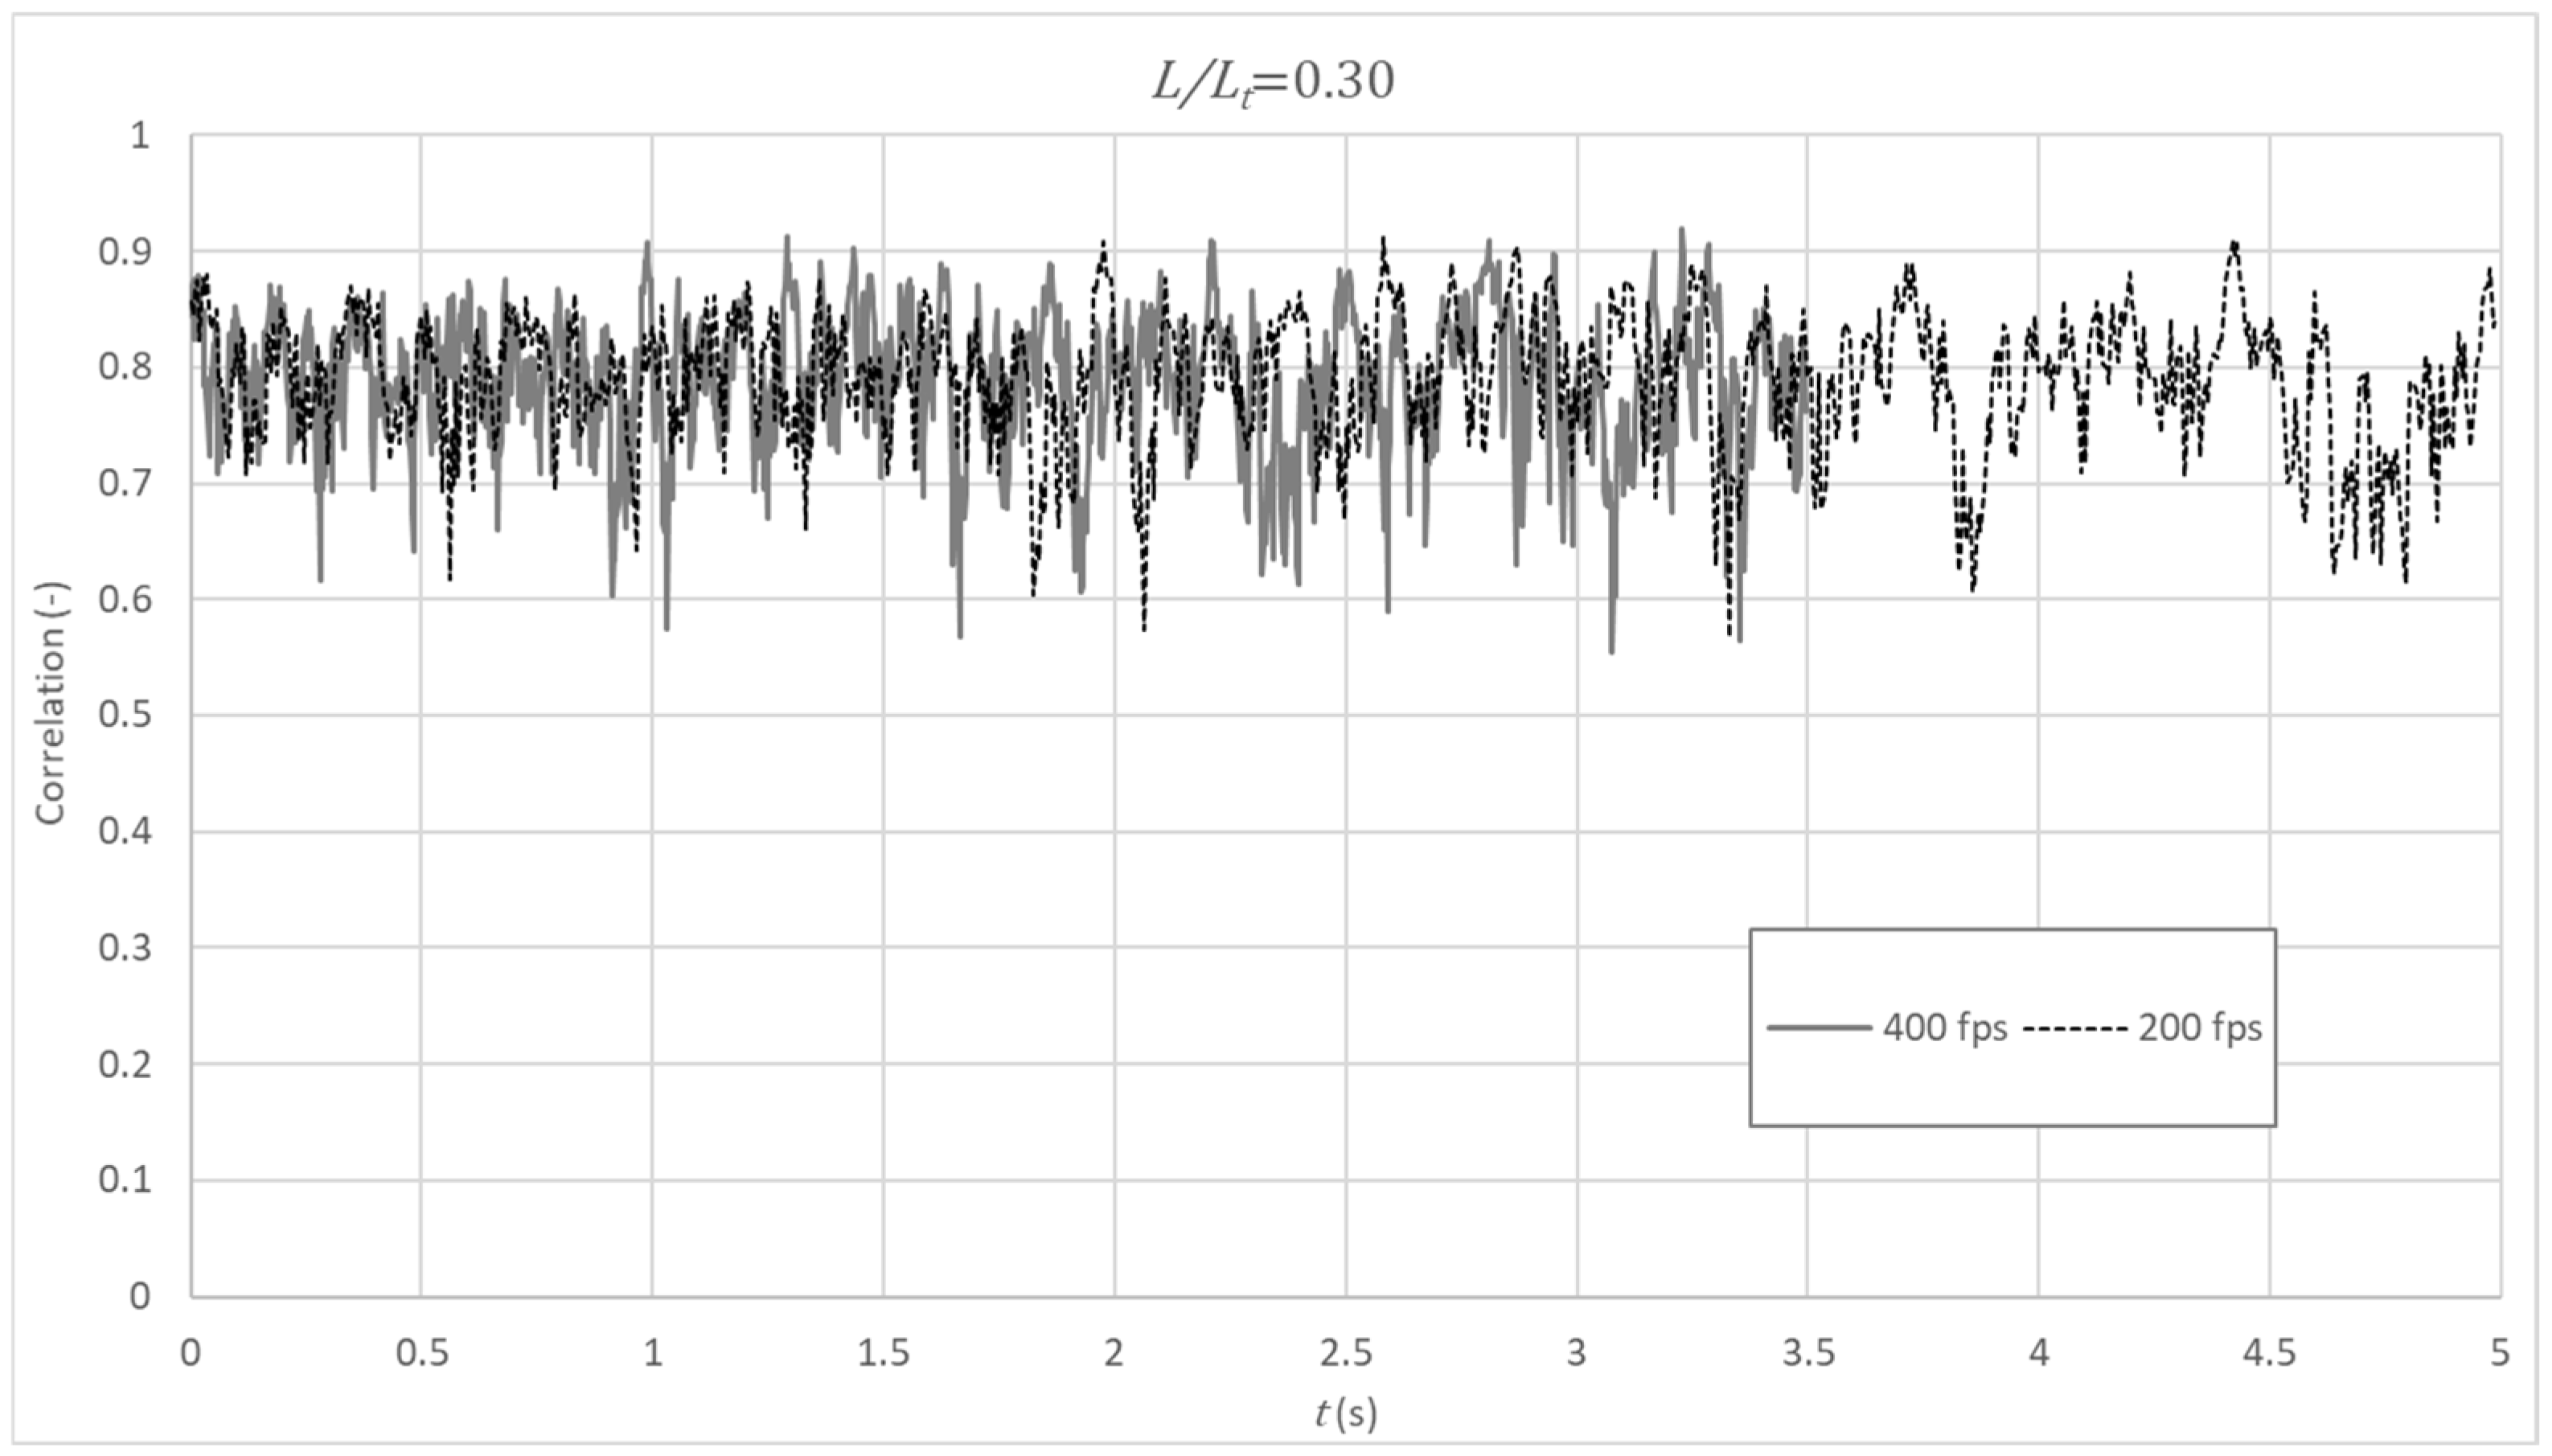
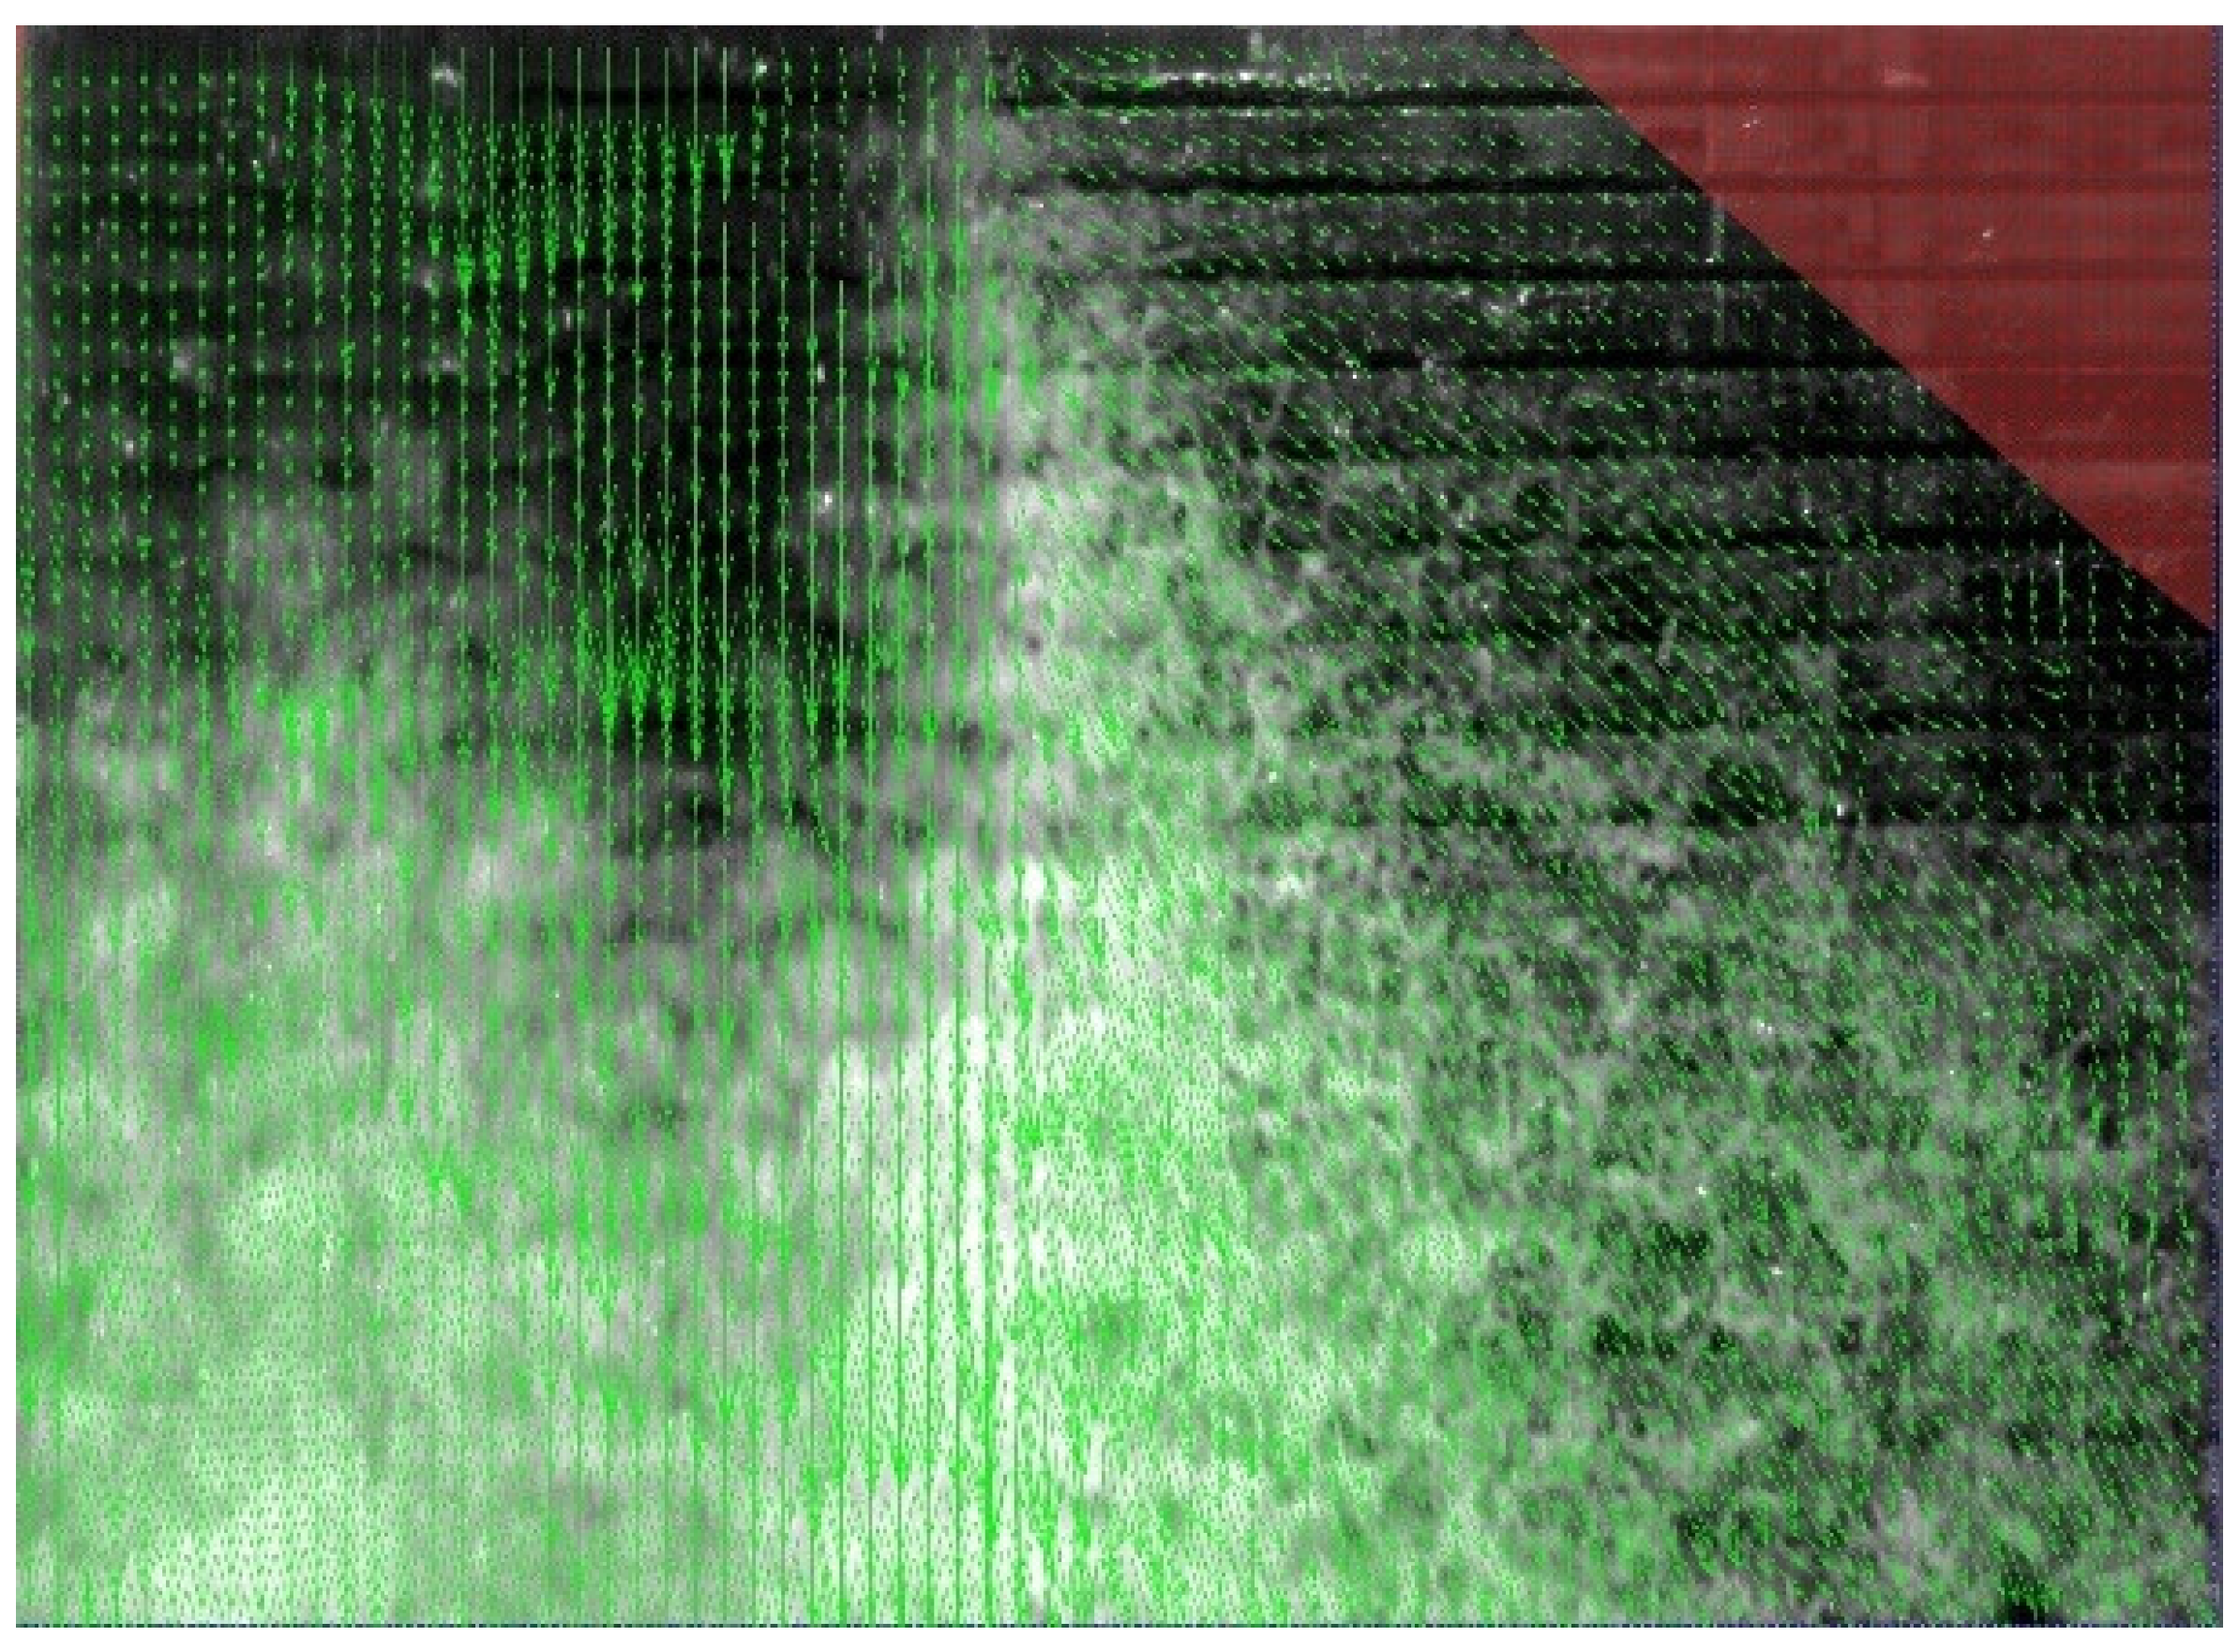
In Figure 8, the gross frontal velocity field obtained in frame 691 for d c / h = 2.38 is shown in function of b / b 0 , being b , the transverse distance from the right sidewall of the chute and b 0 , the chute width at the upstream end. It can be seen that the darkness of the image upstream of the inception point introduces major errors in the estimation of the flow direction. This fact points to the lack of tracers in the flow in this area, which causes lower correlations than those obtained outside it. This makes a careful post-processing of all the images essential. Likewise, it can be observed that downstream of the inception point, the air itself acts as a seed to obtain coherent estimators of the velocity directions. In Figure 9, the time evolution of the correlation obtained for 400 fps and 200 fps on L / L t = 0.30 and b / b 0 = 1.17 is presented. Values oscillating around an average of 0.8 were obtained, which may be considered acceptable.

3.4.2. Lateral View Velocity Field

In the analysis of velocity field observed from the lateral view of the chute, two main flow patterns coexist [1,2,3,4,5]: the skimming flow above the pseudo-bottom formed by the external edges of the steps and the recirculating flow inside the cell between those external edges. Upper skimming flow results in an almost unidirectional velocity profile with high velocities, which vary depending on the flow rate. Recirculating flow in the step cavity is characterized by smaller velocities whose directions vary, forming a main eddy pattern.
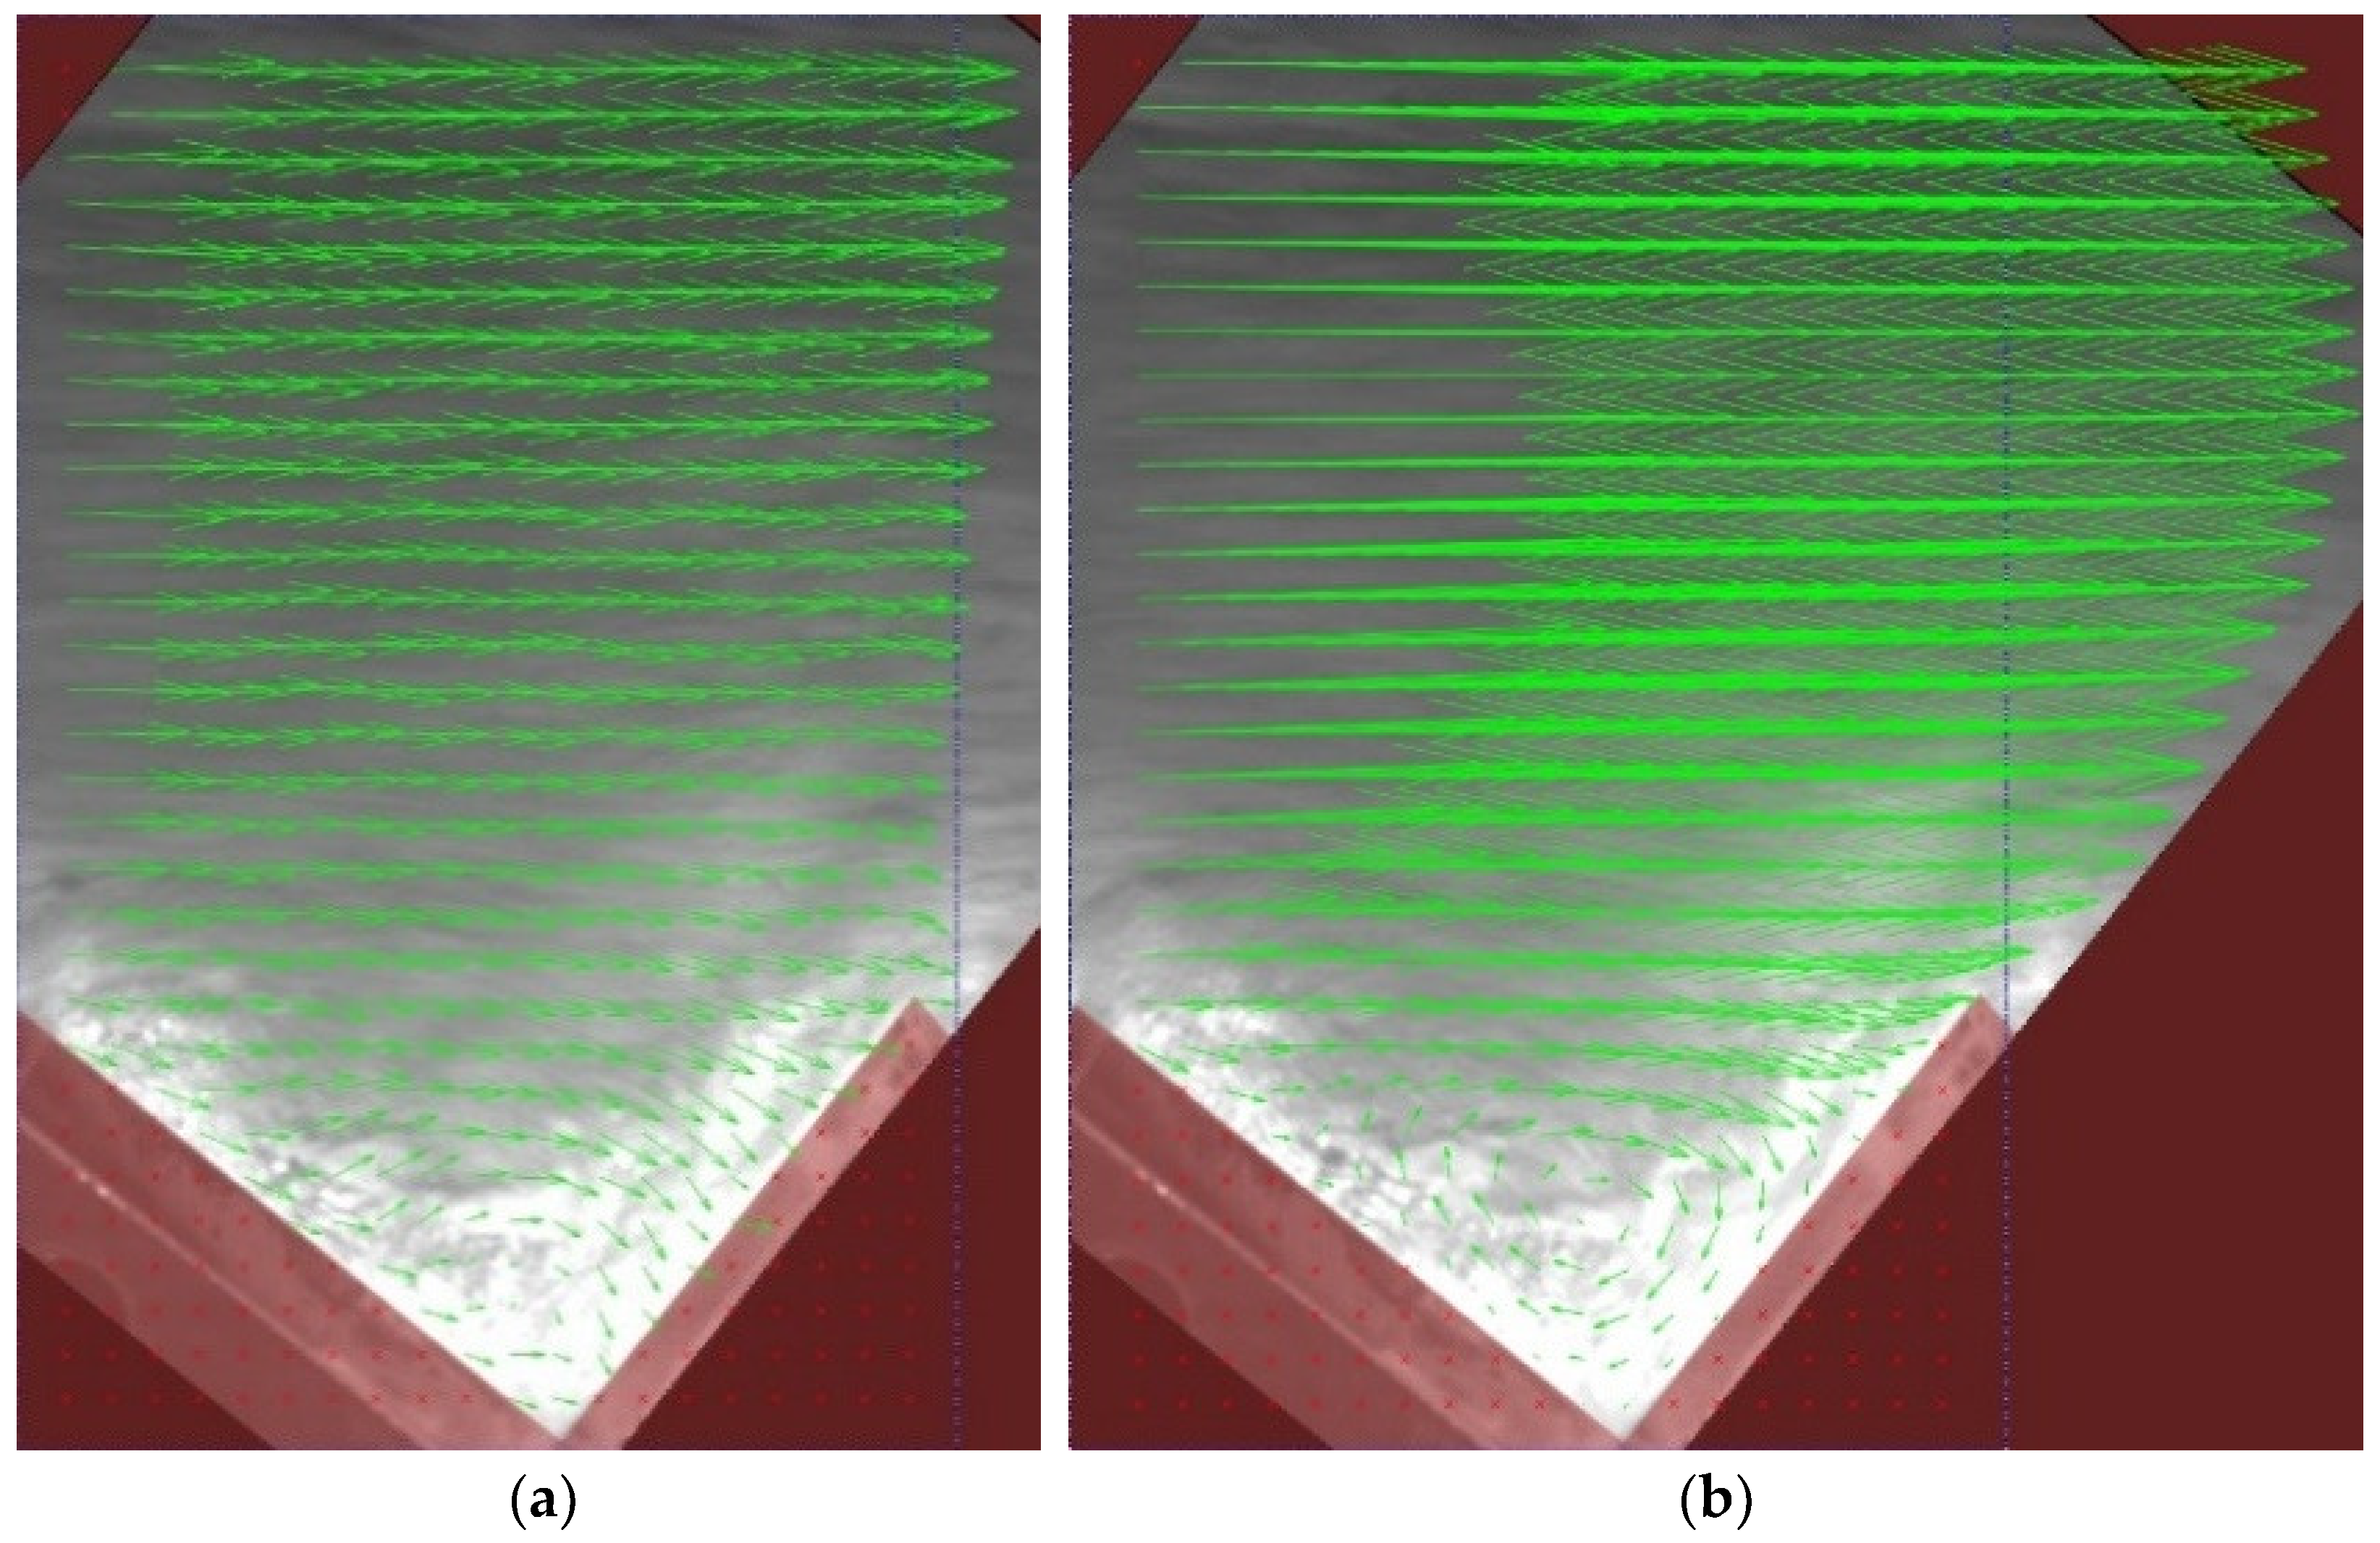
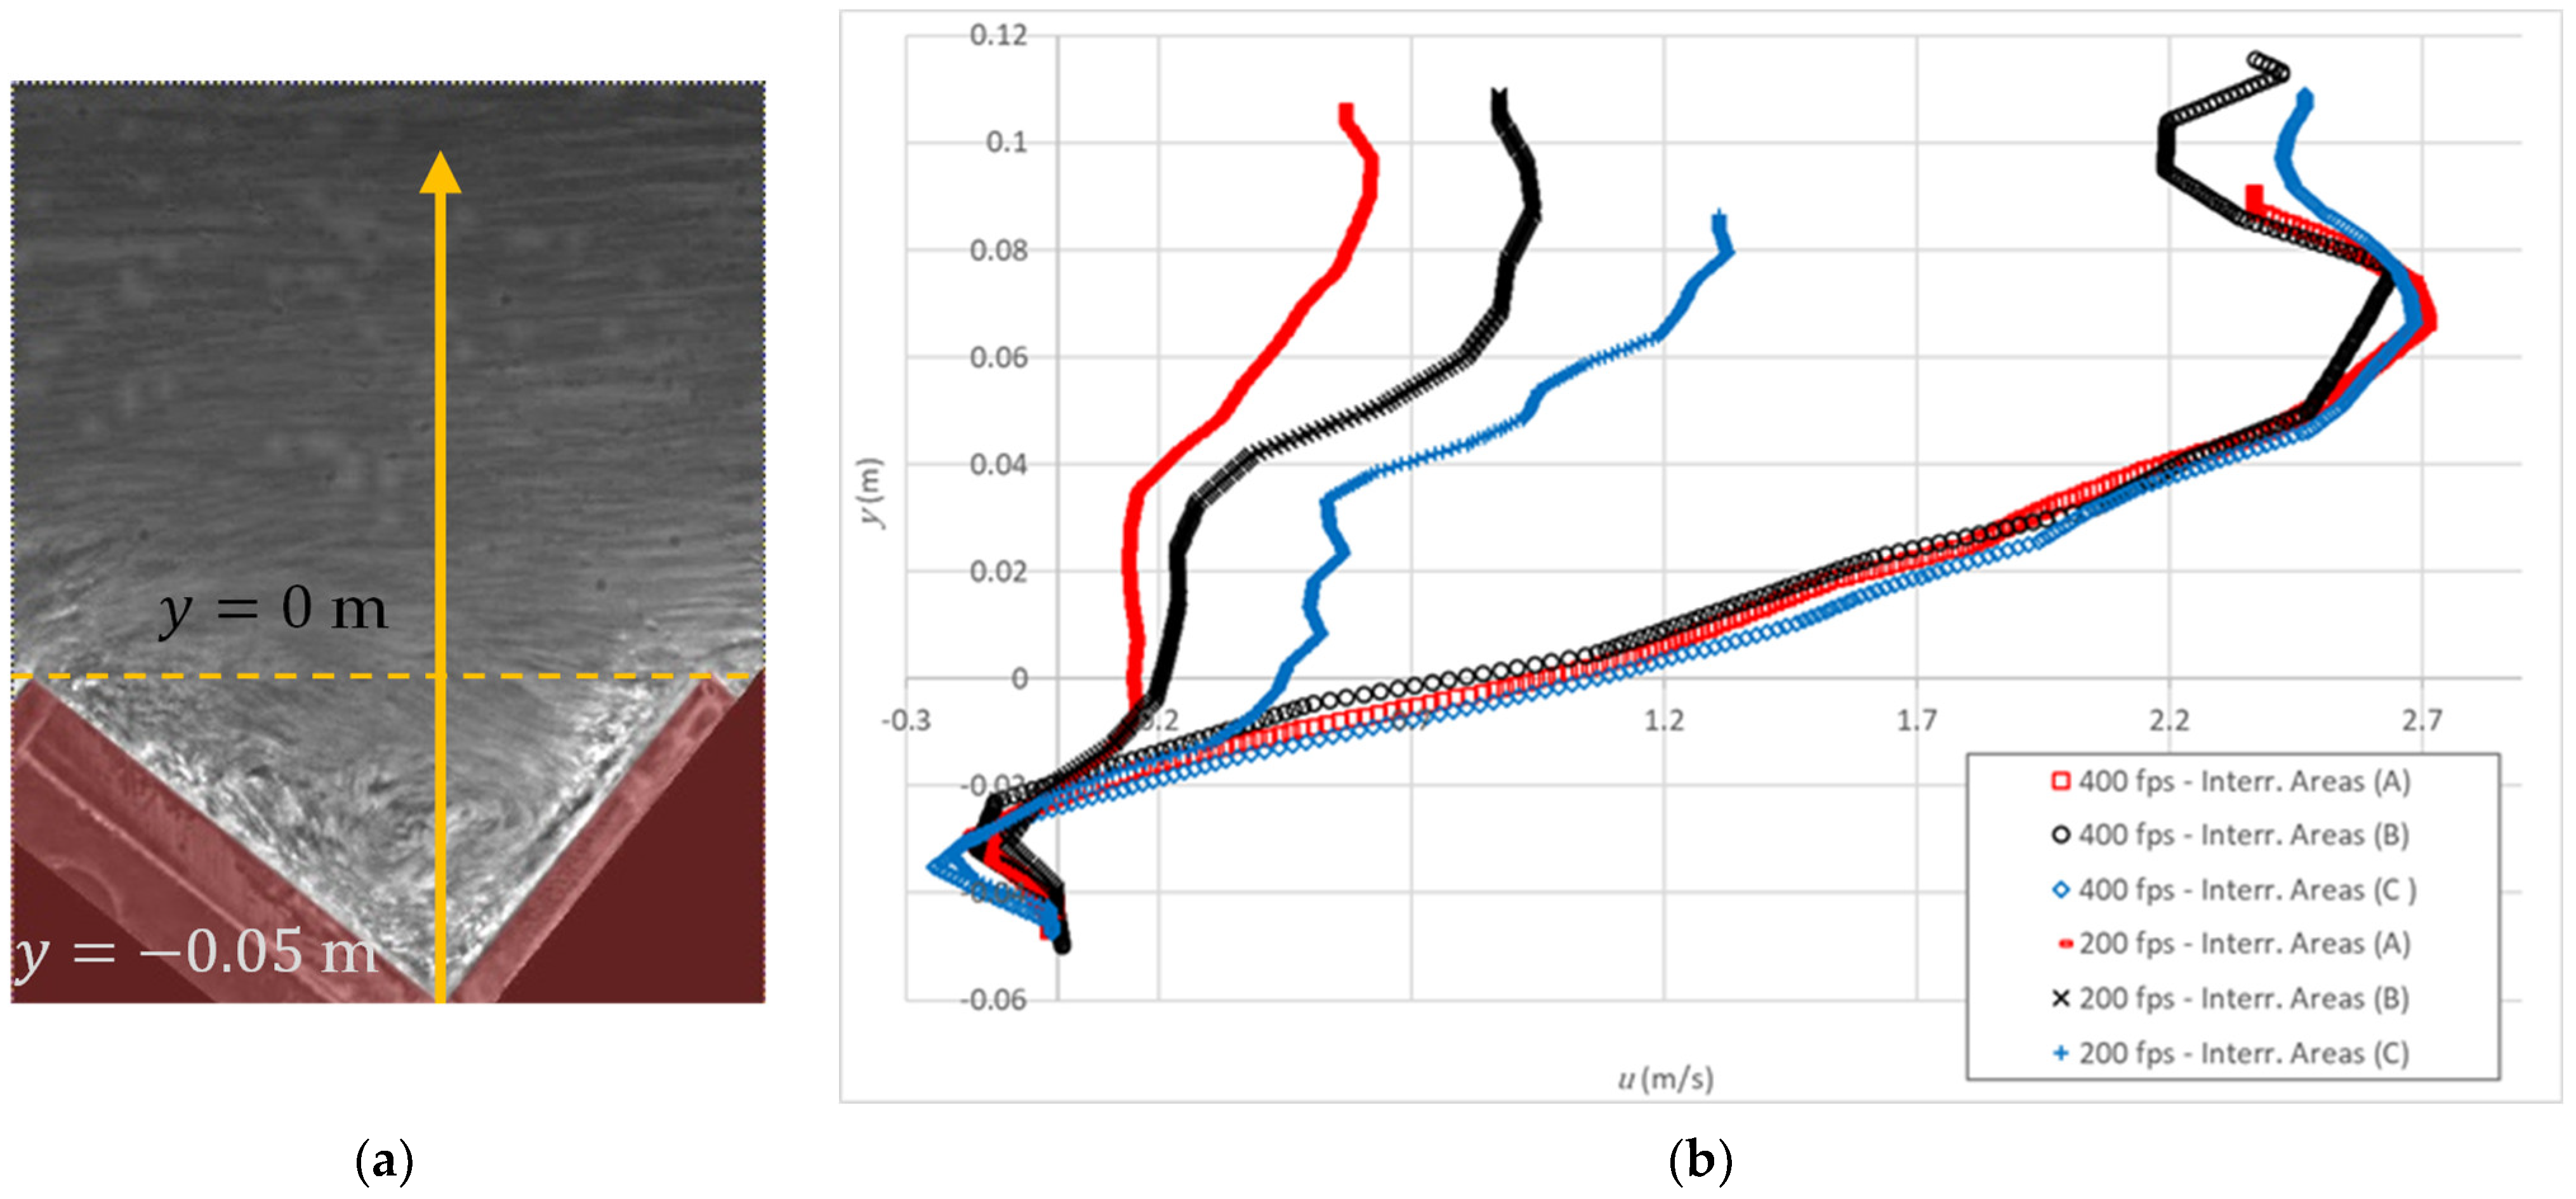
Considering the aforementioned characteristics of the velocity field, the influence of the size of the interrogation areas on the results has been analyzed. In Figure 10, the average velocity field for d c / h = 2.38 is shown for the test with an interrogation area from 288 pixels reduced to 36 pixels in 3 steps, acquired at 400 fps and 200 fps. As the scale used for the vector representation is the same for both images, it can be seen that the velocities obtained in the area above the pseudo-bottom is significantly higher for the 400 fps record than in the case of 200 fps. The same conclusion can be observed in Figure 11, where the horizontal component of velocity obtained along the normal to the pseudo-bottom, from the internal edge of the step, is shown. Furthermore, one can conclude that, in the case of the record obtained at 400 fps, the results are practically independent of the size of the interrogation area. However, in the case of 200 fps, the velocities obtained depend significantly on the size of the interrogation area, in addition to being significantly smaller than those obtained for 400 fps.
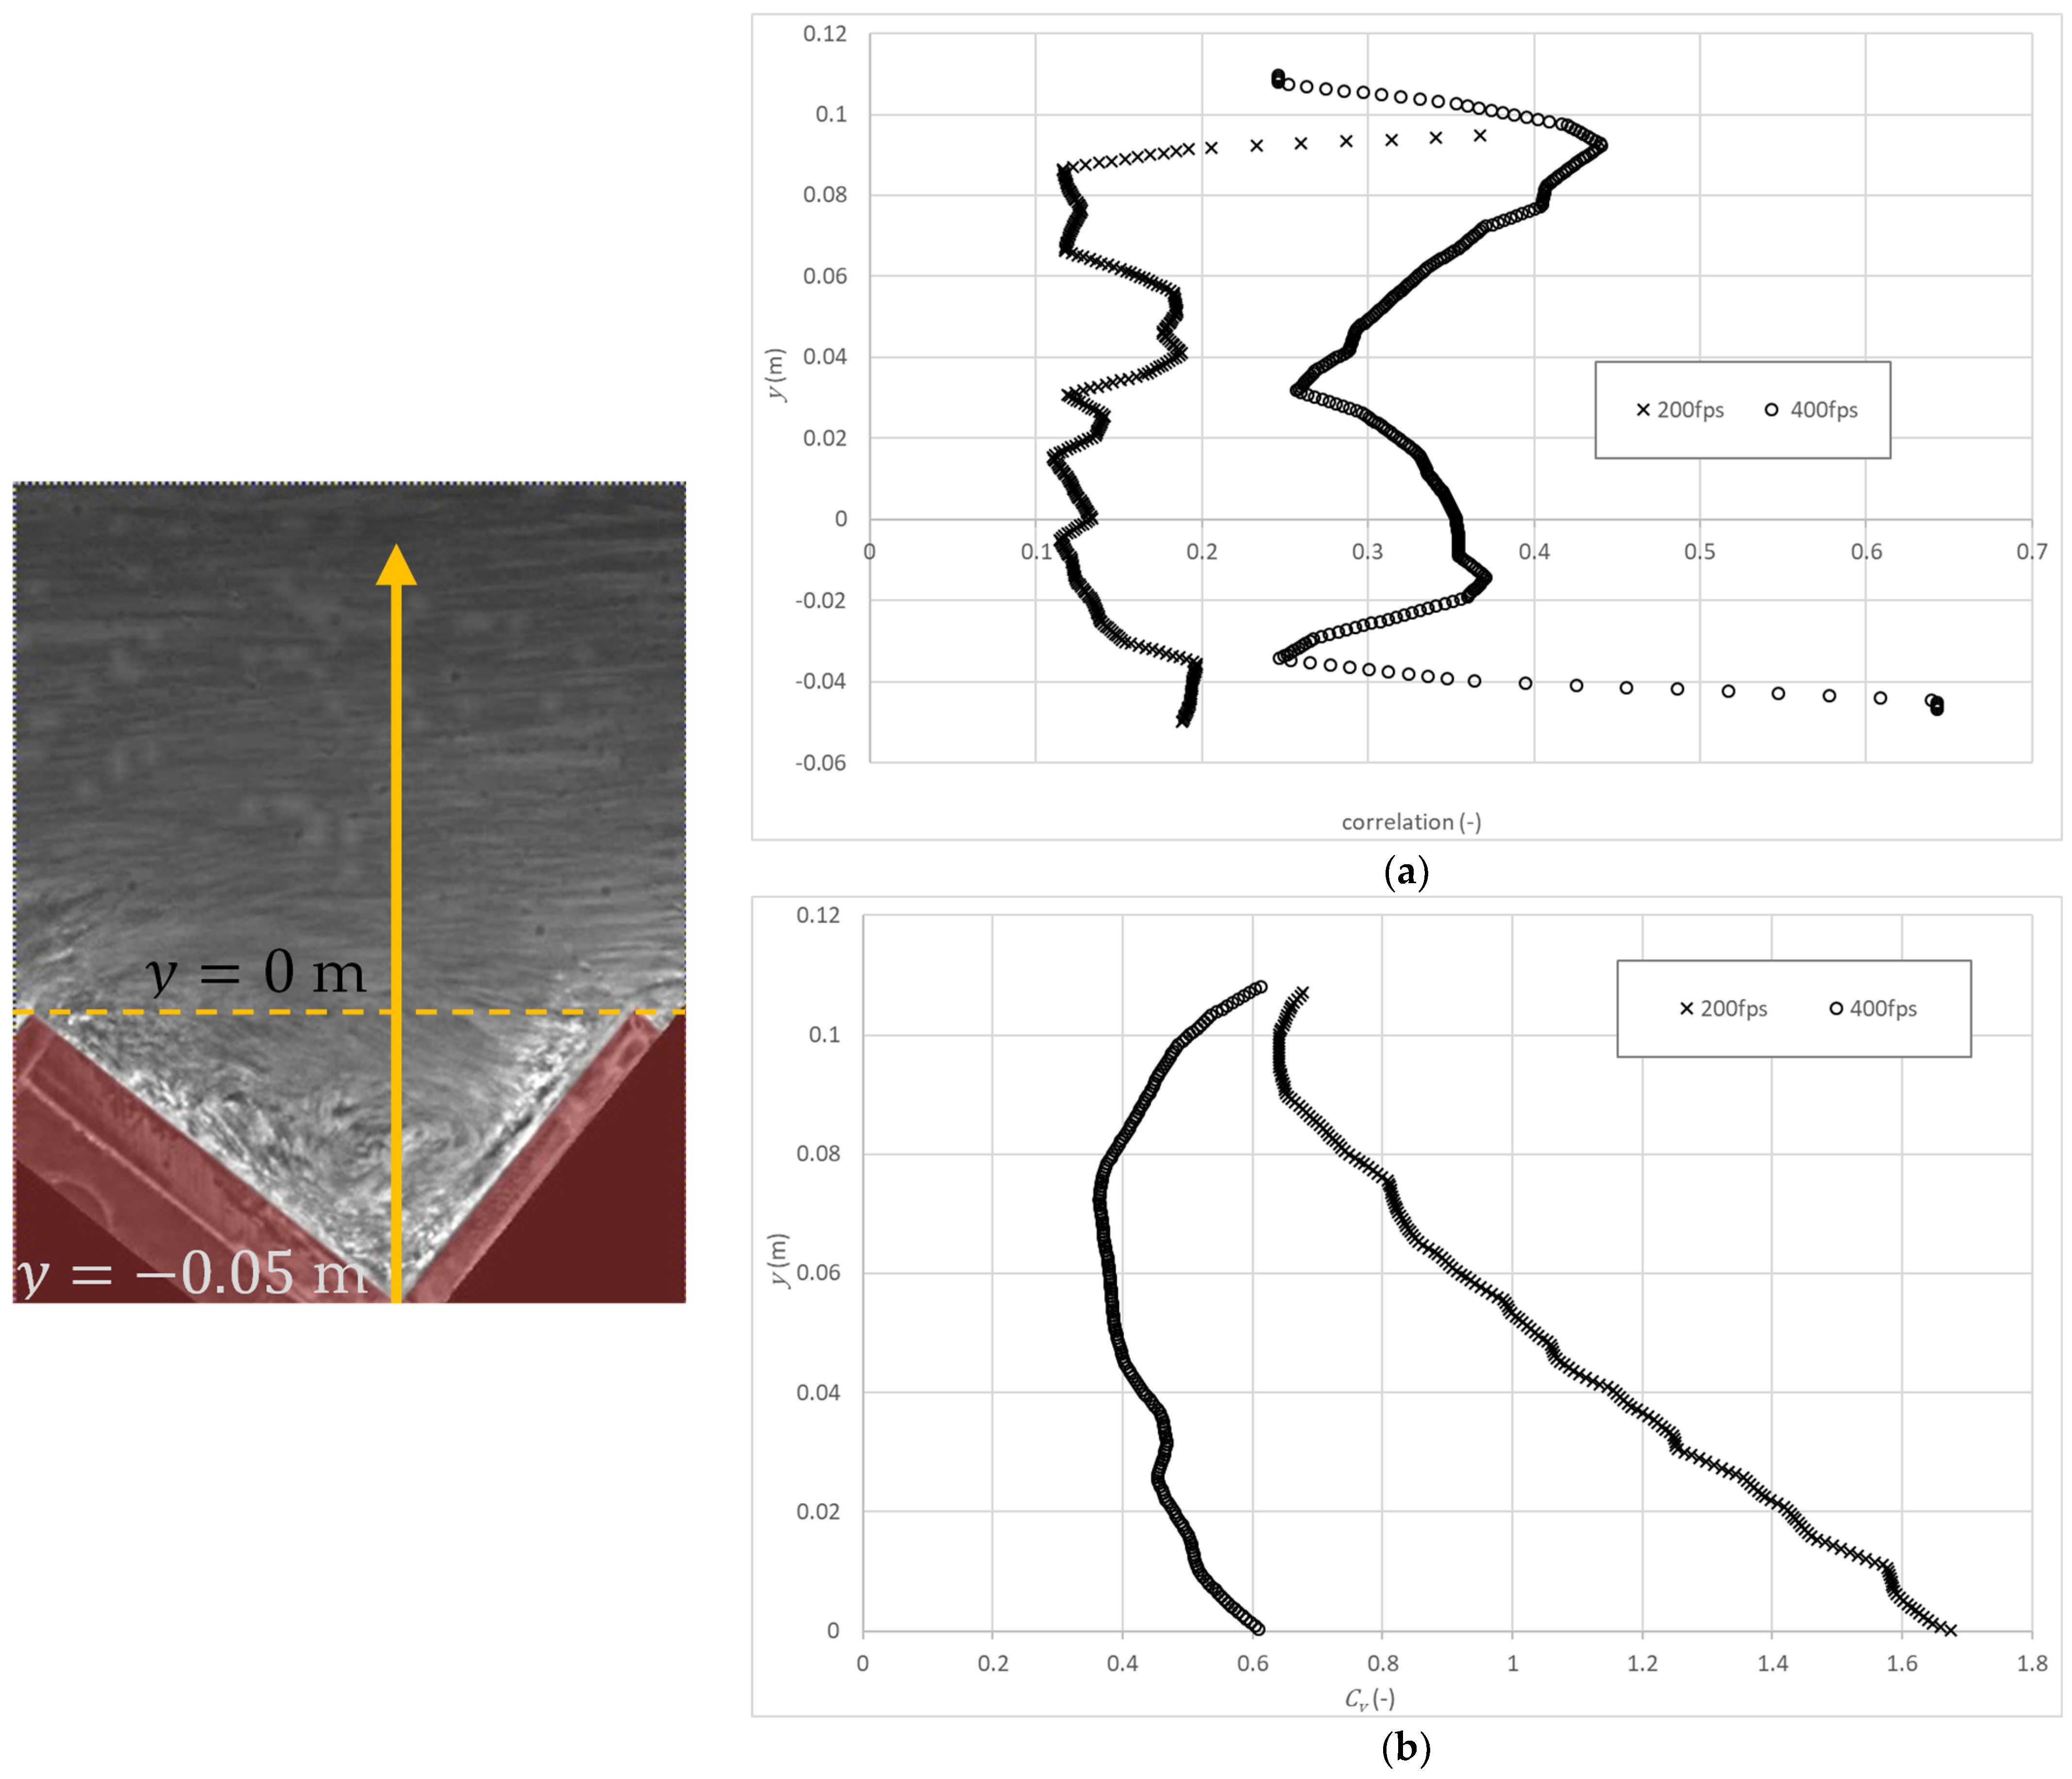
These discrepancies in the results as a function of the image acquisition rate show that 200 fps will not be adequate for the phenomenon to be studied. In Figure 12, the correlation and coefficient of variation ( C v ) obtained for both 400 fps and 200 fps are shown. The velocity fields obtained with an acquisition rate of 200 fps are poorly represented due to the lower correlation and higher coefficient of variation. For this reason, recordings made on lateral view at 200 fps were subsequently discarded.

4. Results and Discussion

4.1. Post-Processing of the Velocity Fields

From the analysis of the frontal view velocities, all valid vectors should present a predominant longitudinal direction downstream of the guiding wall, with an increasing transverse component in the lateral zone where the flow is allowed to spread from the right to the left side of the chute. In turn, from the analysis of the lateral view velocities, in the upper skimming flow above the recirculating cells, velocity vectors should present a predominant direction nearly parallel to the pseudo-bottom.
Additionally, a standard deviation filter consisting of neglecting velocities outside of eight standard deviations of the mean was applied to all frames. Finally, the velocity field was obtained using a local median filter that considers each velocity vector in the image and looks at its nearby neighbors to decide whether or not it is representative of its surroundings. Figure 13 shows the post-processed frontal velocity field obtained in frame 691 for d c / h = 2.38 .

4.2. Frontal View Velocity Field

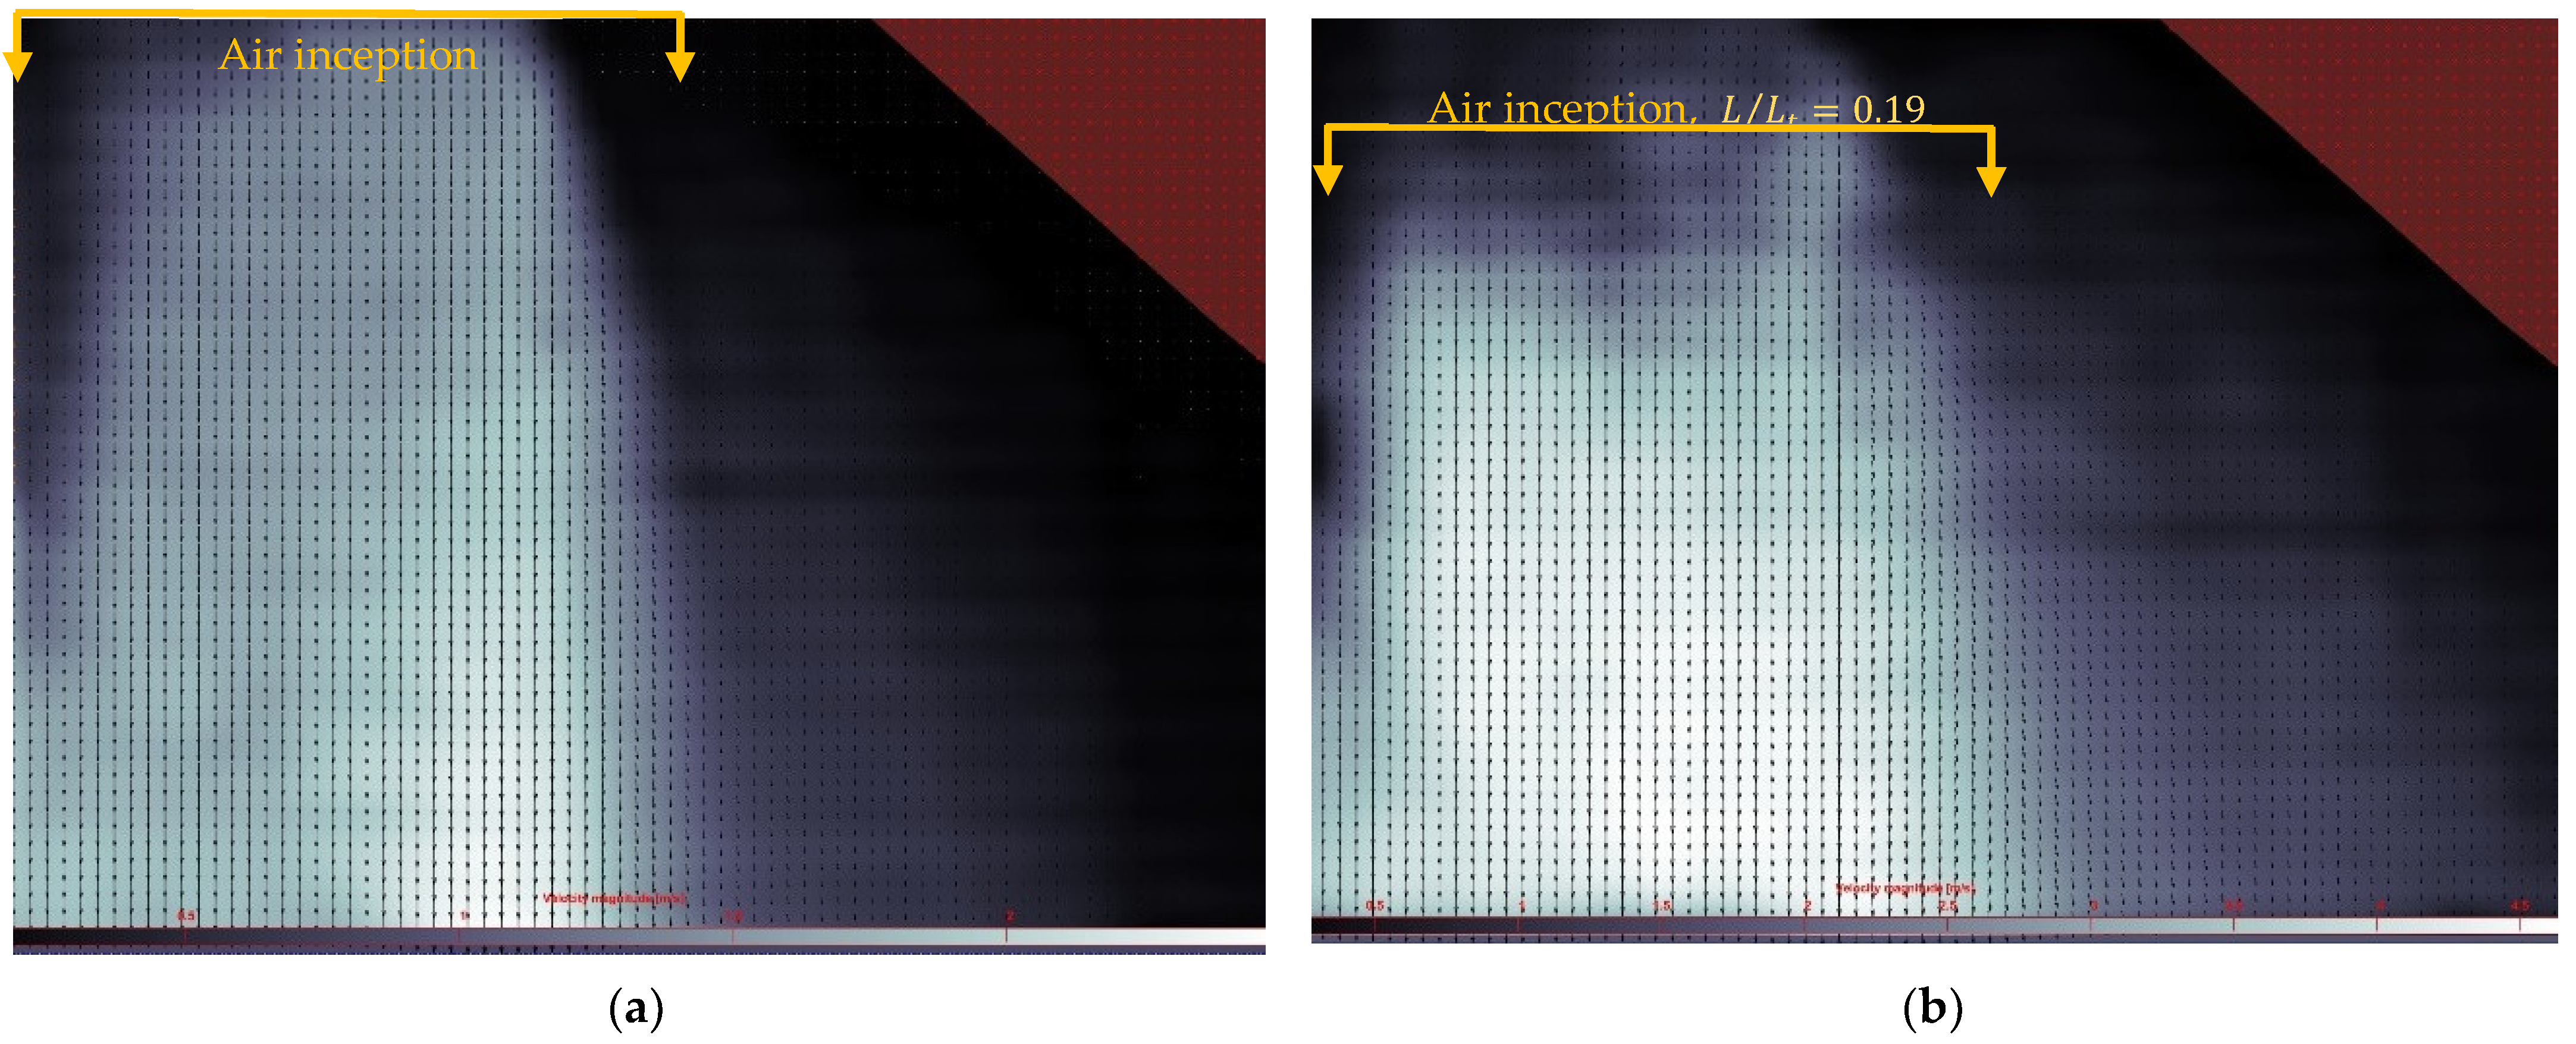
In Figure 14, the velocity field obtained for d c / h = 2.38 at 200 fps is shown and compared with that obtained at 400 fps. There are no substantial differences in the velocity fields obtained by the aforementioned acquisition rates. Thus, it can be seen that the velocity magnitude is increasing downstream (gray upstream to white downstream), as expected, for the gradually varied flow region. The influence of the dimensionless discharge on the location of the point of inception and on the velocity field is illustrated in Figure 15.
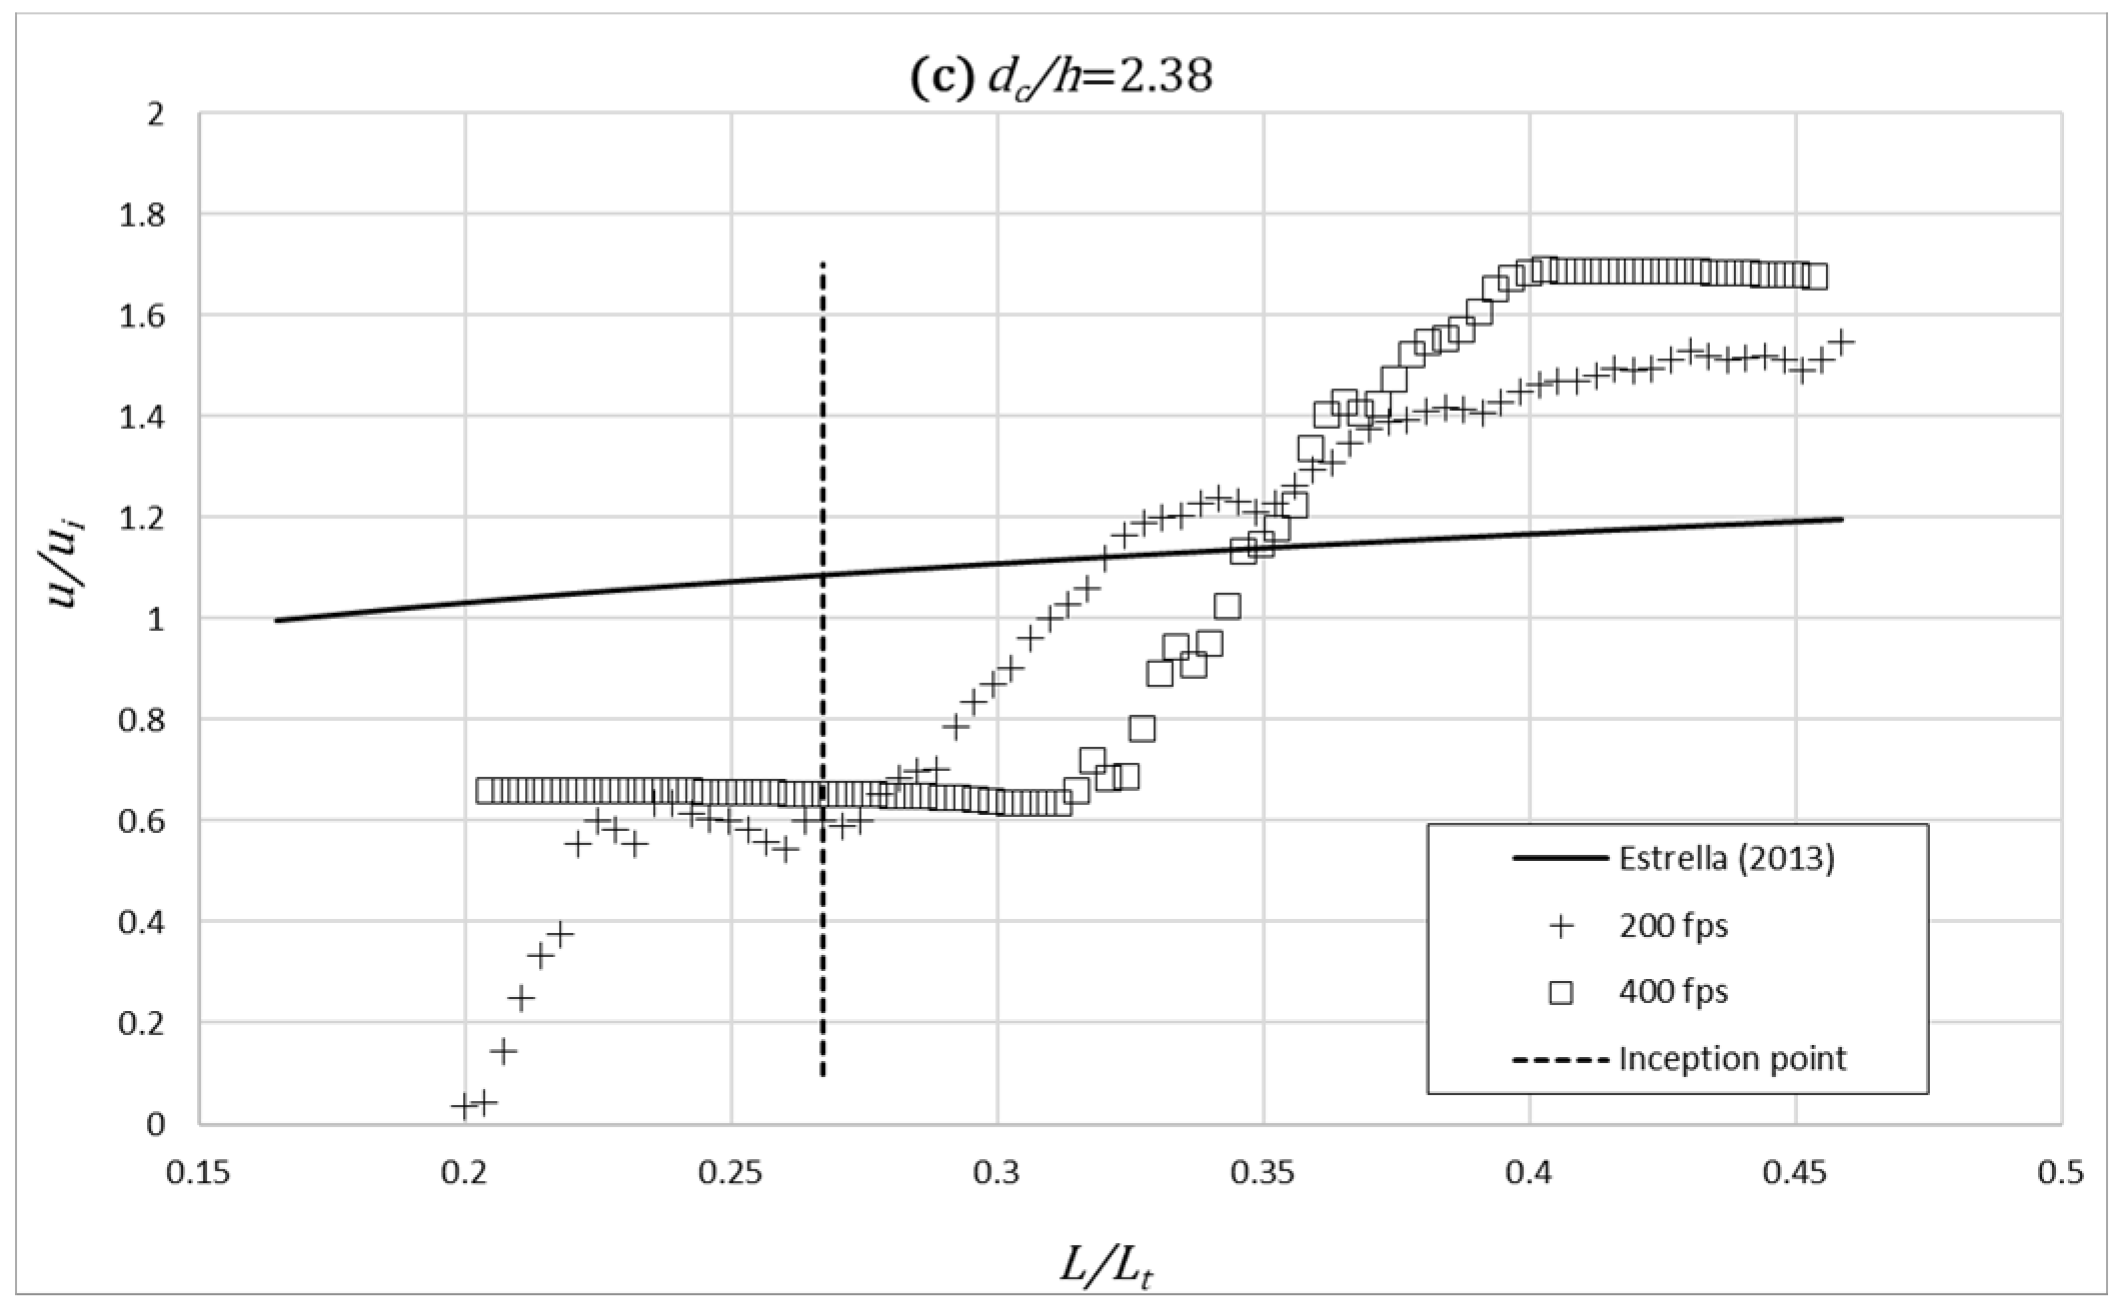
These results are compared with those obtained by [17,45], namely on the streamwise development of the free-surface velocity defined as that corresponding to a distance to the pseudo-bottom equal to the characteristic depth ( d 90 ), where the air concentration is 90%. The development along the chute of the ratio of the estimated surface velocity with that obtained in the inception point of air entrainment ( u / u i ) is shown in Figure 16.
From the analysis of Figure 14, Figure 15 and Figure 16, the following results can be highlighted:
  • Shortly downstream of the point of inception, where air is not fully entrained, a dark zone is observed. That causes a reduction in the estimation of the correlations between consecutive frames and, therefore, generates a greater dispersion and errors in the velocity measurement. In this area, it is observed that the estimation of the dimensionless velocity ( u / u i ) is, in general, significantly underestimated with respect to that obtained by [17,45] in the same physical model.
  • Downstream of the previous dark zone, there is a bright area that coincides with the area where aeration inception has already occurred. This brightness allows a better tracking of correlations between consecutive images. That is, surface air acts as an acceptable flow tracer for velocity estimation. However, an overall tendency of overestimation of the dimensionless velocity ( v / v i ) is noticeable sufficiently downstream of the point of inception, namely for the largest dimensionless flow rate.
  • Improving the lighting of the darkest area is detrimental to creating brightness saturation in the area where the air has already reached the surface. This makes it very difficult to find optimal lighting for both regions. Additional research should be developed on this topic.

4.3. Lateral View Velocity Profile

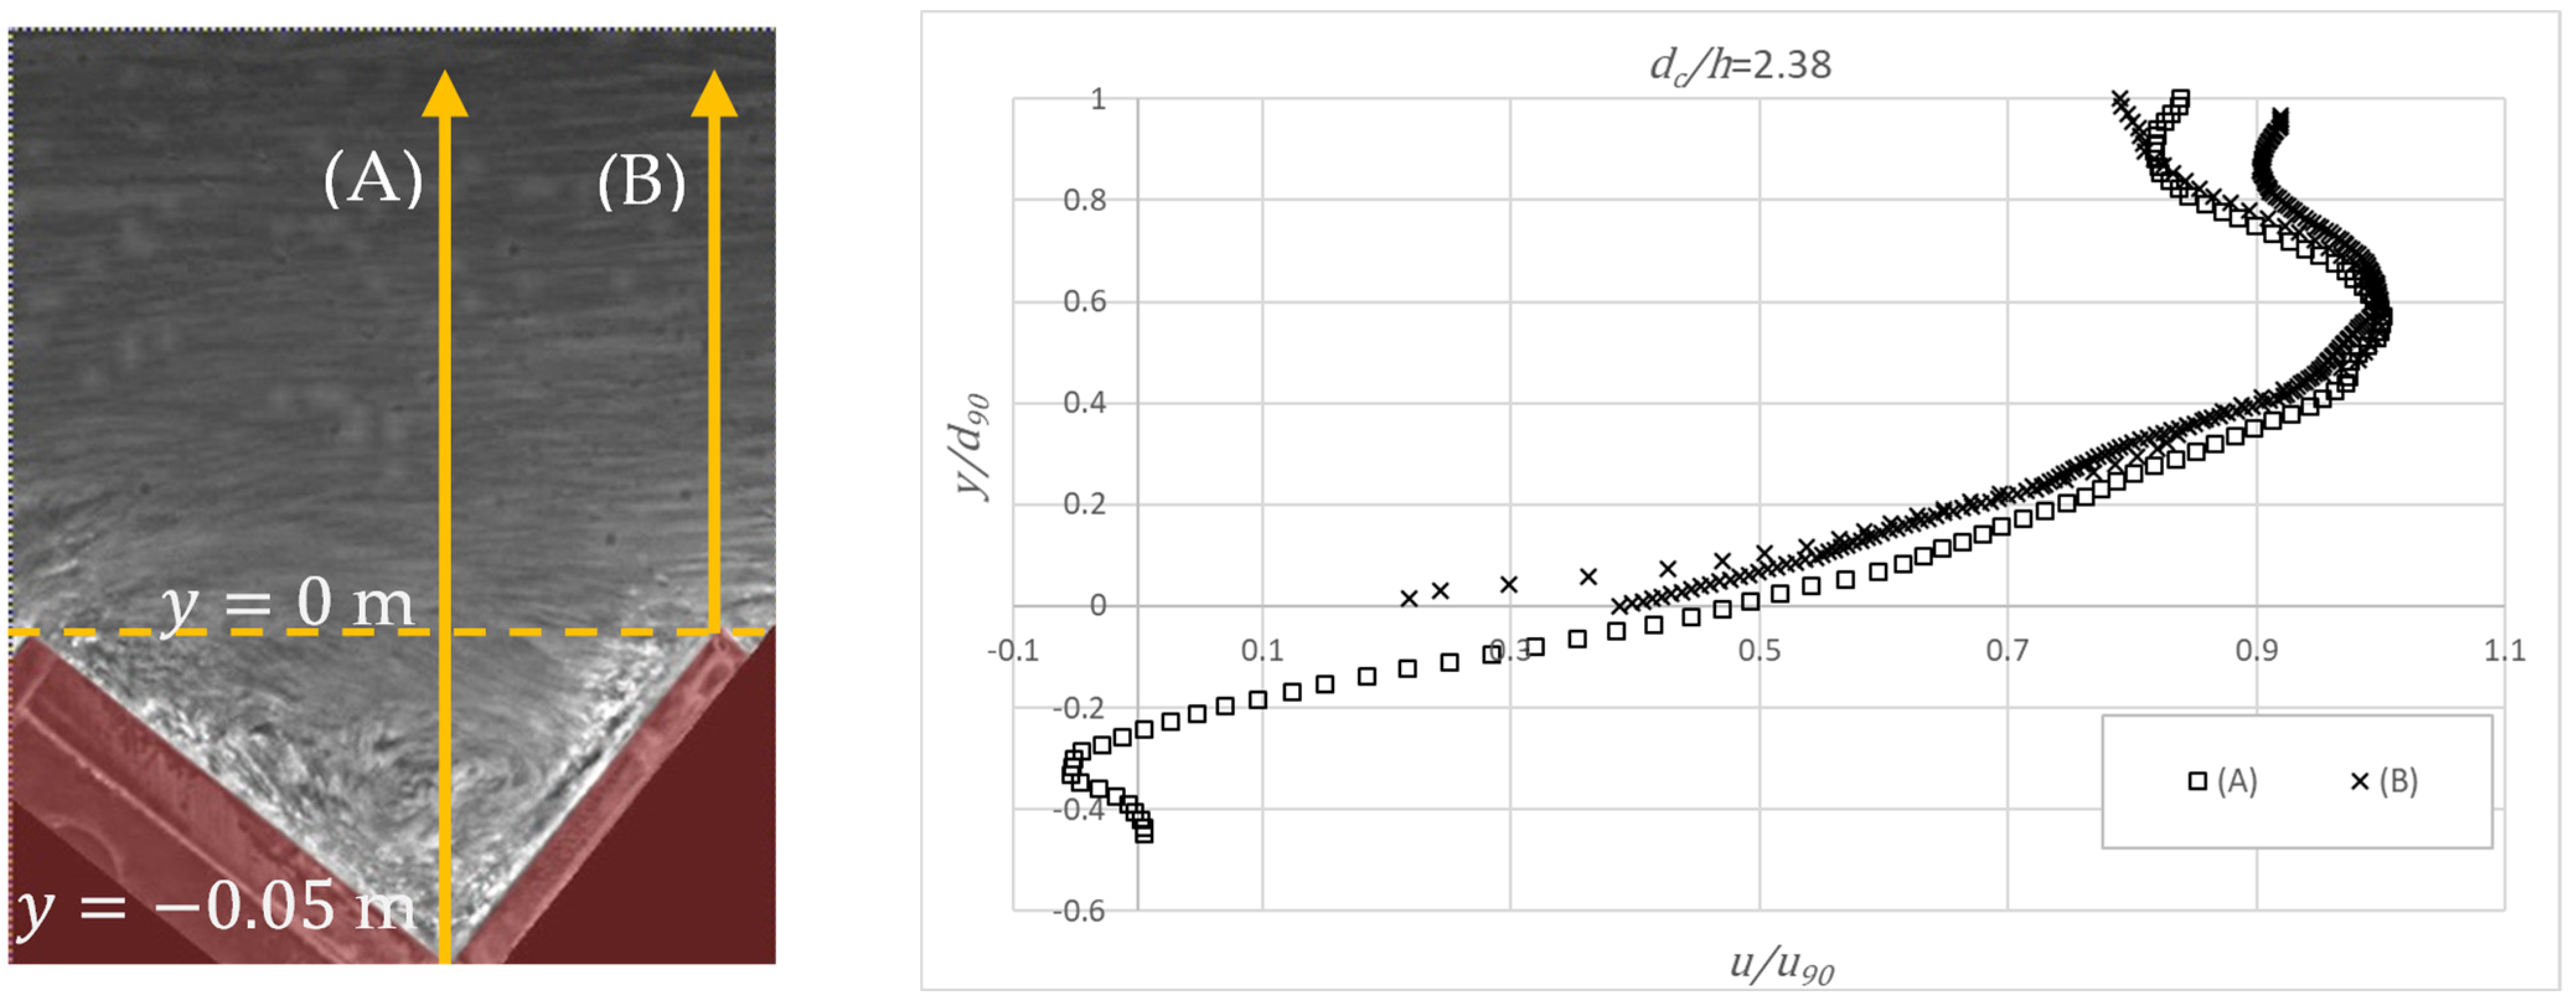
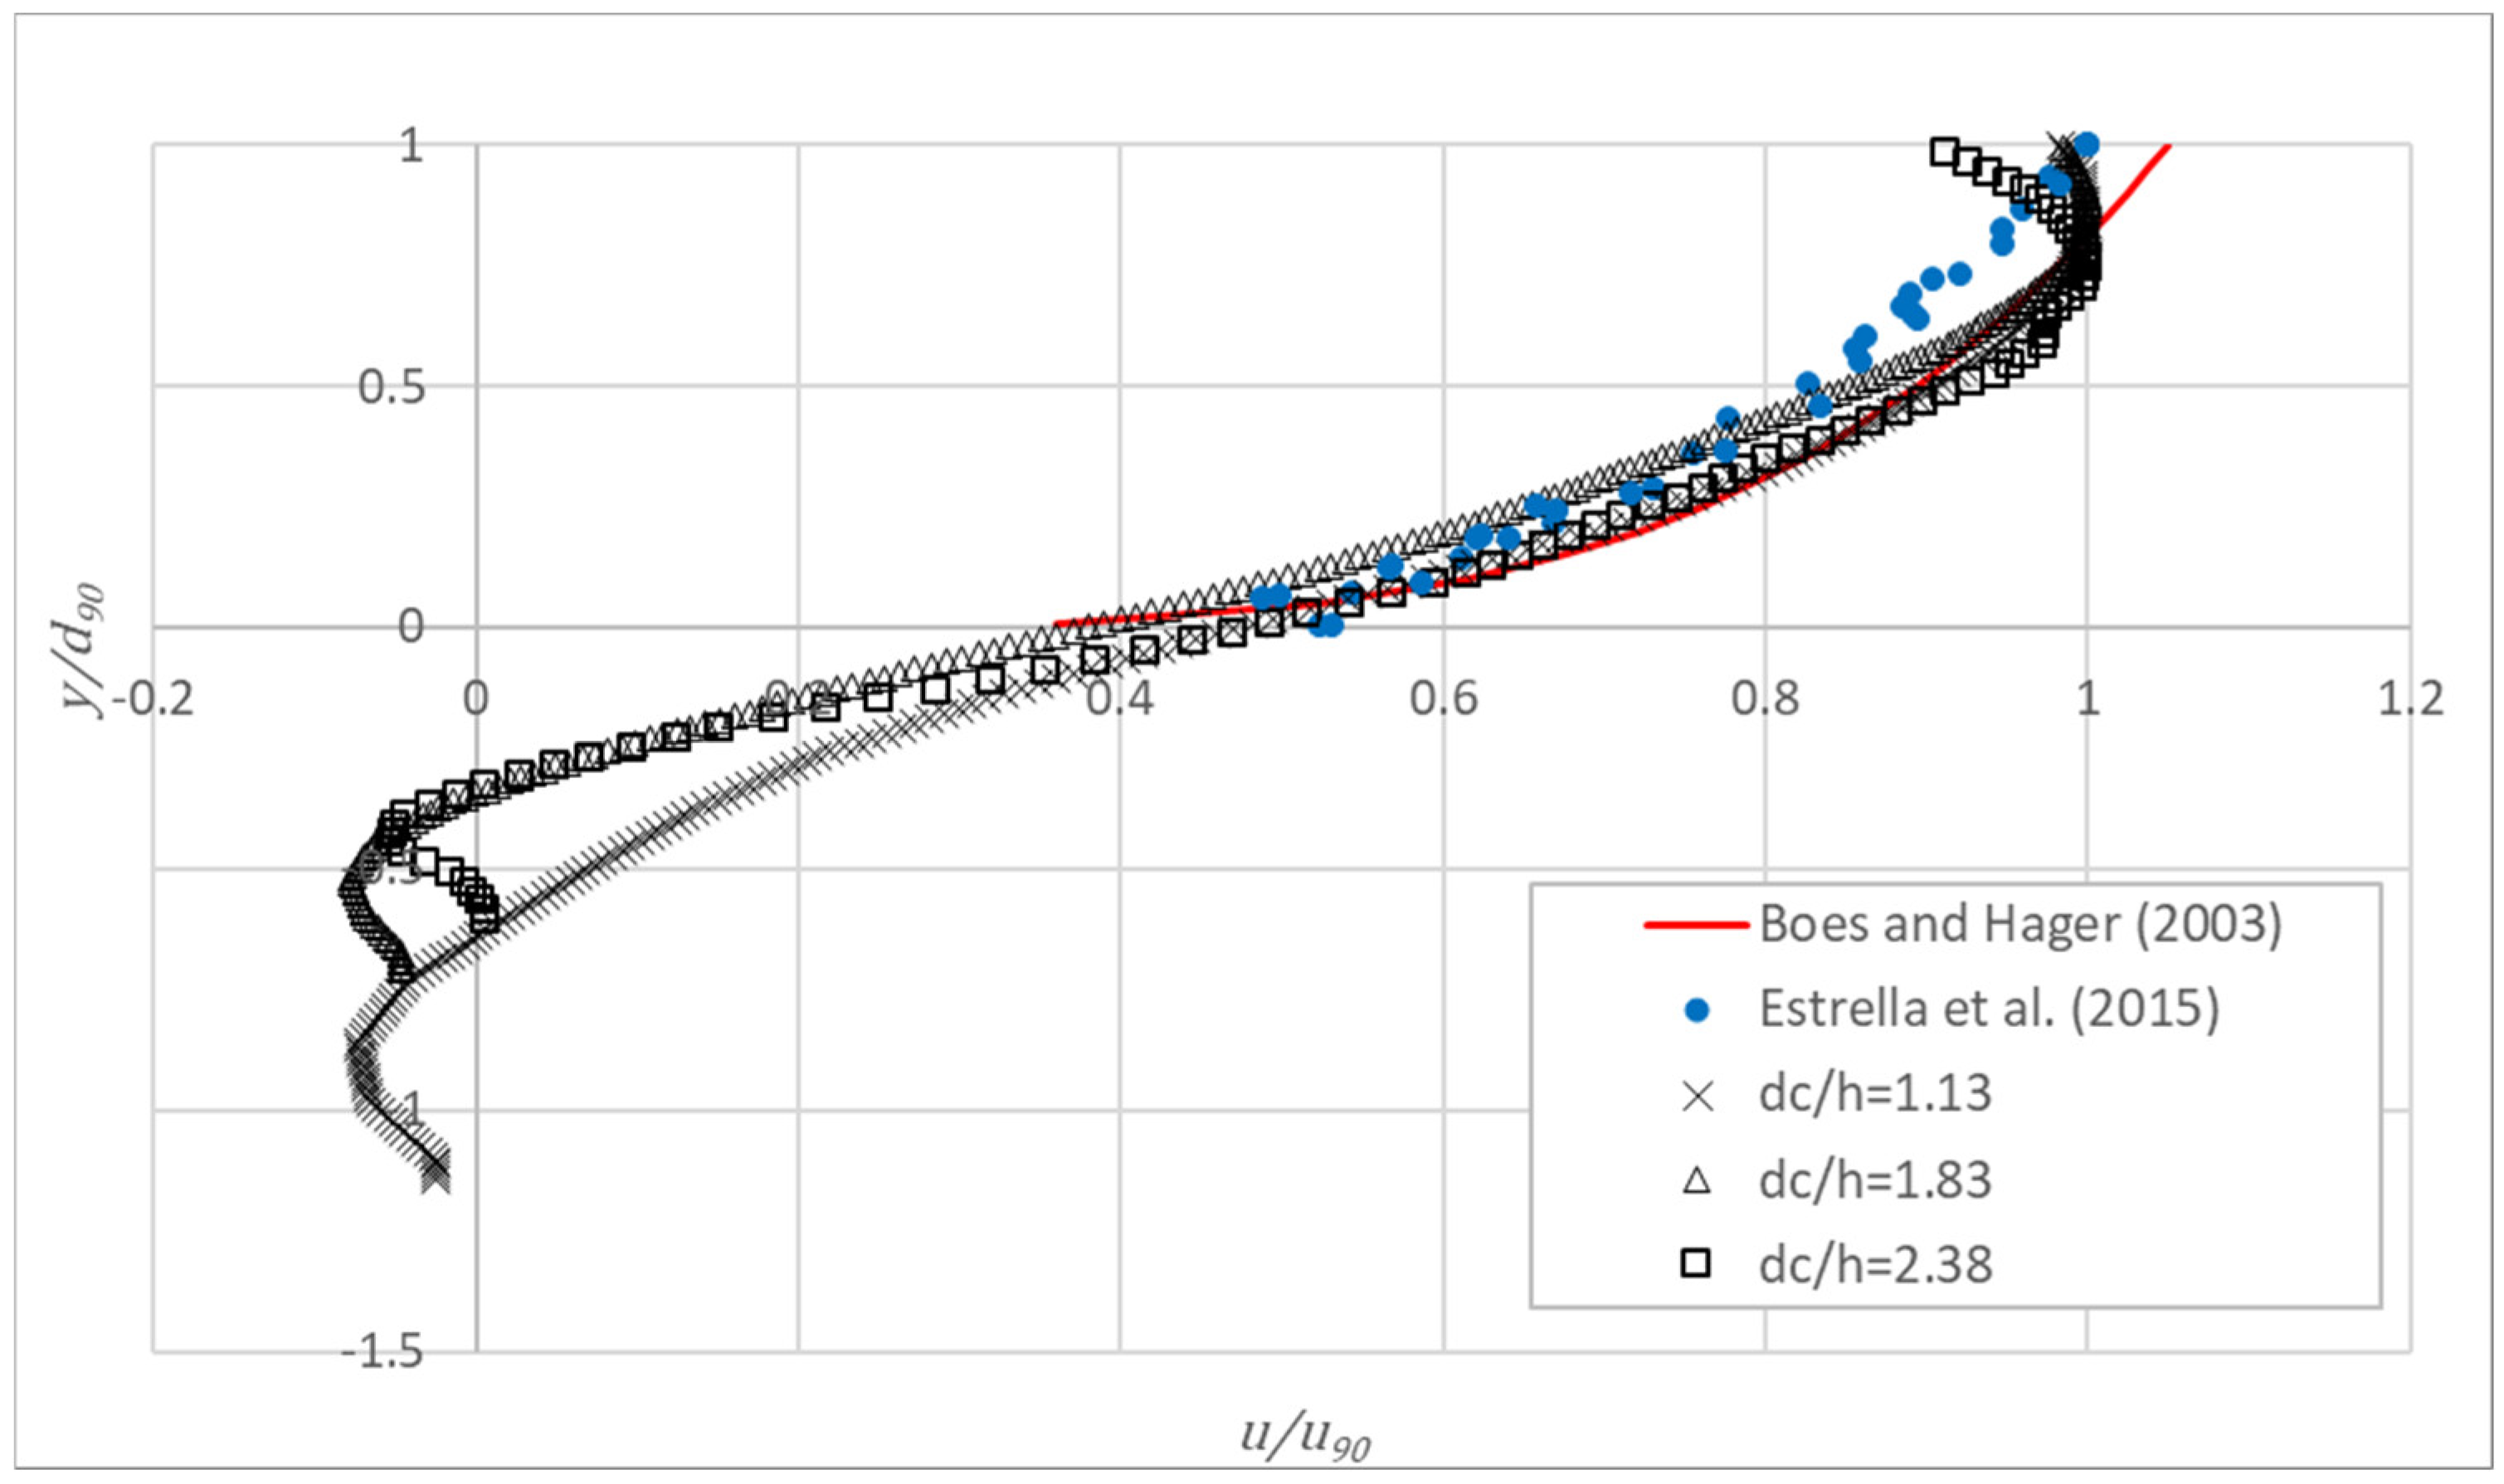
Figure 17 shows the dimensionless horizontal ( u ) velocity profile at L / L t = 0.49 for 400 fps image acquisition rate obtained on the inner step edge (A) and on the outer step edge (B). In the case of position (B), two profiles are shown. It can be seen that image correlations are able to detect the recirculation eddy formed in the inner cavity below the pseudo-bottom. In turn, it is also seen that, in the outer zone, a maximum of velocity is obtained considerably below the free-surface, which is not in agreement with the results obtained by other authors on the same chute or in steeply sloping chutes, using double-tip fiber-optical probes ([13,17,45]). The fact that the external zone of the flow is darker than that corresponding to the cavity flow causes quite low values of the correlations between successive frames that question the goodness of the estimates of the velocity obtained with PIVlab, as previously shown in Figure 12. This may also explain the different velocity profiles in this zone, namely at identical position (B), suggesting that the lighting system used in this study should be improved. Finally, in Figure 18 an acceptable agreement between the dimensionless velocity profiles obtained in the present work with those in [13] and [17] is shown, except in the external flow zone, where larger differences were obtained, as expected.

5. Conclusions

From the experiments carried out in skimming, highly-aerated flow on a stepped chute without sidewall constraint, using a BIV technique for a range of discharges and image acquisition rates, the following conclusions can be drawn:
  • Image pre-processing is considered necessary to improve contrast so as to highlight the presence of air within the flow. In the present study, a rotation of images for both frontal and lateral analysis and a CLAHE filter were applied. Overall, for both views, the results were not influenced by the size of the interrogation areas.
  • PIVlab appears to be a valid tool to estimate free-surface velocities from frontal view measurements, for highly aerated flows, using air bubbles as tracers. Correlations between consecutive frames are acceptable, regardless of the image acquisition rate. However, inaccurate estimations were obtained shortly downstream of the inception point, in the partially aerated region.
  • Free-surface velocities, obtained from frontal view measurements, tend to increase downstream of the inception point, showing an increasing transverse component due to the lack of a lateral sidewall. For small dimensionless discharges and sufficiently downstream of the point of inception, the free-surface velocity compares relatively well with the air–water interfacial velocity previously obtained with a double-tip fiber optical probe in the same facility. However, for the largest dimensionless discharges, significant differences were obtained regardless of the image acquisition rate.
  • The velocity profiles estimated from the lateral view measurements are practically independent of the size of the interrogation area for 400 fps. In contrast, for 200 fps, the velocities are markedly dependent on the size of the interrogation area, being significantly smaller than those obtained for 400 fps.
  • The velocity profiles along the normal to the pseudo-bottom far downstream of the inception point, for 400 fps, are in reasonable agreement with air–water interfacial velocity profiles previously obtained in the same chute, except in the external flow zone, where larger differences were obtained, possibly due to poor lighting, yielding low correlations between consecutive frames. Providing adequate lighting of the area of interest is judged of relevance to improve the performance of air as a flow tracer.

Author Contributions

Conceptualization, M.S.-J., S.E. and J.M.; methodology, M.S.-J., E.B., E.M.-G. and E.B.G.; software, M.S.-J., S.E. and E.B.; validation, M.S.-J., S.E. and J.M.; formal analysis, E.B, E.M.-G. and E.B.G.; investigation, E.B., E.M.-G. and E.B.G.; resources, M.S.-J., S.E. and J.M.; writing—original draft preparation, M.S.-J., S.E. and J.M.; writing—review and editing—M.S.-J., S.E., J.M., E.B. E.M.-G. and E.B.G.; supervision, M.S.-J., S.E., J.M. and E.B.; project administration, E.M.-G. and E.B.G.; funding acquisition, M.S.-J. and E.B. All authors have read and agreed to the published version of the manuscript.

Funding

This research was funded by the Spanish Ministry of Science and Innovation, grant number project CIT-38000-2009-4 presented to the National Applied Research Projects under the National framework of R+D+I 2008–2011; the Spanish Ministry of Economy and Competitivity, grant number BIA2013-49007-C2-2-R presented to the State Program for Research, Development and Innovation Oriented to the Challenges of Society 2014–2017.

Institutional Review Board Statement

Not applicable.

Informed Consent Statement

Not applicable.

Data Availability Statement

Some or all data, models, or code that support the findings of this study are available from the corresponding author upon reasonable request.

Conflicts of Interest

The authors declare no conflict of interest.

Notations

The following symbols are used in this paper:
b transverse distance from the right wall of the chute (m)
b 0 chute width at the upstream end (m)
C v coefficient of variation (-)
d c critical depth (m)
d 90 characteristic flow depth relative to 0.90 air concentration (m)
g gravitational acceleration (m/s2)
h step height (m)
k s step roughness height (m)
L streamwise distance along the chute to the outer edge of the step (m)
L t total length of the chute (m)
q unit discharge at the chute entrance (m2/s)
y coordinate perpendicular to and starting at the pseudo-bottom (m)
t time (s)
u velocity (m/s)
u 90 velocity at d 90 (m/s)
u i velocity at the inception point (m/s)

References

  1. Chanson, H. The Hydraulics of Stepped Chutes and Spillways; Balkema: Lisse, The Netherlands, 2002; ISBN 9058093522. [Google Scholar]
  2. Chanson, H.; Bung, D.B.; Matos, J. Stepped Spillways and Cascades. In Energy Dissipation in Hydraulic Structures; Chanson, H., Ed.; CRC Press: Boca Raton, FL, USA, 2015; p. 20. ISBN 9780429225994. [Google Scholar]
  3. Frizell, K.W.; Frizell, K.H. Guidelines for the Hydraulic Design of Stepped Spillways; Hydraulic Laboratory Report HL-2015-06; Bureau of Reclamation: Denver, CO, USA, 2015. [Google Scholar]
  4. Hager, W.H.; Schleiss, A.J.; Boes, R.M.; Pfister, M. Hydraulic Engineering of Dams; CRC Press: London, UK, 2020; ISBN 9780203771433. [Google Scholar]
  5. Sánchez-Juny, M.; Dolz, J. Experimental Study of Transition and Skimming Flows on Stepped Spillways in RCC Dams: Qualitative Analysis and Pressure Measurements. J. Hydraul. Res. 2005, 43, 540–548. [Google Scholar] [CrossRef]
  6. Sánchez-Juny, M.; Bladé, E.; Dolz, J. Pressures on a Stepped Spillway. Pressions Sur Un Déversoir En Gradins. J. Hydraul. Res. 2007, 45, 505–511. [Google Scholar] [CrossRef]
  7. Sánchez-Juny, M.; Bladé, E.; Dolz, J. Analysis of Pressures on a Stepped Spillway. J. Hydraul. Res. 2008, 46, 410–414. [Google Scholar] [CrossRef]
  8. Amador, A.; Sánchez-Juny, M.; Dolz, J. Developing Flow Region and Pressure Fluctuations on Steeply Sloping Stepped Spillways. J. Hydraul. Eng. ASCE 2009, 135, 1092–1100. [Google Scholar] [CrossRef]
  9. André, S.; Matos, J.; Boillat, J.-L.; Schleiss, A. Energy Dissipation and Hydrodynamic Forces of Aerated Flow over Macro-Roughness Linings for Overtopped Embankment Dams. In Proceedings of the International Conference on Hydraulics of Dams and River Structures; Yazdandoost, F., Attari, J., Eds.; Taylor & Francis Group: Teheran, Iran, 2004; pp. 189–196. [Google Scholar]
  10. Tehrani, M.J.O.M.; Matos, J.; Pfister, M.; Schleiss, A.J. Bottom-Pressure Development Due to an Abrupt Slope Reduction at Stepped Spillways. Water 2022, 14, 41. [Google Scholar] [CrossRef]
  11. Matos, J.; Novakoski, C.K.; Ferla, R.; Marques, M.G.; Dai Prá, M.; Canellas, A.V.B.; Teixeira, E.D. Extreme Pressures and Risk of Cavitation in Steeply Sloping Stepped Spillways of Large Dams. Water 2022, 14, 306. [Google Scholar] [CrossRef]
  12. Frizell, K.W.; Renna, F.M.; Matos, J. Cavitation Potential of Flow on Stepped Spillways. J. Hydraul. Eng. 2013, 139, 630–636. [Google Scholar] [CrossRef]
  13. Boes, R.M.; Hager, W.H. Two-Phase Flow Characteristics of Stepped Spillways. J. Hydraul. Eng. 2003, 129, 661–670. [Google Scholar] [CrossRef]
  14. Pfister, M.; Hager, W.H. Self-Entrainment of Air on Stepped Spillways. Int. J. Multiph. Flow 2011, 37, 99–107. [Google Scholar] [CrossRef]
  15. Relvas, A.T.; Pinheiro, A.N. Velocity Distribution and Energy Dissipation along Stepped Chutes Lined with Wedge-Shaped Concrete Blocks. J. Hydraul. Eng. ASCE 2011, 137, 423–431. [Google Scholar] [CrossRef]
  16. Takahashi, M.; Ohtsu, I. Aerated Flow Characteristics of Skimming Flow over Stepped Chutes. J. Hydraul. Res. 2012, 50, 427–434. [Google Scholar] [CrossRef]
  17. Estrella, S.; Sánchez-Juny, M.; Bladé, E.; Dolz, J. Physical Modeling of a Stepped Spillway without Sidewalls. Can. J. Civ. Eng. 2015, 42, 311–318. [Google Scholar] [CrossRef]
  18. Ostad Mirza, M.J.; Matos, J.; Pfister, M.; Schleiss, A.J. Effect of an Abrupt Slope Change on Air Entrainment and Flow Depths at Stepped Spillways. J. Hydraul. Res. 2017, 55, 362–375. [Google Scholar] [CrossRef]
  19. Felder, S.; Pfister, M. Comparative Analyses of Phase-Detective Intrusive Probes in High-Velocity Air–Water Flows. Int. J. Multiph. Flow 2017, 90, 88–101. [Google Scholar] [CrossRef]
  20. Kramer, M.; Hohermuth, B.; Valero, D.; Felder, S. Best Practices for Velocity Estimations in Highly Aerated Flows with Dual-Tip Phase-Detection Probes; Elsevier Ltd.: Amsterdam, The Netherlands, 2020; Volume 126, ISBN 0000000310796. [Google Scholar]
  21. Terrier, S.; Pfister, M.; Schleiss, A.J. Performance and Design of a Stepped Spillway Aerator. Water 2022, 14, 153. [Google Scholar] [CrossRef]
  22. Hunt, S.L.; Kadavy, K.C.; Wahl, T.L.; Moses, D.W. Physical Modeling of Beveled-Face Stepped Chute. Water 2022, 14, 365. [Google Scholar] [CrossRef]
  23. Frizell, K.H.; Ehler, D.G.; Mefford, B.W. Developing Air Concentration and Velocity Probes for Measuring Highly-Aerated, High-Velocity Flow. In Proceedings of the Symposium on Fundamentals and Advancements in Hydraulic Measurements and Experimentation; ASCE: Reston, VA, USA, 1994; pp. 268–277. [Google Scholar]
  24. Matos, J.; Frizell, K.H. Air Concentration Measurements in Highly Turbulent Aerated Flow. In Environmental and Coastal Hydraulics: Protecting the Aquatic Habitat; Wang, S.S.Y., Carsten, T., Eds.; ASCE: Reston, VA, USA, 1997; Volume B, pp. 149–154. [Google Scholar]
  25. Matos, J.; Frizell, K.H. Air Concentration and Velocity Measurements on Self-Aerated Flow down Stepped Chutes. In Proceedings of the Joint Conference on Water Resource Engineering and Water Resources Planning and Management 2000, Minneapolis, MN, USA, 30 July–2 August 2000; American Society of Civil Engineers. Volume 104. [Google Scholar]
  26. Chamani, M.R.; Rajaratnam, N. Characteristics of Skimming Flow over Stepped Spillways. J. Hydraul. Eng. ASCE 1999, 126, 361–368. [Google Scholar] [CrossRef]
  27. Matos, J.; Meireles, I. Hydraulics of Stepped Weirs and Dam Spillways: Engineering Challenges, Labyrinths of Research. In Proceedings of the ISHS 2014—Hydraulic Structures and Society—Engineering Challenges and Extremes: Proceedings of the 5th IAHR International Symposium on Hydraulic Structures, Brisbane, Australia, 25–27 June 2014; pp. 127–134. [Google Scholar]
  28. Ohtsu, I.; Yasuda, Y. Characteristics of Flow Conditions on Stepped Channels. In Proceedings of the 27th IAHR Biennial Congress, San Francisco, CA, USA, 10–15 August 1997; pp. 583–588. [Google Scholar]
  29. Amador, A.; Sánchez-Juny, M.; Dolz, J. Characterization of the Nonaerated Flow Region in a Stepped Spillway by PIV. J. Fluids Eng. 2006, 128, 1266–1273. [Google Scholar] [CrossRef]
  30. Zhang, G.; Valero, D.; Bung, D.B.; Chanson, H. On the Estimation of Free-Surface Turbulence Using Ultrasonic Sensors. Flow Meas. Instrum. 2018, 60, 171–184. [Google Scholar] [CrossRef]
  31. Kramer, M.; Chanson, H.; Felder, S. Can We Improve the Non-Intrusive Characterization of High-Velocity Air–Water Flows? Application of LIDAR Technology to Stepped Spillways. J. Hydraul. Res. 2020, 58, 350–362. [Google Scholar] [CrossRef]
  32. Leandro, J.; Bung, D.B.; Carvalho, R. Measuring Void Fraction and Velocity Fields of a Stepped Spillway for Skimming Flow Using Non-Intrusive Methods. Exp. Fluids 2014, 55, 1732. [Google Scholar] [CrossRef]
  33. Bung, D.B.; Valero, D. Optical Flow Estimation in Aerated Flows. J. Hydraul. Res. 2016, 54, 575–580. [Google Scholar] [CrossRef]
  34. Zhang, G.; Chanson, H. Application of Local Optical Flow Methods to High-Velocity Free-Surface Flows: Validation and Application to Stepped Chutes. Exp. Therm. Fluid Sci. 2018, 90, 186–199. [Google Scholar] [CrossRef]
  35. Kramer, M.; Chanson, H. Optical Flow Estimations in Aerated Spillway Flows: Filtering and Discussion on Sampling Parameters. Exp. Therm. Fluid Sci. 2019, 103, 318–328. [Google Scholar] [CrossRef]
  36. Lopes, P.; Leandro, J.; Carvalho, R.F.; Bung, D.B. Alternating Skimming Flow over a Stepped Spillway. Environ. Fluid Mech. 2017, 17, 303–322. [Google Scholar] [CrossRef]
  37. Chanson, H. Stepped Spillway Prototype Operation, Spillway Flow and Air Entrainment: The Hinze Dam, Australia; Hydraulic Model Report, CH123/21 2021; School of Civil Engineering, The Unviersity of Queensland: Brisbane, Australia, 2021. [Google Scholar]
  38. Kramer, M.; Felder, S. Remote Sensing of Aerated Flows at Large Dams: Proof of Concept. Remote Sens. 2021, 13, 2836. [Google Scholar] [CrossRef]
  39. Thielicke, W.; Stamhuis, E.J. PIVlab–Towards User-Friendly, Affordable and Accurate Digital Particle Image Velocimetry in MATLAB. J. Open Res. Softw. 2014, 2, e30. [Google Scholar] [CrossRef]
  40. Thielicke, W.; Sonntag, R. Particle Image Velocimetry for MATLAB: Accuracy and Enhanced Algorithms in PIVlab. J. Open Res. Softw. 2021, 9, 12. [Google Scholar] [CrossRef]
  41. Adrian, R. Statistical Properties of Particle Image Velocimetry Measurements in Turbulent Flow. In Proceedings of the Int. Symposium of Laser Anemometry in Fluid Mechanics; Instituto Superior Técnico (IST): Lisboa, Portugal, 1988; pp. 115–129. [Google Scholar]
  42. Keane, R.D.; Adrian, R.J. Optimization of Particle Image Velocimeters. I. Double Pulsed Systems Optimization of Particle Image velocimeters. Part I: Double Pulsed Systems. Meas. Sci. Technol. Meas. Sci. Technol. 1990, 1, 1202–1215. [Google Scholar] [CrossRef]
  43. Willert, C.E.; Gharib, M. Digital Particle Image Velocimetry. Exp. Fluids 1991, 10, 181–193. [Google Scholar] [CrossRef]
  44. Westerweel, J. Digital Particle Image Velocimetry—Theory and Application; Delft University of Technology: Delft, The Netherlands, 1993. [Google Scholar]
  45. Estrella, S. Comportamiento Hidráulico de Aliviaderos Escalonados Sin Cajeros Laterales En Presas de HCR.; UPC-BarcelonaTECH: Barcelona, Spain, 2013. [Google Scholar]
  46. Pons, M. de la P. Estudi Experimental Mitjançant Vídeo D’alta Velocitat d’un Sobreeixidor Esglaonat; Universitat Politècnica de Catalunya: Barcelona, Spain, 2015. [Google Scholar]
Figure 1. Frontal view of the physical model built in the Hydraulics and Fluid Mechanics Laboratory of the Civil Engineering School at UPC.
Water 14 02587 g001
Figure 2. Plain view of the stepped chute (dimensions in mm). The guiding wall at 1 m from the right side is shown. The field of view of the camera covers an area from L / L t = 0.17 to 0.44 (step 11 to step 29), and transversely, up to 2.5 m from the right side of the chute.
Water 14 02587 g002
Figure 3. (a) Image collection apparatus for L / L t = 0.49 (which is equivalent to that on L / L t = 0.88 ) using frontal illumination. (b) Image collection apparatus for L / L t ranging from 0.88   to   0.89 using back illumination.
Water 14 02587 g003
Figure 4. (a) Original frame #0001 of video 0 (without water, 200 fps); the blue line is the foot of the right sidewall of the chute. (b) Image folding (profile view). (c) Folded original frame #0001 of video 0; the green line represents the foot of the folded right sidewall of the chute.
Water 14 02587 g004
Figure 5. Image corresponding to L / L t = 0.49 and d c / h = 2.38 : (a) Original frame; (b) Rotated frame 51.3° counterclockwise.
Water 14 02587 g005
Figure 6. Frame 0001 corresponding to d c / h = 1.13 and 200 fps. (a) Original image. (b) Image after a CLAHE filter.
Water 14 02587 g006
Figure 7. Frame 1104 corresponding to d c / h = 2.38 and 200 fps. (a) Original image. (b) Image after a CLAHE filter and contrast improvement (minimum 0 and maximum 0.95).
Water 14 02587 g007
Figure 8. (a) Gross frontal velocity field obtained in frame 691 for d c / h = 2.38 for an interrogation area with 4 steps using decreasing size of the interrogation areas from 300 px to 50 px. (b) Time-averaged correlation for 400 fps and 200 fps across the chute width at L / L t = 0.30 .
Water 14 02587 g008
Figure 9. Time evolution of the correlation between consecutive frames obtained for L / L t = 0.30 , b / b 0 = 1.17 , d c / h = 2.38 , and 200 fps or 400 fps.
Water 14 02587 g009
Figure 10. Average velocity field obtained at L / L t = 0.49 for d c / h = 2.38 and (a) 200 fps (b) 400 fps, when reducing the interrogation area in 3 steps from 288 to 144, then to 72, and then to 36 pixels.
Water 14 02587 g010
Figure 11. Longitudinal component of velocity ( u ) obtained at L / L t = 0.49 along the normal to the pseudo−bottom from the internal edge of the step for 200 fps and 400 fps, for interrogation areas reduced in 2 steps from 194, to 97, and then to 49 pixels (a); in 2 steps from 256, to 128, and then to 64 pixels (b) and in 3 steps from 288 to 144, then to 72, and then to 36 pixels. The scheme includes the layout of the vertical where the velocities were obtained. The dashed line represents the pseudo−bottom (y = 0).
Water 14 02587 g011
Figure 12. Time−averaged correlation between consecutive frames (a) and coefficient of variation (b) obtained at L / L t = 0.49 for 200 fps and 400 fps. The scheme includes the layout of the vertical where the velocities were obtained. The dashed line represents the pseudo-bottom (y = 0).
Water 14 02587 g012
Figure 13. Post-processed frontal velocity field obtained in frame 691 for d c / h = 2.38 .
Water 14 02587 g013
Figure 14. Velocity field obtained for d c / h = 2.38 at (a) 200 fps and (b) 400 fps.
Water 14 02587 g014
Figure 15. Velocity field obtained for 400 fps and (a) d c / h = 1.13 and (b) d c / h = 1.83 .
Water 14 02587 g015
Figure 16. Dimensionless free-surface velocity development along the chute for 200 fps and 400 fps: comparison with the empirical formula obtained by [17,45].
Water 14 02587 g016aWater 14 02587 g016b
Figure 17. Dimensionless longitudinal ( u ) velocity profiles at L / L t = 0.49 for d c / h = 2.38 ,   in the locations (A) and (B) for 400 fps. The scheme includes the layout of the verticals (A) and (B) where the velocities were obtained. The dashed line represents the pseudo−bottom (y = 0). Two different profiles in (B) position were obtained.
Water 14 02587 g017
Figure 18. Dimensionless longitudinal velocity profile at L / L t = 0.49 along the normal to the pseudo−bottom from the internal edge of the step, for 400 fps and for 1.13 d c / h 2.38 . Comparison with the results by Boess and Hager [13] and Estrella et al. [17].
Water 14 02587 g018
Publisher’s Note: MDPI stays neutral with regard to jurisdictional claims in published maps and institutional affiliations.