Article

Subtidal Dynamics in a Tidal River with Limited Discharge

by
Gillang Noor Nugrahaning Gusti
1,*,
Kiyosi Kawanisi
1,*,
Mohamad Basel Al Sawaf
1 and
Faruq Khadami
1,2
1
Department of Civil and Environmental Engineering, Graduate School of Engineering, Hiroshima University, 1-4-1 Kagamiyama, Higashi-Hiroshima 739-8527, Japan
2
Research Group of Oceanography, Faculty of Earth Sciences and Technology, Bandung Institute of Technology, Bandung 40132, Indonesia
*
Authors to whom correspondence should be addressed.
Water 2022, 14(16), 2585; https://doi.org/10.3390/w14162585
Submission received: 2 August 2022 / Revised: 15 August 2022 / Accepted: 17 August 2022 / Published: 22 August 2022
(This article belongs to the Section Hydraulics and Hydrodynamics)

Abstract

:
Investigating subtidal friction and mass transport is pivotal for examining subtidal dynamics in tidal rivers. Although the behavior of subtidal friction and transport has been discussed in recent years, most studies have been conducted on tidal rivers that are affected by high amounts of river runoff. The aim of this study is to offer an initial understanding of the spatial and temporal behaviors of subtidal friction and subtidal flux in a tidal river channel with limited river runoff. This study utilized the frequency domain and theoretical decomposition analyses to determine the dominant tidal and subtidal mechanisms. Frequency domain analysis indicated the dominance of semidiurnal and diurnal tides in the observed tidal river channel. The rate of energy transfer owing to shallow water interaction was found to be stronger for the current velocity than for the water elevation. Decomposition analysis showed that subtidal friction and flux in a low-discharge tidal river channel were largely influenced by subtidal flow-induced subtidal friction and Eulerian return flux, respectively. The key findings of this study are as follows: (i) the limited amount of river runoff (4–20 m3/s) leads to the vertical variability of subtidal friction contributions from subtidal flow and subtidal-tidal interaction, as well as Eulerian return flux, and (ii) the vertical variability of the aforementioned terms can be associated with the existence of influential longitudinal subtidal density gradients along the tidal river. We believe that these findings advance our understanding of subtidal dynamics in tidal river systems, particularly those with limited discharge.

1. Introduction

Tidal rivers occupy transitional water bodies in lowland areas situated between the rivers and the sea. Tidal rivers are often located in highly populated, urban areas. Therefore, tidal rivers provide important feedback in society from physical aspects, such as wetland ecosystems, hydrological processes, water quality, and sediment transport, as well as socio-economic aspects, such as disaster risk prevention, fisheries, navigational safety, and even political stakes [1,2,3,4,5] A tidal river exhibits a complex hydrodynamic structure because land-originated river runoff encounters bidirectional-flow tidal currents. The hydrodynamic complexity of a tidal river is further enhanced by the impact of other minor, but not insignificant, factors, such as water waves, surges, mean sea level variation, and topographical conditions [6,7].
The interaction between propagating tidal waves and river runoff leads to tidal distortion and damping [8]. Furthermore, this nonlinear interaction generates quadratic friction within the water columns of tidal rivers [8,9]. In tidal river systems, the behaviors of tidal-fluvial interaction can be identified by utilizing a one dimensional momentum balance equation, which is referred to as the Saint Venant Equation [6,10,11]. Buschman et al. [12] evaluated the friction term in the subtidal (averaged over a diurnal period) Saint Venant equation by utilizing velocity and water elevation data for the Berau River, Indonesia which resulted in a residual flow term (significantly influenced by river runoff, Fr), a river-tide interaction term (Frt), and a tidal asymmetry term (Ft). An observational study of the Mahakam River, Indonesia by Sassi and Hoitink [13] revealed that river runoff significantly affects the relative contributions of the three subtidal friction terms, implying an interrelationship between the development of Frt and Ft with quarterdiurnal and fortnightly tides. More importantly, a study by Guo et al. [14] on the Yangtze River, China stated that these subtidal friction terms also governed the variation in the subtidal water elevation, indicating the significant role of subtidal friction in the tidal river environment.
In addition to subtidal friction, the propagating tidal wave in the tidal river generates an inherent landward mass transport known as Stokes flux. The magnitude of the Stokes flux peaked when the phase difference between the water elevation and current velocity was 0° and was non-existent when the phase difference was 90°. In a single tidal river channel with no floodplains, the Stokes flux is typically balanced by the Eulerian seaward ‘return’ flux, which is closely associated to the river runoff [15]. Hence, the magnitude of the subtidal discharge in a single tidal river channel is usually close to zero [6,16].
In most cases, the contributions of river runoff and river–tide interactions to subtidal friction and river–tide interactions have positive values that reflect a strong seaward orientation of the subtidal velocity, which is largely governed by river runoff [12,13]. However, in the case of subtidal discharge terms, the river runoff-affected return flux was the product of the subtidal pressure gradient induced by the landward-oriented Stokes flux. Therefore, the return flux naturally comes in a seaward orientation as a net compensating flux to balance the Stokes flux [15,17]. However, it must be highlighted that these studies were conducted in the estuarine environments that received a high amount of freshwater runoff. Recently, Zhang et al. [18] and Zhang et al. [19] conducted numerical simulations of the subtidal flow and discharge by considering a tidal channel with low freshwater runoff in the Yangtze Delta, China. Their studies revealed that landward return flux can be generated owing to variations in the channel depth and width over long distances. The landward return flux further generated a significant difference between the subtidal discharge magnitude and upstream and downstream phases. However, to the best of our knowledge, the existence of an anomaly in the return flux pattern was only observed in the results of the numerical simulation. Additionally, because subtidal friction terms are also affected by the amount of river discharge, changes in subtidal behavior due to limited river discharge might affect more than just subtidal discharge. Herein, we intend to confirm the existence of such anomalies, not only in subtidal discharge, but also in subtidal friction, from field observations in a tidal channel with limited river runoff.
This study investigated the spatial and temporal variability of subtidal friction and subtidal flux in a low-discharge tidal river channel using the frequency domain and theoretical decomposition analyses. The frequency domain analysis consisted of power spectrum and tidal harmonic analyses, which revealed the dominant tidal mechanisms in the tidal river channel. The decomposition analyses by Buschman et al. [12] and Buschman et al. [15] were employed to unravel the underlying dynamics. We demonstrate the vertical variability in the friction and flux terms, the governing mechanism that induce their variability, and their anomalous orientation. The remainder of this paper is organized as follows. Section 2 describes the study area, the data, and the methods used. Section 3 and Section 4 present the results and a discussion, respectively. Finally, a summary of the study is presented in Section 5.

2. Materials and Methods

2.1. Field Site

The Ota River Estuary is a small-scale estuarine network situated in the delta of Hiroshima which flows into Hiroshima Bay, Japan (Figure 1). The Ota River Estuary has high socioeconomic value in Hiroshima. In addition to the vital functions of this estuary for transportation and tourism, its downstream area is extensively used for oyster aquaculture [20]. The tidal regime in this estuary is mainly semidiurnal, with a tidal range varying from 1.2 m at neap tide to 4 m at spring tide at the river mouth [21]. Over this multichannel network, tidal waves can propagate as far as 13 km upstream from the mouth, although the saline water intrusion length is slightly shorter, at 11 km [22]. The Ota Diversion Channel is a partially stratified estuary, with a periodic semidiurnal stratification cycle induced by tidal straining. During the flood and the first half ebb, the channel is well mixed, while in the latter half of the ebb, salt wedge formation occurs [23,24]. Additionally, the salinity in the channel varies from 10 psu to 30 psu fortnightly [25]. The maximum tidal current velocities during the flood and ebb, respectively, are 0.65 m/s and 0.5 m/s [26].
At 9 km upstream of the river mouth, the Ota River Estuary bifurcates into two main branches. The west branch is an artificial channel called the Ota Diversion Channel, whereas the east branch splits further into four separate downstream rivers. The Ota Diversion Channel’s mean depth and width are approximately 2.1 m and 248 m, while the east branch has around 2 m of mean depth and 212 m of mean width. Measurements by the Ministry of Land, Infrastructure, Transport, and Tourism (MLIT) at the Yaguchi Gauging Station revealed that under normal conditions, the total discharge that flows through the estuary is approximately 50–80 m3 during summer and 20–30 m3 during winter [25]. Approximately 10–20% of the total discharge flows to the Ota Diversion Channel, depending on the flow condition, whereas the remaining streams flow into the bifurcating eastern branch [27].
The Ota Diversion Channel was constructed from 1934 to 1967 to mitigate Hiroshima City’s flood disaster risk during the rainy and typhoon seasons [28]. The Ota Diversion Channel is divided into two parts. The compound cross-sectional channel spans 6 km downstream of the Gion Floodgate, and a single cross-sectional channel spans 3 km downstream of the compound channel. Generally, the bed materials in the Ota Diversion Channels are dominated by silt and clay, with an increasing proportion of finer particles closer to the river mouth [28,29]. Additionally, under normal conditions, the suspended sediment concentration in the Ota Diversion Channel does not exceed 100 g/m3 [23]. The Gion Floodgate, a flood control structure at the upstream end of the Ota Diversion Channel consisting of three sluice gates, was built to regulate the amount of river flow to the channel. When the gauging station at Yaguchi reports a discharge of greater than 400 m3/s, the Gion Floodgate is fully opened. Xiao et al. [29] classified the Ota Diversion Channel as having moderate estuarine circulation because it is influenced by limited runoff and mesotidal flow from Hiroshima Bay.

2.2. Data Acquisition

A measurement program was conducted in the compound channel section of the Ota Diversion Channel between 16 and 28 March 2021. Three upward-looking ADCPs (2 MHz Nortek Aquadopp profilers) were deployed at three different locations along the Ota Diversion Channel to measure the currents and water depths. All of these were located in the thalweg of the compound channel. However, one was located in a straight channel section (station A), whereas the other two were located in relatively curved channel sections (stations B and C). The ADCPs for measurement programs were designed to have 10 min profiling and averaging intervals, 0.1 m blank distance, and 0.25 m cell depth, with as many as 30 bins. Topographic measurements were conducted on a total station to convert the measured water depths into water levels. Tokyo Peil (TP) of Japan, a modern sea level datum based on the mean sea level in Tokyo Bay, was used as a reference for water levels at all stations. Two Alec Electronics ACT-HR (conductivity and temperature loggers) were deployed 15 cm above the riverbed at stations A and C, with 10 min sampling periods to obtain the near-bottom water density at both the upstream and downstream edges of our observation site. The measurement accuracy of the sensors was 0.05 °C for temperature and 0.02 mS/cm for conductivity. The rating curve at the Yaguchi Gauging Station of the MLIT was used to estimate the river discharge during the measurement programs. The observed water depth, near-bottom salinity, and current velocity at each station are shown in Figure 2.

2.3. Data Processing

The water velocity data from the ADCPs were filtered by omitting bins above the water surface that had low beam counts (20–30 counts). To obtain the longitudinal velocity of the flow, the filtered current data were rotated from an east-north orientation to the orientation of the channel. The longitudinal velocity was then vertically divided into three sections, and all the velocity bins within each section were depth-averaged. The division of the depth section was utilized to represent the vertical variability of the dynamic mechanisms analyzed in this study. Each velocity section covered one-third of the total water depth, representing the upper, middle, and lower velocities over the water column. Simultaneously, the water level data at each station were averaged over a 25 h window to obtain the subtidal water level. The tidal range was obtained by subtracting the maximum water level from the minimum water level for the 25 h window.

2.3.1. Tidal Frequency Domain Analysis

  • Spectral Analysis
Tides greatly affect the water level and current in tidal rivers, with varying level of energy at diurnal, semidiurnal, quarterdiurnal, and fortnightly time scales. The power spectrum describes the time series data in its mean frequency content. Therefore, the power spectrum can distinguish between variability and influential processes within certain time-series data. Herein, the power spectrum was calculated with the aim of resolving dominant tidal processes in the Ota Diversion Channel between a period of 13 days (total length of measurement period) and 2 h (cut-off Nyquist frequency for hourly data). To obtain the power spectrum, we employed the Fourier transform, a method to convert continuous time-series data with a certain time step into its power distribution in the frequency domain [30]. Mathematically, the Fourier transform can be expressed as [31]
F ^ k = t 1 t 2 F t e 2 π kt dt
where F(t) refers to the water level or water current at certain time (t), t1 and t2 denote the start and end times of the analyzed period, and k represents the wave number. The power spectrum is then obtained by multiplying the discrete Fourier transform with its complex conjugate, as shown by the following equation [31]
S k = 1 2 π t 1 t 2 F t e kt 2 = F ^ k F ^ k 2 π
in which F ^ k is the discrete Fourier transform of the analyzed time series, and F ^ k is its complex conjugate. Herein, we applied this method to analyze the mean velocities in each depth section and the water level data. In this analysis, we used hourly water level and velocity data instead of subtidal data to consider the influence of overtide components.
  • Harmonic Analysis
We performed tidal harmonic analysis, a least-squares fitting procedure, in the short-term mode to depth-averaged velocity data, based on the T_Tide function [32]. Originally, this method commonly applied the water level time series as the total of a mean value and a group of harmonic terms, as follows:
  H t = b 0 t + n = 1 N A n   cos   ω n t Φ n + r t ]
where H(t) denotes the water level at a specified time; b0(t) is the mean water level; and A, ω, and Φ are the tidal amplitude, frequency, and phase, respectively, of tidal constituents n (n = 1, 2, ..., N), and r(t) represents the residual components. The short-term tidal harmonic analysis in this study utilized a short data sequence of a 25 h depth-averaged velocity to provide a time series of tidal outputs for the six tidal constituents. Three of these tidal constituents, K1, M2, and M4, were used to represent diurnal, semidiurnal, and quarterdiurnal velocities, respectively.

2.3.2. Subtidal Friction Decomposition

To examine the behavior of the subtidal variation in the Ota Diversion Channel, we followed the approach developed by Buschman et al. [12] to differentiate the subtidal friction components from a cluster of tidal constituents that are similar in frequency. First, the friction term in the subtidal momentum balance can be given as
gW U U C 2 = gW 2 π C 2 0 2 π U U dt
in which U is the current velocity, W denotes the channel width, the Chézy coefficient is represented by C, and the angular bracket describes the averaging process over a diurnal period.
Subsequently, an odd function [8,33] was used to analytically approximate the product of U|U| in the friction term. The friction term can then be expressed as
gW 2 π C 2 0 2 π U U dt gWU m 2 2 π C 2 0 2 π ( a U + b U 3 ) dt
where U is the current velocity nondimensionalized by the maximum velocity (Um), and a and b are two constant coefficients set to 0.3395 and 0.6791, respectively, based on the work of Godin [8]. The dominant velocity components over a diurnal period occur at diurnal, semidiurnal, and quarterdiurnal frequencies. Hence, the nondimensional current velocity can be approximated as [12]
U U 0 + U 1 cos ω 1 t Φ 1 + U 2 cos ω 2 t Φ 2 + U 4 cos ω 4 t Φ 4
The subscript i = 0, 1, 2, 4 denote subtidal currents, diurnal tidal currents, semidiurnal tidal currents, and quarterdiurnal currents, respectively. In this study, U 0 was obtained by averaging the measured current velocity over a diurnal period, whereas U 1 , U 2 , and U 4 were obtained through harmonic analysis, as mentioned in the previous subsection.
To obtain the subtidal friction, Equation (5) was substituted by Equation (6), yielding
g W U m 2 2 π C 2 0 2 π ( a U + b U 3 ) d t                                                               = g W U m 2 2 π C 2 ( ( a U 0 + b U 0 3 ) + 3 b 2 U ( U 1 2 + U 2 2 + U 4 2 )                                                               + 3 b 4 ( U 1 2 U 2 cos ( 2 ϕ 1 ϕ 2 ) + U 2 2 U 4 cos ( 2 ϕ 2 ϕ 4 ) ) )
The first term inside the bracket on the right-hand side represents Fr, the subtidal friction that is induced by the river flow. The second term is Frt, which is the subtidal friction caused by the interaction between the river flow and tides. Finally, the third term represents Ft, which is the subtidal friction due to tidal asymmetry.

2.3.3. Stokes Fluxes Analysis

We investigated the subtidal water transport dynamics in the Ota Diversion Channel by analyzing the Stokes flux, a landward water transport which is induced when the water level and current velocity are in phase, or when the phase difference between the two is minimal [15]. The Stokes flux is balanced by the seaward Eulerian flux, which is created by the gradients in the subtidal water level. To obtain these fluxes, we followed the approaches of Buschman et al. [15] and Sassi and Hoitink [13]. First, the observed current velocity is decomposed into
U = U 0 + U
where U″ is obtained from the zero-mean variation in the current velocity during a tidal cycle. Likewise, the total depth can be expressed as
D = h + η 0 + η
in which h is the water depth ƞ0 is the subtidal elevation, and ƞ″ denotes the zero-mean variation in the water surface elevation during a tidal cycle. Subsequently, by assuming a constant channel width, the subtidal flux can be expressed as
Q W = U 0 H + η 0 + U η
The first term on the right-hand side represents the Eulerian return flux, and the second term represents the Stokes flux.

3. Results

3.1. Time and Frequency Variation of Water Level, Near-Bottom Density, and Current Velocity

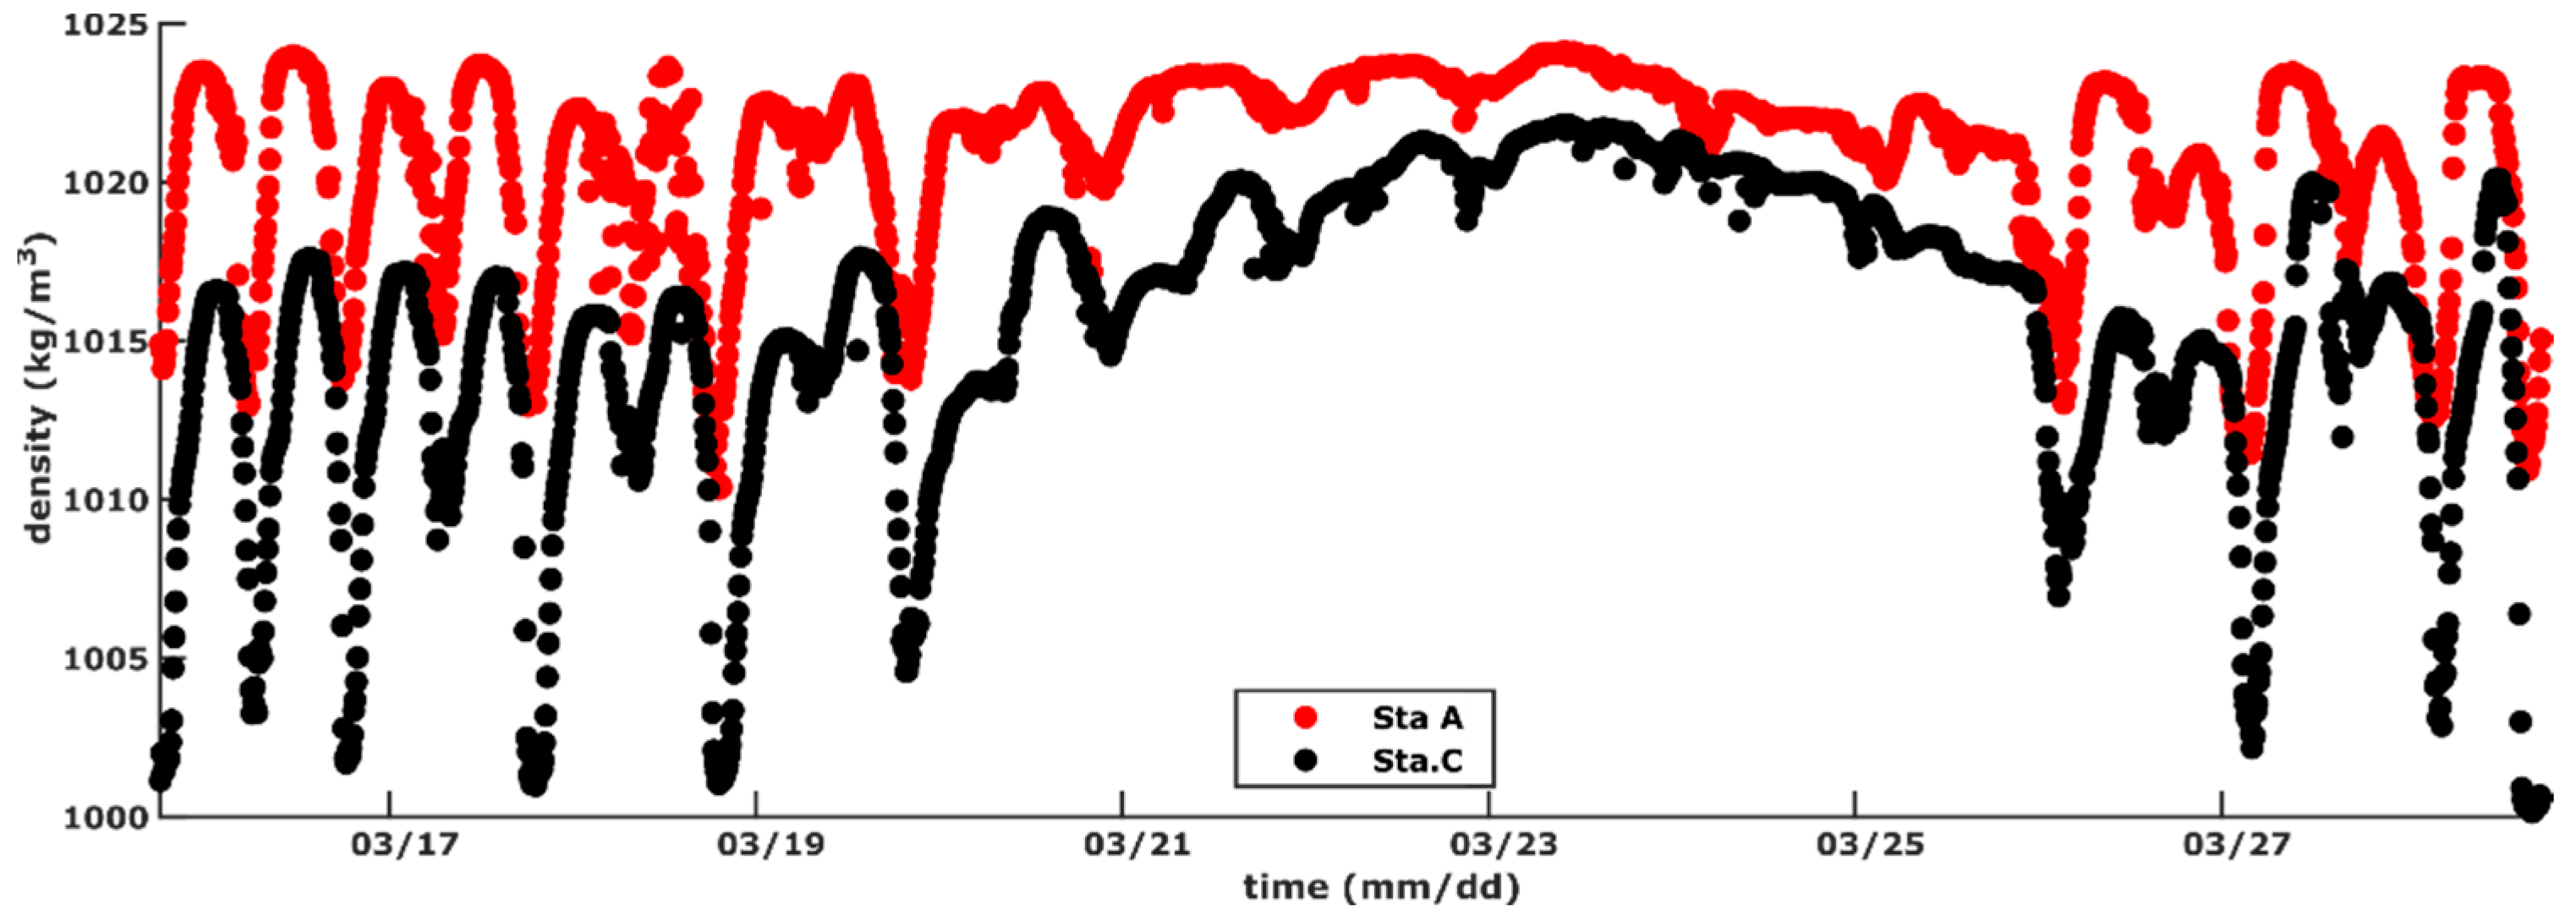
The tidal range and subtidal elevation at each station are shown in Figure 3. Notable temporal variations in the tidal range due to spring-neap tidal cycles were observed at all stations. Stations A, B, and C, located at the channel thalweg, had tidal ranges relatively similar to the spring tidal ranges, which were approximately 1.5–2 m larger than the neap tidal ranges. Similar to the tidal range, the subtidal elevation also exhibited strong temporal variability because of the spring-neap tidal cycles at all stations. At longitudinally arranged stations, the variability in the subtidal elevation was stronger, moving landward. At all stations, the subtidal elevations at spring tide are observed to be 0.2 to 0.3 m higher than during the subsequent neap tide. Figure 4 displays the near-bottom densities at stations A and C. They indicated a clear modulation influenced by the spring-neap variation in salinity (Figure 2b). The near-bottom water density during the neap tide remained above 1015 kg/m3 at both stations, whereas during the spring tide, the water densities dropped to 1010 kg/m3 and 1001 kg/m3 at Stations A and C, respectively.
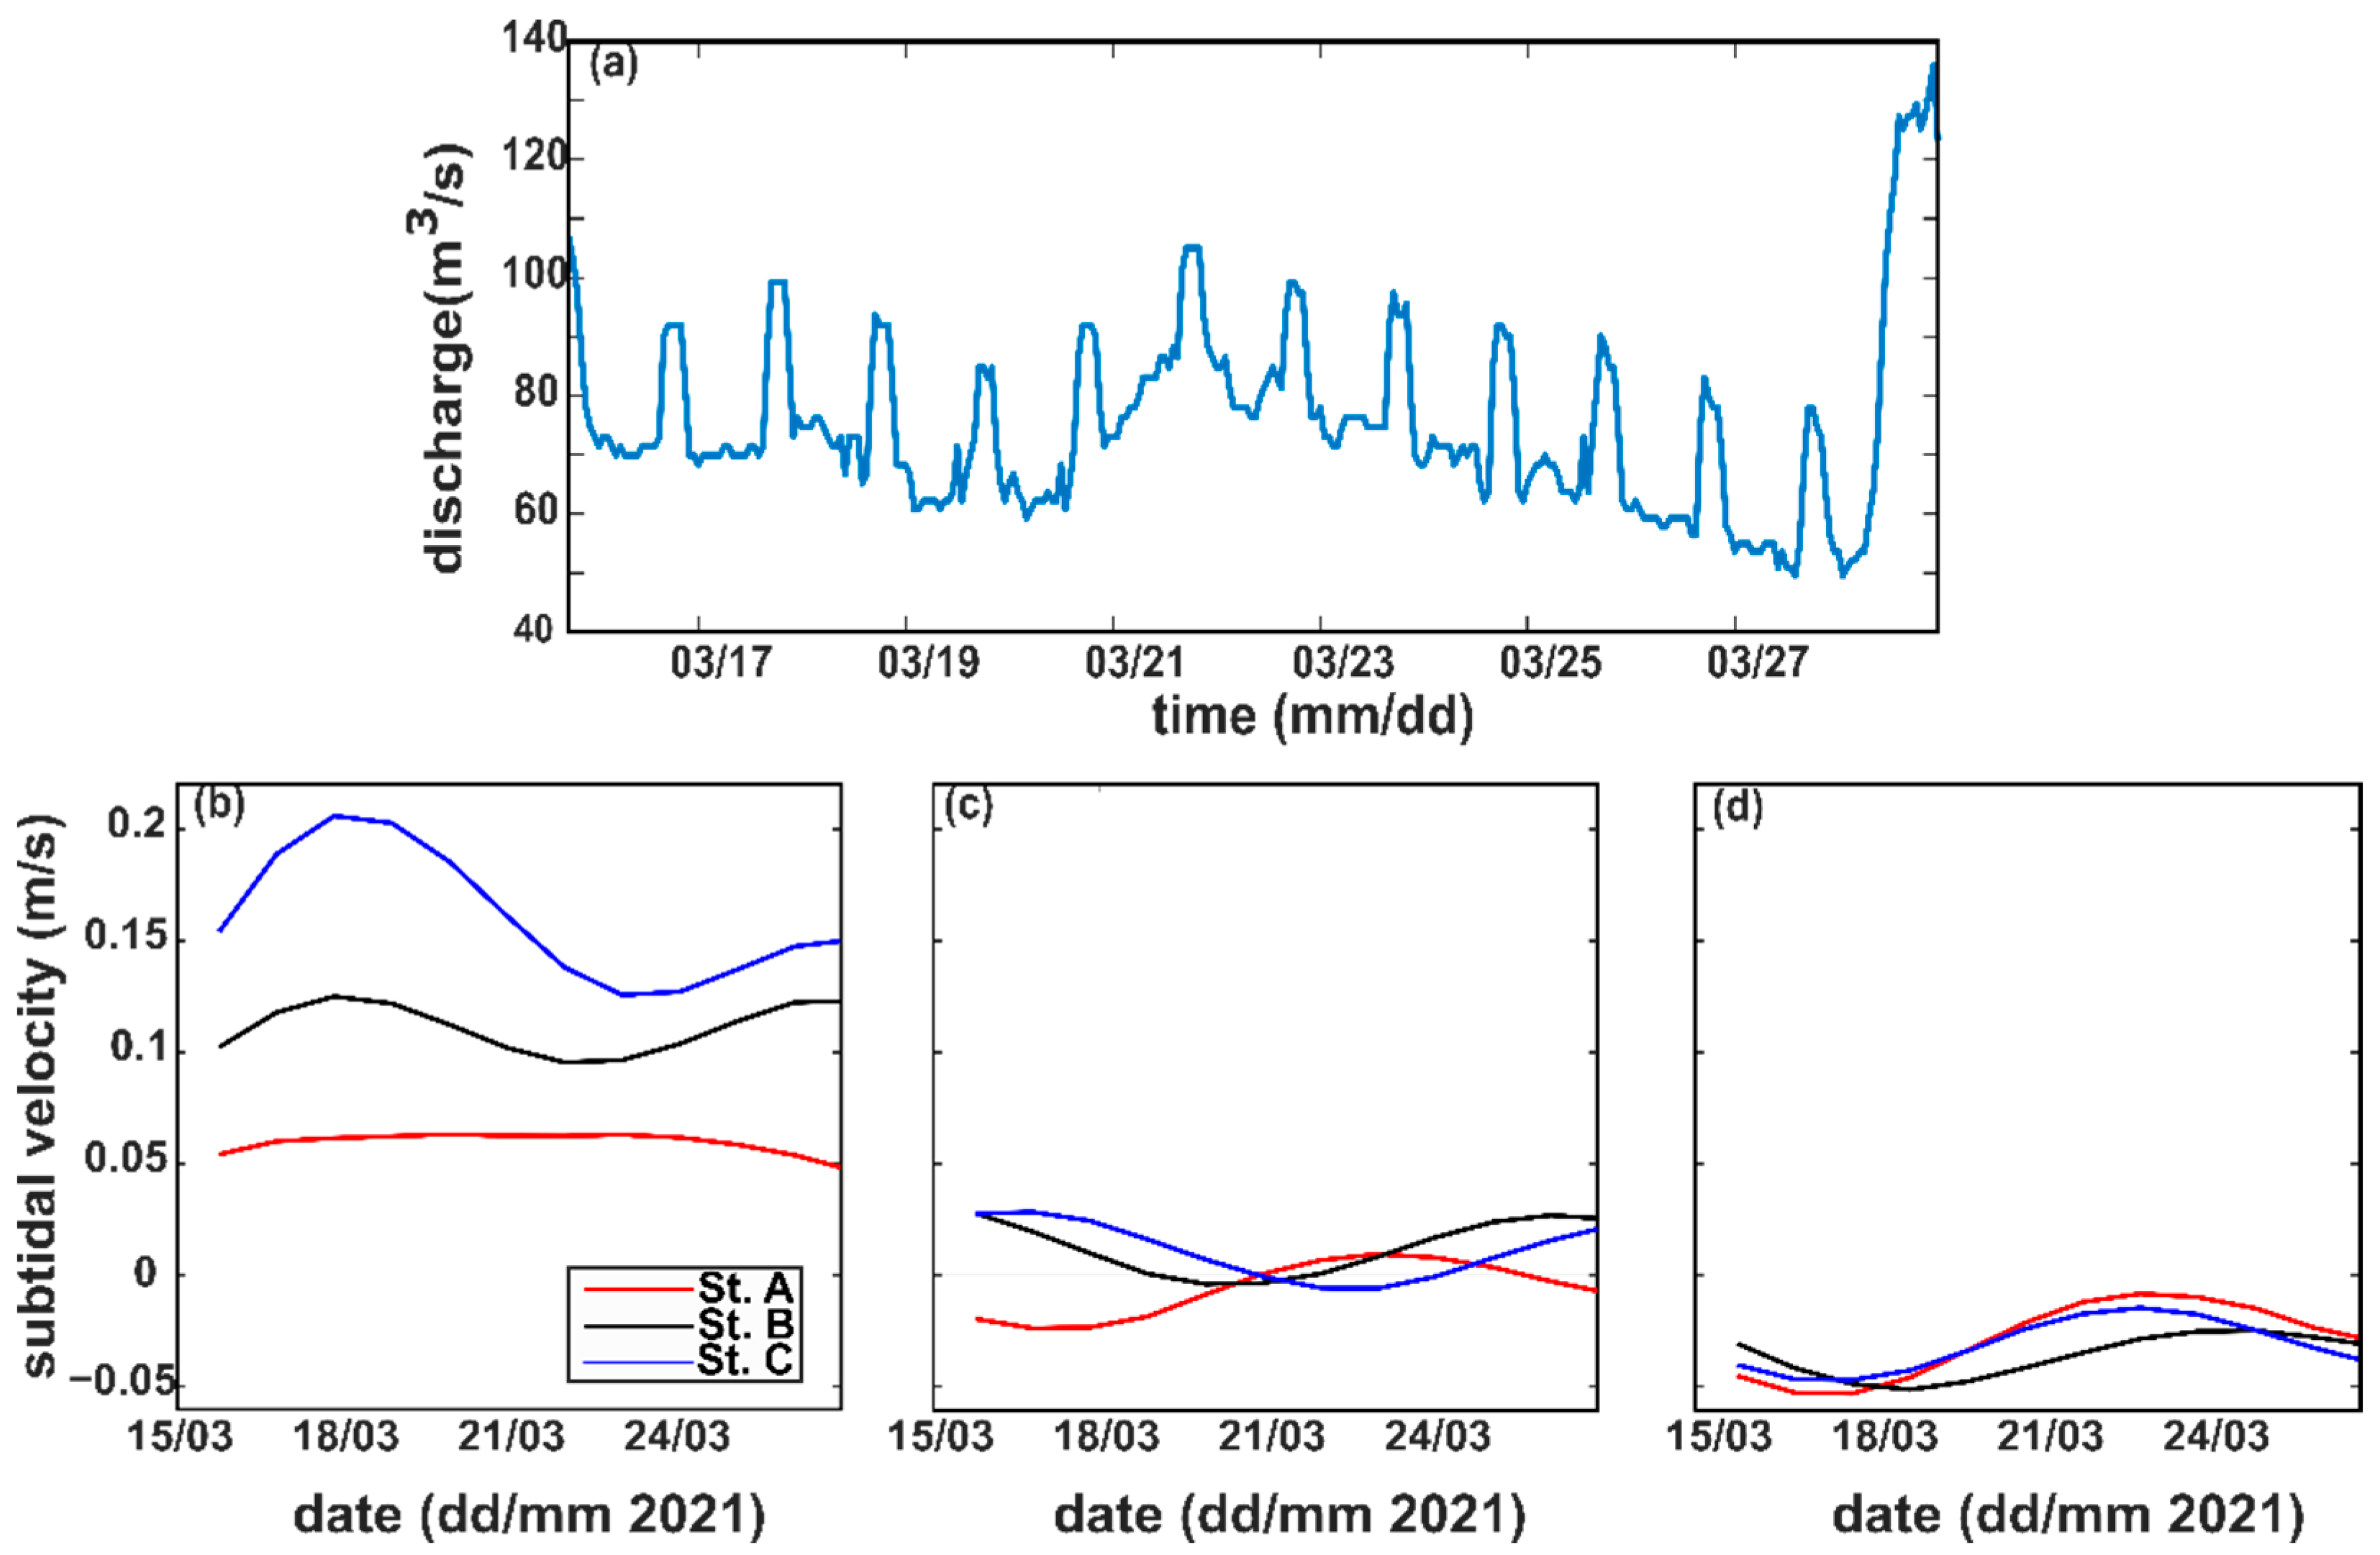
Figure 5 shows the time series of the river discharge at the Yaguchi Gauging Station and the subtidal velocities at the three stations. Positive values represent seaward subtidal velocities, and negative values represent landward subtidal velocities. During the observation period, the discharge at the Yaguchi Gauging Station ranged from 50 m3/s to 130 m3/s. Since, at most, the Ota Diversion Channel only received one-fifth of the total discharge from the Ota River, it can be said that during the observation period, the channel was under the limited influence of freshwater runoff. The subtidal velocity ranges from 0.05 m/s to 0.2 m/s at the surface, −0.025 m/s to 0.025 m/s at the mid-depth, and −0.05 m/s to −0.01 m/s at the lower depth. The subtidal velocity represents a distinct vertical variability from the seaward subtidal velocity at the upper depth. Vertically, the magnitude of the subtidal velocity gradually diminished from the upper depth to mid-depth before changing in a landward direction at a lower depth.
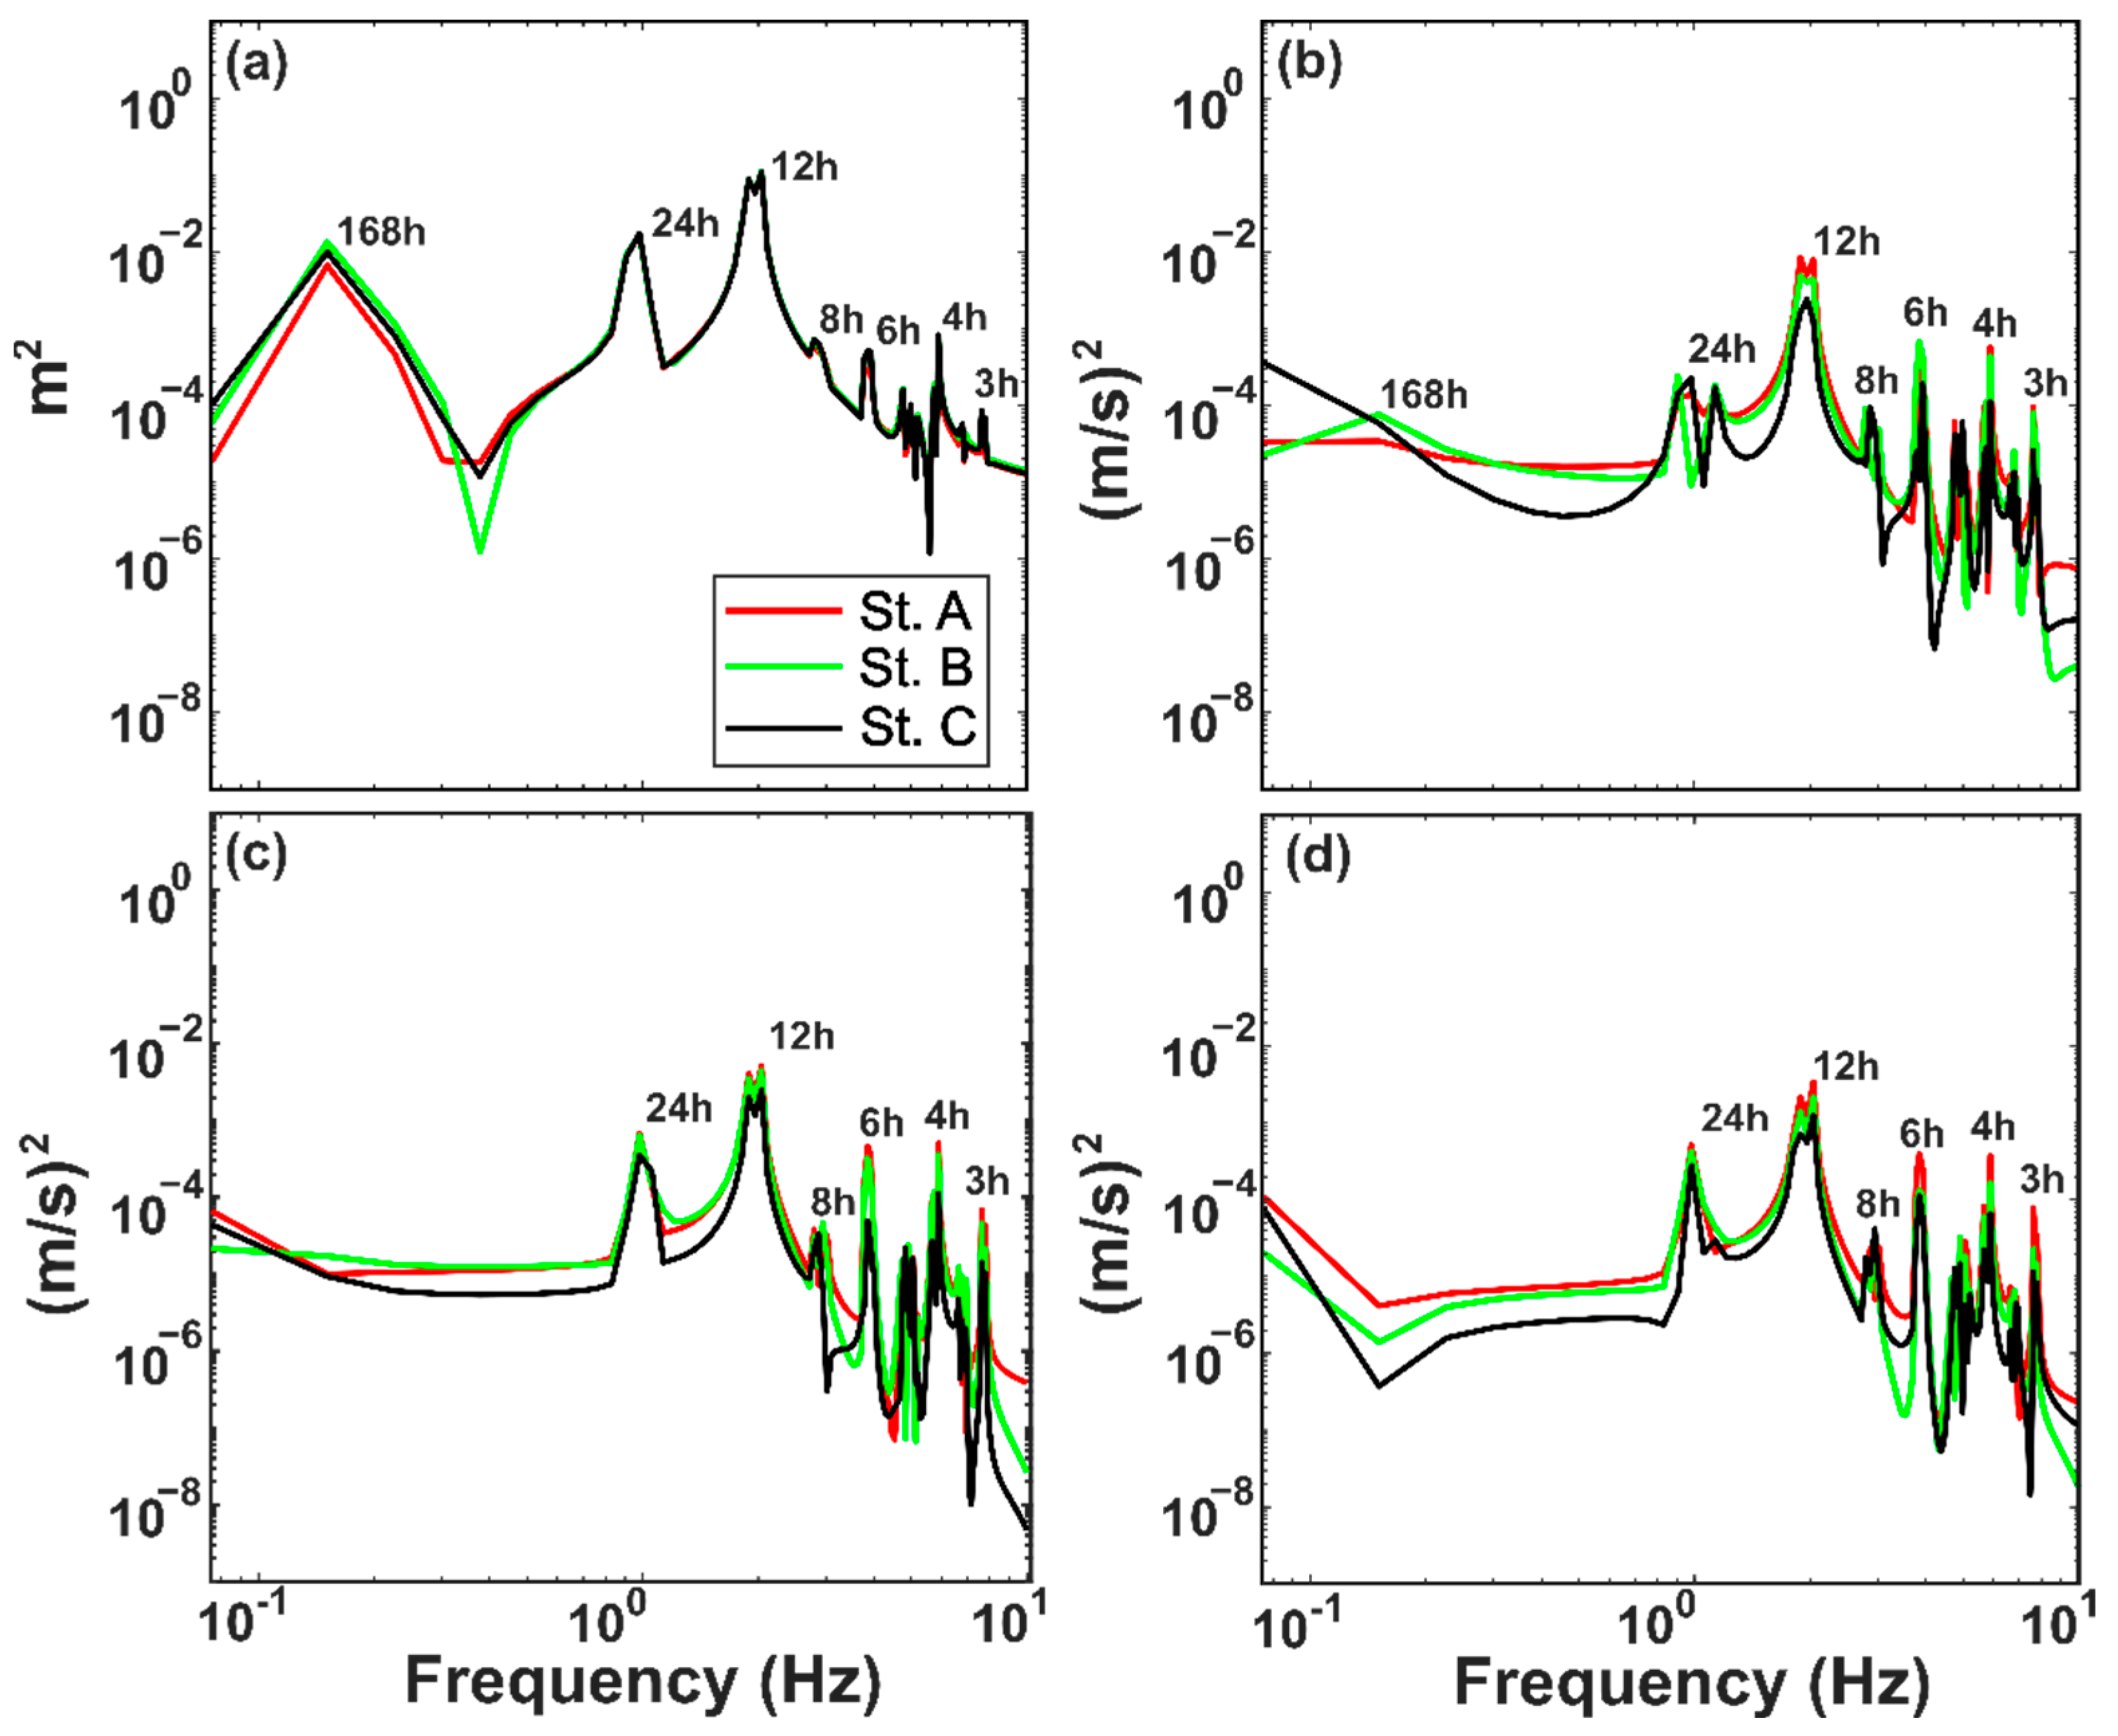
Figure 6 shows the distribution of the energy spectra of the water level and mean velocity at the upper, middle, and bottom depths at all measurement stations along the Ota Diversion Channel, which were estimated using the Fourier transform. The water level spectrum in Stations A, B, and C (Figure 6a) indicates that the Ota Diversion Channel is dominated by signals in the 12 h and 24 h bands. Both bands represented semidiurnal and diurnal tides, with the former being significantly greater than the latter, and no significant difference in energy between each station was observed. In contrast, a significant amount of energy is also observed in the 7-day power-peaking band, which shows the effect of long-period tides (2SK5 and 2MK5) that are most influential at Station B. Peak bands can also be found in the spectrum with periods lower than 12 h, particularly at 3 h, 4 h, 6 h, and 8 h. These peaking bands are usually referred to as overtides and are induced by shallow-water interactions [34]. These interactions lead to the transfer of energy from the semidiurnal and diurnal tidal components to the lower period bands [35] and increase the energy in these bands from downstream to upstream. Spectral analysis of the depth-averaged velocities in each depth section (Figure 6c,e,g) at stations A, B, and C also shows the dominance of the semidiurnal tidal velocity, although its magnitude is only slightly greater than the overtide velocity. Furthermore, a distinct difference in the water level spectrum was observed for diurnal tidal velocity. The diurnal bands were only slightly stronger than the overtide bands at lower and mid-depths, whereas the overtide bands were more prominent at the upper depth. This phenomenon indicates that the energy decay rates of semidiurnal and diurnal tides and their energy transfer to shallow water tidal components are more intense in the water current than in the water level.
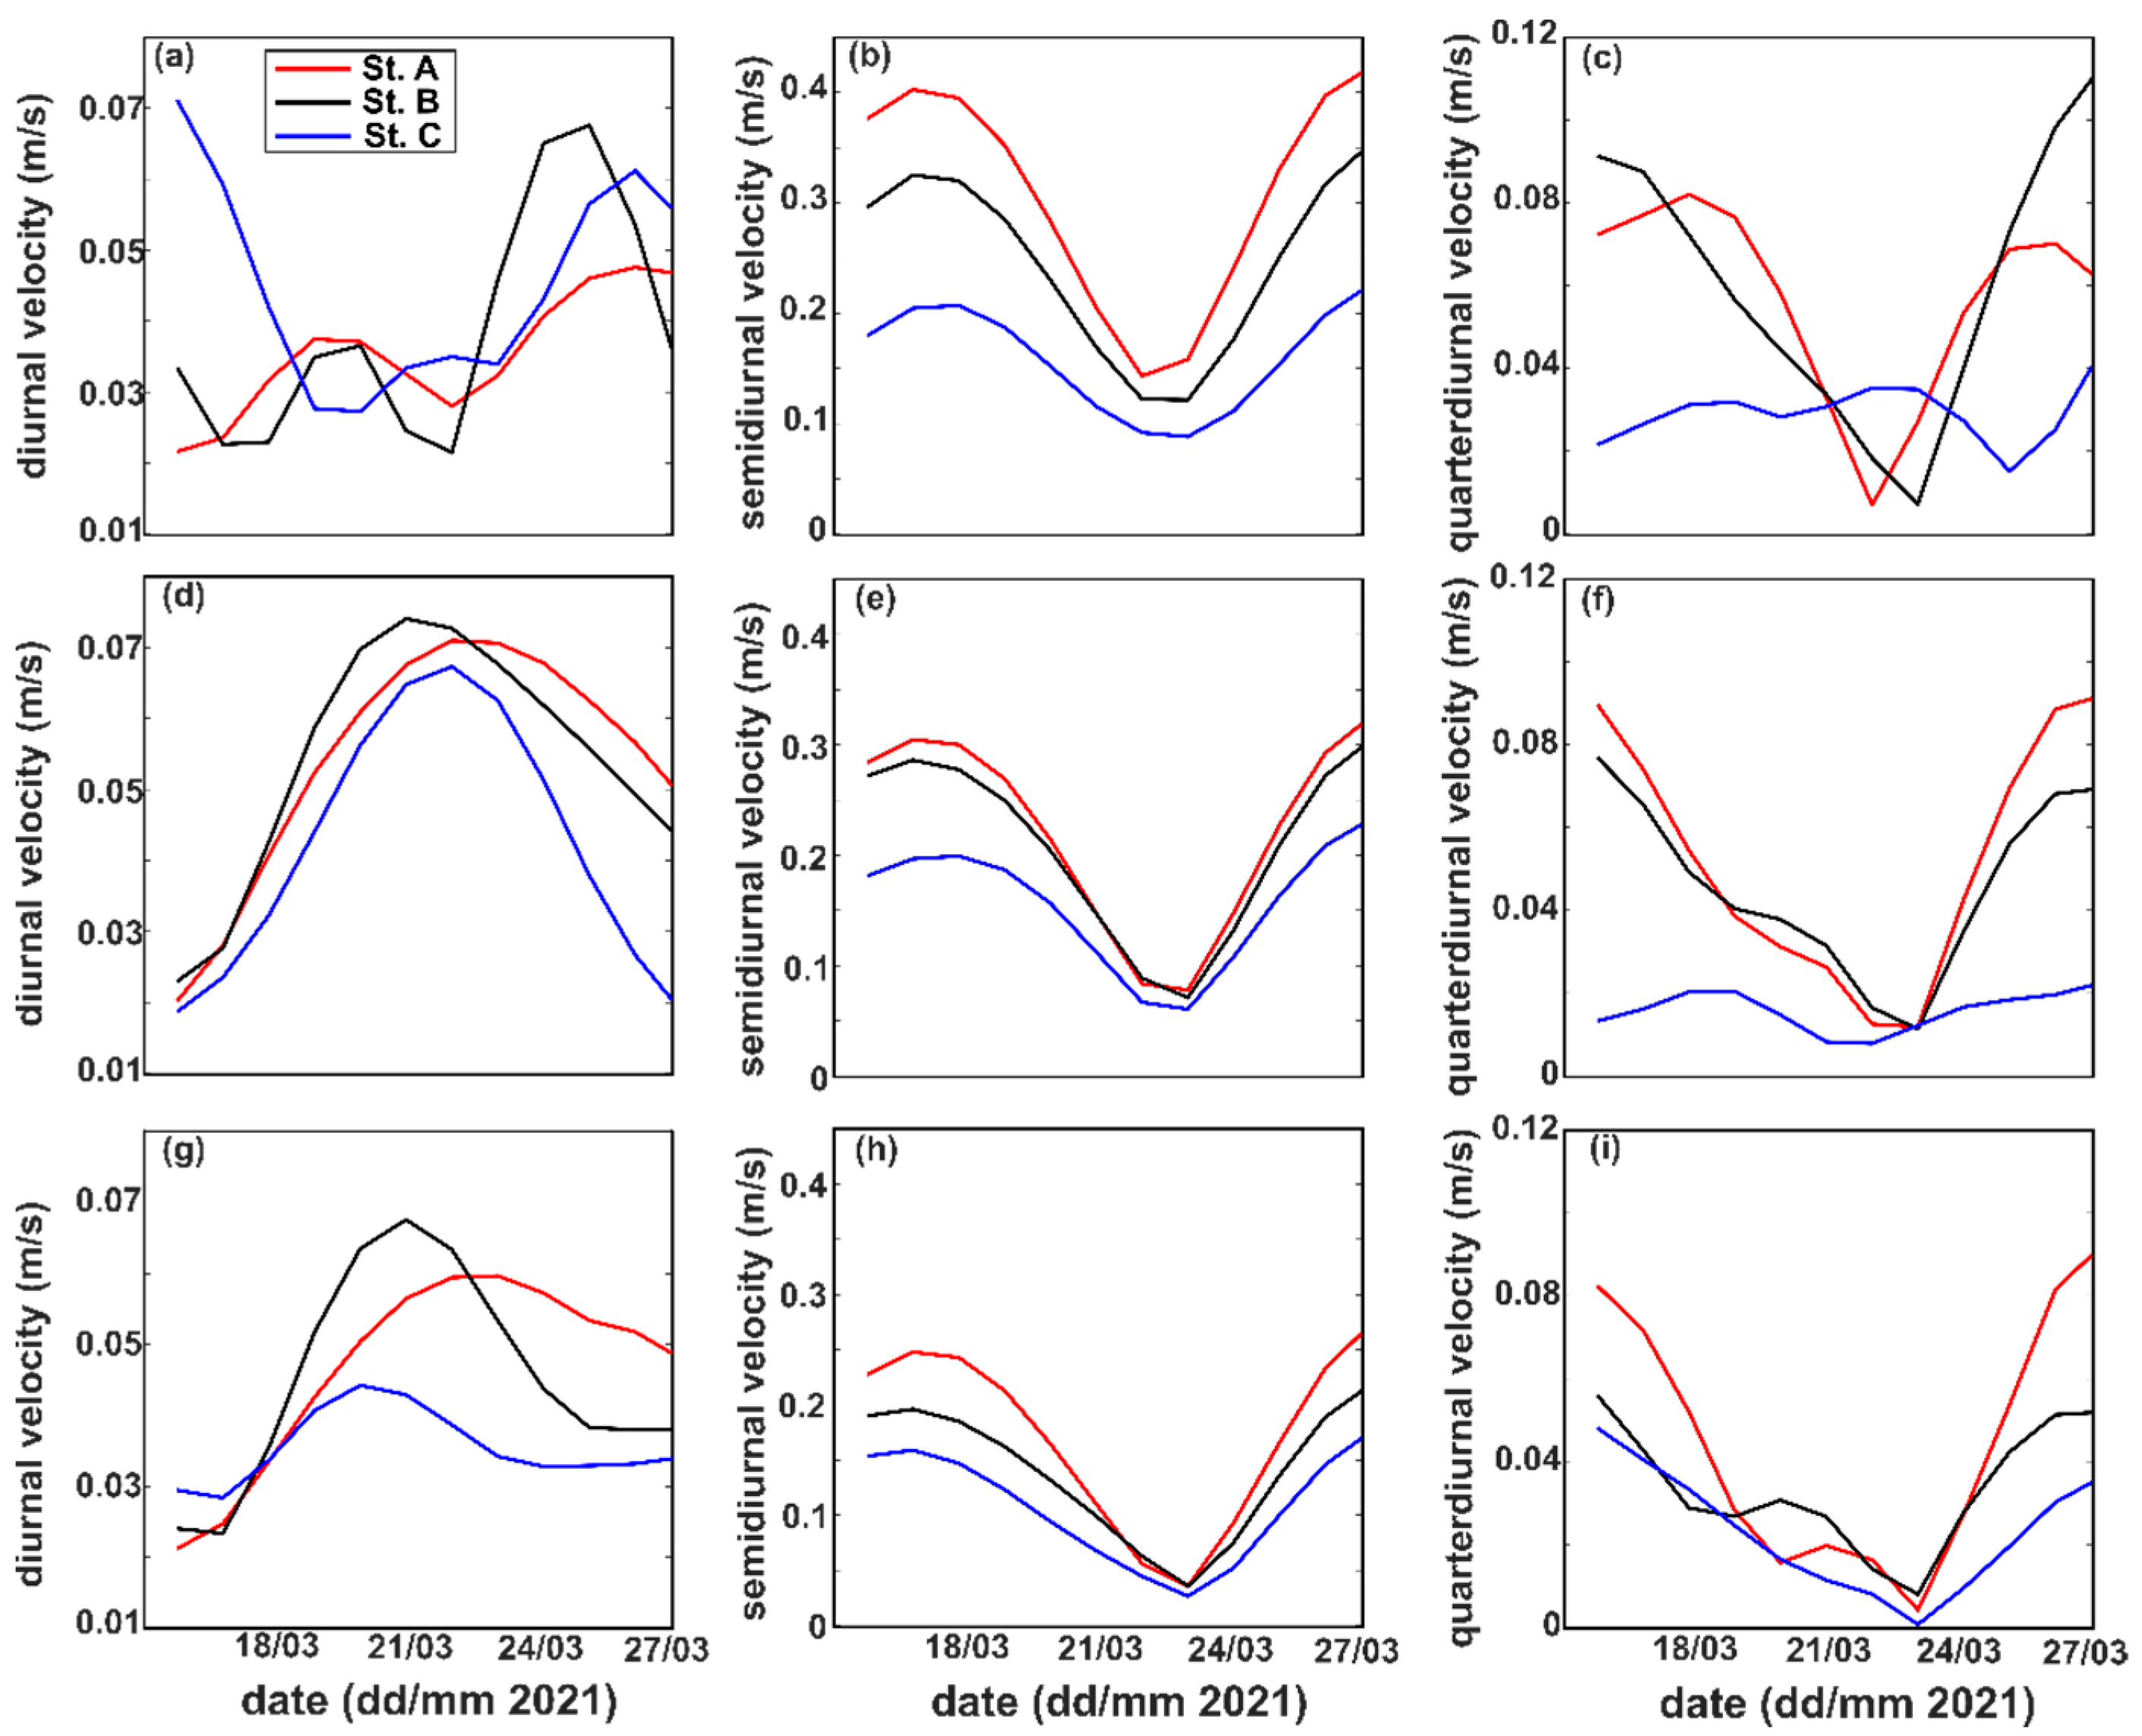
The time series of the diurnal velocity (U1), semidiurnal velocity (U2), and quarterdiurnal velocity (U4) based on harmonic analysis at each depth at stations A, B, and C are shown in Figure 7. Semidiurnal tidal species dominated the velocity signal at each depth, featuring more fluctuations in the amplitude maxima than in the amplitude minima (Figure 7b,e,h). The temporal variation of U2 is strongly modulated by spring-neap variation, with a velocity between 0.15 to 0.4 m/s at the spring tide and 0.04 to 0.15 m/s at neap tide, respectively. The semidiurnal velocity was higher in the downstream area. U4 co-oscillated with U2 at stations A and B, respectively. At Station C, U4 showed relatively insignificant values that fluctuated over time (Figure 7c,f), except at a lower depth (Figure 7i), where spring-neap modulation was apparent. U1 was the least dominant tidal velocity, and its values did not vary with U2 or U4. The U1 values peaked during the neap tide and reached a minimum during the spring tide at mid- and lower depths (Figure 7d,g).

3.2. Subtidal Friction

The results of the harmonic analysis of the shape of the diurnal, semidiurnal, quarterdiurnal, and residual currents were utilized to determine the effect of subtidal friction on the tidal dynamics in the Ota Diversion Channel. Equation (7) was employed to estimate the contribution of subtidal friction due to river flow (Fr), river-tide interaction (Frt), and tidal asymmetry (Ft). However, since the influence of freshwater discharge can be neglected in this channel, we would like to denounce the river flow effect (Fr) as “subtidal flow,” hence Frt is a tidal–subtidal interaction. This is partly because Fr and Frt employ U0, which represents subtidal velocity. In a high-discharge environment, U0 is synonymous with river flow, because river runoff is the leading non-tidal force.
Figure 8 displays the contributions of Fr, Frt, and Ft in Stations A, B, and C. Along the Ota Diversion Channel, the subtidal flow is the most influential component of the subtidal friction to the extent that its values are greater than the tidal–subtidal interaction and tidal asymmetry by an order of magnitude (Figure 8c,f,i), even when the amplitude of semidiurnal velocity is notably higher than the subtidal velocity (particularly at spring tide). The sign and temporal pattern of Fr closely followed those of U0, with diminishing subtidal friction at lower depths before changing from positive to negative near the bed. The Frt also showed vertical variability in terms of magnitude and sign (Figure 8a,d,g). Indeed, the temporal variation in Frt indicates that Fr might have greatly affected it, although according to Buschman et al. [12], Frt is more influenced by squared tidal velocity species. The third component, Ft, had a relatively smaller magnitude than the other two components, with small vertical variability and a greater tendency to have a negative sign over the observation period. The small magnitude of Ft was a result of the interaction between semidiurnal and quarterdiurnal tidal species, which induced an ebb-dominated environment. Furthermore, unlike Fr and Frt, the sign of tidal asymmetry depends on the phase difference between the diurnal, semidiurnal, and quarterdiurnal tidal species. Therefore, they could independently reinforce or reduce the other two terms. By separating the water column vertically, we showed that Fr and Frt, in the tidal channel with a small discharge, have vertical variability not only in magnitude, but also in its positive/negative orientations. The reasons for the vertical variability of Fr and Frt are discussed in Section 4.

3.3. Stokes Fluxes

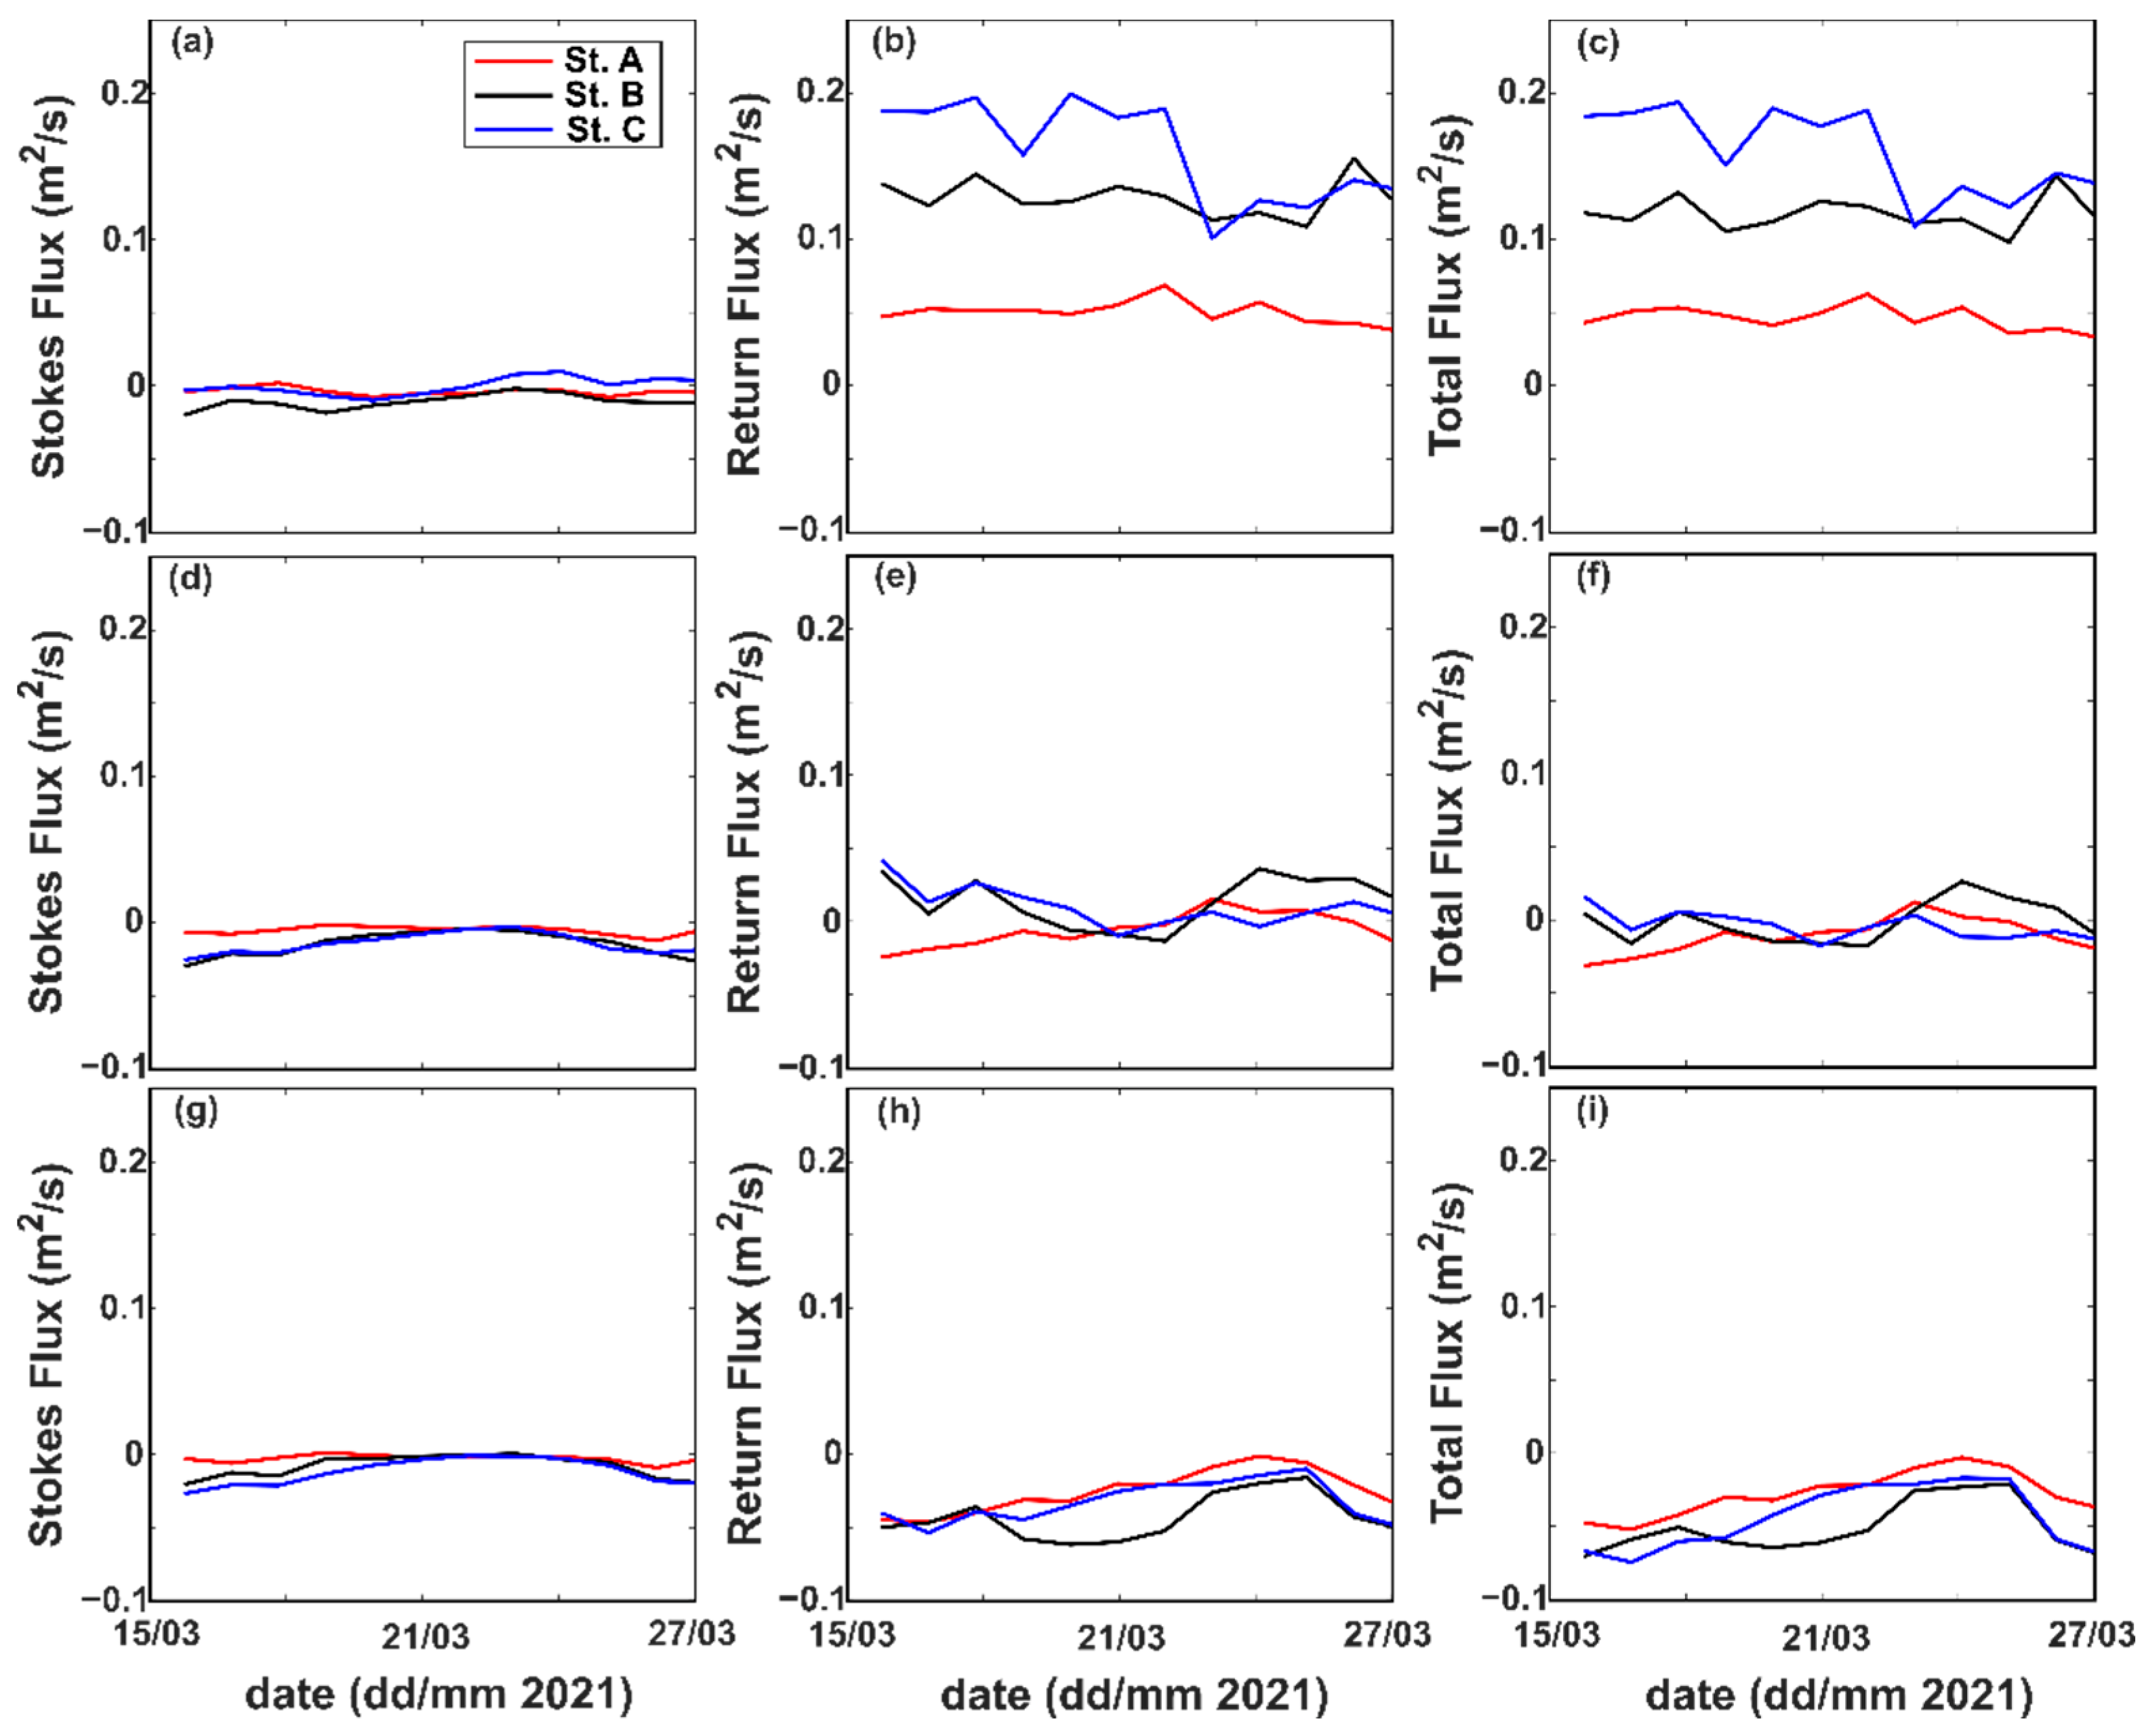
The temporal distributions of Stokes flux, return flux, and their subsequent total fluxes at stations A, B, and C are presented in Figure 9. Negative values denote landward flux, and positive values represent seaward flux. Stokes fluxes at Station A, B, and C are observed to be predominantly negative (−0.025 m2/s to 0 m2/s) throughout all depths, except for relatively minor positive values in the upper depth of Station C (~0.01 m2/s) during the second phase of spring tide (Figure 9a,d,g). The time series of Stokes fluxes shows temporal variation due to the spring-neap tidal cycles, with greater values further upstream. Because Stokes flux is affected by the phase difference between the current velocity and water level instead of merely the tidal magnitude, its values will be greater when the diurnal-semidiurnal inequality is at its maximum and lower when the tidal asymmetry is at its minimum [36]. The return flux shows temporal patterns that do not clearly resemble the variation due to the spring-neap tidal cycles. The values of the return flux, which are higher than those of the Stokes flux, vary with both positive and negative signs (Figure 9b,e,h). In the upper depth, the return flux varies in positive values from 0.04 m2/s to 0.2 m2/s, with greater values observed farther upstream. At mid-depth, the return flux varies from −0.025 m2/s to 0.045 m2/s. During spring tide, the return flux at Station A was predominantly negative, whereas a positive return flux was more apparent at Stations B and C. At neap tide, the values of the return flux at all stations were relatively close to zero. At lower depths, the return flux induced negative values at all stations, ranging from −0.06 m2/s to 0 m2/s. Subsequently, the total flux at all stations had non-zero values and was clearly modulated by the return flux because its magnitude was greater than that of the Stokes flux.
The different values of return flux in the vertical direction could indicate the following: (1) in the upper depth, the return flux induces strong seaward transport that diminishes in the downstream direction; (2) the return flux changes its directional orientation gradually from seaward to landward according to depth. Vertically, the changes were observed first at the mid-depth of the downstream area; (3) the different signs of return flux between Stations B and C and Station A lead to the existence of a convergence zone in the Ota Diversion Channel; and (4) the landward return flux dominates the lower depth, although its magnitude is relatively lower than the seaward return flux at the upper depth. The return flux is closely associated with river discharge [18], yet the influx from river discharge in the Ota Diversion Channel is relatively small, which leads to the question of what generates the distinct variability in return flux in this channel.

4. Discussion

Our analysis of subtidal friction and Stokes flux in low-discharge tidal channels identified distinct vertical variability in the orientation of subtidal flow-induced subtidal friction, the tidal–subtidal interaction term of subtidal friction, and return flux. Both subtidal friction terms varied from positive values near the surface to negative values near the bottom (Figure 8), whereas the return flux indicated a seaward flux at the upper depth and a landward flux at a lower depth (Figure 9). According to Equations (7) and (10), the relationship between Fr, Frt, and the return flux is that they are similarly influenced by subtidal velocity. However, because the subtidal velocity in the Ota Diversion Channel is not necessarily associated with freshwater runoff, we deduced that the subtidal velocity in the channel can be influenced by the baroclinic effect. Through numerical simulations, Burchard and Hetland [37] demonstrated that estuarine circulation in a periodically stratified estuary with irrotational flow comprises gravitational circulation and tidal straining, with the latter being twice as large as the former. Moreover, previous studies on the Ota Diversion Channel have demonstrated the importance of tidal straining [23] and gravitational circulation [27]. However, because the mechanism of tidal straining involves the periodicity of stratification between the flood and ebb, which cannot be observed correctly in the subtidal period, we only considered gravitational circulation as the baroclinic effect.
Gravitational circulation is a physical mechanism generated in an estuary owing to the existence of a longitudinal density gradient in the estuarine channel [38]. This mechanism takes the form of a two-layer circulation that differs vertically in flow orientation. Gravitational circulation induces the seaward flow of low-density water on the surface and landward flow of high-density water near the bed. Owing to vertical variability, gravitational circulation is expected to permanently introduce stratification over the water column in the estuary. For a partially mixed estuary, the gravitational circulation can be expressed as [39]
0.031 g 2 H 4 / A ρ ρ / x 2
where g is gravitational acceleration (9.8 m/s2), A is vertical eddy viscosity (m2/s), ρ is water density (kg/m3), and x is longitudinal distance (m). However, in this study, we could not estimate the eddy viscosity because of the limited density data in the vertical distribution and the insufficiencies of the temporal and spatial resolutions of the current data in calculating the Reynolds shear stress. The return flux pattern shows the seaward surface and landward bottom fluxes. This vertical variability closely resembles the two-layer circulation flow of gravitational circulation. Additionally, Geyer and Macready [38] indicated that subtidal velocity, which is the influential driver of Fr, Frt, and return flux, can be associated with gravitational circulation. Hence, because we could not quantify gravitational circulation, and density stratification data were not available, we opted to use the near-bottom longitudinal density gradient term ( ρ / x ) as a proxy to show the influence of gravitational circulation.
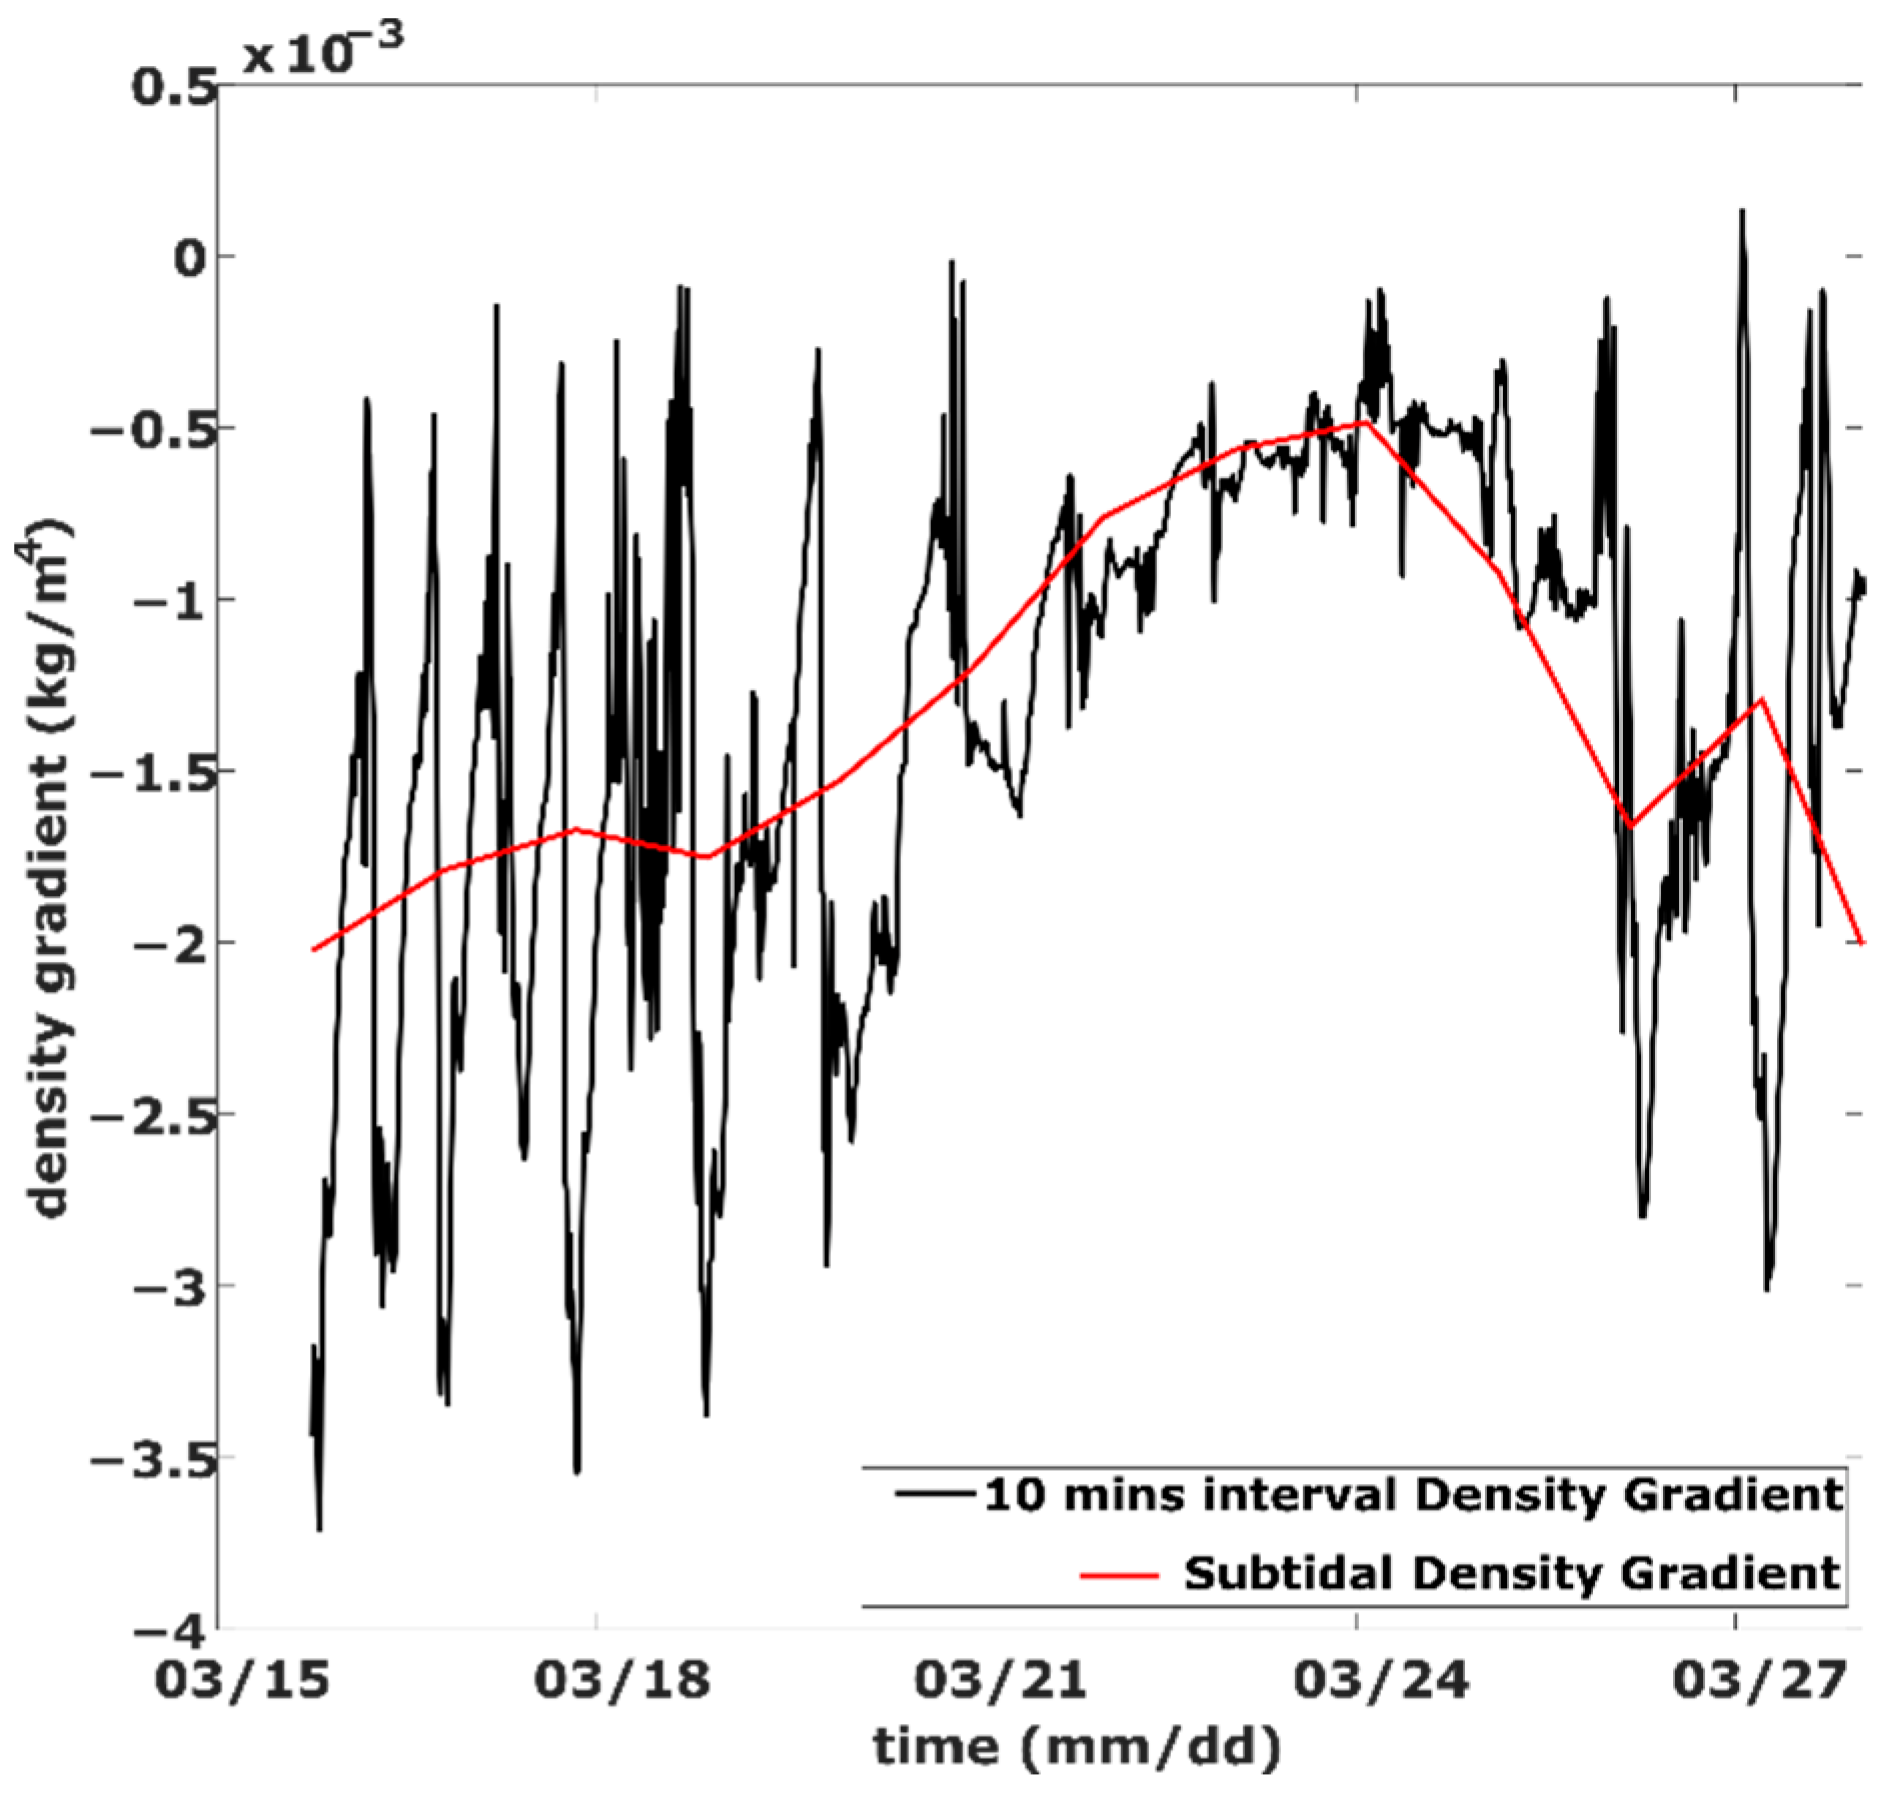
Figure 10 displays the longitudinal gradient of the near-bottom density between stations C and A at 10 min and subtidal intervals. Negative values of the density gradient indicate a higher density in the seaward direction, which prompts landward baroclinic flow over the lower depth of the water column along the Ota Diversion Channel. The temporal variation in the subtidal density gradient signifies the strong influence of the spring neap tide cycle on density distribution.
The correlation trends between Fr and Frt, while the longitudinal subtidal density gradient (Figure 11) showed that Frt seemed to steadily increase with a higher density gradient, whereas Fr had a more substantial increase for higher density gradients, particularly at stations A and C. Figure 11 also displays the R2 and p-values at each station. The Frt and density gradients were correlated at each station. On the other hand, although Fr and the density gradient are found to be highly correlated in the Stations A and C, more than with Frt, the R2 value in Station B indicates poor correlation between both terms. Because the magnitude of the subtidal density gradient is significantly affected by the spring-neap tidal cycle, the low correlation of Fr at Station B could be attributed to the phase difference between the subtidal velocity at Station B and the other stations (Figure 5d). These results suggest that the subtidal density gradient indeed modulates both Frt and Fr through the subtidal velocity, with a greater modulation potential in the latter.
Figure 12 presents the correlation trends, R2, and p-values between the return flux and longitudinal subtidal density gradient. Similar to the subtidal friction terms, the return flux tended to increase with increasing density gradient magnitude. Likewise, the return fluxes at stations A and C were found to be finely correlated with the density gradient, whereas Station B showed a poor correlation between both terms. The low correlation at Station B was likely caused by a greater value of return flux than that at the other stations during the period between the peak of the first spring tide and the lowest neap tide (Figure 9h). As the difference in the subtidal range between Station B and the other stations was not significant (Figure 3), the higher value of the return flux could be attributed to the phase difference in the subtidal velocity at lower depths at Station B (Figure 5d). This phase difference can be attributed to the bathymetry effect because Station B is situated in a small trough within the longitudinal orientation of the channel. Subsequently, this phase difference led to a relatively higher subtidal velocity at Station B than that at the other stations, which induced a higher return flux.
Subtidal friction and discharge play important roles in determining the mean water level and mass transport in tidal channels [6]. Our results offer insights into the behavior of subtidal friction and subtidal discharge in tidal channels where freshwater runoff is limited (Figure 8 and Figure 9), and we demonstrated a correlation between the friction flux and the longitudinal density gradient (Figure 10 and Figure 11). The longitudinal density gradient has always been one of the main governing processes in tidal channels [40]. Furthermore, the longitudinal density gradient generates a baroclinic flow that regulates the influx of fine sediments into the tidal channels [41]. A continuous sediment influx can lead to the introduction of a turbidity maximum zone within the tidal channel. Our results for the total flux between Stations A, B, and C indicated the existence of a turbidity maximum zone in the Ota Diversion Channel. Figure 9f shows the convergence of the total flux near Station B at mid-depth during spring tide, supporting the findings of Xiao et al. [29]. Our findings suggest that the existence of a convergence zone in the Ota Diversion Channel is more likely to be caused by the total subtidal flux, which is strongly affected by baroclinic flow, rather than simply by river and tidal forcing.
Our study presents contrasting dominant mechanisms to similar studies that focus on high-discharge tidal rivers. High river discharge introduces a strong seaward runoff that could be more influential on the subtidal velocity than the longitudinal density gradient [12,13,15]. Subsequently, the river runoff directly affects Fr, Frt, and return flux through the term U0 in high-discharge tidal rivers. More importantly, for subtidal friction, the product of the constant coefficient (a) and subtidal velocity (U0) has the potential to be the mechanism makes the greatest contribution to subtidal friction [12]. However, the effects of high river discharge on the subtidal dynamics may not stop there. Studies in the Qiantang River, China [42,43,44] revealed that the interaction of high river discharge and tides could generate seasonal and interannual variations in bed morphology due to sediment erosion and accumulation. Although we did not focus on the effects of bathymetry on subtidal dynamics, our study indicates that bed morphology could affect the longitudinal variation of subtidal fluxes, particularly the Eulerian return flux. The relationship between bed morphology evolution and subtidal dynamics may provide significant information; however, owing to the time span of our data, this will be considered in future studies.

5. Conclusions

We conducted measurements to obtain temporal variations in water velocity and elevation at three locations in the Ota Diversion Channel from 16 March to 28 March 2021. The data were evaluated using frequency domain and theoretical decomposition analyses to identify the behavior of the subtidal friction and subtidal flux in a low-discharge tidal river. Furthermore, we investigated the underlying mechanism that generates variability in the friction and flux orientations. Our study yielded several interesting findings.
First, the energy decay rates of the semidiurnal and diurnal tides between the current velocity and the water level were different. In essence, the Ota Diversion Channel is dominated by semidiurnal and diurnal tides, with higher-frequency tides becoming more influential further upstream, owing to the energy transfer generated by the shallow-water interaction. The spectral analysis of the current velocity presents a more balanced energy distribution than the water level, particularly between overtides and diurnal tides. Second, by dividing the water column into three separate vertical depths, we found that the magnitude and sign orientation of Fr and Frt varied vertically in the low-discharge tidal river. The magnitude and pattern of Fr are closely associated with the subtidal velocity. Although Frt was also modulated by the subtidal velocity, to a certain extent, it was not as influential as the squared tidal velocity. Additionally, the subtidal friction in the Ota Diversion Channel is primarily driven by subtidal flow because its contribution is an order of magnitude higher than that of the tidal–subtidal interaction and subtidal friction. Third, in the case of the subtidal fluxes, vertical variability was apparent in the return flux. Generally, the return flux generates strong seaward transport, which diminishes the seaward movement and eventually changes its transport orientation according to depth, starting from the downstream area of the channel. Furthermore, because the value of the return flux is greater than the Stokes flux, the total subtidal flux in the Ota Diversion Channel is not zero, and is significantly dominated by the return flux. Fourth, we discovered that the vertical variability of Fr, Frt, and return discharge in the low-discharge tidal channel was induced by a longitudinal subtidal density gradient through subtidal velocity. Additionally, Fr, Frt, and the return flux tended to have a greater magnitude, with a higher subtidal density difference between the upstream and downstream areas. An additional important finding of our study within the context of low-discharge tidal channels is that the total subtidal flux, which is governed by baroclinic flow, can lead to the formation of an estuarine convergence zone. This further signifies a unique behavior in a tidal channel with limited river discharge.
Although our study used a specific site in the Ota Diversion Channel as a case study, its analysis and results represent the distinct behavior of subtidal dynamics in a tidal river with low freshwater discharge. Hence, the results and discussion of our study can contribute to expanding our understanding of the river and tidal interaction dynamics in tidal rivers.

Author Contributions

Conceptualization, G.N.N.G. and F.K.; methodology, G.N.N.G. and F.K.; software, G.N.N.G. and F.K.; validation, G.N.N.G.; formal analysis, G.N.N.G.; investigation, G.N.N.G.; resources, K.K.; data curation, G.N.N.G., F.K., and M.B.A.S.; writing—original draft preparation, G.N.N.G.; writing—review and editing, K.K. and M.B.A.S.; visualization, G.N.N.G.; supervision, K.K.; project administration, G.N.N.G. All authors have read and agreed to the published version of the manuscript.

Funding

This research received no external funding.

Institutional Review Board Statement

Not applicable.

Informed Consent Statement

Not applicable.

Data Availability Statement

Discharge data was provided by the Ministry of Land Infrastructure Transport (MLIT), Japan. Please refer to http://www1.river.go.jp/cgi-bin/SelectMapSite.exe. The ADCP and CT sensors data from this study are available from the corresponding author upon request.

Acknowledgments

Gillang Noor Nugrahaning Gusti is thankful to the Ministry of Education, Culture, Sports, Science, and Technology (MEXT) Scholarship for supporting his doctoral degree at Hiroshima University. This works would not have been completed without the assistance of the students in the River and Coastal Engineering Laboratory, Hiroshima University, and Xiao Cong.

Conflicts of Interest

The authors declare no conflict of interest.

References

  1. Barendregt, A.; Swarth, C.W. Tidal Freshwater Wetlands: Variation and Changes. Estuaries Coasts 2013, 36, 445–456. [Google Scholar] [CrossRef]
  2. Fricke, A.T.; Nittrouer, C.A.; Ogston, A.S.; Nowacki, D.J.; Asp, N.E.; Souza Filho, P.W.M. Morphology and Dynamics of the Intertidal Floodplain along the Amazon Tidal River. Earth Surf. Process. Landf. 2019, 44, 204–218. [Google Scholar] [CrossRef] [Green Version]
  3. Camenen, B.; Gratiot, N.; Cohard, J.A.; Gard, F.; Tran, V.Q.; Nguyen, A.T.; Dramais, G.; van Emmerik, T.; Némery, J. Monitoring Discharge in a Tidal River Using Water Level Observations: Application to the Saigon River, Vietnam. Sci. Total Environ. 2021, 761, 143195. [Google Scholar] [CrossRef]
  4. Wu, Y.; Hannah, C.; Matte, P.; O’Flaherty-Sproul, M.; Mo, R.; Wang, X.; MacAulay, P. Tidal Propagation in the Lower Fraser River, British Columbia, Canada. Estuar. Coast. Shelf Sci. 2022, 264, 107695. [Google Scholar] [CrossRef]
  5. Haralambidou, K.; Sylaios, G.; Tsihrintzis, V.A. Salt-Wedge Propagation in a Mediterranean Micro-Tidal River Mouth. Estuar. Coast. Shelf Sci. 2010, 90, 174–184. [Google Scholar] [CrossRef]
  6. Hoitink, A.J.F.; Jay, D.A. Tidal River Dynamics: Implications for Deltas. Rev. Geophys. 2016, 54, 240–272. [Google Scholar] [CrossRef]
  7. Sarker, S. A Short Review on Computational Hydraulics in the Context of Water Resources Engineering. Open J. Model. Simul. 2022, 10, 1–31. [Google Scholar] [CrossRef]
  8. Godin, G. The Propagation of Tides up Rivers with Special Considerations on the Upper Saint Lawrence River. Estuar. Coast. Shelf Sci. 1999, 48, 307–324. [Google Scholar] [CrossRef]
  9. Cai, H.; Savenije, H.H.G.; Jiang, C. Analytical Approach for Predicting Fresh Water Discharge in an Estuary Based on Tidal Water Level Observations. Hydrol. Earth Syst. Sci. 2014, 18, 4153–4168. [Google Scholar] [CrossRef] [Green Version]
  10. Matte, P.; Jay, D.A.; Zaron, E.D. Adaptation of Classical Tidal Harmonic Analysis to Nonstationary Tides, with Application to River Tides. J. Atmos. Ocean. Technol. 2013, 30, 569–589. [Google Scholar] [CrossRef] [Green Version]
  11. Reza, A.A.; Sarker, S.; Asha, S.A. An Application of 1-D Momentum Equation To Calculate Discharge in Tidal River: A Case Study on Kaliganga River. Tech. J. River Res. Inst. 2014, 2, 77–86. [Google Scholar]
  12. Buschman, F.A.; Hoitink, A.J.F.; Van Der Vegt, M.; Hoekstra, P. Subtidal Water Level Variation Controlled by River Flow and Tides. Water Resour. Res. 2009, 45, W10420. [Google Scholar] [CrossRef]
  13. Sassi, M.G.; Hoitink, A.J.F. River Flow Controls on Tides and Tide-Mean Water Level Profiles in a Tidal Freshwater River. J. Geophys. Res. Ocean. 2013, 118, 4139–4151. [Google Scholar] [CrossRef]
  14. Guo, L.; Wegen, M.; van der Jay, D.A.; Matte, P.; Wang, Z.B.; Roelvink, D.; He, Q. Journal of Geophysical Research: Oceans Nonlinear Tidal Behavior in the Yangtze River Estuary. J. Geophys. Res. C Ocean. 2015, 120, 3499–3521. [Google Scholar] [CrossRef] [Green Version]
  15. Buschman, F.A.; Hoitink, A.J.F.; Van Der Vegt, M.; Hoekstra, P. Subtidal Flow Division at a Shallow Tidal Junction. Water Resour. Res. 2010, 46, W12515. [Google Scholar] [CrossRef] [Green Version]
  16. Sassi, M.G.; Hoitink, A.J.F.; De Brye, B.; Vermeulen, B.; Deleersnijder, E. Tidal Impact on the Division of River Discharge over Distributary Channels in the Mahakam Delta. Ocean Dyn. 2011, 61, 2211–2228. [Google Scholar] [CrossRef]
  17. Wünchow, A.; Masse, A.K.; Garvine, R.W. Astronomical and Nonlinear Tidal Currents in a Coupled Estuary Shelf System. Cont. Shelf Res. 1992, 12, 471–498. [Google Scholar] [CrossRef]
  18. Zhang, W.; Feng, H.; Hoitink, A.J.F.; Zhu, Y.; Gong, F.; Zheng, J. Tidal Impacts on the Subtidal Flow Division at the Main Bifurcation in the Yangtze River Delta. Estuar. Coast. Shelf Sci. 2017, 196, 301–314. [Google Scholar] [CrossRef]
  19. Zhang, W.; Feng, H.; Zhu, Y.; Zheng, J.; Hoitink, A.J.F. Subtidal Flow Reversal Associated With Sediment Accretion in a Delta Channel. Water Resour. Res. 2019, 55, 10781–10795. [Google Scholar] [CrossRef] [Green Version]
  20. Wahyudin; Yamamoto, T. Modeling Bottom-up and Top-down Controls on the Low Recruitment Success of Oyster Larvae in Hiroshima Bay, Japan. Aquaculture 2020, 529, 735564. [Google Scholar] [CrossRef]
  21. Nguyen, H.T.; Kawanisi, K.; Sawaf, M.B. Al Acoustic Monitoring of Tidal Flow and Salinity in a Tidal Channel. J. Mar. Sci. Eng. 2021, 9, 1180. [Google Scholar] [CrossRef]
  22. Kawanisi, K.; Razaz, M.; Kaneko, A.; Watanabe, S. Long-Term Measurement of Stream Flow and Salinity in a Tidal River by the Use of the Fluvial Acoustic Tomography System. J. Hydrol. 2010, 380, 74–81. [Google Scholar] [CrossRef]
  23. Kawanishi, K. Variability of Tidal Current, Density Stratification and Tidal Flat Sediment in a Tidal River. WIT Trans. Ecol. Environ. 2006, 88, 129–138. [Google Scholar] [CrossRef] [Green Version]
  24. Kawanisi, K. Evaluation of M-Y Closure Model in Tidal Estuary with Turbulence Data from High-Resolution Current Profiler. WIT Trans. Built Environ. 2003, 70, 101–110. [Google Scholar]
  25. Khadami, F.; Kawanisi, K.; Al Sawaf, M.B.; Gusti, G.N.N.; Xiao, C. Spatiotemporal Response of Currents and Mixing to the Interaction of Tides and River Runoff in a Mesotidal Estuary. Ocean Sci. J. 2022, 57, 37–51. [Google Scholar] [CrossRef]
  26. Razaz, M.; Kawanisi, K. Turbulence Characteristics in the Bottom Layer of a Shallow Tidal Channel. J. Turbul. 2012, 13, 1–22. [Google Scholar] [CrossRef]
  27. Soltaniasl, M.; Kawanisi, K.; Yano, J.; Ishikawa, K. Variability in Salt Flux and Water Circulation in Ota River Estuary, Japan. Water Sci. Eng. 2013, 6, 283–295. [Google Scholar] [CrossRef]
  28. Gotoh, T.; Fukuoka, S.; Miyagawa, Y. Topographic Changes of Tidal Flats in the Ota River Estuary by Flood Flows. Adv. River Sediment Res. 2013, 1337–1345. Available online: https://sfuku.r.chuo-u.ac.jp/top/sfuku/paper/ISRS2013gotoh.pdf (accessed on 1 August 2022).
  29. Xiao, C.; Kawanisi, K.; Al Sawaf, M.B. Suspended Particulate Matter Concentration in Response to Tidal Hydrodynamics in a Long Mesotidal Floodway. Estuar. Coast. Shelf Sci. 2020, 233, 106525. [Google Scholar] [CrossRef]
  30. Jay, D.A.; Leffler, K.; Diefenderfer, H.L.; Borde, A.B. Tidal-Fluvial and Estuarine Processes in the Lower Columbia River: I. Along-Channel Water Level Variations, Pacific Ocean to Bonneville Dam. Estuaries Coasts 2015, 38, 415–433. [Google Scholar] [CrossRef]
  31. Sarker, S. A Story on the Wave Spectral Properties of Water Hammer. Appl. Mech. 2022, 3, 799–814. [Google Scholar] [CrossRef]
  32. Pawlowicz, R.; Beardsley, B.; Lentz, S. Classical Tidal Harmonic Analysis Including Error Estimates in MATLAB Using TDE. Comput. Geosci. 2002, 28, 929–937. [Google Scholar] [CrossRef]
  33. Godin, G. Compact Approximations to the Bottom Friction Term, for the Study of Tides Propagating in Channels. Cont. Shelf Res. 1991, 11, 579–589. [Google Scholar] [CrossRef]
  34. Schramkowski, G.P.; de Swart, H.E. Morphodynamic Equilibrium in Straight Tidal Channels: Combined Effects of Coriolis Force and External Overtides. J. Geophys. Res. Ocean. 2002, 107, 20-1–20-17. [Google Scholar] [CrossRef]
  35. Speer, P.E.; Aubrey, D.G. A Study of Non-Linear Tidal Propagation in Shallow Inlet/Estuarine Systems Part II: Theory. Estuar. Coast. Shelf Sci. 1985, 21, 207–224. [Google Scholar] [CrossRef]
  36. Gong, W.; Shen, J.; Jia, L. Salt Intrusion during the Dry Season in the Huangmaohai Estuary, Pearl River Delta, China. J. Mar. Syst. 2013, 111–112, 235–252. [Google Scholar] [CrossRef]
  37. Burchard, H.; Hetland, R.D. Quantifying the Contributions of Tidal Straining and Gravitational Circulation to Residual Circulation in Periodically Stratified Tidal Estuaries. J. Phys. Oceanogr. 2010, 40, 1243–1262. [Google Scholar] [CrossRef]
  38. Geyer, W.R.; MacCready, P. The Estuarine Circulation. Annu. Rev. Fluid Mech. 2014, 46, 175–197. [Google Scholar] [CrossRef]
  39. Pu, X.; Shi, J.Z.; Hu, G.D.; Xiong, L.B. Circulation and Mixing along the North Passage in the Changjiang River Estuary, China. J. Mar. Syst. 2015, 148, 213–235. [Google Scholar] [CrossRef]
  40. Burchard, H.; Hetland, R.D.; Schulz, E.; Schuttelaars, H.M. Drivers of Residual Estuarine Circulation in Tidally Energetic Estuaries: Straight and Irrotational Channels with Parabolic Cross Section. J. Phys. Oceanogr. 2011, 41, 548–570. [Google Scholar] [CrossRef]
  41. Ridd, P.V.; Stieglitz, T. Dry Season Salinity Changes in Arid Estuaries Fringed by Mangroves and Saltflats. Estuar. Coast. Shelf Sci. 2002, 54, 1039–1049. [Google Scholar] [CrossRef]
  42. Xie, D.; Pan, C.; Gao, S.; Wang, Z.B. Morphodynamics of the Qiantang Estuary, China: Controls of River Flood Events and Tidal Bores. Mar. Geol. 2018, 406, 27–33. [Google Scholar] [CrossRef]
  43. Xie, D.; Wang, Z.B. Seasonal Tidal Dynamics in the Qiantang Estuary: The Importance of Morphological Evolution. Front. Earth Sci. 2021, 9, 782640. [Google Scholar] [CrossRef]
  44. Xie, D.; Bing Wang, Z.; Huang, J.; Zeng, J. River, Tide and Morphology Interaction in a Macro-Tidal Estuary with Active Morphological Evolutions. Catena 2022, 212, 106131. [Google Scholar] [CrossRef]
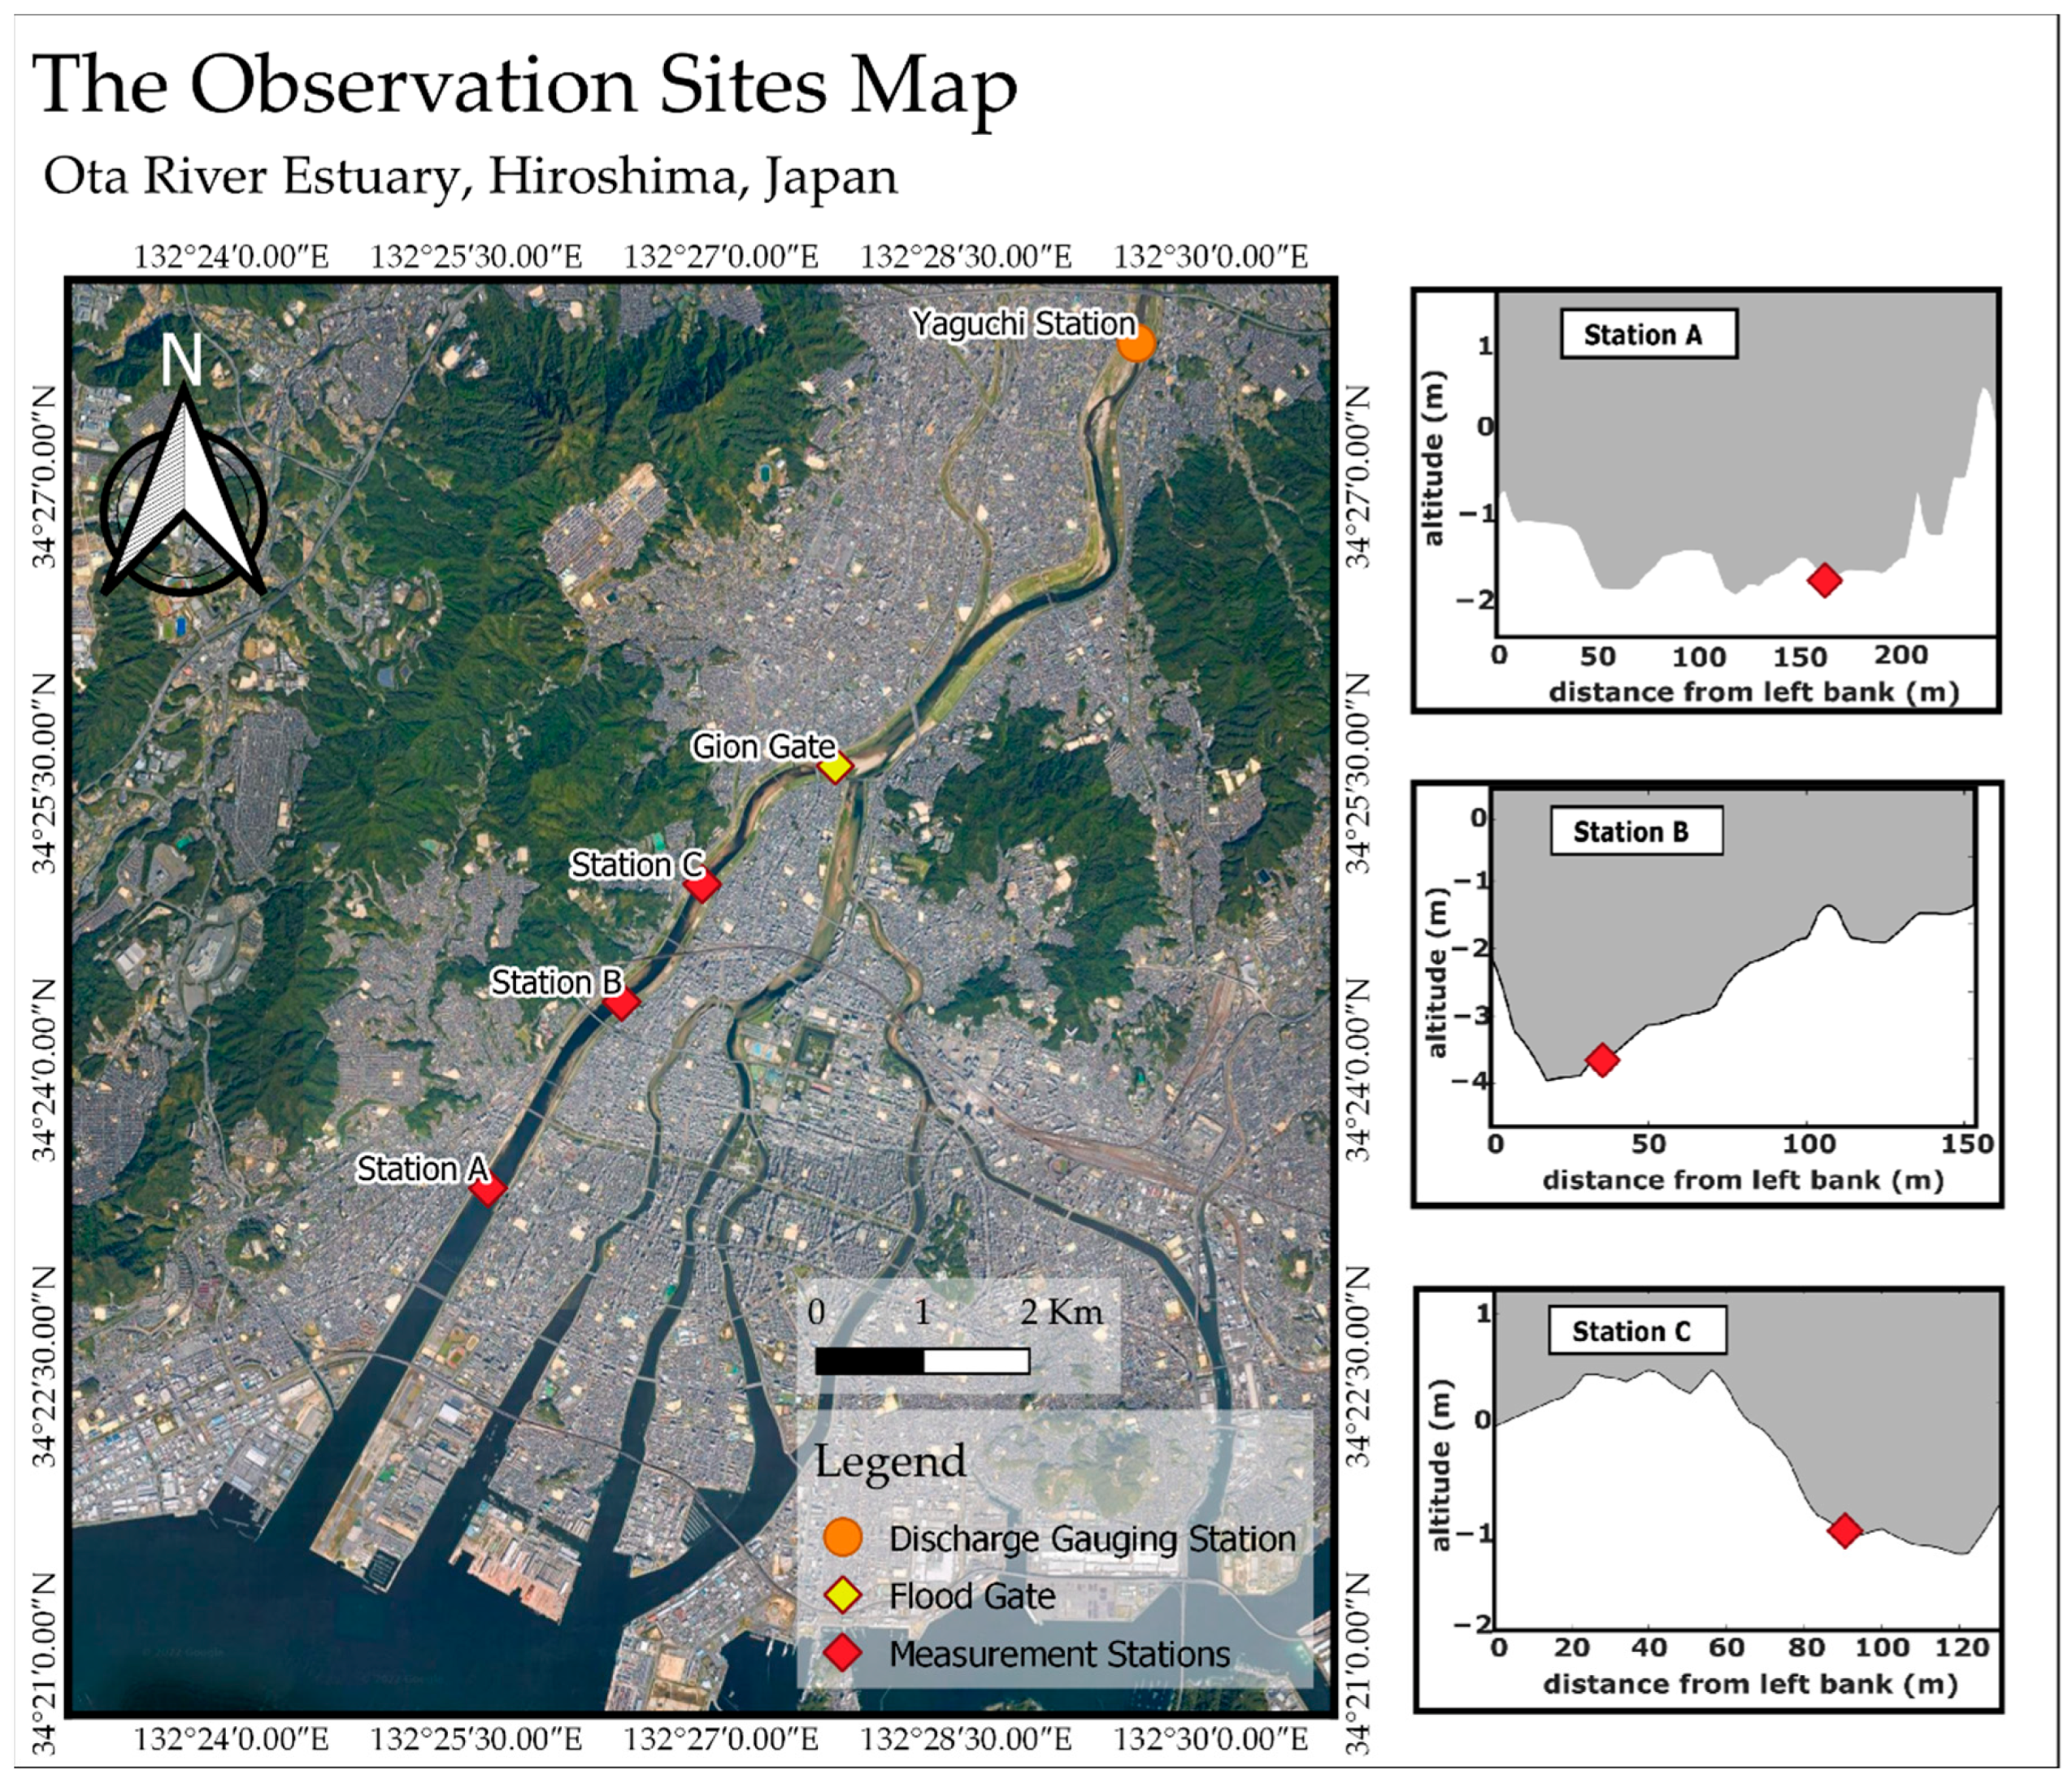
Figure 1. The observation sites in the Ota Diversion Channel, Hiroshima, Japan. Red diamonds show the location of instrument deployment. Insets show a cross-sectional view (seaward) of each station.
Water 14 02585 g001
Figure 2. Time series plot of observed water depth (a), near-bottom salinity (b), and current velocities in station A (c), station B (d), and station C (e).
Water 14 02585 g002
Figure 3. Tidal ranges (left) and subtidal elevations (right) at Stations A, B, and C.
Water 14 02585 g003
Figure 4. Water densities at Stations A and C.
Water 14 02585 g004
Figure 5. River discharge at the Yaguchi Gauging Station (a) and subtidal velocities at the upper depth, (b) mid-depth (c), and lower depth (d) at Stations A, B, and C.
Water 14 02585 g005
Figure 6. The power spectrum of water elevation (a) and current velocity in upper (b), mid-depth (c), and lower (d) depths at Stations A, B, and C.
Water 14 02585 g006
Figure 7. The diurnal velocity (a,d,g), semidiurnal velocity (b,e,h), and quarterdiurnal velocity (c,f,i) at upper (top row), mid- (middle row), and lower depth (bottom row) at Stations A, B, and C.
Water 14 02585 g007
Figure 8. Frt (a,d,g), Ft (b,e,h), and Fr (c,f,i) at upper (top row), mid (middle row), and lower depth (bottom row) in Stations A, B, and C.
Water 14 02585 g008
Figure 9. Stokes flux (a,d,g), return flux (b,e,h), and total flux (c,f,i) at upper (top row), mid- (middle row), and lower depth (bottom row) at Stations A, B, and C.
Water 14 02585 g009
Figure 10. The longitudinal gradient of near-bottom density between Stations C and A. The red line depicts subtidal density gradient, while the black line depicts 10 min interval density gradient.
Water 14 02585 g010
Figure 11. The longitudinal subtidal density gradient vs. Fr (blue triangles) and Frt (red dots) at Stations A (a), B (b), and C (c). The trendlines denote the linear relationship between the density gradient with Fr (blue lines) and Frt (red lines).
Water 14 02585 g011
Figure 12. The longitudinal subtidal density gradient vs. return flux at Stations A (blue triangles), B (red dots), and C (black plus). The trendlines denote the linear relationship between the density gradient with return flux in each respective station.
Water 14 02585 g012
Publisher’s Note: MDPI stays neutral with regard to jurisdictional claims in published maps and institutional affiliations.