Article

Study on Sustainable Well Water Pumping Technology to Melt Ice in Winter for the Middle Route of the South-to-North Water Diversion Project

1
State Key Laboratory of Hydraulic Engineering Simulation and Safety, Tianjin University, Tianjin 300350, China
2
School of Civil Engineering, Tianjin University, Tianjin 300350, China
*
Author to whom correspondence should be addressed.
Water 2022, 14(16), 2550; https://doi.org/10.3390/w14162550
Submission received: 10 July 2022 / Revised: 5 August 2022 / Accepted: 16 August 2022 / Published: 19 August 2022

Abstract

:
In order to improve the water delivery capacity of the middle route of the South-to-North Water Diversion Project in winter, the technology of pumping well water to melt ice was previously adopted to improve the water temperature of the channel. In order to protect the local ecology and channel water quality during the process of pumping and recharging, this paper has analyzed the optimal limit to the range of groundwater level fluctuations and groundwater temperature fluctuations. The Baiquan Underground Reservoir was considered as the research object, and a three-dimensional numerical model of hydrothermal coupling was established. Correlation analyses of pumping and recharge capacity with various factors, and between temperature changes after recharging and various factors, were carried out with a view to protecting local water quality. The single well pumping and recharging scheme was optimized by genetic algorithm. The quantitative estimation formula of pumping and recharge water capacity, and the well depth, permeability coefficient, initial water level, and duration of continuous pumping and recharge, as well as the recovery water level variation formula, were established under the limitation of water level fluctuation. The quantitative relationship between horizontal maximum diameter, L, and the recharge flow rate, the continuous recharge duration, vertical maximum depth, H; and the well depth, temperature change rate, K, and the recharge water temperature, were obtained. The results showed that the permeability coefficient and soil thermal conductivity had little effect on the temperature field change. Additionally, recharge should be carried out in summer, when the temperature of recharge water is above 14.8 °C. When the number of pumping or recharging times, n, is two, the total amount of pumping or recharging during the operation period reaches its maximum. Compared with continuous operation during the operating period, this report found that the total amount of pumped water would increase by 1.1 × 10⁶ m3, and the total amount of recharge would increase by 7 × 10⁵ m3.

1. Introduction

The middle route of the South-to-North Water Diversion Project is a national strategic basic project to solve the water shortage in north China. At present, in order to ensure the safety of water transportation in winter, the project adopts a strategy of water conveyance under the ice sheet, with simultaneous ice blocking rope and other anti-ice control devices to avoid the occurrence of serious ice damage [1,2]. After years of operation, the water transport capacity under the winter ice sheet has approached the theoretical upper limit. Along the middle route of the South-to-North Water Diversion Project are rich geothermal resources, such as the Baiquan Underground Reservoir. By using the method of pumping well water to melt ice, high-temperature water extracted from the underground reservoirs is mixed with the water body in the channel, which can increase the water temperature of the channel [3], control the formation and development of ice in the channel, and even achieve ice-free water delivery in winter, thereby greatly improving water delivery capacity in winter. There is, therefore, a significant need to carry out research on the sustainable pumping and melting of ice in winter, and on this basis, the middle route of the South-to-North Water Diversion Project has been the focus of this research.
Geothermal resources have great application potential. Ground source heat pump is a form of geothermal application, and scholars in China and abroad have conducted in-depth research on this topic. Groundwater or surface water, such as water in lakes, reservoirs, rivers or oceans, are used as heat sources or radiators for heat pumps, through groundwater pumping and recharge cycles, with the help of compressors, to complete the heat transfer between groundwater and buildings. The basis of its popularity and concept of application is that the temperature of groundwater is basically constant and moderate (13–16 °C), which is an ideal energy carrier [4,5]. Vieira et al. analyzed the thermal–hydro–mechanical properties of soil in detail, and predicted that in addition to the shallow geothermal energy, the surface could also be used as a heat storage reservoir [6]. Mitchell et al. reported that, with regard to the geothermal pump system, as long as the suitable water body was close to the heat demand, using the heat source directly instead of the heat pump would usually bring higher efficiency [7], which provides a reference for utilizing the thermal energy of the above-ground reservoir water body. Water-pumping and ice-melting technology utilizes geothermal resources. By setting up pumping stations along the channel to pump high-temperature groundwater into the channel, a transfer of geothermal resources is obtained, and shore ice in the water diversion channel is eliminated. At present, the technology of pumping well water to melt ice is mainly used in China, and there have been few foreign studies. The main applications of this technology are essentially in power station diversion canals, mainly in the Xinjiang and Qinghai regions of China, such as the Qinghai Xiangjia Hydropower Station and Xinjiang Hongshanzui Hydropower Station. Scholars in China and abroad have carried out field investigations and theoretical research on the pumping technology principle, equipment and operation time of melting ice, demonstrating its theoretical feasibility [8,9], and using model testing, numerical simulation, prototype observation and other methods to analyze water temperature changes along the channel after well water is injected [8,10,11,12]. According to the variation of channel water temperature, the layout scheme of the well group was determined to be reasonably optimized [13,14].
As an important source of drinking water in north China, the middle route of the South-to-North Water Diversion Project requires high standards of water quality for the main trunk canals. To apply the technology of pumping water to melt ice, to the middle route of the South-to-North Water Diversion Project, it is, first of all, necessary to pay attention to the impact of water injection on the quality of the channel water. As one of the drinking water sources for Xingtai City, the Baiquan Underground Reservoir has been monitoring the water quality of the Zijinquan Water Plant, Hanyanzhuang Water Plant, and Dongcun Water Plant water source wells in Xingtai City for many years. The water quality monitoring results have shown that the water quality evaluation results were all excellent, being in the range of I~II water quality [15,16]. The water quality of the Hebei section of the middle channel of the South-to-North Water Diversion Project was also reported at I-II national water standard [17,18]. Therefore, when the Baiquan Underground Reservoir is used as the heat source reservoir for pumping and recharging, the impact of water quality on the local ecology can be ignored.
When the technology of pumping well water to melt ice is adopted, it is easy to cause an imbalance of groundwater resources, only by natural recharge, after pumping. In this case, some scholars have proposed a new method of water diversion during winter with equal pumping and recharge volumes, to recycle underground heat energy [19]. In the process of pumping and recharge, the groundwater level will fluctuate up and down. If the fluctuation range of groundwater level is too large, it will pose a challenge to the ecological environmental protection of the region [20]. In this regard, some scholars have suggested that groundwater exploitation and other measures should be optimized and regulated according to the critical water level of shallow and deep groundwater [21], so that the overall buried depth of the regional groundwater level is in an appropriate range [22]. In response, a groundwater regulation system based on regulation measures–cyclic transformation–response feedback, was constructed [23]. When low temperature water is used for recharging, the underground water temperature will decrease after mixing. If the temperature is not restored within time, an accumulation of cold masses will easily be caused after years of operation, which will reduce the temperature of the water pumped and would not be conducive to the sustainability of the pumping/ice-melting measures. Cimmino et al. solved the problem of the heat imbalance of ground source heat pumping by establishing a combined application model of solar and shallow geothermal energies [24]. In the ground source heat pump system, the change rule of groundwater temperature is mainly influenced by various factors such as groundwater level and recharge temperature [25]. Therefore, in pursuit of protecting local water quality, the technology of pumping well water to melt ice was applied to the middle route of the South-to-North Water Diversion Project. On this basis, the water level and water temperature fluctuation ranges during the pumping–recharge process have been limited to both protect the local ecological environment and ensure that the technology can be sustainable for many years.
In this paper, the Baiquan Underground Reservoir along the middle route of the South-to-North Water Diversion Project was used as the heat source for pumping well water to melt ice, and a three-dimensional underground reservoir water thermal model was established. On the premise of ensuring that pumping and recharge waters meet national drinking water standards, the pumping capacity and water level recovery of pumping wells were analyzed from the perspective of water level regulations. Then we analyzed the recharge capacity and water level recovery of the recharge well in the recharge period. Furthermore, from the perspective of water temperature, variations of the law of temperature field and temperature recovery ability of the aquifer under the influence of multiple factors after recharge, were analyzed. The analyses of water level and water temperature provide reference for the sustainable application of the technology of pumping well water to melt ice.

2. Data and Methods

2.1. Study Area

The Baiquan Underground Reservoir is located to the west of Xingtai and Handan, in Hebei Province, covering a total area of about 3843 km2, with a distance of 25~50 km from east to west, as shown in Figure 1. The spring domain belongs to the mainland, comprising a warm temperature, semi-dry season climate area, with an annual precipitation of 500 to 600 mm. The underground reservoir has a natural water storage space, which is composed of fault zones on all sides and a relatively impervious layer at the bottom. It transitions from the western mountainous area to the hilly plains in the east. The western part of the Baiquan Underground Reservoir is based on the watersheds of the Taixing Mountain surface; the eastern part is formed from the Xingtai–Neiqiu and Xingtai–Fengfeng Fracture, to form the border of water resistance; the western section of the southern border is the watershed of the northern Luohe Underground Watershed; the eastern section is the coal system and the fire body of the rock body to form the water resistance boundary; and the northern border is the groundwater split watershed, which is composed of the Neiqiu–Northwest Ridge. Under the control of various factors such as strata rock, geological structure, and topography, the Baiquan Underground Reservoir constitutes a basic, independent, and closed hydrological unit.
Owa carbonate rock is the main water content group of the Baiquan Underground Reservoir. The top of the underground reservoir is covered by Carboniferous, Permian and Quaternary systems. The hydrogeological profile is shown in Figure 2; the upper confining bed is basically composed of gravel or clay.
The middle section is rich in water, the lithology is medium-coarse crystalline limestone, dolomite, thin limestone, with widely developed dissolved pores. The weak water-rich section at the bottom is mostly filled with calcite veins [26]. The underground reservoir has stratification in the vertical direction of karst development, which can be divided into a karst extremely strong development zone, a karst medium development zone, and a karst weak development zone. From below the ground water level to the elevation (Yellow Sea elevation) of -150 m is a karst strong development zone, where the dissolved fissure rate is generally 5.04% to 55.3%, and is a very strong water-rich belt; the elevation −150~−400 m is a karst medium development zone, and the dissolved fissure rate is generally 2.43% to 25.7%, which is a strong and rich water zone; the elevation −400~−650 m is a karst weak development zone, in which the dissolved fissure rate is very low.
The Baiquan Underground Reservoir has a storage capacity of 253 million m3. According to the water level data of the Baiquan Underground Reservoir over many years, the lowest water level has been no lower than 27.7 m, the highest water level has been no higher than 64 m, and fluctuation of the water level within this range does not adversely affect the local ecology. Therefore, during pumping and recharge, the fluctuation of water level is controlled between 27.7 m and 64 m.

2.2. Numerical Model

Under large regional conditions, a karst aquifer can be generalized into equivalent pore medium [27]. The Baiquan Underground Reservoir is dominated by karst water, the aquifer is heterogeneous and anisotropic, and the water flow is generalized to the unstable Darcy flow. The thermal movement accompanying groundwater flow includes groundwater flow and heat transfer. According to Darcy’s law and the energy conservation equation, the groundwater seepage equation is as follows [28]:
S 0 h t + q i x i = ρ Q ρ 0 Q + Q 0 ( T )
q i = K i j u ( ρ 0 g h + ( ρ ρ 0 ) g z )
where Kij is the permeability coefficient, m/d; S0 is the water storage rate, 1/m; qi is the Darcy velocity vector, m/s; h is the water level under the reference condition, m; u is the dynamic viscosity coefficient; and ρ0 and ρQ are, respectively, the density of water under reference conditions and the density of source and sink terms, kg/m3.
The heat transfer of underground hot water in porous media mainly includes convection heat transfer, heat conduction and thermal–mechanical dispersion. Assuming that the heat exchange between water and rock is instantaneous, the heat transfer equation and the governing equation of groundwater temperature field are derived according to the principle of energy conservation [29]:
( θ ρ w C w + ( 1 θ ) ρ s C s ) T t + ρ s C s q i T x i x i ( λ i j T x j ) + ρ Q C Q Q ( T T Q ) = 0
λ i j = θ λ i j w + ( 1 θ ) λ i j s + λ i j d
where Cw, Cs and CQ are the specific heat capacities of water, porous media skeleton and source and sink terms, J/(kg·K), respectively; ρW, ρS, and ρQ are the densities of water, porous medium skeleton and source sink, kg/m3, respectively; θ is the porosity of porous media; TQ is the temperature of the source and sink terms, K; λij is the equivalent thermal conductivity, W/(m·K·s); Q is the source sink term, m3/s; and qi is the Darcy velocity vector, m/s.

2.3. Model Construction

In this paper, a generalized model was used to select a section in the north–south direction of the Baiquan Underground Reservoir for analysis, as shown in Figure 3. The plane range used was 25 km × 10 km, which was divided by triangular meshes, with a total of 564,960 units, which intensified near the pumping or recharge well. As the hydraulic slope was small and the range from east to west was large, the influence of the hydraulic gradient was ignored. The initial temperature of the reservoir in this model was 15 °C, and the geothermal gradient was 1.5 °C/100 m with the deepening of the stratum [30]. The boundary conditions around the reservoir were set as a constant temperature boundary, the bottom was a constant temperature, and the bottom boundary was a water-tight boundary. The ice period is from December to February, and was set to 90 days. Relevant geological parameters refer to data [30,31,32,33] obtained by previous methods such as field testing, engineering collection, and empirical parameters in similar karst regions, as shown in Table 1.
Assuming that the simulated area is isotropic in the horizontal direction, the permeability coefficient in the vertical direction is 1/10 of that in the horizontal direction. At the same time, studies have shown that rock thermal conductivity and volume specific heat are related to compositional porosity, formation thermal conductivity decreases with the increase in porosity, and volume specific heat increases with the increase in porosity [34,35]. According to the heights of the Baiquan Underground Reservoir and its rock-soluble development, the vertical direction of the reservoir was divided into 4 layers. The first layer was the gravel layer of clay, and the second to fourth layers were the karst extremely strong development zone, karst medium development zone, and karst weak development zone. The intermediate value parameters were finally adopted as shown in Table 2 below.

3. Results and Discussion

3.1. Analysis of Pumping and Recharge Characteristics of Underground Reservoirs

As the water quality of the Baiquan Underground Reservoir is relatively good, being between Class I and Class II, the water quality of the underground reservoir has little effect on the quality of channel water during pumping. The water quality of the Hebei section of the middle channel of the South-to-North Water Diversion Project is also between Class I and Class II, and channel water can also be used for recharging. In addition, in order to prevent sudden pollution, it is necessary to regularly monitor the water quality of channels and underground reservoirs to ensure that the pumping–recharge process is carried out under the condition of good water quality.
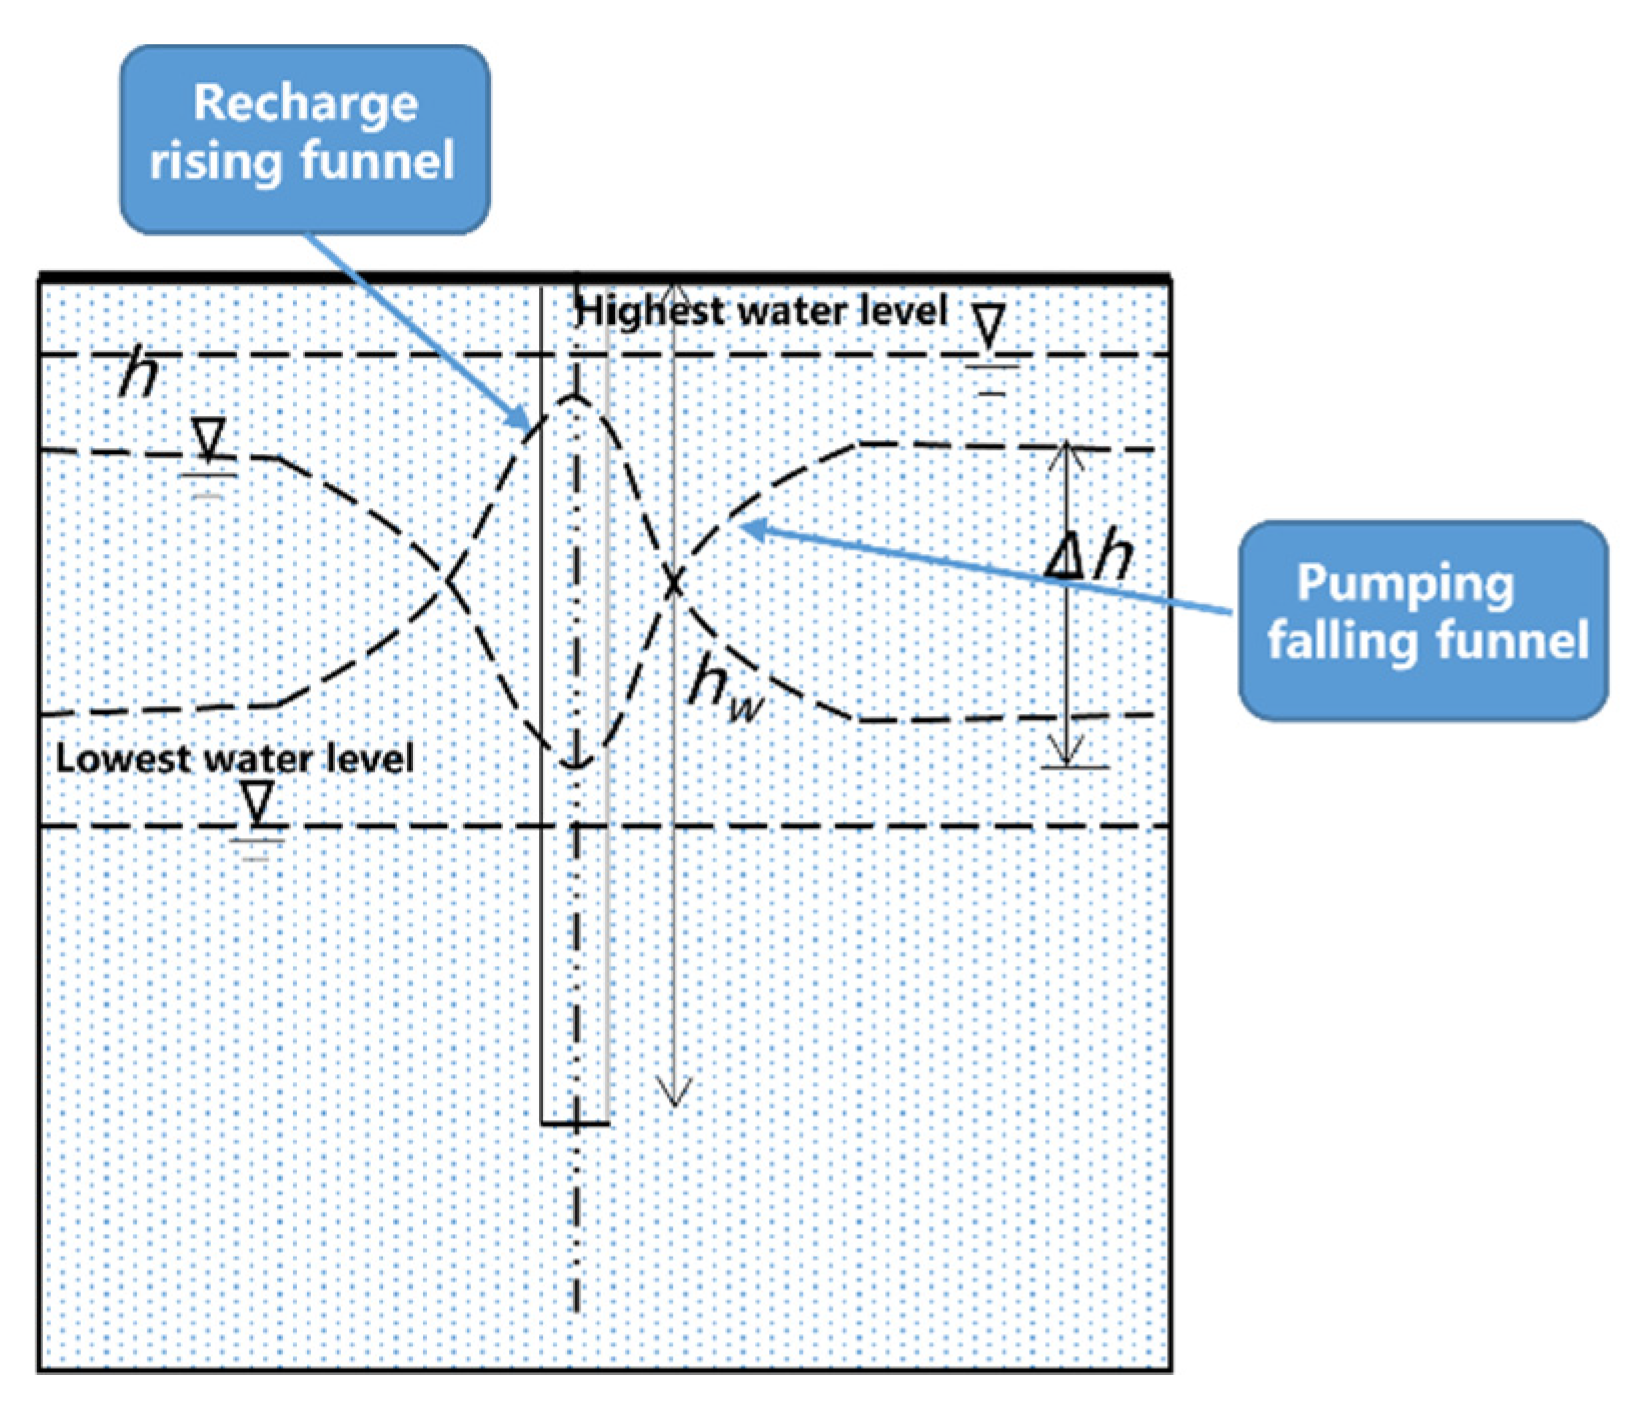
In the pumping process, the water level falls, and a falling funnel centered on the shaft will be formed around the well wall; and during the recharge process, the water level gradually rises, forming a rising funnel. Both are shown in Figure 4. If the water level drops too much, land subsidence may easily be caused, and the regional groundwater hydrological cycle will change, which cannot meet the growth needs of local animals and plants. In the process of recharge, if the water level exceeds the maximum water level for many years, disasters such as soil salinization may easily be caused. Therefore, in the process of pumping and recharge, it is necessary to avoid an excessive fluctuation of water level which will have an impact on the ecology. Therefore, the water level fluctuation caused by pumping and recharging has been limited to between 27.7 m and 64 m, which will affect the pumping and recharging capacities of the well. The difference in well depth, permeability coefficient, continuous pumping/recharging time, and initial water level will determine the flow rate of pumping/recharging. Therefore, it is necessary to analyze the influence of the above factors on pumping/recharging capacities. Pumping capacity and recharge capacity, respectively, refer to the maximum flow that can ensure continuous and stable pumping, and the maximum flow of continuous and stable recharge, under the limitation of water level fluctuations.
After recharge, groundwater temperature changes, as shown in Figure 5. In order to describe its change characteristics, the maximum horizontal diameter, L (the maximum horizontal distance where the temperature around the irrigation well changes), the maximum vertical depth, H (the temperature affected in the vertical direction) and temperature gradient, k (maximum temperature difference/horizontal maximum diameter) are defined as Eigenvalues of temperature field changes. In order to avoid the impact of water temperature changes on the ecology, it is necessary to control the recharge water temperature. Factors that affect the temperature field change mainly include recharge flow, well depth, recharge water temperature, continuous recharge time and aquifer parameters. Therefore, it is necessary to analyze the above factors with regard to the law of temperature change.

3.2. Determination of Ecological Pumping Capacity

In order to study the influence of the initial water level, continuous pumping time, permeability coefficient and well depth, on the pumping capacity variation under the restriction of water level fluctuation (as shown in Table 3), a comparative analysis of working conditions was conducted.
The results of the analyzed working conditions in Table 3, are shown in Table A1. It shows that increasing the well depth and improving the permeability coefficient can significantly improve the pumping capacity. The table also shows that the shorter the continuous pumping time and the higher the initial water level are, the greater the pumping capacity will be. After fitting the parameters in Table A1, Equation (5) was obtained, in which the determination coefficient R2 was 0.987, which is close to 1, indicating that the equation had a good degree of fit. It can be seen from Equation (5) that the initial water level had the greatest influence on pumping capacity. For every 1 m drop in water level, the pumping capacity decreased by 0.217 m3/s, which was positively correlated with the initial water level, well depth, and permeability coefficient, and had a positive correlation with the continuous pumping time.
Q o = 13.937 + 0.013 h w + 0.038 k + 0.217 h 0.012 t
where, Qo is the pumping capacity of pumping well, m3/s; hw is the well depth, m; k is the horizontal/vertical permeability coefficient, m/d; h is the initial water level, m; and t is the continuous pumping time, d.
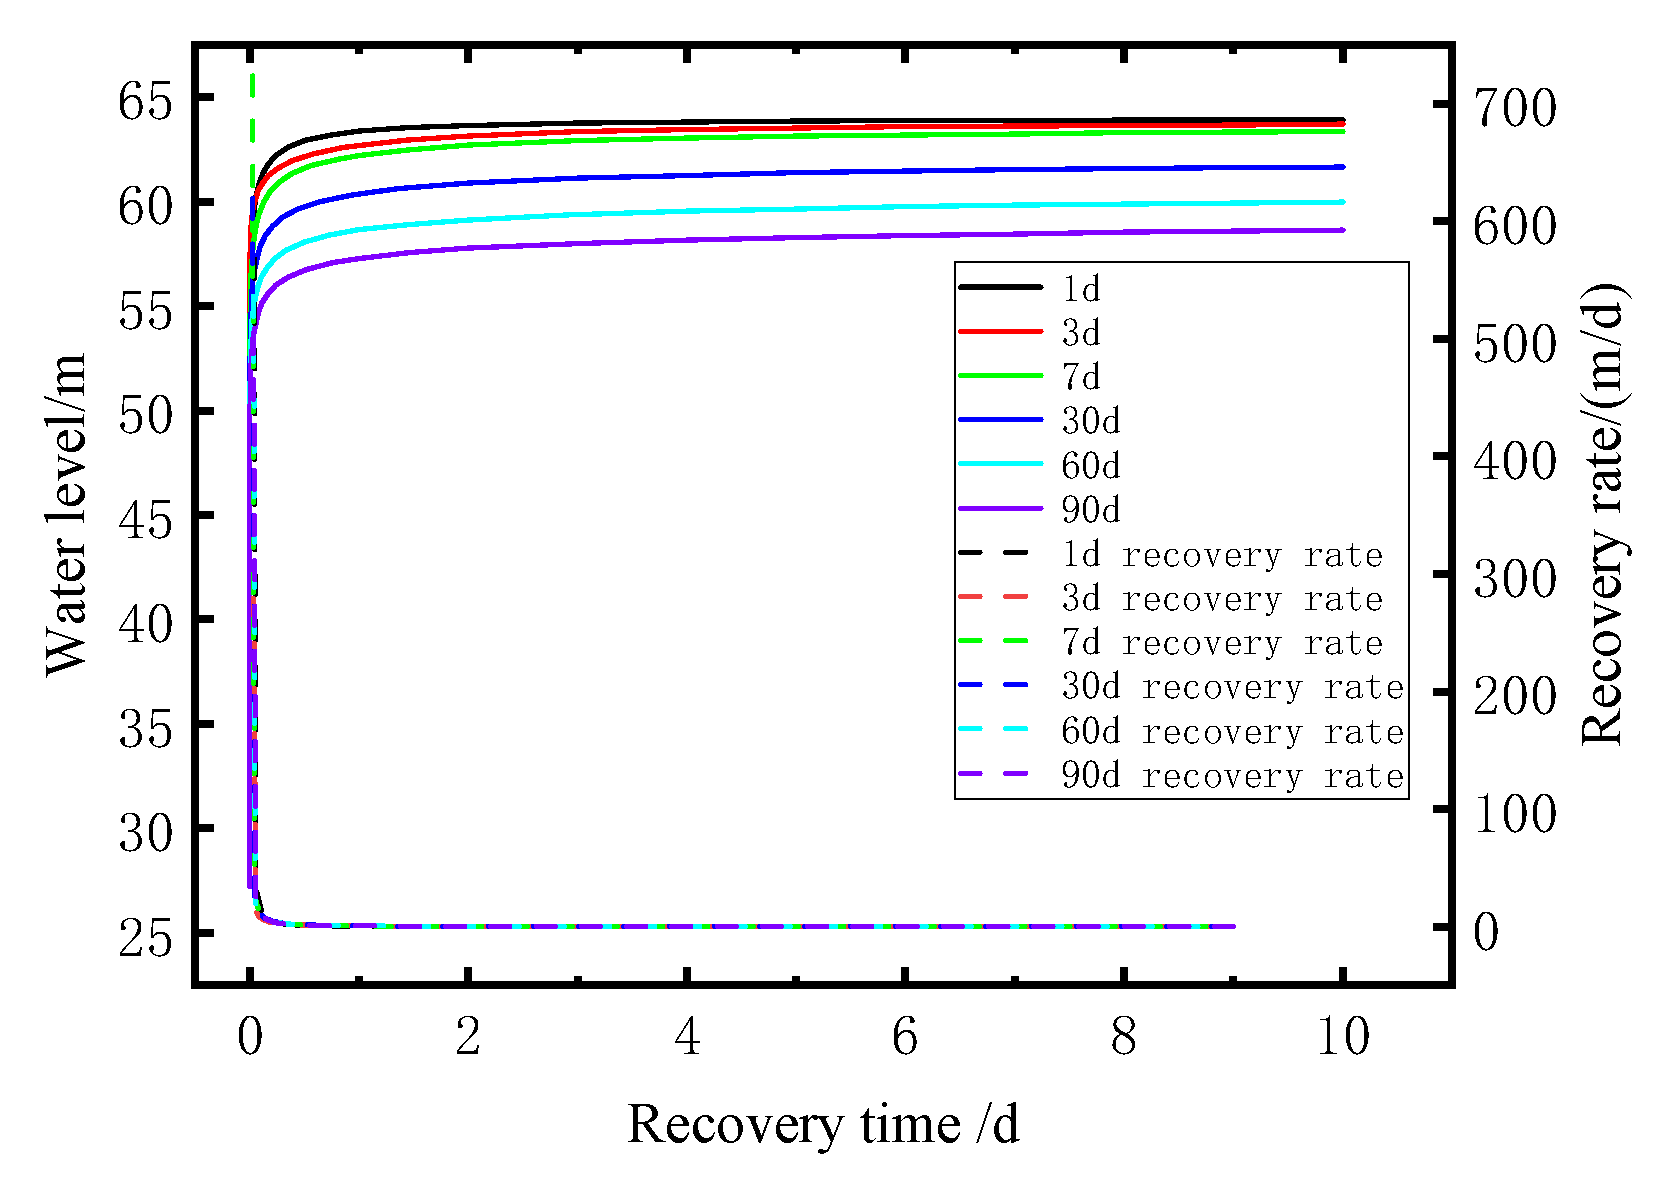
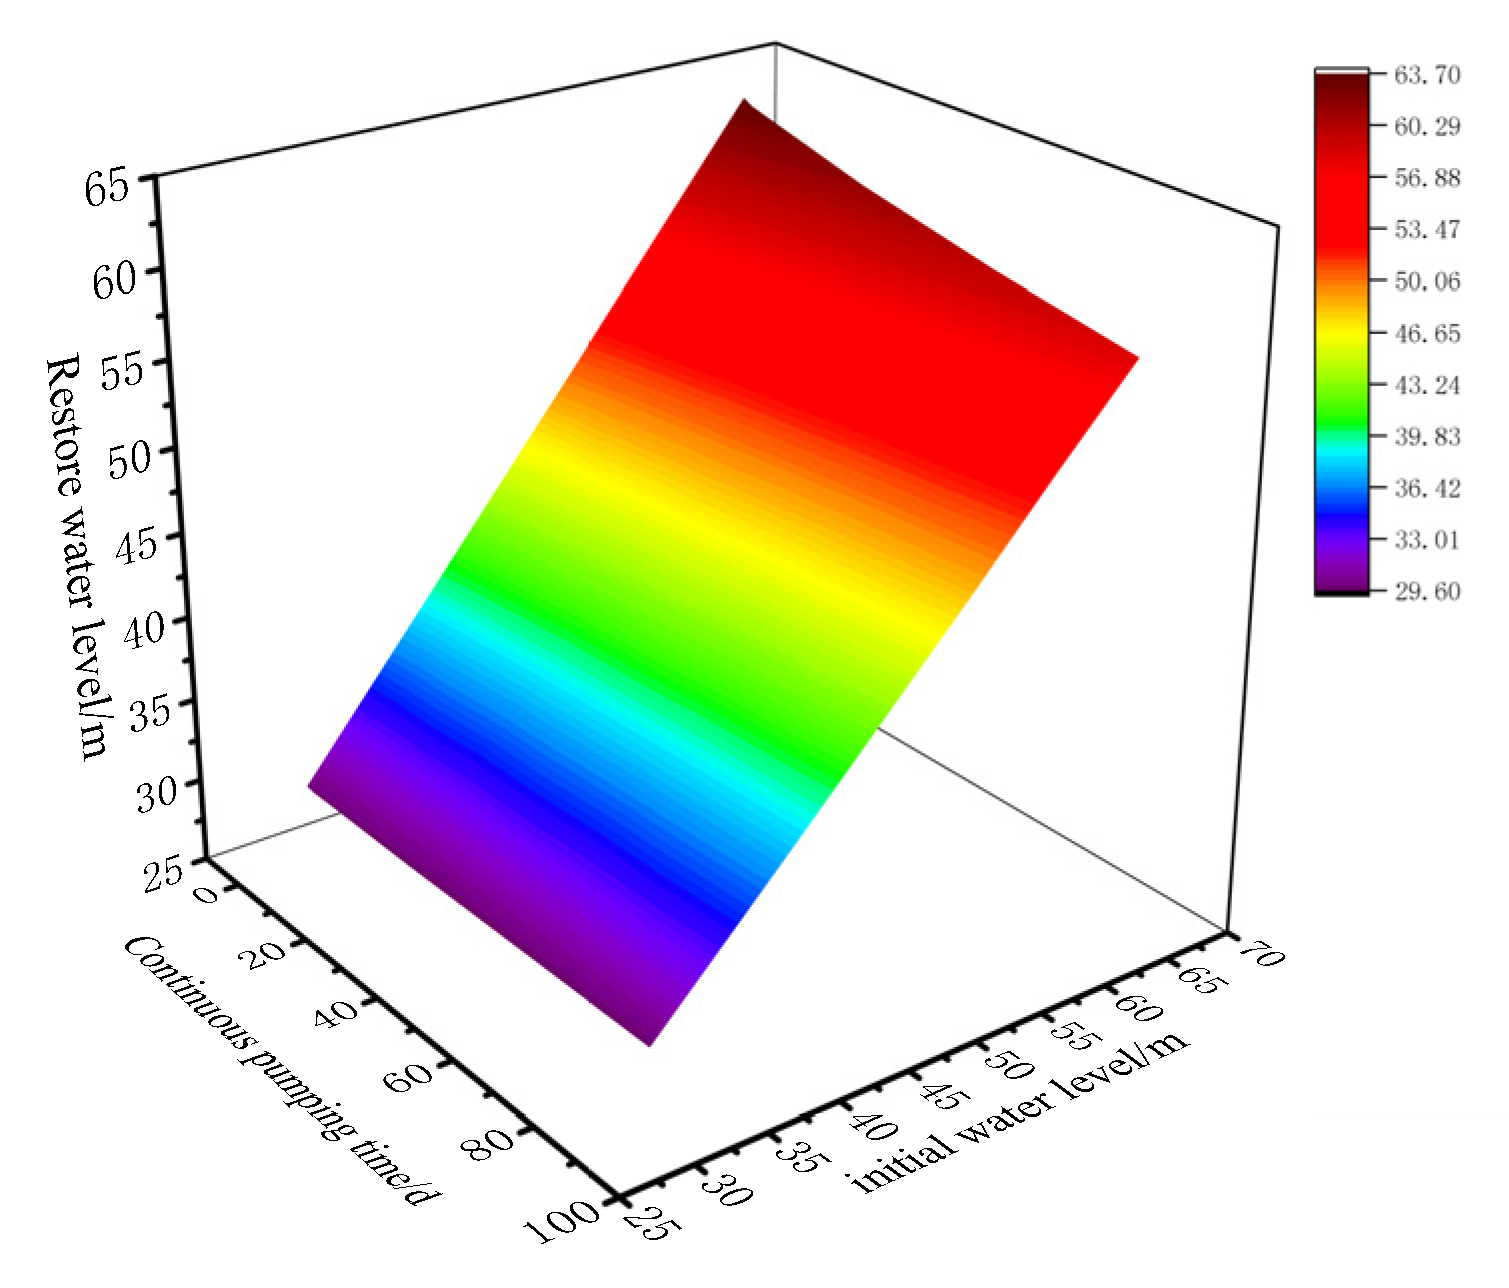
After pumping stops, the water level gradually recovers. When the well depth and permeability coefficient were determined to be 200 m and 150 m/d, respectively, the recovery of the water level under different continuous pumping times was analyzed, as shown in Figure 6. The recovery rate of the well water level was relatively fast in the initial stage, and as the recovery time increased, the recovery rate slowed down rapidly and gradually approached 0. In this paper, when the water level recovery rate was less than 0.05 m/d, the well water level at this time was the recovery level. According to the working conditions in Table 4, the results of the recovery water level under the influence of the initial water level and continuous pumping time, are shown in Figure 7.
In terms of water level recovery, the longer the continuous pumping time, the lower the recovery water level will be. Additionally, the higher the initial water level before pumping, the higher the recovery water level will be. Equation (6) was obtained after parameter fitting. Therefore, when determining the continuous pumping time and initial water level, the recovery water level can be calculated according to Equation (6).
h r = 2.727 0.035 t + 0.937 h
where hr is the recovery water level, m.
A long time is needed for the well water level to recover to the recovery water level. If the recovery time is too long, it will affect the total pumping volume of the entire ice period, and then affect the effect of pumping water and melting ice. After pumping stopped, when the recovery time was 1 d, the recovery speed dropped to 1 m/d, and decreased rapidly with the increase in recovery time. The well water level at this time was not much different from the recovery water level. The well water levels in Table 3, when the recovery time was 1 d, is shown in Figure 8. After fitting the parameters in Figure 8, Equation (7) was obtained. The determination coefficient R2 was 0.996, which is close to 1, indicating that the equation fit was good.
h 1 d = 3.638 0.038 t + 0.905 h
where h1d is the recovery water level at 1 d, m.

3.3. Determination of Ecological Recharge Capacity

Similar to the pumping capacity of a pumping well, the main factors that affect the ecological recharge capacity also include the initial water level, continuous recharge time, permeability coefficient, and well depth. A comparative analysis of the working conditions that were used to study the influence of the above factors on the variation rule of ecological recharge capacity, are shown in Table 5.
The simulation results are shown in Table A2, which show that increasing the well depth and increasing the permeability coefficient can significantly improve the recharge capacity. Table A2 also shows that the shorter the continuous recharge time is, the lower the initial water level is, and the stronger the recharge capacity will be. After fitting the scatter points in Table A2, Equation (8) was obtained, where the determination coefficient R2 was 0.953, which is closer to 1, indicating that the equation fit was good. It can be seen from Equation (8) that the initial water level had the greatest influence on recharge capacity, and the recharge capacity decreased by 0.217 m3/s for every 1 m water level rise.
Q i = 5.954 + 0.013 h w + 0.038 k 0.217 h 0.012 t
where Qi is the recharge capacity of recharge well, m3/s.
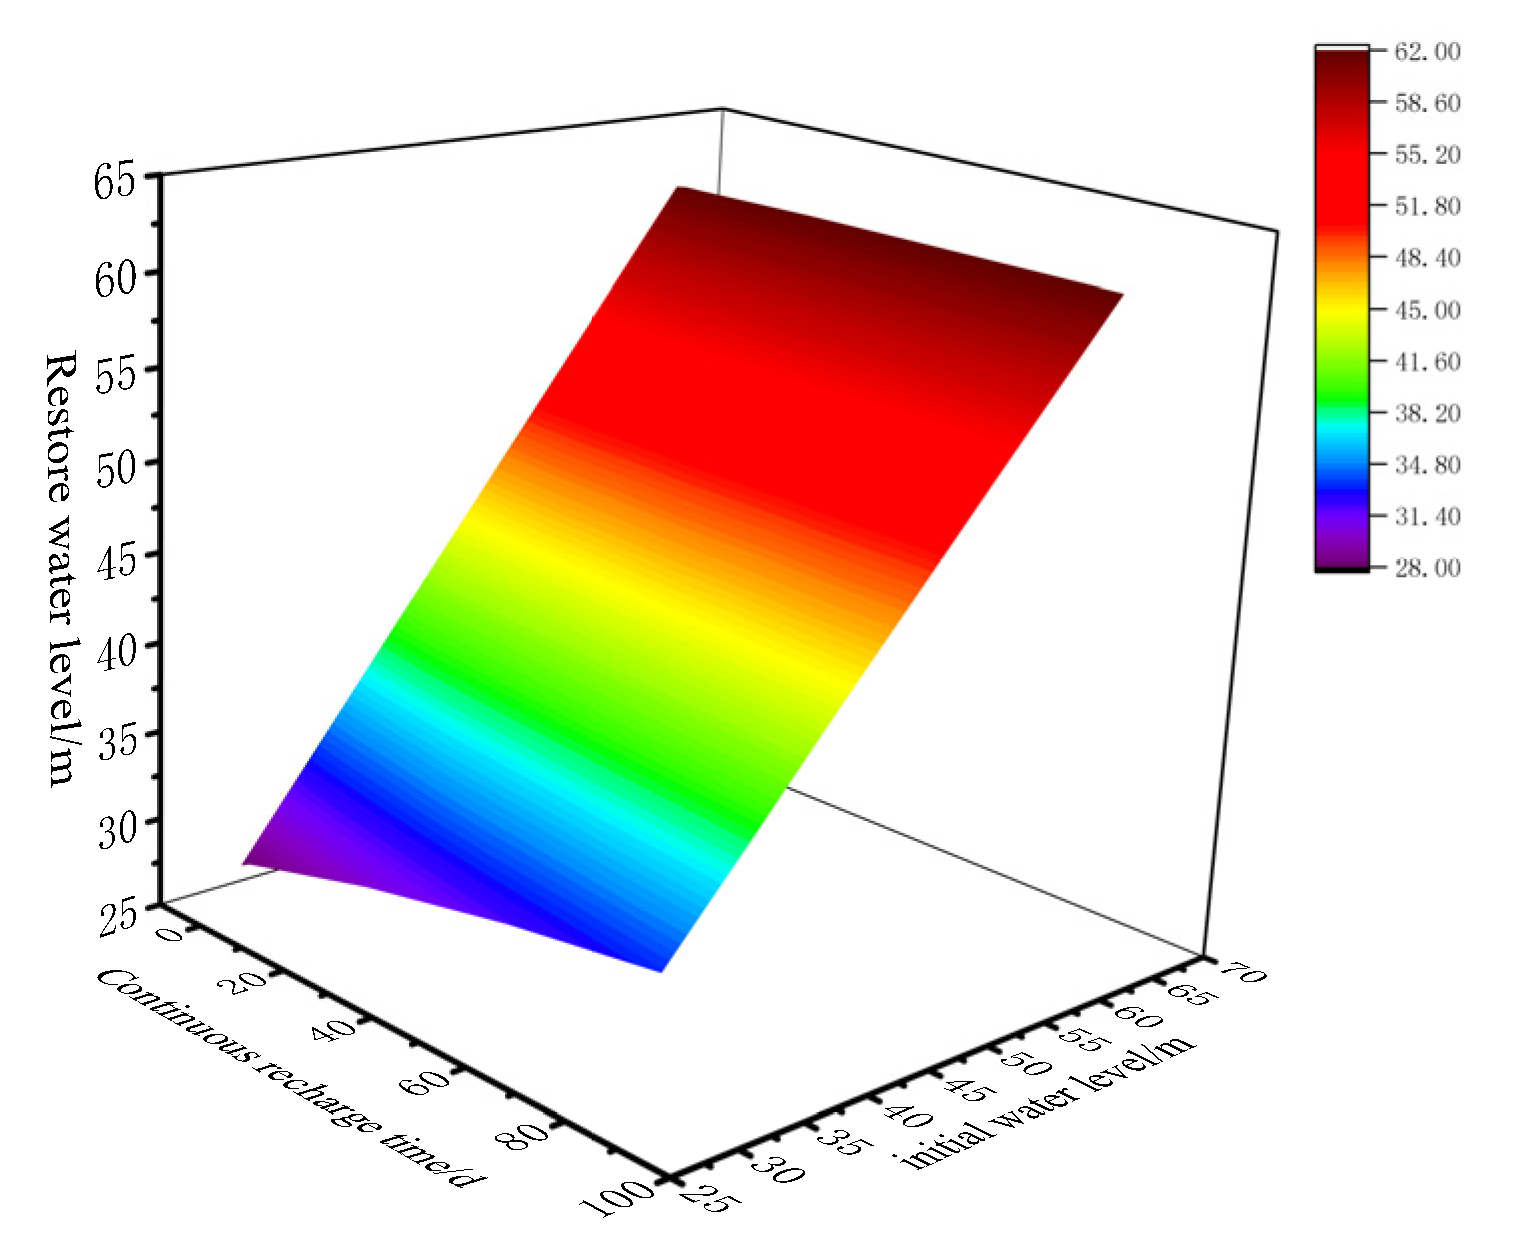
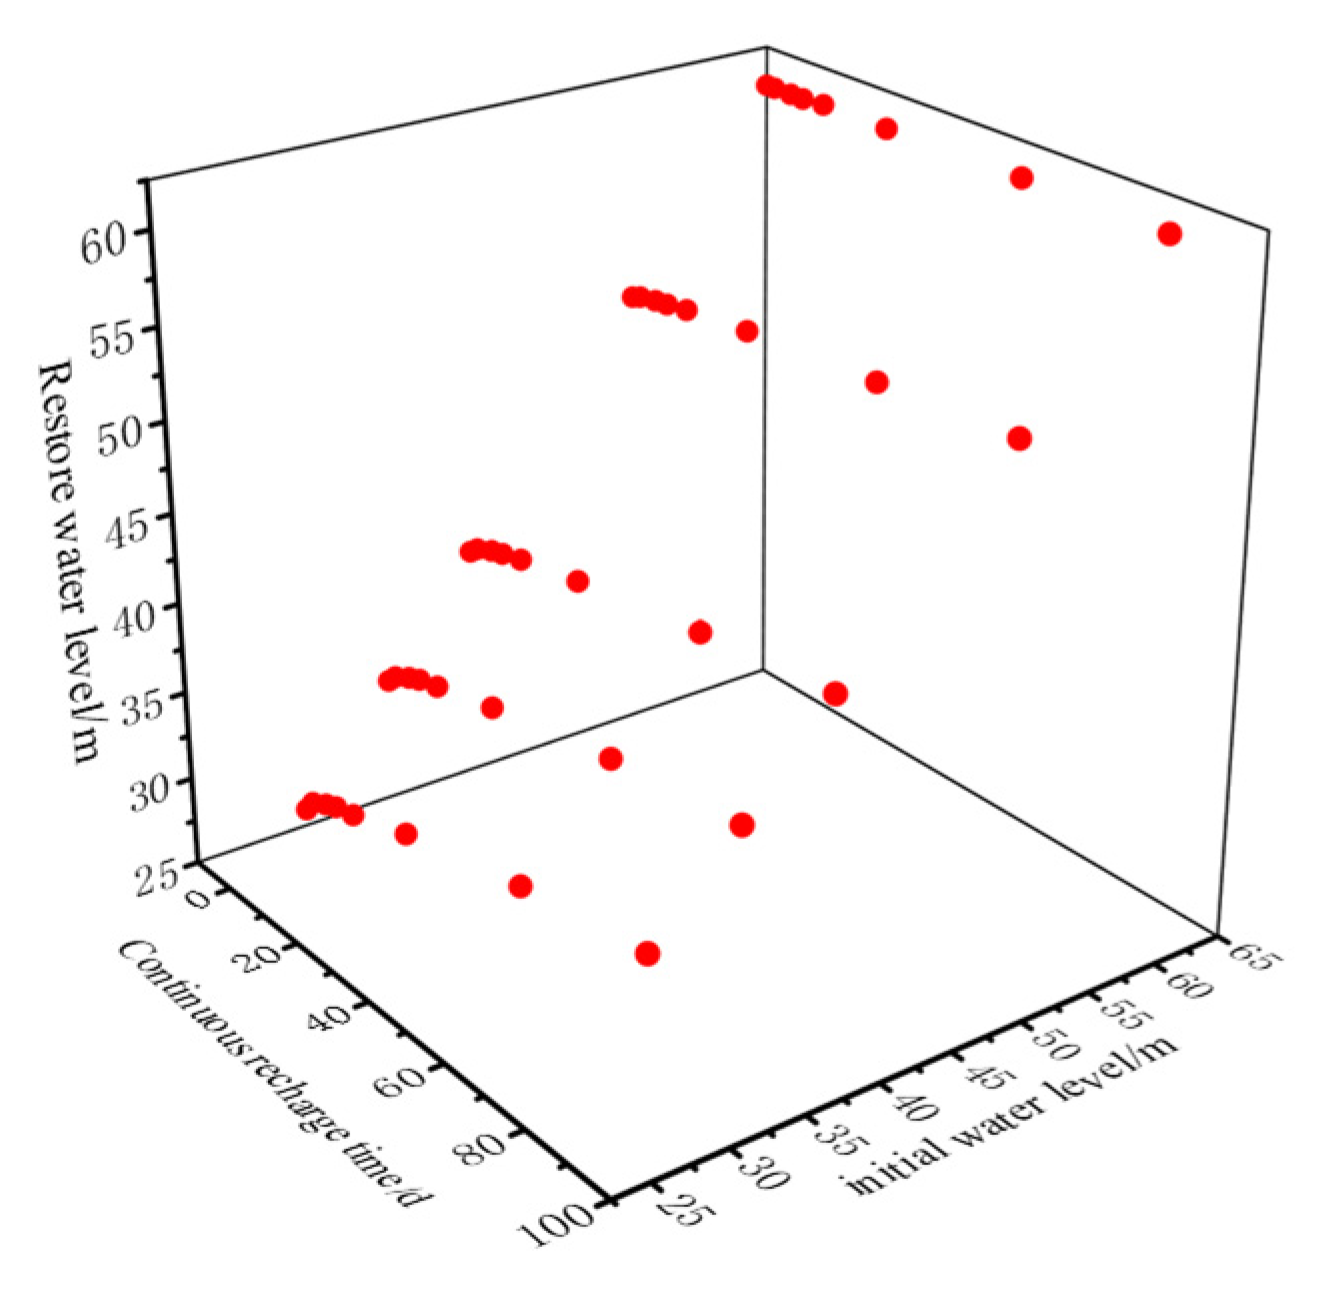
After recharging stops, the water level gradually recovers. When the well depth and permeability coefficient were determined to be 200 m and 150 m/d, respectively, the recovery of the water level under different recharge durations was calculated, and is shown in Figure 9. The recovery rate of well water level was fast in the initial stage, but slowed down rapidly as the recovery time increased and gradually approached 0. Similar to the pumping wells, when the water level recovery rate was below 0.05 m/d, the well water level was the recovery level. According to the working conditions in Table 4, the recovery water level results under the influence of the initial water level and the continuous recharge time, are shown in Figure 10. After parameter fitting, Equation (9) was obtained.
H r = 3.056 + 0.034 t + 0.937 h
where Hr is the recovery water level of the recharge well, m.
To summarize, the longer the continuous recharge time was, the higher the recovery water level was, which was positively correlated with the continuous recharge time. The lower the initial water level was before recharging, the lower the recovery water level. The recovery water level can be calculated after determining the continuous recharge time and the initial water level.
Since it takes a long time for the well water level to recover to the recovery water level, recharging efficiency is easily affected. After recharging had stopped, when the recovery time was 1 d, the recovery speed dropped to 1 m/d, and the water level at this time was not different from the recovery water level. In the working condition of Table 5, the recovered water level when the recovery time was 1 d is shown in Figure 11. After fitting the parameters in the figure, Equation (10) was obtained.
H 1 d = 4.264 + 0.037 t + 0.918 h
where H1d is the recovery water level at 1 d, m.

3.4. Analysis of Temperature Field Change Rule

The factors affecting temperature field changes mainly include the recharge flow rate, well depth, recharge water temperature, continuous recharge time and aquifer parameters. A working condition comparative analysis method was used to study temperature field changes in the following, as shown in Table 6.
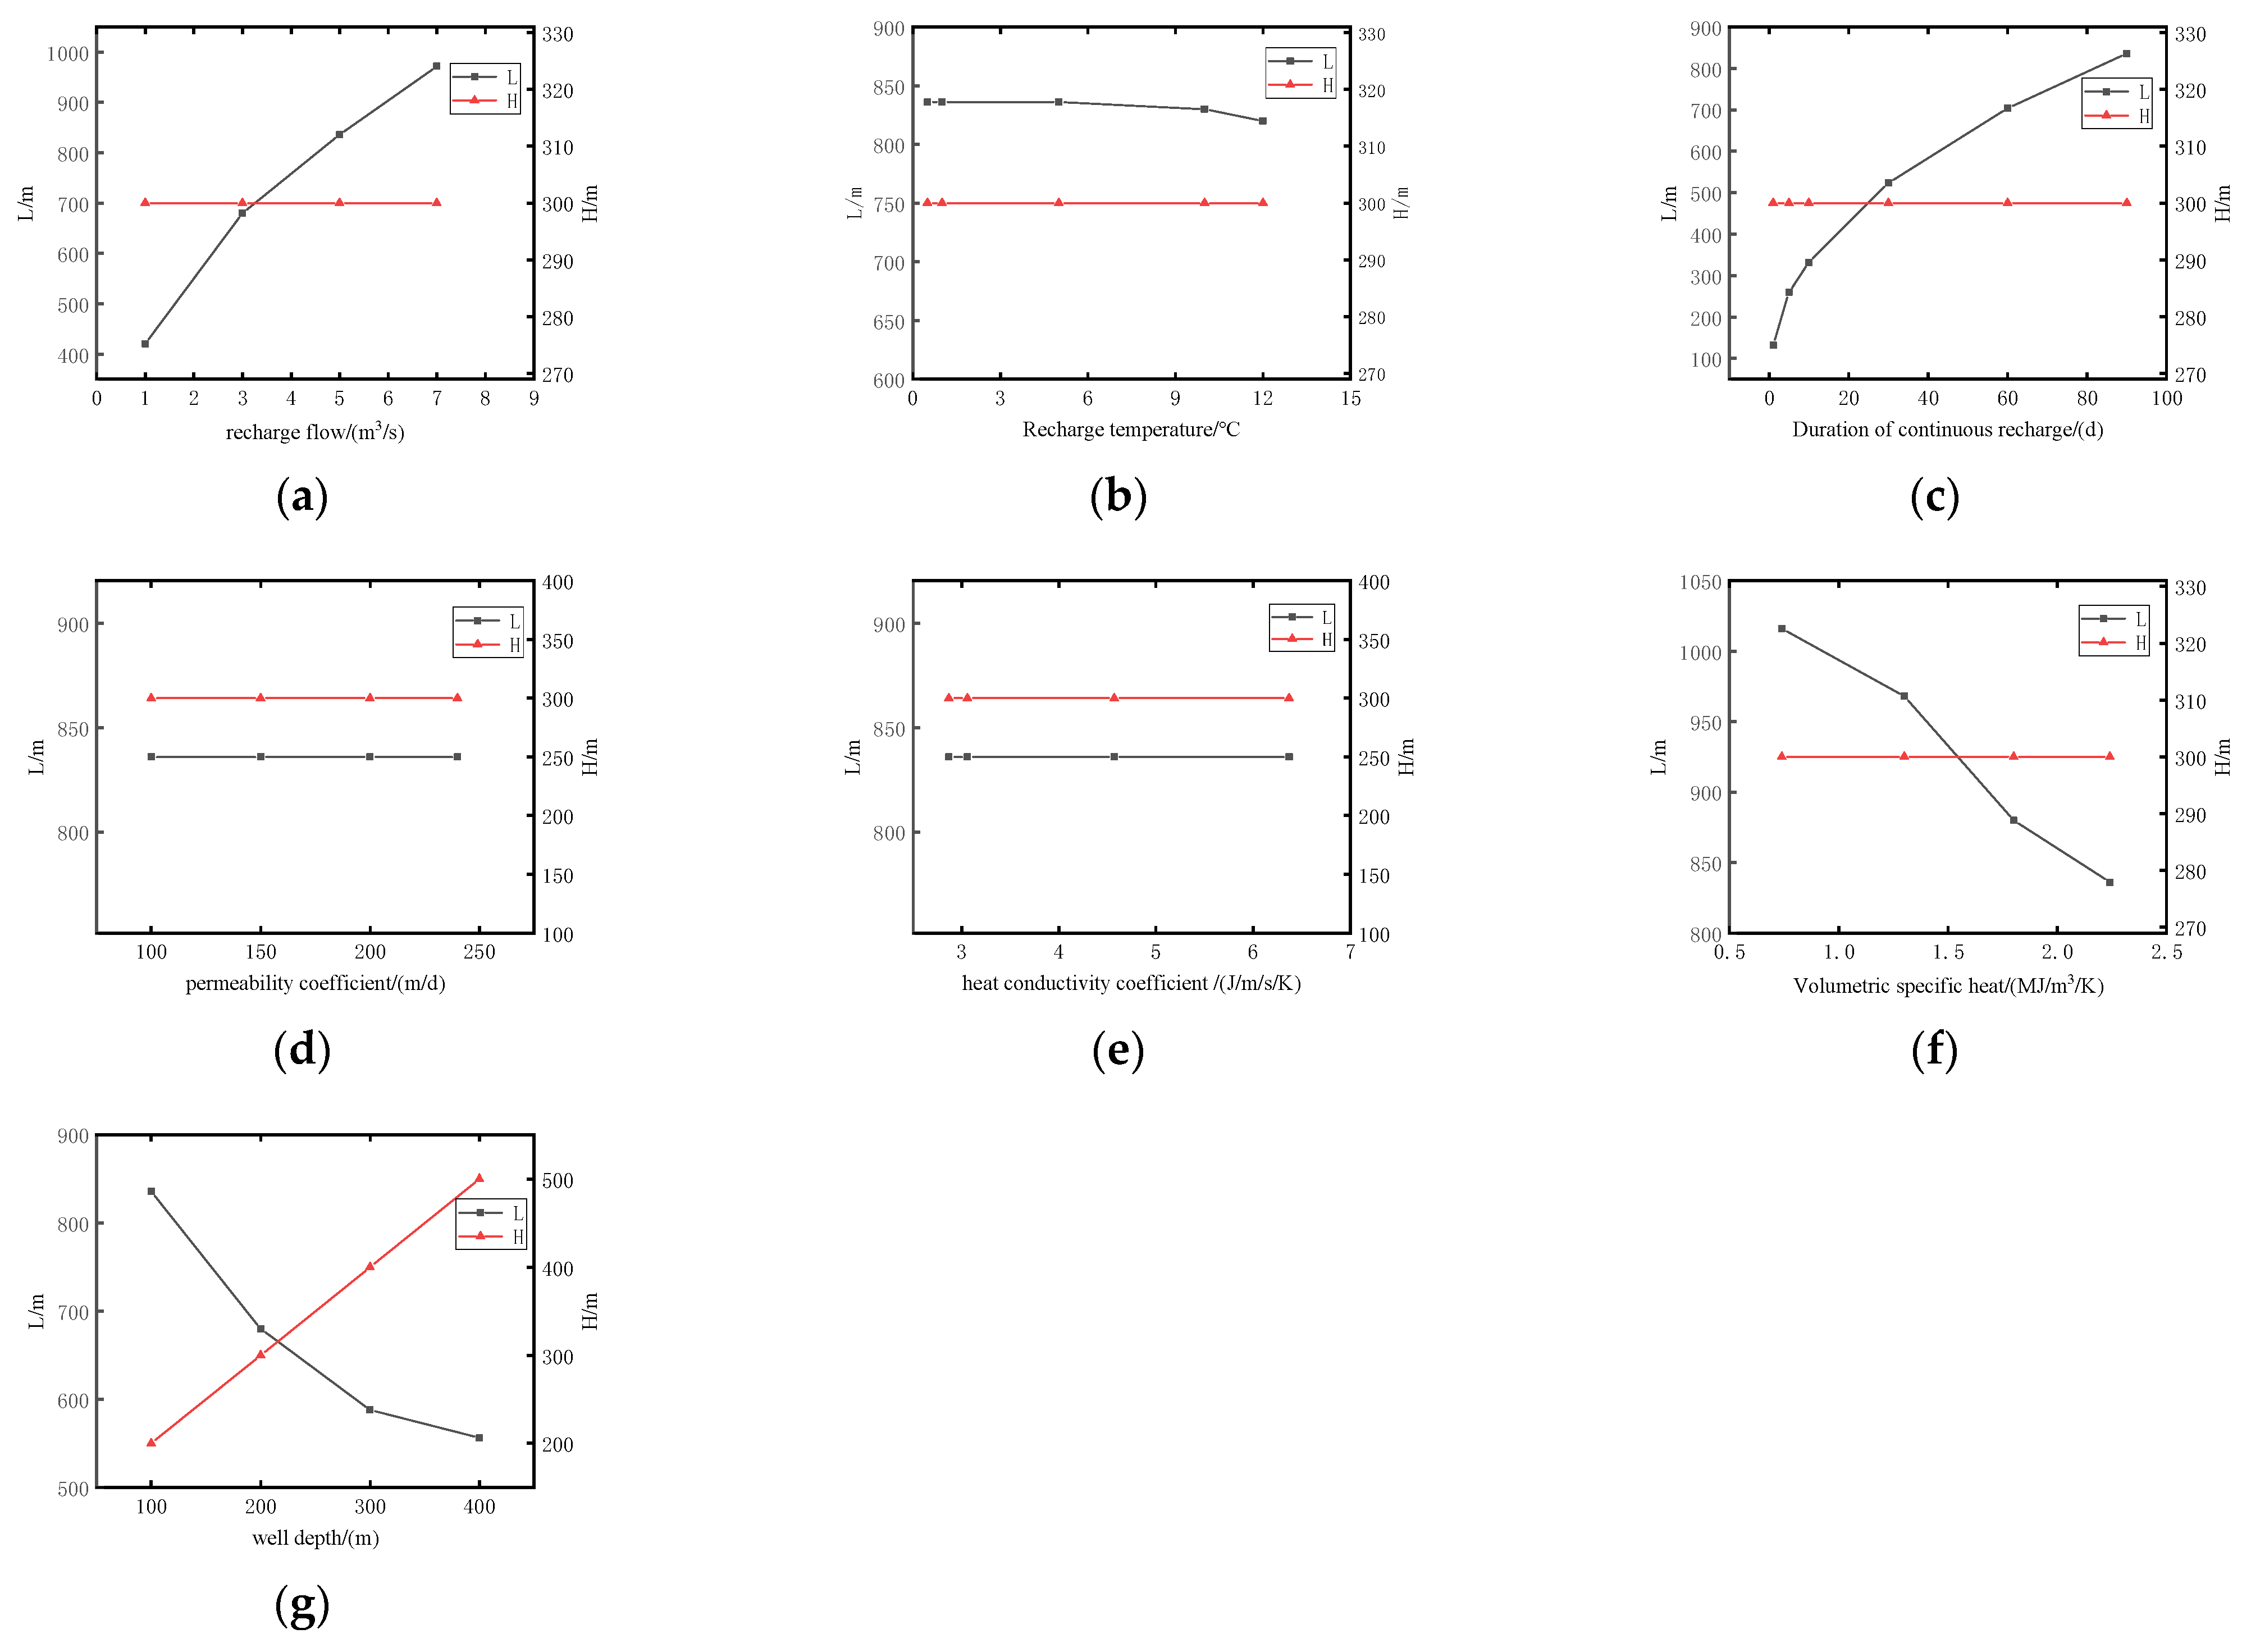
The changes of horizontal maximum diameter, L, and vertical maximum depth, H, under different influencing factors, are shown in Figure 12. In Figure 12a–g, the vertical maximum depth, H, only changed under the influence of well depth factor, and increased with the increase in well depth. The temperature influence was from the top of the well to the bottom of the well 100 m down, so H can be expressed by Equation (11). The horizontal maximum diameter, L, increased with the increase in the recharge flow and the continuous recharge time, but decreased with the increase in soil volume specific heat, well depth and recharge water temperature. Under the influence of permeability coefficient and soil thermal conductivity coefficient, L and H had almost no change, indicating that these two factors had almost no influence on temperature field change.
H = h w + 100
According to the definition, temperature change rate, K, is mainly related to the temperature difference and the horizontal maximum diameter, L. The temperature difference is the difference between the original temperature and recharge water temperature, which can be calculated by Equation (12):
k = 15 T w L
where Tw is the recharge water temperature, °C.
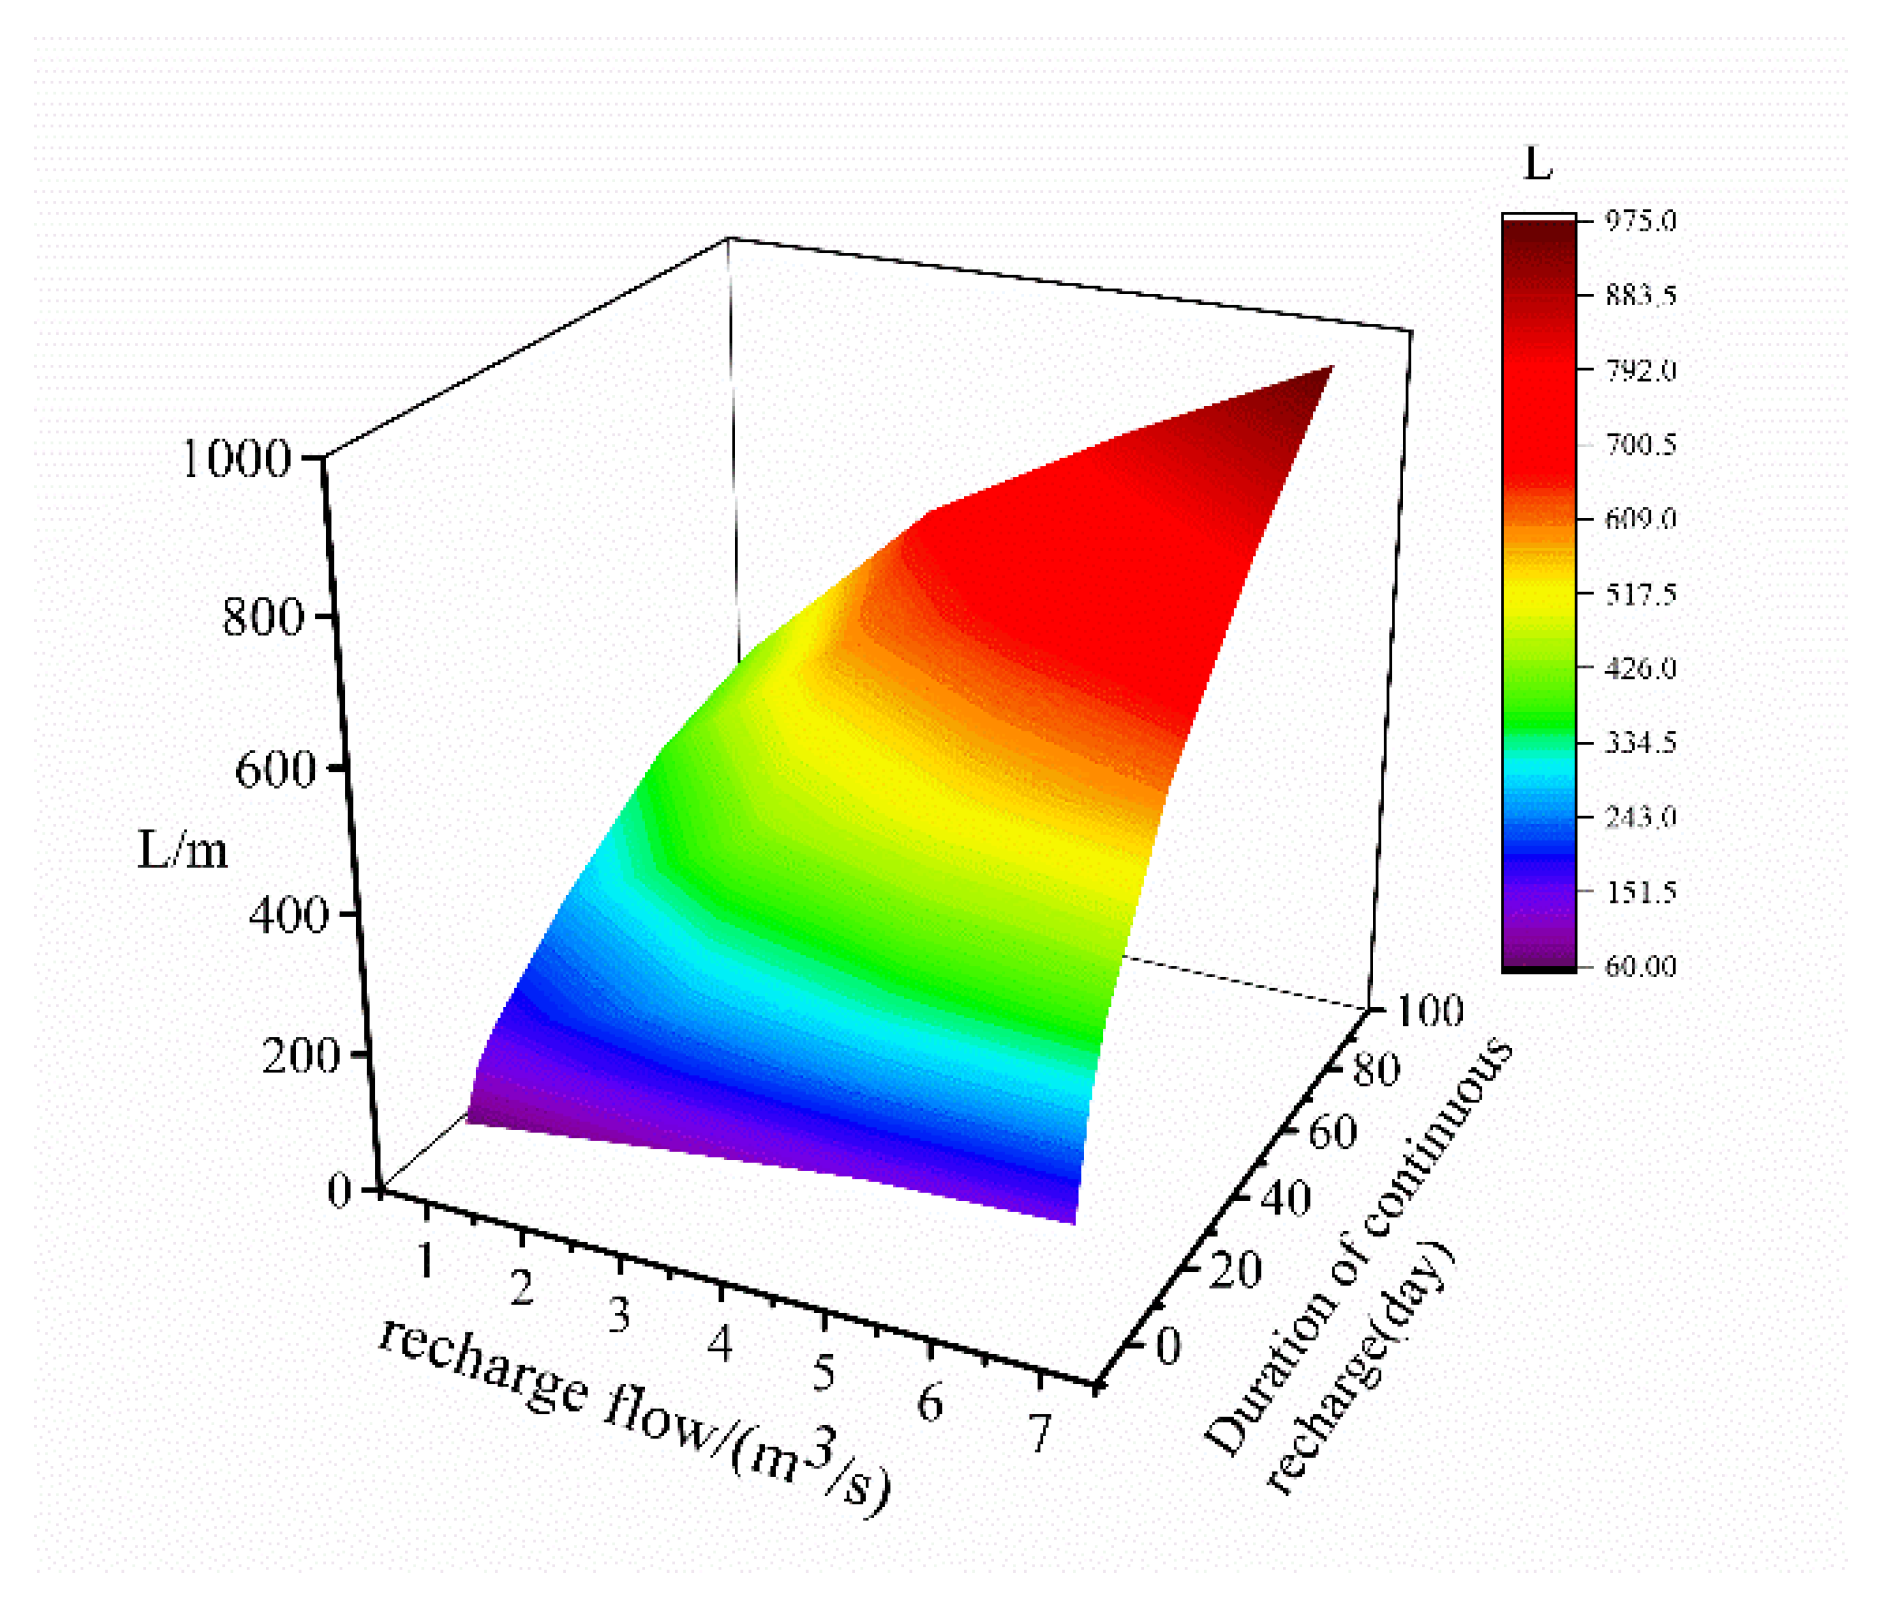
In practical engineering, the depth of the recharge well and the volumetric specific heat of the soil are usually determined. According to conditions 1 and 7 in Table 6, the influence of the recharge time and continuous recharge flow on the horizontal maximum diameter, L, was further analyzed, and the curve is shown in Figure 13. With the increase in recharge flow and continuous recharge time, L gradually increased, which was positively correlated. After parameter fitting, Equation (13) was obtained, and the determination coefficient R2 was 0.924.
L = 47.11 q + 6.033 d + 7.135
where q is the recharge flow, m3/s; and d is the continuous recharge time, d.

3.5. Temperature Field Recovery Analysis

Due to the small thermal conductivity of soil, the large specific volume heat and the slow recovery of the temperature field, it is easy to cause cold mass accumulation after recharge. Therefore, it is necessary to ensure that the temperature, before pumping in winter, is restored to the original temperature, so as to achieve a sustainable operation for many years. Figure 14 shows the recovery water temperature, before pumping in winter, under different recharge temperatures when the recharge flow was 1 m3/s, 3 m3/s, 5 m3/s, and 7 m3/s. As can be seen from the figure, the recharge water temperature should be at least higher than 14.8 °C under different recharge flow rates to restore the water temperature before the next pumping.

3.6. Optimization of Pumping—Recharging Scheme

In order to protect the local ecology, the timing of pumping and melting ice in winter and recharging in summer has already been adopted, and the temperature of recharging water should be above 14.8 °C. When the positions of the pumping well and the recharge well were determined, the well depth and the volumetric specific heat of the soil were also determined. At 200 m and 150 m/d, respectively, according to Formula (5), the pumping capacity decreased with the increase in the continuous pumping time; if water was pumped continuously during the glacial period, the pumping capacity would be at its lowest. Equation (8) shows that the recharge capacity decreased with the increase in the continuous recharge time, and the recharge capacity was the lowest for continuous recharge during the recharge period. After each pumping or recharging, the water level can quickly be recovered, and the pumping capacity and the recharging capacity are improved due to the recovery of the water level. Therefore, in order to improve the utilization efficiency of pumping wells and recharge wells, and maximize the total amount of water pumped during the ice period and the total amount of recharge during the recharge period, multiple short-term pumping or recharging can be used to optimize the total pumping and recharging.
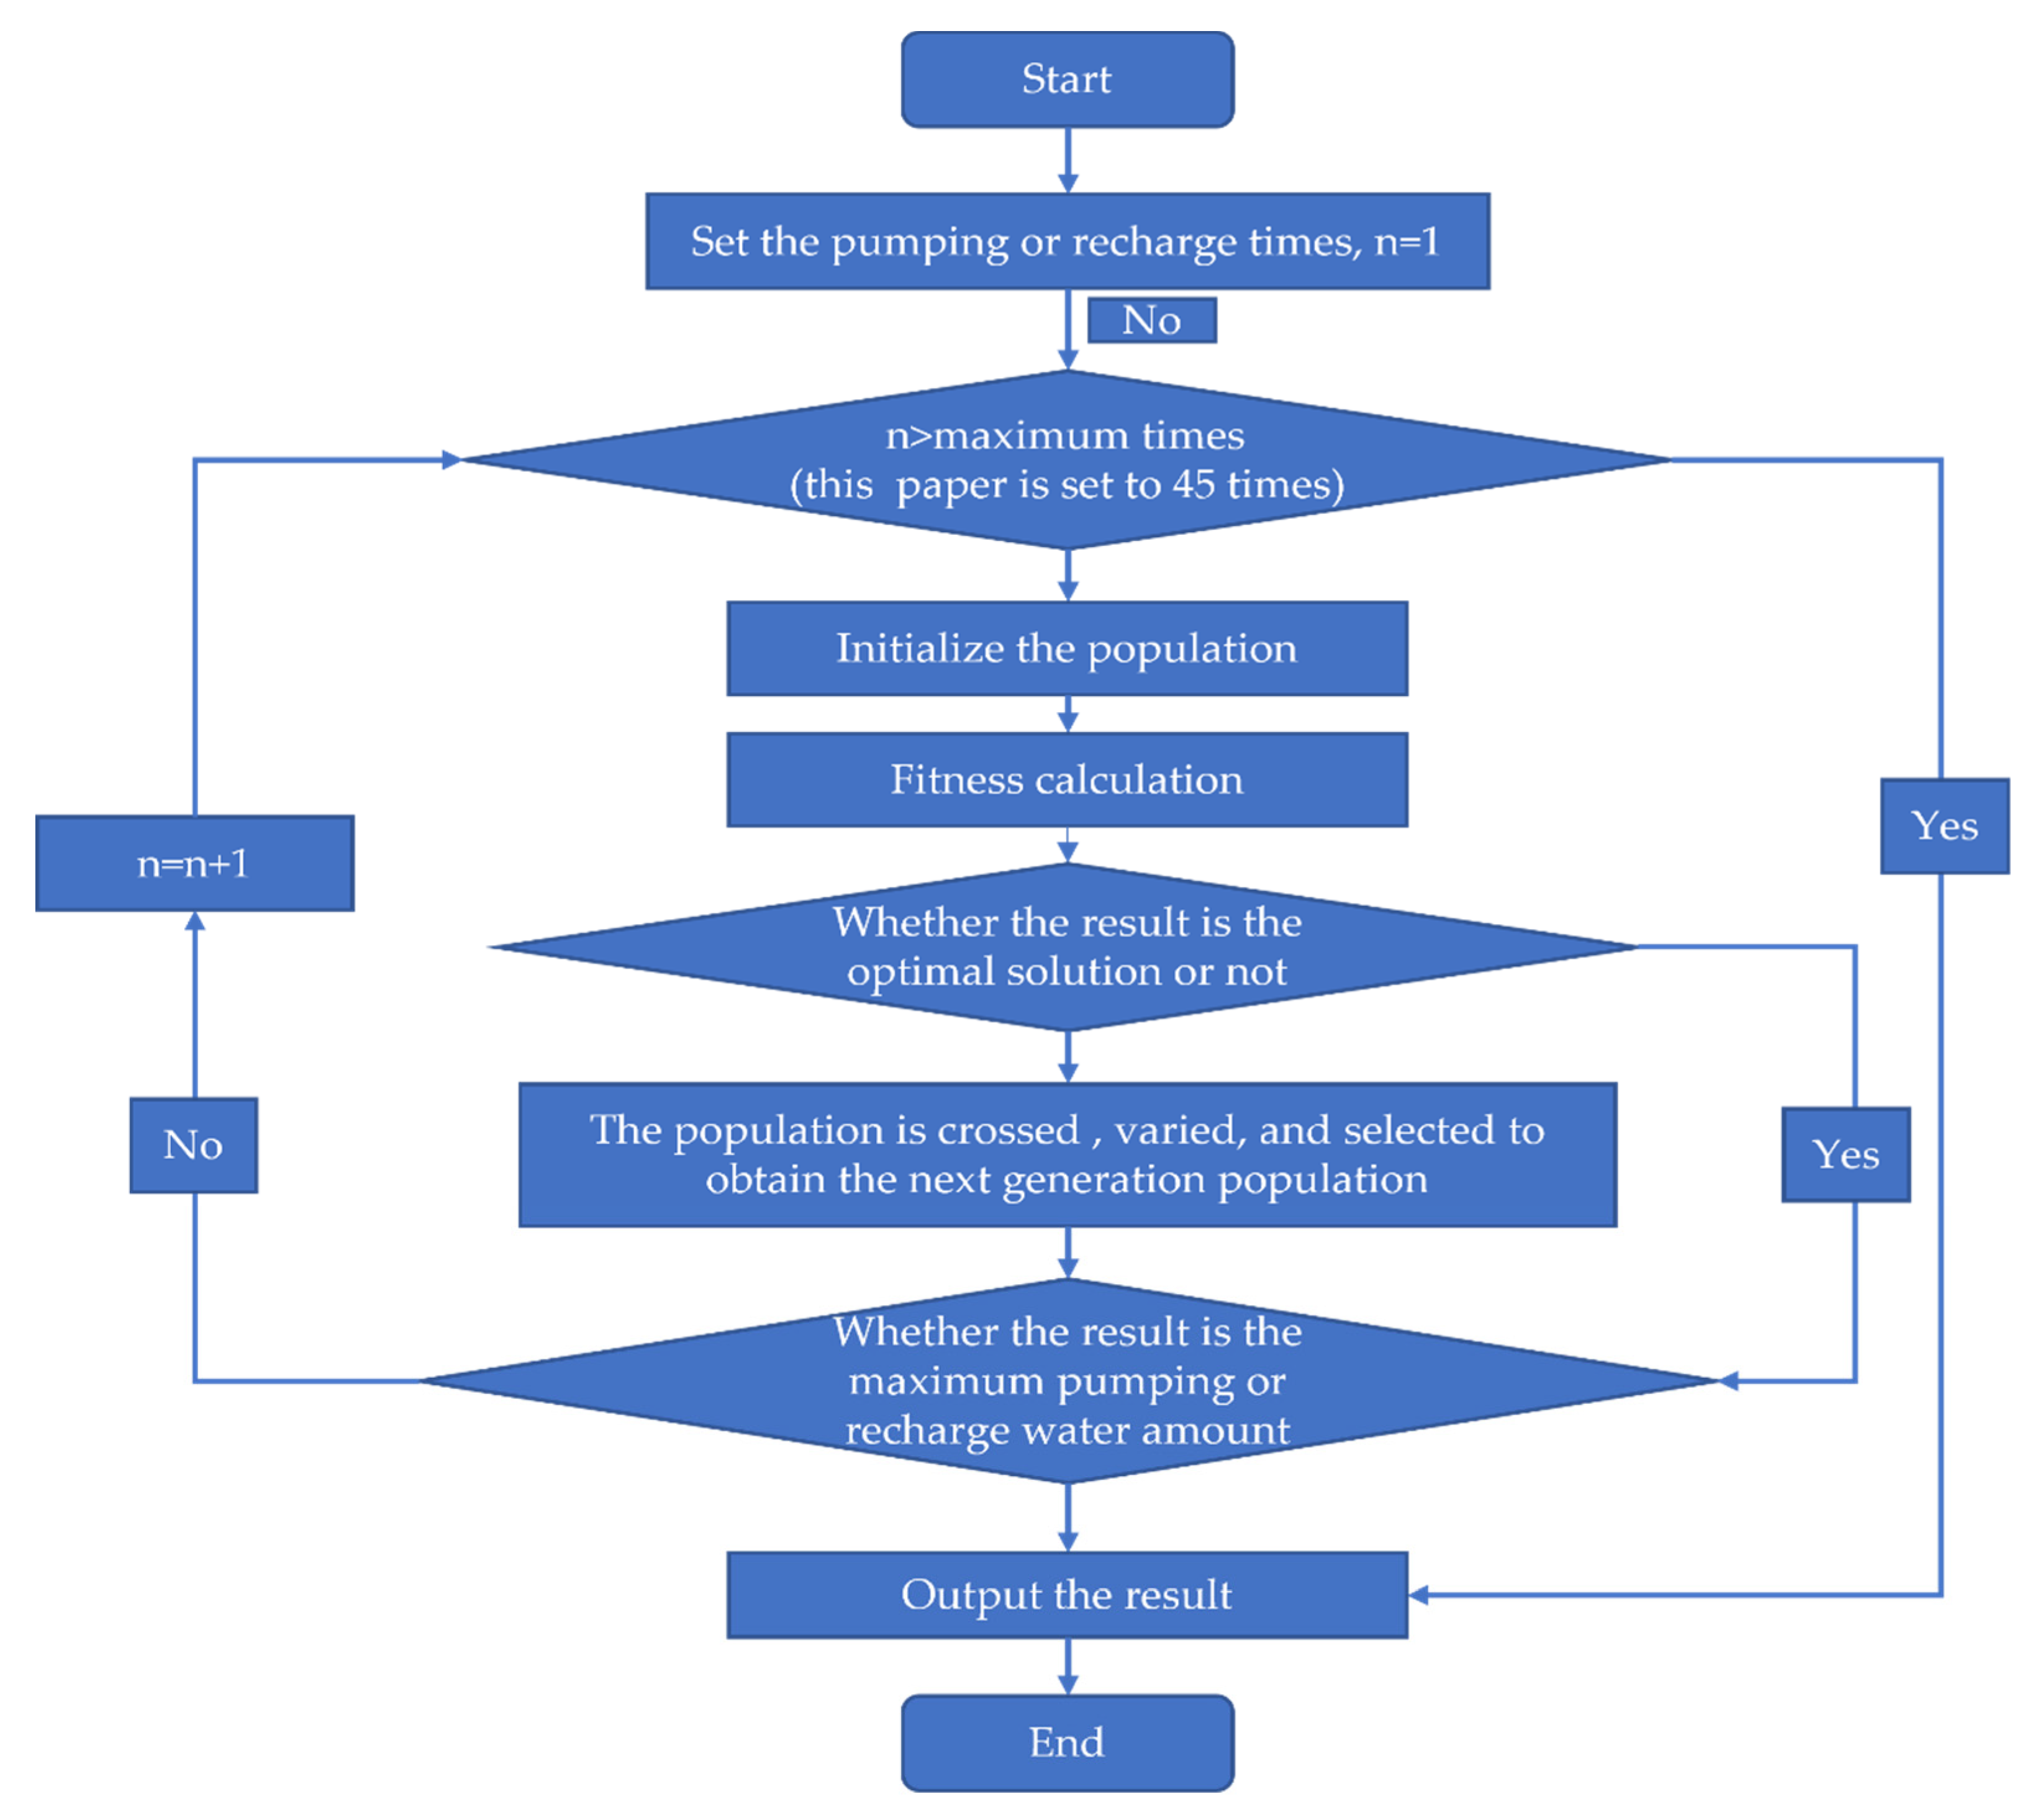
In this paper, a genetic algorithm was used to optimize the total amount of pumping and recharge water in a single well operation. A genetic algorithm is a relatively efficient, parallel and global research method, which searches for the optimal solution in the process of simulating natural evolution and survival of the fittest. Genetic manipulation mainly includes crossover, mutation and selection. The core content of a genetic algorithm is composed of five elements: parameter coding, initial population initialization, design fitness function, design genetic operation, and control parameter setting. In a genetic algorithm, first of all, a set of original data is randomly generated, and then the fitness of individuals in this group of the original population, to the environment, is judged. Individuals with higher fitness are left for genetic operation, and new populations are generated through crossover or mutation. In this way, the cycle continues, and gradually approaches the optimal solution.
The objective function of the maximum amount of water pumped during the 90-day ice period is shown in Equation (14), and the objective function of the maximum amount of recharge during the recharge period is shown in Equation (15). The specific calculation process is shown in Figure 15.
Q = max ( k i = 1 n q i t i )
Q i n = max ( k i = 1 n c i d i )
In the formula: Q is the maximum total pumping volume of the well during the operation period, m3; Qin is the maximum total recharge amount of the well group during the operation period, m3; n is the number of pumping times or recharge times during the operation period; and qi and ci are the pumping capacity at the i-th pumping time and the recharging capacity at the i-th recharging time, m3/s, respectively, which can be obtained from formulas (5) and (8). After each pumping and recharging, in order to prevent the recovery time process from affecting the pumping–recharging effect, a 1 d time was used for recovery, and the water level recovery can be obtained from Equations (7) and (9). ti and di are the continuous pumping time during the i-th pumping, and the continuous recharging time during the i-th recharge, d, respectively; k is the time unit conversion factor, 86,400; and i = 1, 2, 3, …, n.
During the pumping process, the total amount of pumped water cannot exceed the storage capacity of the underground reservoir. After the pumping well has pumped water many times, the total pumping time and recovery time does not exceed the total operation period, and the flow rate injected into the channel by the pumping well cannot be greater than the flow rate that the channel can bear. The constraints are as follows, in Equations (16)–(18):
r o u n d u p ( 1 n 1 ( t i + 1 ) + t n , 0 ) = T
q i < Q c
Q V r
In the formula: T is the operation period, which is 90 days; Qc is the maximum pumpable water flow, m3/s, which should be at least 52.4% of the design flow of the channel design flow [36]; and Vr is the maximum storage capacity of the underground reservoir, which is 253 million m3.
The recharge is also subject to similar constraints, and the constraints are as follows, in Equations (19)–(21):
r o u n d u p ( 1 n 1 ( d i + 1 ) + d n , 0 ) = T
c i Q d
Q i n V r
In the formula: T is the operation period, which is 90 days; and Qd is channel design flow, m3/s.
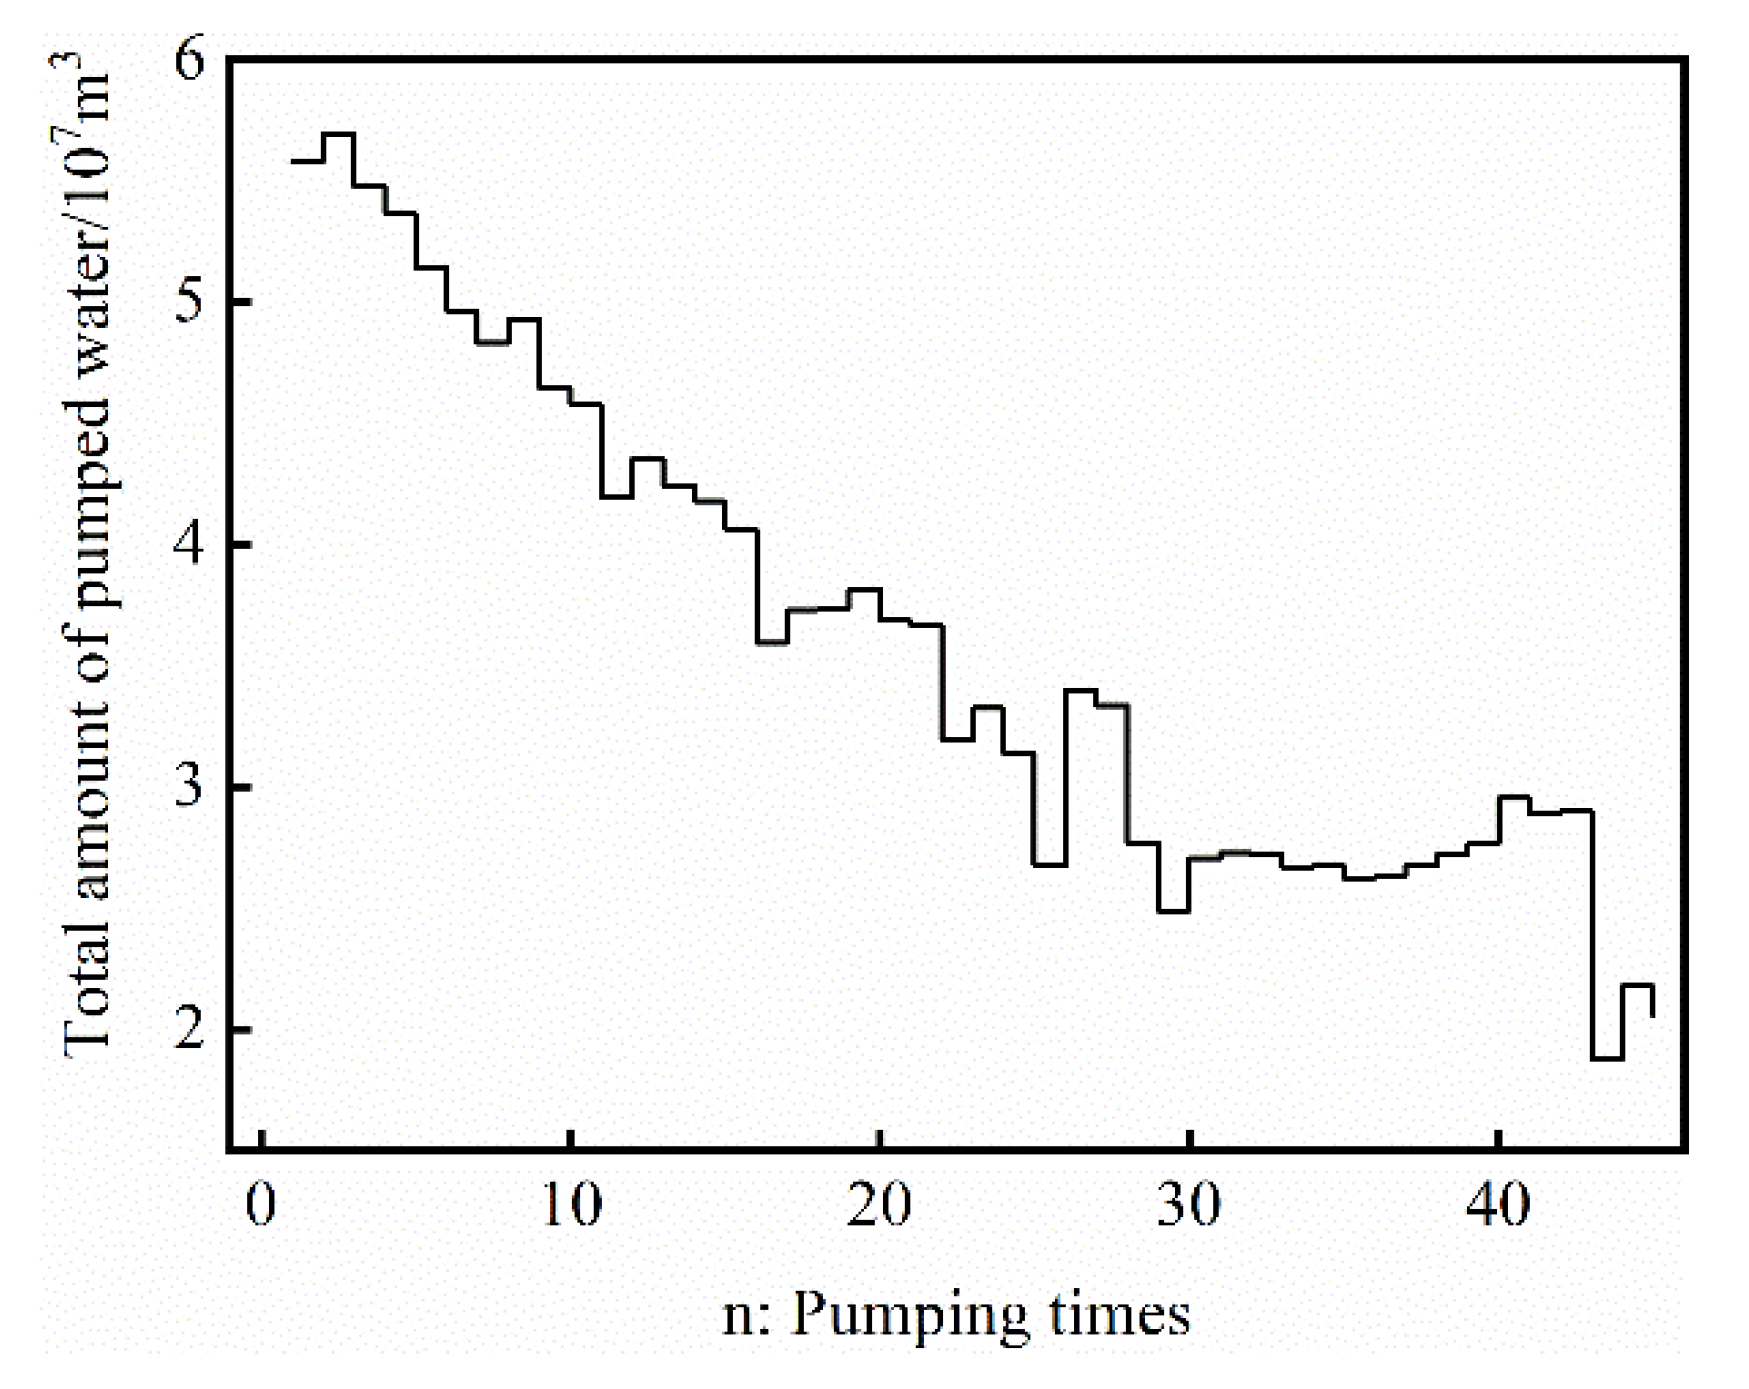
Assuming that the initial water level of the underground reservoir was the highest water level of 64 m during pumping, the genetic algorithm was used to optimize the objective function Formula (14). The maximum pumping volume that the pumping well could achieve during the operation period for different pumping times was calculated, as shown in Figure 16.
It can be seen from Figure 16, that when the number of pumping times was two and the recovery time of the pumping well was 1 d, the total pumping amount reached the maximum. The specific operation mode of a single well is shown in the Table 7. That is, the first pumping ran continuously for 57 d, then stopped pumping for 1 d to restore the water level, and then conducted the second pumping until the end of the ice period. At this time, the optimal amount of water pumping was 5.69 × 10⁷ m3. The total pumping amount increased by 1.1 × 10⁶ m3 compared with the continuous non-stop pumping in the whole ice period, in which the total pumping amount was 5.58 × 10⁷ m3.
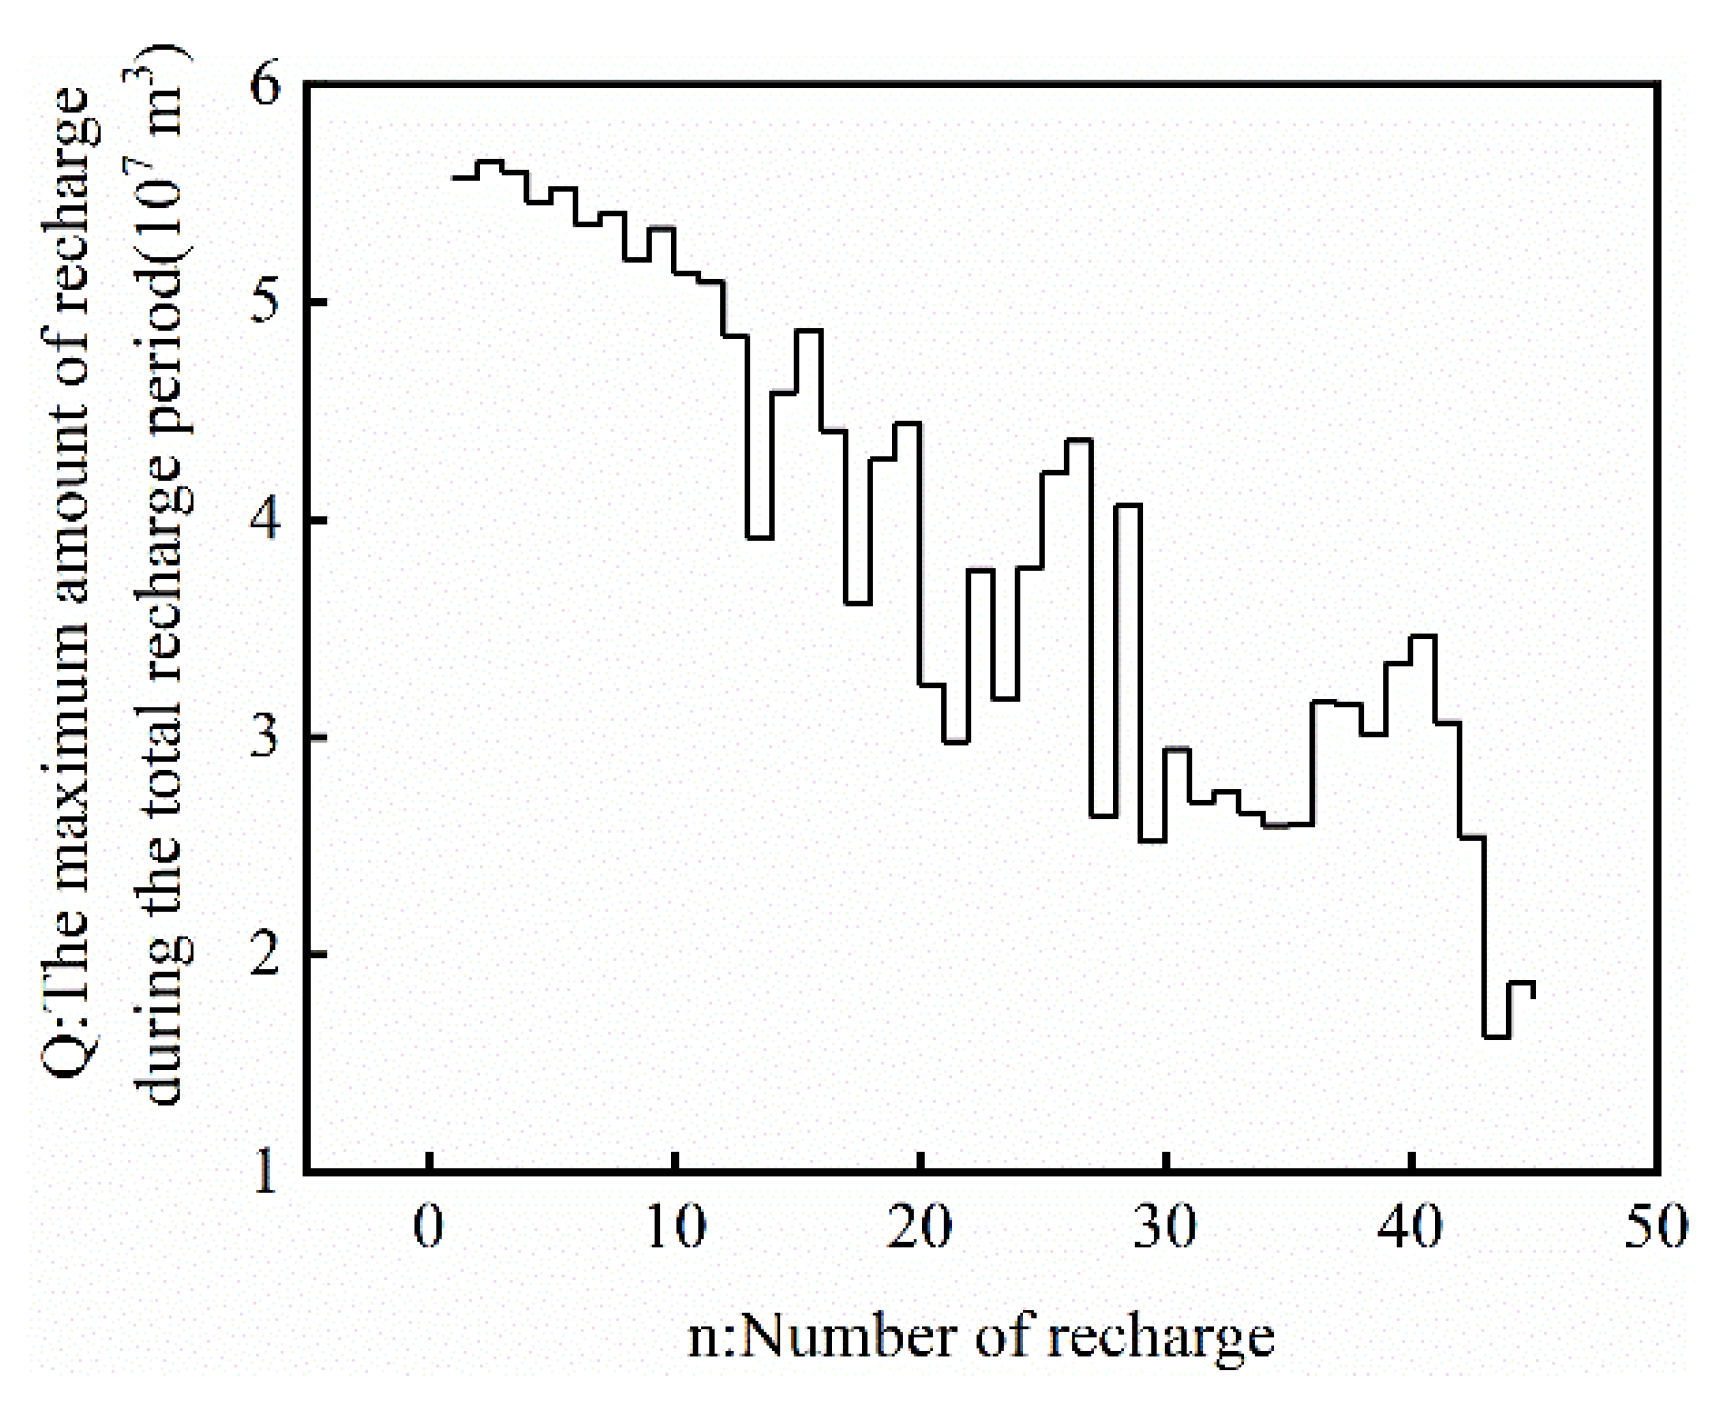
The genetic algorithm was then used to calculate recharging in summer by optimizing Formula (15), assuming that the initial water level of the groundwater reservoir was at the lowest water level of 27.7 m. After optimization, the maximum total amount of recharge that a single well could achieve during the recharge period when operating with different recharge times was calculated, and is shown in Figure 17.
As can be seen from Figure 17, when the number of recharges was two, the total amount of recharge reached the maximum, and the recovery time of the recharge well was 1 d. Under this scheme, the specific operation mode of a single recharge well is shown in Table 8. At this time, the optimal amount of water recharging was found to be 5.64 × 10⁷ m3. The total recharging amount increased by 7 × 10⁵ m3 compared with the continuous non-stop pumping in the whole ice period, for which the total pumping amount was 5.57 × 10⁷ m3.

3.7. Discussion

The technology of pumping well water to melt ice is mainly used in small and medium-sized channels. The required pumping flow is small, basically within 15 m3/s. Therefore, the need for water pumping is small and has little impact on the amount of groundwater, and has had almost no research to rectify the problem. Scholars have mostly carried out relevant research on the ice-melting situation of channels, and there has been little research on groundwater ecology. In this paper, the technology of pumping well water to melt was applied to a large-scale water transfer project such as the South-to-North Water Diversion Project, where the channel flow is above 100 m3/s, which requires a large pumping flow. If recovery is not considered, it is easy to cause the groundwater level to decrease and affect the local ecology. It can be seen from the above research that in order to ensure the sustainable application of pumping water to melt ice, and to ensure the balance of groundwater water volume and heat throughout the year, the system should be operated by pumping water in winter, and recharging with water with a temperature above 14.8 °C in summer. The fluctuation of the water level of the underground reservoir would then be within the appropriate range and can avoid affecting the ecology.
The limitation of the fluctuation range of the water level affects the pumping capacity and the recharge capacity. In this article, the quantitative relationship between pumping capacity and recharging capacity, and initial water level, well depth, permeability coefficient, and continuous pumping/recharging time, is shown in Equations (5) and (7). Therefore, in the actual pumping–recharging process, the location and depth of the well can be analyzed according to engineering needs. At the same time, the water level of the underground reservoir is known before the arrival of the ice period, and the duration of continuous pumping and recharge is determined so as to provide a quantitative relationship reference for pumping scheduling in practical projects.
During the recharge process, the recharge flow rate, recharge water temperature, well depth, recharge time, and volume specific heat will all have an impact on the temperature field, while the thermal conductivity and permeability coefficient have little impact on the temperature field, these results being the same as the study by Tang et al. [19,37]. However, previous studies only analyzed the impact of different factors on the temperature field. Our research has summarized the influence of a variety of factors on the temperature field, and obtained the quantitative relationship between them, which is shown in Equations (11)–(13).
According to Section 3.5, when the continuous pumping of a single well cannot meet the thermal energy demand of the channel, the operation method will be optimized, and the pumping water obtained by Section 3.2, Section 3.3 and Section 3.4 will be the best amount of water pumping in the water level, the total amount of water pumping, and the best total return irrigation total. Based on the quantitative relationship of the pumping–recharge capacity and water level recovery obtained in Section 3.2, Section 3.3 and Section 3.4, the optimal total pumping capacity and the optimal total recharge capacity are optimized. When the number of pumping or recharge times are two or three times, compared with the continuous pumping or recharge of the single well, the total amount of water pumping and the amount of recharge are optimized, thereby achieving the efficient use of wells.
In the research process of this paper, the water level and temperature of the reservoir in the process of pumping well water to melt ice were mainly discussed. In the future, further research can focus on the ice melting of the channel and the change of water temperature along the channel. In terms of pumping and recharge scheduling, further analysis is required according to the actual situation.

4. Conclusions

In order to ensure the sustainability of pumping well water to melt ice, and to prevent ecological damage, pumping and recharging is carried out on the basis of ensuring that the quality of pumped and irrigated water meets the national drinking water standards. First, it is necessary to control the fluctuation range of the water level and the range of the water temperature change. This paper considers the Baiquan Underground Reservoir in establishing a three-dimensional hydrothermal coupling numerical model. The effects of different influencing factors on the pumping and recharge capacities and water level recovery of pumping and recharge wells, were analyzed by numerical simulation. Second, the variation law of aquifer temperature field and temperature recovery under the influence of different factors after recharge, was analyzed. After ensuring the sustainable operation of pumping well water to melt ice, the single well pumping–recharging scheme was further optimized during the operation period. The following conclusions were drawn:
(1)
Under the limitation of water level fluctuation, a quantitative estimation formula of pumping capacity and well depth, permeability coefficient, continuous pumping time and initial water level was established. After the pumping stopped, the water level recovered quickly, and a formula for calculating the recovery water level, the initial water level, and the duration of continuous pumping was established;
(2)
Under the limitation of water level fluctuation, a quantitative estimation formula of recharge capacity and well depth, permeability coefficient, continuous recharge time and initial water level was established. The quantitative estimation formula between the restored water level after recharging, the initial water level, and the continuous recharging time was established;
(3)
The variation characteristics of the temperature field after recharge were analyzed. It was affected by recharge flow rate, recharge water temperature, initial water level, well depth and specific heat of soil volume, but had no relation with permeability coefficient and soil thermal conductivity coefficient. The quantitative relationships between L, H, k, and the above influencing factors, were established;
(4)
Under different recharge flow rates, it was determined that the recharge water temperature in summer must be at least 14.8 °C to restore the recharge water temperature to the original temperature, before water pumping in winter, to ensure the sustainable operation of water pumping and ice melting;
(5)
A genetic algorithm was used to optimize the operation mode of single well recharge and pumping. When the number of pumping times was two, the pumping well was stopped for 1 day to restore the water level; the total amount of water pumped during the ice period reached the maximum, which was 5.69 × 10⁷ m3. Compared with the continuous pumping during the ice period, the pumping volume was increased by 1.1 × 10⁶ m3. When the number of recharges was two, and the recharge well was stopped for 1 day to restore the water level, the total amount of recharge during the recharge period reached the maximum, which was 5.64 × 10⁷ m3. Compared with continuous recharge during the recharge period, the recharge amount was increased by 7 × 10⁵ m3.

Author Contributions

Conceptualization, Y.Z. and X.Z.; methodology, Y.Z.; software, Y.Z.; validation, Y.Z., X.Z. and J.L.; formal analysis, Y.Z.; investigation, Y.Z.; resources, Y.Z.; data curation, Y.Z.; writing—original draft preparation, Y.Z.; writing—review and editing, Y.Z.; visualization, Y.Z.; supervision, X.Z.; project administration, X.Z.; funding acquisition, J.L. All authors have read and agreed to the published version of the manuscript.

Funding

This research was funded by National Natural Science Foundation of China (51909186, U20A20316).

Institutional Review Board Statement

Not applicable.

Informed Consent Statement

Not applicable.

Data Availability Statement

Not applicable.

Conflicts of Interest

The authors declare no conflict of interest.

Appendix A

Table A1. Maximum pumping flow of different working conditions.
Maximum Pumping Flow (m3/s)Well Depth (m)Permeability Coefficient (m/d)Initial Water Level (m)Continuous Pumping Time (d)
4.21001506490
7.42001506490
8.93001506490
10.34001506490
11.35001506490
11.96001506490
7.72001506460
8.032001506430
8.49200150647
8.66200150643
8.9200150641
5.22001006490
9.22002006490
10.72002406490
6.12001505890
4.92001505290
2.52001504090
0.42001503090
6.42001505860
6.72001505830
7.1200150587
7.2200150583
7.4200150581
5.12001505260
5.32001505230
5.6200150527
5.8200150523
5.9200150521
2.62001504060
2.82001504030
2.9200150407
2.95200150403
3200150401
0.452001503060
0.52001503030
0.53200150307
0.54200150303
0.56200150301
Table A2. Maximum pumping flow of different working conditions.
Maximum Recharge Flow (m3/s)Well Depth (m)Permeability Coefficient (m/d)Initial Water Level (m)Continuous Recharge Time (d)
4.210015027.790
7.420015027.790
8.930015027.790
10.340015027.790
11.350015027.790
11.960015027.790
7.720015027.760
8.0320015027.730
8.4920015027.77
8.6620015027.73
8.920015027.71
5.220010027.790
9.220020027.790
10.720024027.790
6.120015033.790
4.920015039.790
2.520015051.790
0.420015061.790
6.420015033.760
6.720015033.730
7.120015033.77
7.220015033.73
7.420015033.71
5.120015039.760
5.320015039.730
5.620015039.77
5.820015039.73
5.920015039.71
2.620015051.760
2.820015051.730
2.920015051.77
2.9520015051.73
320015051.71
0.4520015061.760
0.520015061.730
0.5320015061.77
0.5420015061.73
0.5620015061.71

References

  1. Lian, J.J.; Zhao, X. Research on spacing of double cable net ice stopper. South–North Water Divers. Water Sci. Technol. 2012, 10, 1–3. [Google Scholar]
  2. Mu, X.P.; Cao, P.; Chen, W.X.; Wu, Y.; Wen, R. Review on ice-free water transport technology and factors influencing the regulation of ice-water two-phase flow force in wide and shallow channels during glacial period. Water Power Energy Sci. 2016, 34, 132–136. [Google Scholar]
  3. Wang, F.; Wu, Y.H.; Ma, Y.J.; Zhang, G.Q. Application and discussion of pumping and deicing technology for Hongshanzui Cascade Hydropower Station. Henan Water Conserv. South–North Water Transf. 2009, 7, 111–112. [Google Scholar]
  4. ASHRAE. Geothermal Energy. In Ashrae Handbook HVAC Applications, American Society of Heating; Refrigerating and Air-Conditioning Engineers, Inc.: Atlanta, Georgia, 2003; pp. 11–28. [Google Scholar]
  5. IEA Heat Pump Centre. Ground-source Heat Pump Systems. In IEA Heat Pump Centre Newsletter; The Netherlands, 2005; pp. 23–24. Available online: https://www.osti.gov/etdeweb/biblio/420071 (accessed on 9 July 2022).
  6. Vieira, A.; Alberdi-Pagola, M.; Christodoulides, P.; Javed, S.; Loveridge, F.; Nguyen, F.; Cecinato, F.; Maranha, J.; Florides, G.; Prodan, I.; et al. Characterisation of Ground Thermal and Thermo-Mechanical Behaviour for Shallow Geothermal Energy Applications. Energies 2017, 10, 2044. [Google Scholar] [CrossRef]
  7. Liu, X.P.; Zhang, Z.S.; Chen, R. The Method of improving power Generation Capacity of cascade diversion hydropower stations. China Water Energy Electrif. 2007, 9, 38–43. [Google Scholar]
  8. Mitchell, M.S.; Spitler, J.D. Open-loop direct surface water cooling and surface water heat pump systems—A review. Hvac R Res. 2013, 19, 125–140. [Google Scholar]
  9. Huang, J.L.; Zong, Q.L.; Liu, Z.J.; Zhu, M.M.; Wang, Z.J.; Zhang, X.Y. Prototype test and analysis of water-melting ice-melting in water diversion channels in alpine regions. J. Shihezi Univ. 2014, 32, 392–396. [Google Scholar]
  10. Qin, Z.P.; Zong, Q.L.L.; Tian, Y.; Wu, S.J. Ice-pumping and ice-melting experiment of water diversion open channels in cold regions. J. Wuhan Univ. 2017, 50, 168–173. [Google Scholar]
  11. Zhu, M.M.; Liu, H.F.; Zong, Z.L. Experimental study on water temperature variation in water diversion channels in alpine regions. J. Shihezi Univ. 2015, 33, 239–243. [Google Scholar]
  12. Zheng, T.G.; Zong, Q.L.; Sun, S.K.; Wu, S.J. Attenuation law of water temperature along the process of pumping and melting ice channel in alpine region: Taking Hongshanzui Hydropower Station as an example. Adv. Water Sci. 2018, 29, 667–676. [Google Scholar]
  13. Wu, S.G.; Zong, Q.L.; Zheng, T.G.; Wang, Z.J.; Liu, Z.J. Three-dimensional simulation of water temperature changes in water diversion channels of multiple ice-melting wells in alpine regions and optimal arrangement of well groups. Chin. J. Agric. Eng. 2017, 33, 130–137. [Google Scholar]
  14. Wu, S.G. Process Simulation of Water Temperature Changes in Diversion Channels under the Condition of Pumping Water and Melting Ice; Shihezi University: Shihezi, China, 2017. [Google Scholar]
  15. Hao, G.Z. Analysis of drinking water protection in karst areas in western Xingtai City. In Proceedings of the Academic Exchange Conference on Building Technology and Management, Beijing, China, May 2016; pp. 199–200. [Google Scholar]
  16. Chen, T. Research on Optimization and Adjustment of Karst Water Source Protection Areas in Xingtai City; China University of Geosciences: Beijing, China, 2021. [Google Scholar]
  17. Si, P.Y. Research on Water Quality Evaluation and Algae Changes of Main Canals in the Middle Route of the South-to-North Water Diversion Project (Hebei Section); Hebei Agricultural University: Baoding, China, 2020. [Google Scholar]
  18. Sun, J.; Han, P.L.; Wang, C.; Xin, X.K.; Lei, J.S.; Yin, W. Comprehensive evaluation of the water quality of the main canals in the middle route of the South-to-North Water Diversion Project. South–North Water Divers. Water Conserv. Sci. Technol. 2019, 17, 102–112. [Google Scholar]
  19. Tang, W. Research on Water Conveyance Technology in Glacial Period by Recycling Geothermal Energy; Jinan University: Jinan, China, 2019. [Google Scholar]
  20. Jin, X.H.; Fan, Y.M.; Duan, H.; Yang, J.; Song, C.J.; Jia, Q.; Hu, Y.W. Spatial and temporal response analysis of groundwater level in Yinchuan Plain to unified water regulation in the Yellow River Basin. Chin. J. Water Resour. Hydraul. Eng. 2021, 32, 45–51. [Google Scholar]
  21. Wang, L.; Mao, H.T.; Yan, X.J.; Huang, F.; Lin. Influence of “prevent-intercept-conduct” seepage control in Pingyuan Reservoir on the groundwater level behind the dam. Chin. J. Water Resour. Hydraul. Eng. 2020, 31, 254–260. [Google Scholar]
  22. Shang, H.M.; Wang, W.K.; Duan, L.; Huo, C.Y. Simulation analysis of groundwater regulation based on ecological water level in the northern foot of the Tianshan Mountains. Soil Water Conserv. Res. 2014, 21, 144–147. [Google Scholar]
  23. Zhai, J.Q.; Liu, K.; Zhao, Y.; Dong, Y.Y.; Wang, L.Z.; Jiang, S. Research progress on groundwater level regulation methods and models in oasis in arid regions. Hydrology 2021, 41, 1–7. [Google Scholar]
  24. Cimmino, M.; Eslami-Nejad, P. A simulation model for solar assisted shallow ground heat exchangers in series arrangement. Energy Build. 2016, 157, 227–246. [Google Scholar] [CrossRef]
  25. Chen, W.F.; Du, S.H.; Chen, L.; Yuan, M.L. Correlation analysis of main controlling factors of groundwater temperature under the influence of water source heat pump. Chin. J. Water Resour. Water Eng. 2017, 28, 5. [Google Scholar]
  26. Chai, F.X.; Pan, S.B.; Shi, W.X.; Li, L. Karst groundwater simulation and scheme adjustment in Baiquan Springs, Xingtai. Hydrogeol. Eng. Geol. 2016, 43, 17–21. [Google Scholar]
  27. Borelli, M.; Pavlin, B. Approach to the problem of the underground water leakage from the storage in karst regions. In Dubrovnik Symposium; Hydrologie des Roches Fissures: Paris, France, 1965. [Google Scholar]
  28. Yang, W. Numerical Simulation of Groundwater in Western Jilin Based on Feflow; Jilin University: Changchun, China, 2007. [Google Scholar]
  29. Xue, Y.Q.; Xie, C.H. Numerical Simulation of Groundwater; Science Press: Beijing, China, 2007. [Google Scholar]
  30. Yuan, Z.Q. Evaluation of shallow geothermal resources and potential in Xingtai urban area. Green Sci. Technol. 2017, 10, 162–165. [Google Scholar]
  31. Lei, X.D.; Hu, S.B.; Li, J.; Yang, Q.H.; Han, Y.D.; Jiang, G.Z.; Zheng, J. Characteristics of thermophysical properties of bedrock formations in Beijing area. Adv. Geophys. 2018, 33, 1814–1823. [Google Scholar]
  32. Zheng, J.; Chen, X.; Zhang, Z.C. Hydrogeological parameters of dual medium in southern karst area estimated by pumping test method. Eng. Investig. 2014, 42, 42–46. [Google Scholar]
  33. Ren, Z.L.; Lu, M.; Sun, X.S. Numerical simulation of karst groundwater in Huixian Wetland. South–North Water Transf. Water Conserv. Sci. Technol. 2020, 18, 157–164. [Google Scholar]
  34. Joran, D.R.; Clauser, C.; Marquart, G.; Pechnig, R. Statistically reliable petrophysical properties of potential reservoir rocks for geothermal energy use and their relation to lithostratigraphy and rock composition: The NE Rhenish Massif and the Lower Rhine Embayment (Germany). Geothermics 2015, 53, 413–428. [Google Scholar] [CrossRef]
  35. Xin, S.L.; Wang, J.L.; Dou, H.P.; Wang, Y.; Zhang, J.; He, Y.Q. Experiment and analysis on influencing factors of rock thermophysical properties in buried hill reservoir. Miner. Rock 2014, 34, 102–107. [Google Scholar]
  36. Li, C.X.; Duan, W.G.; Lu, M.L.; Huang, M.H.; Teng, S.F. Research on water temperature and air temperature thresholds for the evolution of ice regime along the middle line of the South-to-North Water Diversion Project. Water Conserv. Sci. Cold Reg. Eng. 2022, 5, 4–8. [Google Scholar]
  37. Sun, J. Research on the Suitable Area of Groundwater Source Heat Pump in Shijiazhuang City and the Characteristic Change of Temperature Field of Aquifer; Hebei University of Geosciences: Shijiazhuang, China, 2020. [Google Scholar]
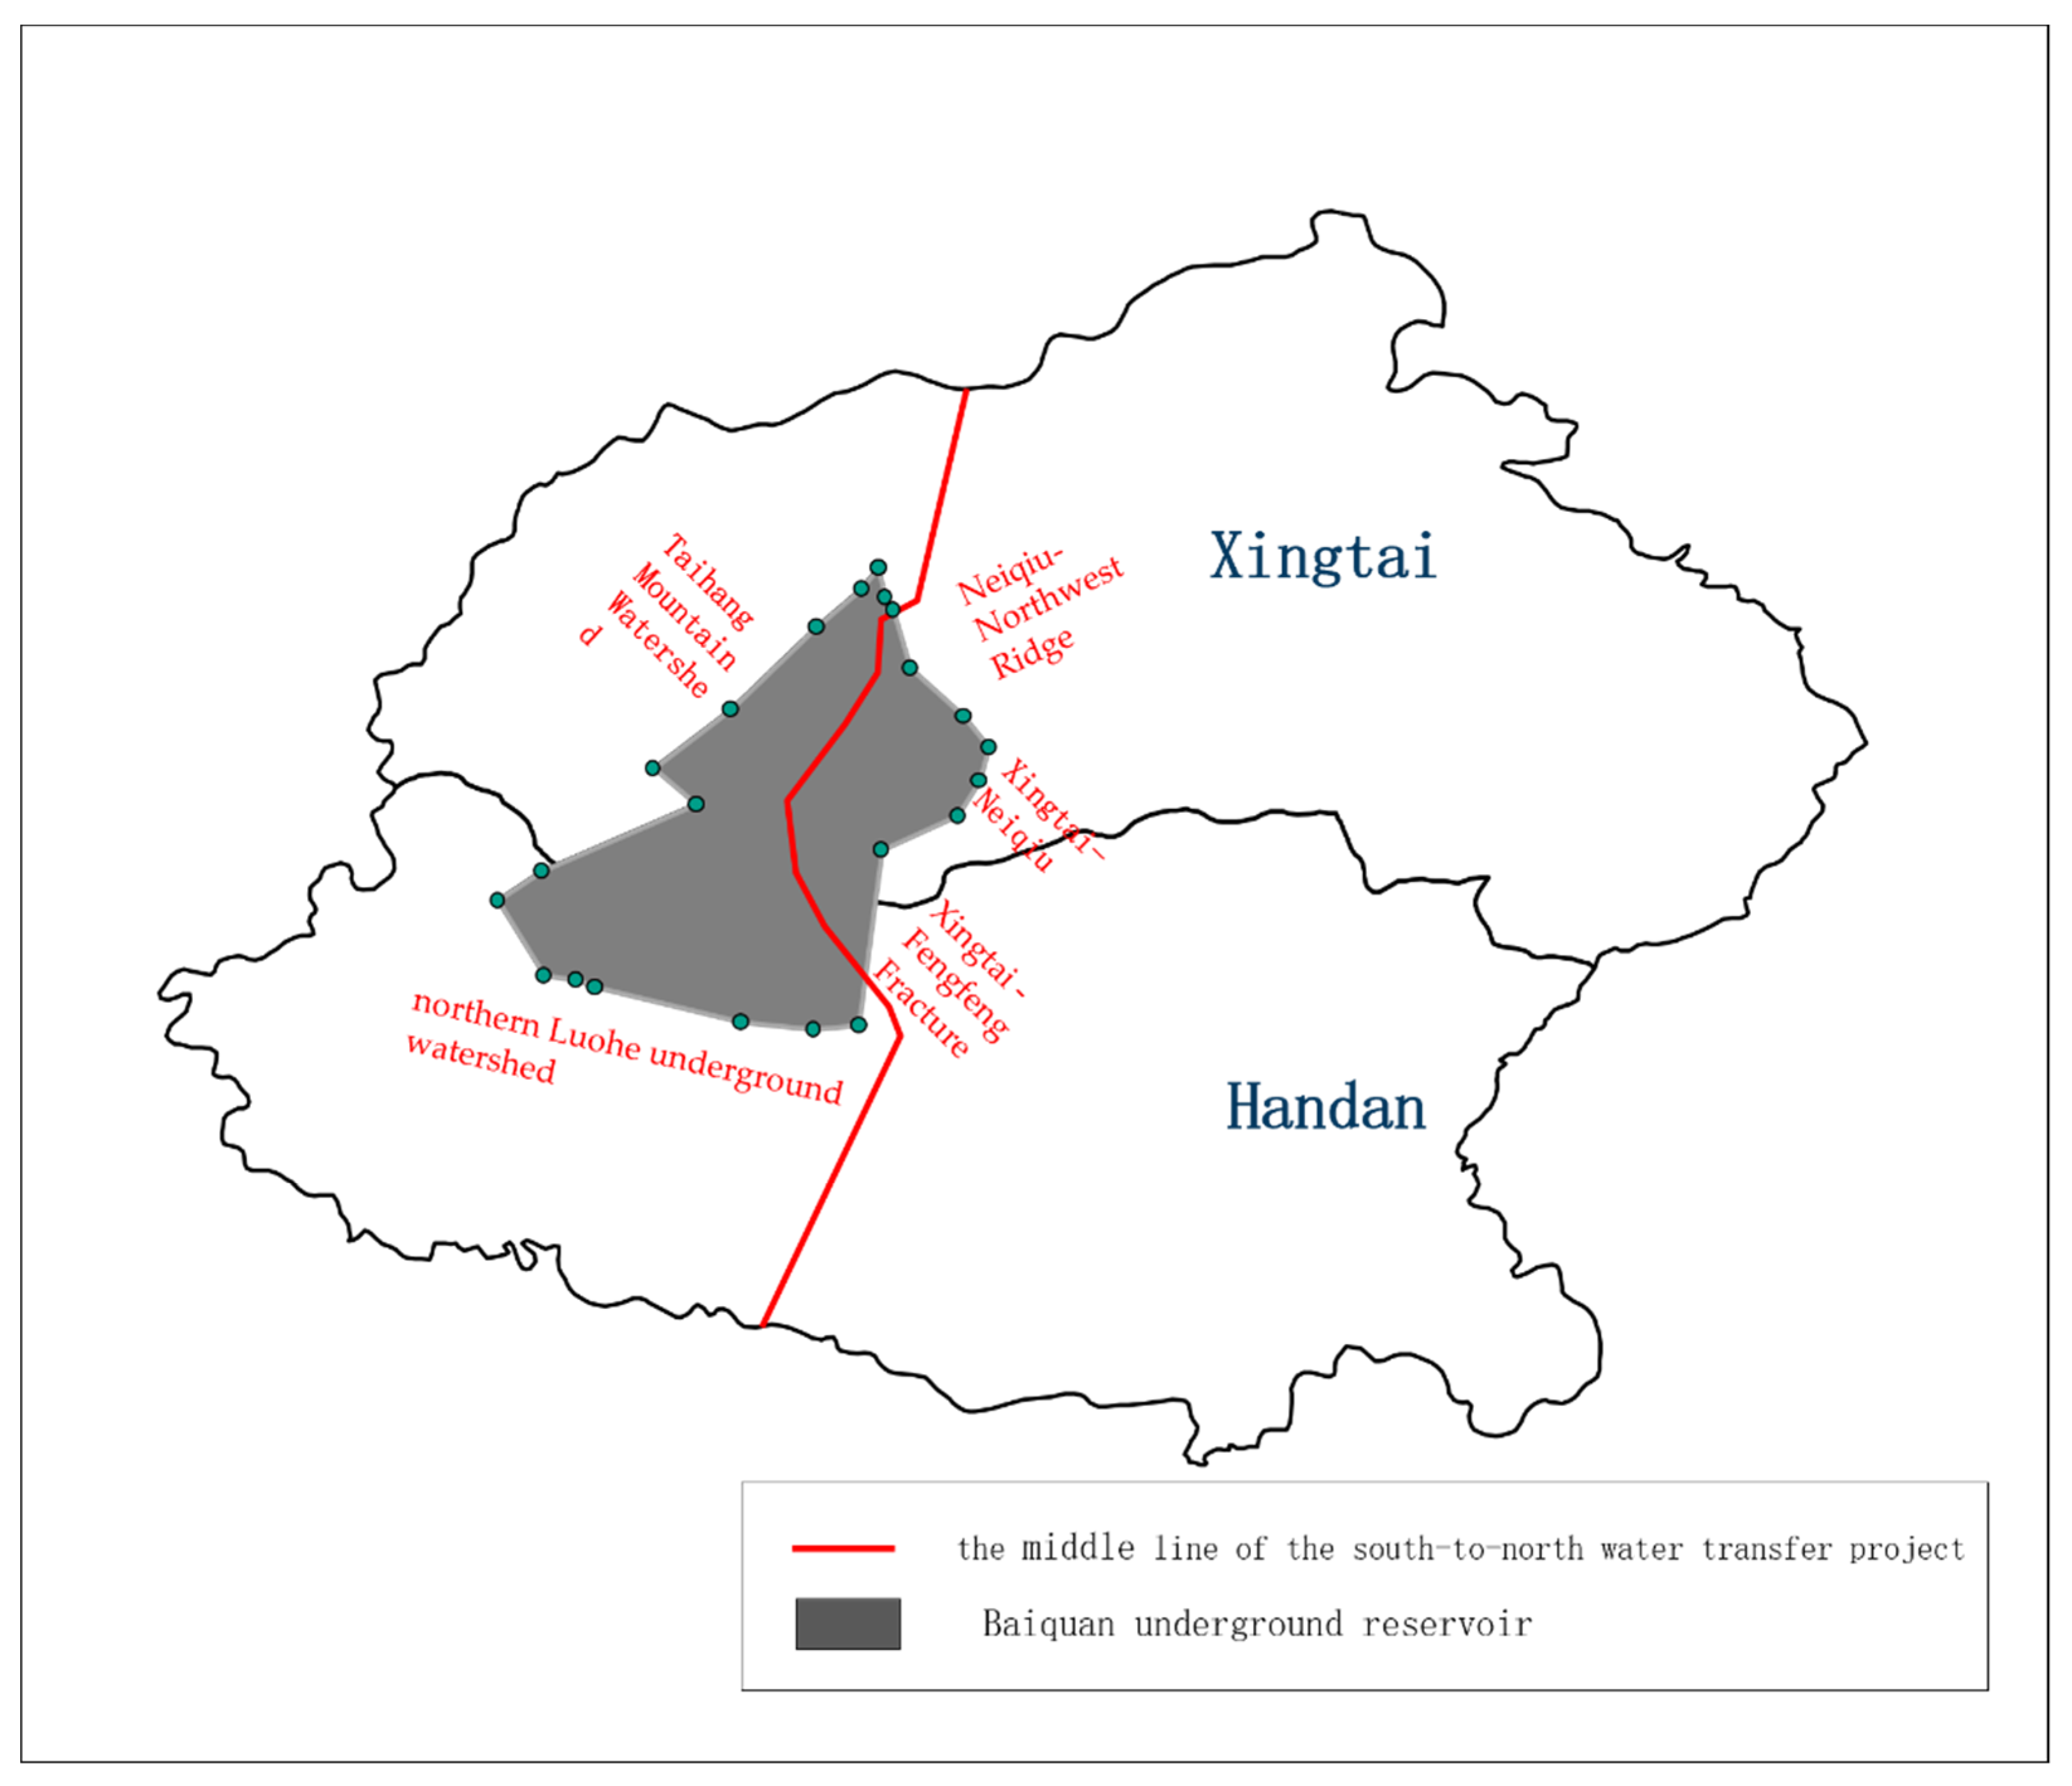
Figure 1. Location diagram of the Baiquan Underground Reservoir.
Water 14 02550 g001
Figure 2. Geological profile of the Baiquan Underground Reservoir.
Water 14 02550 g002
Figure 3. Generalized model of the Baiquan Underground Reservoir.
Water 14 02550 g003
Figure 4. Falling funnel and rising funnel of the well.
Water 14 02550 g004
Figure 5. Temperature field thermal transfer map: (a) horizontal thermal transport, (b) vertical thermal transport, and (c) three-dimensional thermal transport.
Water 14 02550 g005
Figure 6. Water level recovery.
Water 14 02550 g006
Figure 7. Pumping water to restore the water level.
Water 14 02550 g007
Figure 8. Restoration of water level at 1 d.
Water 14 02550 g008
Figure 9. Water level recovery.
Water 14 02550 g009
Figure 10. Recharge water to restore the water level.
Water 14 02550 g010
Figure 11. Restoration of water level at 1 d.
Water 14 02550 g011
Figure 12. Temperature changes under the influence of different factors: (a) recharge flow, (b) recharge water temperature, (c) duration of continuous recharge, (d) permeability coefficient, (e) thermal conductivity of soil, (f) specific volume heat of soil, and (g) well depth.
Water 14 02550 g012
Figure 13. Horizontal maximum diameter change diagram.
Water 14 02550 g013
Figure 14. Variation of temperature at observation point of recharge well with time.
Water 14 02550 g014
Figure 15. Genetic algorithm computational flow.
Water 14 02550 g015
Figure 16. The maximum amount of water pumping under different pumping times.
Water 14 02550 g016
Figure 17. The maximum amount of water recharging under different recharging times.
Water 14 02550 g017
Table 1. Reference parameters of different soil types.
Soil TypeClay, Sandy Soil, SiltFine SandMedium SandCoarse SandGravelFractured LimestoneFractured
Dolomite
Shale
Parameter
Permeability coefficient (m/d)0.1–53–158–2520–5050–30010–240
Storage coefficient0.16–0.20.20.210.240.260.05–0.50–0.05
Specific volume heat of soil
(106 J/m3/K)
2.62.3–2.051.4–1.71.298–2.2210.742–2.3340.345–3.095
Thermal conductivity of soil
(J/m/s/K)
1.05–1.11.8–2.41.82–2.852.865–5.8733.833–6.3271.195–2.369
Specific heat of water
(106 J/ m3/K)
4.2
Water thermal conductivity
(J/m/s/K)
0.65
Table 2. Parameters of the numerical model.
Parameter NameClay-Bearing Layer of Sand GravelKarst Extremely Strong Development Zone (Limestone, Dolomite)Karst Medium Development Zone (Limestone, Dolomite) Karst Weak Development Zone
(Limestone, Dolomite)
Thickness of the strata (m)20214250250
Kx/Ky (m/d)101507535
Kz (m/d)1157.53.5
Storage coefficient0.2
Porosity0.220.30.20.08
Specific heat of water
(106 J/m3/K)
4.2
Water thermal conductivity (J/m/s/K)0.65
Specific volume heat of soil
(106 J/m3/K)
2.342.241.831.3
Thermal conductivity of soil
(J/m/s/K)
1.13.064.295.48
Table 3. Pumping capacity conditions of different factors.
Working ConditionContinuous Pumping Time (d)Initial Water Level (m)Permeability
Coefficient (m/d)
Well Depth (m)
19064150100, 200, 300, 400, 500, 600
2164, 58, 52, 40, 30150200
3150200
7150200
30150200
60150200
90150200
39064100, 200, 240200
Table 4. Water level recovery condition after pumping and recharge.
Working StatusWorking ConditionInitial Water Level (m)Continuous Pumping/Recharge Time (d)
After pumping1641, 3, 7, 30, 60, 90
2581, 3, 7, 30, 60, 90
3521, 3, 7, 30, 60, 90
4401, 3, 7, 30, 60, 90
5301, 3, 7, 30, 60, 90
After recharge127.71, 3, 7, 30, 60, 90
233.71, 3, 7, 30, 60, 90
339.71, 3, 7, 30, 60, 90
451.71, 3, 7, 30, 60, 90
561.71, 3, 7, 30, 60, 90
Table 5. Conditions of recharge capacity of different factors.
Working ConditionContinuous Recharge Time (d)Initial Water Level (m)Permeability Coefficient (m/d)Well Depth (m)
19027.7150100, 200, 300, 400, 500, 600
2127.7, 33.7, 39.7, 51.7, 61.7150200
3150200
7150200
30150200
60150200
90150200
39027.7100, 200, 240200
Table 6. Variation conditions of the recharge temperature field under different factors.
Working ConditionRecharge Flow
(m3/s)
Recharge Water Temperature (°C)Continuous Recharge Time (d)Initial Water Level (m)Permeability Coefficient (m/d)Thermal Conductivity of Soil (J/(∙m∙s∙K))Specific Volume Heat of Soil (MJ/(m3∙K))Well Depth (m)
11, 3, 5, 70.59027.71503.062.24200
250.5, 1, 5, 10, 129027.71503.062.24200
350.59027.7100, 200, 2403.062.24200
450.59027.71502.87, 4.57, 6.372.24200
550.59027.71503.060.74, 1.3, 1.8200
630.59027.71503.062.24100, 200, 300, 400
750.530, 60, 9027.71503.062.24200
Table 7. Optimization scheme of single well pumping.
Continuous Pumping Time ti (d) Pumping Capacity qi (m3/s)Initial Water Level
hi (m)
i = 1577.5764
i = 2326.9959.93
Table 8. Optimization scheme of single well recharging.
Continuous Recharge Time
di (d)
Recharge Capability
ci (m3/s)
Initial Water Level
Hi (m)
i = 1587.5627.7
i = 2316.9931.84
Publisher’s Note: MDPI stays neutral with regard to jurisdictional claims in published maps and institutional affiliations.