Article

Spatial Heterogeneity of CDOM, Optical Brighteners, and Oils in Mesohaline Tidal Creeks Using Self-Organizing Maps

by
Andrew C. Muller
1,* and
Diana Lynn Muller
2
1
Oceanography Department, United States Naval Academy, Annapolis, MD 21401, USA
2
Maritimas, Edgewater, MD 21037, USA
*
Author to whom correspondence should be addressed.
Water 2022, 14(16), 2533; https://doi.org/10.3390/w14162533
Submission received: 20 June 2022 / Revised: 13 August 2022 / Accepted: 16 August 2022 / Published: 18 August 2022
(This article belongs to the Section Water Quality and Contamination)

Abstract

:
Shallow tidal creek systems or triblets are often overlooked when documenting and measuring the spatial extent of pollutants of emerging concern despite much of the population living in and around these areas. An innovative in situ fluorometric instrument coupled with a Self-Organi21zing Map was utilized in Chesapeake Bay’s mesohaline tidal creek system to analyze CDOM, dissolved oxygen, optical brighteners, and oils. The in situ fluorometer proved helpful as a rapid reconnaissance tool complementing the investigation when attached to a CTD instrument. This baseline research showed that CDOM follows non-conservative properties in spring and more conservative behavior in the fall. The results show that the Self-Organizing Map method is a suitable alternative to traditional statistical techniques and may be better at finding key patterns that might otherwise have been obscured by high variability. For example, oils revealed a pattern with residual runoff from highways or boating, while optical brighteners displayed a pattern consistent with septic systems. Optical brighteners also revealed lag effects after the passing of heavy rainfall and were consistent with the lab effect of turbidity. The study also reveals that CDOM is the dominant control on light penetration, one of the limiting factors on underwater grass growth. The results also suggest that CDOM should not be overlooked when measuring the effects of restoration in these systems and should be implemented in regular monitoring and TMDLs.

1. Introduction

Coastal and estuarine tidal tributaries are the nexus between the terrestrial and aquatic ecosystems and are the regions where human impact is the greatest. Much of the human population lives along the coastlines of estuaries or tidal creeks. These zones have been documented as being impacted by multiplicative land uses. These land uses can negatively impact the fragile ecosystem and ecosystem services, including industrialization, stormwater runoff, urban-suburban, agricultural, shipping ports, marinas, recreational areas, or transportation (highways). The coastal and estuarine regions are nurseries for juvenile organisms, habitats for shellfish and fisheries, aquaculture farms high in primary production, storage for carbon in marsh environments, and depositional environments from rivers [1,2,3,4,5,6,7,8,9,10]. The water quality in estuarine tidal tributaries and coastal regions is indirectly or directly impacted because they are the initial receiving basins for anthropogenic sources of excessive sediment, nutrients, and contaminants. The nutrients (nitrogen and phosphorus) may enter the aquatic system, causing eutrophication and severely deteriorating the ecosystem [11,12,13,14,15]. In addition, many pollutants, such as metals, pesticides, herbicides, oils, and contaminants of emerging concern (pharmaceuticals or personal care products) may cause adverse effects on aquatic organisms [16,17,18,19,20]. Both phosphorus and pollutants can be bound to sediments or are directly deposited into the surficial sediment layer and will then become a hotbed of biogeochemical activity depending upon the type of chemical species [21,22].
Furthermore, over time, humans have changed the landscape, increased the stormwater runoff, decreased natural shorelines, and altered the river system, causing increased erosion leading to incised stream channels, poor septic or sewer infrastructures, and combined sewer overflows leading directly to tidal creeks or rivers, which all have been shown to increase the concentrations of dissolved organic matter, optical brighteners (fluorescent whitening agents), or oil products [23,24,25,26]. Chromophoric dissolved organic matter (CDOM) is the portion of dissolved organic matter (DOM) in natural waters that can be optically measured. Researchers have indicated that DOM has been sourced from rivers and is crucial to the biogeochemical processes within coastal zones. Allochthonous and autochthonous organic matter can affect the CDOM concentrations in tidal creeks and coastal systems. This increase in CDOM to tidal creeks can change the aquatic ecosystem by altering the primary production and optics [27].
Optical brighteners (OB), also known as fluorescent whitening agents, are colorless fluorescent chemicals employed to whiten and brighten materials. OBs have been used in the textile and detergent industries since approximately 1945 and are still widely used. The three types of OB include Disulfonated, Tetrasulfonated, and Hexasulfonated chemicals. These OBs are used to whiten textiles, plastics, and paper products and are found in all detergents. They persist in natural waters and sediments, and recent studies have indicated that these chemicals are only partially removed during sewage treatment [28,29]. Resembling CDOM, OBs absorb the near-ultraviolet 360–365 nm and emit in the blue range of 400 to 440 nm [30]. Since optical brighteners are used in everyday household laundry systems and then discharged into septic systems, sewer treatment plants, or combined sewer overflows, these fluorescent whitening agents can be a valuable tracer of emerging contaminants of concern [31,32,33,34,35]. In addition, the Material Safety Data Sheet for OB states that it is harmful to all aquatic life, and respirometric tests have indicated that these chemicals are harmful to aquatic life [36,37]. Optical brighteners have been detected using older fluorescent techniques in coastal systems to detect septic and sewer leaks from homes, farms, and boats [38]. This research utilized a new in situ technique to detect optical brighteners in the aquatic environment.
Marinas, recreational boating, and port-shipping activities, with gas, diesel, and crude oil (dock or floating fuel stations) emissions, occur in many coastal bays and tidal creeks. Although there are strict regulations in the United States regarding fueling stations, marinas, and shipping ports, oil-based products are still witnessed on the surface of tidal creek waters [39]. These oil-based products have been shown to biomagnify from the water column into zooplankton and higher-order organisms [40,41]. Therefore, detecting and monitoring these oil-based products in low-flushing tidal creeks and coastal systems is essential. These sensitive regions of primary production will bio-magnify into local fisheries, shellfish, aquaculture, birds, and other ecosystem services. While numerous studies have been performed measuring CDOM, optical brighteners, and oils (petroleum products) within large estuarine and oceanic settings, little is known about the actual concentrations and patterns of these constituents in small tidal creeks, otherwise known as triblets [42,43].
This research uses self-organizing maps and classical statistical methods to identify patterns of CDOM, OBs, and oils in an urban/suburban mesohaline tidal creek and its triblets. This will assist in identifying the extent of these anthropogenic constituents and serve as a baseline for potential stream restoration projects to determine if they improve the water quality in tidal creek regimes. In addition, since the South River watershed is considered an urban/suburban environment, it is an ideal natural laboratory used in other small estuarine systems.

2. Materials and Methods

2.1. Site Description

The South River is situated on the Lower Western Shore of Maryland on the Chesapeake Bay, with attributes consistent with a partially mixed to mixed estuary dominated by the M2 tidal and a microtidal range of 0.3 m. The South River estuary has 14 sub-tidal creeks, otherwise known as triblets. The watershed is considered urban/suburban with a few rural designations, and the upland South River watershed is forested. The site locations in the tidal creeks were determined by going into each tidal creek as far as the tidal reach allows while still having 2 m for an observation profile. Figure 1 identifies the research sites that were geo-statistically determined to allow for beneficial spatio-temporal monitoring.
The South River estuary has approximately 16 marinas (private and commercial), with half providing gasoline/diesel or marine mechanic businesses. The general land use for the South River watershed is displayed in Table 1, with 18.9 square kilometers of impervious surfaces within the urban/suburban designation. The general descriptions of the sub-watershed tidal creek stations and the main stem station are listed in Table 2 [44,45].

2.2. Materials

The South River stations were vertically sampled over the entire water column for CDOM, OBs, and oils using the ECO Triplet, manufactured by Sea-Bird Electronics (Bellevue, Washington, USA), and was attached to a Hydrolab DS5(Austin, TX, USA). The Hydrolab DS5 provided the vertical profiles of depth, temperature, salinity, dissolved oxygen, pH, chlorophyll-a (Chl-a), and phycoerythrin. Basic weather measurements were taken at each station using a Kestrel 5000 (Boothwyn, PA, USA). The Hydrolab DS5 was calibrated for depth, DO, salinity, pH, Chl-a, and phycoerythrin [46]. Calibrations were performed the morning of field research, and quality control calibration checks were performed post-monitoring as part of the research program’s quality-control protocols. The ECO Triplet had a fluorescent dark count offset instrument that was tested and calibrated with a quinine solution for CDOM, Tide Ultra for Optical Brighteners, and a known stock solution of crude oil for oils [47]. The fluorescent offset information was entered into the instrument’s software, which then provided concentrations in units of mg L−1. The instrument was specifically ordered for the researchers and designed for estuarine (saltwater), with CDOM emission at 465 nm, OB emission at 465 nm, and oil emission at 500 nm. The ECO Triplet allows the user to measure a substance’s concentrations versus wavelength absorption directly.
Although for this research, the analysis concentrated mainly on the surface water column defined at 1 m, typical vertical profile results are reported. The ECO Triplet is used for vertical profiling or long-term continuous monitoring; it is not to be pulled behind a vessel. This first-of-its-kind baseline research was conducted during the fall of 2013 and spring of 2014. Total suspended solids (TSS) measurements were taken at various sites, including freshwater streams, tidal creeks, and restored sections of creeks. TSS analysis was performed in accordance with USEPA standard methods [48]. Long-term monthly TSS data were accessed from the Chesapeake Bay Data Hub for site WT 8.1 for monthly values over 30 years. The Chesapeake Bay Programs WT 8.1 site is also South River site MS 2. Water clarity measurements were made in each site listed above using a Secchi disk. Water clarity data were accessed from the Chesapeake Bay Data Hub for the same 30-year interval at station MS 2 (WT 8.1). A Hydrolab DS5 continuous monitoring sonde was deployed at the headwater section of Church Creek Triblet from 7 August to 5 September 2014 and captured temperature salinity, pH, Chl-a, and turbidity at hourly intervals.

2.3. Statistical Analysis and Self-Organizing Maps

All statistical metrics and tests, including analysis of variance (ANOVA) and means comparison tests, were performed using Sigma Plot 12.5. In addition, vertical plots of parameters were created in MATLAB 2020b (MathWorks, Natick, MA, USA). Finally, a Morlet continuous wavelet transform was performed on the continuous turbidity data from Church creek using the MATLAB wavelet toolbox [49]. Data may be found at the USEPA Chesapeake Bay data hub at: https://www.chesapeakebay.net/what/downloads/cbp_water_quality_database_1984_present (accessed on 1 December 2021).
Self-organizing maps (SOMs) are an unsupervised artificial neural network, also known as Kohonen maps, that uses a competitive clustering technique that delivers unbiased visual pattern recognition maps that conserves the topological structure of data. The power of this technique is two-fold: one, it does not require previous knowledge of the data structure, and two, its primary function is to reduce high-dimensional data into a two-dimensional plane [50]. Numerous studies have successfully utilized this type of cluster analysis to characterize patterns in environmental data that traditional methods often miss due to non-linear effects [51,52,53,54,55,56,57].
The SOM analysis and visualization were performed using the Kohonen and CP-ANN toolbox for MATLAB version 2020b [58]. Pre-treatment of the data consisted of normalizing each data point of a given property to a value between 0 and 1. The SOM was trained using six normalized input variables: CDOM, chlorophyll-a, oils, optical brighteners, dissolved oxygen, and water clarity. The number of hexagons used in the model was determined using the method of 5√n as described by Vesanto [59] and automatically calculated using the Kohonen toolbox for MATLAB.
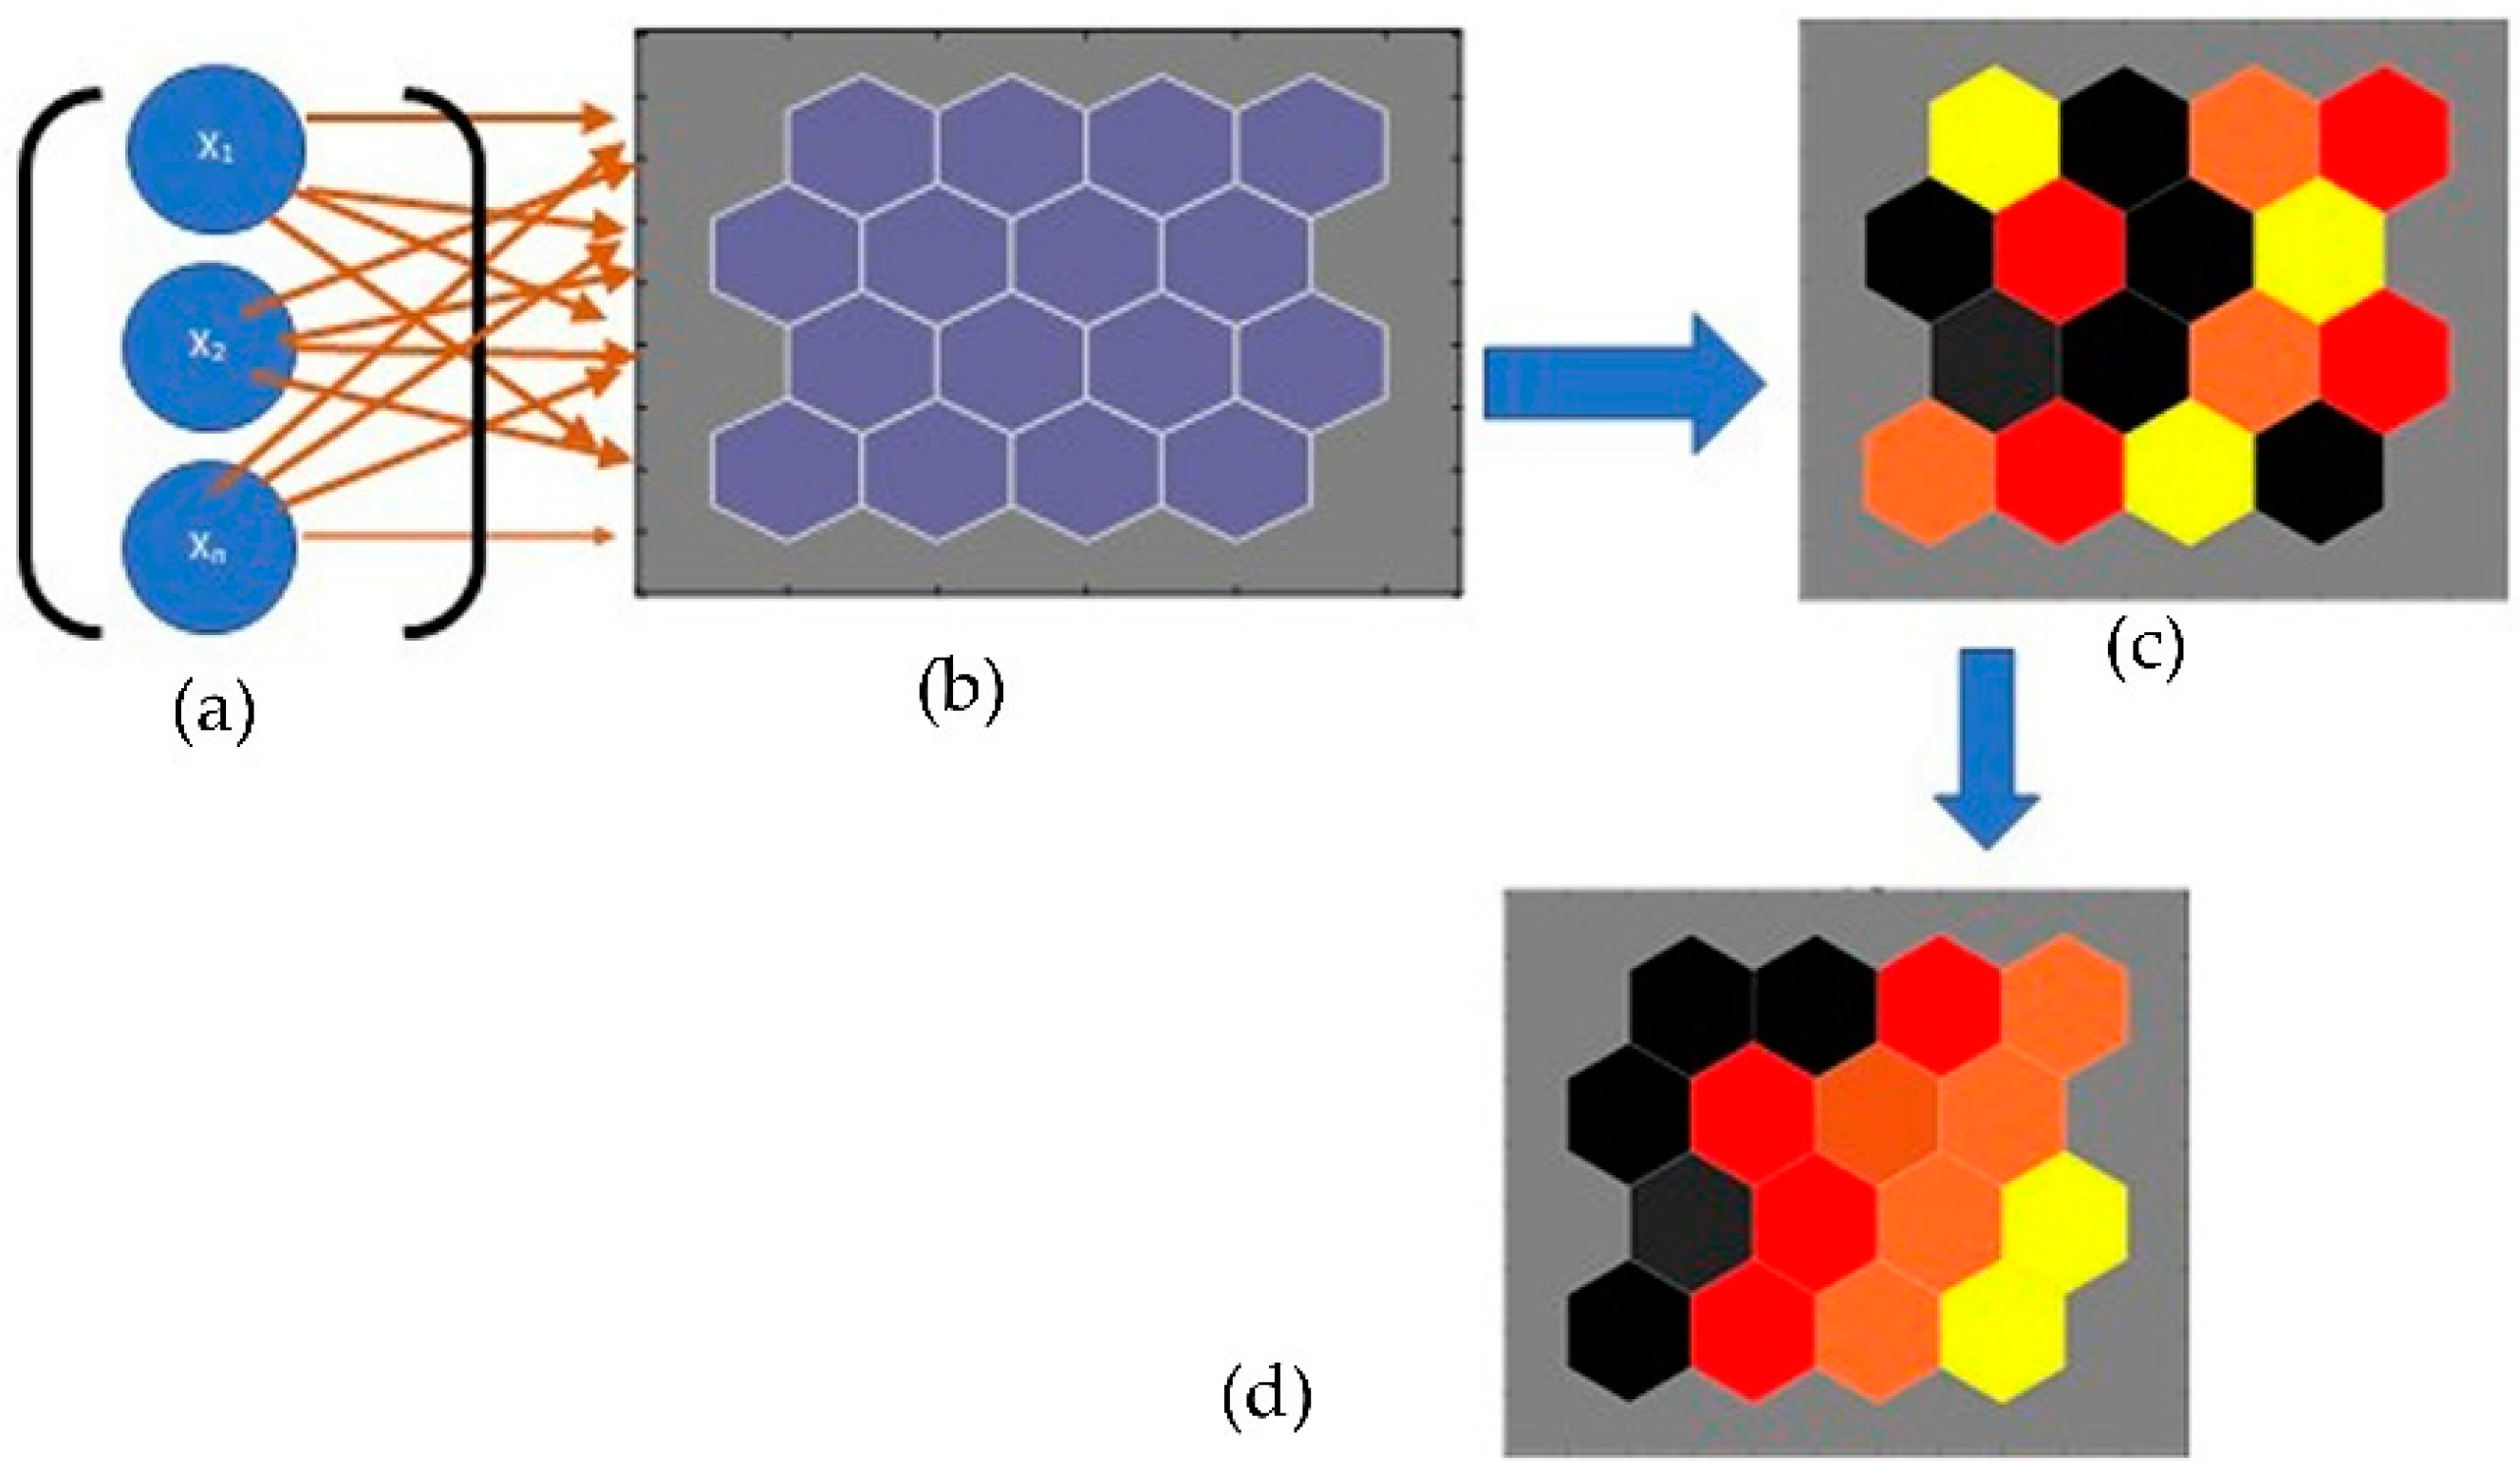
A 189 × 6 numeric matrix of the normalized data was fed into the Kohonen toolbox, which created an10 × 7 hexagonal map or input planes. In a self-organizing map, there are two layers. The first layer is the input vector, which is then mapped onto the second layer or output layer, also known as the input planes. The SOM has four main stages, the initialization stage, the competition stage, the cooperative stage, and finally, the adaptation stage. Figure 2 depicts the basic concept of how SOM input planes are created. In the initialization stage (a and b), connection weights are created through a random process. Then, in the competition stage, “winning” neurons are selected based on the computation of individual discriminant functions or dimension reduction computations (c). In the last two stages, cooperation and adaptation (d), individual winning neurons determine their location on the map and reduce their final discriminant function values based on input variable patterns. After this, the quantification and topologic errors are calculated [60]. The quantification error refers to the squared distance between an individual data point and its nearest centroid, while the topological error in the SOM measures how well the distances between each point were preserved in the map [61].

3. Results

3.1. Statistical Analysis and GIS Maps

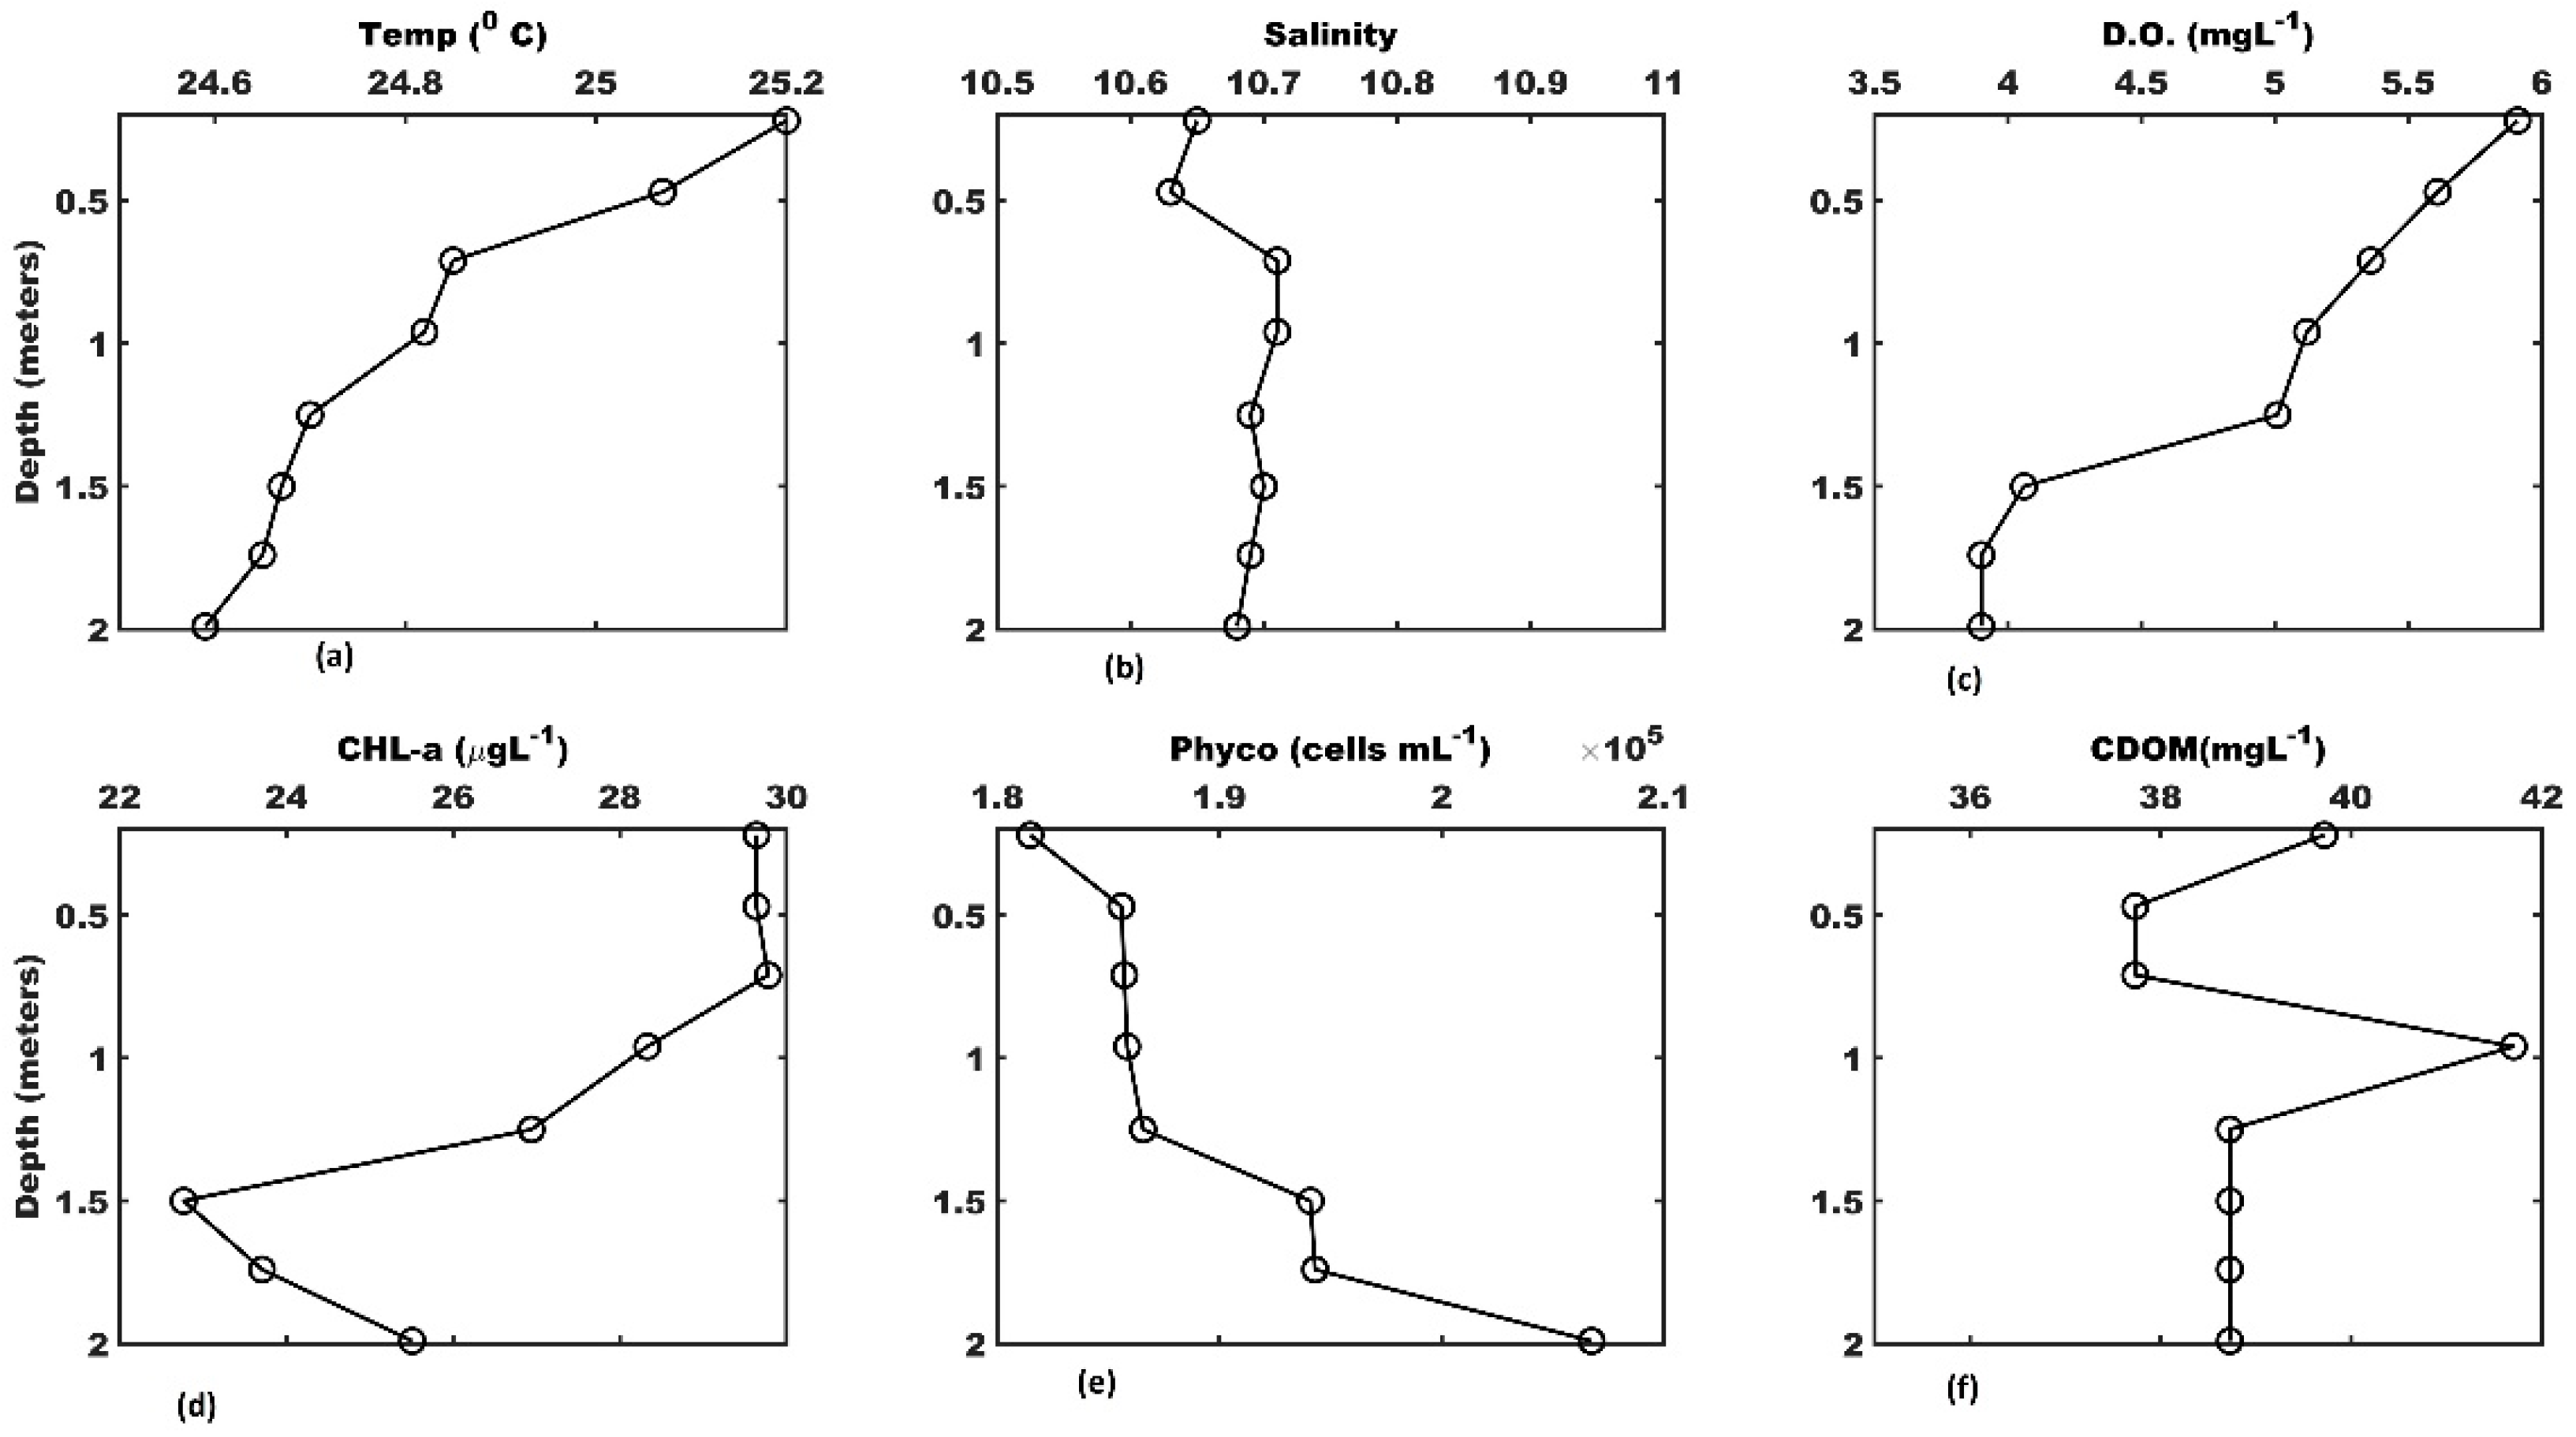
Vertical plots of physicochemical parameters collected on 8 September 2013 in Church Creek Triblet (CHR) indicate the typical vertical distributions of these parameters during late summer and early fall in most of the triblets in the South River estuary. Temperature shows a very weak thermocline with a decrease from surface to the bottom of only 0.7 degrees in 2 m (Figure 3a), while salinity is well mixed (Figure 3b). Dissolved oxygen exhibits near-saturation conditions at the surface but quickly becomes hypoxic (<2 mg L−1) at 1.5 m (Figure 3c). Chlorophyll-a is remarkably high throughout the water column, excessively higher than a typical fall bloom (Figure 3d). According to the Chesapeake Bay blueprint for a healthy ecosystem, the chlorophyll-a concentrations must equal or be below 20.9 µg L−1. Phycoerythrin is a proxy for blue-green algae with moderate concentration for these triblets (Figure 3e). The vertical profile results for CDOM concentration are between 40 and 38 mg L−1 (Figure 3f). These are baseline results as this has never been recorded in triblets.
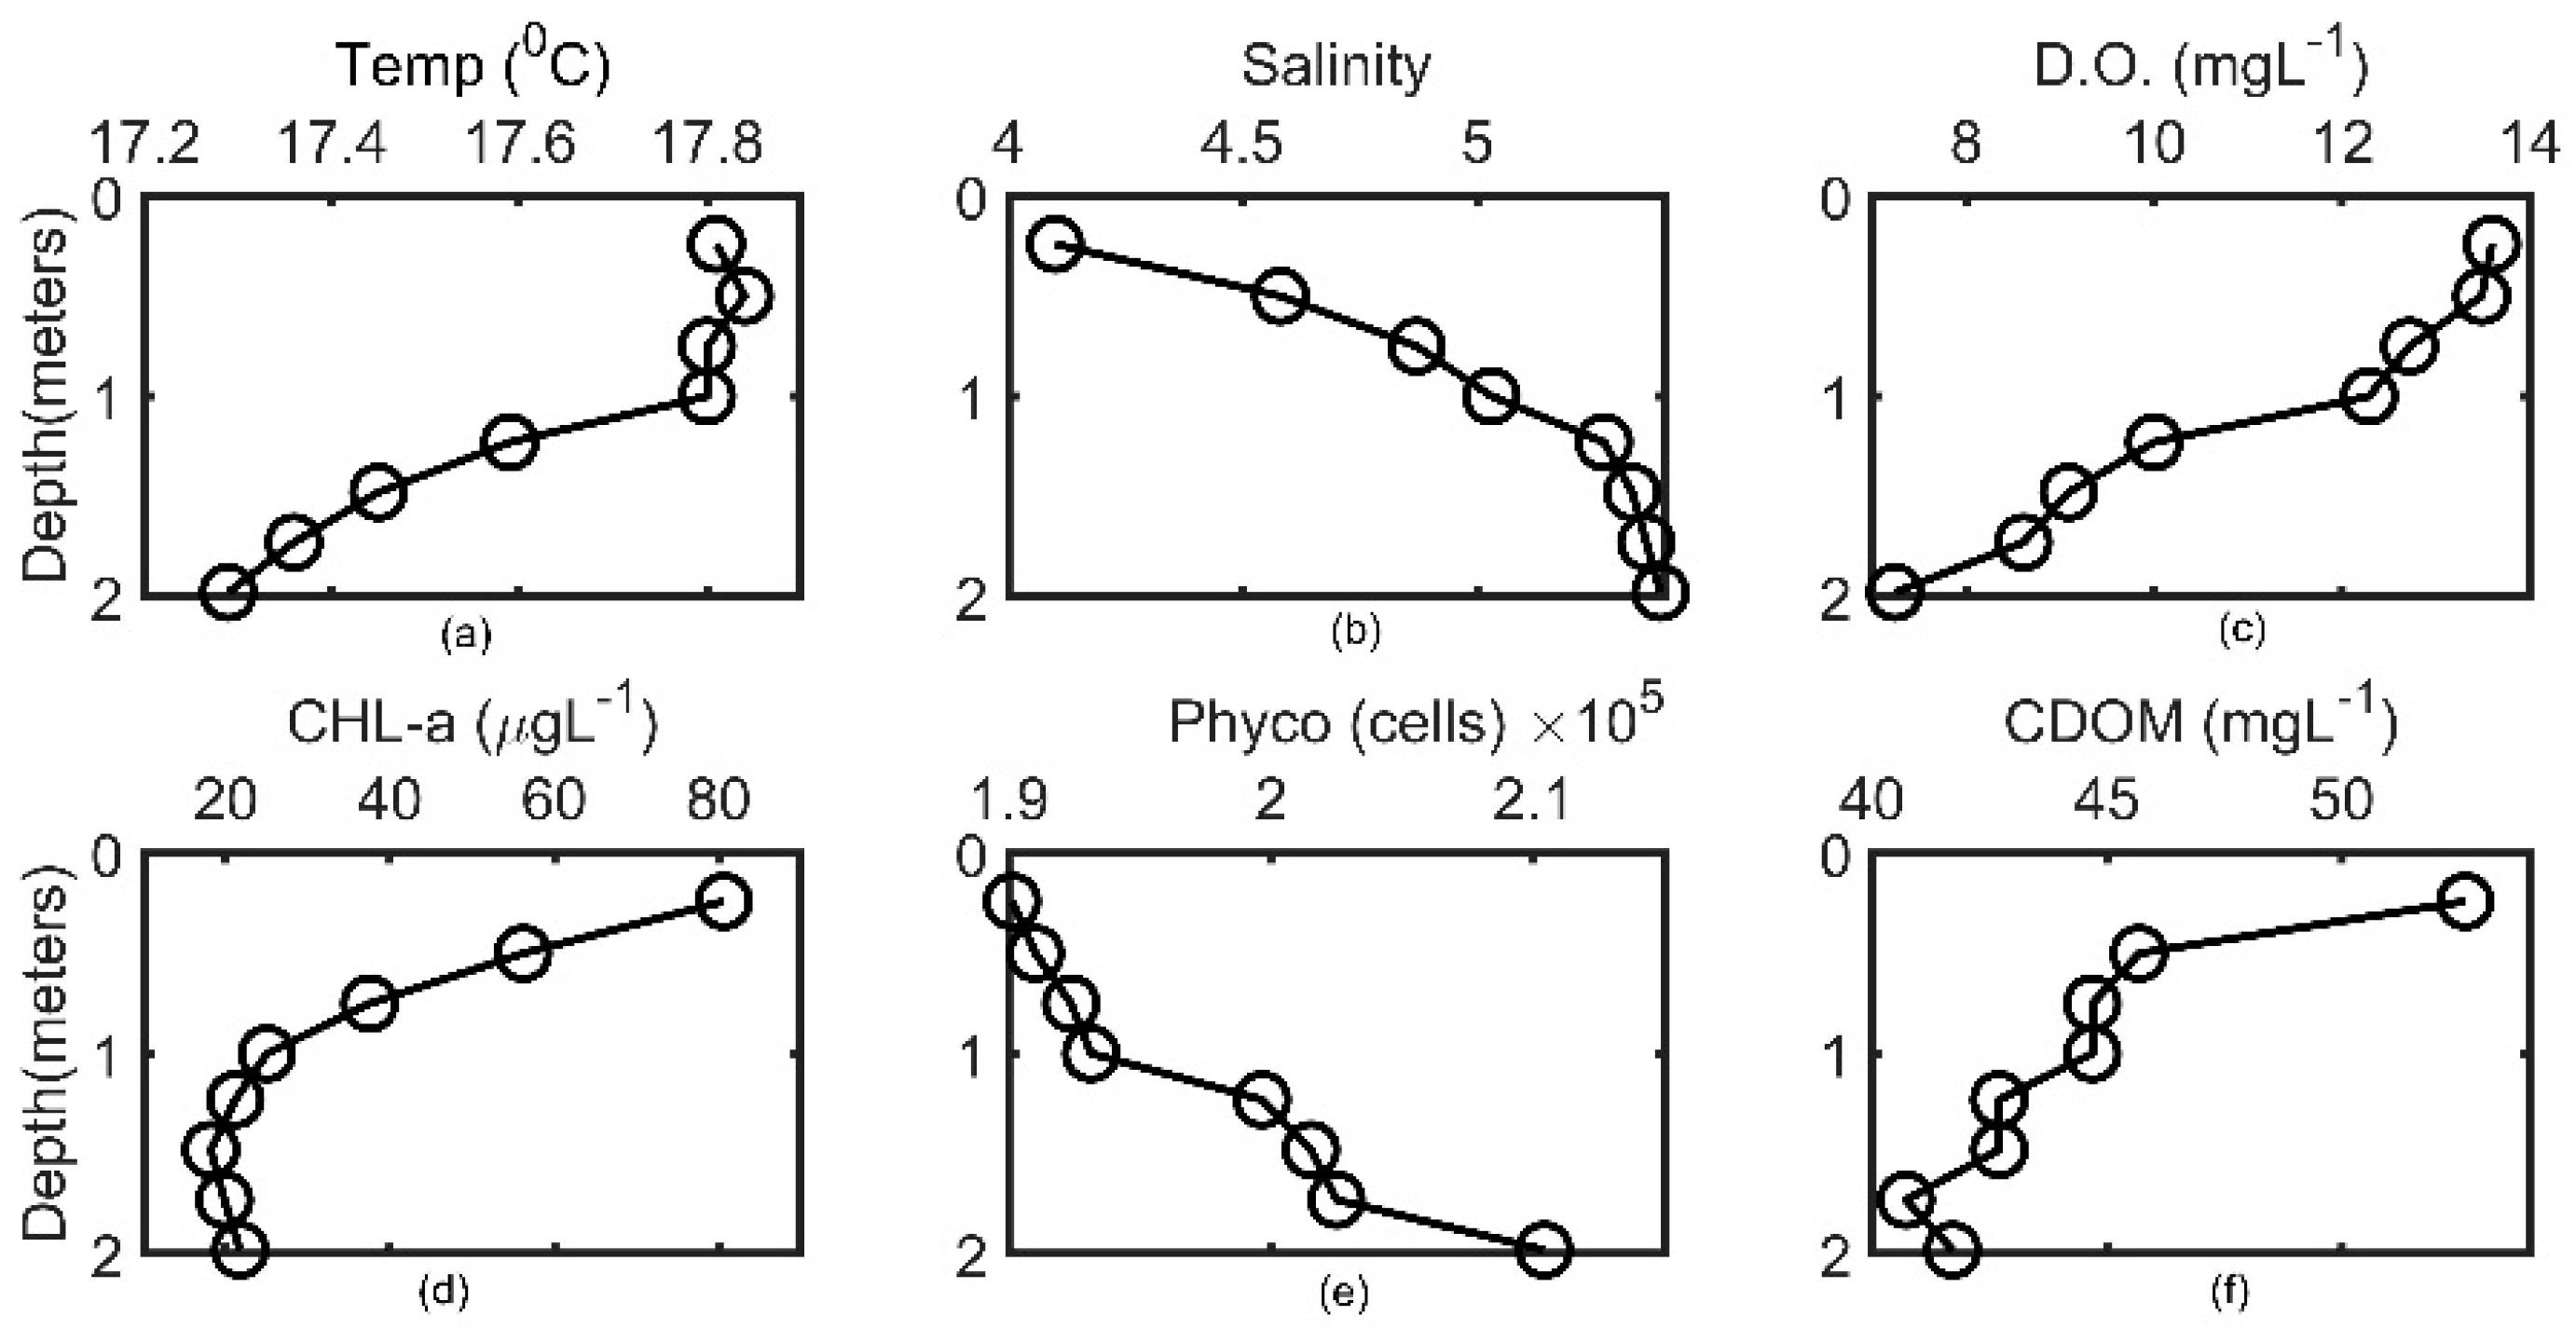
Figure 4a–f illustrate the typical vertical profiles for spring conditions witnessed in the South River Estuary using Broad Creek Triblet (BRD) as an example. The general depth of these triblets is between one to two meters. Temperature is well mixed, while salinity indicates a weak halocline (Figure 4a,b). Dissolved oxygen was supersaturated at the surface due to winds during the collection date coupled with an excessive chlorophyll-a bloom (Figure 4c). Figure 4d shows the excessive spring chlorophyll-a bloom and relatively low blue-green algae concentration (Figure 4e). Figure 4f shows high concentrations of CDOM, which occurred at all triblets. The research found CDOM to be high in concentration during the spring and fall research monitoring events. In this research, the primary focus was on the surface waters, defined as 1 m, despite the collection of vertical profiles.
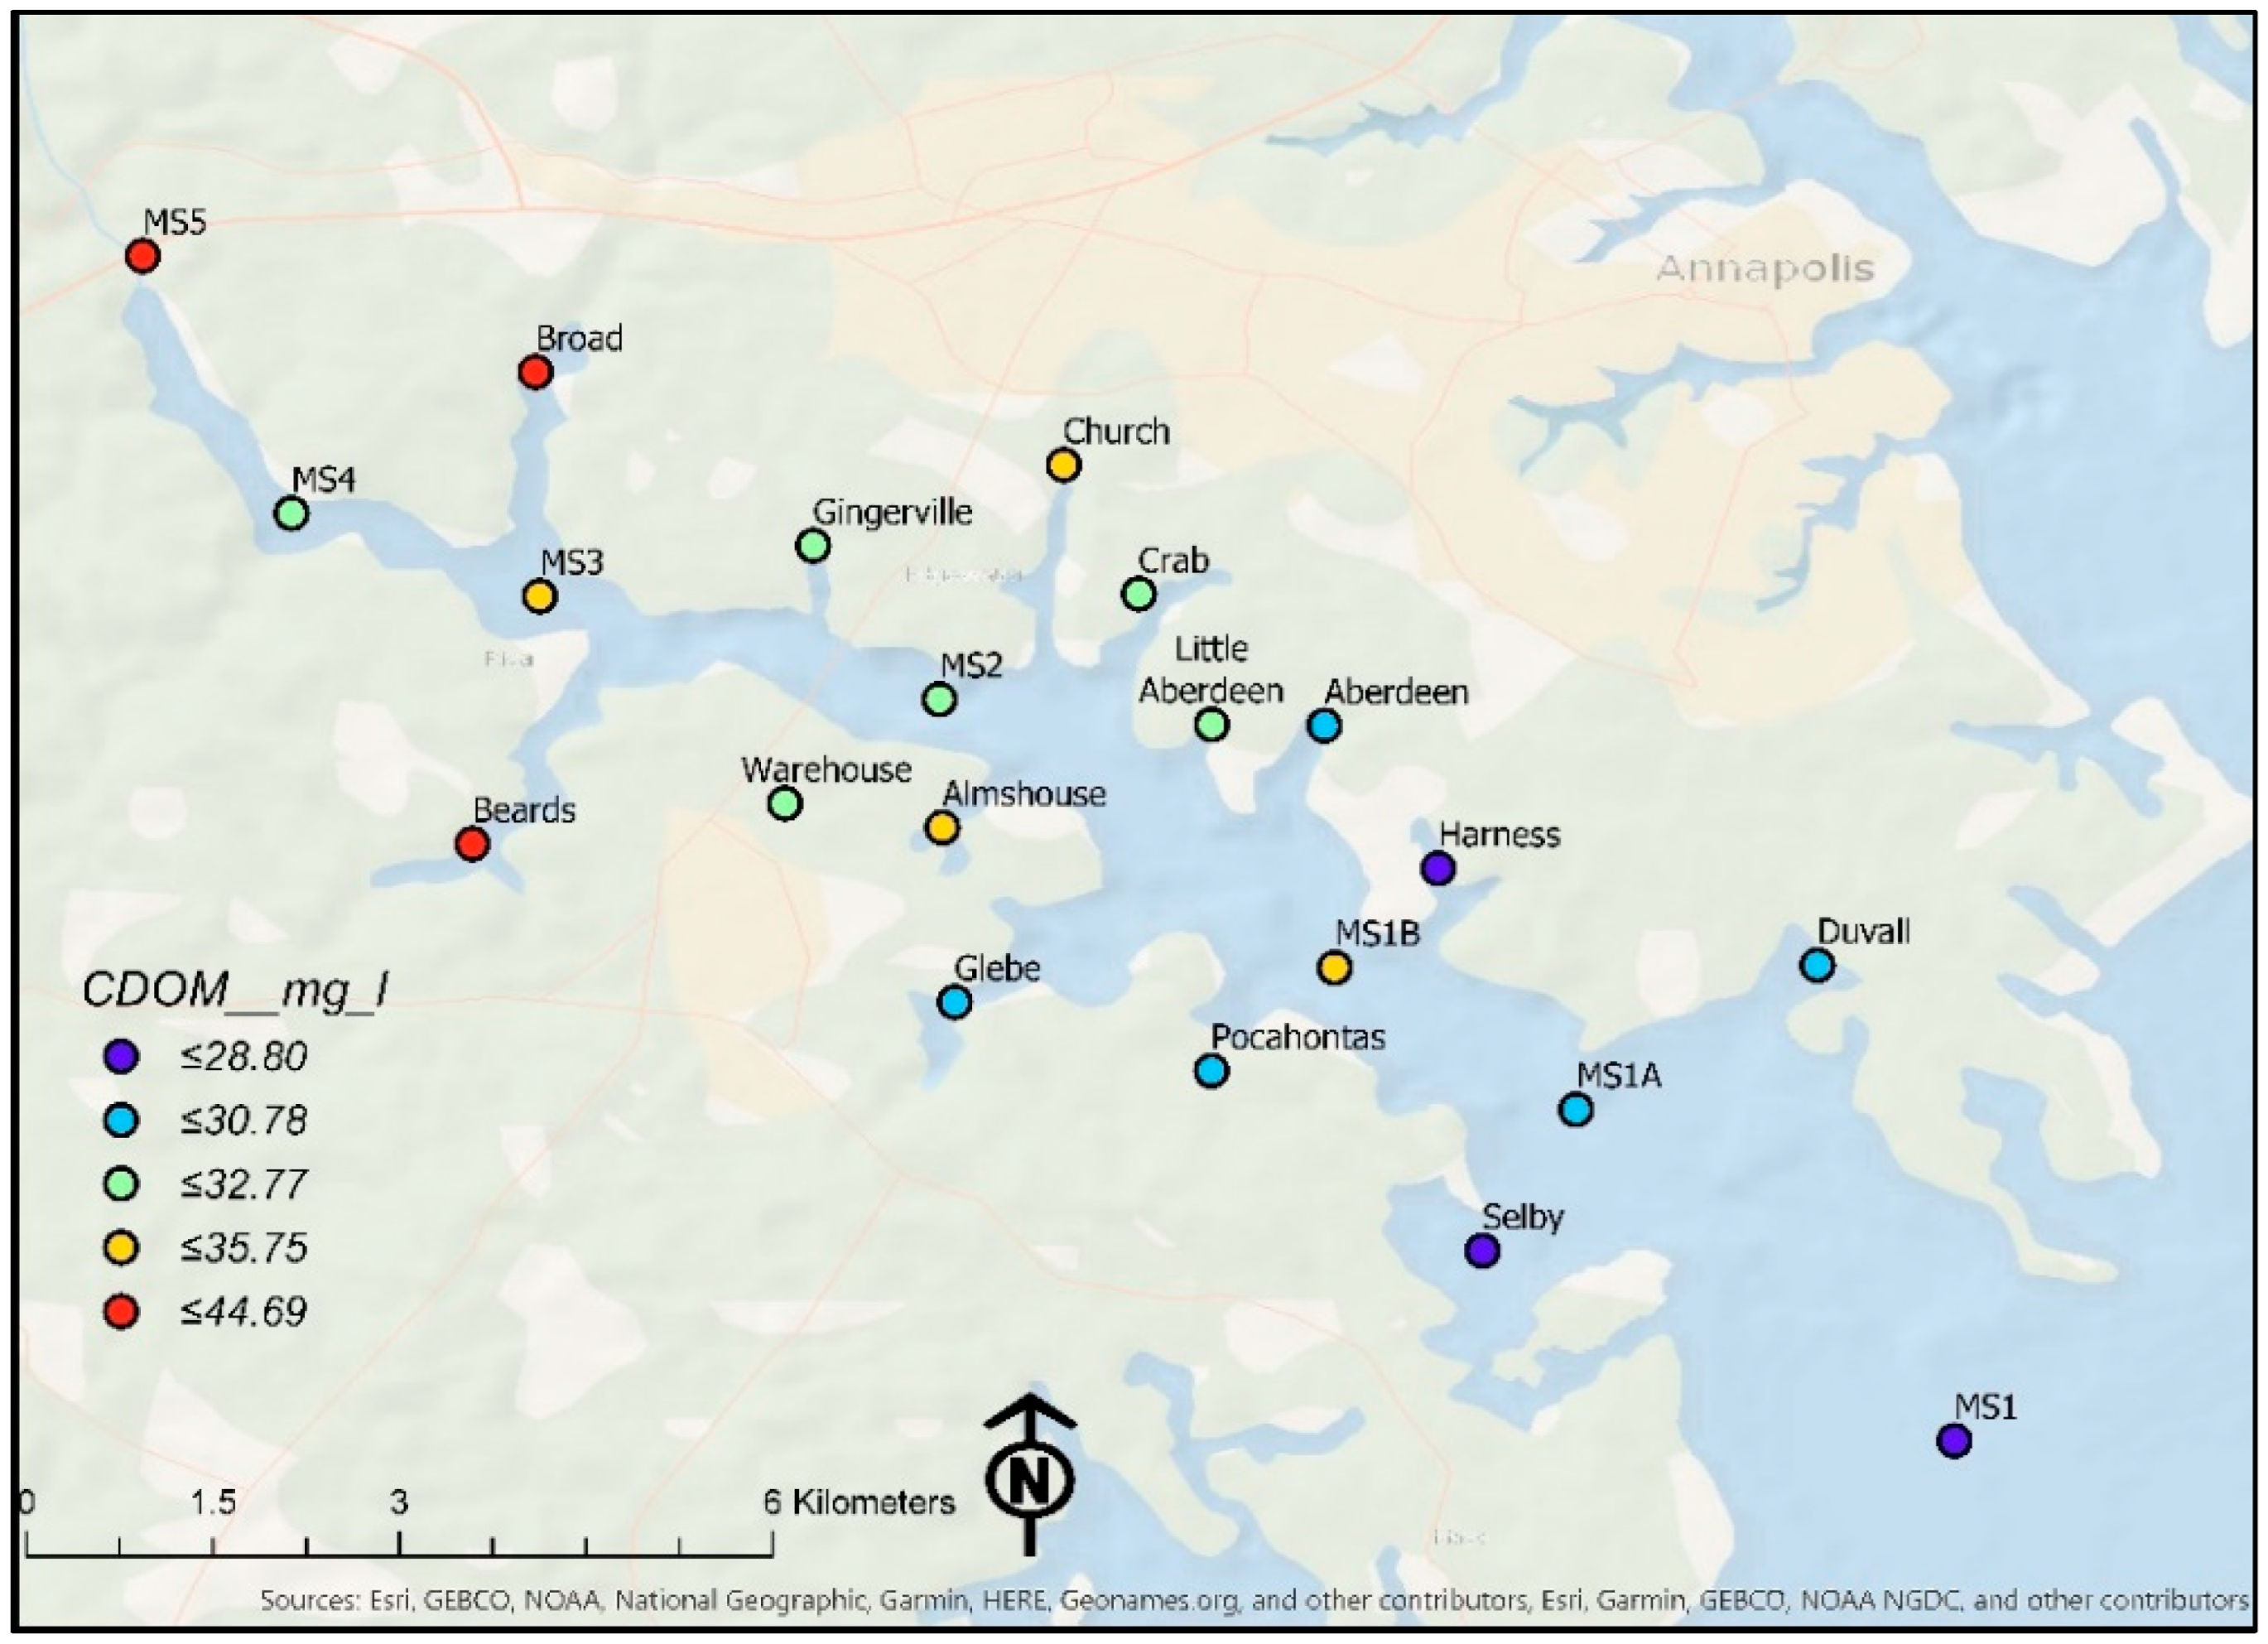
A map of CDOM median values for each site within the South River watershed indicates that the higher concentrations of CDOM are located in the headwaters and decrease toward the estuary’s mouth. This is true of the triblets as well; higher concentrations are located toward the headwaters of these water bodies. The higher concentrations of CDOM median values occur at sites MS5, Beards Creek Triblet, and Broad Creek Triblet. Sites with lower median CDOM values include MS1, Harness Creek Triblet, and Selby Bay (Figure 5). This implies that the headwaters of the triblets can be the primary source of CDOM, and it is not imported from the Chesapeake Bay.
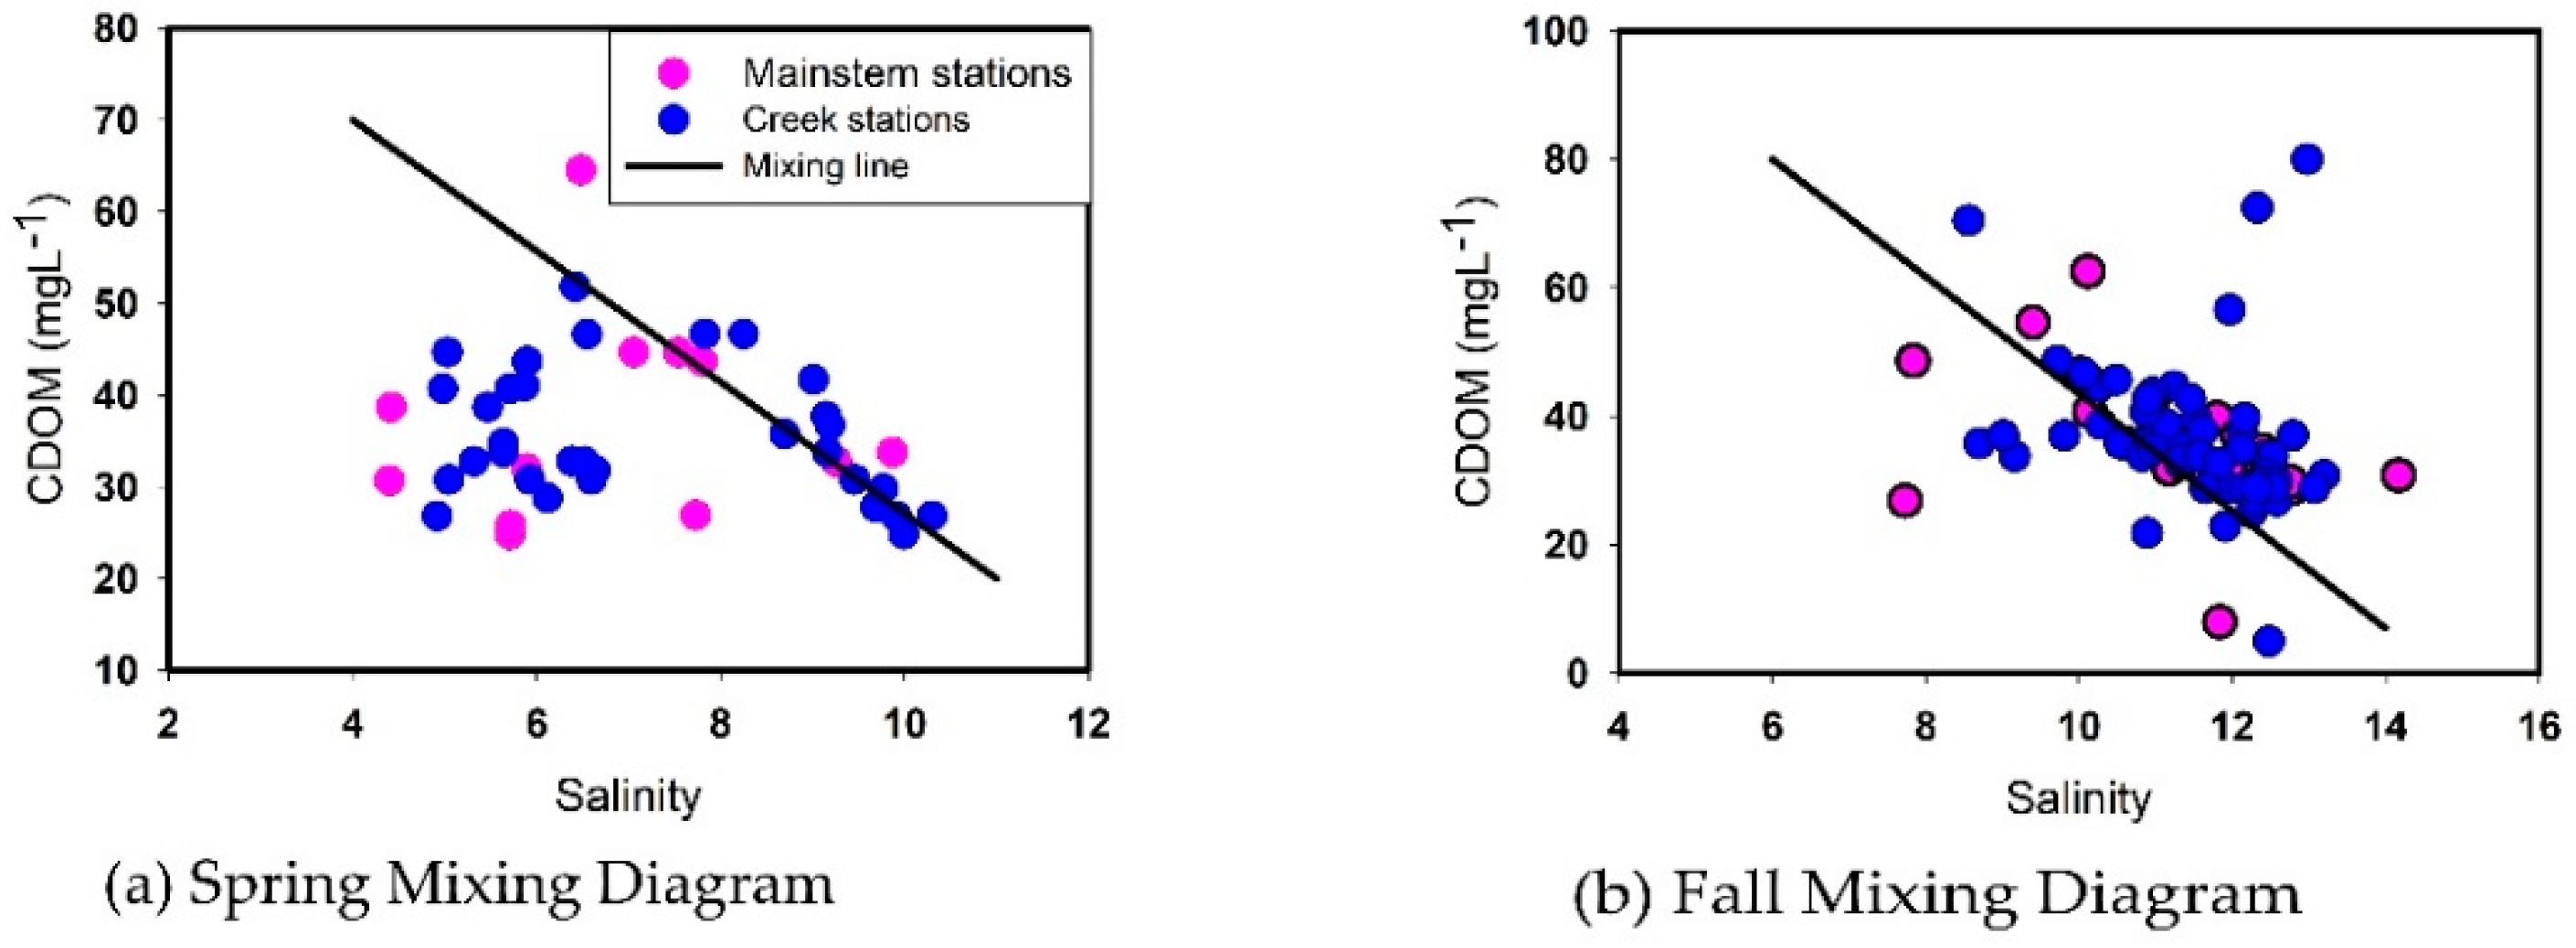
Traditional mixing diagrams for the fall of 2013 and spring of 2014 values are illustrated in Figure 6a,b. The mixing curve patterns reveal that CDOM exhibits non-conservative behavior, with spring displaying a higher degree of non-conservativeness than fall. Spring mixing (Figure 6a) suggests that the upper river sites closest to the headwaters act mainly as a sink for CDOM, especially within triblets. Further inspection of fall 2013 mixing (Figure 6b) diagrams implies that CDOM acts more conservatively throughout the estuary; the production of CDOM occurs in three triblets. The highest recorded value of 80 mg L−1 was observed in Harness Creek Triblet on 29 October 2013, while values below the detection were observed at MS5 and Gingerville Creek Triblet. Values below the detection level were observed in Selby Bay on 8 April 2014 and Warehouse Creek Triblet on 9 September 2013. Site Gingerville Creek Triblet and Warehouse Creek Triblet are tied for the most extensive CDOM range (46.7 mg L−1, whereas MS1 exhibited the smallest range of only 6.95 mg L−1).
Statistical analysis of CDOM samples revealed that CDOM is non-normally distributed in the South River. As a result, a Kruskal–Wallis one-way analysis of variance (ANOVA) on station ranks was performed. This statistical test was used to test the null hypothesis that individual triblets and sites within the South River are not significantly different concerning CDOM. Results from the non-parametric ANOVA test indicate that at least one of the sites is significantly different from other sites, and therefore the null hypothesis should be rejected (H = 65.694 with 21 degrees of freedom, p = < 0.001). Since the stations within the South River sub-watershed exhibited a high degree of variability, an All Pairwise Student–Newman–Keuls Multiple Comparison tests were performed (α = 0.05) to determine which sites differed significantly from each other concerning CDOM. The Means Comparison test showed that several sites are statistically different from one another. Specifically, station Beards Creek Triblet (BRD) contains significantly higher concentrations of CDOM than every other station except for BRO and MS5. The same is true for MS5 and Broad Creek Triblet (BRO).
Intriguingly, while each of these three sites is close to the headwaters of the South River estuary, they are not the only sites with significant concentration differences from other sites. Church Creek Triblet (CHR) is statistically higher in CDOM versus MS1 and Harness Cree Triblet (HAR) but lower in CDOM concentration than MS5, Broad Creek Triblet (BRO), and Beards Creek Triblet (BRD). The results for CDOM are graphically displayed using a box and whisker plot (Figure 7).
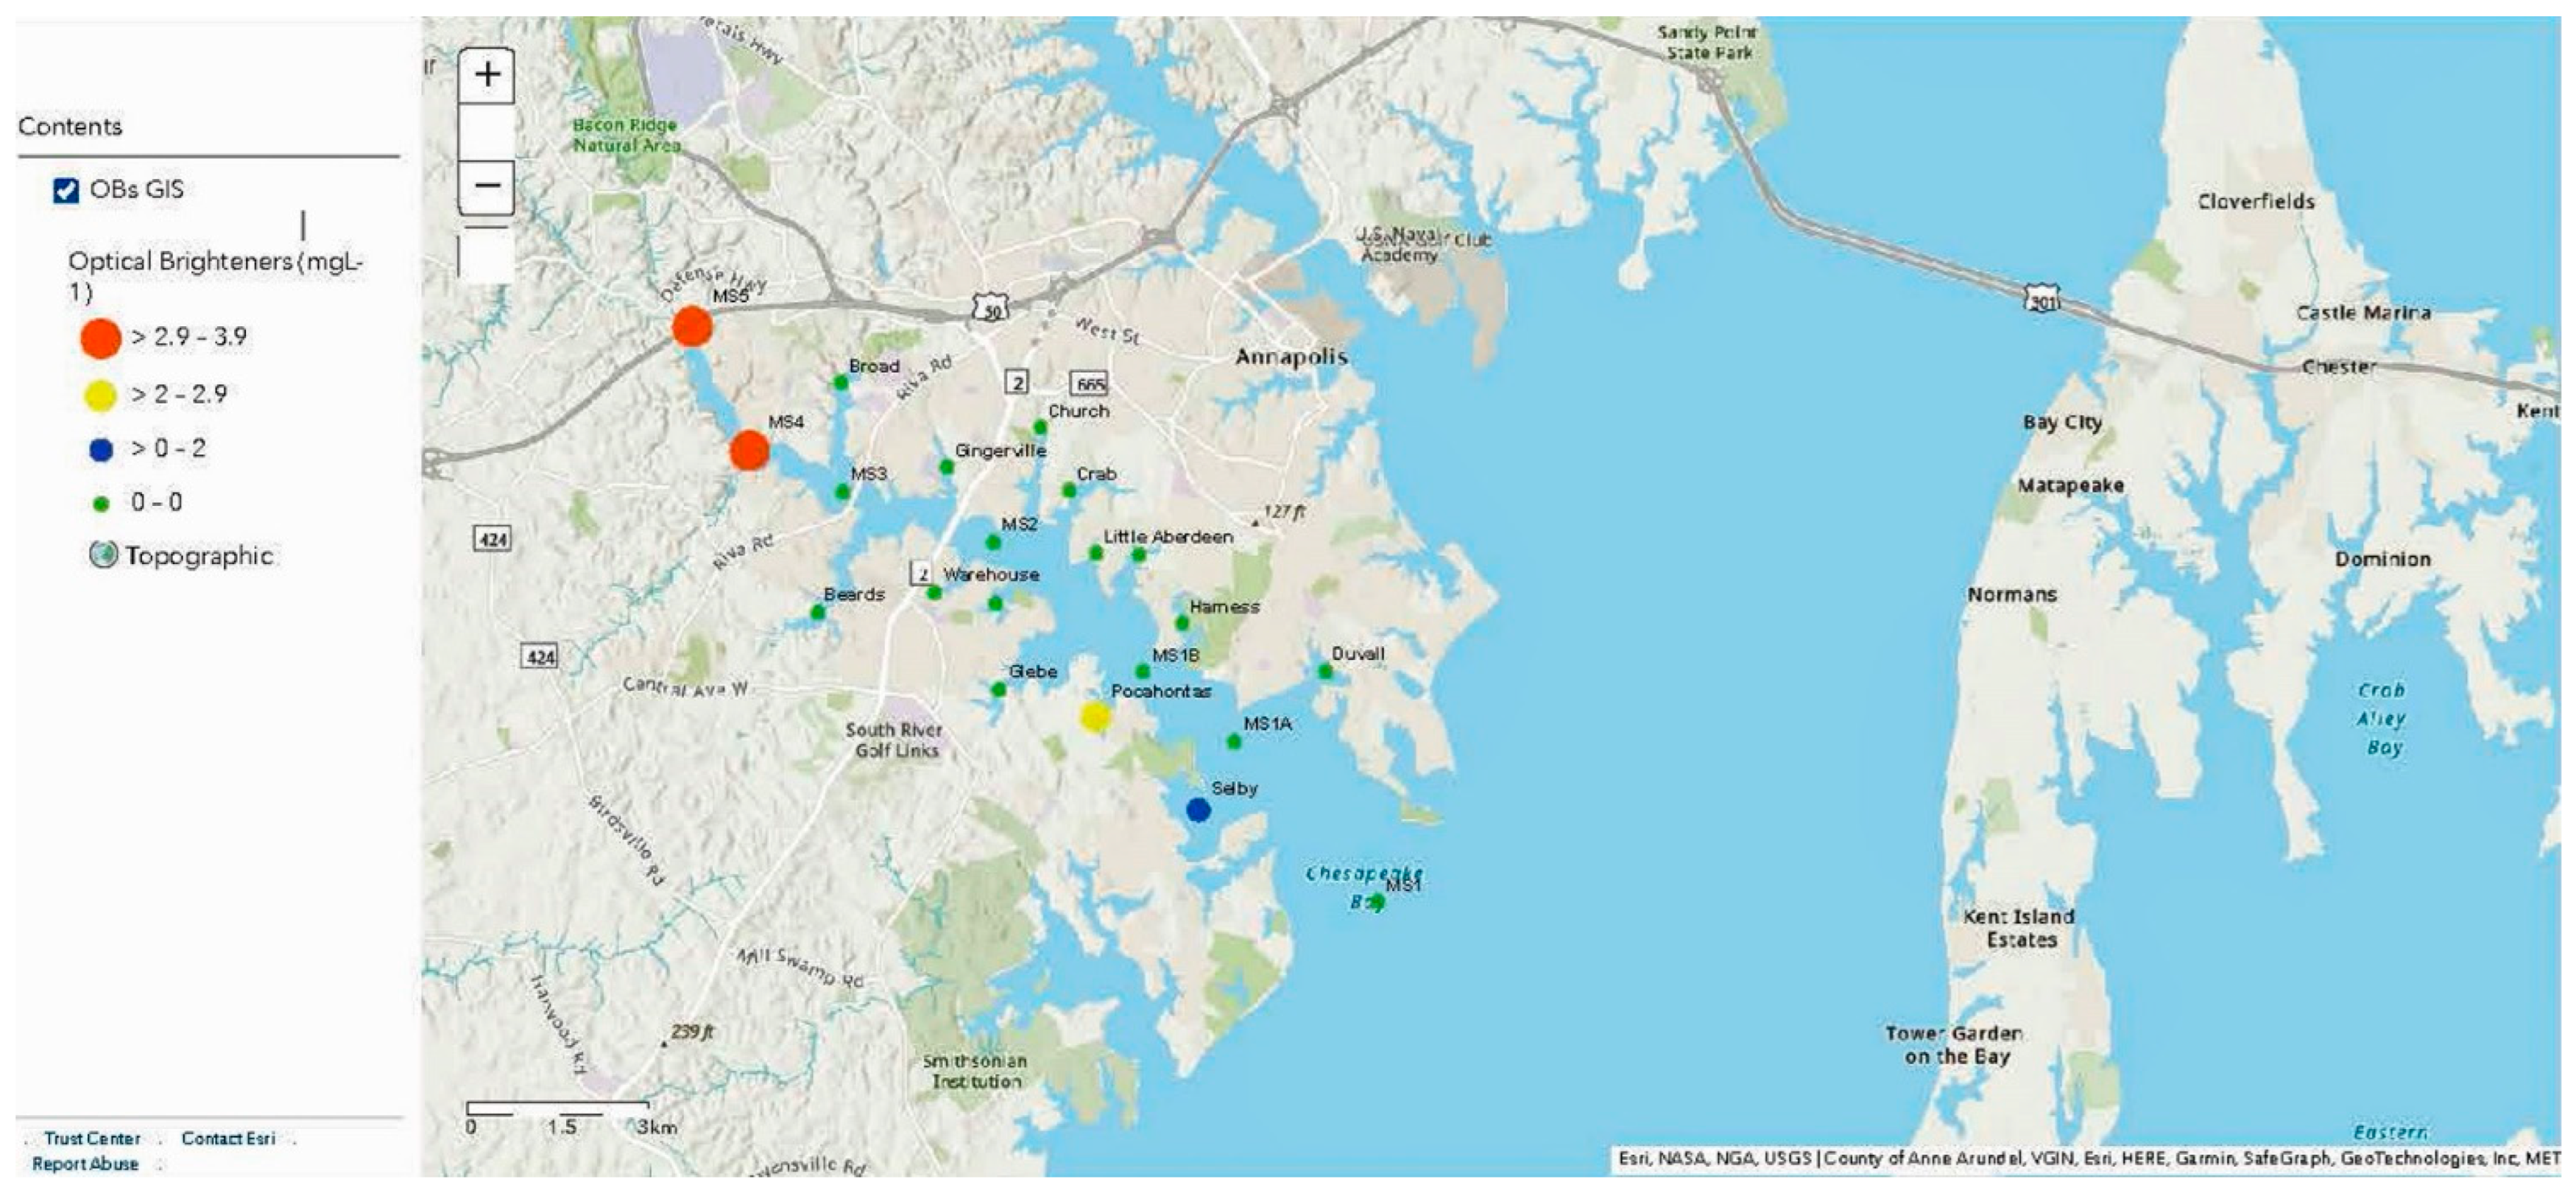
Optical brighteners within the South River are also highly variable but do not appear to display distinct, consistent spatial patterns when examined spatially through GIS mapping. Most sites had concentrations below detection levels for the instrument during much of the sampling campaign. The highest single recorded concentration was at station MS4, with a value of 78.6 mg L−1. Further statistical analysis reveals that optical brighteners are also non-normally distributed, and the One-Way non-parametric ANOVA indicates no significant differences among the sample sites.
Stations MS1 and MS1A are the only sites where no optical brighteners were detected. Except for 2 April 2014 and 13 May 2014, all other dates had at least one site with a measurable concentration of optical brighteners. Some of the sites increased in values to the teens or above; however, 22 April 2014 had the most sites with high concentrations for any day (Figure 8). Interestingly, NOAA precipitation records indicated a significant rainfall event occurred in this watershed six days earlier (https://www.cocorahs.org/ViewData/CountyDailyPrecipReports.aspx?state=MD&county=AA, accessed on 1 December 2021). In the introduction, optical brighteners are a good proxy for leaky septic systems, broken sewer systems, or other nonpoint sources of introduction into the waterway after a rain event.
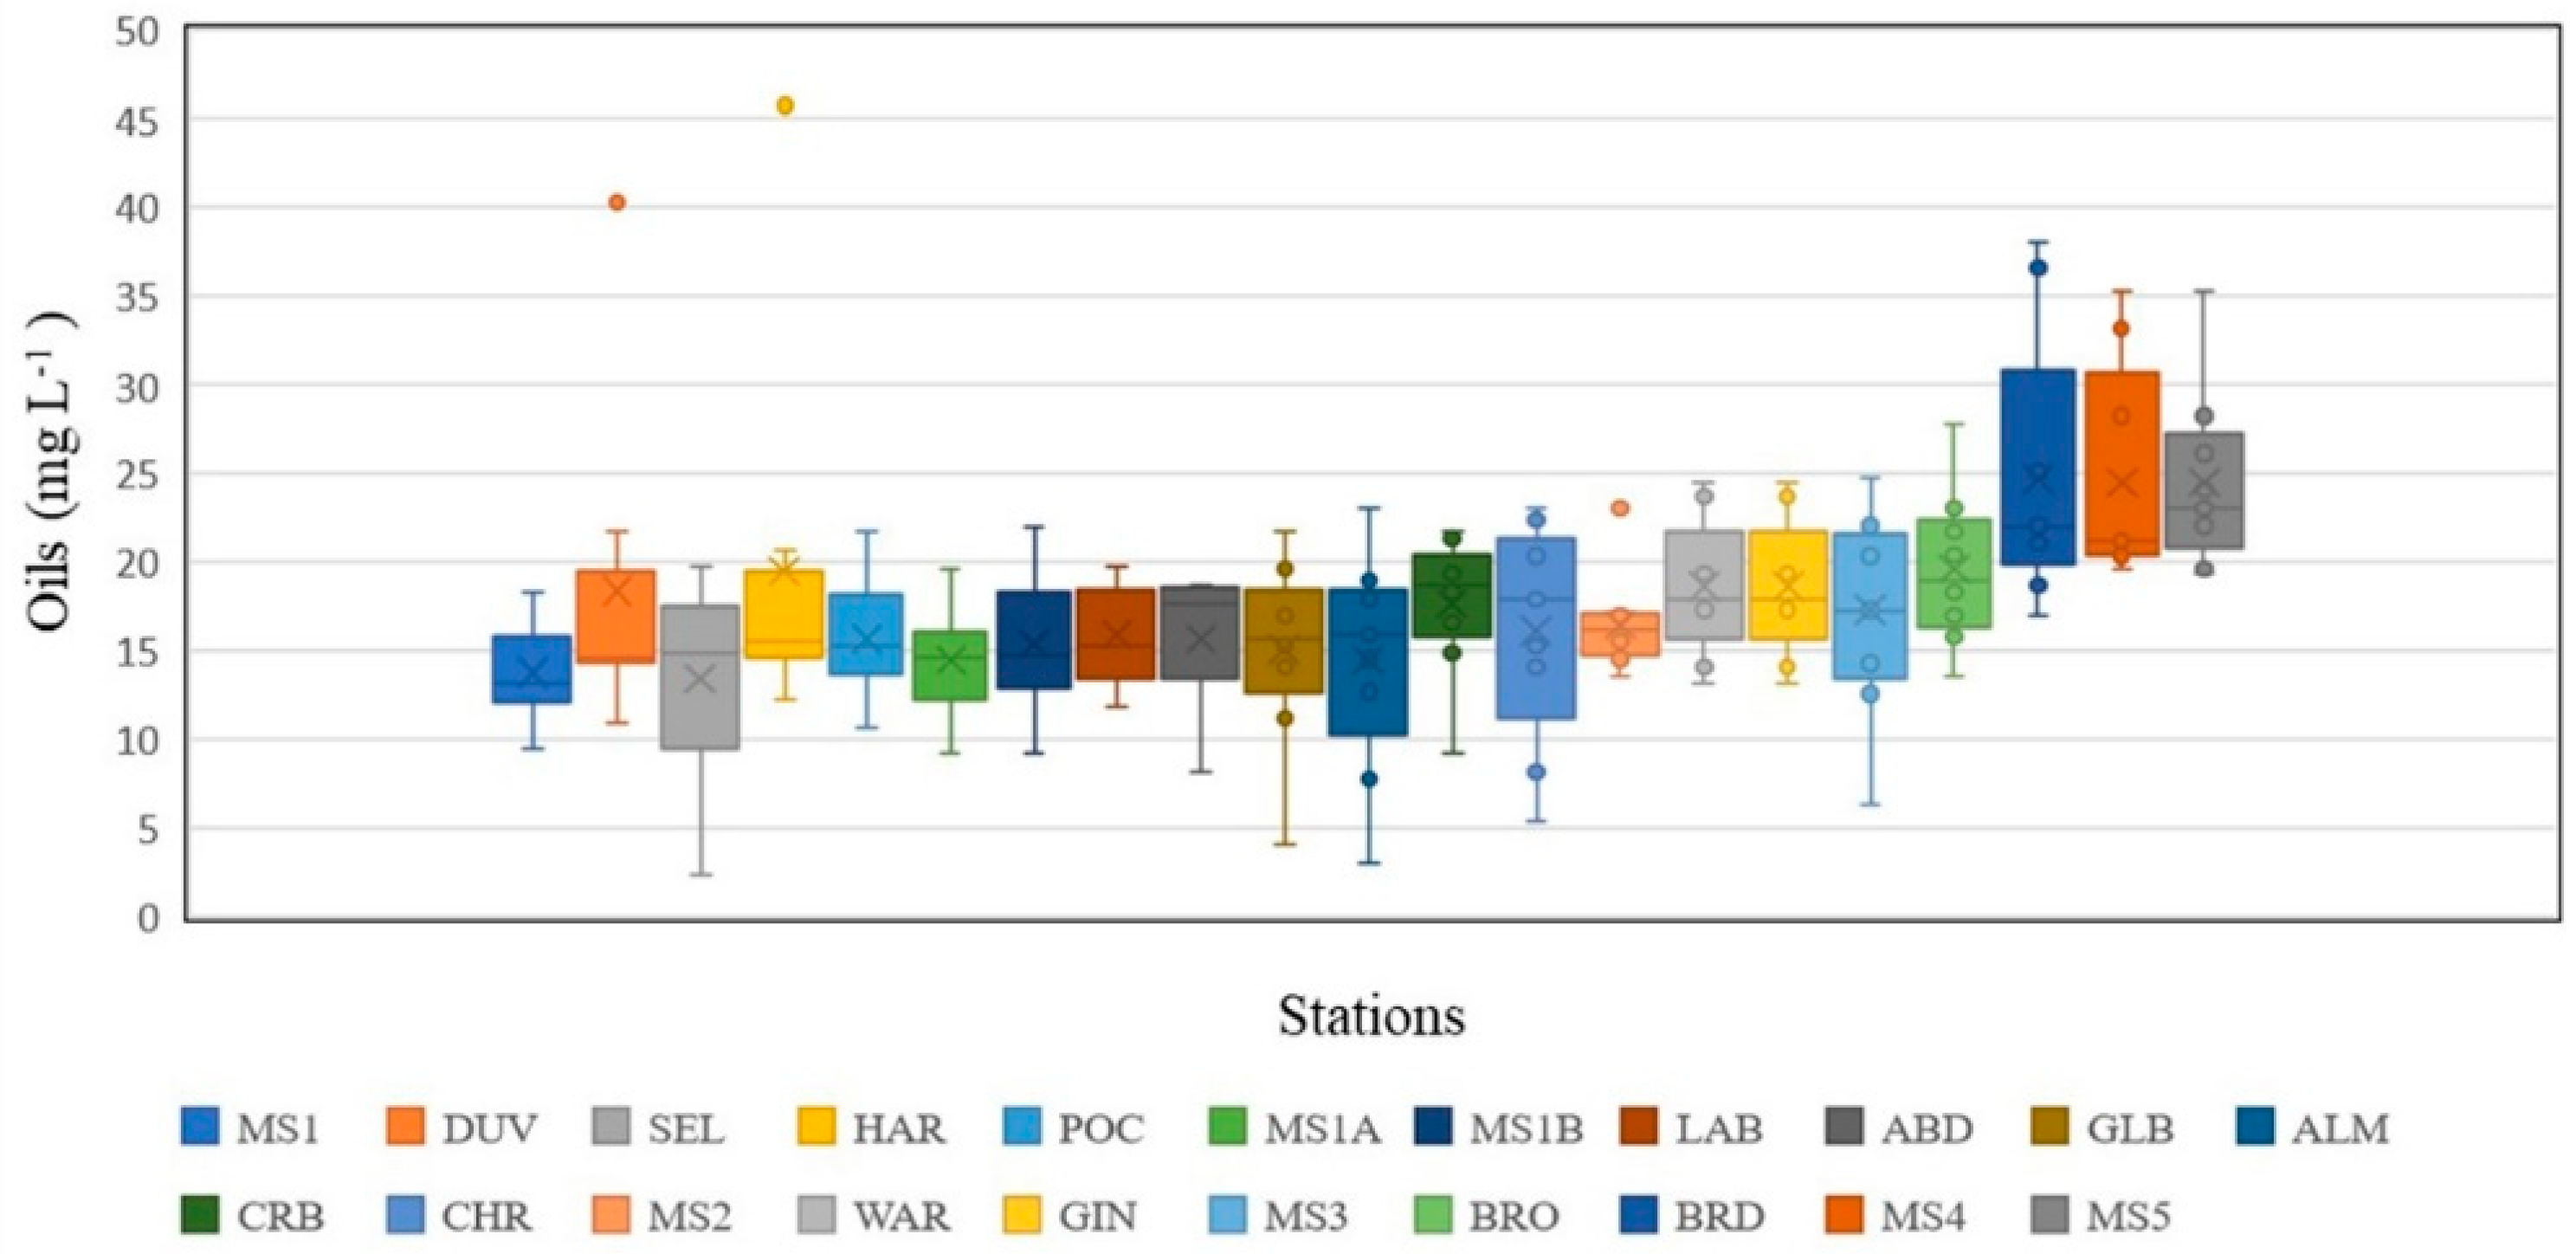
Median values of Oils indicate high values near the headwaters of the South River and the lowest median value at the mouth of the river (Figure 9). The most considerable value reported was Harness Creek Triblet (HAR), 45.76 mg L−1, on 29 October 2013. On the same day, notable high concentrations of oils were detected at GIN, DUV, MS4, and BRD, with concentrations above 20 mg L−1.
Harness Creek Triblet (HAR) has the most extensive range, while Little Aberdeen Creek Triblet LAB and MS1 has the smallest ranges. Statistical results for oils show similar patterns to CDOM, especially the large variability exhibited by both. Oils in the South River are non-normally distributed, so a Kruskal–Wallis non-parametric ANOVA was performed. The ANOVA indicated that at least one of the stations was significantly different from the other medians; therefore, the null hypothesis was rejected. Those sites that are significantly different were identified using the Student-Newman-Keuls Means Comparison method with an α of 0.05. Results indicated that station MS5 has significantly higher values of oils than every other site in the South River, while MS4 was statistically different from all other sites except Beards Creek Triblet (BRD). Beards Creek Triblet (BRD) was also significantly different from all other sites. All other sites contain ranges too large to be statistically different (Figure 10).
The combined fall and spring mixing diagram suggests that oils mainly behave conservatively. However, sites MS 3 and Broad Creek triblet are the main contributors to the small area in the lower left of the diagram, illustrating potentially less conservative behavior and may act as a sink for oils (Figure 11).
TSS values throughout the South River Triblet system displayed moderate concentrations in the range of 1–12 mg L−1, with occasional spikes of much higher concentrations (Table 3). Furthermore, they are consistent with data taken by the State of Maryland’s Department of Natural Resources (MDNR) [62]. No linear relationship was found between TSS, water clarity, Chl-a, or any of these parameters and CDOM.
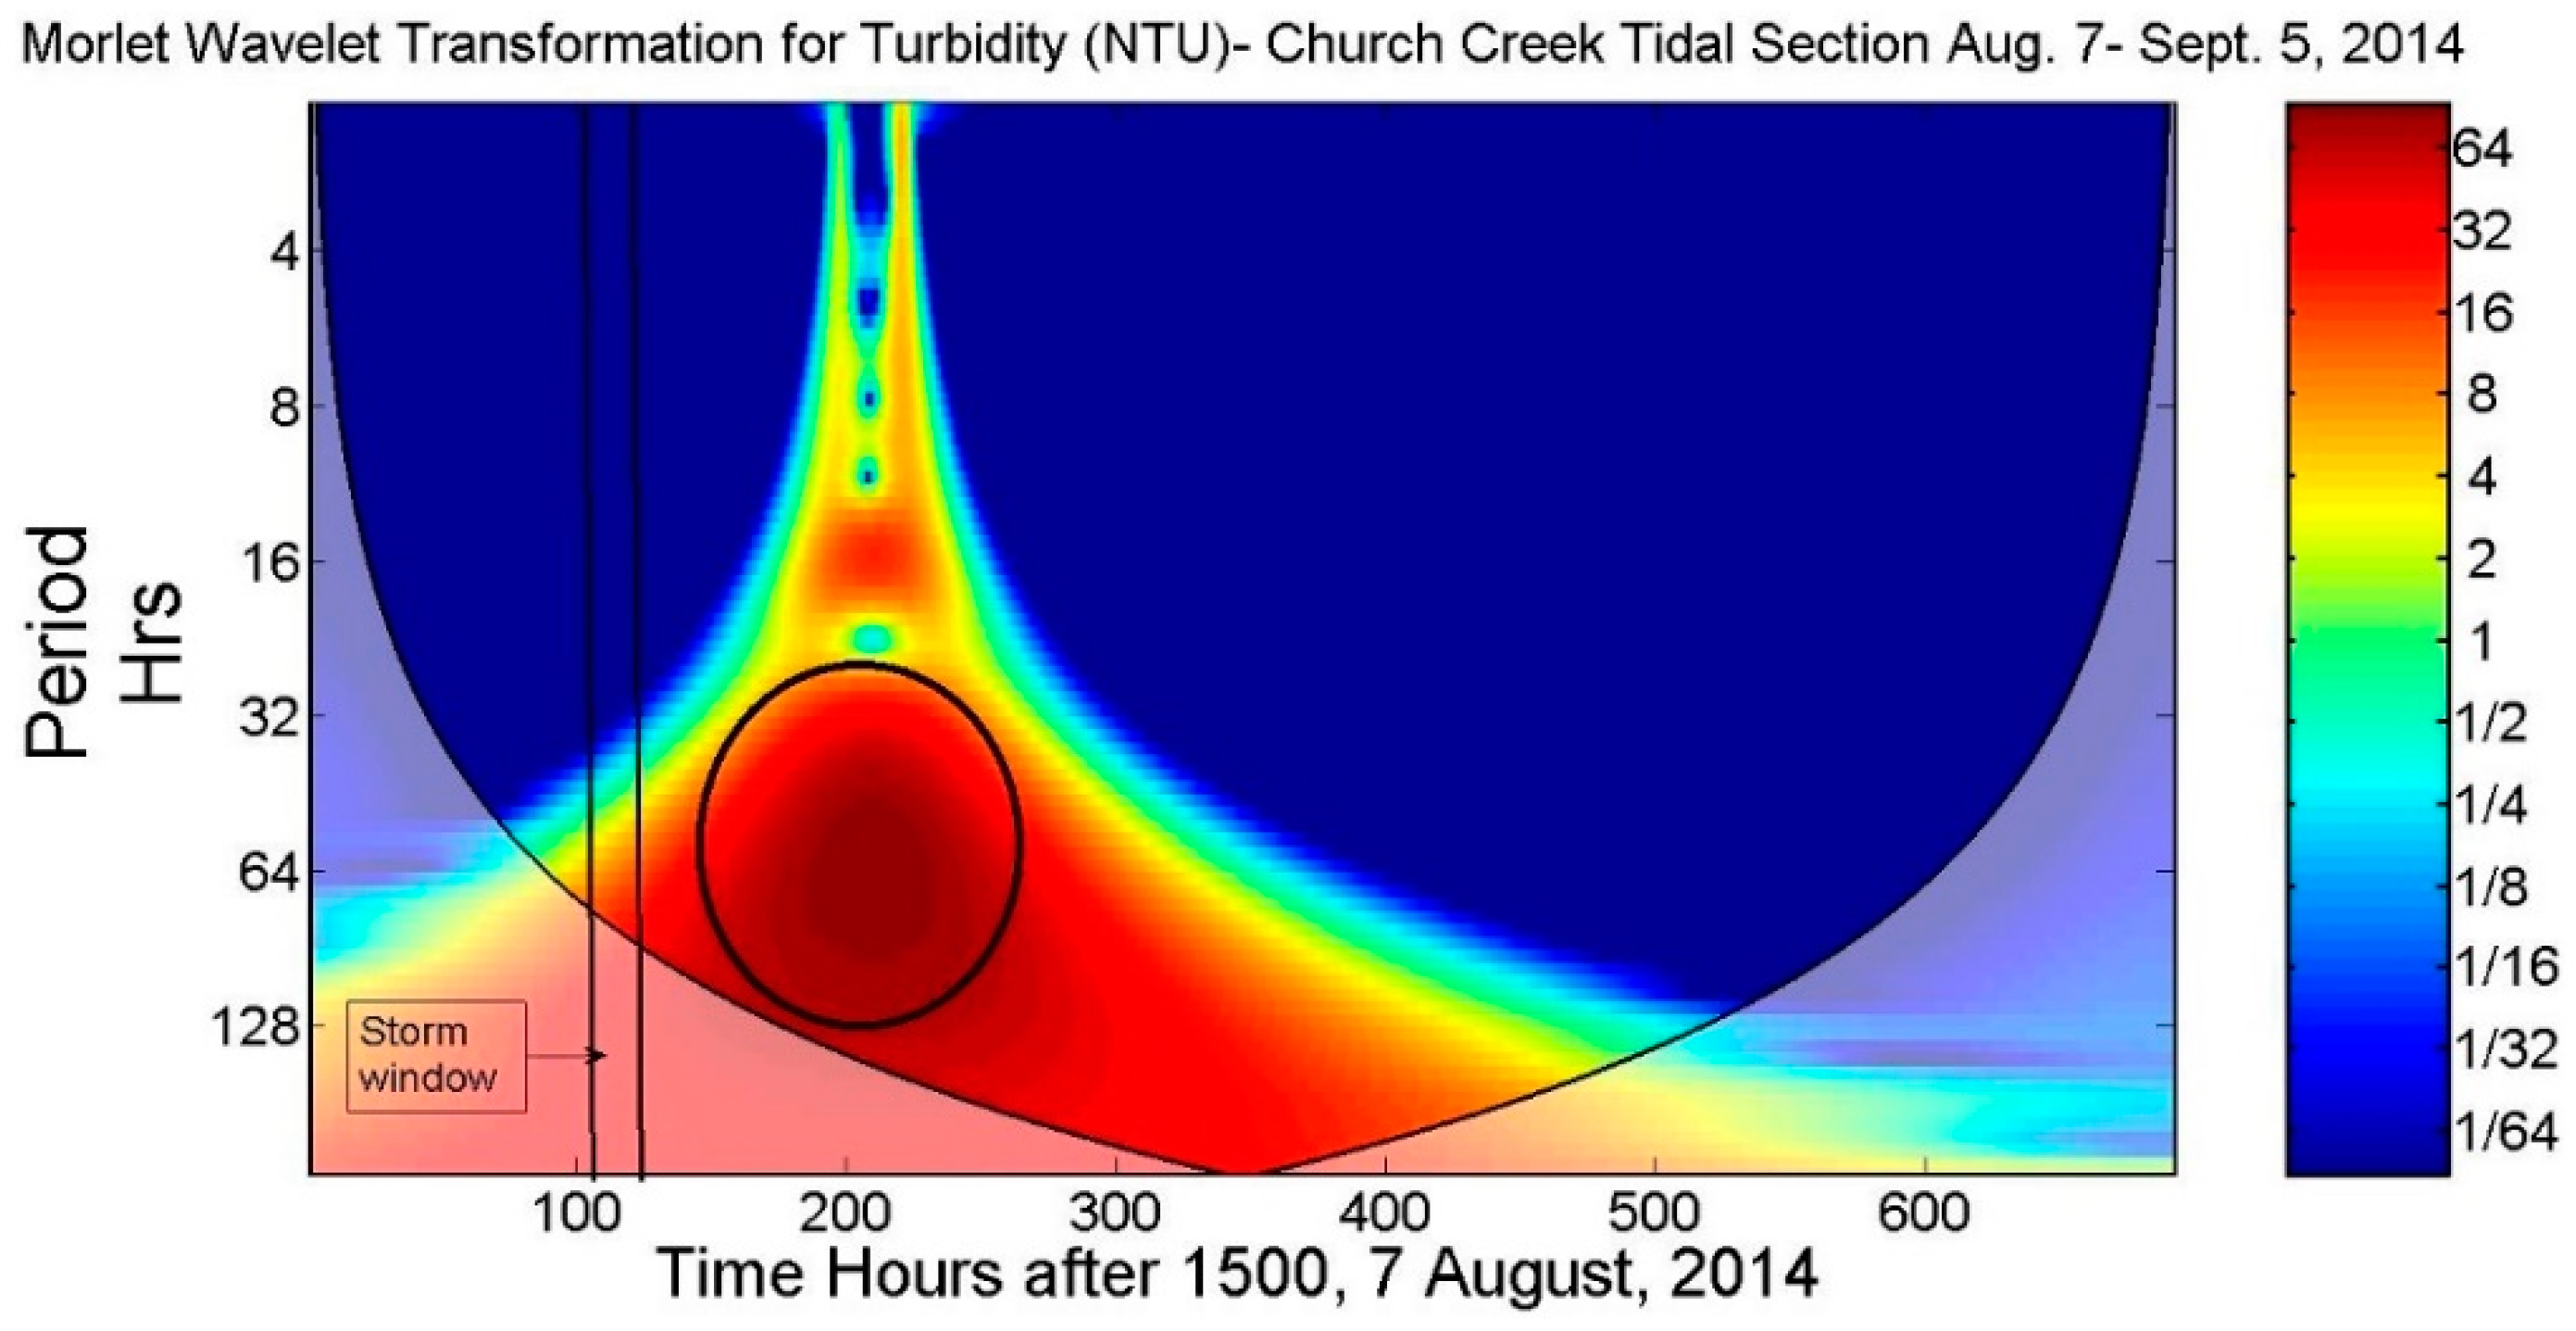
The temporal signature of turbidity within the Church Creek Triblet captured over a month’s worth of data, including a significant storm event via a continuous monitoring sonde, is illustrated by the Morlet continuous wavelet transform shown in Figure 12. During the time interval of 7 August to 5 September 2014, a tropical storm began on 12 August within the South River watershed and lasted for 12 h. This time segment is denoted by the black vertical lines in Figure 12. During this time, wind gusts were reported upwards of 29 knots, and the storm produced over seven inches of rain. Prior to the start of the storm, the average turbidity measured in the tidal section of Church Creek Triblet was 4.1 NTUs. Throughout the actual storm event, the average turbidity increased slightly to 5.3 NTUs; however, the turbidity spiked to over 1100 NTUs three days after the storm had ended. The turbidity spike is recognized in Figure 12 by the peak in the normalized spectral energy during periods at the 200 h mark in the record. The peak lasted for 24 h and began to wane over the next several days, with a total event period of about nine days after the storm’s end.

3.2. Self-Organizing Maps

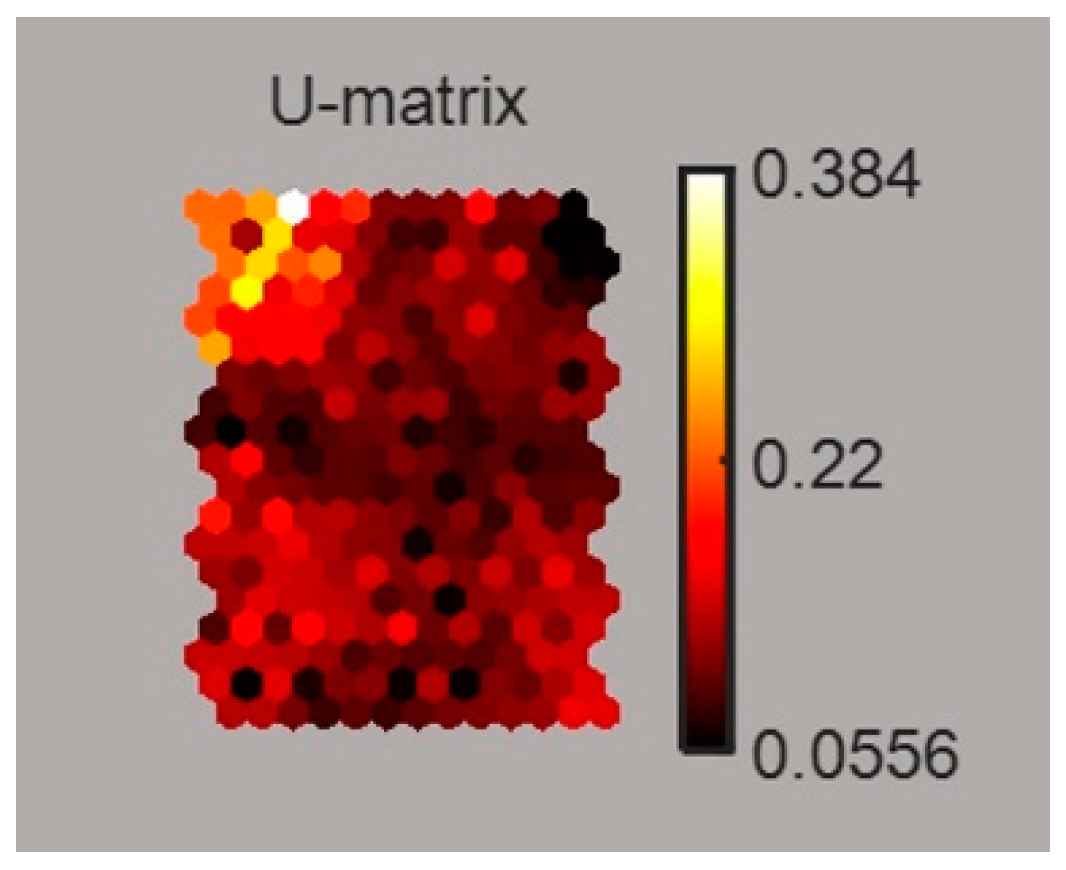
The self-organizing map model created a 10 × 7 hexagonal grid and mapped the 189 × 6 vector to this plane. Two measures of the SOM performance, the quantization error and the topographic error, were calculated using the Kohonen toolbox. The quantization error refers to the distance between the neuron or “best-matching unit” and the data point, calculated by the Euclidian distance formula. The topographic error is a measure of the quality of the map projection in that it tests the degree of local discontinuities in the map [63]. The model developed generated excellent results concerning errors as the quantization error was 0.17 and the topographic error was 0.04. The first result from the SOM model is the U-Matrix plane. The U-Matrix gives a sense of the overall pattern as it represents the unified distance matrix in the model. Lighter areas illustrate smaller distances between neurons, whereas the dark area represents neurons that are further apart. As a result, potential cluster areas may be identified (Figure 13).
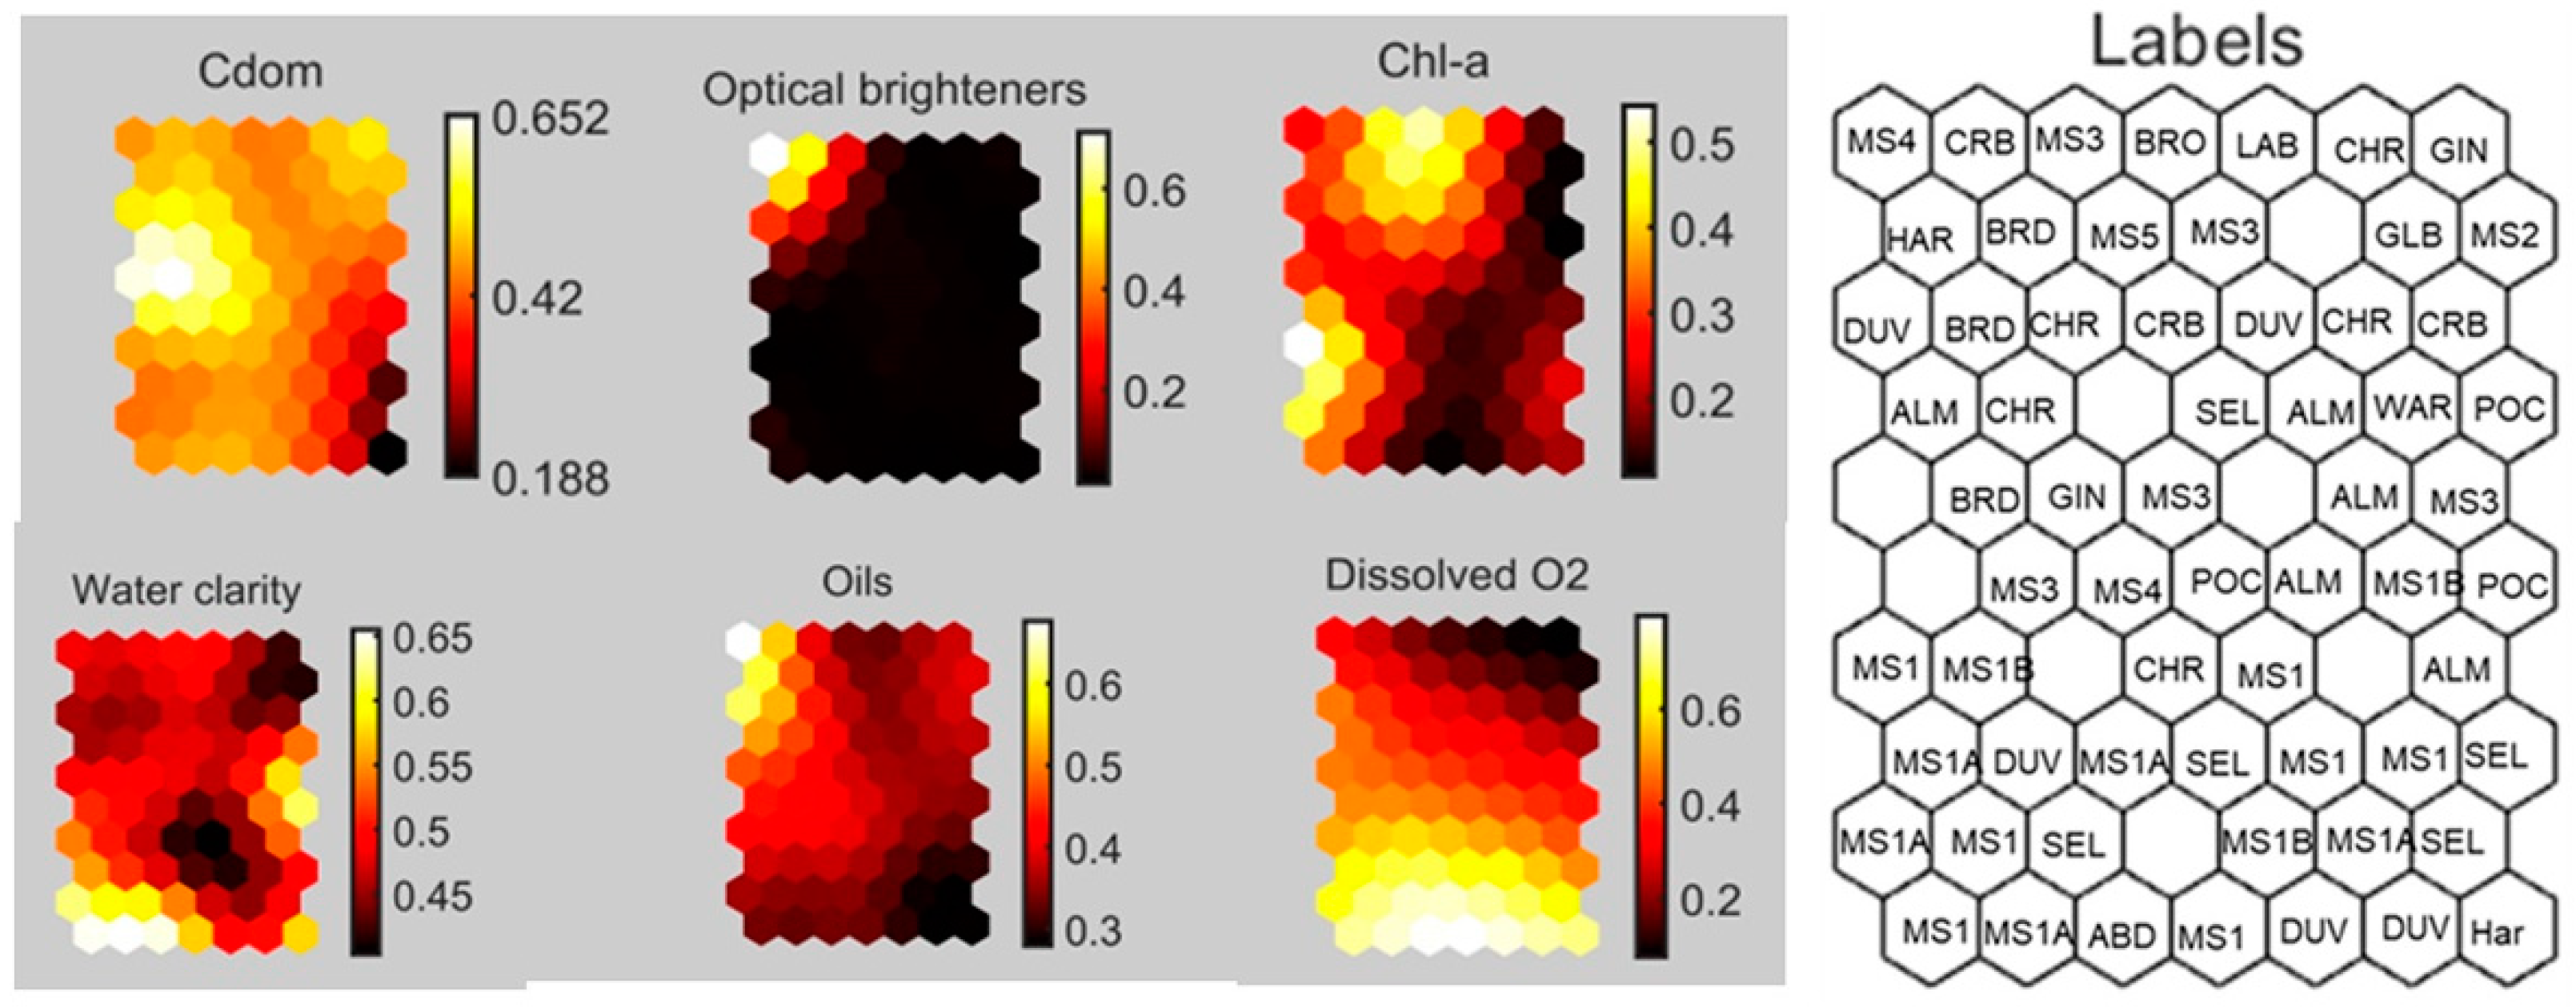
The U-matrix figure suggests a few potential clusters, especially one on the upper left corner, one near the lower left, and one near the right corners. More information can be extracted by visually inspecting the input plane diagrams for each variable. The SOM input plane results for CDOM, Chl-a, oils, optical brighteners, dissolved oxygen, and water clarity via Secchi depth reveal some fascinating patterns (Figure 14).
Starting with the CDOM weight plane, a clear zonation occurs as one moves from the map’s lower right to the upper left. The highest concentrations are clustered mainly towards the upper to mid-left representing stations at the headwaters and towards the middle of the estuary, including BRO, BRD, MS3, CRH, and CRB. The lowest CDOM values are clustered at the bottom right of the map representing stations closest to the mouth of the South River, including SEL, HAR, MS1A, and MS1. The second grouping of high values occurs at the top right corner of the map, representing stations CHR, GIN, MS2, and CRB. Finally, stations with moderately high CDOM are found in the estuary’s central to upper portions (headwaters).
The following input plane is optical brighteners. In this case, much of the map contains low values, with the upper left corner containing high values. This cluster of high values is mainly in the headwaters of the estuary, including MS4, but also includes DUV, CHR, and CRB.
In contrast with the CDOM and OB weight planes, Chl-a displays a different pattern. For Chl-a, the highest values are clustered mainly in the top center portion of the map, which includes stations that are mainly near the headwaters. The second cluster of high values also exists in the lower left. This cluster is best represented by stations towards the mouth of the South River. Finally, the lowest values are contained in a zone that stretches from the upper right across the map and down to the lower middle portion of the map. Stations in this zone are mostly those from the central portion of the river. Most notable are CHR and SEL in this cluster.
Water clarity measured via Secchi disk was included with the input planes to determine if new patterns could be detected. The pattern depicted for water clarity is somewhat patchier than the other input planes, with several clusters of high and low values. The highest values occur in the lower left cluster and represent stations at the estuary’s mouth. Another cluster occurs at the mid-right side containing high values from stations close to the mouth, and a third section at the lower right also contains stations close to the mouth, such as SEL. The map also contains three patches of low Secchi disk values. The upper right corner and lower-middle clusters represent the headwaters and central parts of the river, respectively. Medium to low values are clustered near the mid to upper left portion of the map, again containing stations at the headwaters.
The weight plane for oils demonstrates a clear pattern of low values in the lower right and bottom area to high values in the uppermost left corner. The high-value cluster again represents sites nearest the headwaters, including BRO, MS4, MS3, and other sites such as CRB and DUV. The lowest values for oils are found at sites located mainly at the mouth of the river. There is another pocket of low values in the upper center, representing sites in the central to the upper estuary. For dissolved oxygen, there is a very distinct zonation from the bottom to the top of the matrix, with three very distinct clusters. High values are found at stations close to the mouth with an evident decreasing Secchi depth as one moves towards the headwaters. The lowest values can be found in LAB, CHR, CRB, GIN triblets, and MS2.
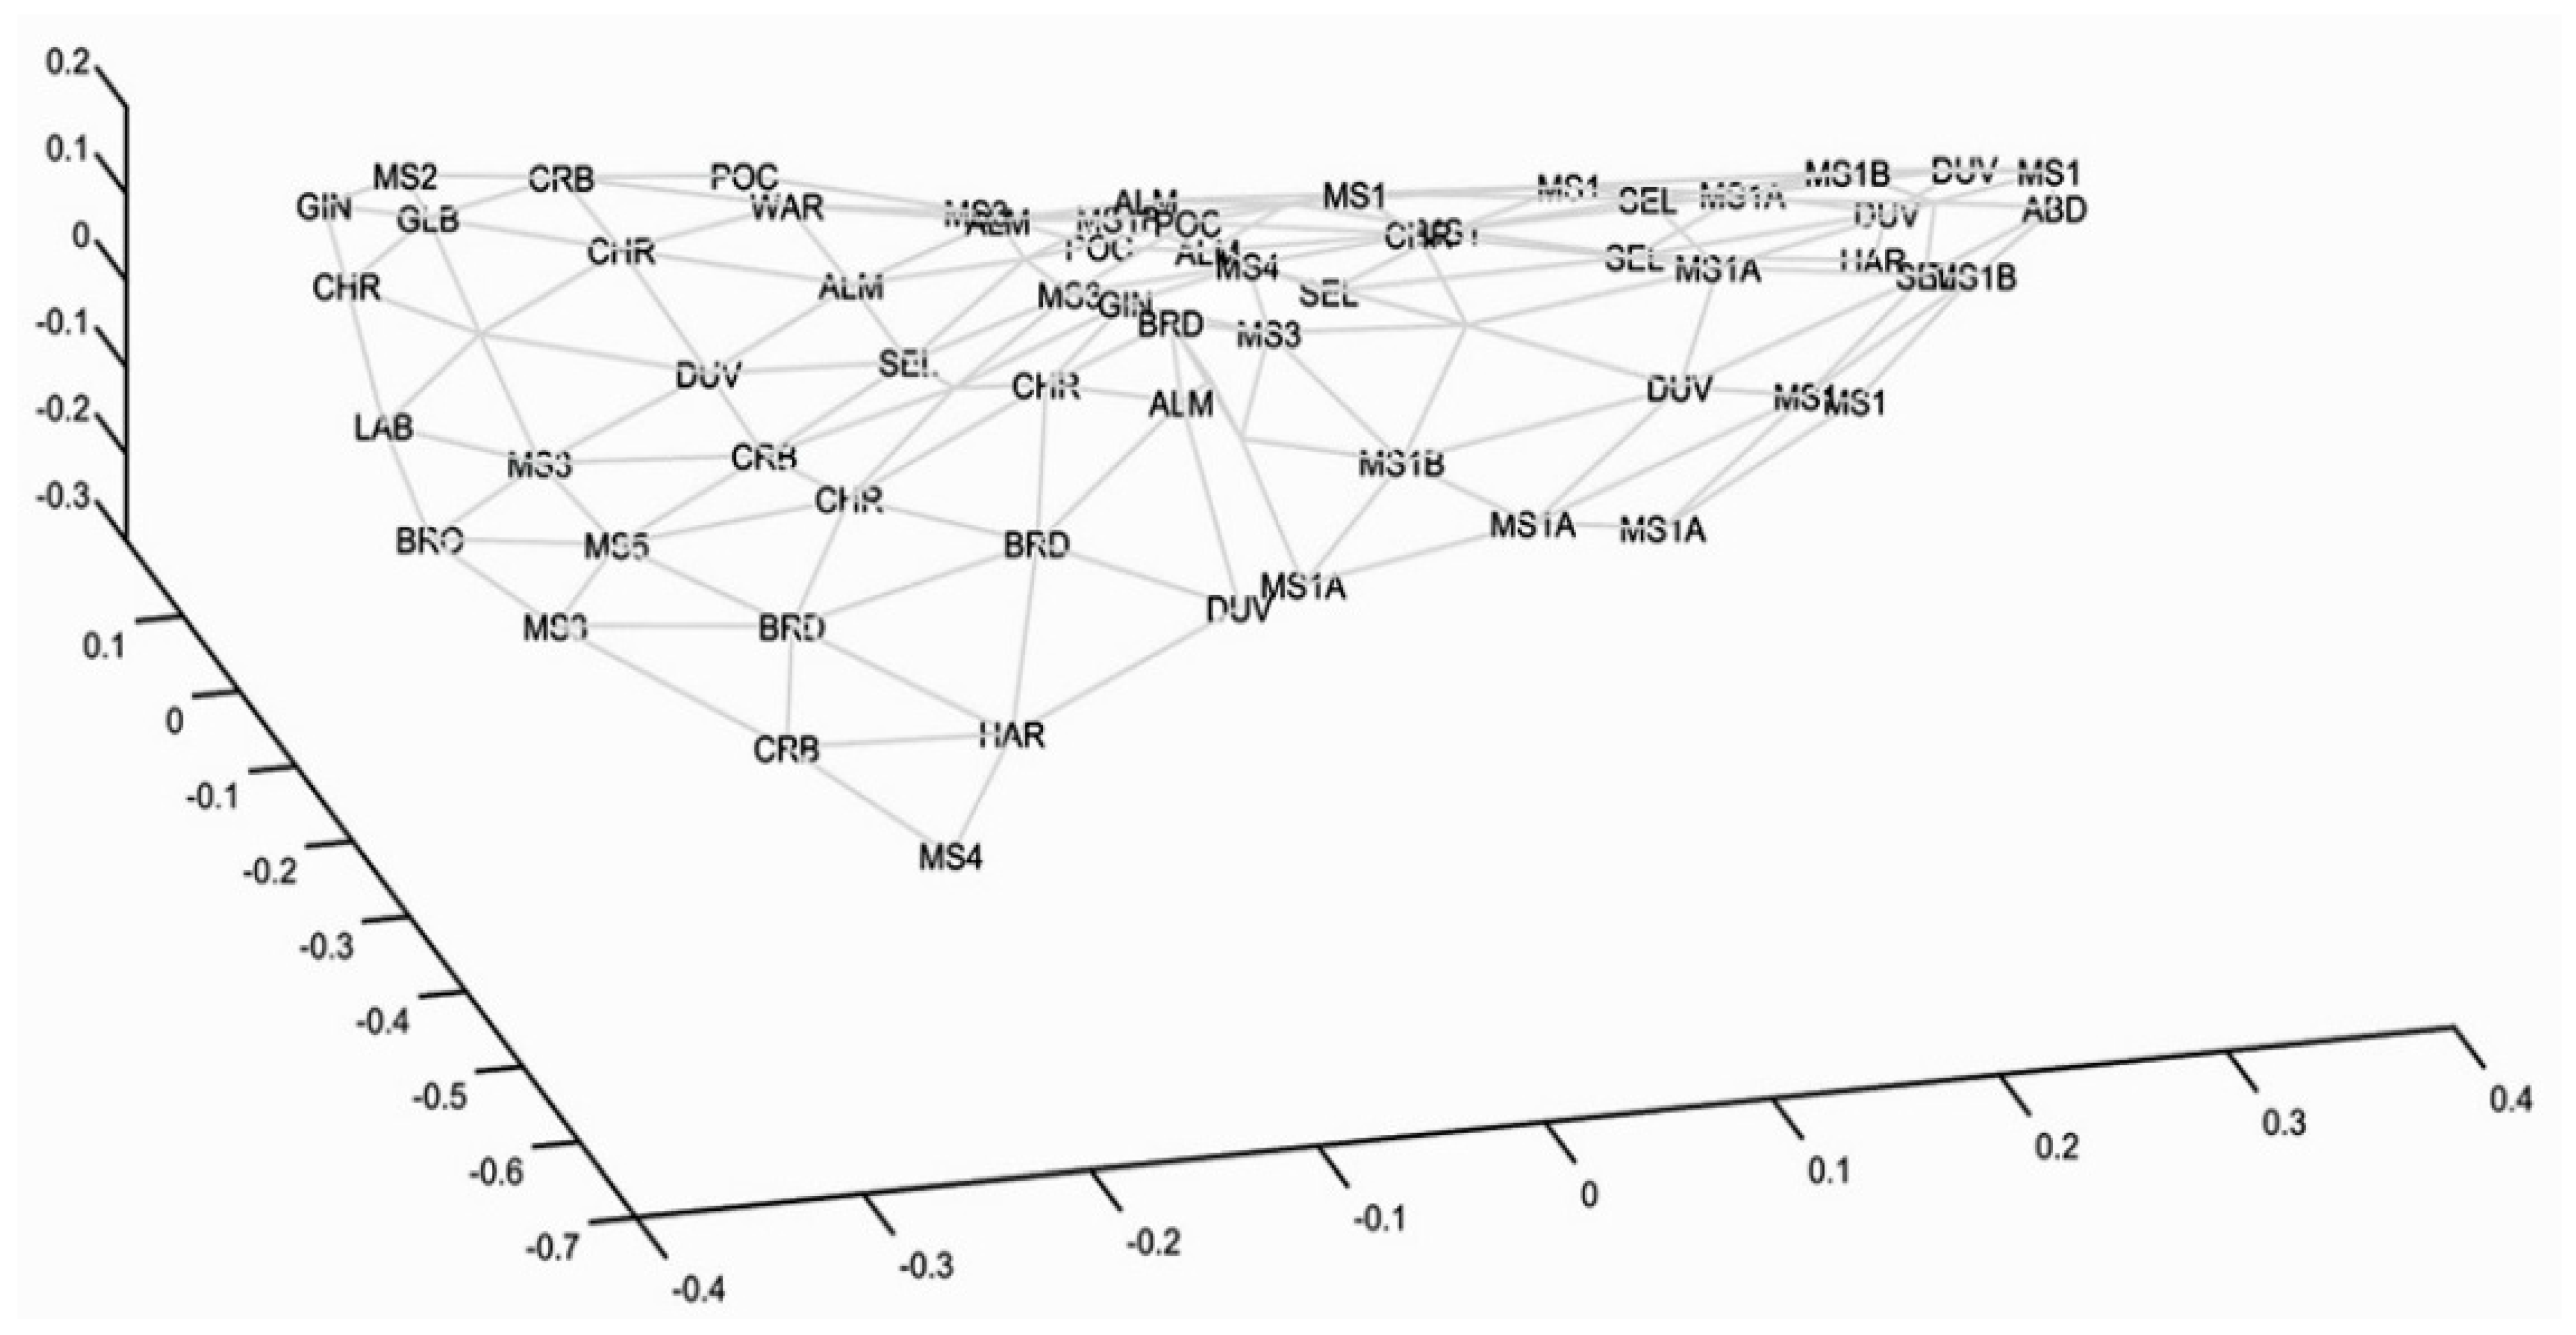
The relationship of the stations to one another can also be visualized through the SOM map-projection graphic. Stations with similar properties are thus closer together in the diagram, whereas those dissimilar are further apart, giving rise to a principal component such as a map (Figure 15).

4. Discussion

Traditional statistical analysis, including GIS mapping, ANOVAs, and mixing plots, suggest that the high degree of variability leading to the non-conservative nature is most likely due to triblet sources and sinks of CDOM. These results further support the notion that creeks or triblets act as nodal points of pollutants to the receiving estuary, as documented in Muller and Muller (2014) [64]. More importantly, the Self-Organizing Maps (SOMs) results concur with this conclusion; however, complex patterns are more easily recognized since they compress the data onto a single 2-D matrix. This allows one to compare all of the inputs in one diagram, and the clustering is not based on prior knowledge of the data structure. Therefore, it tends to be more advantageous than K-means clustering or Principle Component Analysis (PCR). The results indicate that this technique is a powerful tool for elucidating complex patterns in water quality stressors in estuaries that may not be detected using traditional methods. Perhaps the most exciting and informative pattern comparisons between the SOM input planes occur between CDOM, Chl-a, dissolved oxygen, and Secchi depth. While it is clear that CDOM and Chl-a affect water clarity, high values of CDOM appear to match clusters of low Secchi depth.
Conversely, Chl-a has a more robust inverse pattern with dissolved oxygen. Consequently, coupled with the medium to low TSS concentrations, these patterns suggest that CDOM may play a dominant role in poor water clarity within the South River triblet system, leading to low submerged aquatic vegetation (SAV) acreage. The SOM water clarity pattern is very similar to the results of Muller and Muller (2014). The SOM pattern for oils is primarily consistent with the standard non-parametric ANOVA and means comparison tests performed. However, the optical brightener’s results are different. The null hypothesis using the ANOVA for optical brighteners was accepted, suggesting no significant difference among individual triblets, but the SOM tells a different story, as there is clearly a cluster of high values in the upper topological region. Coupling the OB pattern with the wavelet analysis of turbidity in the Church Creek Triblet suggests a 3–6-day time frame for pollutants to work their way through the upper reaches of the triblet system.
Furthermore, the SOM pattern for optical brighteners also appears to match well with the South River septic produced by Anne Arundel County’s Public Works Department (Figure 16). While the South River does not seem to exhibit a significant optical brighteners or oils problem, the ECO Triple and SOM technique may be able to find failing septic infrastructures in small watersheds, areas where septic upgrades would be most beneficial, or where marinas may violate clean practices. Therefore, understanding and documenting the spatial patterns and actual concentrations of CDOM, optical brighteners, and oils in relation to other water quality stressors such as turbidity and Chl-a are essential and have broad overreaching implications regarding the ecological health of these systems. This is especially true given that a significant effort has been made towards restoring the Chesapeake Bay and other similarly degraded estuarine living resources through water quality improvements.
The design for restoring the bay and other estuarine systems within the United States is the EPA’s Total Maximum Daily Load calculations enforced by individual states through the clean water act and serves as a role model for coastal restoration worldwide [65,66]. While there have been some critical documented achievements, including meeting the 2025 goals for nitrogen and phosphorus pollutant loading reductions from several sectors of the main section of the Chesapeake Bay and large tributaries, they come primarily through upgrades in industrial wastewater treatment facilities [67]. Some studies suggest that trends in recent years indicate that the summertime anoxic volume (i.e., dead zone) is decreasing in the mainstem of the Chesapeake Bay [68], and submerged aquatic vegetation has shown signs of recovering [69]. However, some studies suggest that Mainstem Bay water quality trends may be more closely linked to climate fluctuations [70,71]. Even more critical are recent results from studies testing the effectiveness of upland stream restoration efforts in tributaries, and especially triblets where the bulk of the bay population lives. Since 2014, there has been an accelerated effort to implement upland stream restoration “Best Managed Projects” or BMPs. These methods typically involve stream channel reconfigurations to reconnect the valley to the adjacent floodplain, arrest stream bank erosion, remove legacy sediment, and install step pools to slow water down to reduce sediment (TSS) and nutrient pollutant concentrations reaching the receiving estuary per the Chesapeake Bay’s TMDL [72]. This method is often known as Regenerative Stream Conveyance systems (RSC).
Figure 16. Red clusters indicate the Septic systems in this for the South River, MD. Watershed (https://www.aacounty.org/departments/public-works/engineering/forms-and-publications/, accessed on 1 December 2021) [73].
Water 14 02533 g016
Unfortunately, few studies truly document the performance above and below the BMP compared to unrestored tidal creeks of similar character, and most reports mixed results with moderate reductions of TSS and nutrients. Long-term studies within the triblets are necessary, since the statistical evidence shows the importance of examining triblets versus one station in the center of the small estuarine system [74,75]. Some studies also show no statistical differences between restored and unrestored streams, especially for nutrients [76,77]. Even fewer studies exist that measure the effectiveness of these projects to the downstream estuary and typically fail to include CDOM in these studies. This is particularly critical for several reasons. First, regenerative stream conveyance systems, one of the most common upland stream restoration techniques, have decreased pH and dissolved oxygen in surface water streams and groundwater.
Furthermore, this same study that compared water quality between restored and unrestored sites within the Annapolis region, including the South River, indicated that in at least one site, there was up to a 54-percent increase in the release of dissolved organic matter (DOC) than in the adjacent unrestored triblet [78]. Given that the entire reason for performing upland stream restoration is to improve the water quality of the receiving estuary through the TMDL and that the central impairments to the Bay and its tributaries include low dissolved oxygen, high Chl-a, and low water clarity, low pH and DOC exports might exacerbate the estuarine problems rather than improve them. If CDOM concentrations are in part due to exports of DOC related to RS’s or other restoration techniques, then water clarity improvements are not likely to occur in these regions. This may be why there is no improvement in submerged aquatic vegetation (SAV) growth in the small tributaries in this region of the bay. In two decades, there has been no sustained improvement in SAV acreage within the South River or its sister tributaries. Within the South River, the only area that shows appreciable amounts of SAV is in and around Selby Bay (SEL), which is located near the mouth of the estuary and contains some of the lowest CDOM concentrations and better water clarity versus the rest of the estuary. Chen et al. 2014 [78] showed a similar non-conservative CDOM pattern, with the highest values in the upper portion of the Caloosahatchee Estuary of Florida. They also reported that CDOM contributed on average 55 percent of the total light attenuation and that Chl-a contributed only about 12 percent, with the rest being sediment contributions. This compares well with the SOM patterns involving CDOM, Chl-a, water clarity, and the TSS values reported in the South River. As a result, it is apparent that CDOM is a vital water quality stressor in estuaries and that it should be measured, especially in response to upland-restoration practices.

5. Conclusions

This paper presented the baseline concentrations and spatial distribution of CDOM, optical brighteners, and oils using an in situ fluorometric instrumental technique within tidal creeks of a small sub-estuary of the Chesapeake Bay. The results show that the Self-Organizing Map method is a suitable alternative to traditional statistical techniques and may be better at finding key patterns that might otherwise have been obscured by high variability. This research highlights the potential for using these properties as benchmark indicators for restoration effectiveness in estuarine and coastal systems, public awareness of pollutants of emerging concern, and data for coastal resource management.

Author Contributions

Conceptualization, A.C.M. and D.L.M.; methodology, A.C.M. and D.L.M.; software, A.C.M. and D.L.M.; validation, A.C.M.; formal analysis, A.C.M. and D.L.M.; investigation, A.C.M. and D.L.M.; resources, A.C.M. and D.L.M.; data curation, A.C.M.; writing—original draft preparation, A.C.M. and D.L.M.; writing—review and editing, D.L.M.; visualization, A.C.M.; supervision, A.C.M.; project administration, A.C.M.; funding acquisition, A.C.M. and D.L.M. All authors have read and agreed to the published version of the manuscript.

Funding

This research was funded by the Defense Threat Reduction Agency (HDTRA1414199).

Institutional Review Board Statement

Not applicable.

Informed Consent Statement

Not applicable.

Data Availability Statement

Chesapeake Bay Data sets may be found at: https://www.chesapeakebay.net/what/downloads/cbp_water_quality_database_1984_present (accessed on 1 December 2021); weather data sets may be found at: https://www.cocorahs.org/ViewData/CountyDailyPrecipReports.aspx?state=MD&county=AA (accessed on 1 December 2021); submerged aquatic vegetation data sets may be found at: https://www.vims.edu/research/units/programs/sav/access/charts/index.php (accessed on 1 December 2021).

Acknowledgments

The authors would like to acknowledge Arianna Muller and Keaghan Muller for their patience and contributions to the fieldwork.

Conflicts of Interest

The authors declare no conflict of interest.

References

  1. Mustalish, R.A. Optical brighteners: History and technology. Stud. Conserv. 2000, 45, 133–136. [Google Scholar] [CrossRef]
  2. Agardy, T.; Davis, J.; Sherwood, K. Taking Steps toward Marine and Coastal Management: An Introductory Guide; UNEP: Nairobi, Kenya, 2011; ISBN 9789280731736. [Google Scholar] [CrossRef]
  3. Archibold, O.W.; Archibold, O.W. Coastal and marine ecosystems. In Ecology of World Vegetation; Springer: Berlin/Hamburg, Germany, 2011. [Google Scholar]
  4. Aufdenkampe, A.K.; Mayorga, E.; Raymond, P.A.; Melack, J.M.; Doney, S.C.; Alin, S.R.; Aalto, R.E.; Yoo, K. Riverine coupling of biogeochemical cycles between land, oceans, and atmosphere. In Proceedings of the Frontiers in Ecology and the Environment; Wiley: Hoboken, NJ, USA, 2011. [Google Scholar]
  5. Greene, C.M.; Blackhart, K.; Nohner, J.; Candelmo, A.; Nelson, D.M. A National Assessment of Stressors to Estuarine Fish Habitats in the Contiguous USA. Estuaries Coasts 2015, 38, 782–799. [Google Scholar] [CrossRef]
  6. Jennerjahn, T.C.; Mitchell, S.B. Pressures, stresses, shocks and trends in estuarine ecosystems-An introduction and synthesis. Estuar. Coast. Shelf Sci. 2013, 130, 1–8. [Google Scholar] [CrossRef]
  7. Jickells, T. External inputs as a contributor to eutrophication problems. J. Sea Res. 2005, 54, 58–69. [Google Scholar] [CrossRef]
  8. Larsen, F.W.; Turner, W.R.; Mittermeier, R.A. Will protection of 17% of land by 2020 be enough to safeguard biodiversity and critical ecosystem services? ORYX 2015, 49, 74–79. [Google Scholar] [CrossRef]
  9. Luisetti, T.; Turner, R.K.; Jickells, T.; Andrews, J.; Elliott, M.; Schaafsma, M.; Beaumont, N.; Malcolm, S.; Burdon, D.; Adams, C.; et al. Coastal zone ecosystem services: From science to values and decision making; a case study. Sci. Total Environ. 2014, 493, 682–693. [Google Scholar] [CrossRef] [PubMed]
  10. Perillo, G.; Wolanski, E.; Brinson, M.M.; Cahoon, D.R.; Hopkinson, C.S. Coastal wetlands: A Synthesis. In Coastal Wetlands: An Integrated Ecosystem Approach; Elsevier: Amsterdam, The Netherlands, 2019; ISBN 9780080932132. [Google Scholar]
  11. Carpenter, S.R.; Caraco, N.F.; Correll, D.L.; Howarth, R.W.; Sharpley, A.N.; Smith, V.H. Nonpoint pollution of surface waters with phosphorus and nitrogen. Ecol. Appl. 1998, 8, 559–568. [Google Scholar] [CrossRef]
  12. Painting, S.J.; Devlin, M.J.; Malcolm, S.J.; Parker, E.R.; Mills, D.K.; Mills, C.; Tett, P.; Wither, A.; Burt, J.; Jones, R.; et al. Assessing the impact of nutrient enrichment in estuaries: Susceptibility to eutrophication. Mar. Pollut. Bull. 2007, 55, 74–90. [Google Scholar] [CrossRef]
  13. Rabalais, N.N.; Turner, R.E.; Díaz, R.J.; Justić, D. Global change and eutrophication of coastal waters. ICES J. Mar. Sci. 2009, 66, 1528–1537. [Google Scholar] [CrossRef]
  14. Scavia, D.; Field, J.C.; Boesch, D.F.; Buddemeier, R.W.; Burkett, V.; Cayan, D.R.; Fogarty, M.; Harwell, M.A.; Howarth, R.W.; Mason, C.; et al. Climate change impacts on U.S. coastal and marine ecosystems. Estuaries 2002, 25, 149–164. [Google Scholar] [CrossRef]
  15. Seitzinger, S.P.; Sanders, R.W. Contribution of Dissolved Organic Nitrogen from Rivers to Estuarine Eutrophication; John Wiley & Sons: Hoboken, NJ, USA, 1997; Volume 159. [Google Scholar]
  16. Barra Caracciolo, A.; Topp, E.; Grenni, P. Pharmaceuticals in the environment: Biodegradation and effects on natural microbial communities. A review. J. Pharm. Biomed. Anal. 2015, 106, 25–36. [Google Scholar] [CrossRef]
  17. Lopez De Alda, M.J.; Díaz-Cruz, S.; Petrovic, M.; Barceló, D. Liquid chromatography-(tandem) mass spectrometry of selected emerging pollutants (steroid sex hormones, drugs and alkylphenolic surfactants) in the aquatic environment. J. Chromatogr. A 2003, 1000, 503–526. [Google Scholar] [CrossRef]
  18. Moreno-González, R.; Rodriguez-Mozaz, S.; Gros, M.; Barceló, D.; León, V.M. Seasonal distribution of pharmaceuticals in marine water and sediment from a Mediterranean coastal lagoon (SE Spain). Environ. Res. 2015, 138, 326–344. [Google Scholar] [CrossRef] [PubMed]
  19. Pan, B.; Ning, P.; Xing, B. Part V-Sorption of pharmaceuticals and personal care products. Environ. Sci. Pollut. Res. 2009, 16, 106–116. [Google Scholar] [CrossRef] [PubMed]
  20. Zenker, A.; Cicero, M.R.; Prestinaci, F.; Bottoni, P.; Carere, M. Bioaccumulation and biomagnification potential of pharmaceuticals with a focus to the aquatic environment. J. Environ. Manag. 2014, 133, 378–387. [Google Scholar] [CrossRef] [PubMed]
  21. Sinkko, H.; Lukkari, K.; Jama, A.S.; Sihvonen, L.M.; Sivonen, K.; Leivuori, M.; Rantanen, M.; Paulin, L.; Lyra, C. Phosphorus Chemistry and Bacterial Community Composition Interact in Brackish Sediments Receiving Agricultural Discharges. PLoS ONE 2011, 6, e21555. [Google Scholar] [CrossRef]
  22. Levin, L.A.; Ekau, W.; Gooday, A.J.; Jorissen, F.; Middelburg, J.J.; Naqvi, S.W.A.; Neira, C.; Rabalais, N.N.; Zhang, J. Effects of Natural and Human-Induced Hypoxia on Coastal Benthos; EGU: Munich, Germany, 2009; Volume 6, Available online: www.biogeosciences.net/6/2063/2009/ (accessed on 15 June 2020).
  23. Li, P.; Chen, L.; Zhang, W.; Huang, Q. Spatiotemporal distribution, sources, and photobleaching imprint of dissolved organic matter in the Yangtze Estuary and its adjacent sea using fluorescence and parallel factor analysis. PLoS ONE 2015, 10, e0130852. [Google Scholar] [CrossRef]
  24. Menon, H.B.; Sangekar, N.P.; Lotliker, A.A.; Vethamony, P. Dynamics of chromophoric dissolved organic matter in Mandovi and Zuari estuaries-A study through in situ and satellite data. ISPRS J. Photogramm. Remote Sens. 2011, 66, 545–552. [Google Scholar] [CrossRef]
  25. Mostofa, K.M.G.; Liu, C.Q.; Vione, D.; Mottaleb, M.A.; Ogawa, H.; Tareq, S.M.; Yoshioka, T. Colored and chromophoric dissolved organic matter in natural waters. In Photobiogeochemistry of Organic Matter; Springer: Berlin/Hamburg, Germany, 2013; pp. 365–428. [Google Scholar] [CrossRef]
  26. Yang, L.; Guo, W.; Hong, H.; Wang, G. Non-conservative behaviors of chromophoric dissolved organic matter in a turbid estuary: Roles of multiple biogeochemical processes. Estuar. Coast. Shelf Sci. 2013, 133, 285–292. [Google Scholar] [CrossRef]
  27. Coble, P.G.; Spencer, R.G.M.; Baker, A.; Reynolds, D.M. Aquatic Organic Matter Fluorescence. In Aquatic Organic Matter Fluorescence; Cambridge University Press: Cambridge, UK, 2014; pp. 75–122. [Google Scholar]
  28. Dickerson, J.W.; Hagedorn, C.; Hassall, A. Detection and remediation of human-origin pollution at two public beaches in Virginia using multiple source tracking methods. Water Res. 2007, 41, 3758–3770. [Google Scholar] [CrossRef]
  29. Ferrell, G.M.; Grimes, B.H. Effects of centralized and onsite wastewater treatment on the occurrence of traditional and emerging contaminants in streams. J. Environ. Health 2014, 76, 18–27. [Google Scholar] [PubMed]
  30. Application Note: Optical Brighteners Fluorescence Methods. Available online: www.turnerdesigns.com (accessed on 18 August 2021).
  31. Billian, H.; Krometis, L.A.; Thompson, T.; Hagedorn, C. Movement of traditional fecal indicator bacteria and source-tracking targets through septic drainfields. Sci. Total Environ. 2018, 610–611, 1467–1475. [Google Scholar] [CrossRef] [PubMed]
  32. Cao, Y.; Griffith, J.F.; Weisberg, S.B. Evaluation of optical brightener photodecay characteristics for detection of human fecal contamination. Water Res. 2009, 43, 2273–2279. [Google Scholar] [CrossRef] [PubMed]
  33. Dubber, D.; Gill, L.W. Suitability of fluorescent whitening compounds (FWCs) as indicators of human faecal contamination from septic tanks in rural catchments. Water Res. 2017, 127, 104–117. [Google Scholar] [CrossRef] [PubMed]
  34. Hartel, P.G.; Hagedorn, C.; McDonald, J.L.; Fisher, J.A.; Saluta, M.A.; Dickerson, J.W.; Gentit, L.C.; Smith, S.L.; Mantripragada, N.S.; Ritter, K.J.; et al. Exposing water samples to ultraviolet light improves fluorometry for detecting human fecal contamination. Water Res. 2007, 41, 3629–3642. [Google Scholar] [CrossRef]
  35. Hartel, P.G.; Rodgers, K.; Moody, G.L.; Hemmings, S.N.; Fisher, J.A.; McDonald, J.L. Combining targeted sampling and fluorometry to identify human fecal contamination in a freshwater creek. J. Water Health 2008, 6, 105–116. [Google Scholar] [CrossRef]
  36. Rane, A.; Joshi, S.J. Biodecolorization and Biodegradation of Dyes: A Review. Open Biotechnol. J. 2021, 15, 97–108. [Google Scholar] [CrossRef]
  37. Salas, H.; Gutiérrez-Bouzán, C.; López-Grimau, V.; Vilaseca, M. Respirometric Study of Optical Brighteners in Textile Wastewater. Materials 2019, 12, 785. [Google Scholar] [CrossRef]
  38. Mallin, M.A.; Haltom, M.I.; Song, B.; Tavares, M.E.; Dellies, S.P. Bacterial source tracking guides management of boat head waste in a coastal resort area. J. Environ. Manag. 2010, 91, 2748–2753. [Google Scholar] [CrossRef]
  39. USEPA. National Management Measures Guidance to Control Nonpoint Source Pollution from Marinas and Recreational Boating National Management Measures to Control Nonpoint Source Pollution from Marinas and Recreational Boating; USEPA: Washington, DC, USA, 2001.
  40. Graham, W.M.; Condon, R.H.; Carmichael, R.H.; D’ambra, I.; Patterson, H.K.; Linn, L.J.; Hernandez, F.J. Oil carbon entered the coastal planktonic food web during the Deepwater Horizon oil spill. Environ. Res. Lett. 2010, 5, 045301. [Google Scholar] [CrossRef]
  41. Nayar, S.; Goh, B.P.L.; Chou, L.M. The impact of petroleum hydrocarbons (diesel) on periphyton in an impacted tropical estuary based on in situ microcosms. J. Exp. Mar. Bio. Ecol. 2004, 302, 213–232. [Google Scholar] [CrossRef]
  42. Green, R.E.; Bower, A.S.; Lugo-Fernández, A. First Autonomous Bio-Optical Profiling Float in the Gulf of Mexico Reveals Dynamic Biogeochemistry in Deep Waters. PLoS ONE 2014, 9, e101658. [Google Scholar] [CrossRef]
  43. Boomer, K.; Boynton, W.; Muller, A.; Muller, D.; Sellner, K. Revisiting Coastal Land-Water Interactions: The Triblet Connection. Available online: http://www.chesapeake.org/stac (accessed on 18 August 2021).
  44. Watershed Report for Biological Impairment of the South River in Anne Arundel County, Maryland Biological Stressor Identification Analysis Results and Interpretation FINAL; Maryland Department of Environment: Baltimore, MD, USA, 2014.
  45. Total Maximum Daily Load of Sediment in the Non-tidal South River Watershed, Anne Arundel County, Maryland; Technical Report; Maryland Department of Environment: Baltimore, MD, USA, 2017.
  46. Hydrolab DS5X, DS5, and MS5 Water Quality Multiprobes; Hydrolab: Austin, TX, USA, 2006.
  47. ECO 3-Measurement Sensor (Triplet) User’s Guide ECO-Triplet User’s Guide (Triplet) Revision M 11. 2007. Available online: www.wetlabs.com (accessed on 12 August 2021).
  48. NEMI Method Summary-160.2. Available online: https://www.nemi.gov/methods/method_summary/5213/ (accessed on 20 January 2022).
  49. Torrence, C.; Compo, G. A practical Guide to wavelet analysis. Bull. Am. Meteorol. Soc. Progr. Atmos. Ocean. Sci. 1998, 79, 61–78. [Google Scholar] [CrossRef]
  50. Kohonen, T. The self-organizing map. Neurocomputing 1998, 21, 1–6. [Google Scholar] [CrossRef]
  51. Kim, D.-K.; Jo, H.; Han, I.; Kwak, I.-S. Explicit Characterization of Spatial Heterogeneity Based on Water Quality, Sediment Contamination, and Ichthyofauna in a Riverine-to-Coastal Zone. Int. J. Environ. Res. Public Health 2019, 16, 409. [Google Scholar] [CrossRef]
  52. Kim, D.K.; Javed, A.; Yang, C.; Arhonditsis, G.B. Development of a mechanistic eutrophication model for wetland management: Sensitivity analysis of the interplay among phytoplankton, macrophytes, and sediment nutrient release. Ecol. Inform. 2018, 48, 198–214. [Google Scholar] [CrossRef]
  53. Ejarque-Gonzalez, E.; Butturini, A. Self-Organising Maps and Correlation Analysis as a Tool to Explore Patterns in Excitation-Emission Matrix Data Sets and to Discriminate Dissolved Organic Matter Fluorescence Components. PLoS ONE 2014, 9, e99618. [Google Scholar] [CrossRef] [PubMed]
  54. Richardson, A.J.; Risi En, C.; Shillington, F.A. Using self-organizing maps to identify patterns in satellite imagery. Prog. Oceanogr. 2003, 59, 223–239. [Google Scholar] [CrossRef]
  55. Chon, T.-S.; Kwak, I.-S.; Park, Y.-S.; Kim, T.-H.; Kim, Y. Patterning and short-term predictions of benthic macroinvertebrate community dynamics by using a recurrent artificial neural network. Ecol. Modell. 2001, 146, 181–193. Available online: www.elsevier.com/locate/ecolmodel (accessed on 13 August 2021). [CrossRef]
  56. Giraudel, J.L.; Lek, S. A comparison of self-organizing map algorithm and some conventional statistical methods for ecological community ordination. Ecol. Modell. 2001, 146, 329–339. [Google Scholar] [CrossRef]
  57. Pal, N.R.; Pal1, S. Editorial computational intelligence for pattern recognition. Int. J. Pattern Recognit. Artif. Intell. 2002, 16, 773–779. [Google Scholar] [CrossRef]
  58. Kohonen and CPANN Toolbox for Matlab-File Exchange-MATLAB Central. Available online: https://www.mathworks.com/matlabcentral/fileexchange/100696-kohonen-and-cpann-toolbox-for-matlab?s_tid=prof_contriblnk (accessed on 12 June 2022).
  59. Vesanto, J.; Himberg, J.; Alhoniemi, E.; Parhankangas, J. SOM Toolbox for Matlab 5 Libella Oy Espoo 2000 SOM Toolbox for Matlab 5. 2000. Available online: http://www.cis.hut.fi/projects/somtoolbox/ (accessed on 13 August 2021).
  60. Kohonen, T. Self-Organizing Maps; Springer Series in Information Sciences; Springer: Berlin/Heidelberg, Germany, 2001; Volume 30, ISBN 978-3-540-67921-9. [Google Scholar]
  61. Wandeto, J.M.; Dresp-Langley, B. The quantization error in a Self-Organizing Map as a contrast and colour specific indicator of single-pixel change in large random patterns. Neural Netw. 2019, 119, 273–285. [Google Scholar] [CrossRef]
  62. Anne Arundel County South River Watershed Summary Report; Technical Report; CH2MHill, KCI Technology: Englewood, CO, USA, 2008.
  63. Digitalcommons@uri, D.; Breard, G.T. Evaluating Self-Organizing Map Quality Measures as Convergence Criteria. Master’s Thesis, University of Rhode Island, South Kingstown, RI, USA, 2017. [Google Scholar] [CrossRef]
  64. Muller, A.; Muller, D. Analysis of nodal point pollution, variability, and sustainability in mesohaline tidal creeks. Mar. Pollut. Bull. 2014, 85, 204–213. [Google Scholar] [CrossRef] [PubMed]
  65. Moore, C.; Guignet, D.; Maguire, K.B.; Dockins, C.; Simon, N.B. Valuing Ecological Improvements in the Chesapeake Bay and the Importance of Ancillary Benefits. J. Benefit Cost Anal. 2018, 9, 27–66. [Google Scholar] [CrossRef] [PubMed]
  66. Vallero, D.A. Chapter 3, Environmental Biochemodynamic Processes. In Environmental Biotechnology: A Biosystems Approach; Academic Press: Amsterdam, The Netherlands, 2010. [Google Scholar]
  67. Zhang, Q.; Murphy, R.R.; Tian, R.; Forsyth, M.K.; Trentacoste, E.M.; Keisman, J.; Tango, P.J. Chesapeake Bay’s water quality condition has been recovering: Insights from a multimetric indicator assessment of thirty years of tidal monitoring data EPA Public Access. Sci. Total Environ. 2018, 637–638, 1617–1625. [Google Scholar] [CrossRef]
  68. Murphy, R.R.; Kemp, W.M.; Ball, W.P. Long-Term Trends in Chesapeake Bay Seasonal Hypoxia, Stratification, and Nutrient Loading. Estuaries Coasts 2011, 34, 1293–1309. [Google Scholar] [CrossRef]
  69. Lefcheck, J.S.; Orth, R.J.; Dennison, W.C.; Wilcox, D.J.; Murphy, R.R.; Keisman, J.; Gurbisz, C.; Hannam, M.; Brooke Landry, J.; Moore, K.A.; et al. Long-term nutrient reductions lead to the unprecedented recovery of a temperate coastal region. Proc. Natl. Acad. Sci. USA 2018, 115, 3658–3662. [Google Scholar] [CrossRef]
  70. Scully, M.E. The Importance of Climate Variability to Wind-Driven Modulation of Hypoxia in Chesapeake Bay. J. Phys. Oceanogr. 2010, 40, 1435–1440. [Google Scholar] [CrossRef]
  71. Muller, A.C.; Muller, D.L. Forecasting future estuarine hypoxia using a wavelet based neural network model. Ocean Model. 2015, 96, 314–323. [Google Scholar] [CrossRef]
  72. Williams, M.R.; Wessel, B.M.; Filoso, S. Sources of iron (Fe) and factors regulating the development of flocculate from Fe-oxidizing bacteria in regenerative streamwater conveyance structures. Ecol. Eng. 2016, 95, 723–737. [Google Scholar] [CrossRef]
  73. Anne Arundel County, MD Septic Systems|GIS Map Data|Anne Arundel County, Maryland|Koordinates. Available online: https://koordinates.com/layer/98935-anne-arundel-county-md-septic-systems/ (accessed on 20 January 2022).
  74. Newcomer Johnson, T.A.; Kaushal, S.S.; Mayer, P.M.; Smith, R.M.; Sivirichi, G.M. Nutrient Retention in Restored Streams and Rivers: A Global Review and Synthesis. Water 2016, 8, 116. [Google Scholar] [CrossRef]
  75. Filoso, S.; Smith, S.M.C.; Williams, M.R.; Palmer, M.A. The Efficacy of Constructed Stream-Wetland Complexes at Reducing the Flux of Suspended Solids to Chesapeake Bay. Environ. Sci. Technol. 2015, 49, 8986–8994. [Google Scholar] [CrossRef] [PubMed]
  76. Goldman, M.A.; Needelman, B.A. Wetland Restoration and Creation for Nitrogen Removal: Challenges to Developing a Watershed-Scale Approach in the Chesapeake Bay Coastal Plain. Adv. Agron. 2015, 132, 1–38. [Google Scholar] [CrossRef]
  77. Liang, D.; Harris, L.A.; Testa, J.M.; Lyubchich, V.; Filoso, S. Detection of the effects of stormwater control measure in streams using a Bayesian BACI power analysis. Sci. Total Environ. 2019, 661, 386–392. [Google Scholar] [CrossRef]
  78. Chen, Z.; Doering, P.H.; Ashton, M.; Orlando, B.A. Mixing Behavior of Colored Dissolved Organic Matter and Its Potential Ecological Implication in the Caloosahatchee River Estuary, Florida. Estuaries Coasts 2015, 38, 1706–1718. [Google Scholar] [CrossRef]
Figure 1. (a) Location of the South River Estuary on the western shore of Chesapeake Bay, Maryland, USA. (b) Location of the research sites with the main stem and triblet stations.
Water 14 02533 g001
Figure 2. Computing schematic example of a Self-Organizing Map. (a) This represents the input data. (b) Illustrates data being mapped to the hexagons for the model. (c) Illustrates the winning neuron process based on the Euclidian distancing method. (d) Final input plane.
Water 14 02533 g002
Figure 3. Vertical profiles in shallow triblet (<2 m) Church Creek. (a) weak thermocline (b) well-mixed with respect to salinity (c) Dissolved oxygen exhibits near saturation conditions at the surface, hypoxic at 1.5 m. (d) Chlorophyll-a high at the surface to 1 m. (f) CDOM with a maximum at 1 m.
Water 14 02533 g003
Figure 4. Spring vertical profiles in triblets of the South River Estuary, Beards Creek Triblet. (a) Temperature is well mixed. (b) Salinity indicates a weak halocline. (c) Surface DO supersaturated due to high winds and the spring bloom. (d) Chlorophyll-a concentrations are indicative of a spring bloom. (e) Phycoerythrin is inversely low compared to chlorophyll-a but still shows concentrations of blue-green algae. (f) CDOM concentrations are high at the surface (1 m).
Water 14 02533 g004
Figure 5. CDOM median concentrations indicate the source of CDOM is in the headwaters of the triblets/estuary and not sourced from the Chesapeake Bay.
Water 14 02533 g005
Figure 6. Mixing diagrams for CDOM, (a) spring mixing diagram, (b) fall mixing diagram.
Water 14 02533 g006
Figure 7. Box and whisker plot illustrating the results for CDOM. The three box and whiskers to the right are the Triblets Beards (BRD), Broad (BRO), and MS5 which are similar to each other and different from all other stations.
Water 14 02533 g007
Figure 8. GIS map of Optical Brightener concentrations in the South River Estuary and corresponding triblets.
Water 14 02533 g008
Figure 9. GIS map of surficial oil concentration in the main stem and corresponding triblets of the South River estuary.
Water 14 02533 g009
Figure 10. Box and whisker plot for the general Oil concentrations in the main stem and triblet locations, South River, MD. Triblet BRD and MS4 are like each other, but different from all other stations. Whereas MS5 is completely different from all other stations.
Water 14 02533 g010
Figure 11. Mixing diagram for general oils, South River main stem, and triblets research sites.
Water 14 02533 g011
Figure 12. Morlet continuous wavelet transform of turbidity (NTUs) was captured from 7 August to 5 September 2014 in the Church Creek Triblet. The black circle represents 95 percent confidence above red noise. The bottom boundary is the cone of influence. Peak energy occurs at 64–75 h or 3-day periodicity.
Water 14 02533 g012
Figure 13. SOM UMatrix Map.
Water 14 02533 g013
Figure 14. SOM input planes map, CDOM, O.B. Chl-a, water clarity, oils, and dissolved oxygen. Station labels mapped to the SOM are located to the right in the diagram.
Water 14 02533 g014
Figure 15. SOM map projection.
Water 14 02533 g015
Table 1. General Land-Use Designations for South River Watershed.
DesignationSquare Kilometers
Water1.2
Pasture2.1
Crop6.7
Urban/Suburban54.0
Forest83.7
Table 2. Research site detailed descriptions, including land-use for triblets.
StationStation TypeAverage Depth (m)Distance from Mouth (km)Characteristics
MS1Main channel—mouth4.50.0Mouth of South River Estuary
Duval (DUV)Tidal embayment2.03.5210 ha
Selby (SEL)Tidal embayment3.03.0158 ha
Harness (HAR)Triblet3.05.4223 ha, 103 septic systems
Pocahontas (POC)Triblet2.0 164 ha, 2 septic system
MS1AMain channel6.03.7
MS1BMain channel6.05.4
Little Aberdeen (LAB)Triblet3.0 57 ha, 77 septic systems
Aberdeen (ABD)Triblet4.0 222 ha; 69 septic systems
Glebe (GLB)Triblet4.0 952 ha, 117 septic systems
Almshouse (ALM)Triblet3.5 97 ha, 5 septic systems
Crab (CRB)Triblet3.0 308 ha, 103 septic systems
Church (CHR)Triblet2.5 526 ha, 315 septic systems
MS2Main channel8.08.7
Warehouse (WAR)Triblet2.0 142 ha, 52 septic systems
Gingerville (GIN)Triblet2.5 250 ha, 166 septic systems
MS3Main channel4.011.3
Beards (BRD)Triblet2.0 1845 ha
MS4Main channel—mouth of Flat creek, turbidity maximum2.012
Broad (BRO)Triblet3.0 1700 ha, 718 septic systems
MS5Main channel—headwaters1.615.0
Table 3. Total suspended sediment results for the estuary, triblets, and freshwater streams.
Tidal Station IDs22 Apr 20148 May 201413 May 2014
MS1 9.4
MS1A 10.711.8
MS1B 10.47.4
MS210.39.75.9
MS311.210.57.0
MS412.611.09.5
MS518.214.512.4
Selby7.711.78.7
Pocahontas9.77.86.9
Glebe 8.69.77.7
Almshouse9.46.19.4
Warehouse11.311.111.1
Beards6.313.019.3
Duvall8.815.611.9
Harness6.28.210.7
Aberdeen7.110.39.4
Little Aberdeen7.59.89.6
Crab7.09.83.4
Church7.28.112.9
Gingerville7.58.69.7
Broad11.210.812.4
Field Blank0.00.00.0
Lab Blank0.00.00.0
Non-Tidal Creeks
Station ID15 Apr 201421 Apr 201430 Apr 201415 May 201428 May 2014
BCS320.512.2128.127.66.4
BDASH13.59.8110.0
BDS327.224.490.0 65.6
BRB27.09.089.02.2
CCH115.56.145.03.8
CCH29.62.344.00.7
CCHRest10.021.0211.68.0
CRB11.15.9262.97.115.4
CRB310.4128.743.043.285.5
FLT18.07.635.02.23.4
GLD111.09.148.016.025.3
NTH15.53.74.02.60.3
WIL4.64.85.04.1
Field Blank0.00.00.00.00.0
Lab Blank0.00.00.00.00.0
Publisher’s Note: MDPI stays neutral with regard to jurisdictional claims in published maps and institutional affiliations.