Article

Breakthrough Curves Prediction of Selenite Adsorption on Chemically Modified Zeolite Using Boosted Decision Tree Algorithms for Water Treatment Applications

by
Neda Halalsheh
1,*,
Odey Alshboul
1,
Ali Shehadeh
2,
Rabia Emhamed Al Mamlook
3,4,
Amani Al-Othman
5,
Muhammad Tawalbeh
6,7,
Ali Saeed Almuflih
8 and
Charalambos Papelis
9,10
1
Department of Civil Engineering, Faculty of Engineering, The Hashemite University, P.O. Box 330127, Zarqa 13133, Jordan
2
Department of Civil Engineering, Hijjawi Faculty for Engineering Technology, Yarmouk University, P.O. Box 566, Irbid 21163, Jordan
3
Department of Industrial Engineering and Engineering Management, Western Michigan University, Kalamazoo, MI 49008, USA
4
Department of Aeronautical Engineering, University of Zawiya, Al Zawiya City P.O. Box 16418, Libya
5
Department of Chemical Engineering, American University of Sharjah, Sharjah P.O. Box 26666, United Arab Emirates
6
Department of Sustainable and Renewable Energy Engineering, University of Sharjah, Sharjah P.O. Box 27272, United Arab Emirates
7
Sustainable Energy & Power Systems Research Centre, RISE, University of Sharjah, Sharjah P.O. Box 27272, United Arab Emirates
8
Department of Industrial Engineering, King Khalid University, King Fahad St., Guraiger, Abha 62529, Saudi Arabia
9
Department of Civil Engineering, New Mexico State University, Las Cruces, NM 88003, USA
10
Carlsbad Environmental Monitoring & Research Center (CEMRC), Carlsbad, NM 88220, USA
*
Author to whom correspondence should be addressed.
Water 2022, 14(16), 2519; https://doi.org/10.3390/w14162519
Submission received: 1 July 2022 / Revised: 5 August 2022 / Accepted: 10 August 2022 / Published: 16 August 2022
(This article belongs to the Section Wastewater Treatment and Reuse)

Abstract

:
This work describes an experimental and machine learning approach for the prediction of selenite removal on chemically modified zeolite for water treatment. Breakthrough curves were constructed using iron-coated zeolite adsorbent and the adsorption behavior was evaluated as a function of an initial contaminant concentration as well as the ionic strength. An elevated selenium concentration in water threatens human health and aquatic life. The migration of this metalloid from the contaminated sites and the problems associated with its high releases into the water has become a major environmental concern. The mobility of this emerging metalloid in the contaminated water prompted the development of an efficient, cost-effective adsorbent for its removal. Selenite [ Se ( IV ) ] removal from aqueous solutions was studied in laboratory-scale continuous and packed-bed adsorption columns using iron-coated natural zeolite adsorbents. The proposed adsorbent combines iron oxide and natural zeolite’s ability to bind contaminants. Breakthrough curves were initially obtained under variable experimental conditions, including the change in the initial concentration of Se   ( IV ) , and the ionic strength of solutions. Investigating the effect of these parameters will enhance selenite mobility retardation in contaminated water. Continuous adsorption experiment findings will evaluate the efficiency of this economical and naturally-based adsorbent for selenite removal and fate in water. Multilinear and non-linear regressions approaches were utilized, yet low coefficients of determination values were respectively obtained. Then, a comparative analysis of five boosted regression tree algorithms for a selenite breakthrough curve prediction was performed. AdaBoost, Gradient boosting, X G B o o s t , L i g h t G B M , and C a t B o o s t models were analyzed using the experimental data of the packed-bed columns. The performance of these models for the breakthrough curve prediction under different operation conditions, such as initial selenite concentration and ionic strength, was discussed. The applicability of these models was evaluated using performance metrics (i.e., Mean Absolute Error ( M A E ), Root Mean Square Error ( R M S E ), Mean Absolute Percentage Error ( M A P E ), and coefficient of determination ( R 2 ). The C a t B o o s t model provided the best fit for a breakthrough prediction with a coefficient of determination R 2 equal to 99.57. The k-fold cross-validation technique and the statistical metrics verify this model’s accurateness. A feature importance assessment indicated that Se   ( IV ) initial concentration was the most influential experimental variable, while the ionic strength had the least effect. This finding was consistent with the column transport results, which observed Se   ( IV ) sorption dependency on its inlet concentration; simultaneously, the ionic strength effect was negligible. This work proposes implementing machine learning-based approaches for predicting water remediation-associated processes. The significance of this work was to provide an alternative method for investigating selenite adsorption behavior and predicting the breakthrough curves using a machine-based approach. This work also highlighted the importance of management practices of adsorption processes involved in water remediation.

1. Introduction

Selenium removal in water-contaminated sites has recently received focused attention [1,2]. Elevated concentrations of this metalloid are caused by natural sources or anthropogenic activities [3]. Selenium is of particular concern due to its high mobility in surface and groundwater and its substantial risk to humans and wildlife [4,5,6]. Selenium exists in organic and inorganic forms in the water environment [7]. Selenite ( IV ) and selenate (VI) are the primary inorganic forms and the most bioavailable and toxic ones [8,9]. The environmental problems associated with these two forms have prompted the development of efficient and cost-effective attenuation and transport prediction methods [1,10,11]. The most widely used methods for selenite removal include ion exchange, coagulation, precipitation, membrane filtration, ozone oxidation, photo-reduction, biological treatment, and adsorption [12,13,14,15]. These technologies have certain disadvantages, such as generating harmful by-products, producing a large amount of sludge, inability to reach the standard concentrations, and high operation costs [16]. Moreover, these methods are not applicable for drinking water treatment due to specific drawbacks [17,18]. However, the process of adsorption is receiving much attention nowadays because it is considered a promising method for selenium removal from aqueous solutions [19]. The development of efficient, cost-effective adsorbents is crucial for water selenium treatment. Adsorbents include natural materials such as charcoal, clay, lignin, chitosan, agricultural wastes, and natural zeolite, or synthetic ones such as synthetic zeolites, synthetic alumina, crown ethers, cyclodextrin, and many polymeric-based resins [15,20,21,22]. Many adsorbents have been employed in the last decade for selenite and selenate removal; selenate removal efficiency could be enhanced if it is reduced to selenite, followed by an adsorption removal technique [23]. The developed adsorbents include mesoporous material, metal-organic frameworks, magnetic nanoparticles, and metal oxides [23,24].
Metal oxide adsorbents such as iron and aluminum oxides are among the most common due to their versatility and abundant surface-active sites, particularly the iron-based ones; among these is goethite, which has shown high potential for selenium removal. Goethite(α-FeOOH) and hydrous ferric oxide (HFO) were employed as adsorbents by Hayes et al. [25], who studied the effect of ionic strength on selenite and selenate sorption behavior; the results of this study suggested using this variable to distinguish between adsorption mechanisms, where selenite was found to bind stronger to these oxide surfaces compared to selenate. The adsorption of selenite onto different forms of iron oxide and oxyhydroxides was studied by Parida et al. [26]; results showed the efficiency of using these forms and reported the capacity for selenite removal as following the order β-FeOOH < α-FeOOH < γ-FeOOH < δ-FeOOH < ferrihydrite. Monteil-Rivera et al. [27] studied selenite adsorption onto a hydroxyapatite surface in the presence of additional phosphate. The results confirmed the ability of hydroxyapatite selenite sorption from aqueous solutions and concluded that the presence of phosphate ions lowered selenite sorption by direct competitions. The effect of multisorbate systems on selenite sorption was studied by Jordan et al. [28], who confirmed the capability of magnetite for the sorption of selenite; he also showed that the competition between these two adsorbates for the surface sites had lowered selenite sorption on magnetite.
Although using iron-based adsorbents for selenite removal provided a promising solution, the problems associated with the iron’s small-size particles and the difficulty of using them for a continuous flow urged researchers to combine these adsorbents with natural, traditional adsorbents to overcome this problem. Examples of these adsorbents are zeolite, granular activated carbons, and sand. Lien Lo et al. [29] showed that iron-coated sand was able to remove between 1105–1343 µg Se/g iron-coated sand of selenite. Iron-coated granular-activated carbon (Fe-GAC) was developed and tested for selenite removal from an aqueous solution by Zhang et al. [30], five types of GAC were used, and a maximum capacity of 2.50 mg-Se/g-adsorbent was obtained. Although Iron-coated zeolite has been employed for the removal of many contaminants in water [31,32,33], seldom papers had investigated using such an adsorbent for selenium. Iron-modified zeolitic tuff (Fe- CLI) was tested as an adsorbent and soil supplement for selenite and selenate by Jevtic et al. [34]. The results showed adsorption affinity for both selenium forms, which are affected by pH, the adsorption capacity of selenite was found to be higher than selenate, and the cultivation of Pleurotus ostreatus mushrooms transformed the organic selenium form to a more bounded one. Exploring the efficiency of iron-coated zeolite for selenite using packed adsorption columns has not been studied before. Although batch experiments will provide data about the effectiveness of the adsorbent–adsorbate system, this information will not be appropriate for a large-scale application system [35]. According to the literature, selenite adsorption onto iron-coated zeolite using packed columns had not yet been investigated.
Fixed-bed adsorption columns are frequently used for engineering systems to study contaminant transport into different adsorbents. In addition to its simplicity and lower operation cost, the adsorbent is continuously in contact with the adsorbate in this system, and a large volume of contaminated water can be treated over a short period [36,37]. The design of efficient continuous column systems requires the development of a prediction model that can predict the breakthrough curves for the studied adsorbent. This experimentally verified model is then used to explain the effect of the operating condition on the adsorption processes [38,39]. Modeling and simulation techniques are applied successfully to engineering and science systems [40,41]. Machine learning-based approaches were employed in engineering, medicine, healthcare, education, and industrial and commercial development [42,43]. A generalized regression neural network (GRNN) model and multilayer perceptron (MLP) model were proposed to simulate the spatial distribution of heavy metals in soil, the ML models evidenced their efficiency for metals simulation [44]. The artificial neural network (ANN) model showed an optimistic prediction result for a pollutants’ soil resistivity study [45]. Deep learning applications for the extraction of mechanical properties of materials and hyperspectral Imaging were investigated as well [46,47,48]. Simulation techniques such as molecular dynamics (MD) have been employed effectively by Zhu et al. [49], who developed a novel adsorbent for heavy metal removal, the interfacial interaction of the layered material was evaluated by this model. The MD technique has also been used in Pb(II) adsorption and desorption on modified montmorillonite and the simulation of the interlayer structure [50].
Artificial intelligence (AI)-, machine learning (ML)-, and deep learning (DL)-based models have been developed with outstanding progress in the last two decades [51]. There are numerous types of models that have been used in engineering system, such as an adaptive network-based fuzzy inference system (ANFIS), learning vector quantization, regression, a random forest, support vector machine (SVR), Naive Bayes, evolutionary algorithms (EA), and an artificial neural network (ANN) [52,53,54].
Mathematical models that describe the breakthrough curves have been widely employed for breakthrough predictions in the literature [55]. However, in some cases, these models provided a poor fit when correlated with the experimental data of the fixed-bed columns and showed distinct imperfection [39]. In addition, these mathematical models could not predict the whole behavior of the breakthrough curve [56]. Thus, methods other than the commonly used have been implemented to address this issue. Machine learning-based models have been successfully applied to predict contaminants’ adsorption behaviors in solid-phase systems [57]. These models could also predict the breakthrough curves’ efficiently [55]. For example, artificial neural network (ANNs)-based models were employed in adsorption predictions studies. The following models were used for the prediction of dye adsorption onto different types of adsorbents: multilayer feedforward neural networks (MLFNN), ANFIS, SVR, and hybrid models [58]. As another example, Rojas-Mayorga et al. [59] investigated the efficiency of using artificial neural networks with the optimal brain surgeon approach for the modeling of breakthrough curves (BTCs) of fluoride adsorption on aluminum char adsorbent. The results highlighted the efficiency of using models for BTCs prediction. The artificial neural network (ANN) approach using the Levenberg–Marquardt (LM) algorithm for the prediction and modeling of the breakthrough curve analysis of the fixed-bed adsorption of iron ions from aqueous solution by activated carbon confirmed the efficiency of using such approaches [60]. As a conclusion, researchers have considered implementing the machine learning-based models over the other available methods due to their outstanding performance in solving nonlinearity systems, insensitivity to the data stochasticity, and ability to perform intelligently with limited data availability [61,62,63].
As a result, and according to the literature, there is a lack of studies in using iron-coated zeolite for selenium removal, and there is a lack of studies in using a machine learning approach for the prediction of selenite sorption behavior and breakthrough curves. Therefore, a combination of iron-coated zeolite and ML models to predict breakthrough curves and the performance of selenite under varying conditions is crucial and, therefore, presented in this study. The literature included efforts to study selenite sorption into different adsorbents; however, an evaluation of the efficiency of sodium pretreated with iron-coated zeolite as the adsorbent for selenite removal using packed-bed columns had not been studied yet. Predicting the sorption behavior of selenite under different conditions will affect its fate in an aqueous solution and limit its mobility. Hence it will facilitate selenite-contaminated site remediation. In order to determine the effect of the selenite feed concentration and ion strength on the sorption process and to predict the corresponding sorption behavior, machine learning-based models were employed, namely, boosted regression tree algorithms, AdaBoost, Gradient boosting, X G B o o s t , L i g h t G B M , and C a t B o o s t models, with a dataset extracted from the laboratory scale column experiments. To the best of the authors’ knowledge, such an application of models to similar Se (IV) removal systems has not yet been implemented in the literature. The advantages of such a machine learning-based approach have not been previously considered for selenite. This study set out first to obtain breakthrough curves of selenite adsorption onto the chemically modified zeolite using fixed packed-bed columns. A comparison of five algorithms’ performance to determine the best for breakthrough curve prediction was then conducted using the laboratory data. The best performing model was employed to compare the predicted and actual values. Further, the effect of the initial selenite concentration and ionic strength on the sorption process was investigated, and the significance of these parameters was determined. This study highlights the merits of tested breakthrough curve modeling approaches for the adsorption data analysis involved in water selenite decontamination using iron-coated zeolite.

2. Methodology

The methodology of this work is composed of two stages. The first one is the work performed on a laboratory-scale adsorption column, and the second stage uses the results of the preceding part in a machine learning prediction approach, as illustrated in Figure 1. The machine learning approach is crucial to predict the performance and save time for future scaling-up operations. Figure 1 shows a detailed block flow diagram for the methodology followed in this work.
Datasets were first collected via continuous column experiments. Adsorbent preparation, characterization, adsorbate and chemicals preparation, column packing and feeding, and column effluent collection and analysis were conducted. Although multilinear and non-linear regression techniques were used, low coefficient determination values were achieved. Machine learning techniques were then implemented using the extracted dataset, as shown in Figure 1. The input data were divided into multiple datasets to study and construct the algorithms that can learn from these data and make predictions accurately. As shown in Figure 1, these datasets are trained and tested. Five boosted regression tree algorithms were studied and analyzed. These algorithms are Adaptive Boosting ( A d a B o o s t ), Gradient Boosting, Categorical Boosting ( C a t B o o s t ), Extreme Gradient Boosting ( X G B o o s t ), and Light Gradient Boosted Machine ( L i g h t G B M ). The developed models were then evaluated using different performance metrics.

2.1. Natural Zeolite Pretreatment and Iron Modification

In this study, natural zeolite (clinoptilolite) was chemically modified and used as an adsorbent. This type is distinguished by its high calcium and potassium content on the one hand and low iron content on the other. The as-received zeolite was sieved and washed with deionized water to achieve the same particle size and remove any surface debris. Natural zeolite was sieved through 14–40 mesh to achieve a size fraction of 0.42 to 1.41 mm for all experiments. Sieved samples were then kept for sodium pretreatment and iron coating.
The Ca-rich clinoptilolite zeolite was pretreated with sodium chloride ( NaCl ) solution. Zeolite sample was soaked in 2 M of NaCl , stirred very well, vacuumed, and preserved in a desiccator for four days. To eliminate chloride ions, zeolite was washed with high pure deionized water (18.2 M Ω resistivity). The supernatant’s electrical conductivity ( EC ) was measured and repeated until the EC stabilized; the sample was then dried in the oven for 24 h at 105 °C and finally kept in capped bottles to be coated with iron. The sodium pretreatment process aimed to change zeolite’s chemical composition by exchanging its high calcium content with sodium, thus obtaining a Na-rich zeolite. Pretreatment efficiency was evaluated by analyzing zeolite chemical composition using Scanning Electron Microscope (SEM) technique.
The pretreated zeolite surface structure was then coated with iron oxides to enhance its capacity to bind selenite. The coating technique was conducted using 0.5 N ferric nitrate nonahydrate Fe (NO3)3·9H2O solution. A 200 g sample of the sodium-pretreated zeolite was placed in a beaker. Then, 100 mL of 0.5 N ferric nitrate and 800 mL of deionized water were added and mixed by magnetic bars on a hot plate stirrer and subjected to a vertical overhead stirrer. The solution’s pH value was adjusted to 9.5 through a dropwise addition of 0.1 M sodium hydroxide ( NaOH ). The sample was then placed in the oven at 75 ± 1 °C for successive cycles of overhead stirring and settling for 96 h. The vertical stirrer was on for the first 24 h and turned off for the next 24 h, allowing the mixture to settle before turning the stirrer on again for the next cycle; for the last cycle, the stirrer was off for 24 h. Finally, zeolite was rinsed with high-purity deionized water, shaken vigorously, and centrifuged for a minute at a 450-rpm rate; supernatant electrical conductivity was measured periodically with EC   ( K   = 0.506   μ S / cm ) probe. Centrifuging was halted when stable EC was obtained. Samples were dried in the oven for 24 h at 75 ± 1 °C. Finally, the sodium-pretreated iron-coated zeolite sample was kept in capped bottles to be used as an adsorbent in the column experiments. It should be noted that, before initiating each experiment, the sodium-pretreated iron-coated zeolite was rinsed carefully with high-purity water to remove any impurities which could interfere with the ion of interest. The coating technique efficiency was evaluated by measuring the iron content of the coated zeolite using the SEM EDX technique and comparing it with the natural zeolite composition.

2.2. Adsorbate Preparation

All chemicals used in the adsorption experiments were of analytical reagent grade. Selenite stock solutions were prepared using high analytical anhydrous sodium selenite (Na2SO3) (≥99.8% metal basis) and were purchased from Alfa Aesar (Haverhill, MA, USA). Solutions were diluted with reagent-grade water as necessary. Concentrations of 10−4 and 10−5 of selenite were prepared. Background electrolyte solutions were prepared as NaNO3 at 0.01 M and 1.0 M ionic strength. The pH level of all solutions was adjusted to pH 7 value, using 0.1 M nitric acid or 0.1 M sodium hydroxide.

2.3. Determination of Breakthrough Curves for Selenite Adsorption on Modified Zeolite Using Packed-Bed Micro-Columns

Selenite adsorption experiments were performed in packed acrylic columns of 2.54 cm in length and 1.91 cm internal diameter. Column studies were conducted based on a system described by Normile et al. [64]. Columns were packed with approximately 10.2 g of modified zeolite with particle size fractions of 0.42 to 1.41 mm. Steel mesh screens (size #40) were placed at each column’s inlet and outlet to prevent particles from passing through—if available, packing O-rings were placed at the column grooves to create a seal at the interfaces. The column was then attached to the pump using Fluorinated Ethylene Propylene ( FEP ) tubes and reducing ferrules. Column adsorption experiments were conducted at pH 7 and 0.5 mL/min flowrate using different selenite feed concentrations and ionic strength solutions. A breakthrough curve of conservative tracer (bromide) was obtained for each run. Bromide was used due to its limited interaction with zeolite and low cost and toxicity. Bromide stock solution and calibration curve standards were prepared using sodium bromide purchased from Thermo Fisher Scientific Inc. (Waltham, MA, USA). The calibration curve for bromide transport into the iron-coated zeolite was initiated. An ionic strength adjustor was added to solutions to provide constant ionic strength. Effluent bromide samples were collected every 0.2 min and measured by a bromide electrode. Sample collection continued until C/Co equaled 1. By then, bromide breakthrough curves were developed. A breakthrough curve of conservative tracer (bromide) was first obtained. Subsequently, the column was saturated with a pH -adjusted ionic strength solution for at least five pore volumes to flush out any fine zeolite particles. A pH -adjusted solution of specific selenite concentration and ionic strength was then loaded. The feeding solution was prepared with 10−5 and 10−4 M Na2SeO3 in 0.01 and 1 M of sodium nitrate (NaNO3) as a background electrolyte solution. Samples were regularly collected at the column outlet at a fixed interval (i.e., 2.56 min). The pH levels of the effluent samples were consistently monitored throughout the experiments, Mettler Toledo (Columbus, OH, USA) Seven Excellence meter was used. The collected samples were prepared for selenite concentration quantification using an inductively coupled plasma mass spectrometer (ICP-MS). Samples were diluted with 1% nitric acid (HNO3) for the ICP-MS analysis. The dilution varied according to the initial selenite concentration and the expected concentration of the collected samples. For each analysis run, selenite stock solutions were prepared and diluted as necessary to prepare the calibration standards. The selenite concentration content of the collected samples was measured, and the relative concentration (C/Co) was calculated. The breakthrough curve for each condition experiment was obtained by plotting adsorption elapsed time or its corresponding pore volumes against selenite relative concentration. All experiments were performed in triplicate to reflect data reproducibility, and standard deviation-based error bars have been added.

2.4. Model Formulation

2.4.1. Multilinear and Non-Linear Regression

Multilinear regression (MLR) is a technique that extends ordinary linear regression by including multiple features. Generally, the response variable Y is assumed to be related to the p regressors, as shown in Equation (1):
Y = β 0 + β 1 ( X 1 ) + β 2 ( X 2 ) + + β p ( X p ) + ε
where Y is the response variable, X = [ X 1 ,   X 2 ,   . ,   X p ] is the predictor features, β = [ β 0 ,   β 1 ,   .. ,   β P ]   is the regression coefficient, and ε is a random error.
In this study, Y is the relative concentration ( C / C o ), X 1 = Selenite initial concentration, X 2 = Ionic strength, and X 3 = Number of pore volumes (V/Vp).
Equation (1) can be rewritten regarding the related features, as shown in Equation (2).
C / C o = 0.091 + 2013.64 × c o n c e r t r a t i o n 0.094 × i o n i c   s t r e n g t h + 0.012 × p o r e   v o l u m e
The multilinear regression approach has yielded an extremely low coefficient of determination (i.e., 0.33). Thus, it is logical to try using non-liner regression approaches to develop a function for the C / C o . Equations (3)–(6) represents a non-linear regression of polynomial and logarithmic approaches. The R2 for Equations (3)–(6) were 0.37, 0.53, 0.41, and 0.57, respectively.
C / C o = 0.09 + 2050 × c o n c e r t r a t i o n 0.09 × i o n i c   s t r e n g t h 2 + 0.011 × p o r e   v o l u m e 3
log ( C / C o ) = 3.05 + 0.146 × log ( c o n c e r t r a t i o n ) 0.050 × log ( i o n i c   s t r e n g t h ) + 1.093 × log ( p o r e   v o l u m e ) 3
log ( C / C o ) = 2.547 + 3560 × c o n c e r t r a t i o n 0.1635 × i o n i c   s t r e n g t h 2 + 0.041 × p o r e   v o l u m e 3
C / C o = 0.287 + 2199 × c o n c e r t r a t i o n 2 0.124 × i o n i c   s t r e n g t h + 0.244 × log ( p o r e   v o l u m e )    
Even though the non-linear regression approach produced higher R2 values than the linear regression, the coefficient of determination was less than 0.58, which remains humble and needs more sophisticated approaches to be estimated. Such results were one of the main motivations for the current study to use advanced machine learning techniques for the prediction of C / C o with higher accuracy.

2.4.2. Boosted Decision Tree Algorithms

Boosting is similar to bagging in combining weak learners/trees to create a single predictive model, where a weak learner is somewhat more accurate than a random guess. However, boosting differs from bagging in that it sequentially produces trees intending to learn from previously constructed trees. When each tree is fitted on a modified version of the original data set, the previously fitted tree’s information is used to fit the current tree [65].
Several machine learning-based algorithms are available in literature. Five boosted tree algorithms (i.e., AdaBoost, Gradient boosting, XGBoost, LightGBM, and CatBoost) were chosen for prediction of selenite behavior onto iron-coated zeolite and breakthrough curves. More information on algorithms and models can be found in in Clark et. al. [66].
-
AdaBoost
AdaBoost is still one of the most popular and commonly utilized boosting algorithms, with applications in various industries. This technique aims to use adaptive boosting to optimize the efficiency of each weak learner; adaptive refers to the assumption that no prior information about the weak learners’ accuracies is required [67]. Instead, it adjusts to these inaccuracies and creates a weighted mixture of the weak learners, with each weak learner’s weight determined by its accuracy. Weight is a sample weight representing each sample’s relative importance and calculates the training error in each fit [68]. The weights are recalculated after each iteration, increasing for incorrectly identified samples and decreasing for those that were successfully classified. As a result, the procedure is repeated until an acceptable level of accuracy is achieved [69]. The key benefit of AdaBoost over other boosting algorithms is that it does not require any parameter to be calibrated [70].
-
Gradient Boosting
Gradient boosting is a technique for iteratively integrating numerous weak learners into an ensemble model to achieve accurate predictions. AdaBoost modifies the training samples based on the outcomes of the current iteration so that the subsequent tree has a better fit. The primary goal of Gradient boosting is to enhance an imperfect model Fb by adding a new learner f(X;ab), so that the upgraded model makes a true prediction, as shown in Equation (7):
F b + 1 ( X ) = F b ( X ) + f ( X ; a b ) = y ..   f ( X ; a b ) = y F b ( X )
The Gradient boosting technique fits f(X;ab) to the residual yFb(X). As with the other boosting techniques described, each Fb+1 attempts to fix the errors of its predecessor Fb [71].
-
CatBoost
Categorical boosting (CatBoost) was improved to solve the problem of bias in Gradient boosting. It should be noted that estimating the Gradient using the ith training sample may cause it to be biased regarding the model Fb(X), since the Gradient is calculated for the Xi sample using the model Fb(X) that was generated using all of the training samples, including the ith sample and their associated target features in the previous phase. As a result, to solve the problem: the model Fb(X) must be estimated without the ith sample for the Gradient to be unbiased concerning it. The Gradient boosting adjustment was offered to fix this issue. This would add significant variation from the calculated gradients associated with the samples utilized early in the training set.
This technique is computationally infeasible since it requires training # various models, which multiplies the complication and memory requirements by # times. A more efficient strategy was developed to make its execution time more comparable to the popular boosting approaches XGBoost and LightGBM. As a result, CatBoost employs a more efficient technique based on the ordered boosting algorithm [72].
-
XGBoost
XGBoost is an acronym for extreme Gradient boosting and it is based on the gradient boosting approach. Due to parallel and distributed computing, one of the advantages of XGBoost is its ability to scale effectively with big data sets and quicker computational performance during the model training process. XGBoost, unlike Gradient boosting, adds a regularization element to the cost function [73]. The learning procedure for the model’s additive functions is carried out by minimizing the regularized objective, as shown in Equation (8):
i + 1 N L ( y ^ i , y i ) + b = 1 B Ø ( f ( X ; a b ) )
where the loss function L is the difference between the forecasted value ŷi, the actual variable yi, [ 1 ,   2 ,   ,   B ] are iterations at stage b for greedy construction of the boosted tree, and Ø(f(X;ab)) is the regularization element.
-
LightGBM
LightGBM is defined as a decision tree that applies the Gradient boosting approach. It was created to improve the previously existing XGBoost approach, which was insufficient in efficiency and scalability when applied to the significant feature dimension and the enormous data size [74]. This technique also offers the optimum split points in the learning process of developing a decision tree, which is time-consuming. This method aids in enhancing efficiency in memory usage and training speed.

2.5. Cross-Validation

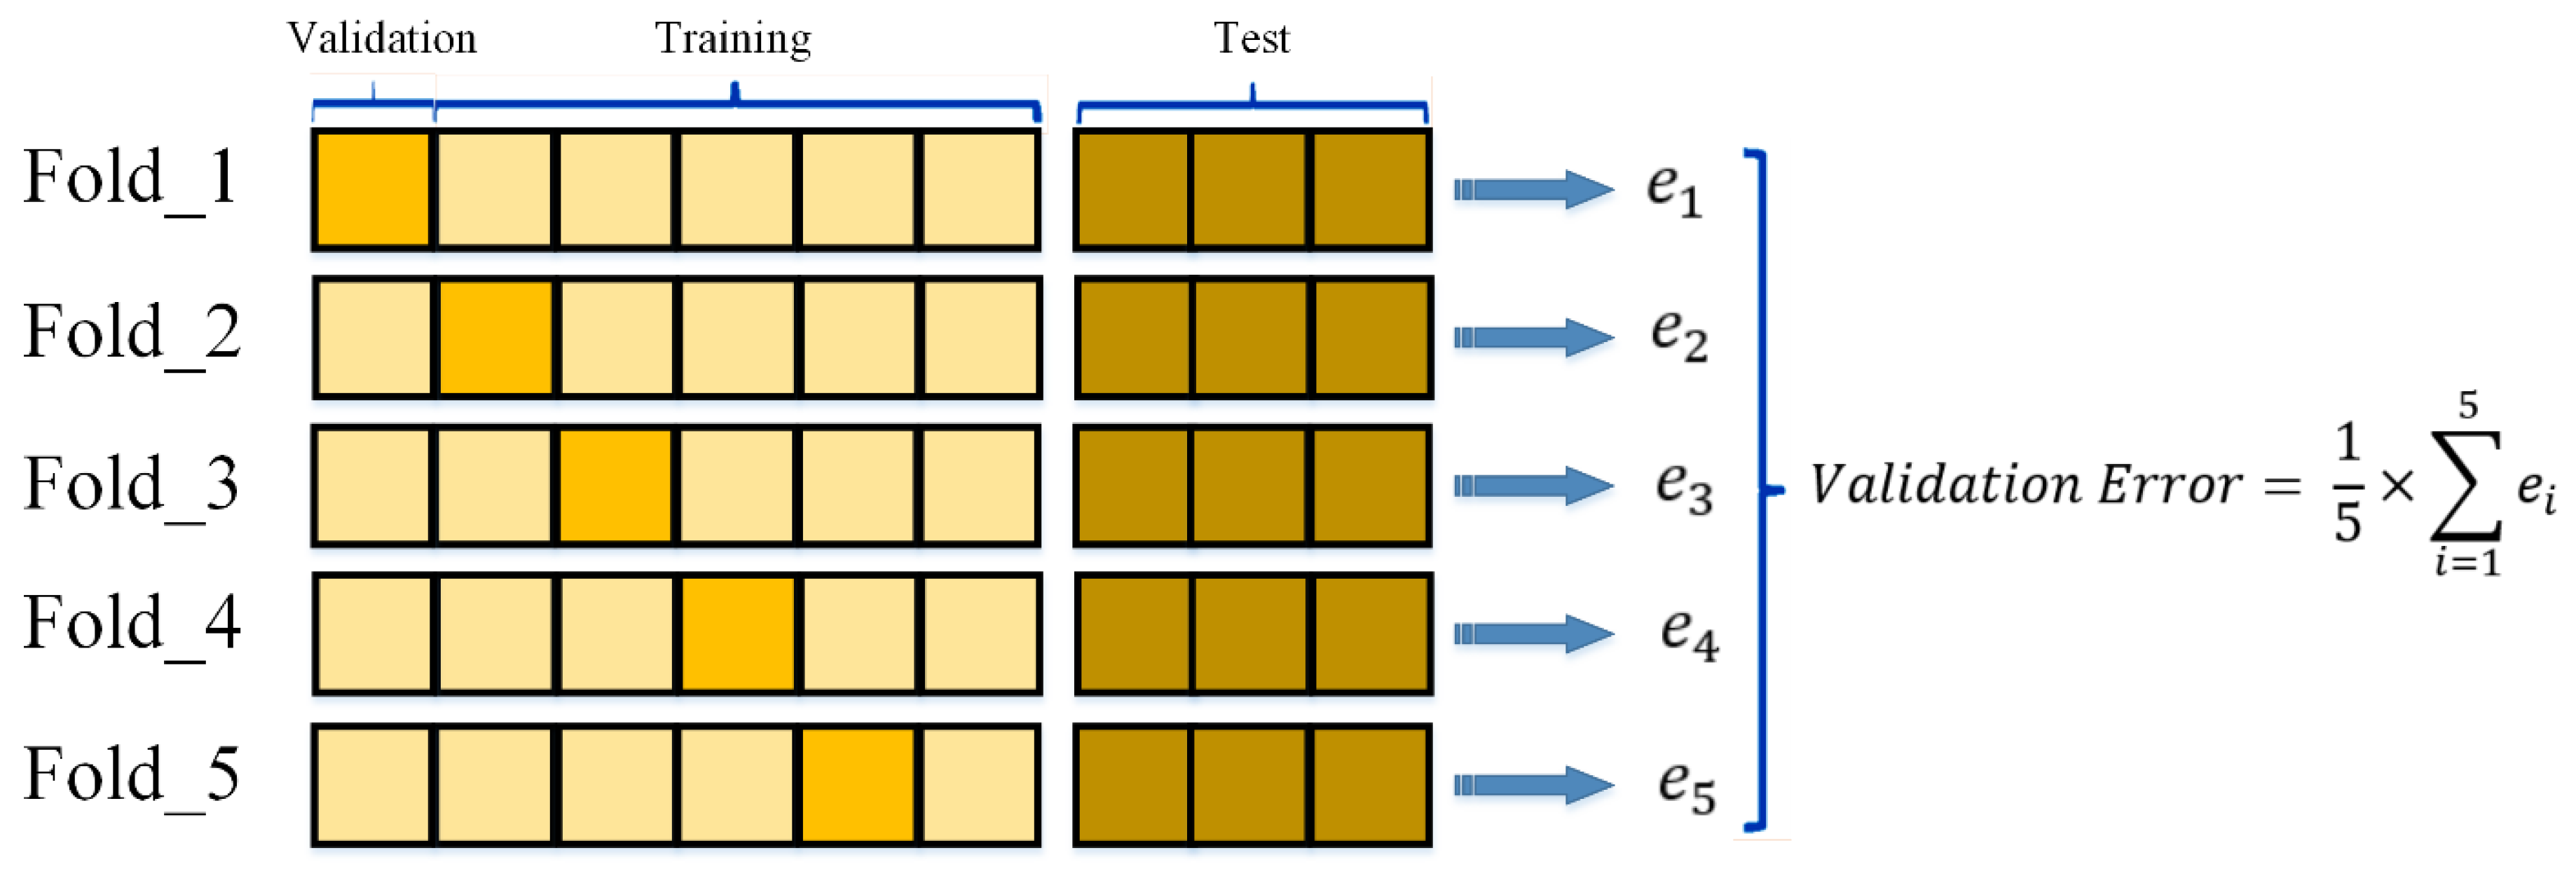
The K-fold cross-validation method investigated the ML algorithm performance on a different data set. Hence, this process requires the database to be divided into training and testing subsets. The training dataset is partitioned throughout this procedure into multiple ‘k’ smaller pieces [65]. Therefore, the term ‘k’-fold was created. K-fold is used for testing, and k-1 is used for training based on a random data set. In this study, the competence of the ML model is investigated using a stratified 5-fold cross-validation technique. Using this procedure, the data set is randomly divided into five folds. Consequently, each fold is used as a validation set just once. Lastly, each fold’s error or accuracy measure may be compared; if they are comparable, the model will likely generalize well. Figure 2 illustrates the 5-fold cross-validation process.

2.6. Evaluation Measurement

Assessment metrics were used to determine ML models’ predictive performance to examine how well a model’s predicted values match the actual values. Thus, the assessment metric was used to examine the adequacy of the suggested model. After validating the primary model assumptions, evaluating the recommended model’s usefulness and predictive ability is vital. Four Statistical Indicators (i.e., Root Mean Square Error (RMSE), Mean Absolute Error (MAE), Mean Absolute Percentage Error (MAPE), and coefficient of determination (R2)) were employed to assess the efficiency of the suggested model quantitatively, as presented in Equations (9)–(12), as follows:
M A E = 1 m i = 1 m | Y i Y i ¯ |
R M S E = 1 m i = 1 m ( Y i Y i ¯ ) 2
M A P E = 1 m i = 1 m | Y i Y i ¯ Y i | × 100
R 2 = 1 i = 1 m ( Y i Y i ¯ ) 2 i = 1 m ( Y i Y ¯ ) 2
where Y i   represents the observed values of the Relative concentration, Y i ¯ represents the forecasted outcome, Y ¯ represents the mean of the Y i , and m represents the number of the datasets utilized. The model precision and proficiency will increase if the R2 value is close to 1 and the RSME, MAE, and MAPE values are close to zero.

3. Selenite Adsorption Dataset (SAD)

Selenite availability and transport fate in water are affected by several variables, including concentration, ionic strength, redox potential, and selenium speciation [75]. The narrow margin distinguishes selenium’s nutritional and toxic concentration limits [30]. Accumulating this metalloid in soil and water poses a risk to human, plant, and aquatic life. Hence, it is important to investigate the effect of these variables. Due to the vast possibilities of these variables, specific features must be selected.
Selecting features highly associated with selenite availability in water and groundwater and which affect its mobility and affinity for adsorbents is known as feature selection. The Boosted Decision Tree model-based feature selection method is a popular approach. The concept is to determine the relevance of characteristics using the node magazines in each decision tree. The final variable importance is the average of the variable importance for the entire decision tree. The cross-validation approach is utilized in this study to choose the features whose significance is more than 0.5. In our research, the related features of initial selenite concentration and solution ionic strength were selected as features since their feature significance was more than 0.5.
The necessary research data were collected from the laboratory-scale packed column experiments. The contaminant’s initial concentration variable is highly important in the adsorption system [76]. Selenite concentrations were chosen thoroughly to represent a real concentration of this metalloid in the contaminated water, mainly groundwater. The studied range (10−4 and 10−5) M covers the selenite contamination levels in the water. Investigating the impact of this variable will provide information on the optimum concentration of selenite required to saturate the active sites on the iron-coated zeolite. The concentration gradient is the driving force for the adsorption process. The higher driving force and faster site coverage at a higher initial concentration lead to a better understanding of column performance [60,77]. The ionic strength variable was investigated too. Adsorption is likely influenced by changes in this parameter due to the competitive adsorption effect; ions compete with contaminants for the adsorption sites, decreasing contaminant adsorption into adsorbent [76].
On the other hand, some adsorption processes are independent of this variable due to their adsorption mechanisms, where the adsorbent’s ability to bind specific adsorbents is not affected by the presence of other ions. Investigating the impact of this variable on selenite adsorption can suggest the adsorption mechanisms of this metalloid on the developed adsorbent. Data were obtained at two initial concentrations (Co) and two ionic strengths. Experiments were conducted according to the design matrix. The influent solution was fed at a specific flow rate of (0.5 mL/min). For each (Co), effluent samples were collected at a particular time interval and measured by ICP-MS for the selenite concentration (C), (C/Co), corresponding to each time (t), were calculated and plotted as a function of pore volume numbers. Figure 3 shows the schematic diagram of the packed-bed adsorption experiments. Sample collections were continued until the effluent concentration had reached a constant value equal to the initial concentration (C/Co = 1). Since time and pore volumes can be used interchangeably, the experiment’s results were employed to develop breakthrough curves by plotting the pore volumes number against the relative concentration (C/Co) value. The descriptive statistics analysis of the utilized features is also shown in Table 1.

Correlation Matrix Analysis

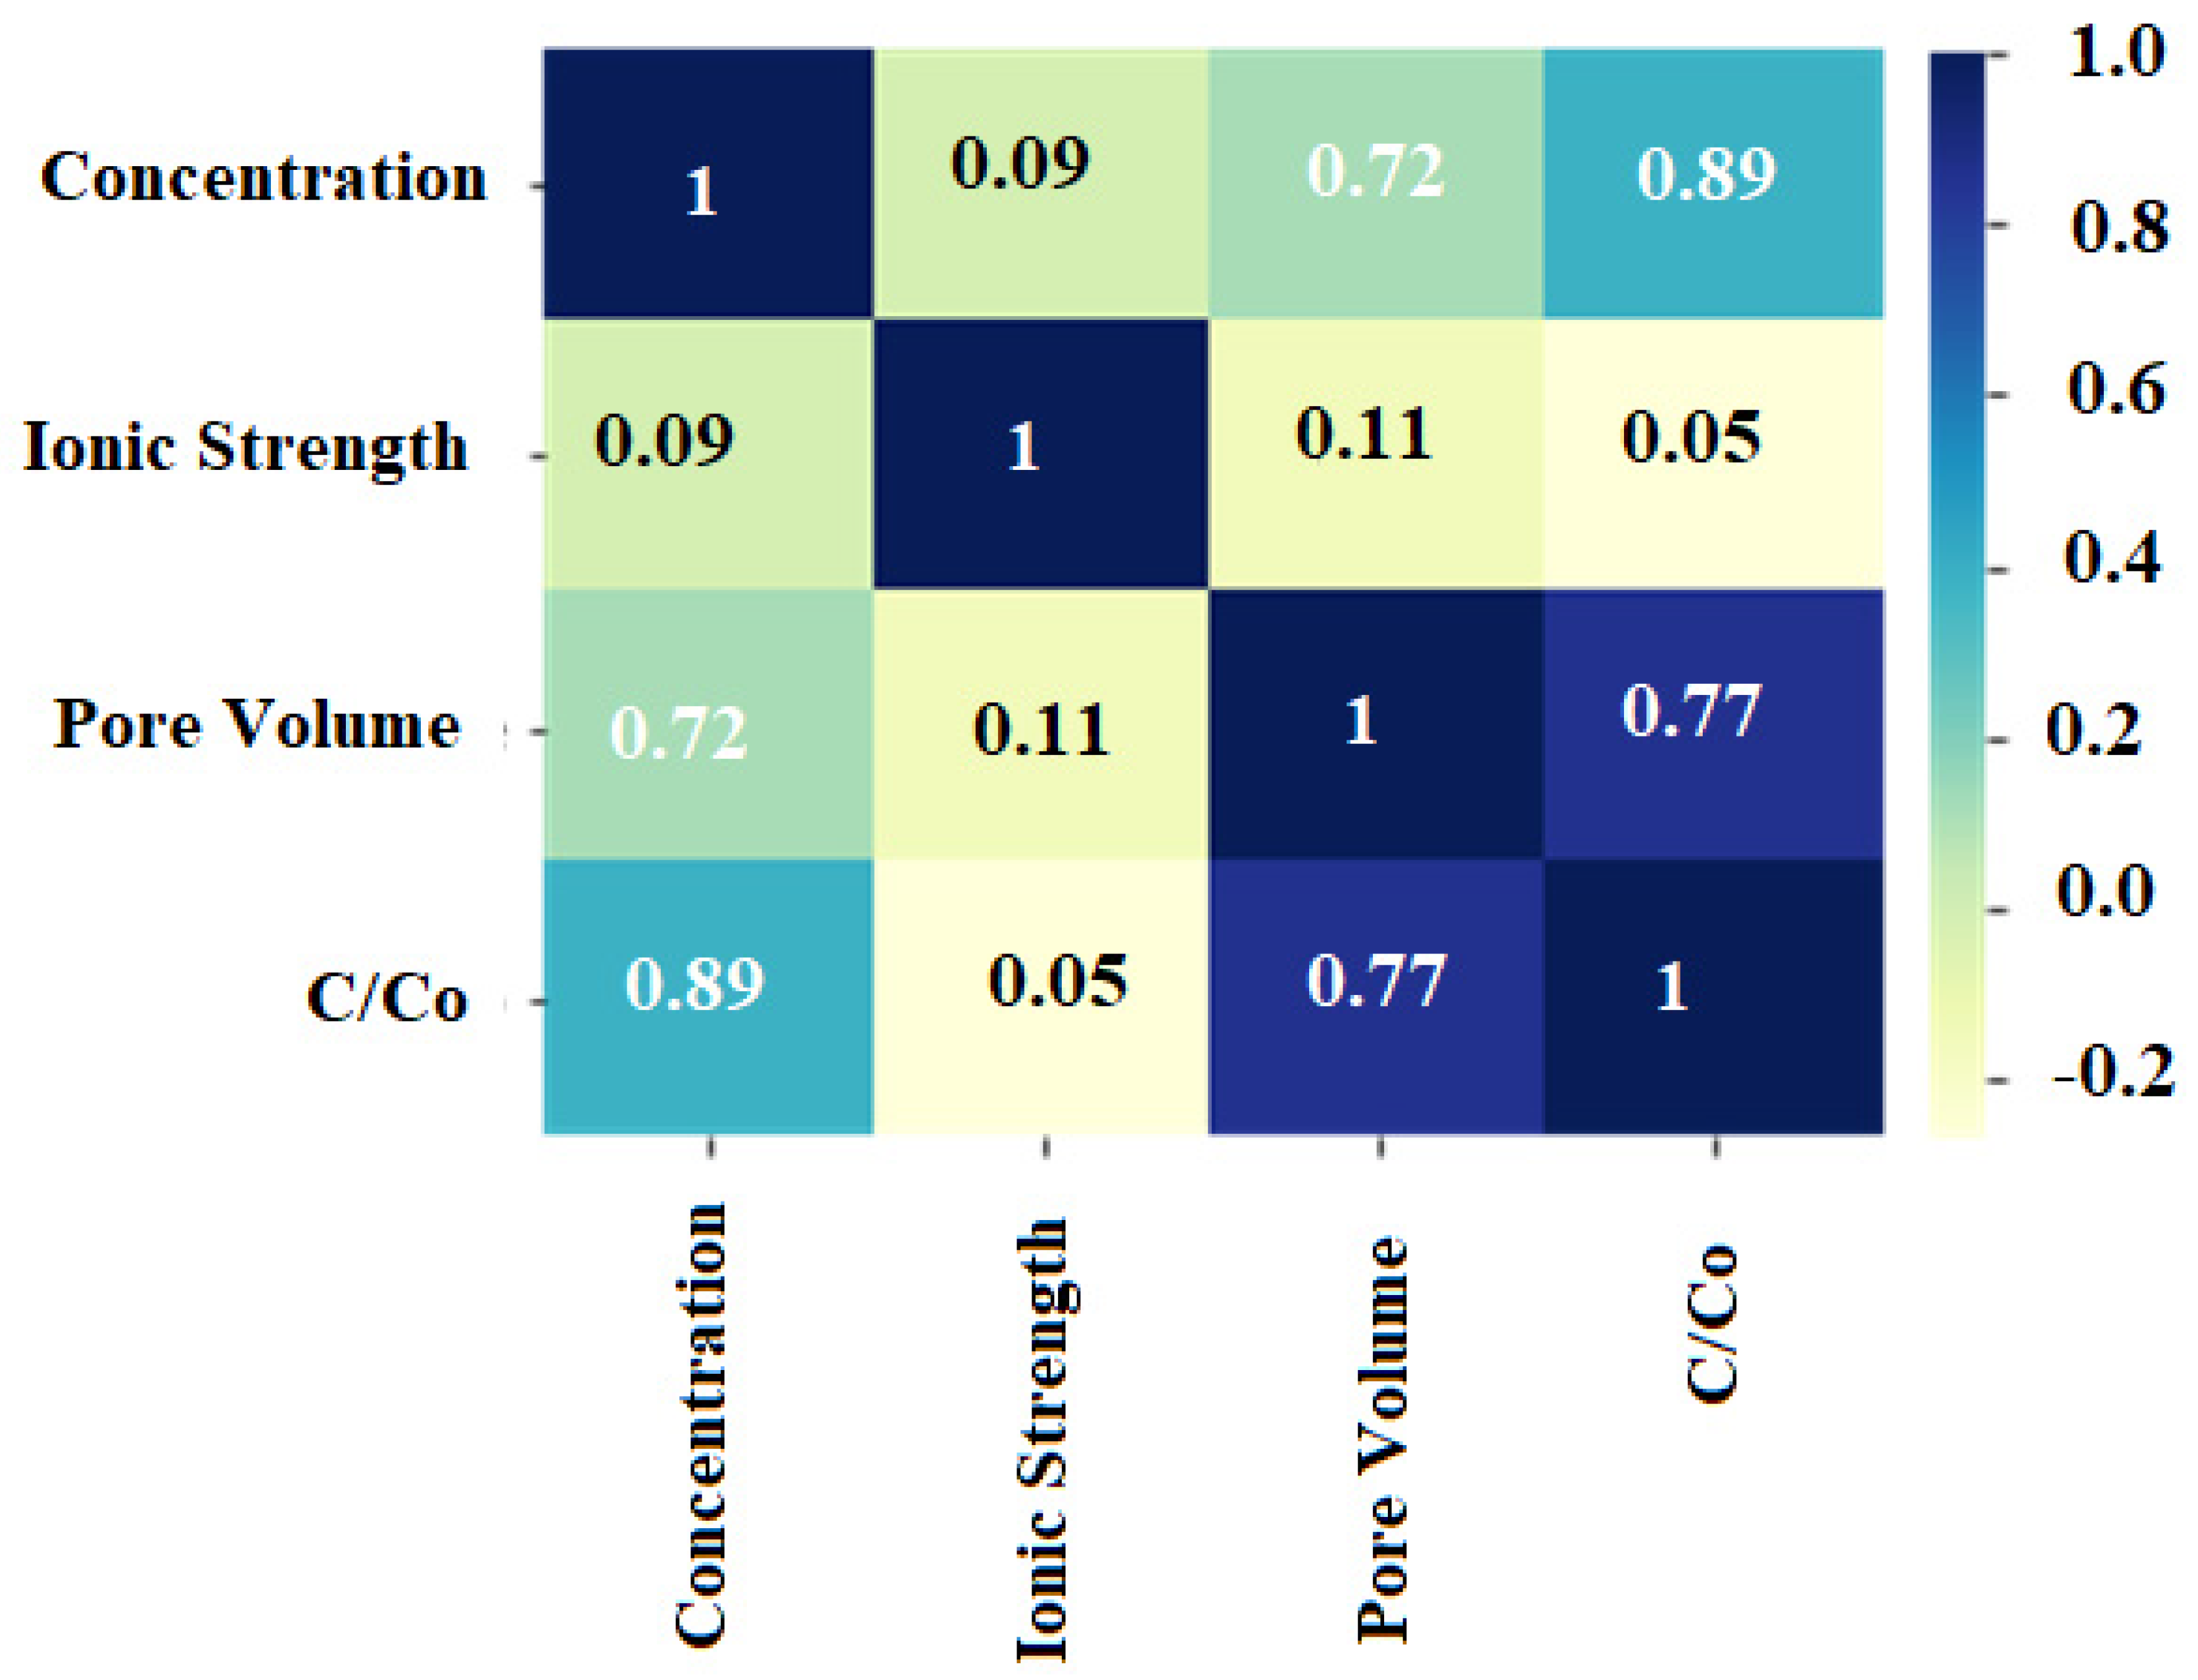
Pearson’s correlation among and in between selected features and the relative concentration was applied to evaluate the impact of these features, as shown in Figure 4. The relation’s sign determined the trend of the correlation between the terms to investigate the effect of each item against every other item. For example, the effect of selenite’s inlet concentration and ionic strength on the relative concentration (C/Co) is shown in Figure 4. The heatmap plot shows the correlation between these variables and the relative concentration (C/Co). A correlation coefficient of 0.89 between the initial concentration and (C/Co) indicated a strong relationship, reflecting that such a feature can be considered important compared with other variables in the selenite adsorption process. On the other hand, a correlation coefficient of 0.05 between the ionic strength and relative concentration reflects almost no relationship between them; it also emphasizes that this parameter’s effect on selenite sorption might be negligible. To conclude, the high or low correlation may be one of the reasons that, for the existing dataset, a certain feature may be important or can be relaxed.

4. Results and Discussion

4.1. Clinoptilolite Characterization

Natural clinoptilolite zeolite was pretreated with sodium ions to improve its ion-exchange capacity. This type of zeolite is distinguished by its high calcium content; therefore, its pretreatment by a monovalent cation such as (Na+) enhances its cation exchange capacity. Further modification of sodium-pretreated zeolite by iron oxide increased its negligible sorption capacity for anions. Natural and modified zeolite were characterized to compare the modification effect on zeolite chemical composition and properties. It will also evaluate the efficiency of the sodium-pretreatment and iron-coating processes. The elemental composition analysis using a scanning electron microscope (SEM) technique equipped with Energy-Dispersive X-ray spectroscopy (EDX) results are shown in Table 2.
As expected, the SEM-EDX analysis showed a higher sodium content of the modified zeolite than the natural zeolite. The replacement of cations with sodium increased the sodium percentage by weight from 0.53 to 1.17. The increased percentage of sodium is accompanied by a calcium and potassium decrease, as displayed in Table 2. Hence, the solution has a high affinity for more exchangeable ions [78]. A significant increase in the iron percentage was also observed after iron oxide surface coating. The iron percentage increased from 0.54 to 8.04% by weight, also illustrated in Table 2, emphasizing the efficiency of the coating process.
Brunauer–Emmett–Teller (BET) model analysis was conducted to determine more characteristics of sodium-pretreated iron-coated zeolite, where a pore size of 211.25 nm and pore volume of 0.0245 cm3/g were obtained.

4.2. Continuous Adsorption Experiments

4.2.1. Effect of Initial Inlet Concentration on Breakthrough Curves

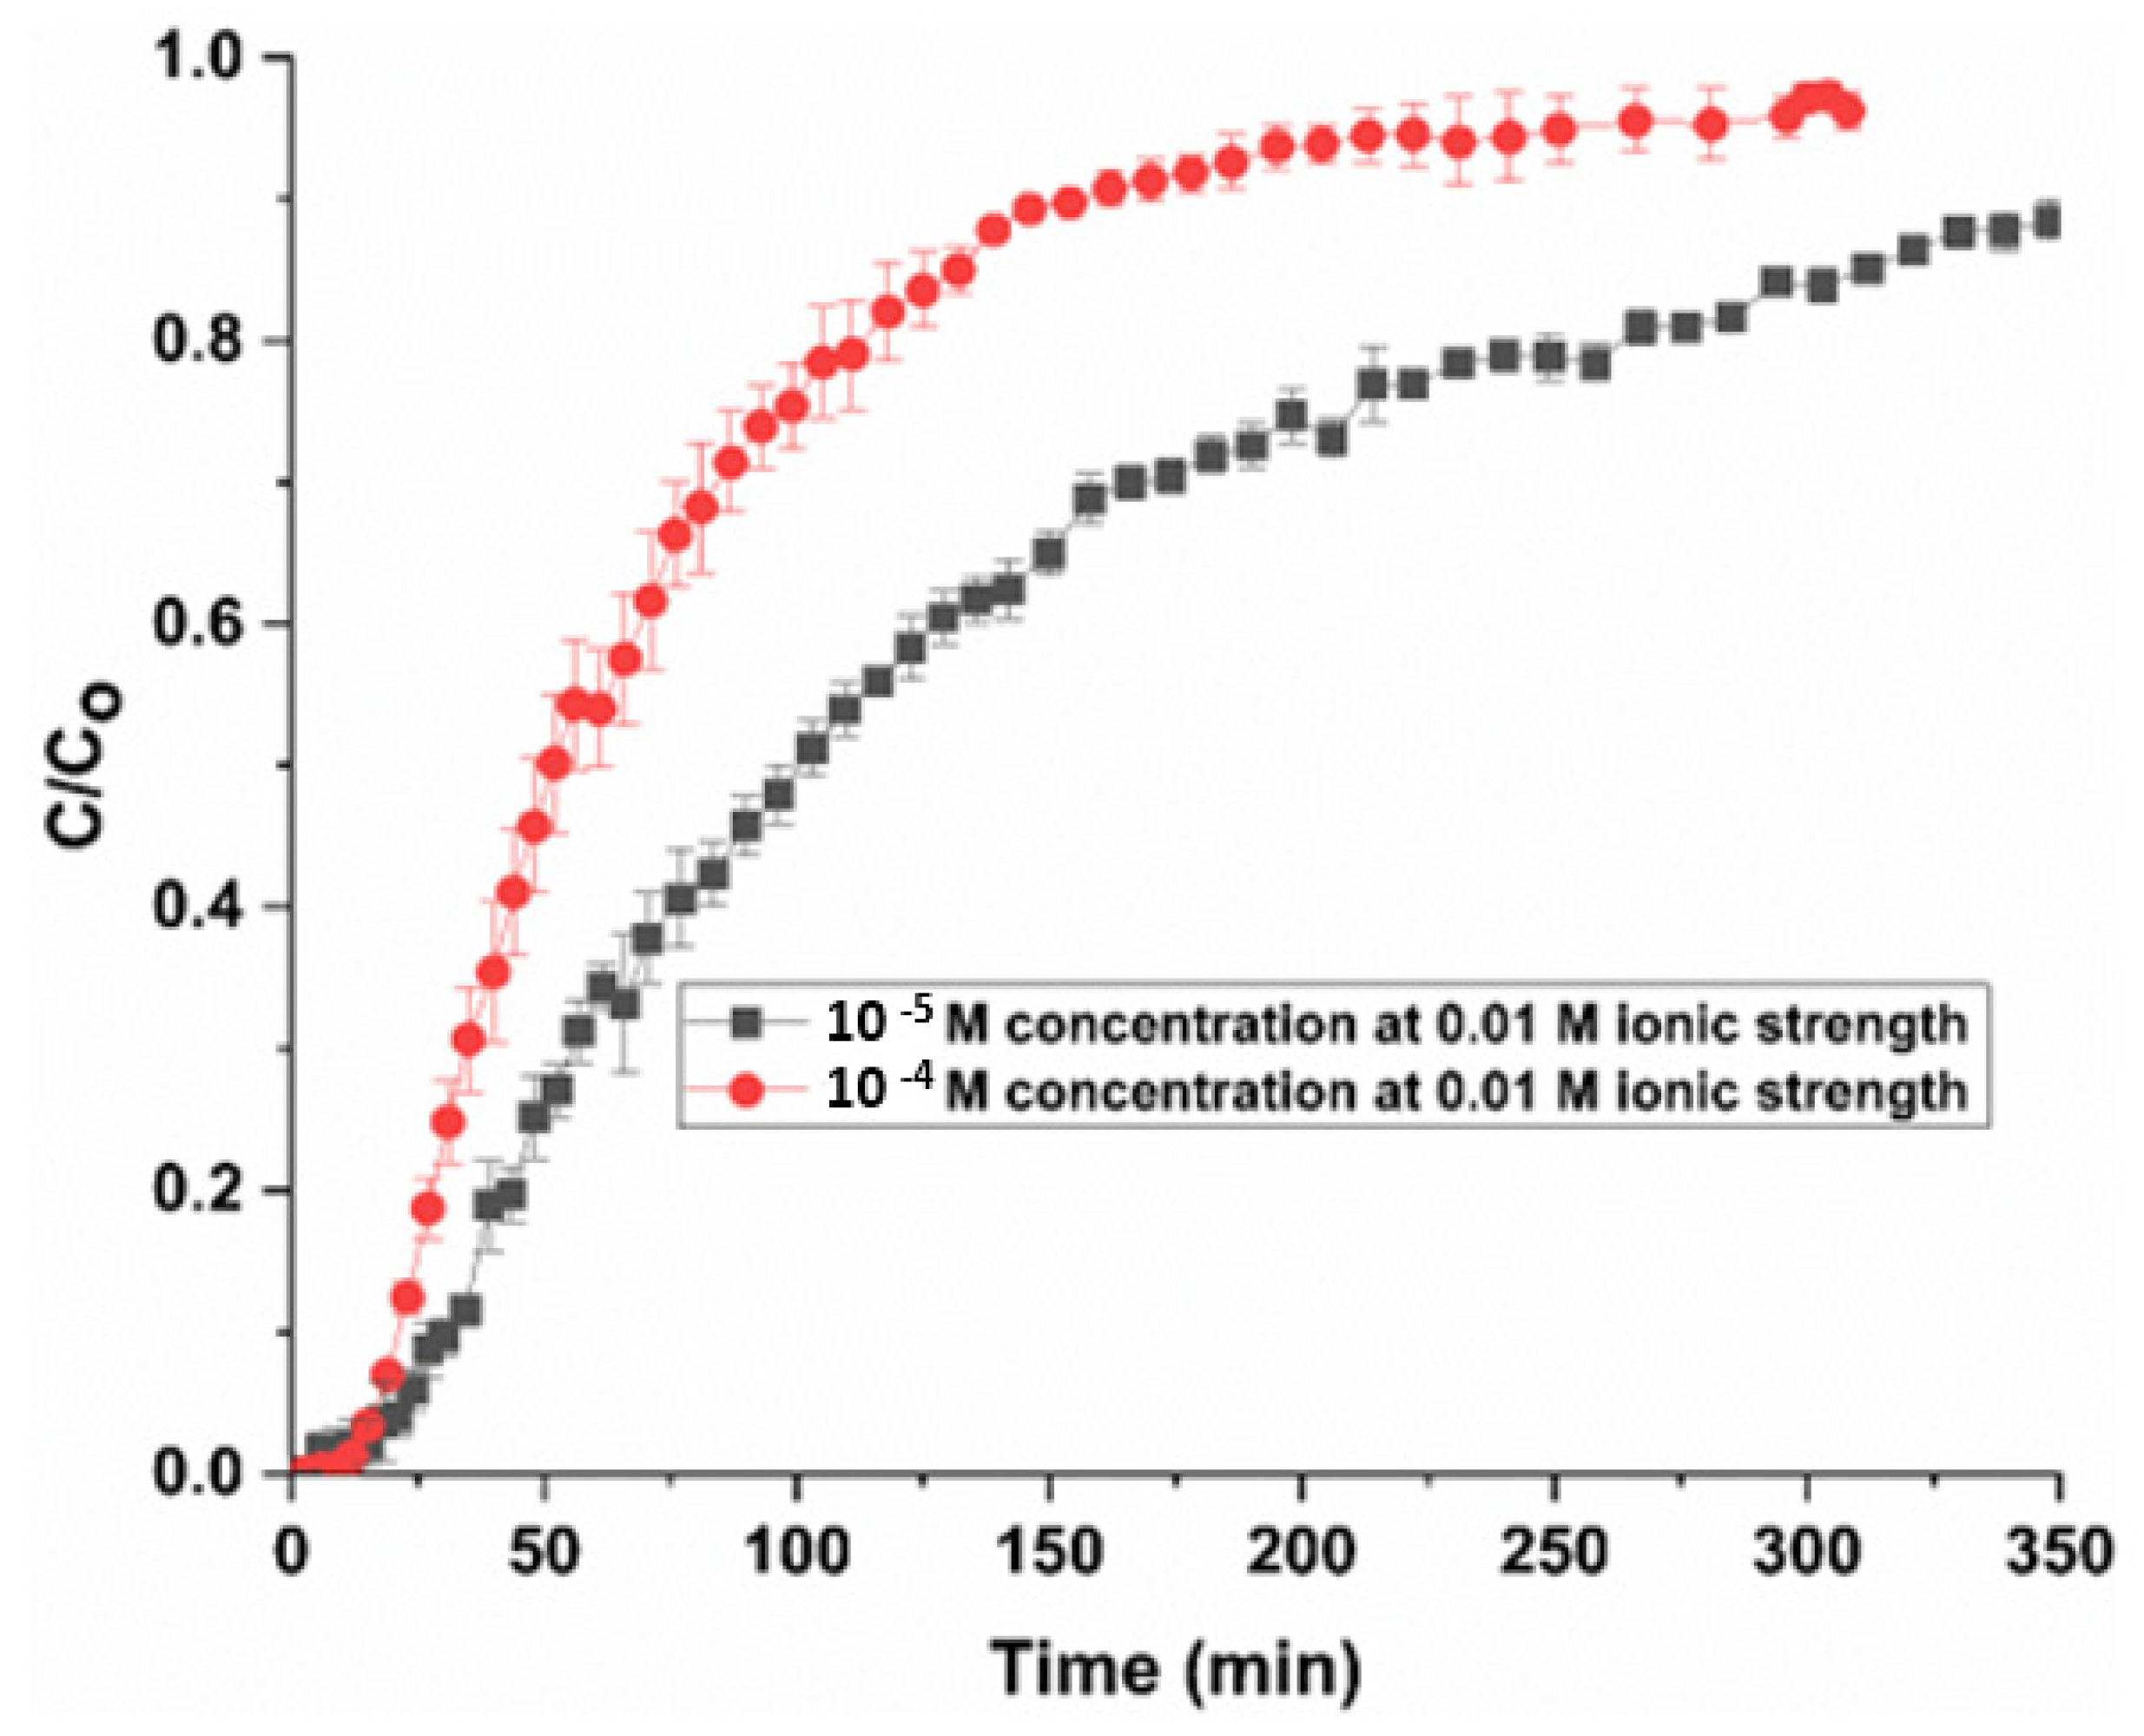
The study of selenite breakthrough curves under varying conditions highlighted the performance of the adsorption process of this anion onto zeolite. Breakthrough curves illustrated the concentration ratio of adsorbate in the outlet flow and its initial concentration (C/Co). The breakthrough curves at different initial selenite concentrations (10−5, 10−4) M and different ionic strengths of (0.01, 1) M, a flow rate of 0.5 mL/min, and pH 7 are shown in this section. The breakthrough curves show a decrease in the treated volume with an increase in the initial concentration; timewise, the saturation breakthrough time of each condition increased with the decreasing initial selenite concentration. Figure 5 shows the selenite breakthrough curves at 0.01 M ionic strength at different initial selenite concentrations. The breakthrough curves for the average of three identical experimental trials of a 10−4 M and 10−5 M initial concentration at a 0.01 M ionic strength are shown. The figure showed that the breakthrough curve occurred slower at the 10−5 M concentration than 10−4 M. The higher the concentration, the steeper the curve and the shorter the breakthrough curve time. The increase in time reflects a higher sorption capacity for selenite and higher mobility retardation. The breakthrough curve of the 10−5 M concentration required almost 100 min to reach its half-saturation concentration, while 50 min were required at 10−4 M, as demonstrated in Figure 5. At higher concentrations, the binding sites of zeolite were most probably occupied faster, resulting in lower retardation at 10−4 M. Figure 5 shows that the breakthrough curves shifted toward the origin at the higher inlet concentration, regardless of the ionic strength value. Curves were sharper and rapidly reached saturation at 10−4 M compared to 10−5 M. This behavior is related to enhancing the driving force for the adsorption process, resulting in the early saturation and occupation of iron-coated zeolite active sites at the higher concentration.

4.2.2. Effect of Ionic Strength on Breakthrough Curves

The breakthrough curves for the average of three experimental trials at two ionic strength values (0.01 M and 1 M) for the 10−4 M selenite concentration are shown in Figure 6. The breakthrough curves of the 0.01 M and 1.0 M ionic strengths show the neglected effect of this variable on selenite sorption onto modified zeolite. This negligible effect is due to the selenite sorption mechanism on the amphoteric sites. Selenite binds strongly and forms inner-sphere complexes with these surfaces. Thus, these bonds are not affected by ions present in the solution. Hence, the shape of the breakthrough curves was almost the same under the two studied ionic strengths. The time required for breakthrough saturation and the ability of modified zeolite to retard the mobility of selenite were almost the same under the studied ionic strength concentrations, as demonstrated in Figure 6.

4.3. Statistical Analysis

The efficient design of fixed-bed columns requires the accurate prediction of breakthrough curves of adsorbate effluent. Therefore, the obtained breakthrough curves were analyzed and modeled using suggested regression models. Proposed models were fitted to selenite experimental adsorption data. As shown in Figure 7, diagnostic plots of this model are used to assess the quality of adsorption data fitting models.
Model assumptions need to be inserted before implementing the final models. The model outcome will not provide a satisfactory performance if these assumptions are not validated. Four stages are required to be assessed to validate these assumptions, including normality, linearity, independence, and homogeneity of variance for the experimental data using these stages. Diagnostic plot analysis results confirm whether or not the best adsorption data fitting of selenite has been obtained.
Figure 7a represents the plot of residuals against the fitted data of selenite adsorption. This plot checks if the residual data exhibit non-linear regression. As shown, the residuals increase in a spread from left to right. As the model residuals have a non-linear relationship with the fitted values, adding quadratic or interaction components may enhance the predictions. The model residuals show no relationship between the mean and the fitted values, but their variance increases with the fitted values. Therefore, the constant model error assumption is not satisfied. Moreover, Figure 7c checks the assumption of homoscedasticity among the residuals in the regression model. Furthermore, as shown in Figure 7c, the red line, which displays the trend of variation of the residuals, increases from left to right.
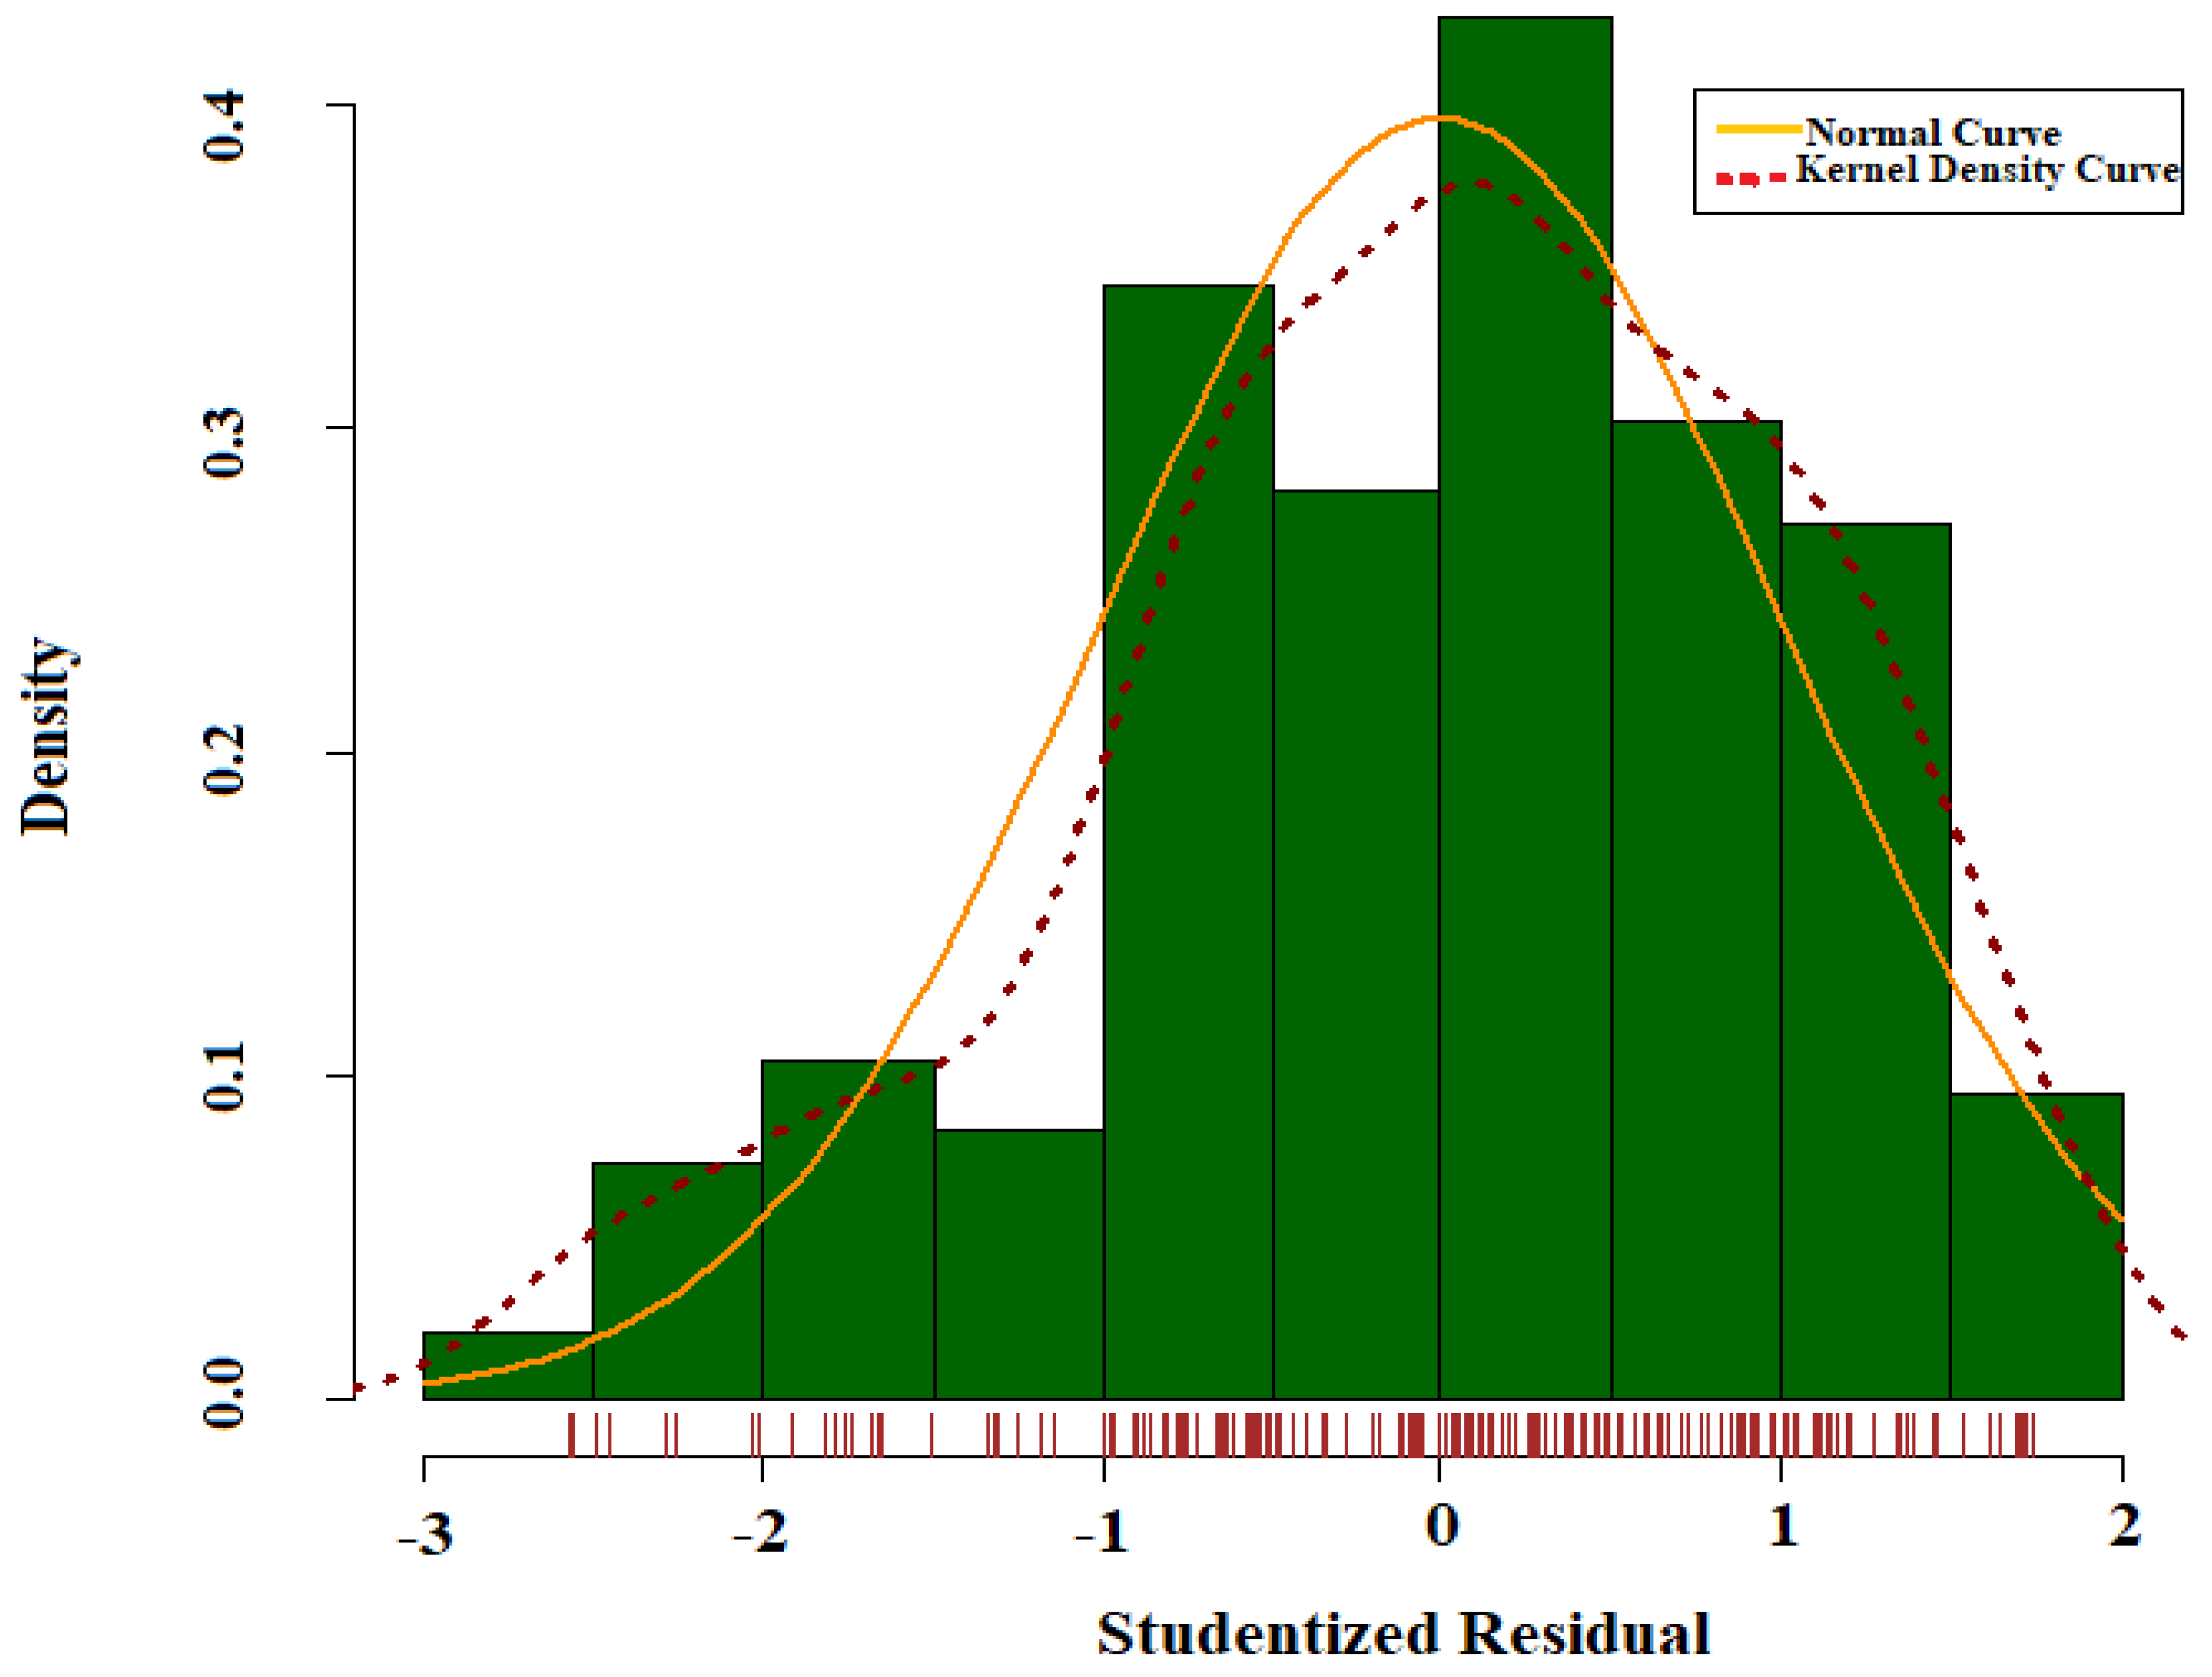
The initial assumption, as illustrated in Figure 8, is that the data are normally distributed. Figure 7b and Figure 8 show the normal plot based on the distribution of the data points. The figures show a severely skewed distribution of the response variable. Consequently, a normality analysis and maybe some transformations are necessary. The Q-Q plot is a great visual indicator if the residuals are not normally distributed. According to the standard modeling assumptions, the tails have larger values than those we would expect. Thus, transforming variables are required to yield a normal distribution. As shown in Figure 7d, the residuals are distributed and validate the residuals’ homogeneity of variance (homoscedasticity).

4.4. Performance of ML Algorithms

The efficiency of the proposed ML algorithms has been compared using MAE, RMSE, MAPE, and R2 indicators to predict the relative concentration, as shown in Table 3.
The linear and non-linear regressions provided less accuracy than the machine learning-based models. Thus, the current research focused on utilizing the most effective machine learning algorithms to produce the most accurate results from the prediction process. As a result, the comparison outcomes reveal that CatBoost had higher measures of the R2 value and lower MAE, RMSE, and MAPE values compared with other models for the relative concentration prediction. According to these metrics, the LightGBM and Gradient models surpassed the other prediction models (i.e., AdaBoost and XGBoost). On the other hand, the results also indicate that the CatBoost and LightGBM had an outstanding prediction ability compared to XGBoost.
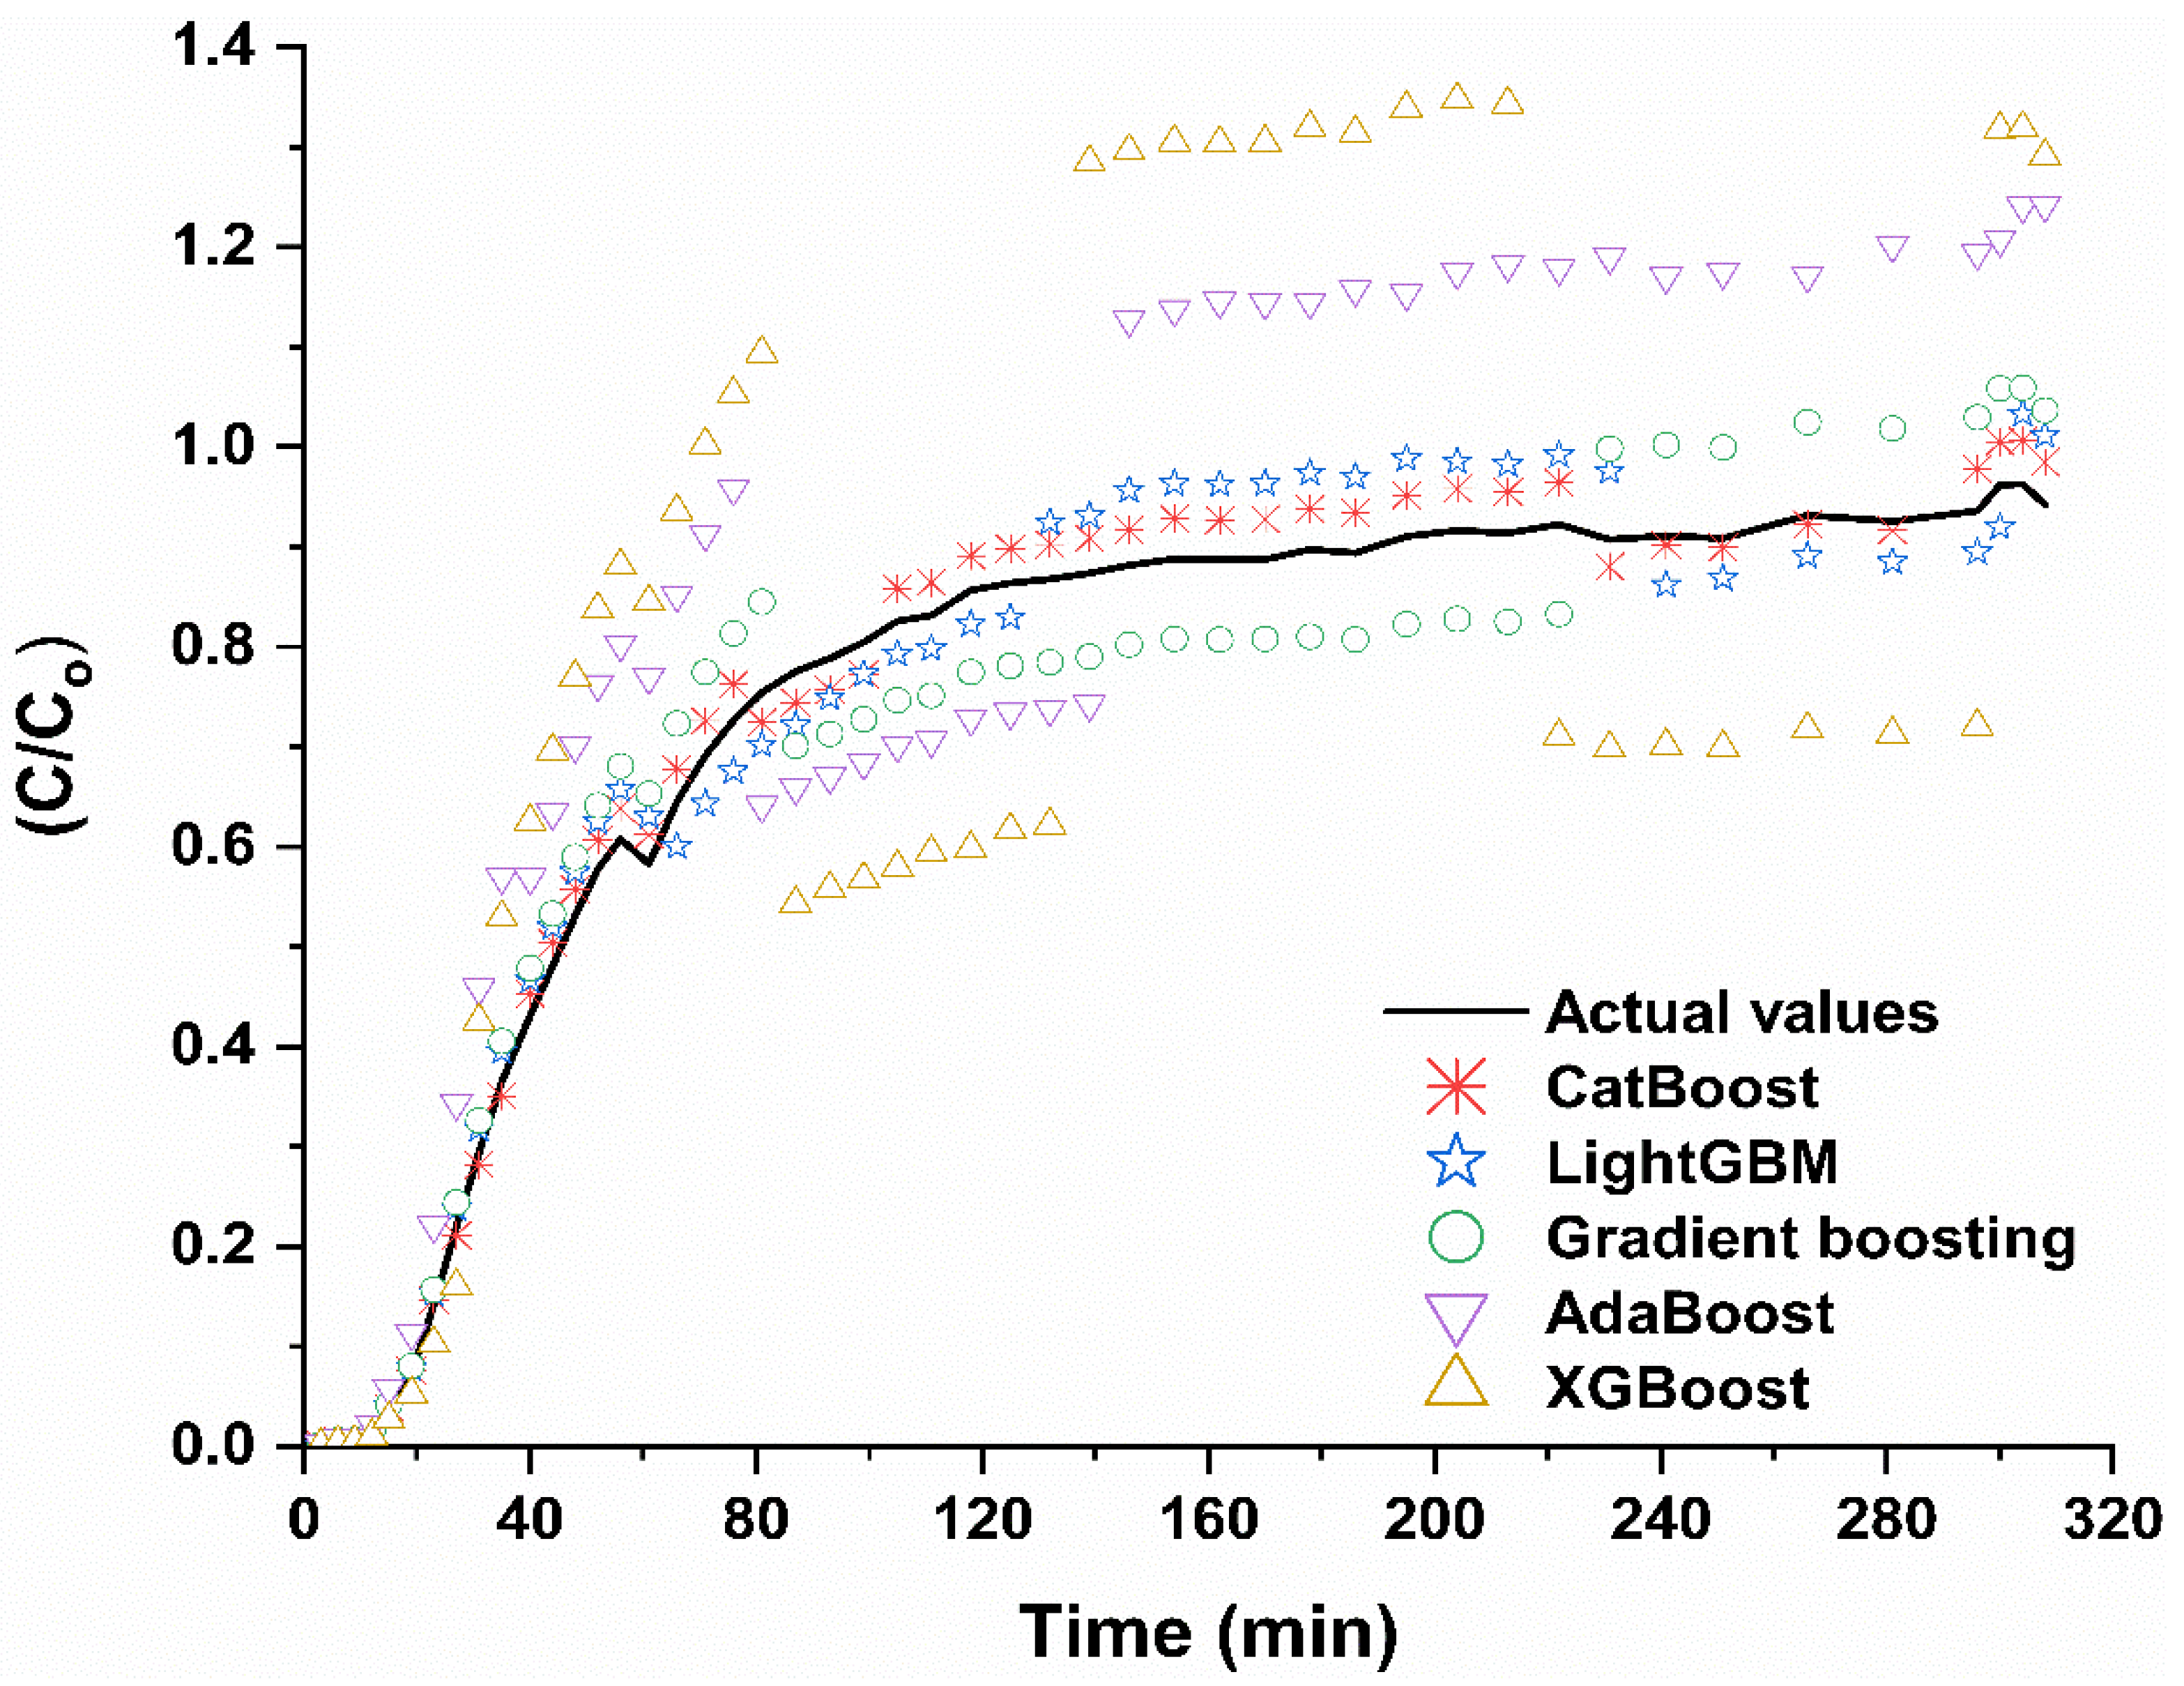
Moreover, the forecasted results of the proposed model illustrate that the CatBoost prediction values are very close to the experimental relative concentration measures. Therefore, the better fit, with only a slight deviation from the experimental values, is the CatBoost model. The plots compare the predicted performance of the proposed models. As a result, the CatBoost is the most efficient and proficient model in predicting the relative concentration.
Figure 9, showing the CatBoost Mechanism, clearly illustrates that there is more than one value for the multi-regression, which indicates that the leaves are at the same level, and the same splitting rule can be applied to all intermediate nodes within the same tree level. Furthermore, the same features can be used to make left and right splits for each level of Figure 9, creating an “Oblivious Decision Tree.” Herein, the splitting rule at the same tree level is the same for all nodes, and the tree is symmetrical, indicating that there are only “FloatFeature” nodes in the visualized tree. Moreover, the node corresponding to the “FloatFeature” split contains the feature index and border value used to split objects. Therefore, in the visualized tree, each node represents one split. In addition, since there are three types of splits, three types of tree nodes exist. For example, the node of depth 0 shows that objects are splitters with a border value of 5.5 × 10⁻⁵ nodes of the depth 0 split objects by their 2nd feature of 34.6831. In the same vine, nodes of depth 2 split objects by their 3rd feature with a border value of 10.4553. Hence, the final possible result is optimization with less mean.
Figure 10 also shows the experimental results (10−4 M initial concentration and 0.01 M ionic strength) compared with the machine learning-based generated results. The figure also illustrates that the C a t B o o s t   has the best accuracy compared with the other methods, indicating that   C a t B o o s t is a formidable tool for prediction and regression purposes. The findings of the current research support such a statement for various reasons. First, from the robustness point of view, C a t B o o s t can increase model performance while lowering overfitting and tweaking time. In addition, C a t B o o s t includes various settings that may be tweaked [79].
Nonetheless, because the default values yield excellent results, it lowers the need for substantial hyper-parameter adjustment. Secondly, from an accuracy point of view, the C a t B o o s t method is a unique gradient-boosting technique that is both fast and greedy [79]. As a result, C a t B o o s t (when properly implemented) either leads or ties in competition with traditional benchmarks. Finally, the accuracy evaluation matrices show that C a t B o o s t has surpassed the other used algorithms.
As shown in Figure 10, the proposed models have different capabilities for predicting selenite behavior on the iron-coated zeolite. AdaBoost and XGBoost models provide the worst performance for the data fitting of selenite breakthrough curves at both the initial and final stages of adsorption since relative concentration values higher than 1 were observed (C/Co > 1), which suggests a higher selenite effluent concentration than the initial feeding one. This finding contradicts the fundamental adsorption system principle where the adsorbate feeding concentration cannot be exceeded, and the maximum relative concentration of it equals 1 (C/Co = 1). In contrast, the LightGBM model provides a relatively good fit, while the CatBoost model provides the best fit. This variation of performance between the models highlighted the challenge of finding a model to fit the experimental data. On the other hand, it proposed an alternative for the time-consuming laboratory scale experiments, which could also be expensive if a synthetic unnatural adsorbent is used. Based on this, the CatBoost model offers an advantage for the fixed-bed column because it predicted the adsorption performance under the studied operation conditions. This model may also be employed to predict the adsorption behavior under different operation conditions.

4.5. Feature Importance

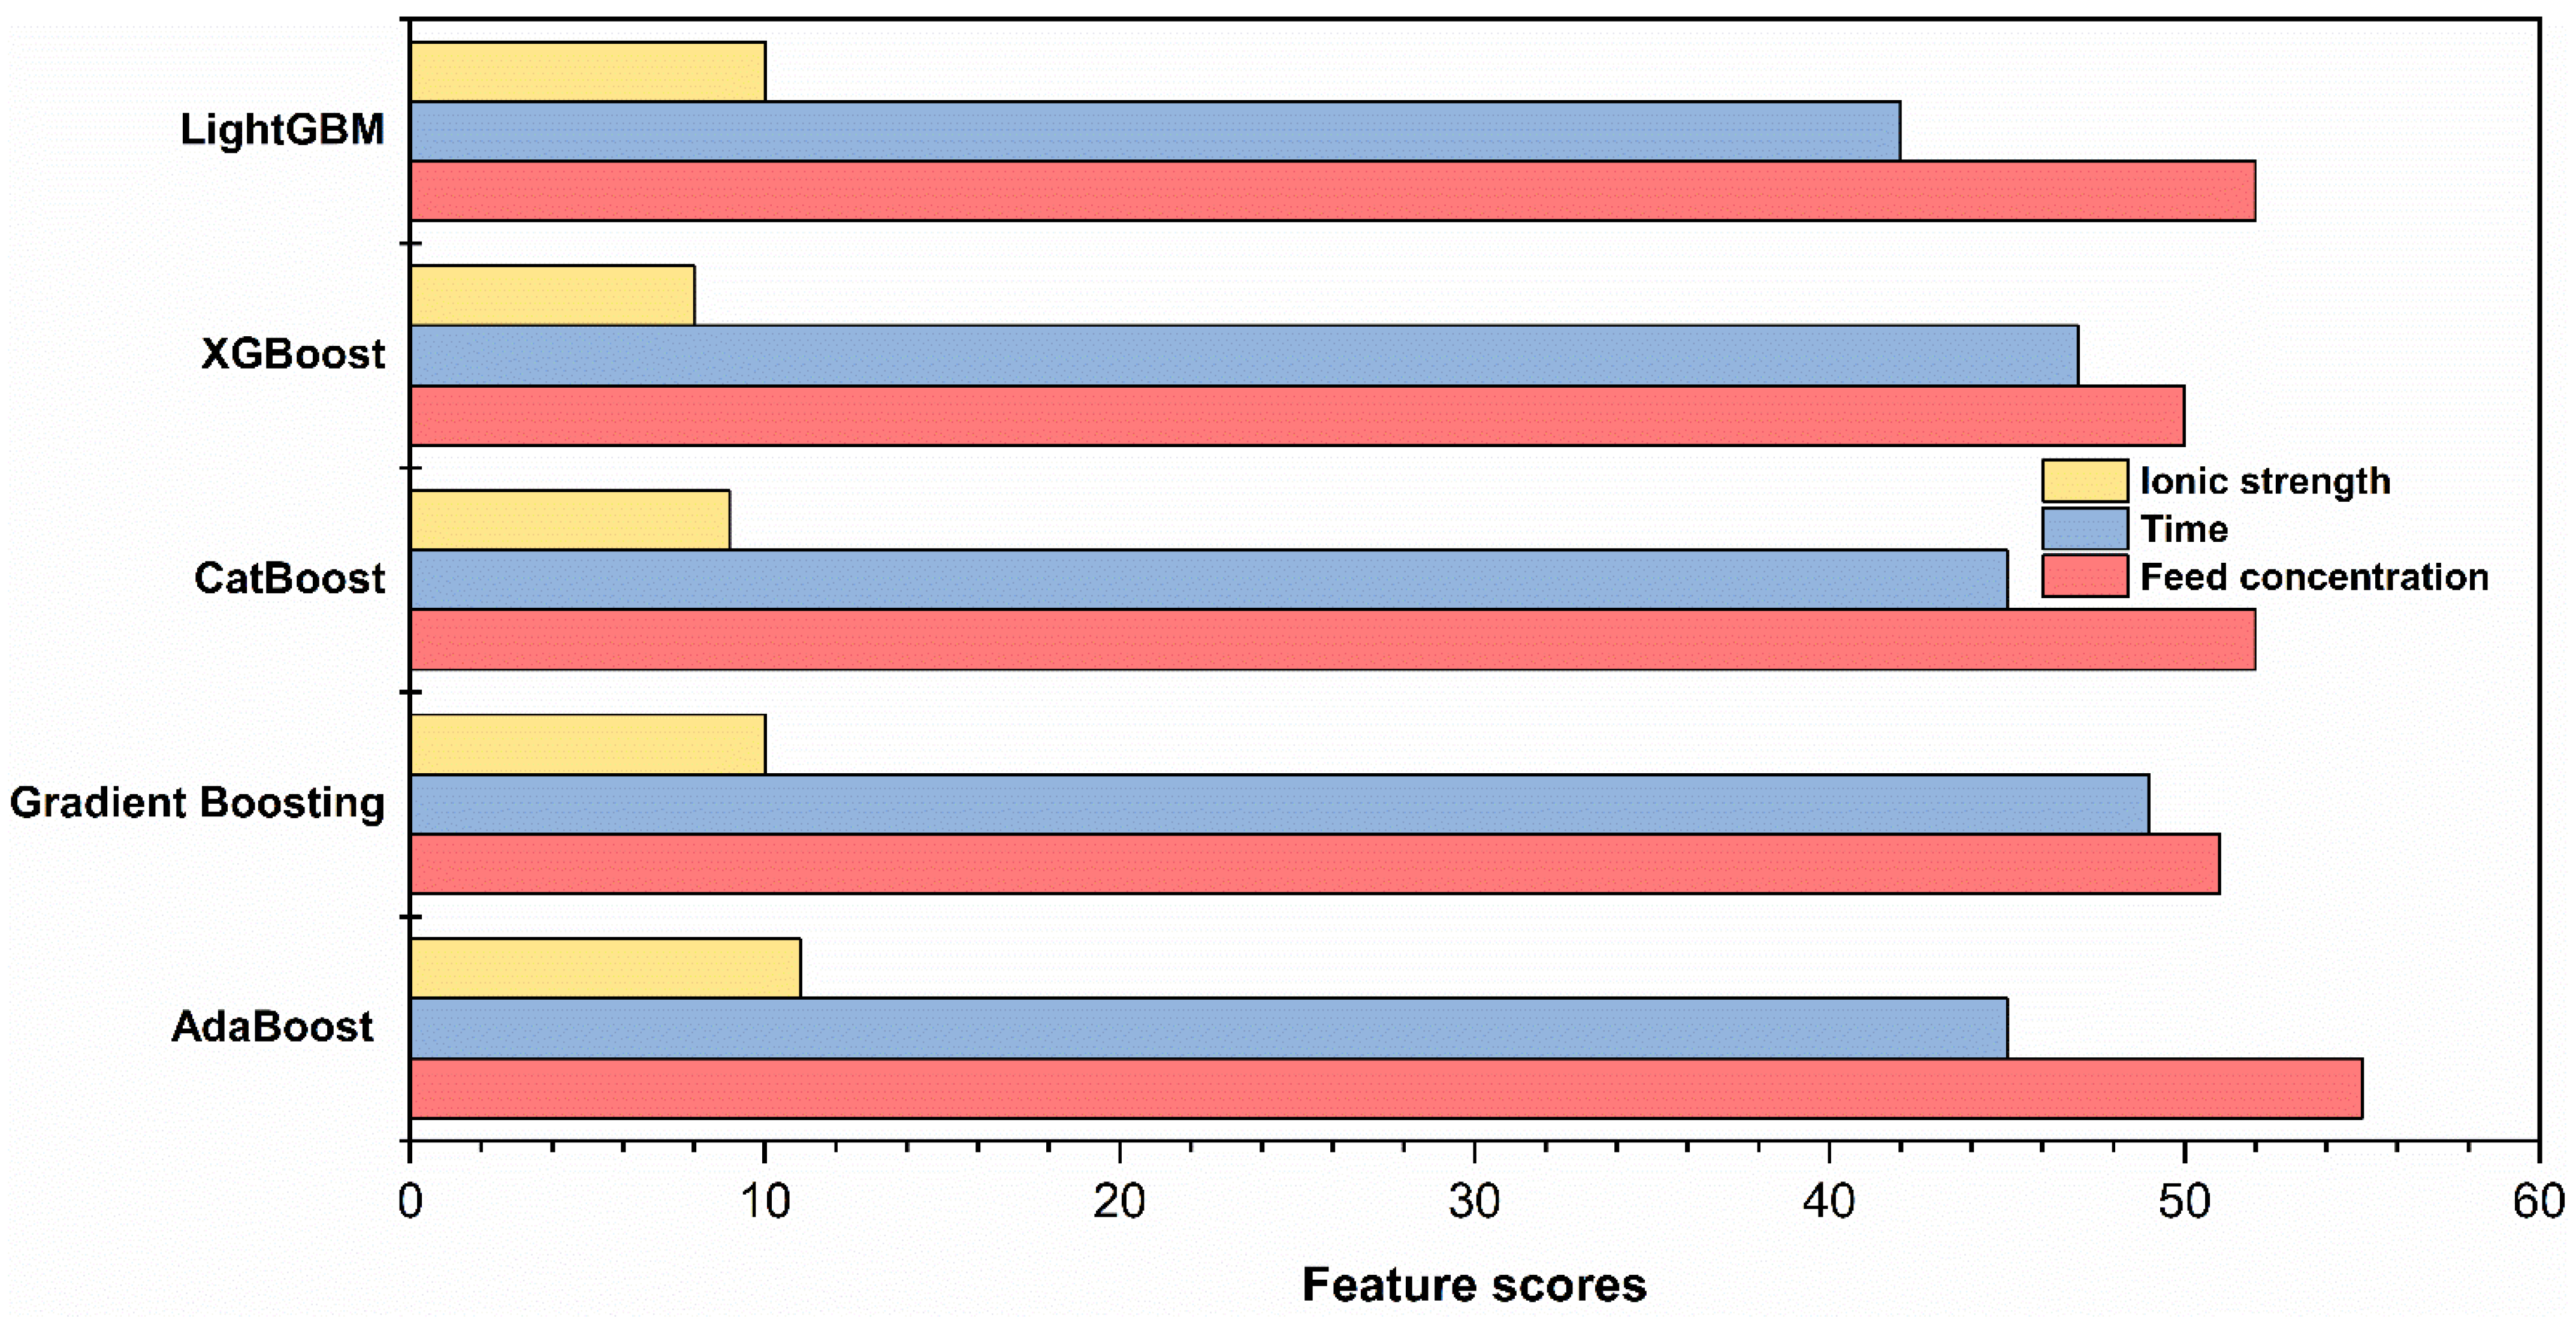
A better view of the model’s features helps stakeholders effectively judge trends. Therefore, a feature importance assessment has been performed using LightGBM, XGBoost, CatBoost, Gradient, and Adaboost models to determine the degree of importance of each variable involved in predicting the relative concentration. Hence, the feature score plot has been conducted to provide a relative score for each variable, as shown in Figure 11.
One of the vital characteristics of the CATBoost utilization is its unique ability to quantify feature importance. In such a case, the feature importance estimation is executed depending on the Prediction   Values   Change   theory, which relies on a simple yet effective approach that quantifies the average prediction flocculation when a specific attribute shifts. Herein, the prediction change is directly associated with the feature value change in a positive relationship. Moreover, from a mathematical point of view, feature importance can be numerically calculated using Equations (13) and (14):
F e a t u r e   i m p o r t a n c e = ( λ 1 μ ) 2 × ω 1 + ( λ 2 μ ) 2 × ω 2      
μ = λ 1 × ω 1 + λ 2 × ω 2 λ 1 × ω 1
where ω 1 and ω 2 represent the overall weight of points in the right and left leaves. In addition, λ 1 and λ 2   signify the formulation rate in the right and left leaves, respectively.
As a result, the feature significance was computed and sorted in descending order: initial concentration, pore volume, and ionic strength. Determining the influential variables and their importance on selenite sorption enhances the prediction model’s performance. The feature score result was consistent with the column adsorption experiment results, where selenite adsorption was not affected by changing the ionic strength. This agreement suggests the value of using machine learning-based models to distinguish between adsorption mechanisms. Selenite tends to bind more strongly on the adsorbent surfaces via the formation of inner-sphere complexes dependent on selenite’s initial concentration, while the effect of ionic strength is negligible. Figure 11 showed that the initial selenite concentration was the major influential variable affecting the relative concentration (C/Co) value. The highest initial concentration score confirmed this variable’s significant effect on selenite sorption onto modified zeolite. On the other hand, the lowest ionic strength score supports this variable’s negligible effect.
The machine learning-based prediction models used in this study has enlightened the path and opened up new possibilities for implementing and integrating models for predicting and modeling various contaminants’ environmental behavior. The applicability of these models is not limited to selenite removal and can also be used for different processes other than adsorption. Developing the machine learning-based models will facilitate the understanding of the uncertain non-linear patterns of the water pollutants compared to the traditional statistical, empirical, or mathematical models. The feature importance technique can also evaluate the most significant factors affecting the treatment process. The application of ML-based models for studying the adsorption behavior of selenite on iron-coated zeolite can inspire researchers to utilize this approach’s great potential to develop other innovative novel adsorbents that can perform better for contaminants’ removal from water. Different ML-based artificial network strategies can be used for developing new adsorbents (e.g., generative adversarial network and the variational autoencoder). Prediction models can pave the road for a large-scale application technology in the environmental engineering systems, where such adsorbents can be used, e.g., permeable reactive barriers for groundwater remediation where developed adsorbents can be used as a permeable material. In general, using the ML-based models will reduce the burden on tedious laboratory-scale work in terms of time, cost, space requirements, and workforce.

5. Conclusions

In this research, machine learning-based boosted regression tree algorithms have been implemented for selenite breakthrough curve modeling. The capability of five boosted regression model approaches for predicting the breakthrough curves of selenite sorption onto chemically modified zeolite using fixed-bed columns data was studied and evaluated. First, column experiments were conducted under different geochemical conditions, and then the column performance as a function of initial selenite concentration and ionic strength data sets were modeled using the boosted regression tree algorithms. These models were implemented to predict the performance and the most significant operating variable for future continuous adsorption experiments. The models were tested via statistical performance metrics, and the validation of these models was evaluated. Each model showed different capabilities in predicting selenite transport in the column. CatBoost prediction values were the most efficient and the closest to the laboratory relative concentration values, with a minimal error between the predicted and experimental results. The CatBoost model had the highest coefficient of determination, followed by the LightGBM and Gradient models. The fold cross-validation test supports the prediction accuracy of these models, where the CatBoost model had less MAE and MAPE than the other four models.
A feature importance assessment verified that the feed concentration of selenite is the most influential variable, while the ionic strength had the least impact. Determining the importance of these variables will significantly enhance the prediction of future breakthrough curves. The importance of this work lies in the use of data processing algorithms that offer additional advantages for the column adsorption process design in water treatment. This approach can be applied and expanded to cover a wide range of adsorption behaviors of other contaminants and evaluate the affinity of different adsorbents under different operating conditions.
Nevertheless, the current study has some limitations. For instance, larger dataset sizes can be used to test the developed model’s capabilities. Additionally, more investigations are required to test the proposed model’s accuracy with the presence of overfitting. Moreover, the issue of performance degradation when larger datasets are analyzed needs to be considered. Furthermore, the proposed model can be improved to be more generic and investigate further features, such as the effect of interfering ions, the volumetric flowrate, bed height, and adsorbent particle size. Additionally, it is critical to identify the most influential characteristics through effective feature selection and correlation to speed up the prediction process and minimize potential overfitting by limiting the number of attributes examined.

Author Contributions

Conceptualization, N.H. and O.A.; methodology, N.H., C.P., O.A. and A.S.; software, O.A., A.S., R.E.A.M. and A.S.A. ; validation, O.A., A.S., R.E.A.M. and A.S.A.; formal analysis, O.A., A.S. and N.H.; investigation, N.H., A.S. and O.A.; resources, N.H.; writing—original draft preparation, N.H.; writing—review and editing, N.H., O.A., A.S., A.A.-O. and M.T.; visualization, N.H., A.A.-O., M.T. and A.S.; supervision, N.H.; project administration, N.H. and O.A.; All authors have read and agreed to the published version of the manuscript.

Funding

This research received no external funding.

Institutional Review Board Statement

Not applicable.

Informed Consent Statement

Not applicable.

Data Availability Statement

Not applicable.

Acknowledgments

The authors extend their appreciation to the Deanship of Scientific Research at King Khalid University for funding this work through Large Groups Project under grant number (RGP. 2/178/43). Neda Halalsheh gratefully acknowledges the Deanship of Scientific Research at the Hashemite University for the funding support (Grant number: 89/2019).

Conflicts of Interest

The authors declare no conflict of interest.

References

  1. He, Y.; Xiang, Y.; Zhou, Y.; Yang, Y.; Zhang, J.; Huang, H.; Shang, C.; Luo, L.; Gao, J.; Tang, L. Selenium contamination, consequences and remediation techniques in water and soils: A review. Environ. Res. 2018, 164, 288–301. [Google Scholar] [CrossRef]
  2. Etteieb, S.; Magdouli, S.; Zolfaghari, M.; Brar, S. Monitoring and analysis of selenium as an emerging contaminant in mining industry: A critical review. Sci. Total Environ. 2019, 698, 134339. [Google Scholar] [CrossRef] [PubMed]
  3. Hay, M.B.; Leone, G.; Partey, F.; Wilking, B. Selenium attenuation via reductive precipitation in unsaturated waste rock as a control on groundwater impacts in the Idaho phosphate patch. Appl. Geochem. 2016, 74, 176–193. [Google Scholar] [CrossRef]
  4. Vinceti, M.; Filippini, T.; Wise, L.A. Environmental Selenium and Human Health: An Update. Curr. Environ. Health Rep. 2018, 5, 464–485. [Google Scholar] [CrossRef]
  5. Jacobson, A.T.; Fan, M. Evaluation of natural goethite on the removal of arsenate and selenite from water. J. Environ. Sci. 2019, 76, 133–141. [Google Scholar] [CrossRef]
  6. Qin, H.-B.; Zhu, J.-M.; Liang, L.; Wang, M.-S.; Su, H. The bioavailability of selenium and risk assessment for human selenium poisoning in high-Se areas, China. Environ. Int. 2013, 52, 66–74. [Google Scholar] [CrossRef] [PubMed]
  7. Okonji, S.; Achari, G.; Pernitsky, D. Environmental Impacts of Selenium Contamination: A Review on Current-Issues and Remediation Strategies in an Aqueous System. Water 2021, 13, 1473. [Google Scholar] [CrossRef]
  8. Pérez-Corona, T.; Madrid, Y.; Cámara, C. Evaluation of selective uptake of selenium (Se (IV) and Se (VI)) and antimony (Sb (III) and Sb (V)) species by baker’s yeast cells (Saccharomyces cerevisiae). Anal. Chim. Acta 1997, 345, 249–255. [Google Scholar] [CrossRef]
  9. Simmons, D.; Wallschläger, D. A critical review of the biogeochemistry and ecotoxicology of selenium in lotic and lentic environments. Environ. Toxicol. Chem. 2005, 24, 1331–1343. [Google Scholar] [CrossRef]
  10. Lv, H.; Chen, W.; Zhu, Y.; Yang, J.; Mazhar, S.H.; Zhao, P.; Wang, L.; Li, Y.; Azam, S.M.; Ben Fekih, I.; et al. Efficiency and risks of selenite combined with different water conditions in reducing uptake of arsenic and cadmium in paddy rice. Environ. Pollut. 2020, 262, 114283. [Google Scholar] [CrossRef]
  11. Evans, S.F.; Ivancevic, M.R.; Yan, J.; Naskar, A.K.; Levine, A.M.; Lee, R.J.; Tsouris, C.; Paranthaman, M.P. Magnetic adsorbents for selective removal of selenite from contaminated water. Sep. Sci. Technol. 2019, 54, 2138–2146. [Google Scholar] [CrossRef]
  12. Golder Associates. Literature Review of Treatment Technologies to Remove Selenium from Mining-Influenced Water; Technical Report; Golder Associates: Lakewood, CO, USA, 2009; p. 40. [Google Scholar]
  13. Staicu, L.C.; Morin-Crini, N.; Crini, G. Desulfurization: Critical step towards enhanced selenium removal from industrial effluents. Chemosphere 2017, 172, 111–119. [Google Scholar] [CrossRef] [PubMed]
  14. Okonji, S.O.; Yu, L.; Dominic, J.A.; Pernitsky, D.; Achari, G. Adsorption by Granular Activated Carbon and Nano Zerovalent Iron from Wastewater: A Study on Removal of Selenomethionine and Selenocysteine. Water 2020, 13, 23. [Google Scholar] [CrossRef]
  15. Jalbani, N.S.; Solangi, A.R.; Memon, S.; Junejo, R.; Bhatti, A.A.; Yola, M.L.; Tawalbeh, M.; Karimi-Maleh, H. Synthesis of new functionalized Calix[4]arene modified silica resin for the adsorption of metal ions: Equilibrium, thermodynamic and kinetic modeling studies. J. Mol. Liq. 2021, 339, 116741. [Google Scholar] [CrossRef]
  16. Al Sharabati, M.; Abokwiek, R.; Al-Othman, A.; Tawalbeh, M.; Karaman, C.; Orooji, Y.; Karimi, F. Biodegradable polymers and their nano-composites for the removal of endocrine-disrupting chemicals (EDCs) from wastewater: A review. Environ. Res. 2021, 202, 111694. [Google Scholar] [CrossRef]
  17. Kalaitzidou, K.; Nikoletopoulos, A.-A.; Tsiftsakis, N.; Pinakidou, F.; Mitrakas, M. Adsorption of Se(IV) and Se(VI) species by iron oxy-hydroxides: Effect of positive surface charge density. Sci. Total Environ. 2019, 687, 1197–1206. [Google Scholar] [CrossRef]
  18. Li, J.; Wang, X.; Zhao, G.; Chen, C.; Chai, Z.; Alsaedi, A.; Hayat, T.; Wang, X. Metal–organic framework-based materials: Superior adsorbents for the capture of toxic and radioactive metal ions. Chem. Soc. Rev. 2018, 47, 2322–2356. [Google Scholar] [CrossRef]
  19. Okonji, S.O.; Achari, G.; Pernitsky, D. Removal of Organoselenium from Aqueous Solution by Nanoscale Zerovalent Iron Supported on Granular Activated Carbon. Water 2022, 14, 987. [Google Scholar] [CrossRef]
  20. Al Bsoul, A.; Hailat, M.; Abdelhay, A.; Tawalbeh, M.; Al-Othman, A.; Al-Kharabsheh, I.N.; Al-Taani, A.A. Efficient removal of phenol compounds from water environment using Ziziphus leaves adsorbent. Sci. Total Environ. 2020, 761, 143229. [Google Scholar] [CrossRef]
  21. Al Bsoul, A.; Hailat, M.; Abdelhay, A.; Tawalbeh, M.; Jum’H, I.; Bani-Melhem, K. Treatment of olive mill effluent by adsorption on titanium oxide nanoparticles. Sci. Total Environ. 2019, 688, 1327–1334. [Google Scholar] [CrossRef]
  22. Abuwatfa, W.H.; Al-Muqbel, D.; Al-Othman, A.; Halalsheh, N.; Tawalbeh, M. Insights into the removal of microplastics from water using biochar in the era of COVID-19: A mini review. Case Stud. Chem. Environ. Eng. 2021, 4, 100151. [Google Scholar] [CrossRef]
  23. Ali, I.; Shrivastava, V. Recent advances in technologies for removal and recovery of selenium from (waste)water: A systematic review. J. Environ. Manag. 2021, 294, 112926. [Google Scholar] [CrossRef] [PubMed]
  24. Bandara, P.C.; Perez, J.V.D.; Nadres, E.T.; Nannapaneni, R.G.; Krakowiak, K.J.; Rodrigues, D.F. Graphene Oxide Nanocomposite Hydrogel Beads for Removal of Selenium in Contaminated Water. ACS Appl. Polym. Mater. 2019, 1, 2668–2679. [Google Scholar] [CrossRef]
  25. Hayes, K.F.; Papelis, C.; Leckie, J.O. Modeling ionic strength effects on anion adsorption at hydrous oxide/solution interfaces. J. Colloid Interface Sci. 1988, 125, 717–726. [Google Scholar] [CrossRef]
  26. Parida, K.M.; Gorai, B.; Das, N.N.; Rao, S.B. Studies on ferric oxide hydroxides: III. Adsorption of selenite (SeO2−3) on different forms of iron oxyhydroxides. J. Colloid Interface Sci. 1997, 185, 355–362. [Google Scholar] [CrossRef] [PubMed]
  27. Monteil-Rivera, F.; Fedoroff, M.; Jeanjean, J.; Minel, L.; Barthes, M.-G.; Dumonceau, J.-M. Sorption of Selenite (SeO32−) on Hydroxyapatite: An Exchange Process. J. Colloid Interface Sci. 2000, 221, 291–300. [Google Scholar] [CrossRef]
  28. Jordan, N.; Lomenech, C.; Marmier, N.; Giffaut, E.; Ehrhardt, J.-J. Sorption of selenium(IV) onto magnetite in the presence of silicic acid. J. Colloid Interface Sci. 2009, 329, 17–23. [Google Scholar] [CrossRef]
  29. Lo, S.L.; Chen, T.Y. Adsorption of Se (IV) and Se (VI) on an iron-coated sand from water. Chemosphere 1997, 35, 919–930. [Google Scholar] [CrossRef]
  30. Zhang, N.; Lin, L.-S.; Gang, D. Adsorptive selenite removal from water using iron-coated GAC adsorbents. Water Res. 2008, 42, 3809–3816. [Google Scholar] [CrossRef]
  31. Han, R.; Zou, L.; Zhao, X.; Xu, Y.; Xu, F.; Li, Y.; Wang, Y. Characterization and properties of iron oxide-coated zeolite as adsorbent for removal of copper(II) from solution in fixed bed column. Chem. Eng. J. 2009, 149, 123–131. [Google Scholar] [CrossRef]
  32. Giles, D.E.; Mohapatra, M.; Issa, T.B.; Anand, S.; Singh, P. Iron and aluminium based adsorption strategies for removing arsenic from water. J. Environ. Manag. 2011, 92, 3011–3022. [Google Scholar] [CrossRef] [PubMed]
  33. Šiljeg, M.; Stefanović, C.; Mazaj, M.; Tušar, N.N.; Arčon, I.; Kovač, J.; Margeta, K.; Kaučič, V.; Logar, N.Z. Structure investigation of As(III)- and As(V)-species bound to Fe-modified clinoptilolite tuffs. Microporous Mesoporous Mater. 2009, 118, 408–415. [Google Scholar] [CrossRef]
  34. Jevtić, S.; Arčon, I.; Rečnik, A.; Babić, B.; Mazaj, M.; Pavlović, J.; Matijaševic, D.; Nikšić, M.; Rajić, N. The iron(III)-modified natural zeolitic tuff as an adsorbent and carrier for selenium oxyanions. Microporous Mesoporous Mater. 2014, 197, 92–100. [Google Scholar] [CrossRef]
  35. Liu, Y.; Liu, F.; Ni, L.; Meng, M.; Meng, X.; Zhong, G.; Qiu, J. A modeling study by response surface methodology (RSM) on Sr(II) ion dynamic adsorption optimization using a novel magnetic ion imprinted polymer. RSC Adv. 2016, 6, 54679–54692. [Google Scholar] [CrossRef]
  36. Negrea, A.; Mihailescu, M.; Mosoarca, G.; Ciopec, M.; Duteanu, N.; Negrea, P.; Minzatu, V. Estimation on Fixed-Bed Column Parameters of Breakthrough Behaviors for Gold Recovery by Adsorption onto Modified/Functionalized Amberlite XAD7. Int. J. Environ. Res. Public Health 2020, 17, 6868. [Google Scholar] [CrossRef]
  37. Giri, A.; Patel, R.; Mahapatra, S. Artificial neural network (ANN) approach for modelling of arsenic (III) biosorption from aqueous solution by living cells of Bacillus cereus biomass. Chem. Eng. J. 2011, 178, 15–25. [Google Scholar] [CrossRef]
  38. Shafeeyan, M.S.; Daud, W.M.A.W.; Shamiri, A. A review of mathematical modeling of fixed-bed columns for carbon dioxide adsorption. Chem. Eng. Res. Des. 2014, 92, 961–988. [Google Scholar] [CrossRef]
  39. Hu, Q.; Huang, Q.; Yang, D.; Liu, H. Prediction of breakthrough curves in a fixed-bed column based on normalized Gudermannian and error functions. J. Mol. Liq. 2020, 323, 115061. [Google Scholar] [CrossRef]
  40. Alshboul, O.; Shehadeh, A.; Tatari, O.; Almasabha, G.; Saleh, E. Multiobjective and multivariable optimization for earthmoving equipment. J. Facil. Manag. 2022; ahead-of-publish. [Google Scholar] [CrossRef]
  41. Shehadeh, A.; Alshboul, O.; Hamedat, O. A Gaussian mixture model evaluation of construction companies’ business acceptance capabilities in performing construction and maintenance activities during COVID-19 pandemic. Int. J. Manag. Sci. Eng. Manag. 2021, 17, 112–122. [Google Scholar] [CrossRef]
  42. Lu, Y. Artificial intelligence: A survey on evolution, models, applications and future trends. J. Manag. Anal. 2019, 6, 1–29. [Google Scholar] [CrossRef]
  43. Alshboul, O.; Alzubaidi, M.A.; Al Mamlook, R.E.; Almasabha, G.; Almuflih, A.S.; Shehadeh, A. Forecasting Liquidated Damages via Machine Learning-Based Modified Regression Models for Highway Construction Projects. Sustainability 2022, 14, 5835. [Google Scholar] [CrossRef]
  44. Sergeev, A.; Buevich, A.; Baglaeva, E.; Shichkin, A. Combining spatial autocorrelation with machine learning increases prediction accuracy of soil heavy metals. CATENA 2019, 174, 425–435. [Google Scholar] [CrossRef]
  45. Chu, Y.; Liu, S.; Cai, G.; Bian, H. Artificial neural network prediction models of heavy metal polluted soil resistivity. Eur. J. Environ. Civ. Eng. 2021, 25, 1570–1590. [Google Scholar] [CrossRef]
  46. Lu, L.; Dao, M.; Kumar, P.; Ramamurty, U.; Karniadakis, G.E.; Suresh, S. Extraction of mechanical properties of materials through deep learning from instrumented indentation. Proc. Natl. Acad. Sci. USA 2020, 117, 7052–7062. [Google Scholar] [CrossRef]
  47. Ozdemir, A.; Polat, K. Deep Learning Applications for Hyperspectral Imaging: A Systematic Review. J. Inst. Electron. Comput. 2020, 2, 39–56. [Google Scholar] [CrossRef]
  48. Ou, D.; Tan, K.; Lai, J.; Jia, X.; Wang, X.; Chen, Y.; Li, J. Semi-supervised DNN regression on airborne hyperspectral imagery for improved spatial soil properties prediction. Geoderma 2021, 385, 114875. [Google Scholar] [CrossRef]
  49. Zhu, S.; Chen, Y.; Khan, M.A.; Xu, H.; Wang, F.; Xia, M. In-Depth Study of Heavy Metal Removal by an Etidronic Acid-Functionalized Layered Double Hydroxide. ACS Appl. Mater. Interfaces 2022, 14, 7450–7463. [Google Scholar] [CrossRef]
  50. Zhu, S.; Xia, M.; Chu, Y.; Khan, M.A.; Lei, W.; Wang, F.; Muhmood, T.; Wang, A. Adsorption and Desorption of Pb(II) on l-Lysine Modified Montmorillonite and the simulation of Interlayer Structure. Appl. Clay Sci. 2019, 169, 40–47. [Google Scholar] [CrossRef]
  51. Haenlein, M.; Kaplan, A. A Brief History of Artificial Intelligence: On the Past, Present, and Future of Artificial Intelligence. Calif. Manag. Rev. 2019, 61, 5–14. [Google Scholar] [CrossRef]
  52. Yaseen, Z.M. An insight into machine learning models era in simulating soil, water bodies and adsorption heavy metals: Review, challenges and solutions. Chemosphere 2021, 277, 130126. [Google Scholar] [CrossRef]
  53. Alshboul, O.; Shehadeh, A.; Al-Kasasbeh, M.; Al Mamlook, R.E.; Halalsheh, N.; Alkasasbeh, M. Deep and machine learning approaches for forecasting the residual value of heavy construction equipment: A management decision support model. Eng. Constr. Arch. Manag. 2021. [Google Scholar] [CrossRef]
  54. Alshboul, O.; Shehadeh, A.; Almasabha, G.; Almuflih, A.S. Extreme Gradient Boosting-Based Machine Learning Approach for Green Building Cost Prediction. Sustainability 2022, 14, 6651. [Google Scholar] [CrossRef]
  55. Blagojev, N.; Kukić, D.; Vasić, V.; Šćiban, M.; Prodanović, J.; Bera, O. A new approach for modelling and optimization of Cu(II) biosorption from aqueous solutions using sugar beet shreds in a fixed-bed column. J. Hazard. Mater. 2019, 363, 366–375. [Google Scholar] [CrossRef] [PubMed]
  56. Chu, K.H. Breakthrough curve analysis by simplistic models of fixed bed adsorption: In defense of the century-old Bohart-Adams model. Chem. Eng. J. 2020, 380, 122513. [Google Scholar] [CrossRef]
  57. Dutta, S.; Parsons, S.A.; Bhattacharjee, C.; Bandhyopadhyay, S.; Datta, S. Development of an artificial neural network model for adsorption and photocatalysis of reactive dye on TiO2 surface. Expert Syst. Appl. 2010, 37, 8634–8638. [Google Scholar] [CrossRef]
  58. Ghaedi, A.M.; Vafaei, A. Applications of artificial neural networks for adsorption removal of dyes from aqueous solution: A review. Adv. Colloid Interface Sci. 2017, 245, 20–39. [Google Scholar] [CrossRef]
  59. Rojas-Mayorga, C.K.; Bonilla-Petriciolet, A.; Sánchez-Ruiz, F.; Moreno-Perez, J.; Reynel-Ávila, H.; Aguayo, I.; Castillo, D.I.M. Breakthrough curve modeling of liquid-phase adsorption of fluoride ions on aluminum-doped bone char using micro-columns: Effectiveness of data fitting approaches. J. Mol. Liq. 2015, 208, 114–121. [Google Scholar] [CrossRef]
  60. Das, S.; Mishra, S. Artificial neural network (ANN) approach for prediction and modeling of breakthrough curve analysis of fixed-bed adsorption of iron ions from aqueous solution by activated carbon from Limonia acidissima shell. Int. J. Chem. React. Eng. 2021, 19, 1197–1219. [Google Scholar] [CrossRef]
  61. Bhagat, S.K.; Tung, T.M.; Yaseen, Z.M. Development of artificial intelligence for modeling wastewater heavy metal removal: State of the art, application assessment and possible future research. J. Clean. Prod. 2020, 250, 119473. [Google Scholar] [CrossRef]
  62. Wang, J.; Ji, H.; Wang, Q.G.; Li, H.; Qian, X.; Li, F.; Yang, M. Prediction of size-fractionated airborne particle-bound metals using MLR, BP-ANN and SVM analyses. Chemosphere 2017, 180, 513–522. [Google Scholar] [CrossRef]
  63. Tepanosyan, G.; Sahakyan, L.; Maghakyan, N.; Saghatelyan, A. Combination of compositional data analysis and machine learning approaches to identify sources and geochemical associations of potentially toxic elements in soil and assess the associated human health risk in a mining city. Environ. Pollut. 2020, 261, 114210. [Google Scholar] [CrossRef] [PubMed]
  64. Normile, H.J.; Papelis, C.; Kibbey, T.C.G. Remobilization Dynamics of Caffeine, Ciprofloxacin, and Propranolol following Evaporation-Induced Immobilization in Porous Media. Environ. Sci. Technol. 2017, 51, 6082–6089. [Google Scholar] [CrossRef]
  65. James, G.; Witten, D.; Hastie, T.; Tibshirani, R. An Introduction to Statistical Learning; Springer: New York, NY, USA, 2013; Volume 112. [Google Scholar]
  66. Clark, L.A.; Pregibon, D. Tree-based models. In Statistical Models in S; Routledge: Abington, UK, 2017. [Google Scholar]
  67. Freund, Y.; Schapire, R.E. A desicion-theoretic generalization of on-line learning and an application to boosting. In Proceedings of the European Conference on Computational Learning Theory, Barcelona, Spain, 13–15 March 1995; pp. 23–37. [Google Scholar]
  68. Hu, W.; Hu, W.; Maybank, S. AdaBoost-Based Algorithm for Network Intrusion Detection. IEEE Trans. Syst. Man, Cybern. Part B 2008, 38, 577–583. [Google Scholar] [CrossRef]
  69. Drucker, H. Improving regressors using boosting techniques. In Proceedings of the 14th International Conference on Machine Learning, Nashville, TN, USA, 8–12 July 1997. [Google Scholar]
  70. Shrestha, D.L.; Solomatine, D.P. Experiments with AdaBoost.RT, an Improved Boosting Scheme for Regression. Neural Comput. 2006, 18, 1678–1710. [Google Scholar] [CrossRef] [PubMed]
  71. Friedman, J.H. Greedy function approximation: A gradient boosting machine. Ann. Stat. 2001, 29, 1189–1232. [Google Scholar] [CrossRef]
  72. Prokhorenkova, L.; Gusev, G.; Vorobev, A.; Dorogush, A.V.; Gulin, A. CatBoost: Unbiased Boosting with Categorical Features. Available online: https://github.com/catboost/catboost (accessed on 1 May 2022).
  73. Chen, T.; Guestrin, C. XGBoost: A Scalable Tree Boosting System. In KDD ’16: Proceedings of the 22nd ACM SIGKDD International Conference on Knowledge Discovery and Data Mining, San Francisco, CA, USA, 13–17 August 2016; Association for Computing Machinery: New York, NY, USA, 2016; pp. 785–794. [Google Scholar] [CrossRef]
  74. Ke, G.; Meng, Q.; Finley, T.; Wang, T.; Chen, W.; Ma, W.; Ye, Q.; Liu, T. LightGBM: A Highly Efficient Gradient Boosting Decision Tree. Available online: https://github.com/Microsoft/LightGBM (accessed on 5 May 2022).
  75. Holmes, A.B.; Gu, F.X. Emerging nanomaterials for the application of selenium removal for wastewater treatment. Environ. Sci. Nano 2016, 3, 982–996. [Google Scholar] [CrossRef]
  76. Xu, R.; Wang, Y.; Tiwari, D.; Wang, H. Effect of ionic strength on adsorption of As(III) and As(V) on variable charge soils. J. Environ. Sci. 2009, 21, 927–932. [Google Scholar] [CrossRef]
  77. Selambakkannu, S.; Othman, N.A.F.; Abu Bakar, K.; Karim, Z.A. Adsorption studies of packed bed column for the removal of dyes using amine functionalized radiation induced grafted fiber. SN Appl. Sci. 2019, 1, 175. [Google Scholar] [CrossRef]
  78. Rožić, M.; Cerjan-Stefanović, Š.; Ćurković, L. Evaluation of Croatian Clinoptiloliteand Montmorillonite-rich tuffs for ammonium removal. Croatica Chem. Acta 2002, 75, 255–269. [Google Scholar]
  79. Huang, G.; Wu, L.; Ma, X.; Zhang, W.; Fan, J.; Yu, X.; Zeng, W.; Zhou, H. Evaluation of CatBoost method for prediction of reference evapotranspiration in humid regions. J. Hydrol. 2019, 574, 1029–1041. [Google Scholar] [CrossRef]
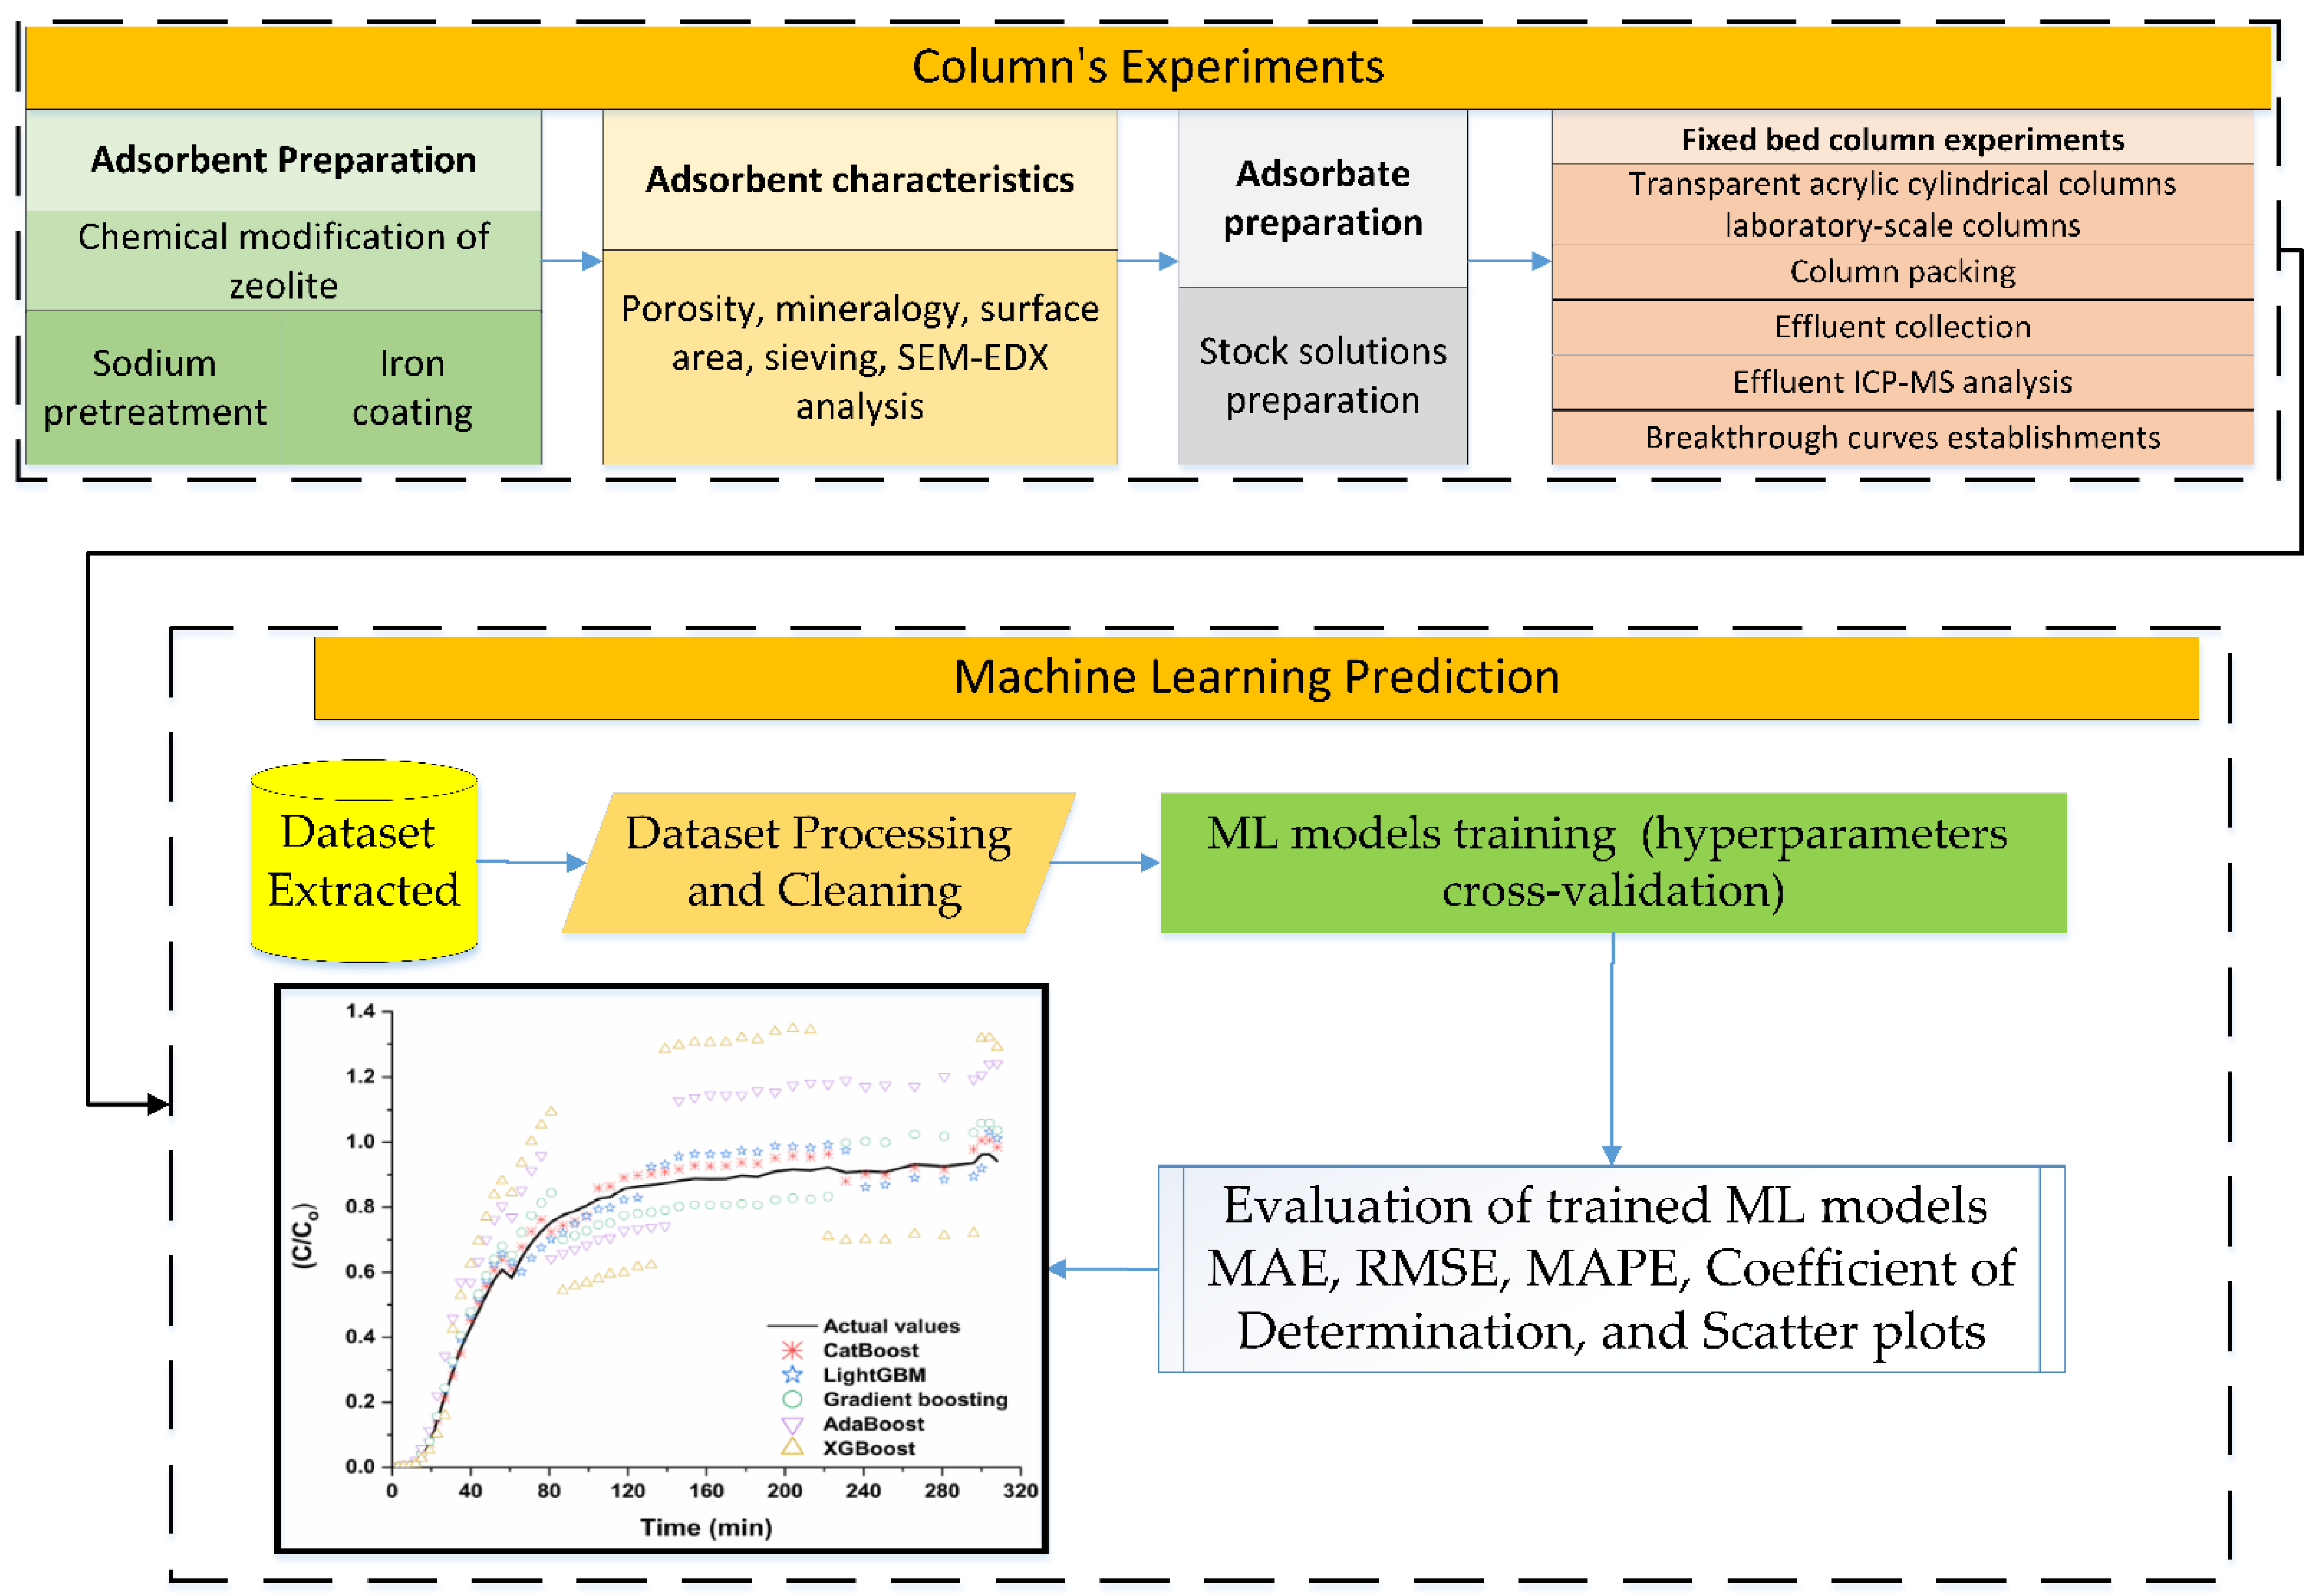
Figure 1. Methodology flowchart.
Water 14 02519 g001
Figure 2. Five-fold cross-validation process presentation.
Water 14 02519 g002
Figure 3. Schematic diagram of the fixed-bed adsorption column.
Water 14 02519 g003
Figure 4. Heated Correlation plot.
Water 14 02519 g004
Figure 5. Selenite breakthrough curves at 0.01 ionic strength at two selenite initial concentrations.
Water 14 02519 g005
Figure 6. Selenite breakthrough curves for 10−4 M initial concentration at two ionic strengths values.
Water 14 02519 g006
Figure 7. Presentation of the regression diagnostics. Residuals vs. Fitted values (a), Normal Q-Q, (b), Scale—Location (c), and Residuals vs. Leverage (d).
Water 14 02519 g007
Figure 8. Normal distribution of residual value.
Water 14 02519 g008
Figure 9. CatBoost Mechanism.
Water 14 02519 g009
Figure 10. Presentation of the actual values of ( C / C o ) versus the predicted values at 10−4 initial concentration and 0.01 ionic strength.
Water 14 02519 g010
Figure 11. Feature importance plot.
Water 14 02519 g011
Table 1. Descriptive statistics analysis of the dataset.
Random samples of SADFeatures
Concentration (M)Ionic Strength (M) Time (min) C/Co
10−50.0130.004974
10−50.0160.036074
10−50.0190.040607
10−51590.125845
10−51630.197145
10−51670.220659
10−40.013000.962113
10−40.013040.962832
10−40.013080.942469
10−411290.774688
10−411360.77704
10−411430.788269
⋮ ⋮ ⋮ ⋮⋮ ⋮ ⋮ ⋮⋮ ⋮ ⋮ ⋮⋮ ⋮ ⋮ ⋮
Mean0.00005450.4951140.499
Median0.000010.01980.532
Minimum0.000010.0130.002
Maximum0.000113480.962
Table 2. Elemental analysis of zeolite before and after modification.
ElementWeight %
Natural ZeoliteModified Zeolite
O67.5751.98
Mg0.420.48
Al4.364.99
Si17.6925.92
K1.340.39
Na0.531.18
Ca2.711.17
Fe0.548.04
Others4.845.85
Table 3. Performance comparison of the ML models.
Performance MetricsPrediction Models
AdaBoostGradient BoostingXGBoostLightGBMCatBoost
R263.78%97.97%43.27%99.00%99.57%
MAE0.150.030.190.020.015
MAPE0.800.121.460.140.06
RMSE0.160.040.220.030.02
Publisher’s Note: MDPI stays neutral with regard to jurisdictional claims in published maps and institutional affiliations.