Article

The Variations and Influences of the Channel Centerline of the Zhenjiang-Yangzhou Reach of the Yangtze River Based on Archival and Contemporary Data Sets

1
School of Geographic & Oceanographic Sciences, Nanjing University, Nanjing 210037, China
2
School of Environmental Science, Nanjing Xiaozhuang University, Nanjing 211171, China
3
College of Geography and Planning, Nanning Normal University, Nanning 530001, China
4
School of Economics, Nanjing University of Finance and Economics, Nanjing 210003, China
*
Author to whom correspondence should be addressed.
Water 2022, 14(16), 2478; https://doi.org/10.3390/w14162478
Submission received: 2 June 2022 / Revised: 4 August 2022 / Accepted: 6 August 2022 / Published: 11 August 2022
(This article belongs to the Topic Advanced Oxidation Process: Applications and Prospects)

Abstract

:
The Zhenjiang-Yangzhou reach of the Yangtze River is located at the top of the Yangtze River Delta, which is one of the most dramatic changes in the lower reaches of the Yangtze River. The study on the migration characteristics of the channel centerline is crucial for a comprehensive understanding of the river channel changes in the Zhenjiang-Yangzhou reach. In this study, a detailed calculation method is proposed to extract the channel centerline of the Zhenjiang-Yangzhou reach by using old maps and remote sensing satellite map and decompose it into seven parts. The spatial and temporal changes of Net Shift Distance (NSD), Cumulative Moving Distance (CMD), Migration Rate of Channel Centerline (MRCC) and Linear Regression Change Rate of channel centerline (LRCR) from 1865 to 2019 on the cross-section scale are studied. The results show that: (1) from 1868 to 2019, the channel centerline of the Zhenjiang-Yangzhou reach kept shifting. The average net displacement distance of the section is 1103.47 m on the right bank, and the average cumulative displacement distance of the section is 2790.51 m. (2) According to the NSD and CMD data of each part, the long-term movement direction of the channel centerline is basically the same, and a small part of the channel centerline has periodic reverse swing. The probability of channel centerline moving right is about twice that of moving left. At the same time, some rivers have high erosion risk. (3) Through MRCC and LRCR data, the total number of channel centerline moving left and right is 156 and 329, respectively, and the erosion risk level of the near half of the shoreline is high. (4) The change of river boundary conditions and hydrodynamic force will affect the migration rate and direction of channel centerline. (5) This study proposes a method to extract channel centerline from a braided reach and study its changes, which can be applied to other similar reaches with a long history of human activities and high density. The results enrich people’s understanding of the long-term changes of a braided reach in the lower reaches of the Yangtze River and have certain guiding significance for river regulation, navigation safety, and revetment construction.

1. Introduction

River systems collect, transport, and distribute water, sediment, and biomass in basins, thereby tightly linking processes at multiple time scales, such as the hydrological cycle, landscape changes, and ecological evolution. Water bodies interact with the atmosphere, vegetation, environment, and landforms and play an important role in regional economic and environmental sustainability, drinking water safety, and ecological security [1,2,3]. River channel change can be very sensitive to environmental change and human activities, and it has been one of the main research topics in fluvial geomorphology [4].
There are many braided reaches in the middle and lower Yangtze River in China. These reaches have a number of central bars or islands, which lead to multiple channels at low flows, and such a planform geometry usually results in frequent lateral channel shifting [5]. These fluvial processes of braided reaches can cause unfavorable effects such as inducing the collapse of floodplain banks and threatening the safety of levees. Therefore, channel migration processes in braided rivers have aroused major concern in the study of river dynamics and geomorphology [6].
Multitemporal analyses of river course changes over long time are of crucial importance [7]. For example, the analysis of changes in water channel and floodplain of the lower Yuba River in California, USA, was performed over a period of 100 years. This study was mostly based on photogrammetric data and old maps, including a comparison of a digital elevation model (DEM) and planimetric change analysis [8]. A similar study was performed for the Basento River in Southern Italy. The researchers managed to carry out an analysis of the channel changes over 150 years [9]. Another research using different data sources concerns the Calore River in Northern Italy and change detection of its course since 1870. The data were processed using advanced GIS methods [10].
Remote sensing technology, as a multi-temporal, multi-spectral, low-cost, and high-resolution information source, has been widely used to study channel morphological changes in alluvial rivers, and specific methods or software have been developed to quantify channel characteristics [11,12]. It is theoretically possible to define the boundary of an extracted water surface area as the river bankline and then extract the channel centerline. However, the extracted water boundary is very sensitive to the water level changes in the same period, and the channel changes obtained from satellite images may be different when the water levels are in different value ranges. Low water levels may lead to substantial exposure of the riverbed, which will lead to errors in the extracted channels compared to those at high water levels [13]. Only satellite images with the lowest possible water level differences can be selected to reduce errors [14].
However, previous studies on channel evolution of braided rivers have generally focused on the study of inflow-sediment changes, channel deposition and degradation, and adjustments to cross-sectional geometry [15,16,17]. River channel migration plays a crucial role in the morphological changes of braided rivers, which usually include various lateral shifts of shoreline, water depth, main line, and channel centerline [18,19]. Several data sources from historical maps, cross-sectional topography, and remote sensing imagery can be used to determine these changes [20,21,22].
The Zhenjiang-Yangzhou reach is one of the most rapidly evolving braided reaches in the lower Yangtze River. Based on the measured hydrology and topographical data, extensive researches have been conducted on the evolution of the river, its influencing factors, and channel conditions [23,24,25,26,27]. Numerous studies have shown that the Zhenjiang-Yangzhou reach of the Yangtze River has undergone significant channel changes in the past century, including the continuous lateral movement of the channel centerline as well as the scouring and silting of the river banks. Therefore, to determine the temporal and spatial variation of the migration direction and rate of the channel centerline is helpful for a comprehensive understanding of the characteristics of the river process of the Zhenjiang-Yangzhou reach of the Yangtze River. Nowadays, with the popularization of aerial laser radar scanning technology and UAV aerial photography technology, the acquisition of high-quality river change data has become very simple, and the scanning resolution of the above method is also suitable for most software processing. Unfortunately, due to the slow speed of river change, short-term aerial data cannot provide enough information about river change. This means that in most cases, using one data source alone cannot obtain long-term river channel change data, and multi-source data are needed for research. However, remote sensing data and historical maps are not compatible in form, resolution, coordinate system, projection, and accuracy. Therefore, it is necessary to establish a more reliable semi-automatic program to standardize the two data sources. Based on the unified standard and process, the channel centerline in the historical maps and remote sensing satellite map was extracted, and the correlation analysis was completed.
In this study, we employed multi-source data fusion methods at different scales to study the spatiotemporal changes of the Net Shift Distance, Cumulative Moving Distance, Migration Rate of Channel Centerline, and Linear Regression Change Rate of the channel centerline from 1865 to 2019. The multi-source data include old maps and satellite imagery. The main objectives of the current study are to: (1) propose a detailed computational procedure to extract the channel centerline from old maps and satellite images and set the baseline and cross-section; (2) calculate the temporal and spatial changes of the channel centerline’s shift distance, Cumulative Moving Distance, Migration Rate of Channel Centerline, and Linear Regression Change Rate on the cross-sectional scale to judge the risk of river bank erosion; and (3) analyze the key factors affecting the lateral movement of channel centerline and discuss the influence of river boundary conditions, hydrological conditions, human activities, and other factors on the lateral movement of channel centerline.

2. Materials and Methods

2.1. Study Area

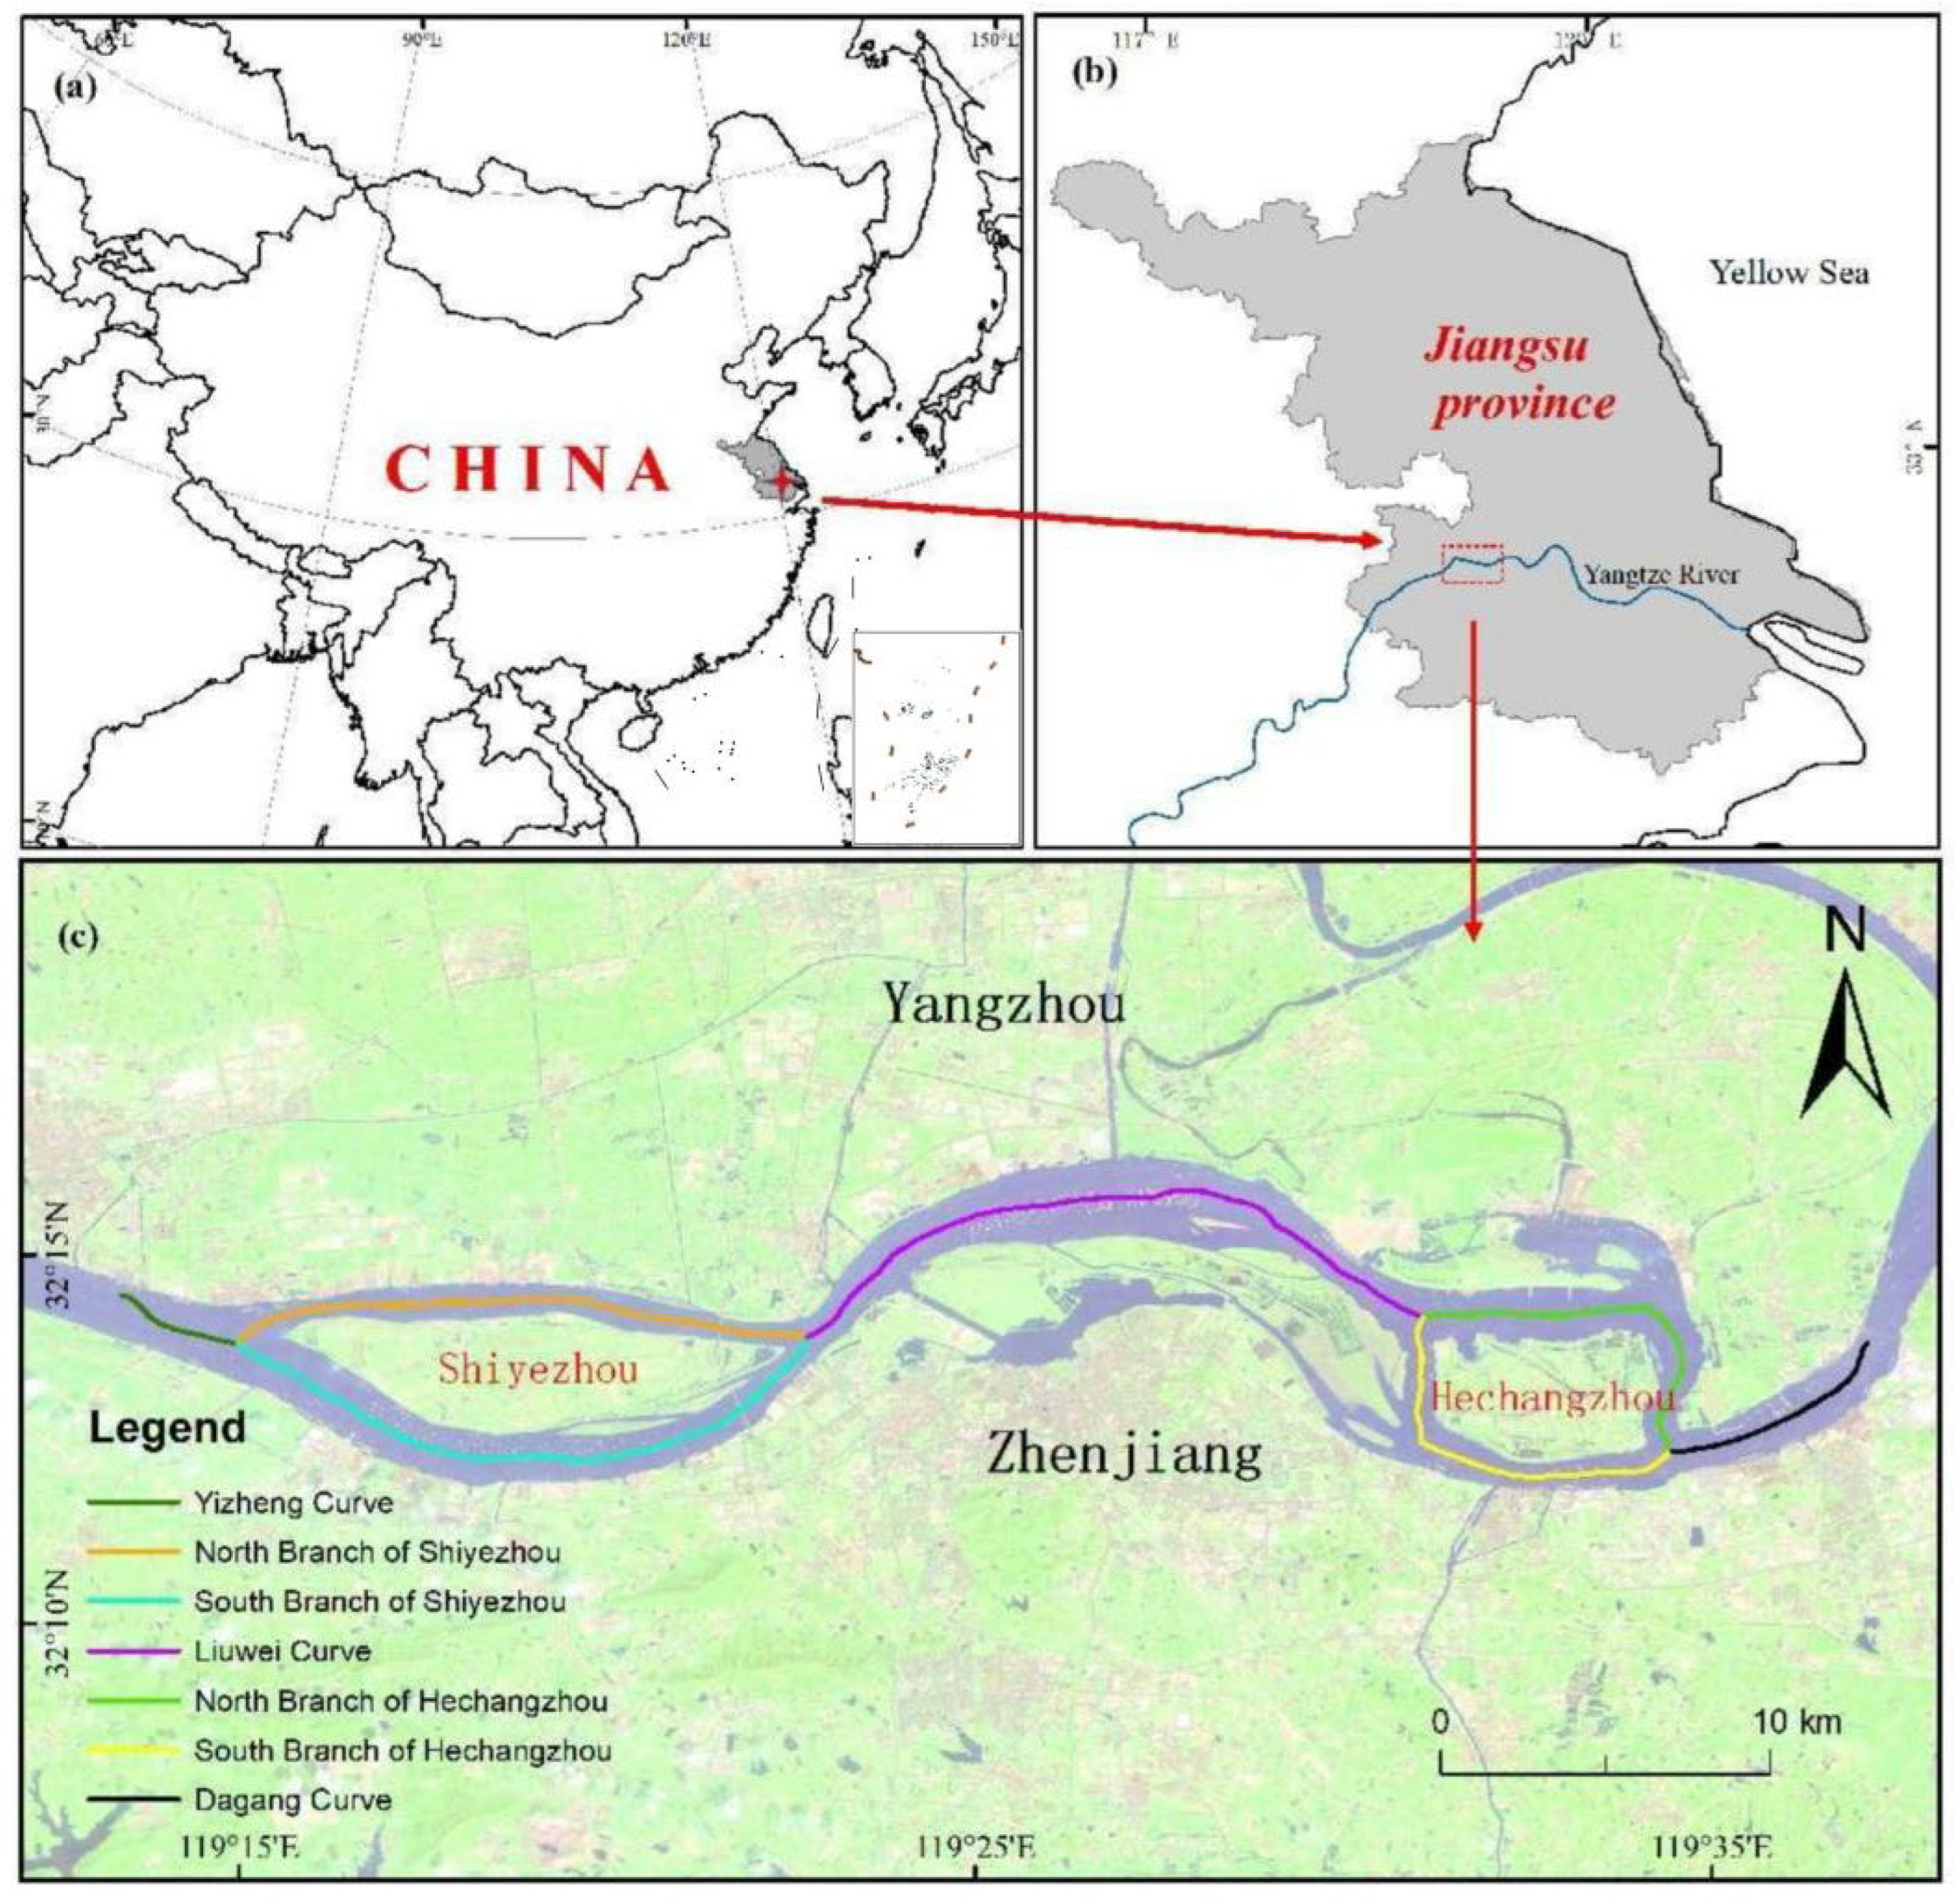
The Zhenjiang-Yangzhou reach of the Yangtze River is located at the apex of the Yangtze River Delta, starting from Yizheng at the upstream to Sanjiangying at the downstream, of which the total length is 73.7 km [28]. This reach has a large range of changes and a complex evolution process (Figure 1) [29]. The north bank of Zhenjiang-Yangzhou reach is a vast delta alluvial plain, the south bank is close to the northern foot of the Nanjing-Zhenjiang mountain, and the Xiashu loess terrace was formed in the late Pleistocene, downstream of Zhenjiang Port; the river arm of bascule bridge bluff invades the river and controls the development of the river.
Affected by Yellow River flood over Huaihe River from 1570, the lower reaches of Huaihe River gradually evolved from flowing eastward into the sea to flowing southward into the Yangtze River, becoming a tributary of the Yangtze River. Since then, the water inflow of the Huaihe River has gradually increased, reaching the maximum after the main stream of the lower reaches of the Huaihe River was diverted into the river in 1851. This change adds a new variable to the evolution of the river geomorphology of the Yangtze River and changes the original channel characteristics and flow structure of the Zhenjiang-Yangzhou reach of the Yangtze River. Beach scouring and silting and riverbank advancing and retreating also change greatly.
The total length of the Zhenjiang-Yangzhou reach is 73.3 km, consisting of Yizheng Curve, Shiyezhou Curve, Liuliu Curve, Hechangzhou Inlet, and Dagang Curve [30,31]. The reach plane form of Zhenjiang-Yangzhou is complex, with both branching sections and bending sections. The river course changes rapidly, and the regulation is difficult [32].

2.2. Data Source

2.2.1. Old Maps

Old maps presenting the Zhenjiang-Yangzhou reach of the Yangtze River valley were not a frequent subject of research. Old maps that were considered potentially useful include: (1) The sandbar merging north bank on the Jiangsu Province Atlas, compiled in 1868, was collected in the Library of Fudan University (No. 001126209), which recorded in detail the river course and sandbar of the Yangtze River in Zhenyang section. Combined with the historical data of Yangzhou City—“Jiangdu County Annals” and the data of The Harvard University Library in the United States does not publish the historical data of the old customs of China (1860–1949)”, published by historian Wu Songdi in 2014. It can basically restore the change of the reach channel of the Zhenjiang-Yangzhou in the 1960s [33,34]. (2) In 1931, the Land Survey Bureau of the Ministry of Staff of the National Government completed the topographic map drawing of Jiangsu Province and sorted out the military topographic maps of various scales in Jiangsu Province. The relevant military topographic maps were collected and collated by the Department of Regional Affairs of the Ministry of Internal Affairs of the National Government. The relevant military topographic maps can be obtained online through the Institute of Modern History of the Central Academy in Taipei City, Taiwan Province, China [35]. The topographic map can be used as the basic data of the river morphology of the Zhenjiang-Yangzhou reach of the Yangtze River in the 1930s. (3) In 1953, the Cartographic Bureau of the United States Army Agency drew detailed topographic maps of the surrounding areas of Nanjing, Jiangsu Province, based on aerial imagery accumulated during the Anti-Japanese War and other mapping data from the 1950s. The military topographic map was kept by the University of Texas Library after decryption. The river morphology of the Zhenjiang-Yangzhou reach of the Yangtze River reflected in the military topographic map can be used as the basic data for the river change study of the Zhenjiang-Yangzhou reach in the 1950s [36].

2.2.2. Remote Sensing Satellite Images

Remote sensing images are real-time, accurate, and intuitive and are often used to identify water-land boundaries [37]. In order to ensure the representativeness of the extraction results, the selected remote sensing satellite images should be clear, cloudless, and located at similar water levels. We selected two remote sensing satellite images, including (1) TM image of Landsat 5 satellite, taken on 18 October 1984, with a spatial resolution of 30 m, and (2) OLI image of Landsat 8 satellite, taken on 16 November 2019, with the same as the TM image. The geometric correction was conducted by image-to-image registration, with the image in 2019 as the reference of all other images. The root mean square errors of correction are all less than 30 m.

2.3. Research Method

2.3.1. Research Process

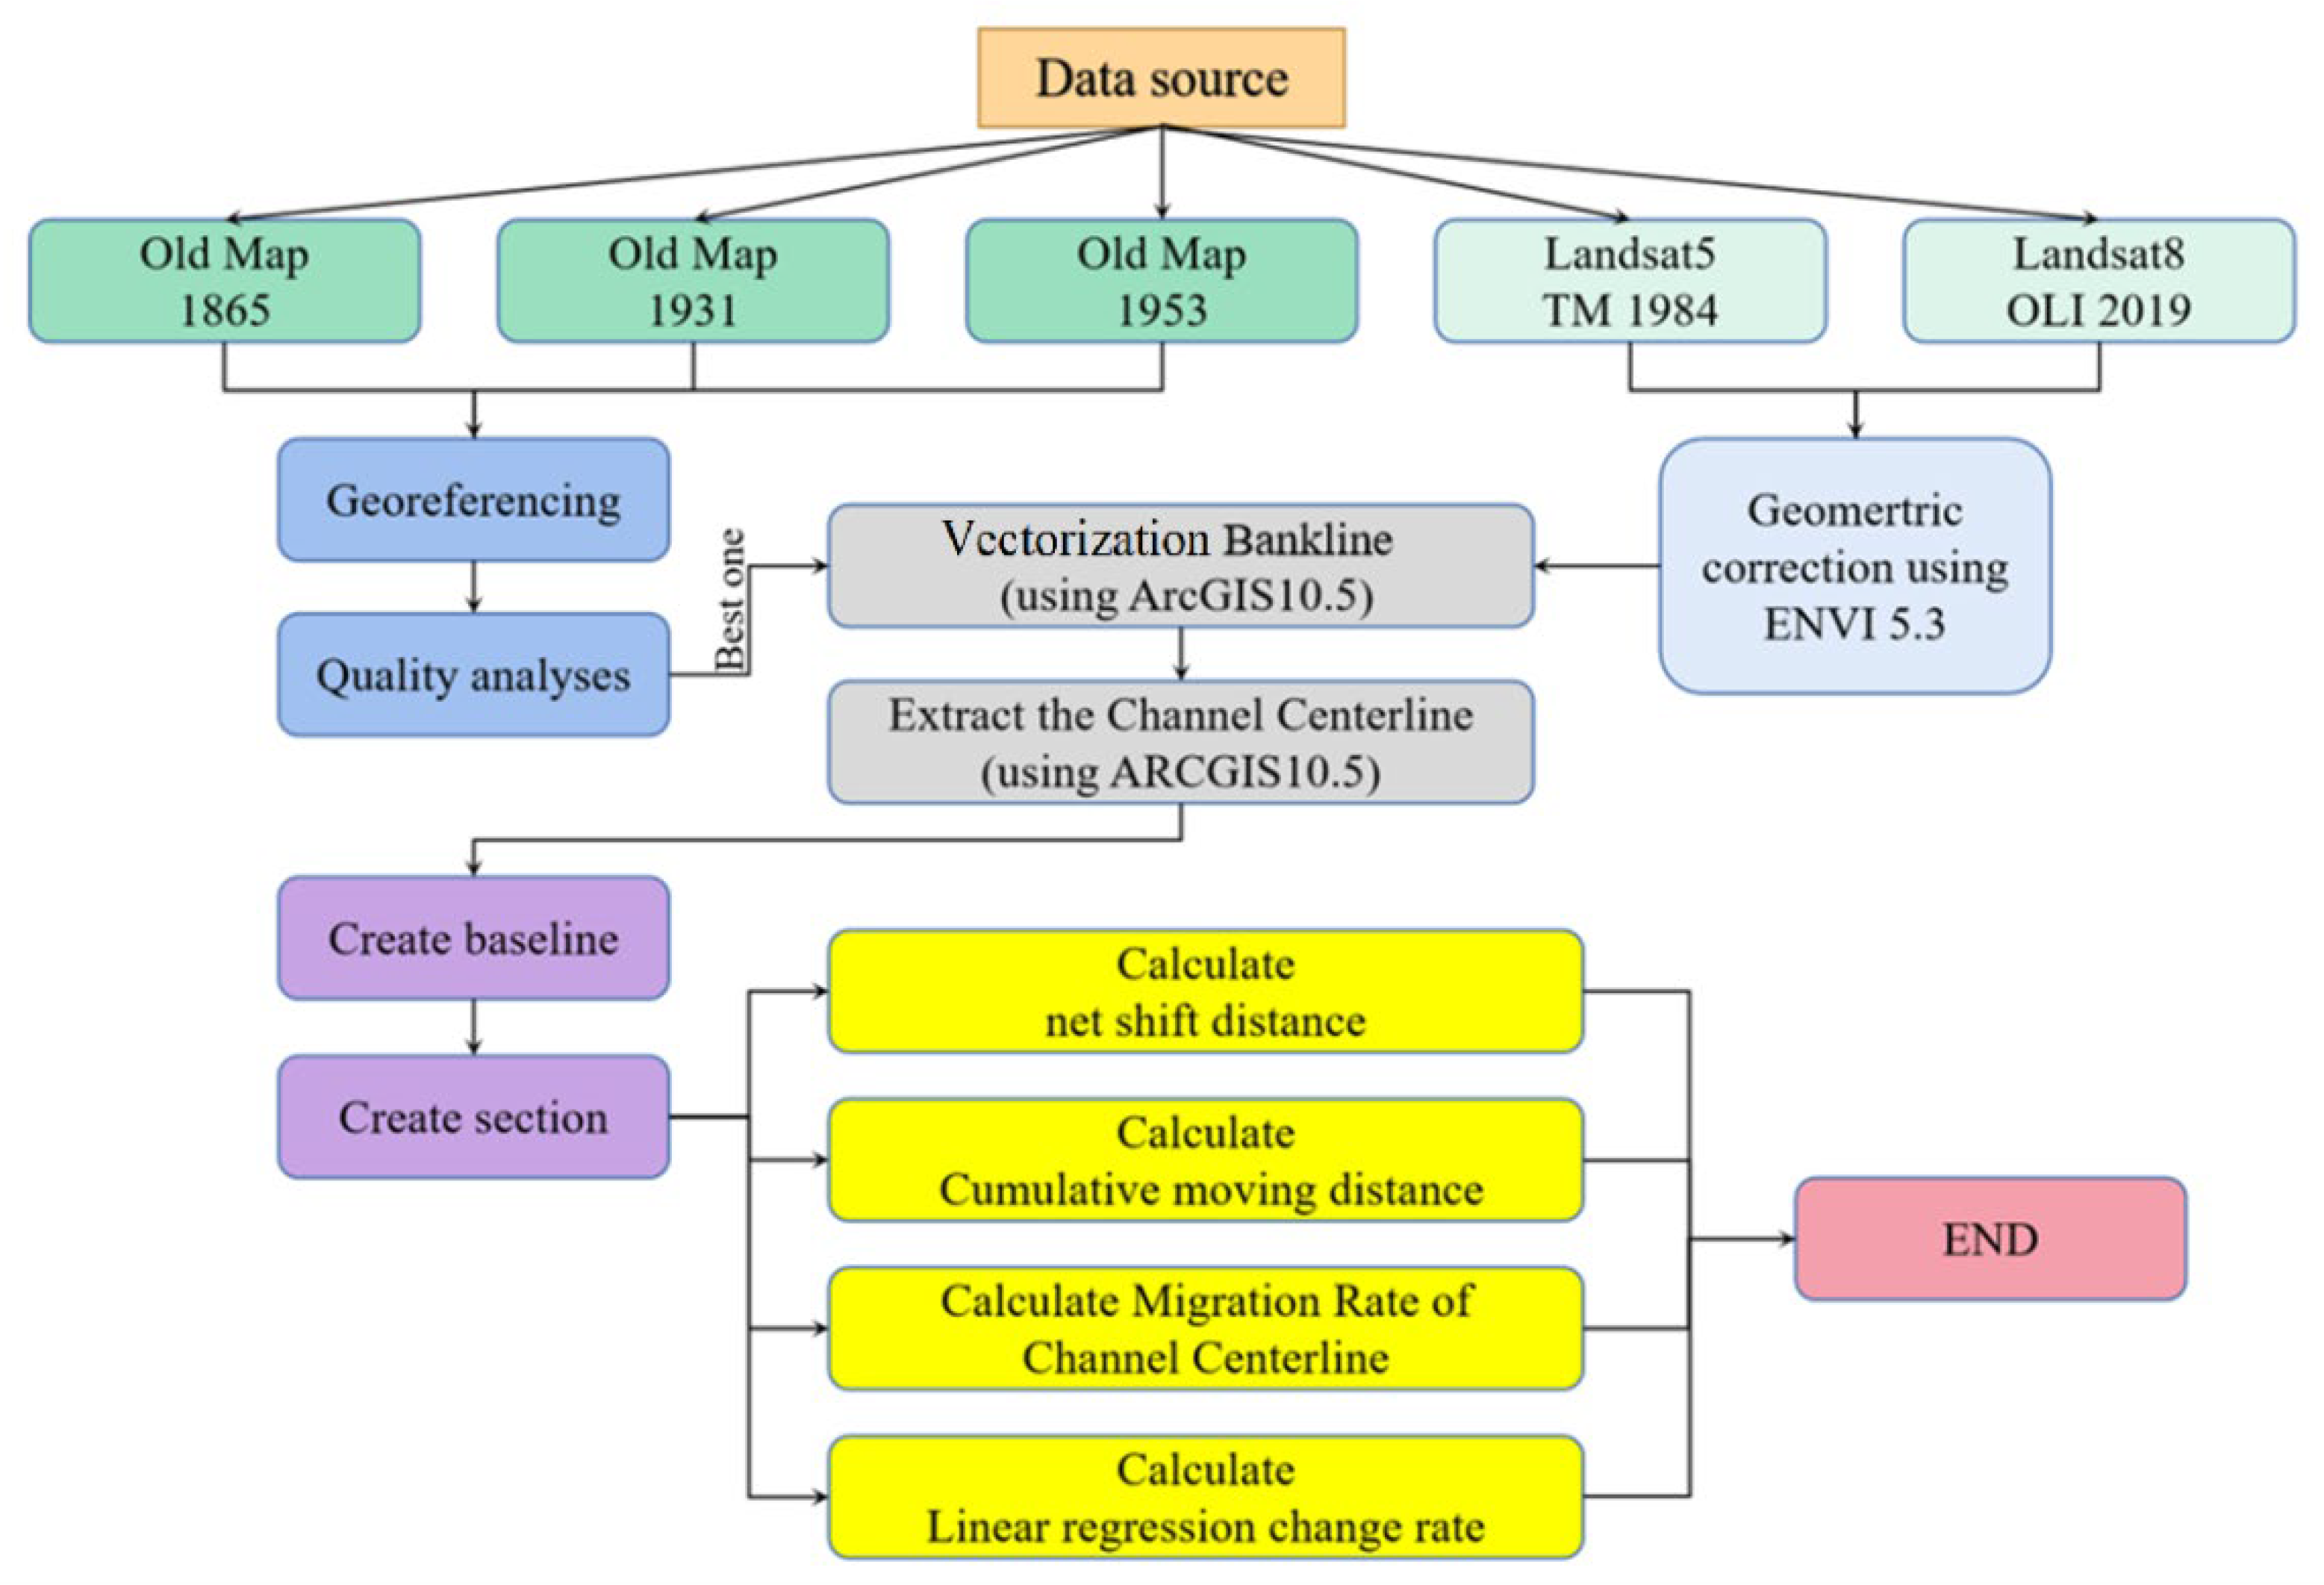
The following flowchart (Figure 2) represents the dataset and processing methods used in this study. In some cases, it shows the relationship between data sets, the channel Centerline extraction method, and how to use them in the channel centerline of the Zhenjiang-Yangzhou reach of the Yangtze River. According to the flow chart, we used Arcgis10.5 and ENVI5.3 software to process the data step by step: (1) Each old map collected was registered and geometrically corrected several times according to the standard map published locally, and the quality inspection was carried out. The results with the highest accuracy were output, and the shoreline was vectorized. At the same time, we manually extracted coastlines from each satellite map by visual interpretation. (2) We extracted the five different years of vectorized shoreline map summary, with automatic extraction of their channel centerline. (3) We created a baseline and created appropriate interval sections. (4) Each section intersects with channel centerline to form an intersection. We calculated NSD, CMD, MRCC, and LRCR according to the distance between the intersection and other intersections of the same section and the distance between the intersection and baseline.

2.3.2. Determination of Section

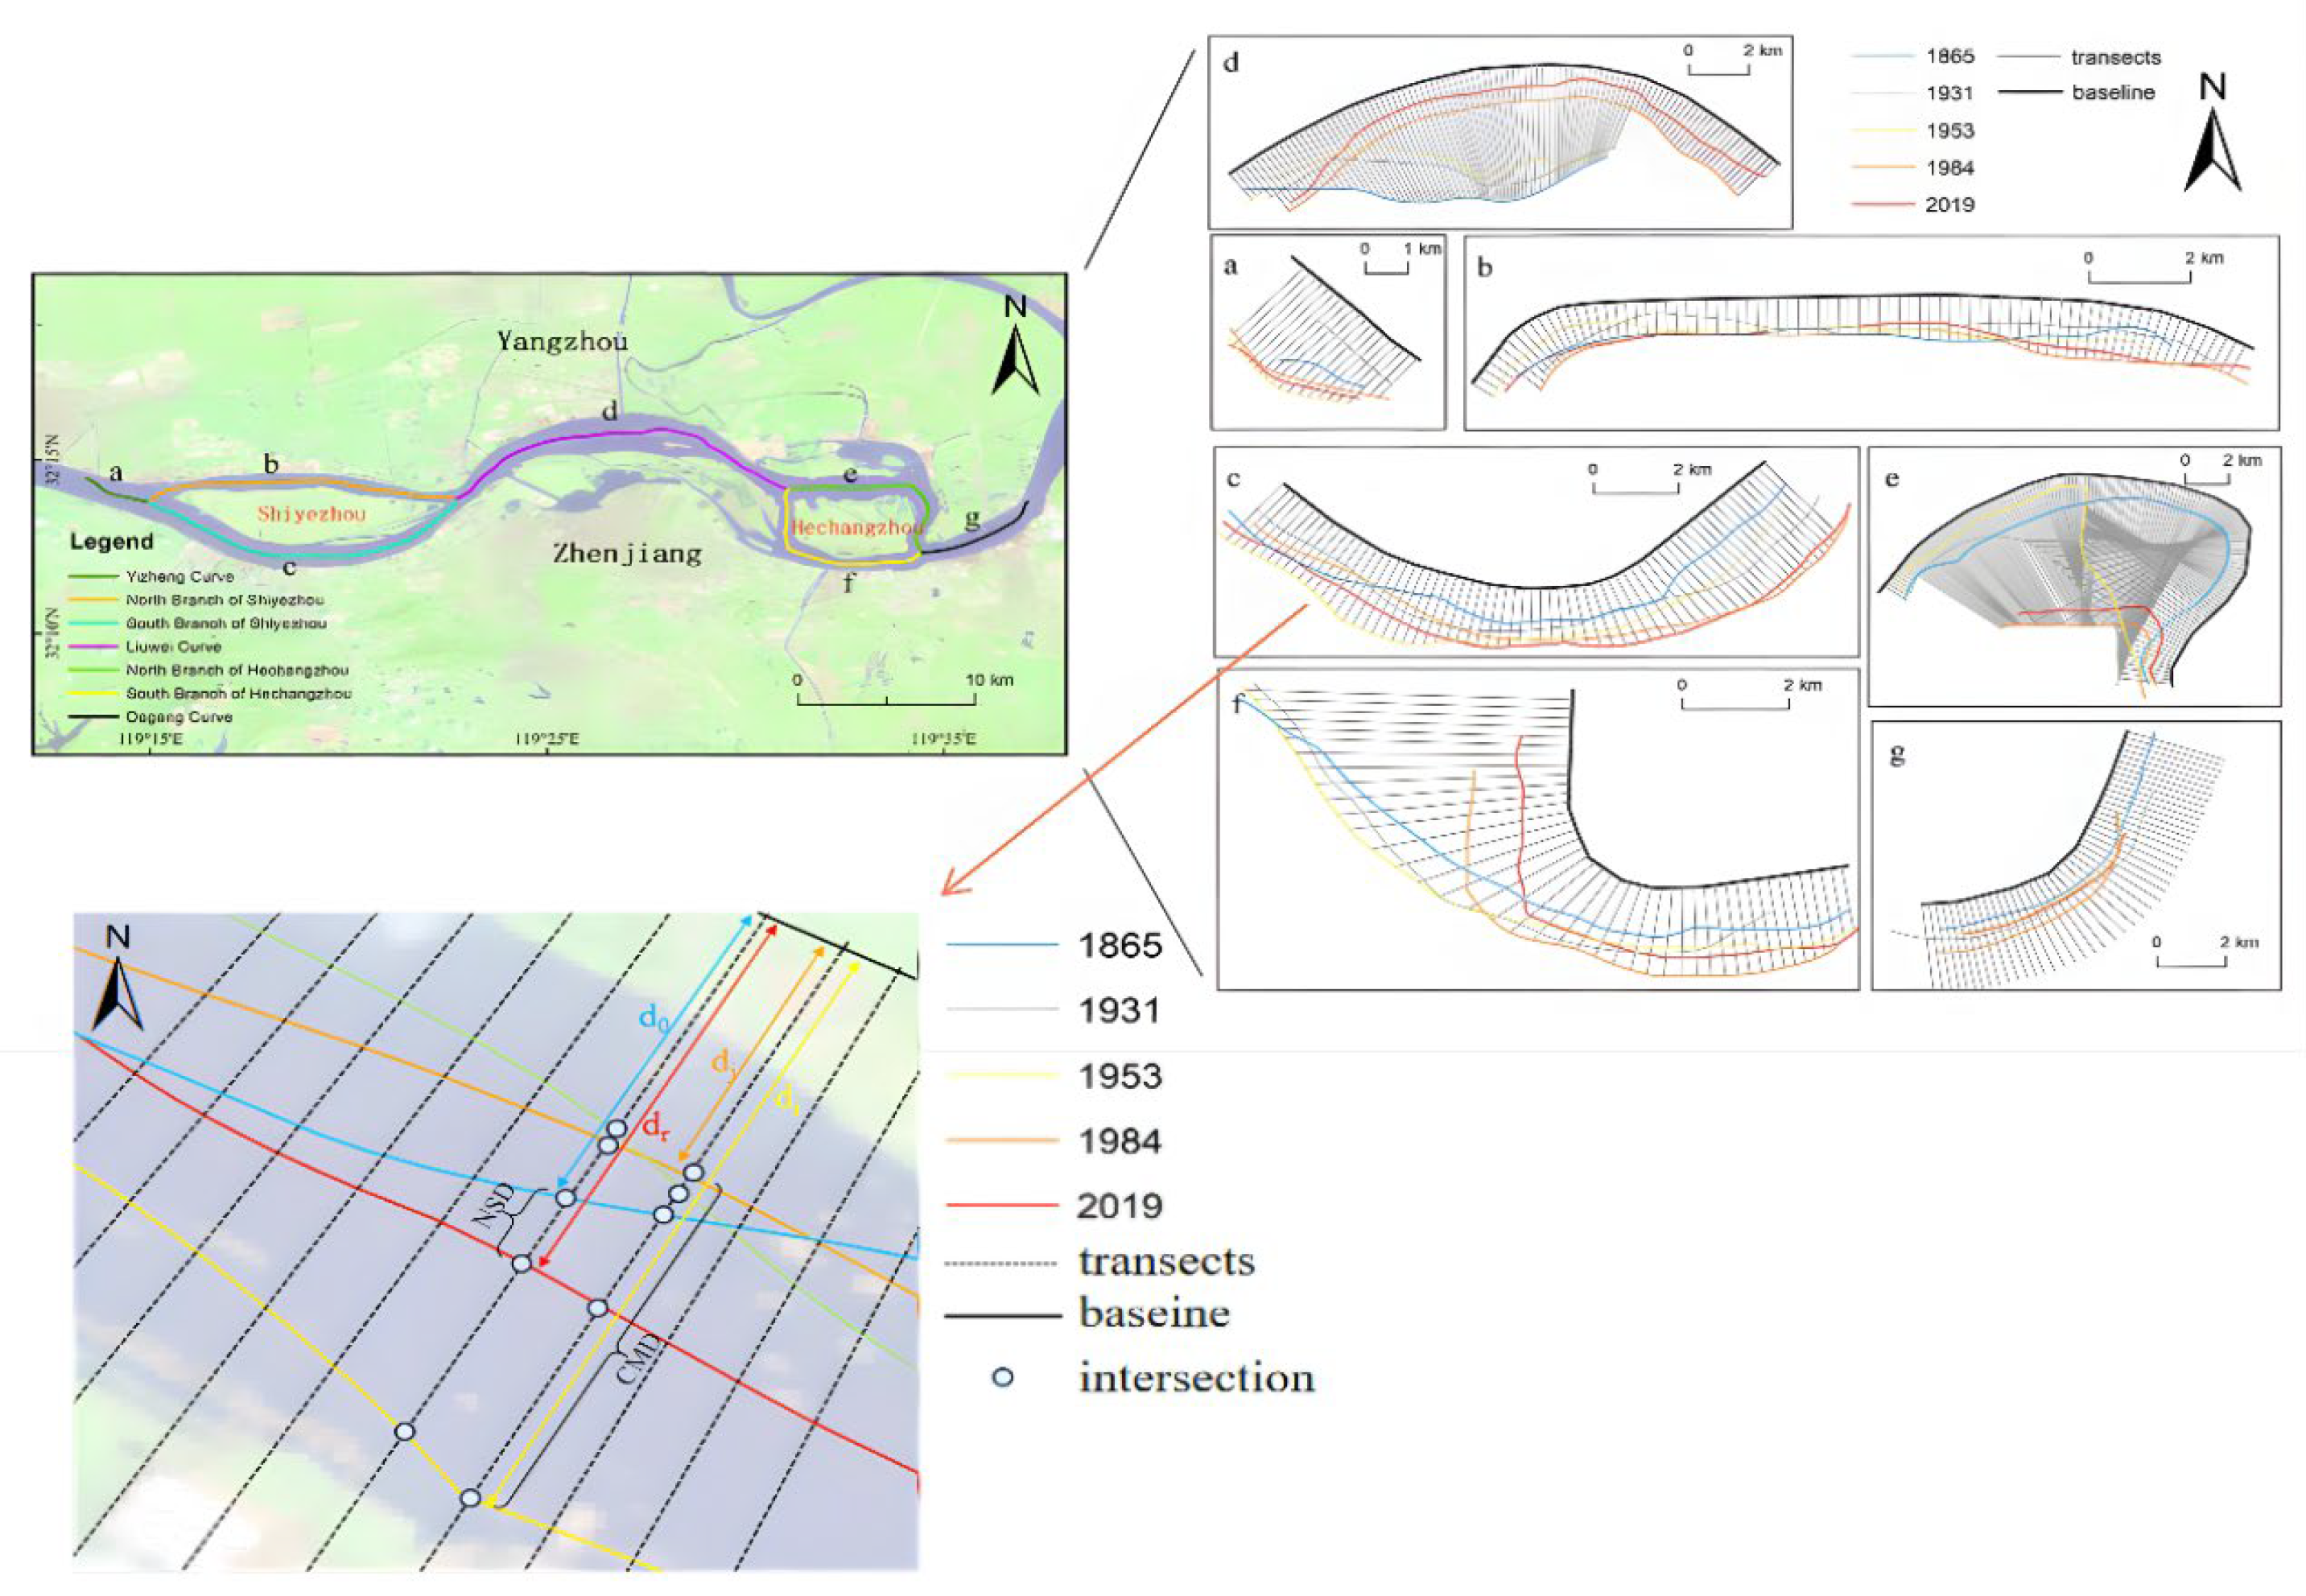
The channel centerline of the Zhenjiang-Yangzhou reach is divided into seven segments: Yizheng Curve, North Branch of Shiyezhou, South Branch of Shiyezhou, Six Curve, North Branch, of Hechangzhou, South Branch of Hechangzhou, and Dagang Curve (Figure 3). Then, we found the buffer that is closest to the channel centerline and created a baseline according to the buffer direction. Then, the cross-section was generated: the longest length of the cross section was set to 3500 m, and the sampling interval was set to 200 m. After smoothing, fitting, and adjustment, the cross-section was orthogonally projected from the baseline to the channel centerline in different years. A total of 510 equidistant vertical lines were generated, including 19 equidistant vertical lines in Yizheng Curve, 82 equidistant vertical lines in North Branch of Shiyezhou, 67 equidistant vertical lines in South Branch of Shiyezhou, and 103 equidistant vertical lines in Six Curve. In addition, the relevant parameters of this study are also shown in Figure 3.

2.3.3. Calculation of Net Shift Distance (NSD)

Net Shift Distance (NSD) is the distance between the channel centerline of the farthest and most recent years on each section. The NSD is expressed as follows:
N S D = d r d 0 ,
In this formula, dr is the distance from the intersection point of the channel centerline and the section line to the baseline in the recent year, and d0 is the distance from the intersection of the channel centerline and the section line to the baseline in the furthest year.

2.3.4. Calculation of Cumulative Moving Distance (CMD)

CMD is the distance between the channel centerline that is farthest from the baseline and the closest to the baseline on each section. CMD represents the sum of the motion distance of the channel centerline position in all phases, which is independent of time. The CMD is expressed as follows:
C M D = d j d i ,
In this formula, dj is the distance from the nearest intersection of the channel centerline and the section line to the baseline; di is the distance from the intersection of the channel centerline and the section line to the baseline.

2.3.5. Calculation of Migration Rate of Channel Centerline (MRCC)

MRCC refers to the change rate of the distance between the channel centerline in the furthest year and the nearest year on each section. The MRCC is expressed as follows:
M R C C ( i , j ) = d j d i Δ Y ( j , i ) ,
where i denotes the point where the channel centerline intersects the section line in the farthest year, and j denotes the point where the channel centerline intersects the section line in the recent year. MRCC(i,j) denotes the terminal rate of change from the channel centerline in the farthest year to the channel centerline in the latest year. di and dj represent the distance between the channel centerline and the baseline in the furthest year and the nearest year, respectively; ∆Y(j,i) represents the time interval between the nearest year and the farthest year.

2.3.6. Calculation of Linear Regression Change Rate (LRCR)

LRCR refers to the point where the cross-section line intersects the channel centerline by using the least square method, and finally, the change rate of the channel centerline is calculated. LRCR can fit the changes of the channel centerline in all years, which is simple in principle and easy to operate. The LRCR index is used in this study to calculate and analyze the multiple change rates the channel centerline over a long period of time. The LRCR is expressed as follows:
y = a + b x ,
a = i = 1 n ( x i x ¯ ) ( y i y ¯ ) ,
L R C R = y ¯ a x ¯ ,
Among them, y is a dependent variable for the spatial location of the channel centerline; x represents the independent variable of the year; a is the fitted constant intercept; LRCR is the regression slope, which represents the y change corresponding to each unit x change.

3. Results and Discussion

In this study, the above methods were employed to quantify the section- and reach-scale morphometric parameters, covering the Net Shift Distance, Cumulative Moving Distance, Migration Rate of Channel Centerline, and Linear Regression Change Rate in the channel centerline of the Zhenjiang-Yangzhou reach in 1865–2019.

3.1. The Net Shift Distance and Cumulative Moving Distance of the Channel Centerline on the Section Scale

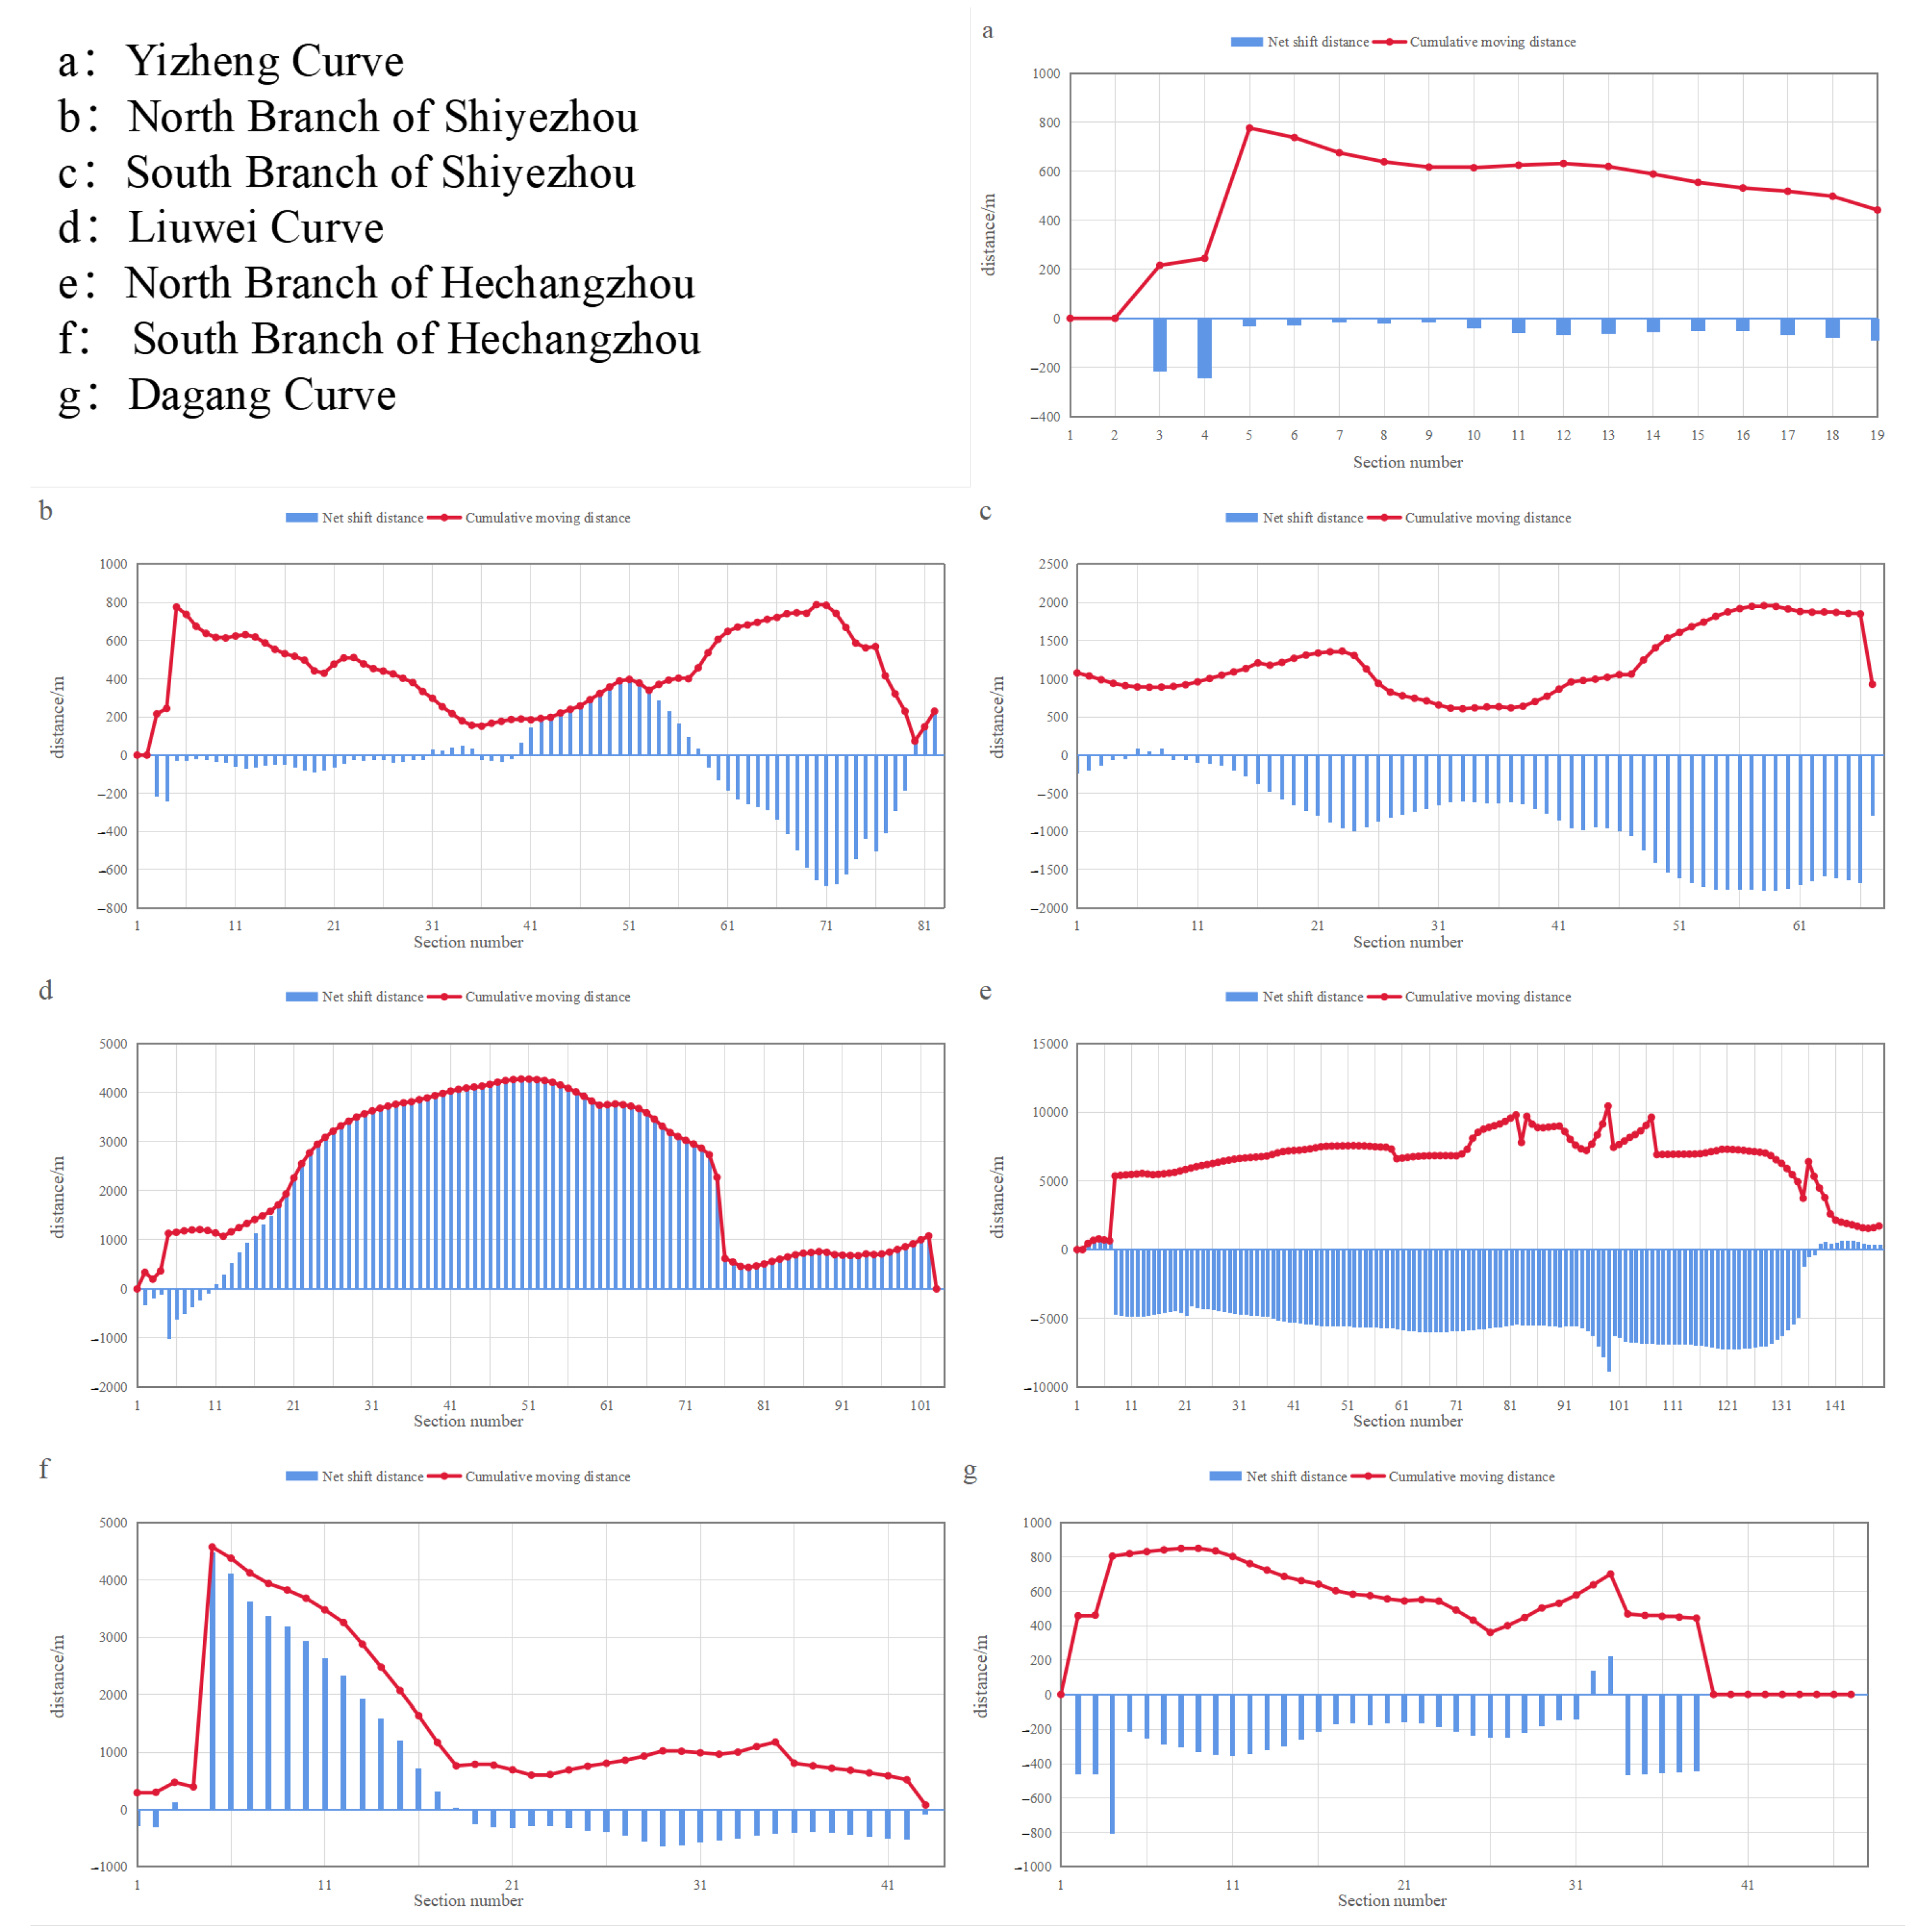
In the past 100 years, the channel centerline reached by Zhenjiang-Yangzhou has shown a trend of continuous swing on the whole (Figure 4). The average Net Shift Distance of the section is 1103.47 m for the right bank migration, and the average cumulative displacement distance of the section is 2790.51 m. The channel centerline has the largest net displacement distance of the channel curve, followed by the South Branch of Hechangzhou, North Branch of Shiyezhou, Yizheng Curve, and Curve, and South Branch of Hechangzhou, and the smallest is North Branch of Hechangzhou. The maximum Cumulative Moving Distance of the channel centerline is North Branch of Hechangzhou, followed by Six Curve, South Branch of Shiyezhou, South Branch of Hechangzhou, and North Branch of Shiyezhou.
Among them, for the channel centerline of Yizheng Curve during 1868–2019, the value of Net Shift Distance from upstream to downstream trend is high → low → medium, the average section of Net Shift Distance is right bank migration 302.01 m, the highest value appears in section 4, the right bank migration 650.63 m, and the lowest value appears in sections 1 and 2. The variation trend of Cumulative Moving Distance from upstream to downstream is low to high, with an average of 938.65 m. The highest value appeared in section 5, which was 1972.7 m, and the lowest value appeared in sections 1 and 2. Cumulative Moving Distance is much larger than Net Shift Distance, which indicates that Yizheng Curve has periodic reverse swing. The connection between Yizheng Curve and South Branch of Shiyezhou becomes the main channel in the upper reaches of the river, which receives the influence of the geostrophic bias force. The river continuously scours the right bank, resulting in the gradual movement of the channel center line to the right bank.
For the channel centerline of North Branch of Shiyezhou during 1868–2019, the value of Net Shift Distance from upstream to downstream changed from low to high. The average Net Shift Distance of the cross-section was 57.23 m, and the highest value appeared in section 71, which was right bank migration 683.79 m; the lowest value appeared in section 31, which was left bank migration, at 10.84 m. The change trend of Cumulative Moving Distance from upstream to downstream is high → low → high, with an average of 435.93 m. The highest value appears in section 4, which is 244.36 m, and the lowest value appears in section 1. The Cumulative Moving Distance of sections 1–14 is far greater than the Net Shift Distance, indicating that there is periodic reverse swing in this part of the river. The absolute value of Cumulative Moving Distance after section 41 is basically the same as that of Net Shift Distance, indicating that the long-term movement direction of this part of the river is basically the same. The right bank of North Branch of Shiyezhou was scoured, while the small sandbars in the area of Shiyezhou Sandbank continued to merge, resulting in an expanding area of Shiyezhou Sandbank and a dynamic balance on the right bank.
For the channel centerline of South Branch of Shiyezhou during 1868–2019, the value of Net Shift Distance from upstream to downstream changed from low to high. The average section Net Shift Distance was 869.04 m on the right bank. The highest value appeared in section 59, which was right bank migration, at 1777.36 m. The lowest value appeared in section 5, which was right bank migration, at 0.55 m. The change trend of Cumulative Moving Distance from upstream to downstream is high → low → high, with an average of 1186.31 m. The highest value appeared in section 59, which is 1958.07 m, and the lowest value appeared in section 33, at 606.65 m. Cumulative Moving Distance of sections 1–23 is greater than Net Shift Distance, indicating that there is periodic reverse swing in this part of the river. The absolute value of Cumulative Moving Distance after section 24 is basically the same as that of Net Shift Distance, indicating that the long-term movement direction of this part of the river is basically the same. At first, a large number of small sandbars were scattered in this area, which compressed the width of South Branch of Shiyezhou. Later, after the small sandbars were merged into Shiyezhou Sandbank, the river surface became wider.
For the channel centerline of Liuwei Curve during 1868–2019, the change trend of Net Shift Distance from upstream to downstream is low → high → low, and the average cross-section Net Shift Distance is left bank migration 2191.63 m. The highest value appears in section 51, which is 4273.94 m for left bank migration, and the lowest value appears in section 103. The variation trend of Cumulative Moving Distance from upstream to downstream is high → low → high, which is consistent with the variation trend of Net Shift Distance, with an average value of 2340.15 m. The maximum appears in section 59, which is 4273.94 m, and the minimum appears at section 103. The absolute values of Cumulative Moving Distance of most cross-sections are basically the same as those of Net Shift Distance, indicating that the long-term movement direction of boundary curve in each cross-section is basically the same. The reason for the dramatic change of the Six Curve is that the hydrodynamic force has changed greatly, resulting in the change of the top impact point, and the river changed from the initial concave bank to the convex bank.
For the channel centerline of North Branch of Hechangzhou during 1868–2019, the value of Net Shift Distance from upstream to downstream trend is low → high → low, the average section of Net Shift Distance is right bank migration at 4908.03 m, the highest value appears in section 59, and the right bank migration is 7851.58 m. The lowest value appears in section 2. The variation trend of Cumulative Moving Distance from upstream to downstream is low → high → low, which is consistent with the variation trend of Net Shift Distance, with an average value of 6465.19 m. The maximum appears at section 99, which is 9139.1 m, and the minimum appears at section 2. The absolute values of Cumulative Moving Distance of most sections are basically consistent with those of Net Shift Distance, indicating that the long-term movement direction of North Branch of Hechangzhou in each section is basically the same. Today’s Hechangzhou Sandbank area is much smaller than in 1868. At first, there was a huge and scattered small sandbank, and the northern bank of the merged Hechangzhou Sandbank gradually shrank southward.
For the channel centerline of South Branch of Hechangzhou during 1868–2019, the value of Net Shift Distance from upstream to downstream trend is low → high → low, the average section of Net Shift Distance is left bank migration 498.38 m, the highest value appears in section 5, and left bank migration is 4480.37 m. The lowest value appears in section 4, with left bank migration of 20.15 m. The trend of Cumulative Moving Distance from upstream to downstream is low → high → low, which is basically consistent with the trend of Net Shift Distance, and the average value is 1474.11 m. The maximum value appears in section 5, which is 4575.81 m, and the minimum value appears in section 43, which is 80.86 m. The absolute values of Cumulative Moving Distance of most sections are basically consistent with those of Net Shift Distance, indicating that the long-term movement direction of South Branch of Hechangzhou in each section is basically the same. During the long-term evolution of Hechangzhou Sandbank, the North Bank and West Bank are shrinking, resulting in a part of the channel centerline of South Branch of Hechangzhou moving to the left bank.
For the channel centerline of Dagang Curve during 1868–2019, the change trend of Net Shift Distance from upstream to downstream is high → low → high → low, and the average cross-section Net Shift Distance is right bank migration 212.48 m. The highest value appears in section 4, which is 805.25 m of right bank migration, and the lowest value appears in section 1 and sections 39–46. The change trend of Cumulative Moving Distance from upstream to downstream is low → high → low, with an average of 475.66 m. The highest value appeared in section 4, which is 805.25 m, the lowest value appeared in sections 1 and 9–46. The Cumulative Moving Distance of sections 5–33 is greater than Net Shift Distance, indicating that this part of the river has periodic reverse swing. The Cumulative Moving Distance of sections 1–4 and sections 34–36 are basically the same as the absolute value of Net Shift Distance, indicating that the long-term movement direction of this part of the river is basically the same. Compared with other reaches, the hydrodynamic force of the Dagang Curve has little change, mainly because the left bank has built many ports and a large number of berths extend into the main channel.

3.2. Analysis and Risk Recognition Based on the Central Line of MRCC and LRCR

In this study, the Migration Rate of Channel Centerline (MRCC) and Linear Regression Change Rate (LRCR) were employed to quantify the section- and reach-scale morphometric parameters. It includes the moving distance and direction of channel centerline on all sections. Based on the above data, we identified the risk of riverbank erosion (Figure 5, Figure 6, Figure 7, Figure 8, Figure 9, Figure 10 and Figure 11).
Studies have shown that the braided river channel has self-adjustment characteristics under basically unchanged climatic conditions and upstream water and sediment conditions. The probability of the channel centerline moving to the left bank should be roughly equal to that of moving to the right [38]. In this study, the total number of the channel centerline moving left and right in the Zhenjiang-Yangzhou reach of the Yangtze River is 156 and 329, respectively, indicating that the probability of the channel centerline moving right is about twice that of moving left. It shows that the upstream water and sediment conditions of the Zhenjiang-Yangzhou reach of the Yangtze River are unstable and vary greatly.
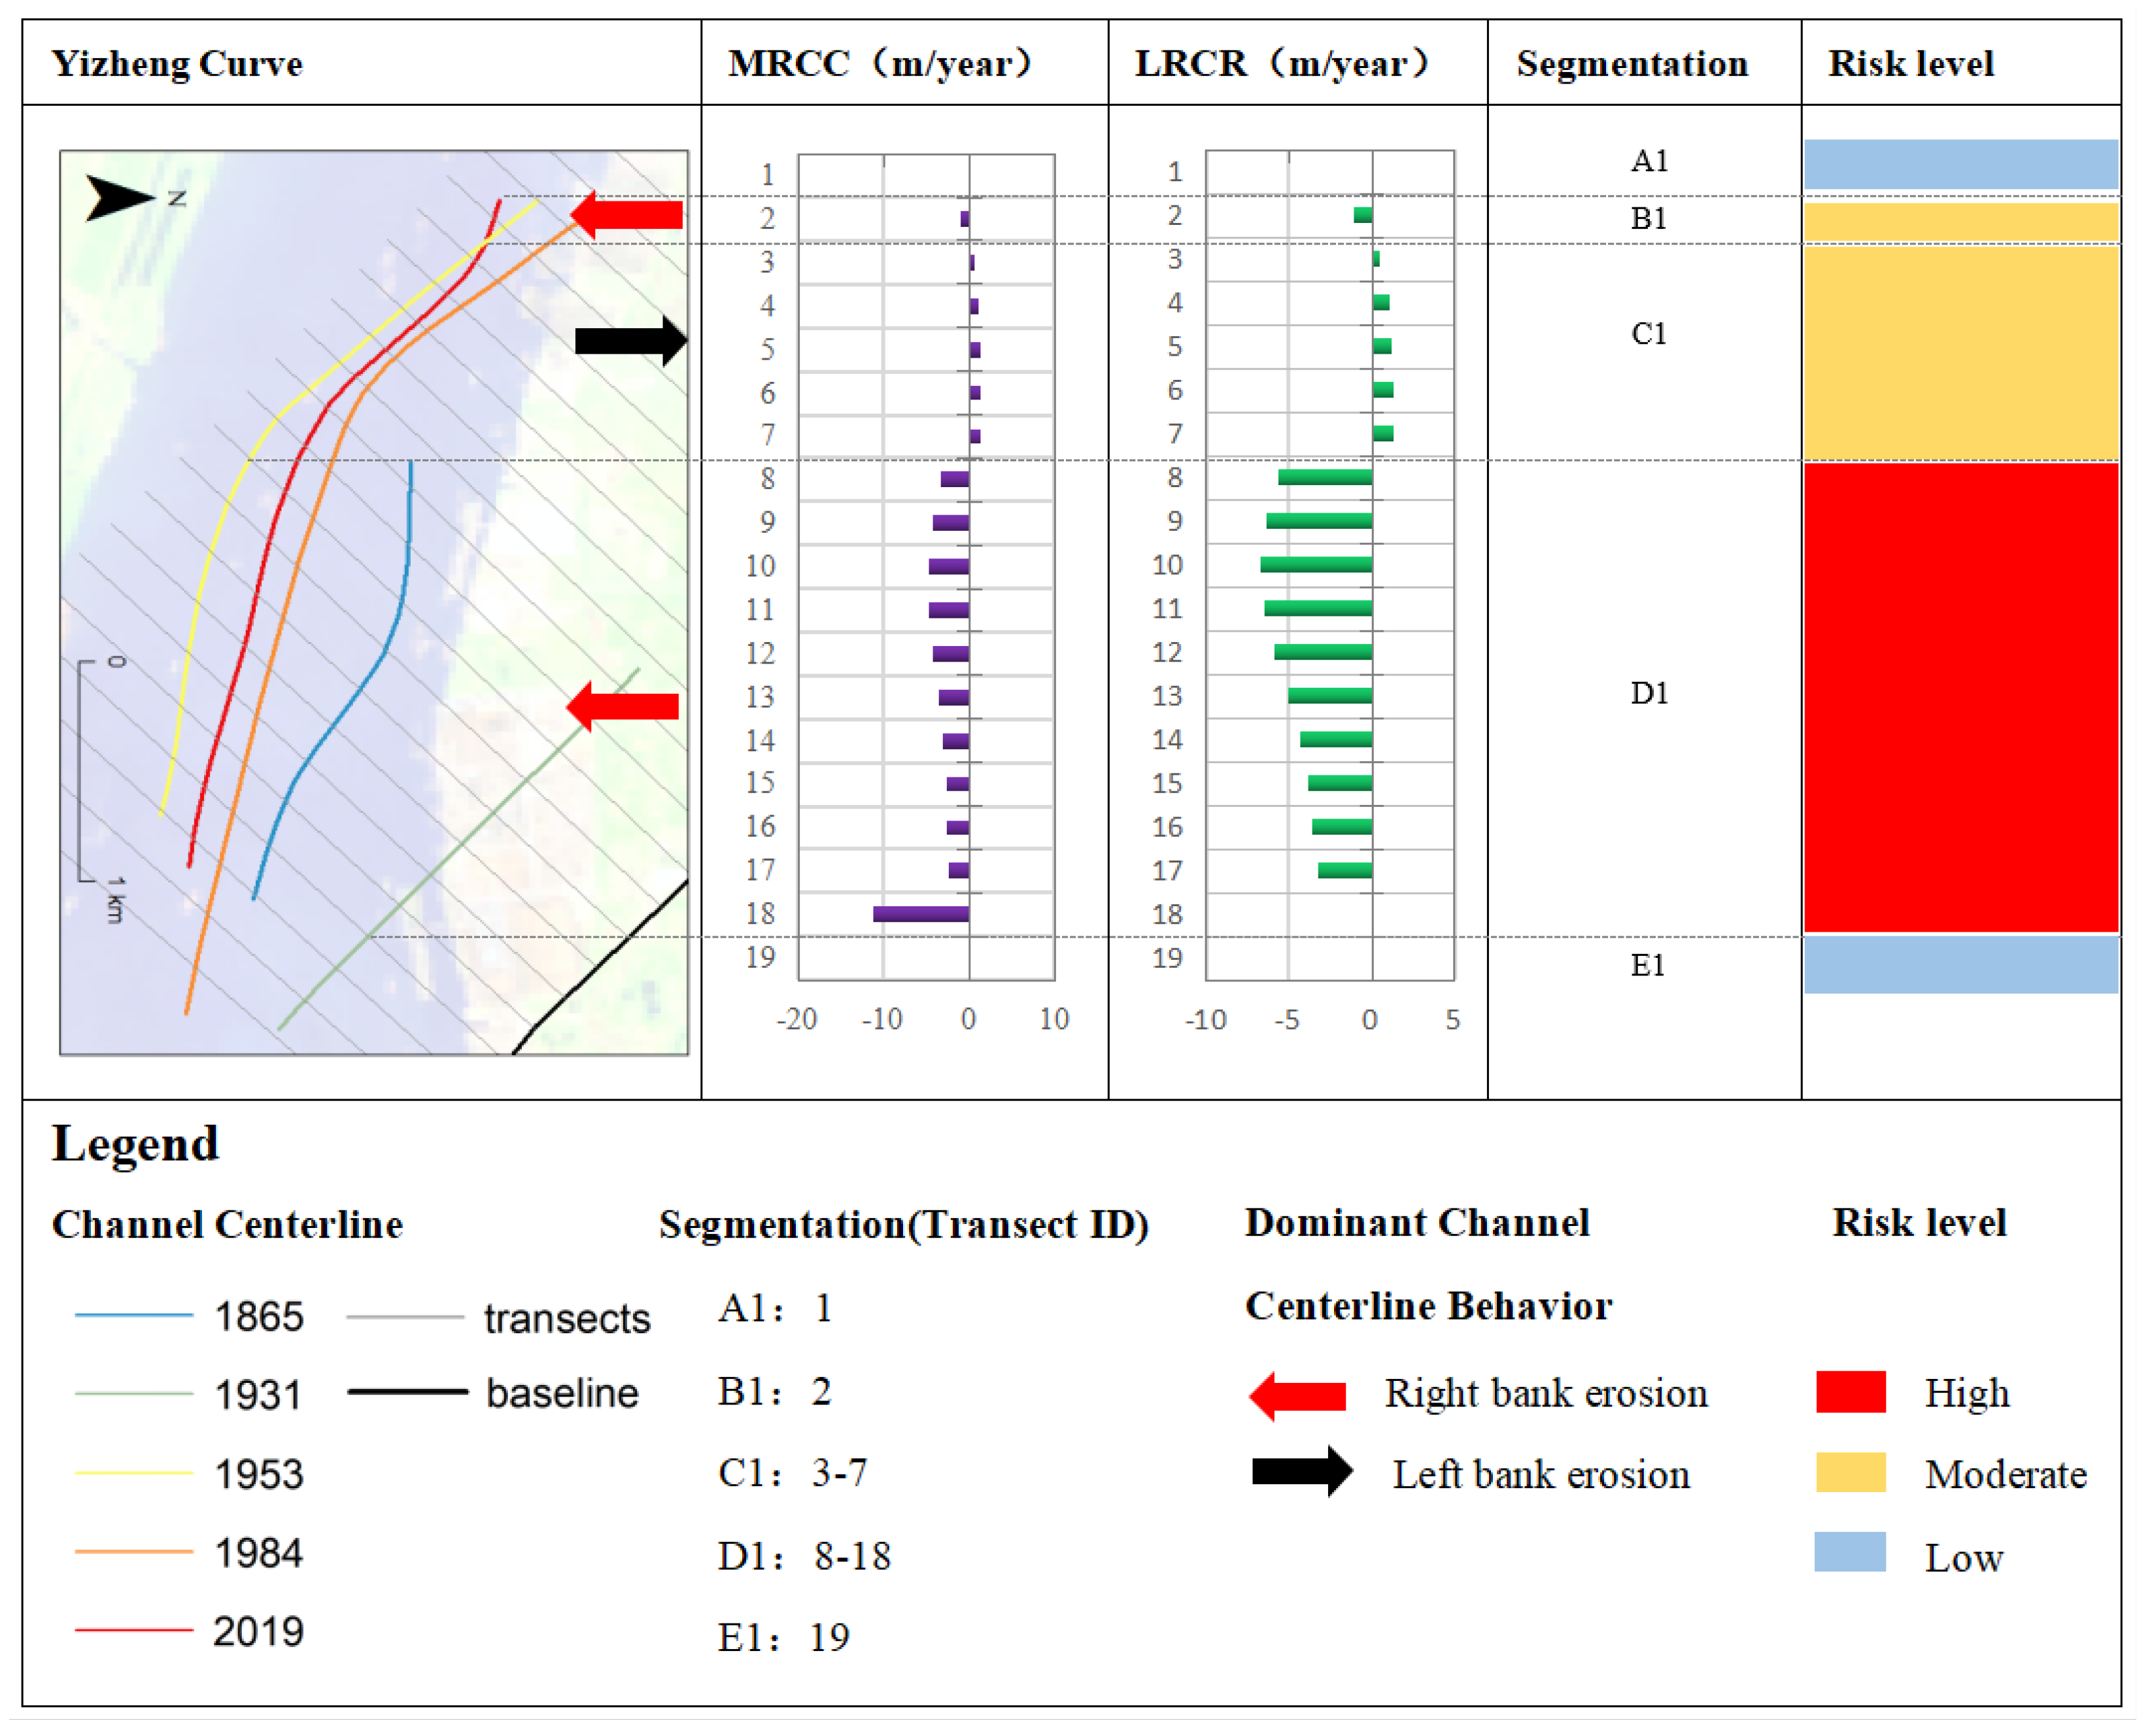
As shown in Figure 5, the highest MRCC value of Yizheng Curve during 1868–2019 was 11.13 m/y, with an average of 2.19 m/y, and the highest LRCR value was 6.67 m/y, with an average of 2.45 m/y. The number of left shifts of the Yizheng Curve section is 5, and the number of right shifts is 12. Combining the direction and velocity of cross-section movement to identify the bank erosion risk, Yizheng Curve can be divided into five sections. Section A1 contains section 1, and the bank erosion risk level is low. Section B1 contains section 2, and the erosion risk level is moderate risk on the right bank. Section C1 contains sections 3–7, and the erosion risk level is moderate risk on the left bank. Section D1 contains sections 8–18, and the erosion risk level is high risk on the right bank. Section E1 contains section 19, and the risk level of riparian erosion is low.
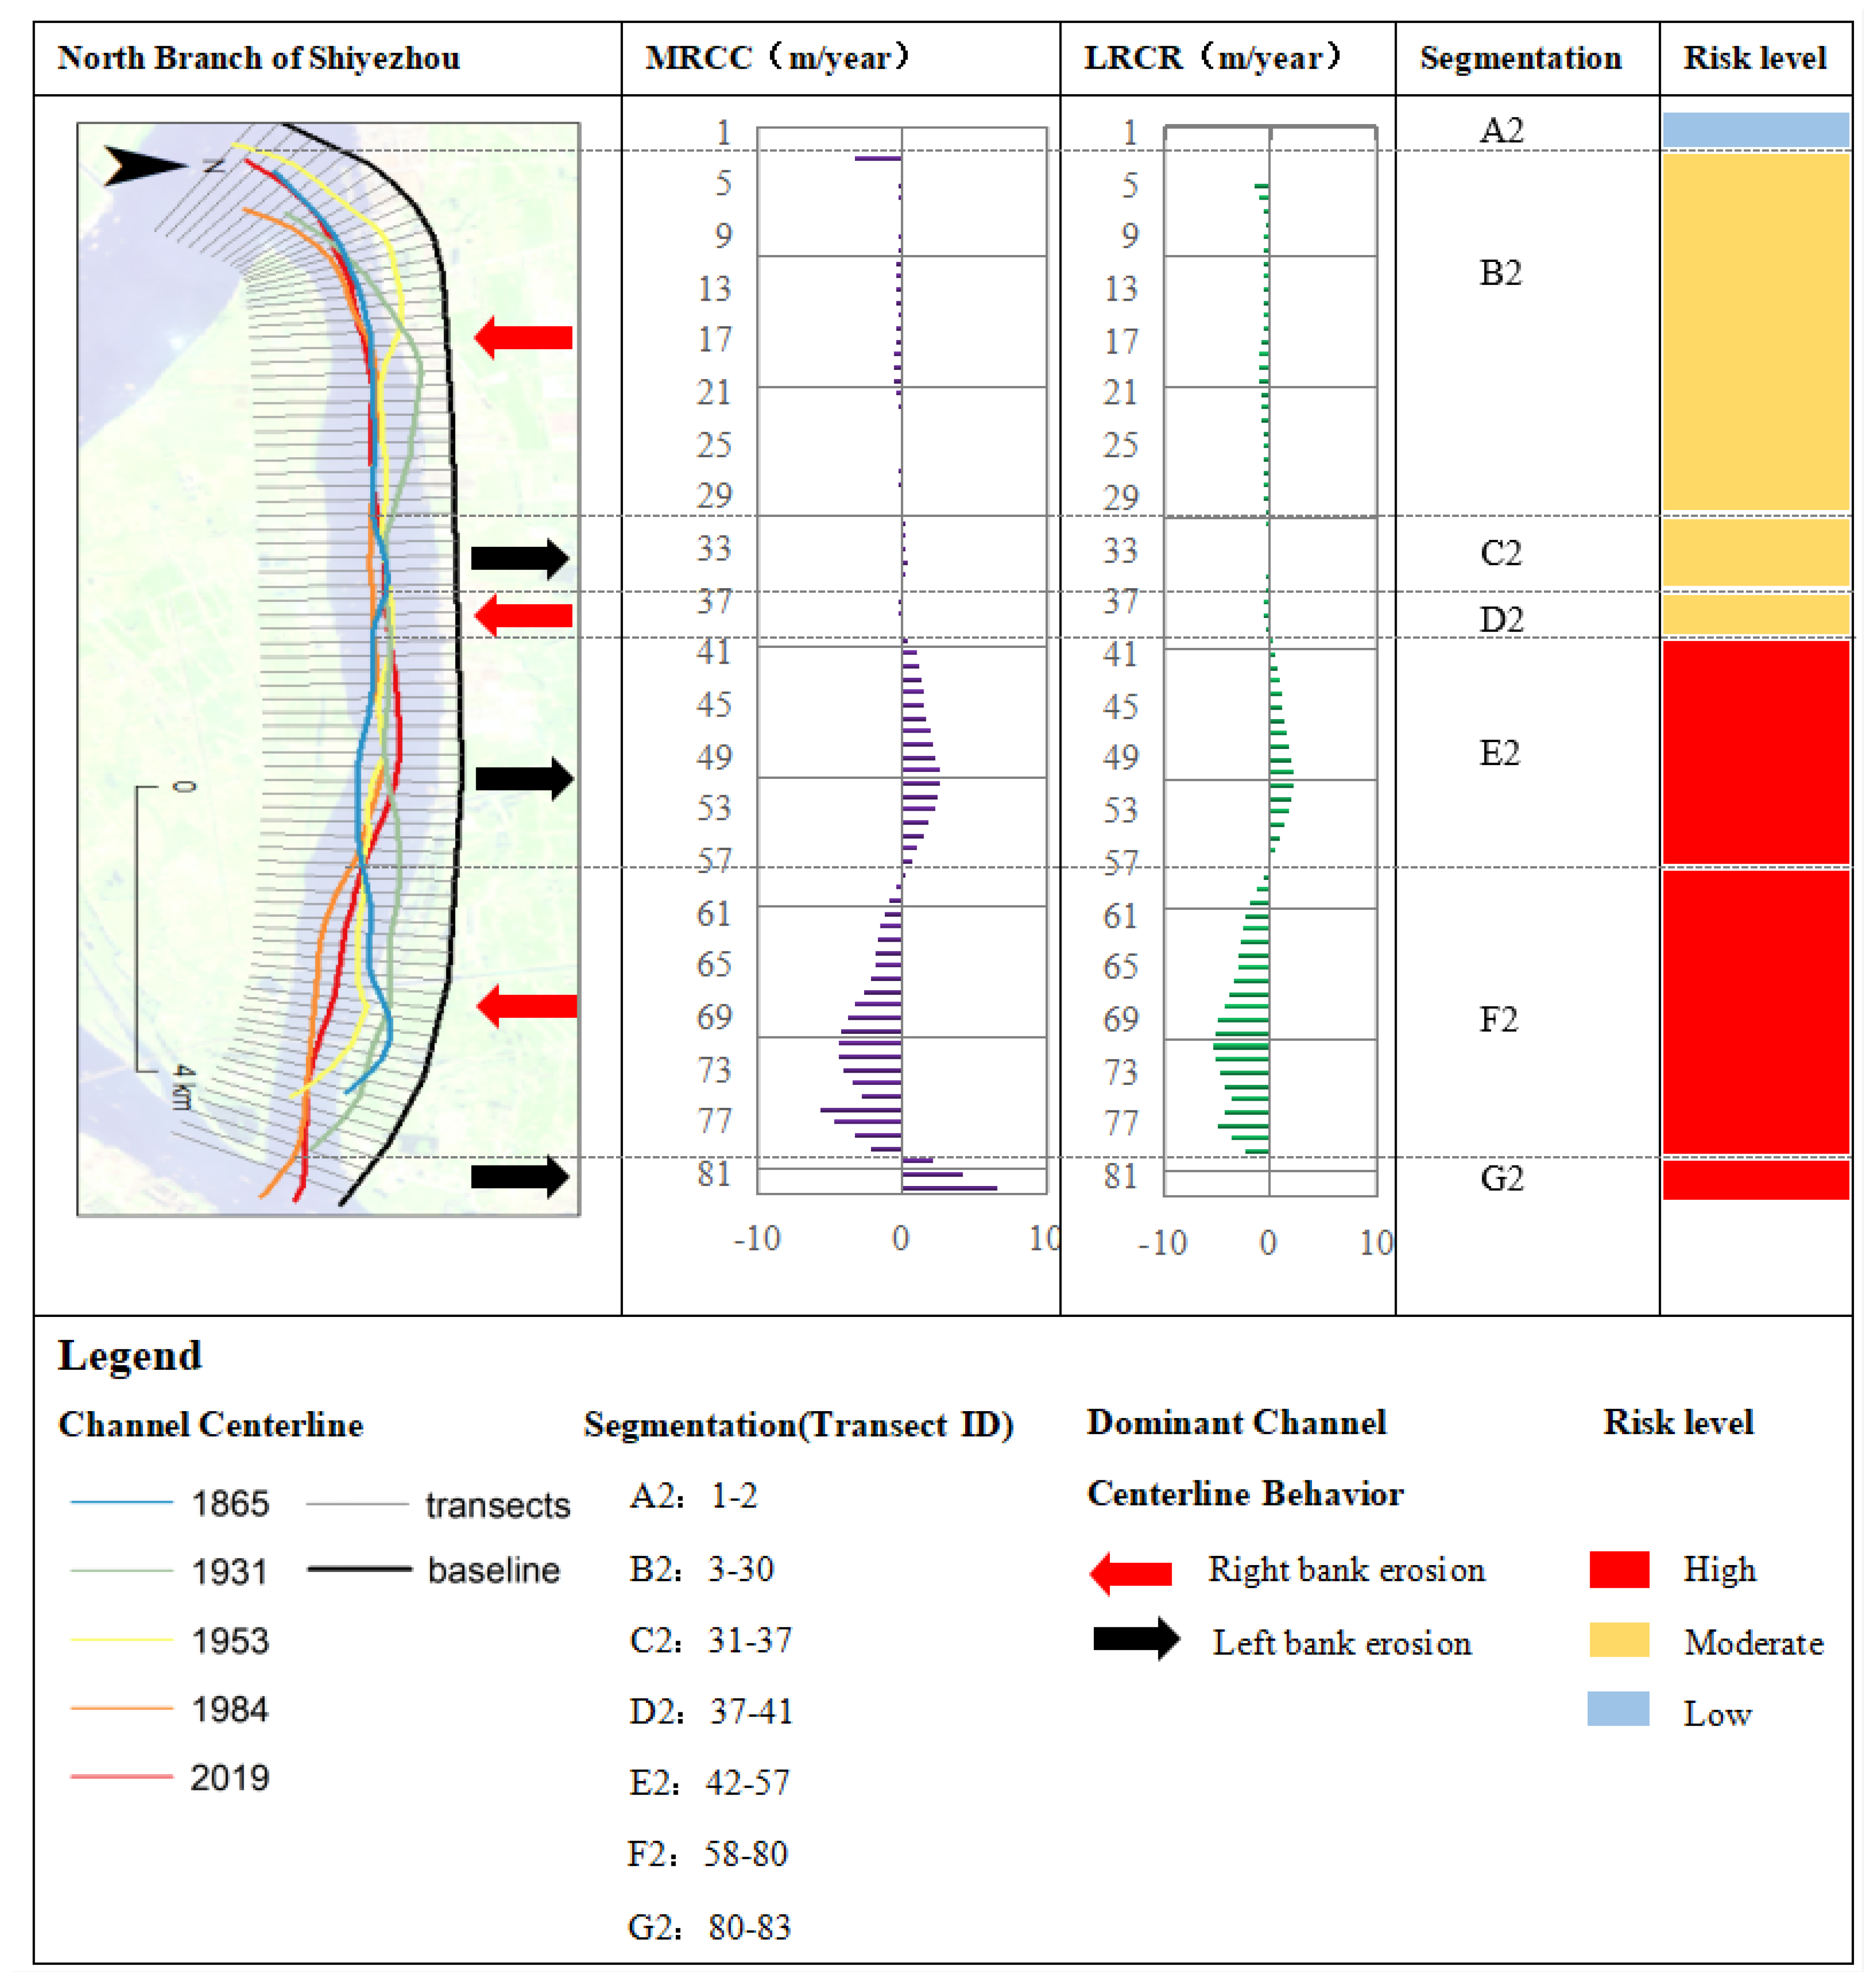
As shown in Figure 6, the highest MRCC value of North Branch of Shiyezhou during 1868–2019 was 6.58 m/y, with an average of 0.38 m/y, and the highest LRCR value was 5.3 m/y, with an average of 0.94 m/y. The number of left shifts of North Branch of Shiyezhou section is 27, and the number of right shifts is 53. Combining the direction and velocity of cross-section movement to identify the bank erosion risk, Yizheng Curve can be divided into seven sections. Section A2 contains sections 1–2, and the bank erosion risk level is low. Section B2 contains section 3–30, and the erosion risk level is moderate on the right bank. Section C2 contains sections 31–37, and the erosion risk level is moderate on the left bank. Section D2 contains sections 37–41, and the erosion risk level is moderate on the right bank. Section E2 contains sections 42–57, and the erosion risk level is high on the left bank. Section F2 contains sections 58–80, and the erosion risk level is high on the right bank. Section G2 contains sections 80–83, with an erosion risk rating of high risk on the left bank.
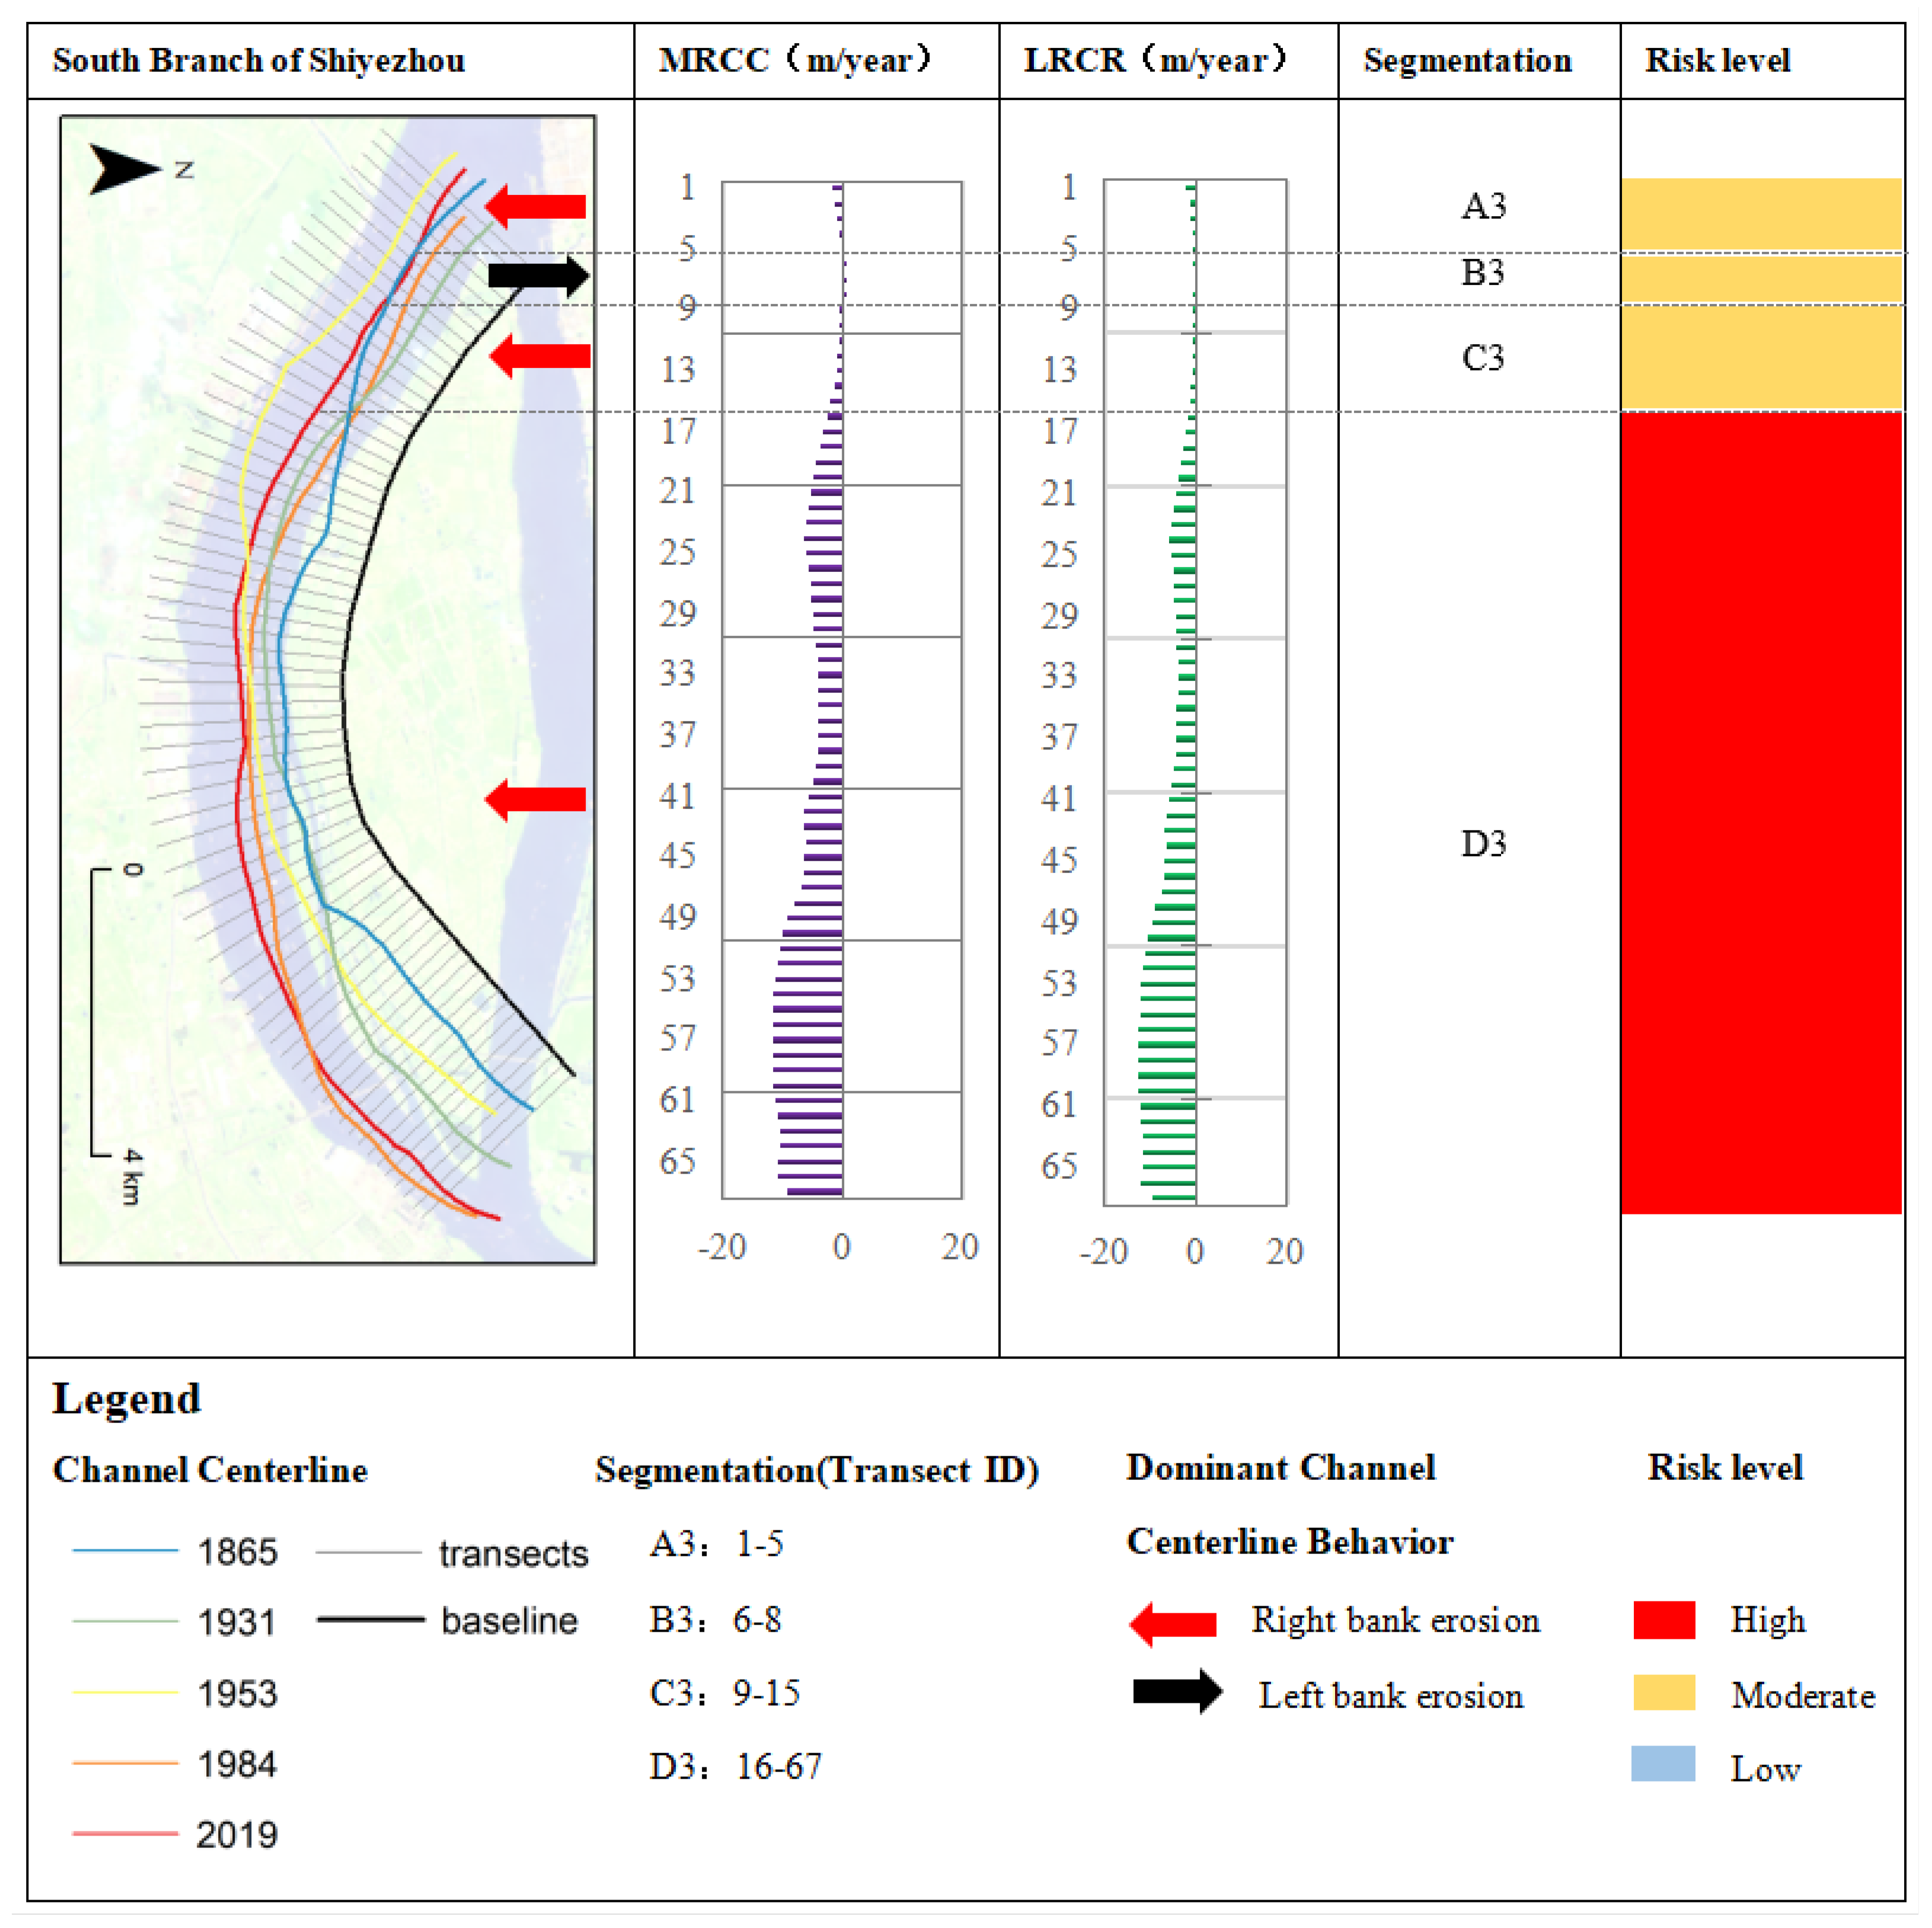
As shown in Figure 7, the maximum MRCC value of South Branch of Shiyezhou during 1868–2019 was 11.54 m/y, with an average of 5.7 m/y, and the maximum LRCR value was 12.63 m/y, with an average of 5.93 m/y. The number of left shifts of South Branch of Shiyezhou section is 3, and the number of right shifts is 63. Combining the direction and velocity of cross-section movement to identify the bank erosion risk, Yizheng Curve can be divided into four sections. Section A3 contains sections 1–5, and the erosion risk level is moderate on the right bank. Section B3 contains sections 6–8, and the erosion risk level is moderate on the left bank. Section C3 contains sections 9–15, and the erosion risk level is moderate on the right bank. Section D3 contains sections 16–67, and the erosion risk level is high on the right bank.
As shown in the Figure 8, the maximum value of MRCC of Liuwei Curve during 1868–2019 was 30.85 m/y, with an average of 18.32 m/y, and the maximum value of LRCR was 30.29 m/y, with an average of 13.76 m/y. The number of left shifts of Liuwei Curve section is 91, and the number of right shifts is 9. Combining the direction and velocity of cross-section movement to identify the bank erosion risk, Yizheng Curve can be divided into three sections. Section A4 contains sections 1–11, and the erosion risk level is moderate on the right bank. Section B4 contains sections 12–15, and the erosion risk level is moderate on the left bank. Section C4 contains sections 15–103, and the erosion risk level is high on the left bank.
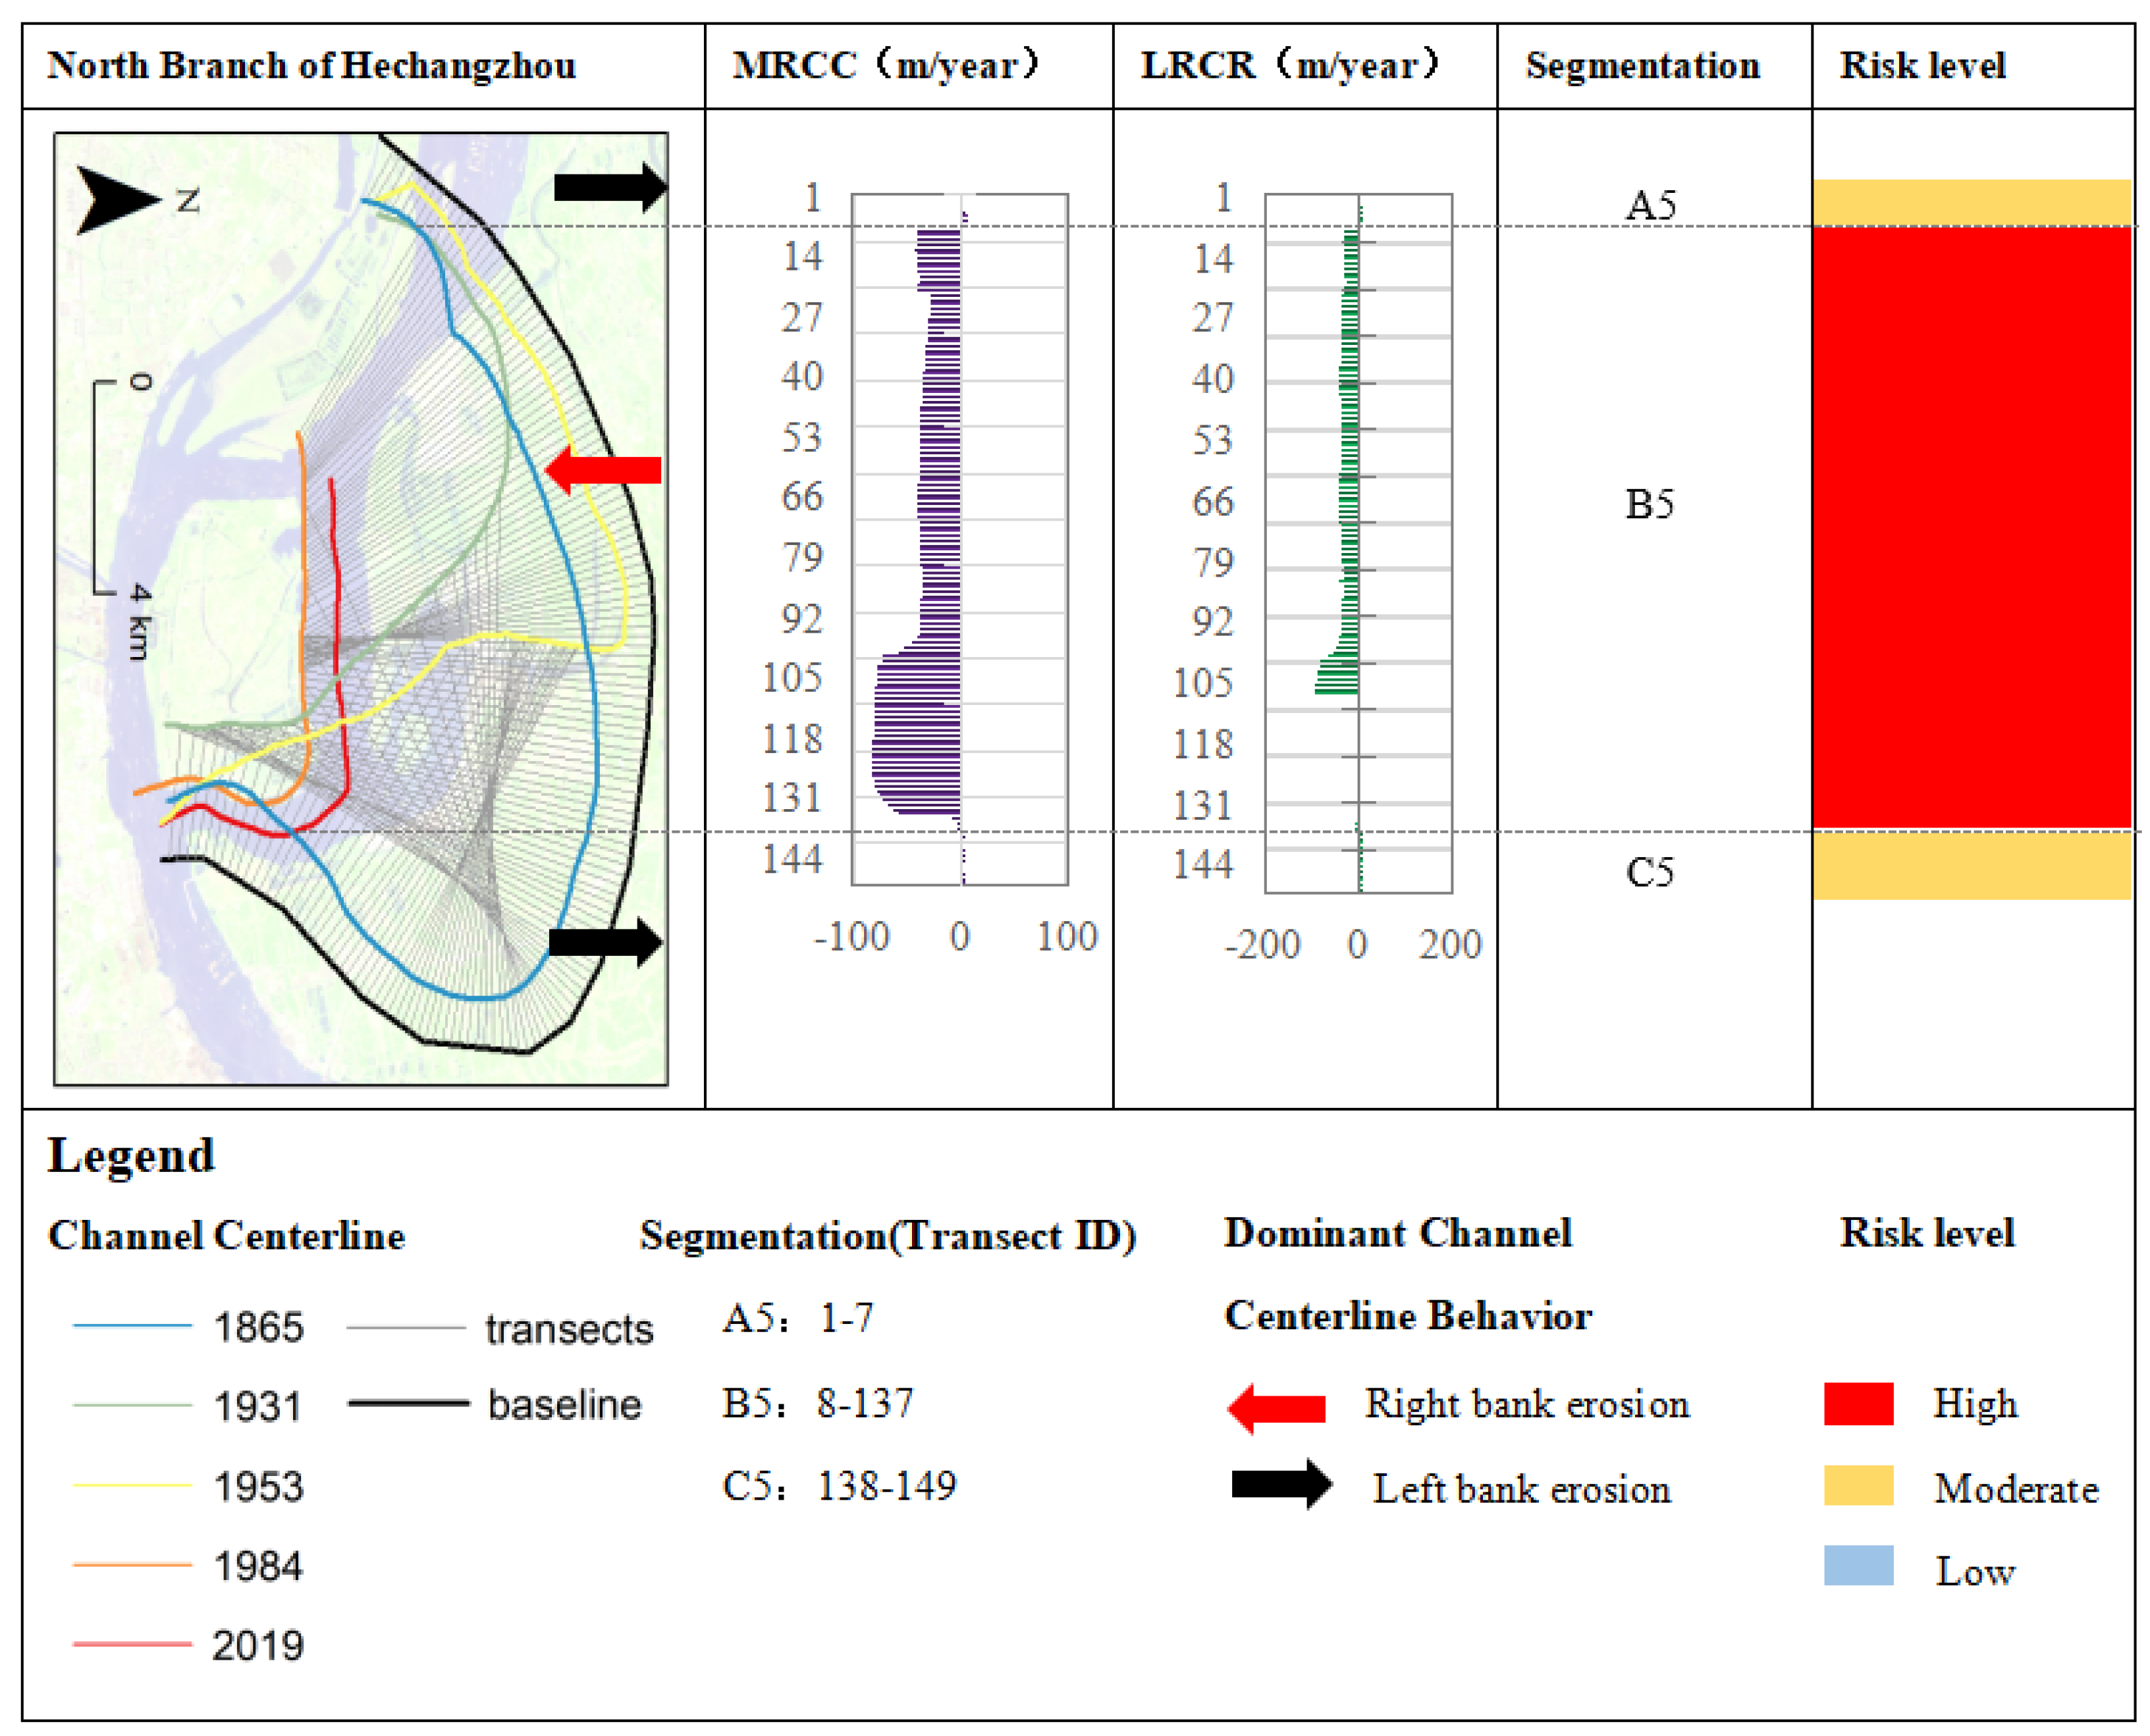
As shown in Figure 9, the highest MRCC value of North Branch of Hechangzhou during 1868–2019 was 82.96 m/y, with an average of 40.41 m/y, and the highest LRCR value was 93.8 m/y, with an average of 26.83 m/y. The North Branch of Hechangzhou section moves left 12 times and right 130 times. Combining the direction and velocity of cross-section movement to identify the bank erosion risk, Yizheng Curve can be divided into three sections. Section A5 contains sections 1–7, and the erosion risk level is moderate on the left bank. Section B5 contains sections 8–137 with high risk of the right bank. Section C5 contains sections 138–149, and the erosion risk level is moderate on the left bank.
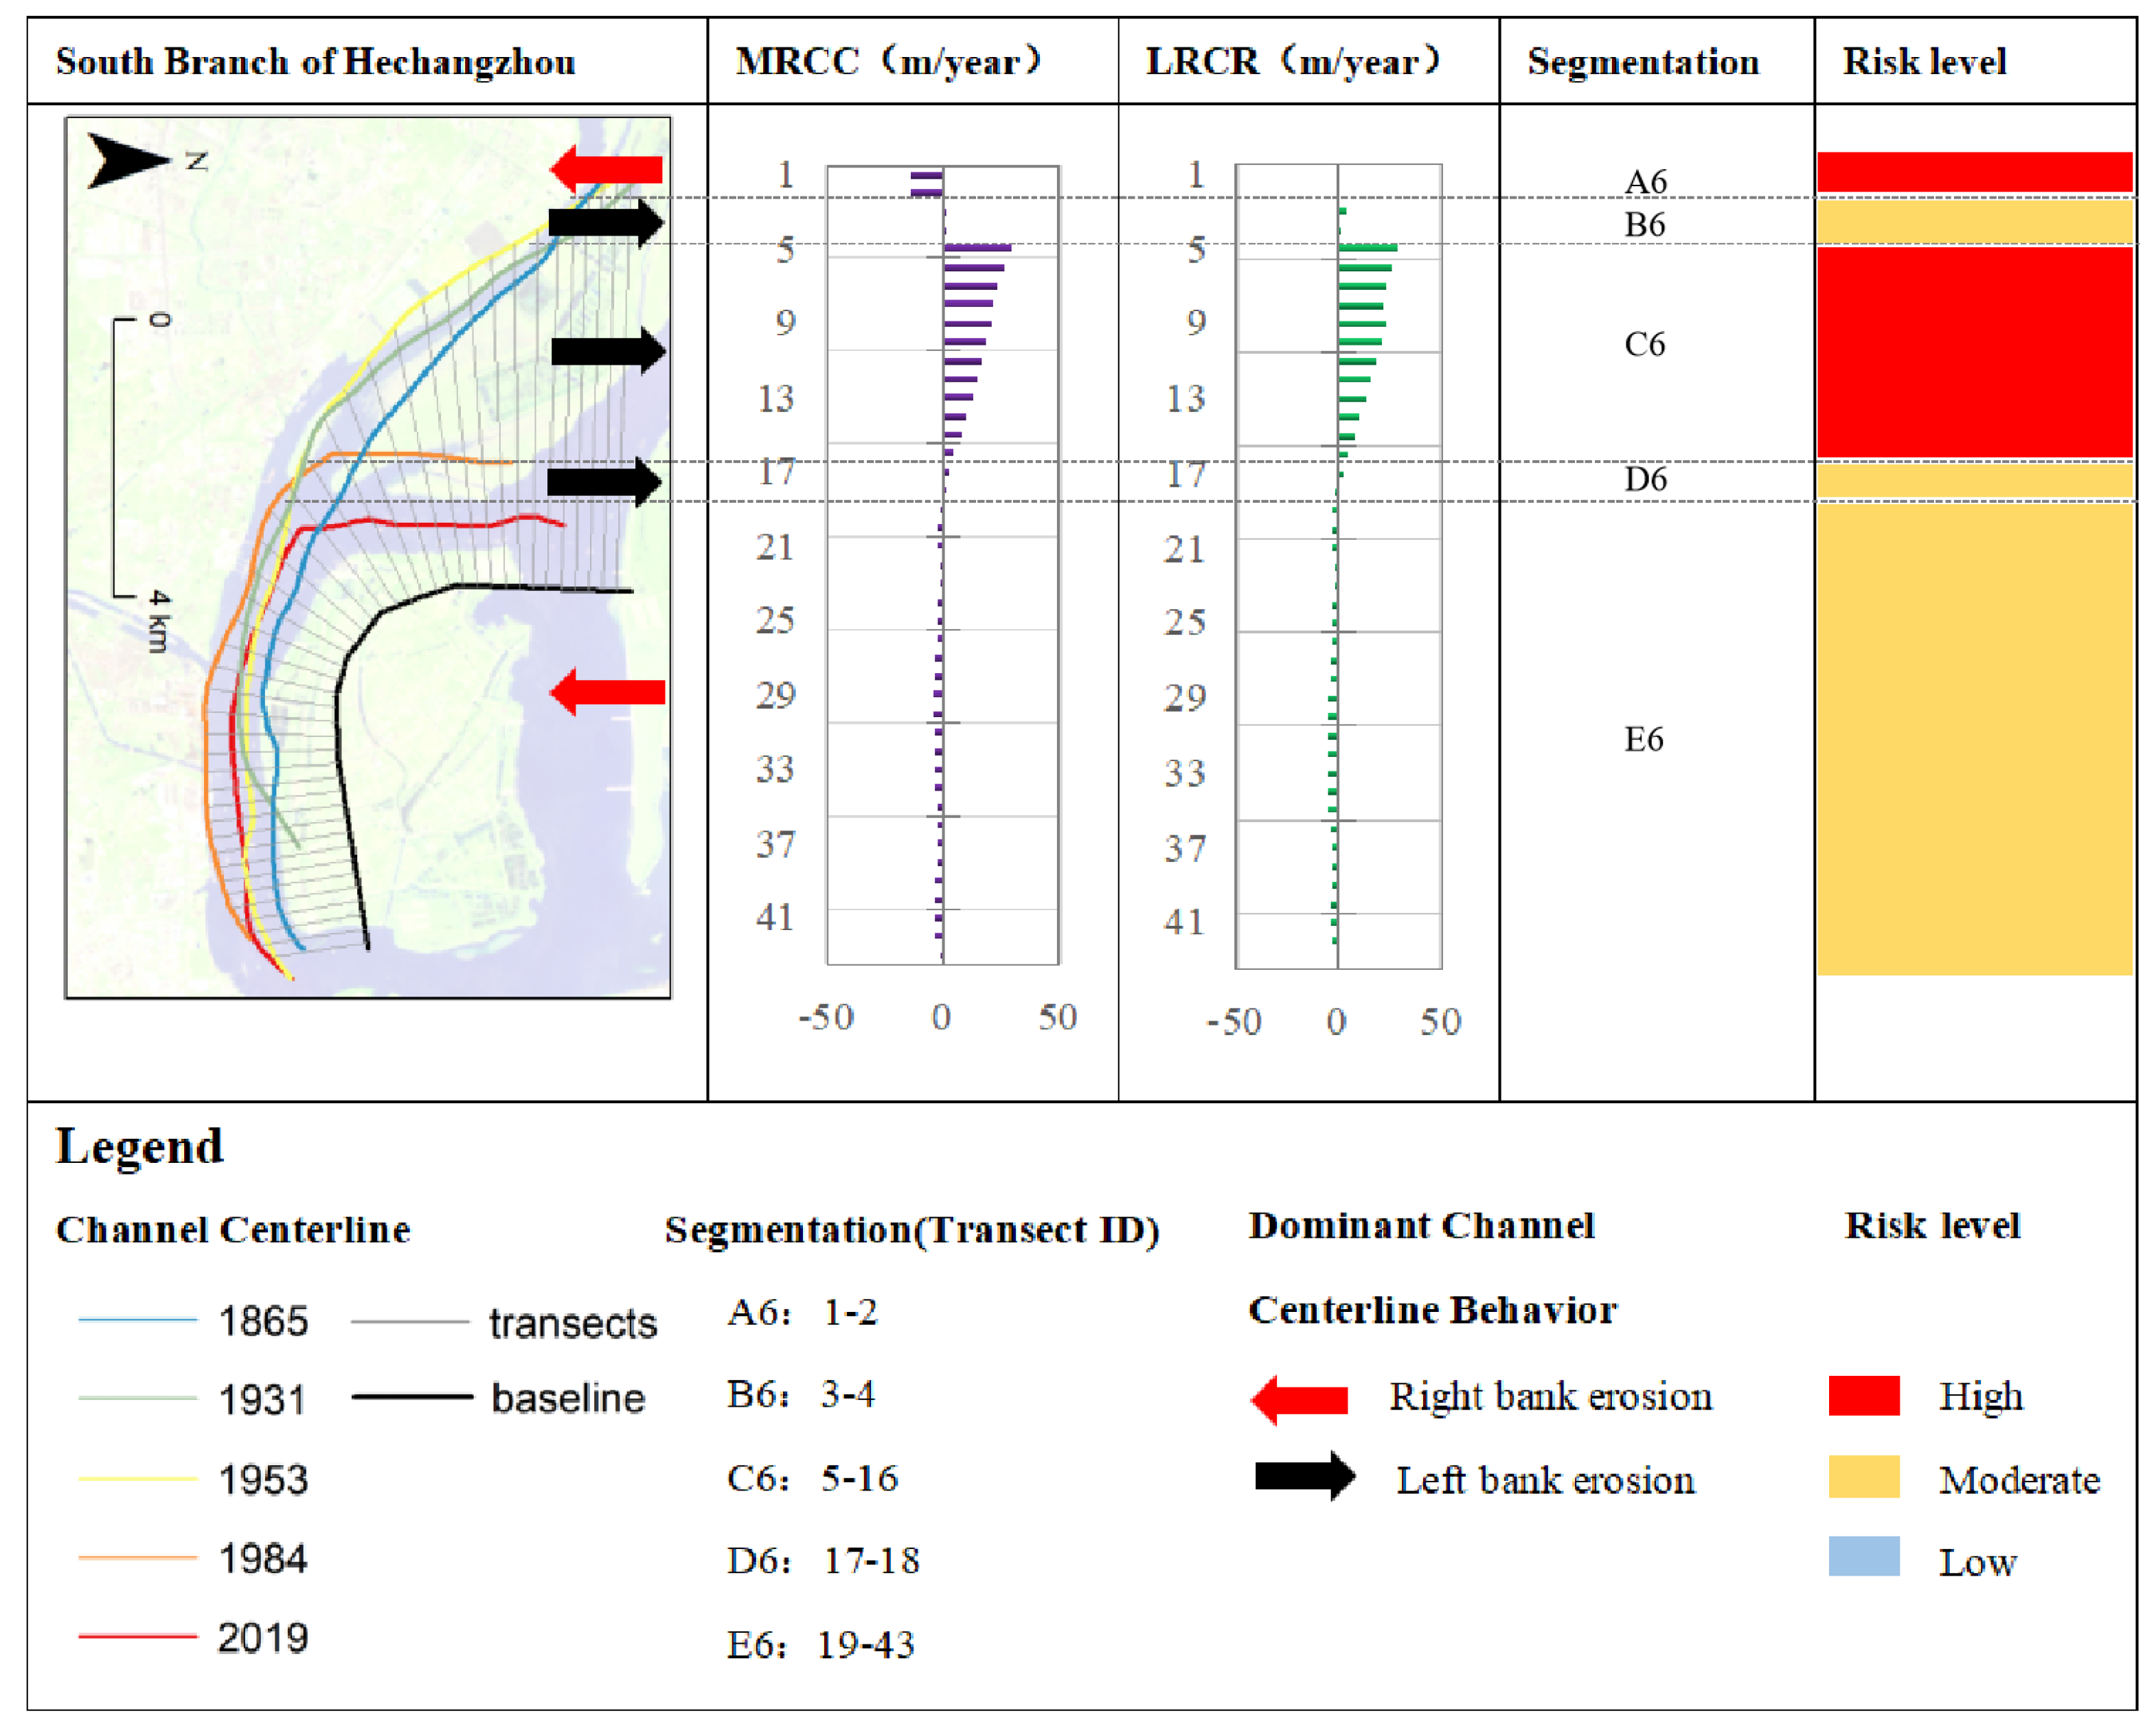
As shown in Figure 10, the maximum MRCC value of South Branch of Hechangzhou during 1868–2019 was 29.09 m/y, with an average of 2.69 m/y, and the maximum LRCR value was 28.16 m/y, with an average of 2.81 m/y. The number of left shifts of South Branch of Hechangzhou section is 16, and the number of right shifts is 27. Combining the direction and velocity of cross-section movement to identify the bank erosion risk, Yizheng Curve can be divided into five sections. Section A6 contains sections 1–2, and the erosion risk level is high on the right bank. Section B6 contains sections 3–4, and the erosion risk level is moderate on the left bank. Section C6 contains sections 5–16, and the erosion risk level is high on the left bank. Section D6 contains sections 17–18, and the erosion risk level is moderate on the left bank. Section E6 contains sections 19–43, and the erosion risk level is moderate on the left bank.
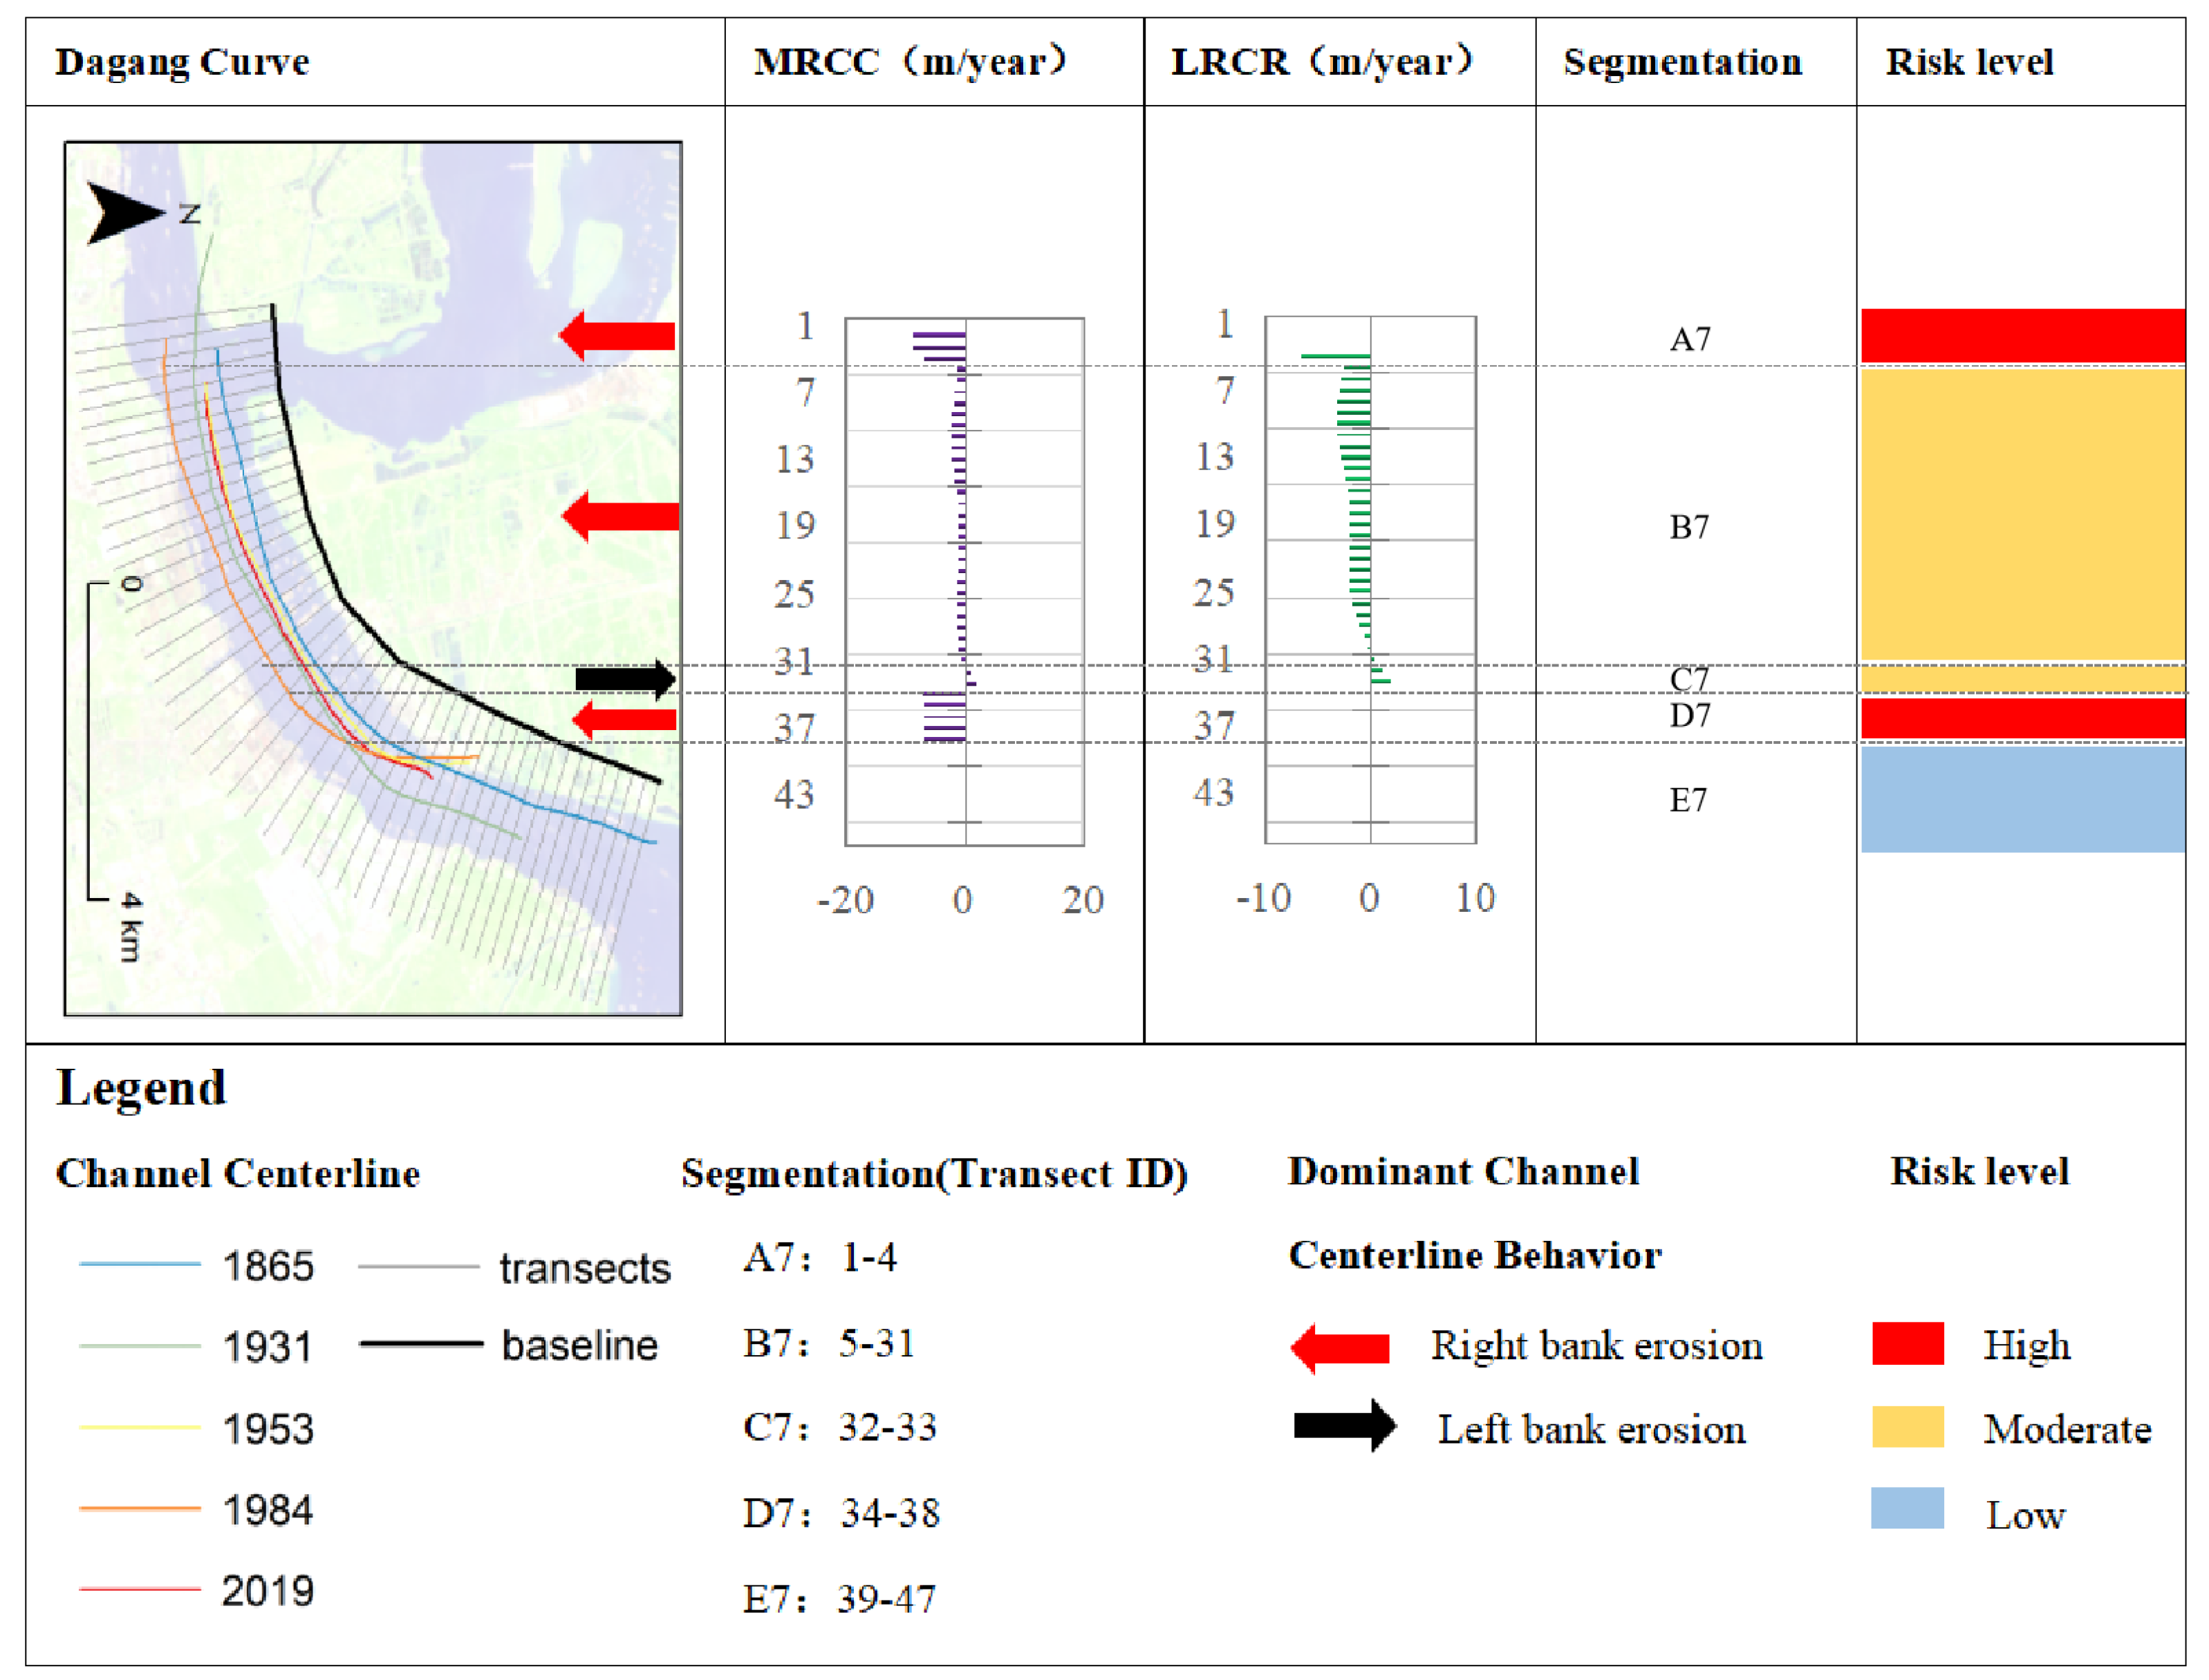
As shown in Figure 11, the maximum value of MRCC of Dagang Curve during 1868–2019 was 8.71 m/y, with an average of 2.05 m/y, and the maximum value of LRCR was 6.71 m/y, with an average of 1.26 m/y. The number of left shifts of Dagang Curve section is 2, and the number of right shifts is 35. Combining the direction and velocity of cross-section movement to identify the bank erosion risk, Yizheng Curve can be divided into five sections. Section A7 contains sections 1–4, and the erosion risk level is high on the right bank. Section B7 contains sections 5–31, and the erosion risk level is moderate on the right bank. Section C7 contains sections 32–33, and the erosion risk level is moderate on the left bank. Section D7 contains sections 34–38, and the erosion risk level is high on the right bank. Section E7 comprises sections 39–47, with a low risk rating for riparian erosion.

3.3. Influence Factors of Channel Centerline Changes

Channel evolution covers various deformation components such as adjustments in planform and cross-sectional geometries, and channel migration is a critical component of channel planform adjustments in alluvial rivers. Factors influencing channel migration mainly include changes in river boundary conditions, hydrological and sediment changes, and sandbanks merging. These influencing factors are presented herein to investigate the variation characteristics in the variation characteristics of the migration intensity of the channel centerline of the Zhenjiang-Yangzhou reach of the Yangtze River.

3.3.1. Changes of River Boundary Conditions

The Zhenjiang-Yangzhou reach is located at the top of the Yangtze River Delta, and the tidal current of the Yangtze River estuary can reach the reach to form a jacking effect. Therefore, the boundary conditions of the river will change with the dynamic changes of the material composition of the riverbed, topography, water level difference, and river slope.
The geological structure of the located Yangzhou reach belongs to the Yangzi quasi-platform, and the river trend is basically consistent with the geological structure trend, showing a west-east trend. The river valley reached by the Zhenjiang-Yangzhou reach is narrow in the upper part and wide in the lower, showing an asymmetric horn shape. Both sides are alluvial plains, and outward are loess terraces and low hills. The riverbed is mostly composed of fine sand or silt, and there are medium-coarse sand and gravel in the deep groove.
The southern bank of the reach is the Xiashu loess terrace and part of the impact plain at the northern foot of the Ningzhen Mountains. The Xiashu loess was formed about 100,000 years ago by river accumulation. All the riverbeds and bank walls made up of Xiashu soil are hard and have strong impact resistance. The riverbed on the south bank of the reach is mostly composed of Xiashu loess with good impact resistance except for Zhengzunzhou and a few bank walls. Therefore, all the rivers adjacent to the south bank (right bank) are not seriously eroded except the South Branch of Shiyezhou, where the south bank is continuously eroded.
The north bank of the reach can be divided into two parts from the terrain. Weiyang Loess Platform is located in the north of Yizheng to Yangzhou line. Loess is widely distributed and stretches for tens of kilometers. The southeast and east are the alluvial plains of the Yangtze River Delta. This area was once a shallow estuary area in history. The riverbed and bank wall there have poor erosion resistance and are easy to be washed by water. Therefore, after the crest point gradually moves to the northern bank of the adjacent curve opposite Jinshan Mountain, the central line of the channel moves northward rapidly.
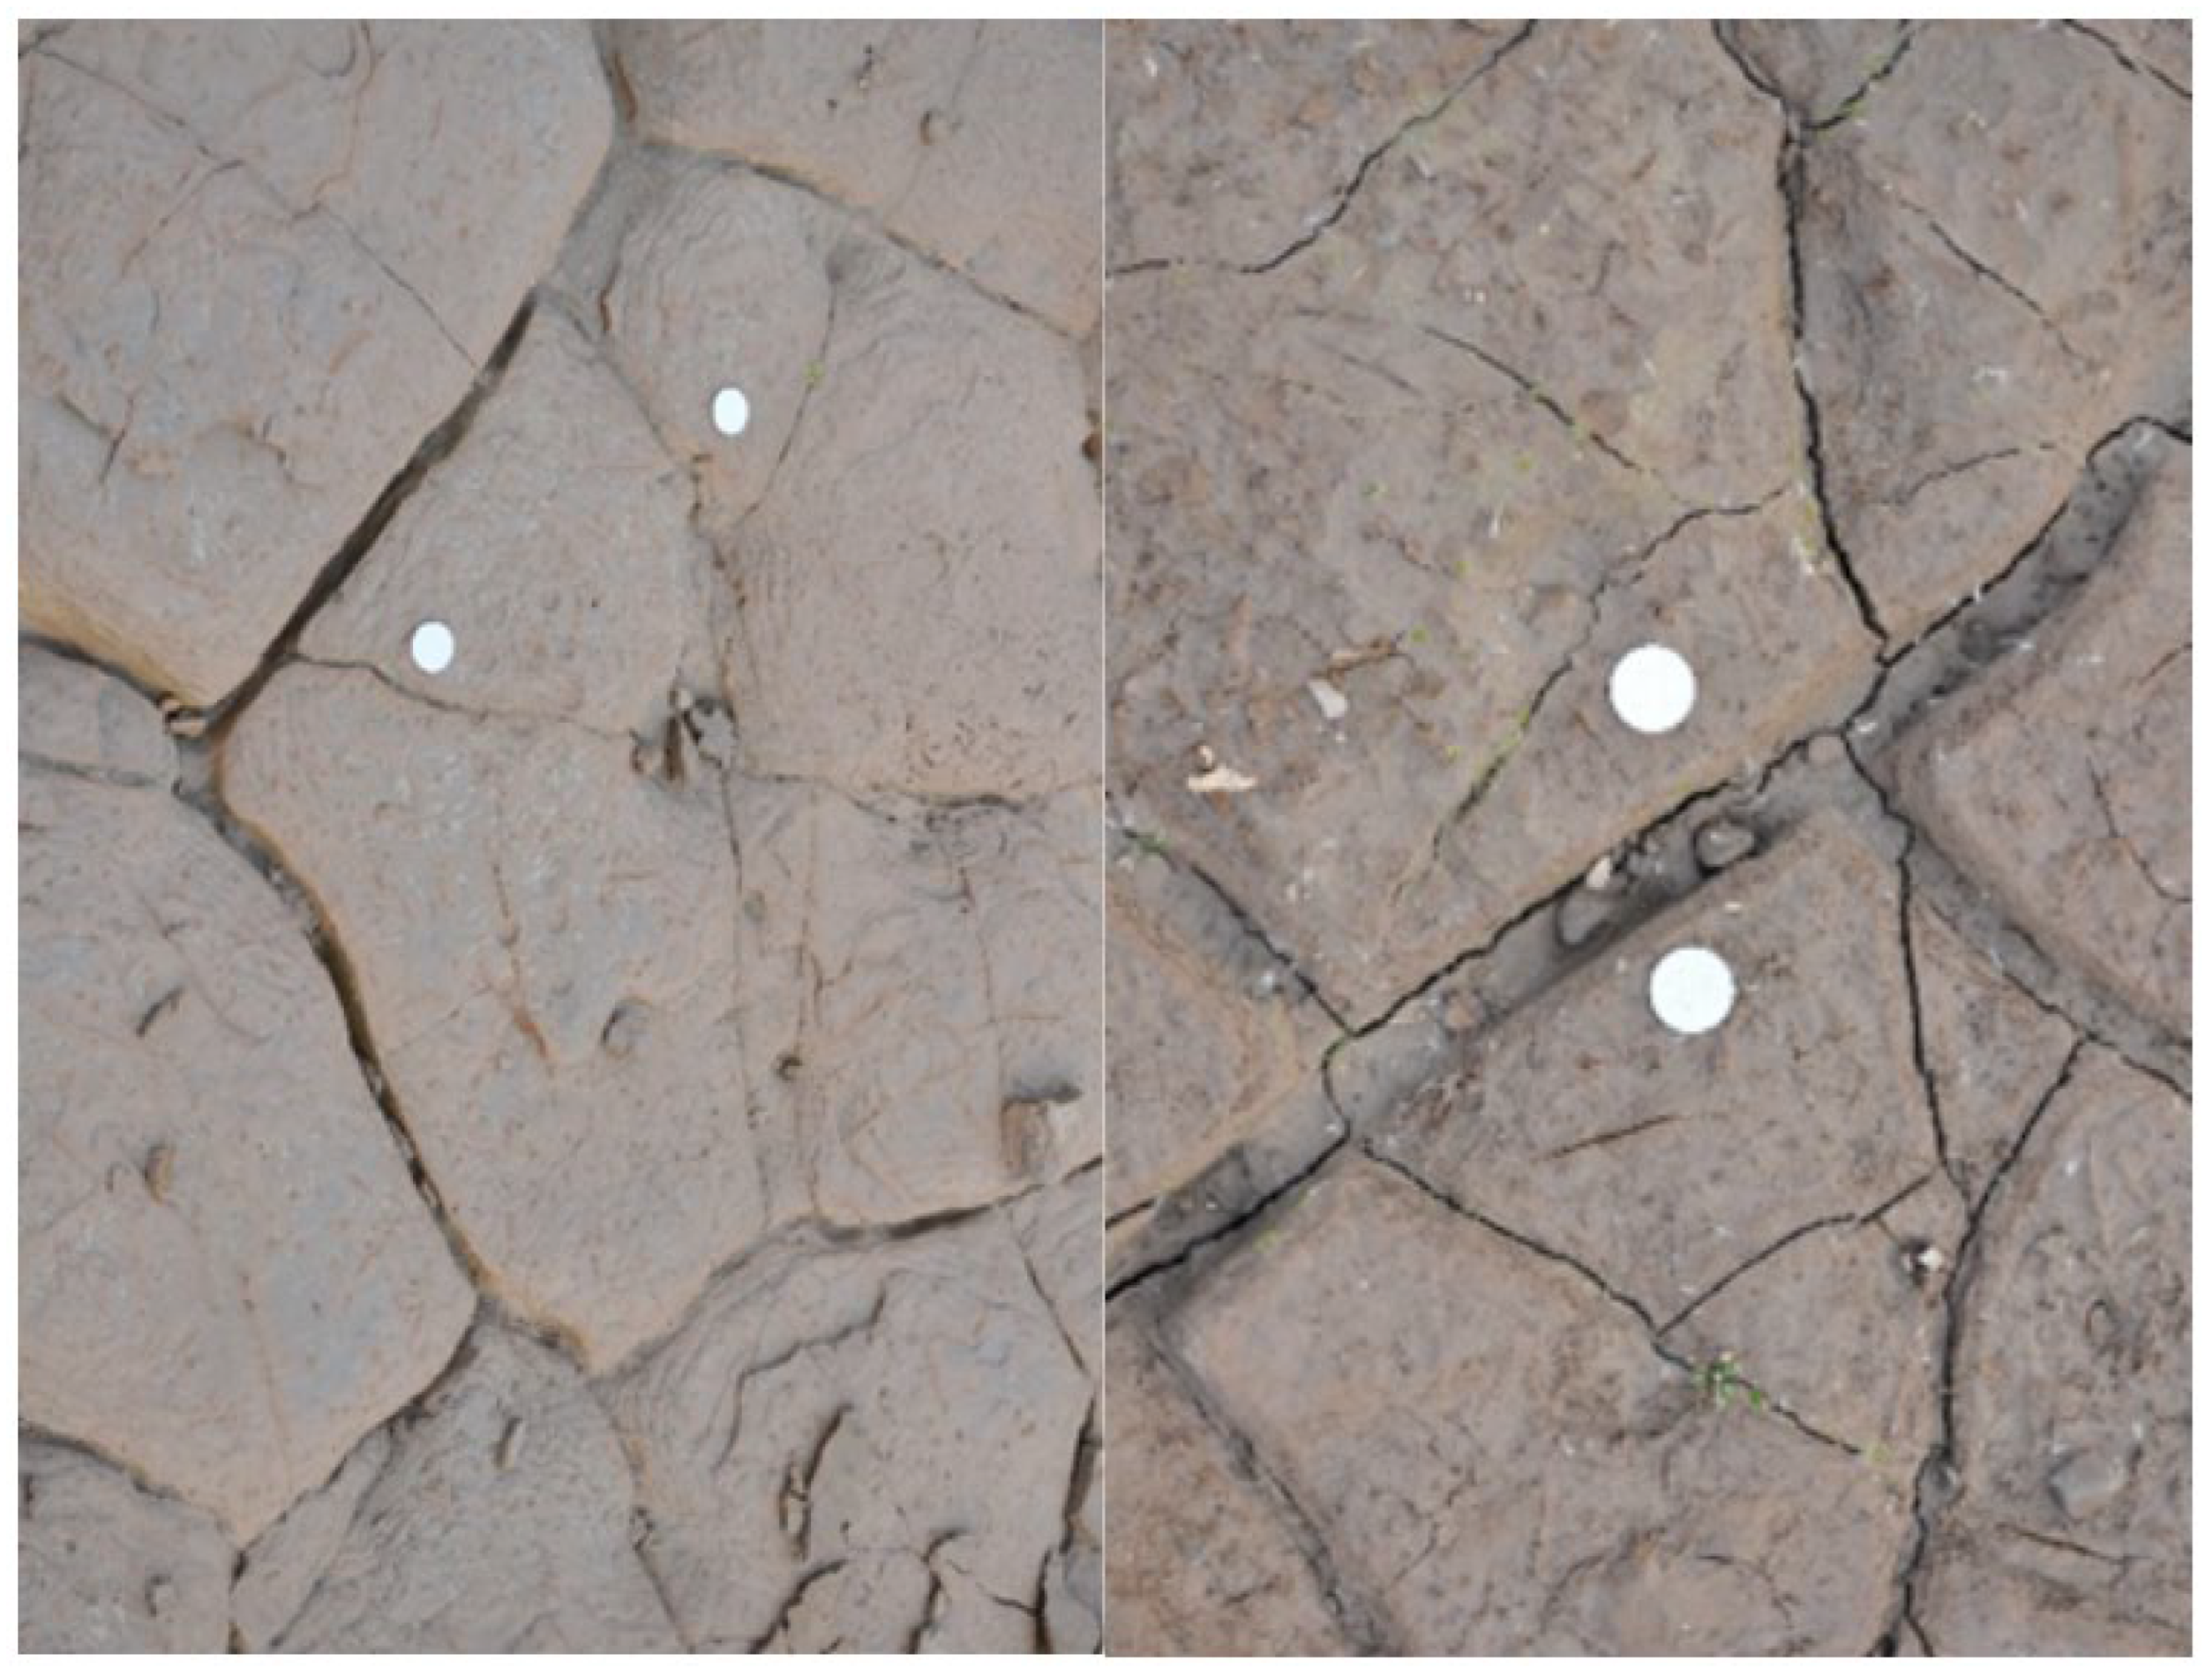
The hard soil or bedrock outcrops in the river reach are not easy to scour. The bank wall has become a good diversion barrier, and even if there are some concave alluvial soil banks, due to the inertia of the flow, in general, in flood years, a large scour will not occur. However, the soil conditions of river floodplains are different. According to the investigation and study of the modern river floodplain sedimentary columnar samples collected in our field and the outcrop profile in the field, it was found that the mud deposits deposited at a high water level in the flood period of the river reach are prone to mud cracks in the dry and rainy environment and have obvious characteristics of mud cracks. Figure 12 shows the scene images of dense mud cracks found near Zhengrunzhou.
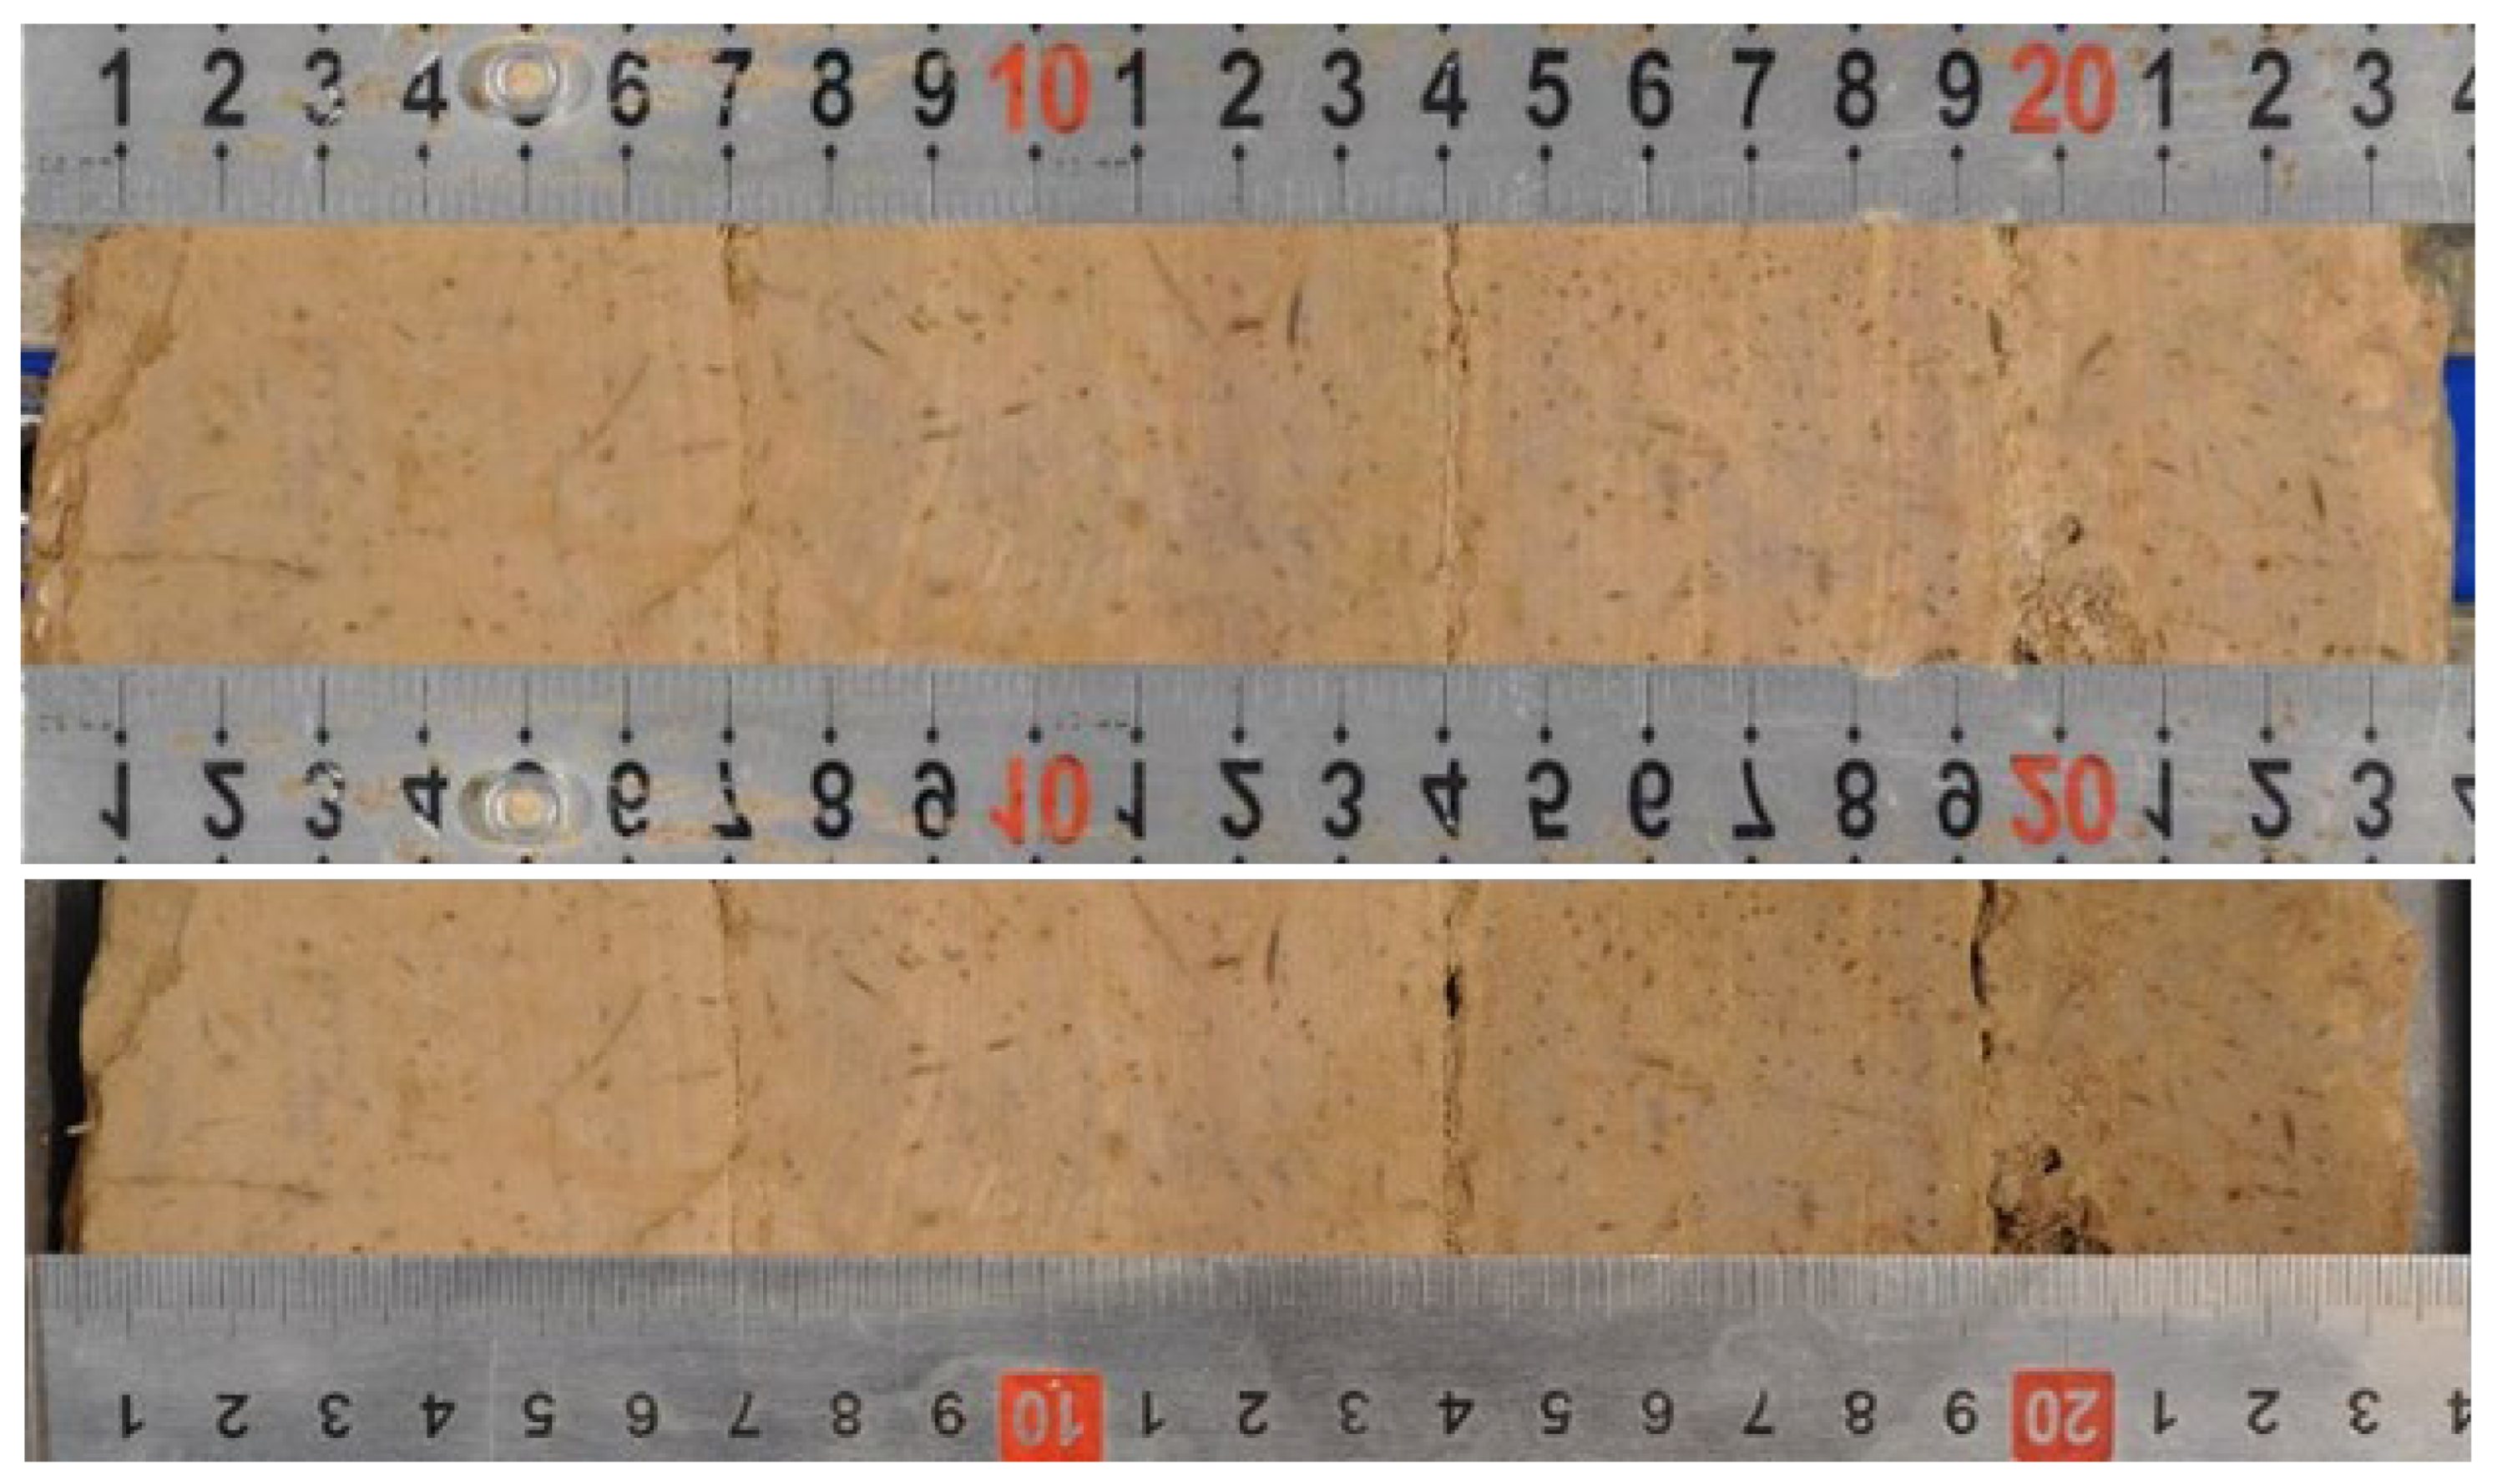
The located Yangzhou reach is mainly composed of barrier sand, sandbars, and beaches, which originally had multiple rivers. Later, some Jiajiang Rivers were silted by sediment and became dark rivers. The floodplain sediments in front of the embankment have obvious horizontal bedding structures, most of which are horizontal laminas of millimeter thickness, as shown in Figure 13. Under the impact of river water and waves, the sand layer is very easy to be hollowed out, resulting in the loss of support and collapse of the upper floodplain sediments.
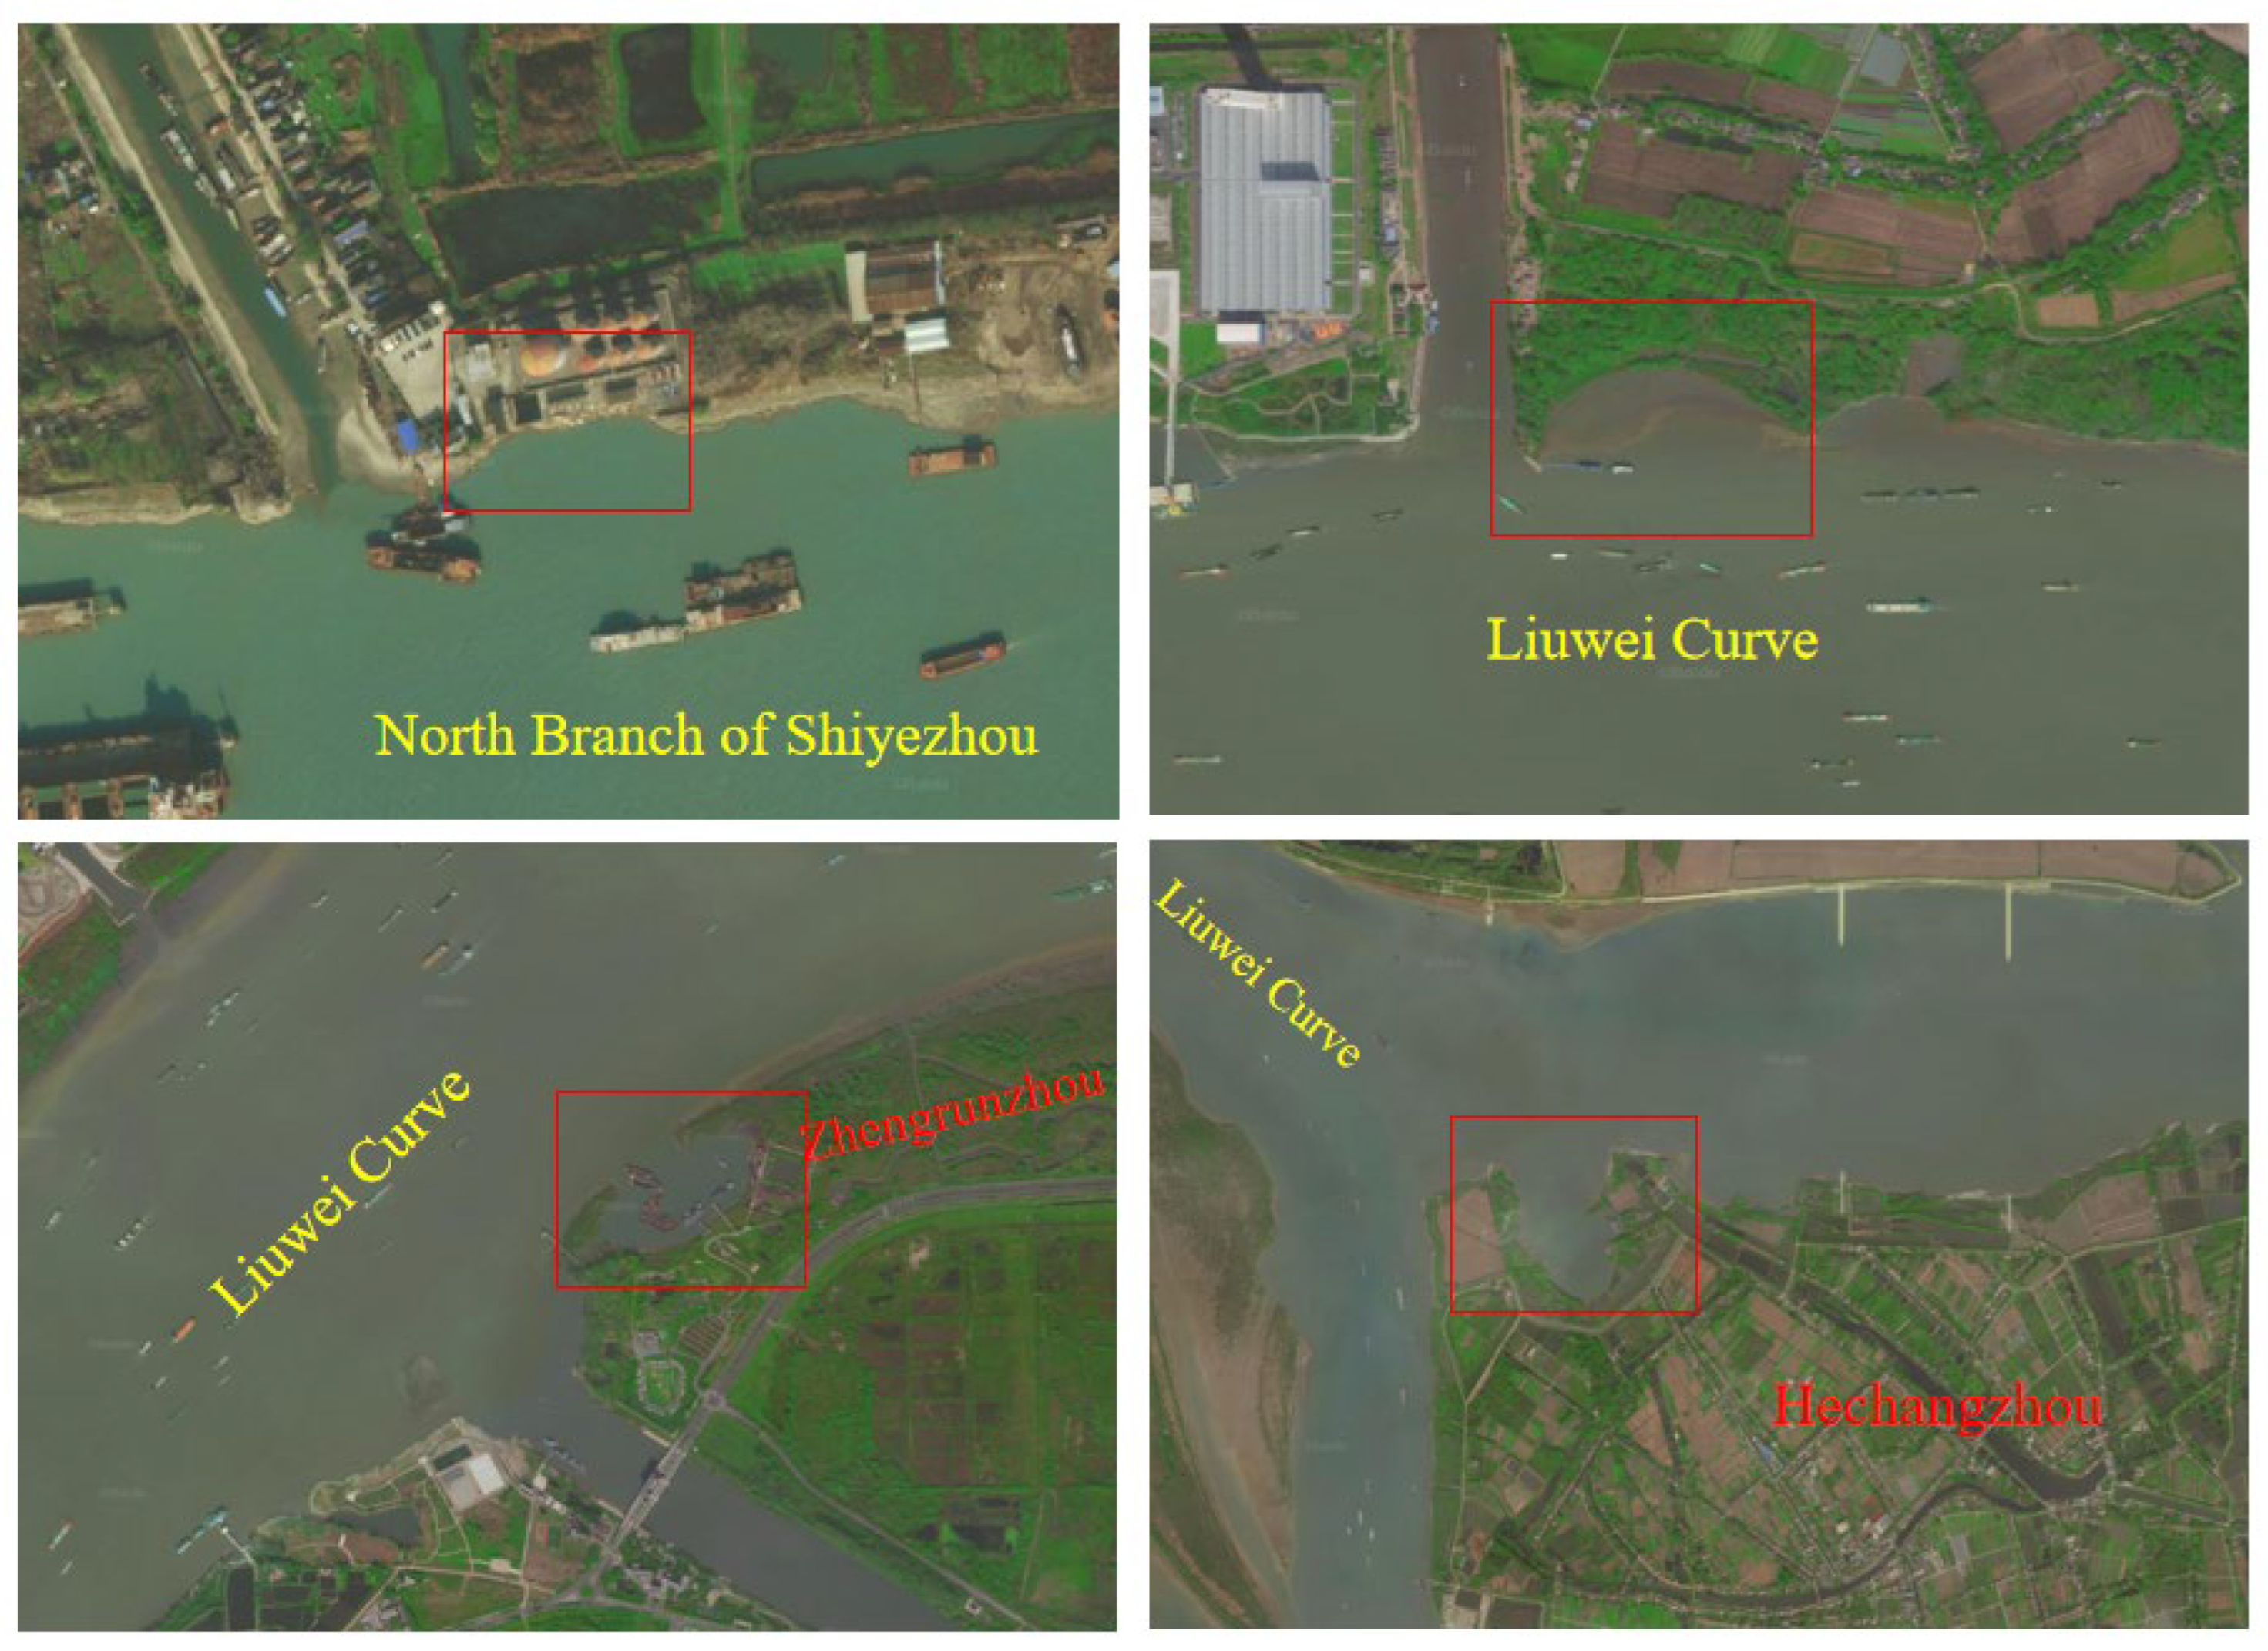
The swing of the river bank makes these dark rivers appear on the current river bank and even be pushed down by the river embankment. There will be a great deal of groundwater in and out of the dark river and will even take away silt, resulting in bank collapse and even embankment collapse into the river, forming an obvious gap on the bank. As shown in Figure 14, several examples of bank collapse show that large-scale bank collapse will lead to increased river width at the bank collapse, resulting in the channel centerline moving to the bank collapse.
At the same time, the two sides of the river are densely populated, and regular floods pose a huge threat to the safety of people’s lives and property. The continuous deposition of Zhenjiang Port has seriously affected the local economic development. Therefore, various river regulation projects have been carried out in the river. These projects have gradually changed the boundary conditions of some river sections and have also had some impacts on the evolution of the river.
For example, the regulation of Zhenjiang port and the expansion of Jiaobei beach will lead to the evolution of the river regime in favor of the development of the South Branch of Hechangzhou. The problem of bank collapse on the north side of Hechangzhou is very active. Although Zhenjiang has carried out a dam project in the left bank of Hechangzhou to solve the problem of diversion ratio, which has a certain effect on improving the diversion ratio, the development of Jiaobei beach is continuing, and the change of river regime determines that it cannot fundamentally solve the problem of diversion ratio in Hechangzhou. Artificial river regulation leads to the development of Jiaobei beach and the narrow channel, which will aggravate the risk of bank collapse.

3.3.2. Changes in Hydrodynamic Conditions

The expansion of the Huaihe River channel and the increase of water quantity have a great influence on the change of the reach hydrodynamic conditions of the Zhenjiang-Yangzhou reach. The Zhenjiang-Yangzhou reach was narrow at both ends and broad in the middle hundreds of years ago. When the river channel changes from a narrow section to a wide section, the kinetic energy in the original mechanical energy of water and sediment flow will be significantly reduced, so the sediment will fall and silt accordingly. When the channel changes from a wide section to a narrow section, the backwater action of the narrow section causes the sediment to fall before the entrance to the narrow section. After the north branch of the Huaihe River enters the river, the water and sediment conditions change, and the main current line of the lower reach of the Zhenjiang-Yangzhou reach gradually moves to the southeast. The west entrance of the north branch and the Yangtze River are supported by each other, and the water flow becomes slow, and the sediment is deposited accordingly, resulting in the continuous shrinkage of the north branch, and the sandbar is parallel to the north, and finally, the north branch evolves into the Jiajiang River. The contraction of the north branch makes the east gate become the main channel of the Huaihe River and gradually evolved into the present channel of the Yangtze River, where the Yangtze River and the Huaihe River meet, making the sediment silt before entering the entrance of the narrow section, and the tail of the large sediment extends southward.
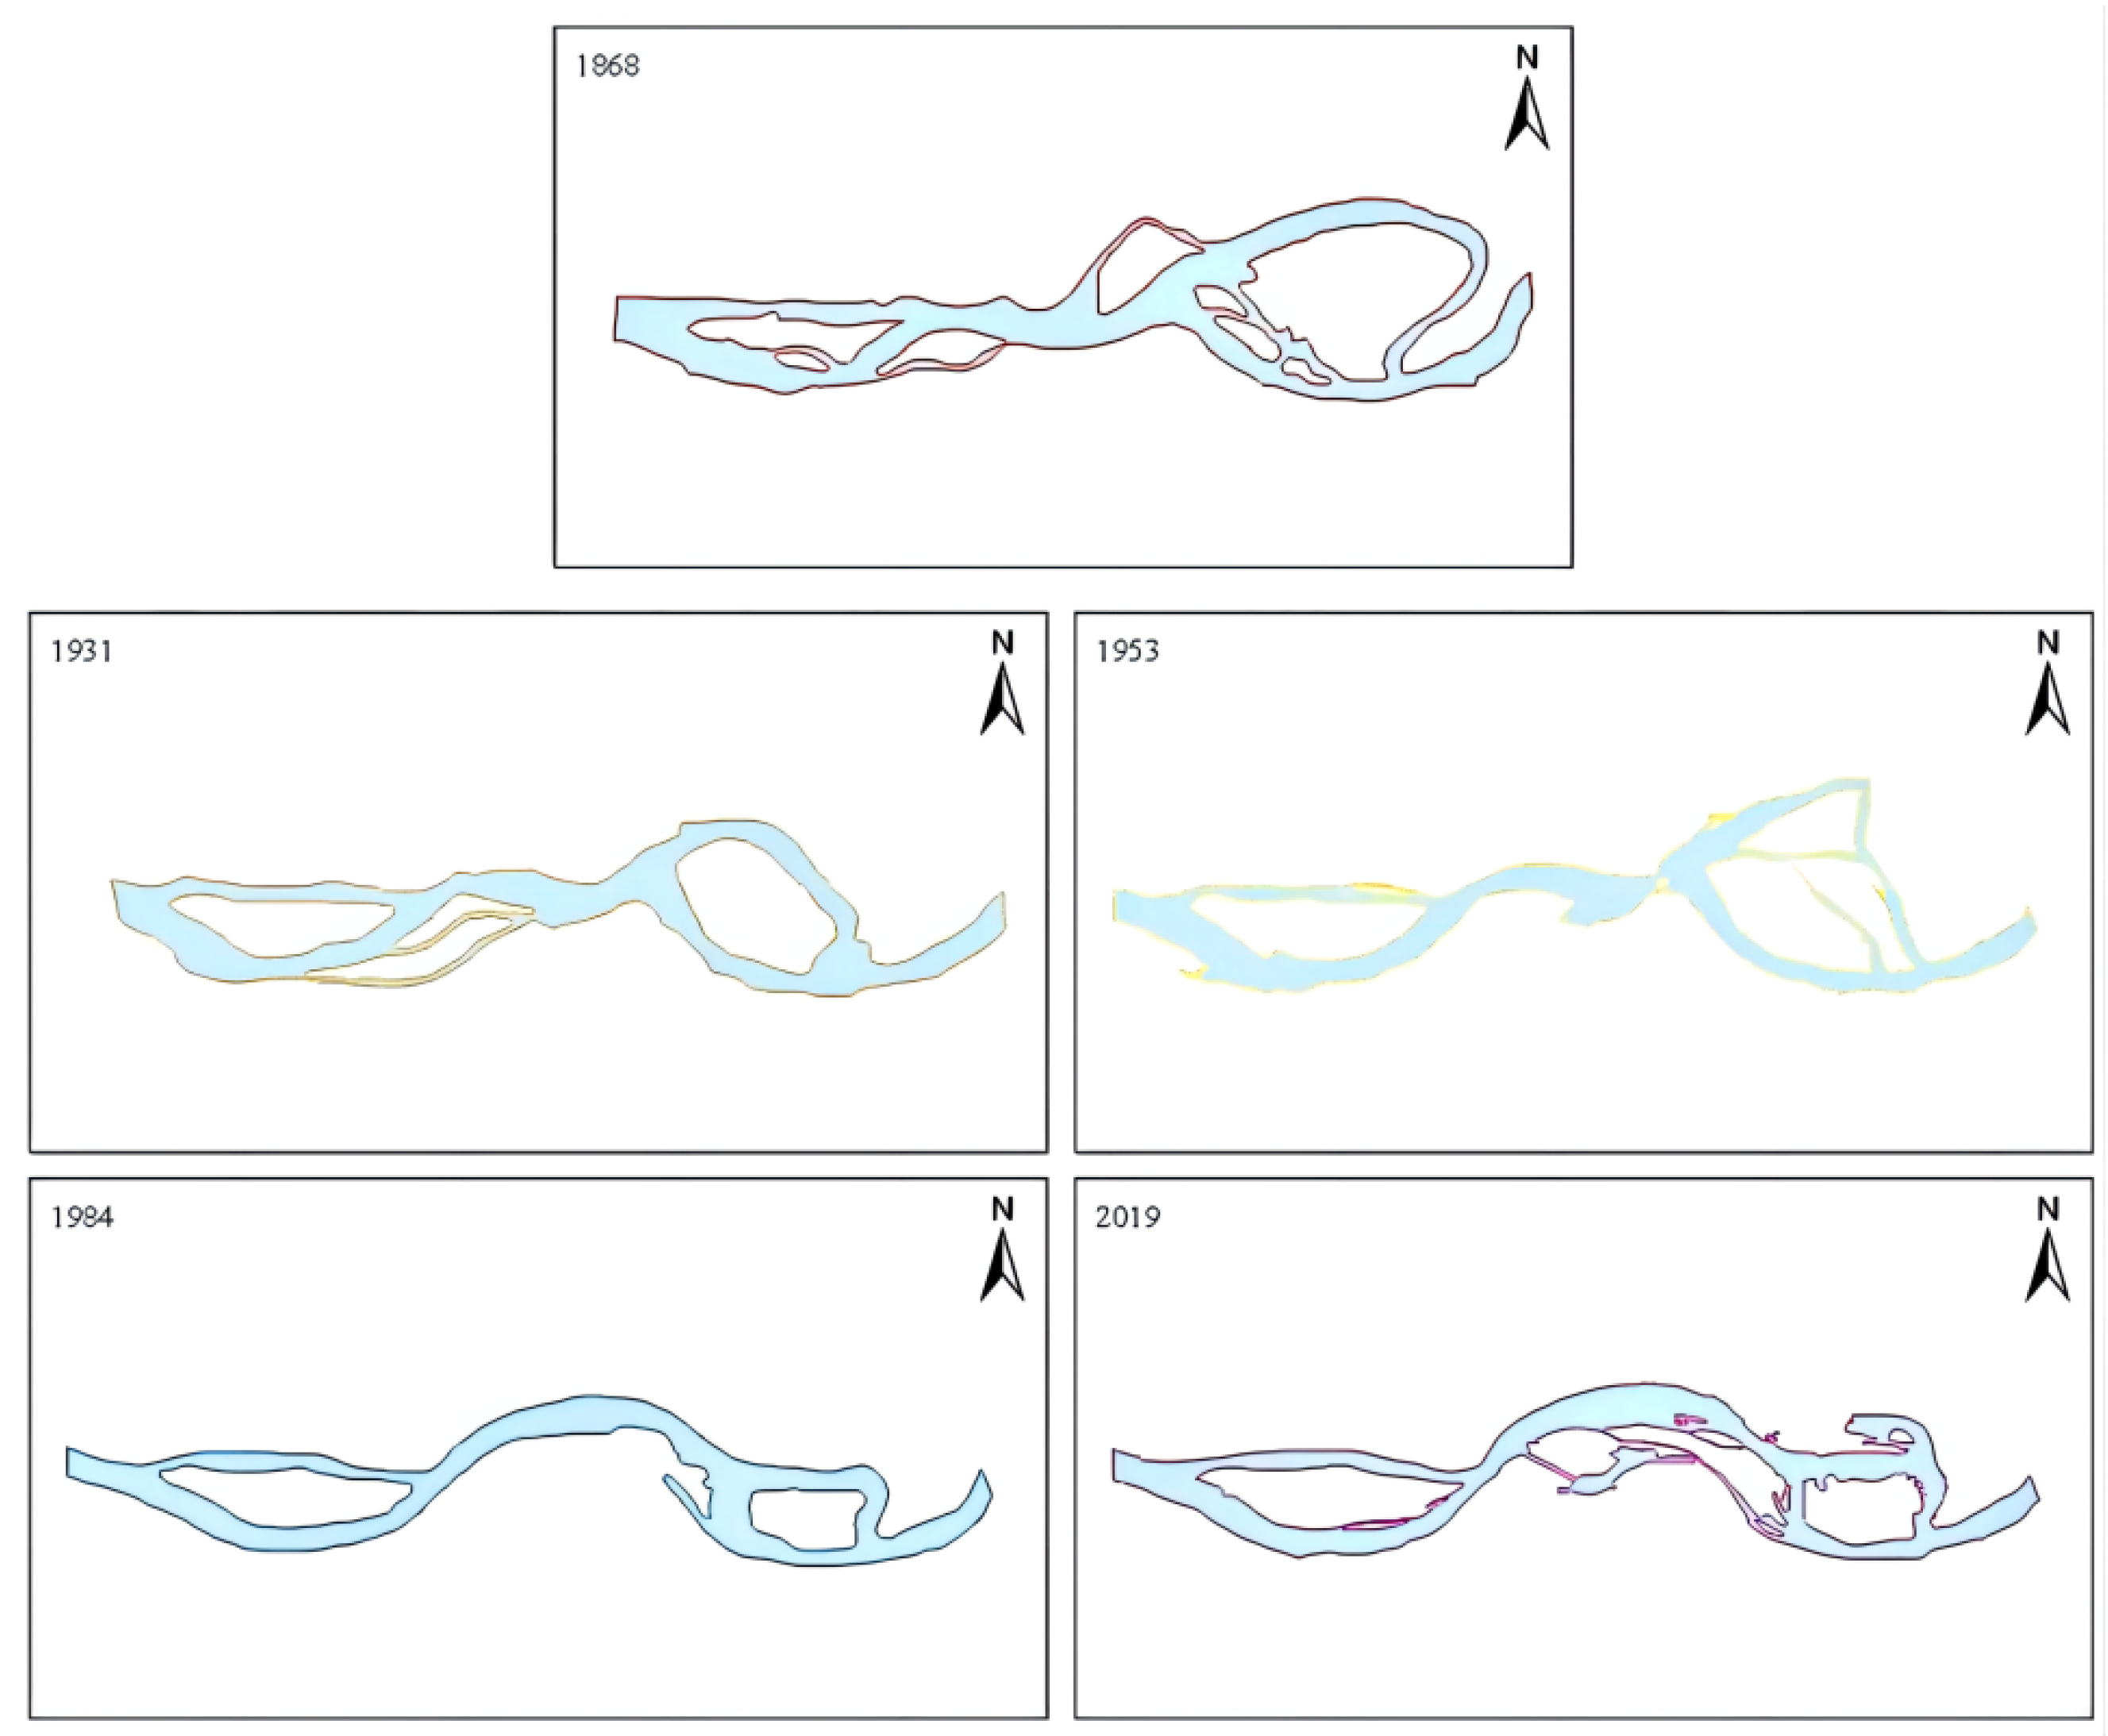
The expansion of the Huaihe River channel and the increase of water quantity have a great influence on the change of hydrodynamic conditions in the Zhenyang reach of the Yangtze River. In 1851, the Huaihe River flood destroyed the Xinli Dam, and now, the Huaihe River flows into the Yangtze River perennially. Zhengkezhou and Shiyezhou, two sandbars from Yizheng to Guazhou in the west reach of the Zhenjiang-Yangzhou reach, moved down rapidly. The upper end of Shiyezhou was concealed by Zhengkezhou and was not scoured. The sedimentation caused by backwater made the upper end rise. The lower end was controlled by Guazhou and Jinshan nodes and stopped the extension, which caused the upper and lower reaches to merge [39]. After crossing Guazhou, the mainstream of the Yangtze River turned to the right bank and then turned to the left bank through the mainstream of Beigu Mountain and Jiao Mountain. On the river surface, Xinzhou, Enyuzhou, and other sandbars were formed, and the formed Jiajiang River continued to bank northward. The river and sandbar information of the Zhenjiang-Yangzhou reach from 1868 to 2019 are digitized (Figure 15).
It can be seen from the figure that since the sandbank outside the estuary of Shiyezhou and Huaihe River merges with the left bank, the river channel changes from straight to curved. The Guazhou area becomes the concave bank, and the Zhenjiang area becomes the convex bank. Under the action of centrifugal force, the lateral circulation of the curved channel develops, and the lateral erosion occurs continuously, and at the same time, it moves downstream. Guazhou was originally the vertex of concave bank. With the downdraft of meandering stream, the east of Guazhou began to be eroded. Zhenrenzhou (the used name of Zhengrunzhou) was originally located in the west of Zhenjiang. Due to the influence of the downdraft of convex bank, Zhenjiang port is gradually covered. After 1868, the evolution of the Zhenjiang-Yangzhou reach was mainly characterized by a gradual change into an “S”-type shape.

3.3.3. Water and Sediment Changes after the Construction of the Three Gorges Dam

Water and sediment processes in the fluvial environment have a significant influence on the Zhenjiang-Yangzhou reach of the Yangtze River [40,41]. According to the results of the Changjiang Water Resources Commission and many other studies [42,43], water and sediment processes were drastically changed in the Zhenjiang-Yangzhou reach after the cutoff of Gezhouba Dam in 1981 and the impoundment of the Three Gorges Reservoir in 2003. A severe decrease in sediment load notably occurred in the Zhenjiang-Yangzhou reach. In general, the reduction of sediment would aggravate the lateral erosion and cause the channel centerline to move towards the eroded side.
Datong Hydrological Station in Chizhou City, Anhui Province, is the control station in the lower reaches of the Yangtze River. According to statistics, there are mainly small tributaries such as the Huaihe River, Chuhe River, Qingyi River, Shuiyang River, and Qinhuai River below Datong Station. The flow into the river in the mainstream section accounts for about 2–3% of the flow of Datong Station. Therefore, the flow and sediment characteristics of Datong Hydrological Station basically represent the characteristics of water and sediment in Zhenyang Reach. As shown in Table 1, since the impoundment of the Three Gorges Reservoir, the distribution and composition of water and sediment in Datong Station have been adjusted and changed to some extent during the year. The average annual runoff in 2003~2020 (after impoundment) is 2.95% less than that in 1950~2002 (before impoundment), and the average annual sediment discharge is 68.6% less than that in 1950~2002 [44]. As shown in Table 1. From the perspective of annual distribution, the inflow and sediment of Datong Station are mainly concentrated in the flood season (May–October). Among them, the inflow and sediment of the Three Gorges Reservoir in the flood season after impoundment account for 67.4% and 78.8% of the whole year, respectively, which are slightly reduced compared with those before impoundment by 3.5% and 8.7%, respectively.
The change of incoming water and sediment caused by the construction of Three Gorges Dam has an important influence on the scouring and silting of the Zhenjiang-Yangzhou reach. Chen Jingru et al. collected underwater topographic maps of Zhenyang reach over the years and used SURFER8 software to calculate scouring and silting. The distribution of scouring and silting changes in this reach is shown in Table 2 [45].
In addition to the siltation of the river channel from 1991 to 1998, the river channel was scoured each year. Over the years, the cumulative scour was 183.57 million m3, with an average brush depth of 1.8 m. The scour area was mainly located in the nearshore area below Siyuangou. Before the completion of the Three Gorges Dam, some rivers in Zhenyang reach were silted. After the completion of the Three Gorges Dam, the erosion became more and more intense. By 2011–2016, all parts of the Zhenjiang-Yangzhou reach had become scoured. In order to avoid severe erosion of the concave bank, two river and shoreline remediation projects have been carried out in the past two decades in the Zhenjiang-yangzhou reach, focusing on the construction or reinforcement of the South Branch of Shiyezhou and Six Curve embankments, repairing the damaged bank sections affected by a large number of bank collapse events, which greatly improves the anti-erosion ability of the concave bank of the river section. The trend of the river in the erosion of the key bank sections in this century has been slowed to a certain extent, and the effect of the revetment project is remarkable.
4. Conclusions and Foresight

In this study, we use multi-source data at different scales, including old maps and satellite images, to study the spatiotemporal changes of the Net Shift Distance, Cumulative Moving Distance, Migration Rate of Channel Centerline, and Linear Regression Change Rate of the channel centerline from 1865 to 2019. The results show that:
(1)
From 1868 to 2019, the channel centerline of the Zhenjiang-Yangzhou reach kept shifting. The average net displacement distance of the section is 1103.47 m on the right bank, and the average cumulative displacement distance of the section is 2790.51 m. The river section with the largest net displacement distance of the channel centerline is the Liuwei Curve, and the smallest is the North Branch of Hechangzhou. The maximum Cumulative Moving Distance of the river center line is North Branch of Hechangzhou, and the minimum is Yizheng Curve.
(2)
According to the NSD and CMD data of each part, it can be found that the long-term movement direction of the channel centerline is basically the same, and a small part of the channel centerline has periodic reverse swing.
(3)
The upstream runoff and sediment conditions of the Zhenjiang-Yangzhou reach of the Yangtze River are unstable and vary greatly. The probability of the channel centerline moving right is about twice that of moving left. At the same time, some rivers have high erosion risk.
(4)
Environmental changes and changes in river boundary conditions caused by human activities, the expansion of the Huaihe River into the Yangtze River, as well as changes in hydrodynamic forces caused by a large number of sandbanks, and changes in river scouring and silting after the completion of the construction of the Three Gorges Dam will affect the movement of the channel centerline in the Zhenyang reach.
This study proposes a calculation procedure to extract the channel centerline from a braided reach and study its changes. This calculation procedure selected Arcgis 10.5 as the implementation environment. The advantages of this calculation procedure are simple, efficient, and versatile. Computers will not have too much memory load, computational efficiency is relatively high, and accuracy and accuracy can be guaranteed. This method can also be understood as a standardized process for obtaining multi-source river channel change data, and the goal of this method can also be achieved by using other software. The method of this study can also be applied to other similar rivers with a long history of human activities and high density. In addition, based on the theoretical knowledge or research methods of natural geography, geology, geographic information science, and historical geography, this study reveals the changing trend of the river course change of the Yangtze River-Yangzhou reach of the Yangtze River and the complexity and difference of the river course change in space from the macro and micro perspectives and discusses the potential impact of human activities on river course change. The results enrich people’s understanding of the long-term changes of a braided reach in the lower reaches of the Yangtze River and have certain guiding significance for river regulation, navigation safety, and revetment construction.
Of course, this study also has many deficiencies to be improved. First of all, for the Landsat medium-resolution remote sensing image used in this study, the satellite source is relatively single, and the resolution is slightly low, resulting in some errors in the extraction of Bankline; finally, the channel centerline generated there contains some errors. Secondly, the tidal Yangzhou reach of the Yangtze River is a channel weakly affected by the tide. Due to the difficulty in obtaining tidal information, the tidal level correction was not carried out in this study. Future research can combine higher resolution remote sensing images to obtain clearer shoreline contour, eliminate the influence of tides, and improve the output accuracy of the bankline and channel centerline. In addition, more on-site observation and investigation interviews should be carried out on the bank of the Yangzhou reach of the Yangtze River to confirm the specific influence of the production activities of many docks and industrial and mining enterprises on the bank, the ship traveling wave of the passing ships and the river, and shoreline renovation project on the change of river boundary conditions, which are also the main research objectives of the next stage.

Author Contributions

Conceptualization, methodology, and writing—original draft preparation, C.L. (Cunli Liu); data curation, B.L.; software, C.L. (Changfeng Li); visualization, B.L., S.J. and G.W.; supervision and funding acquisition, B.L. and Z.Z. All authors have read and agreed to the published version of the manuscript.

Funding

This research was funded by National Natural Science Foundation of China (No. 41371024) and Nanjing University Doctoral Promotion Program (No. 202101B035) and Jiangsu Water Conservancy Science and Technology Project (No. 2015081).

Institutional Review Board Statement

Not applicable.

Informed Consent Statement

Not applicable.

Data Availability Statement

The data presented in this study are available on request from the author. The data are not publicly available due to privacy. Images employed for the study will be available online for readers.

Conflicts of Interest

The authors declare no conflict of interest.

References

  1. Lake, P.S. Ecological effects of perturbation by drought in flowing waters. Freshw. Biol. 2003, 48, 1161–1172. [Google Scholar] [CrossRef]
  2. Alderman, K.; Turner, L.R.; Tong, S.L. Floods and human health: A systematic review. Remote Sens. Environ. 2012, 140, 23–35. [Google Scholar] [CrossRef] [PubMed]
  3. Song, G.F. Evaluation on water resources and water ecological security with 2-tuple linguistic information. Int. J. Knowl. Based Intell. Eng. Syst. 2019, 23, 1–8. [Google Scholar] [CrossRef]
  4. Liu, X.; Shi, C.; Zhou, Y.; Gu, Z.; Li, H. Response of Erosion and Deposition of Channel Bed, Banks and Floodplains to Water and Sediment Changes in the Lower Yellow River, China. Water 2019, 11, 357. [Google Scholar] [CrossRef]
  5. Xia, J.; Wang, Y.; Zhou, M.; Deng, S.; Li, Z.; Wang, Z. Variations in Channel Centerline Migration Rate and Intensity of a Braided Reach in the Lower Yellow River. Remote Sens. 2021, 13, 1680. [Google Scholar] [CrossRef]
  6. Eixoto, J.M.A.; Nelson, B.W.; Wittmann, F. Spatial and temporal dynamics of river channel migration and vegetation in central Amazonian white-water floodplains by remote-sensing techniques. Remote Sens. Environ. 2009, 113, 2258–2266. [Google Scholar]
  7. Szombara, S.; Lewińska, P.; Żądło, A.; Róg, M.; Maciuk, K. Analyses of the Prądnik riverbed Shape Based on Archival and Contemporary Data Sets—Old Maps, LiDAR, DTMs, Orthophotomaps and Cross-Sectional Profile Measurements. Remote Sens. 2020, 12, 2208. [Google Scholar] [CrossRef]
  8. Ghoshal, S.; James, L.A.; Singer, M.B.; Aalto, R. Channel and floodplain change analysis over a 100-year period: Lower Yuba river, California. Remote Sens. 2010, 2, 1797–1825. [Google Scholar] [CrossRef]
  9. de Musso, N.M.; Capolongo, D.; Caldara, M.; Surian, N.; Pennetta, L. Channel changes and controlling factors over the past 150 years in the Basento river (southern Italy). Water 2020, 12, 307. [Google Scholar] [CrossRef]
  10. Magliulo, P.; Valente, A. GIS-Based geomorphological map of the Calore River floodplain near Benevento (Southern Italy) overflooded by the 15th October 2015 event. Water 2020, 12, 148. [Google Scholar] [CrossRef]
  11. Priestnall, G.; Aplin, P. Cover: Spatial and temporal remote sensing requirements for river monitoring. Int. J. Remote Sens. 2006, 27, 2111–2120. [Google Scholar]
  12. Arnesen, A.S.; Silva, T.S.; Hess, L.L.; Novo, E.M.; Rudorff, C.M.; Chapman, B.D.; McDonald, K.C. Monitoring flood extent in the lower Amazon River floodplain using ALOS/PALSAR ScanSAR images. Remote Sens. Environ. 2013, 130, 51–61. [Google Scholar] [CrossRef]
  13. Rozo, M.G.; Nogueira, A.C.R.; Castro, C.S. Remote sensing-based analysis of the planform changes in the upper Amazon River over the period 1986–2006. J. S. Am. Earth Sci. 2014, 51, 28–44. [Google Scholar] [CrossRef]
  14. Rozo, M.G.; Nogueira, A.C.; Truckenbrodt, W. The anastomosing pattern and the extensively distributed scroll bars in the middle Amazon River. Earth Surf. Process. Landf. 2012, 37, 1471–1488. [Google Scholar] [CrossRef]
  15. Miao, C.; Ni, J.; Borthwick, A.G.L. Recent changes of water discharge and sediment load in the Yellow River basin, China. Prog. Phys. Geogr. Earth Environ. 2010, 34, 541–561. [Google Scholar] [CrossRef]
  16. Ma, Y.; Huang, H.Q.; Nanson, G.C.; Li, Y.; Yao, W. Channel adjustments in response to the operation of large dams: The upper reach of the lower Yellow River. Geomorphology 2012, 147–148, 35–48. [Google Scholar] [CrossRef]
  17. Xia, J.; Li, X.; Zhang, X.; Li, T. Recent variation in reach-scale bankfull discharge in the Lower Yellow River. Earth Surf. Process. Landf. 2013, 39, 723–734. [Google Scholar] [CrossRef]
  18. Julien, P.; Tuzson, J. River Mechanics. Appl. Mech. Rev. 2003, 56, B30–B31. [Google Scholar] [CrossRef]
  19. Chen, J.-G.; Zhou, W.-H.; Chen, Q. Reservoir Sedimentation and Transformation of Morpho-Logy in the Lower Yellow River during 10 Year’s Initial Operation of the Xiaolangdi Reservoir. J. Hydrodyn. 2012, 24, 914–924. [Google Scholar] [CrossRef]
  20. Richard, G.A.; Julien, P.Y.; Baird, D.C. Case Study: Modeling the Lateral Mobility of the Rio Grande below Cochiti Dam, New Mexico. J. Hydraul. Eng. 2005, 131, 931–941. [Google Scholar] [CrossRef]
  21. Kong, D.; Latrubesse, E.M.; Miao, C.; Zhou, R. Morphological response of the Lower Yellow River to the operation of Xiaolangdi Dam, China. Geomorphology 2020, 350, 106931. [Google Scholar] [CrossRef]
  22. Cheng, Y.; Xia, J.; Zhou, M.; Deng, S.; Li, D.; Li, Z.; Wan, Z. Recent variation in channel erosion efficiency of the Lower Yellow River with different channel patterns. J. Hydrol. 2022, 610, 127962. [Google Scholar] [CrossRef]
  23. Yang, X. Evolution and Cause Analysis of Sandbanks in the Center of the Yangtze River from 1570 to 1971. J. Geogr. 2020, 75, 1512–1522. (In Chinese) [Google Scholar]
  24. Liu, X.; Pine, T.; Li, Z. Research on river evolution and regulation of Zhenyang reach in the lower reaches of the Yangtze River. J. Yangtze River Acad. Sci. 2011, 28, 1–9. (In Chinese) [Google Scholar]
  25. Lu, L.; Liao, X.; Huang, W. Discussion on river channel evolution and control measures of Zhenyang reach of the Yangtze River. People’s Yangtze River 2009, 40, 9–11+58+110. (In Chinese) [Google Scholar]
  26. Chen, F.; Fu, Z.; Yang, F. Influence of river regime change on channel conditions in Zhenyang reach of the Yangtze River. Water Transp. Proj. 2011, 6, 112–116. (In Chinese) [Google Scholar]
  27. Wang, J.; Fan, H.; Zhu, L.; Ying, H. Analysis on hydrodynamic improvement measures of Hechangzhou branch deepwater channel regulation right branch. Water Transp. Proj. 2014, 9, 11–17. (In Chinese) [Google Scholar]
  28. Zhenjiang Municipal Bureau of Water Resources. Yangtze River. Available online: http://http://slj.zhenjiang.gov.cn/slj/hczhhjj/201806/ef443afe8e4349d38d0a1d469353ab08.shtml (accessed on 15 June 2018).
  29. Wang, Z.; Chen, Z.; Li, M.; Chen, J.; Zhao, Y. Variations in downstream grain-sizes to interpret sediment transport in the middle-lower Yangtze River, China: A pre-study of Three-Gorges dam. Geomorphology 2009, 113, 217–229. [Google Scholar] [CrossRef]
  30. Luan, H.; Liu, T.; Huang, W. The morphological evolution and trend of typical channel in the lower reaches of the Yangtze River under water and sediment conditions. J. Yangtze Acad. Sci. 2018, 3, 7–12. (In Chinese) [Google Scholar]
  31. Wang, X.; Tang, L.; Ding, X. The river bed evolution in Zhenyang reach of Yangtze River is analyzed by GIS. Sediment Study 2008, 6, 68–73. (In Chinese) [Google Scholar]
  32. Zhang, X.; Xie, R.; Fan, D.; Yang, Z.; Wang, H.; Wu, C.; Yao, Y. Sustained growth of the largest uninhabited alluvial island in the Changjiang Estuary under the drastic reduction of river discharged sediment. Sci. China (Earth Sci.) 2021, 64, 1687–1697. (In Chinese) [Google Scholar] [CrossRef]
  33. Zhu, H. Jiangdu County Chronicles; Jiangsu People’s Publishing House: Nanjing, China, 1996; pp. 47–49. [Google Scholar]
  34. Wu, S. Harvard University Library Unpublished History of Old Customs in China; Guangxi Normal University Press: Guilin, China, 2014; pp. 13–38. [Google Scholar]
  35. Institute of Modern History, Central Research Institute. Available online: https://map.rchss.sinica.edu.tw/cgi-bin/gs32/gsweb.cgi/login?o=dwebmge&cache=1652927698637 (accessed on 3 September 2021).
  36. University of Texas Library. Available online: https://maps.lib.utexas.edu/maps/china.html (accessed on 7 September 2021).
  37. Yang, C.; Cai, X.; Wang, X.; Yan, R.; Zhang, T.; Lu, X. Remotely Sensed Trajectory Analysis of Channel Migration in Lower Jingjiang Reach during the Period of 1983–2013. Remote Sens. 2015, 7, 16241–16256. [Google Scholar] [CrossRef]
  38. Zhang, R.; Xie, J. Sedimentation Research in China; China Water and Power Press: Beijing, China, 1993; pp. 75–98. [Google Scholar]
  39. Chen, J.; Yun, C. Channel process of the Changjiang River lower reach (from Nanjing to Wusong). Acta Geogr. Sin. 1959, 25, 221–239. [Google Scholar]
  40. Leopold, L.B.; Wolman, M.G. River Channel Patterns: Braided, Meandering, and Straight; US Government Printing Office: Washington, DC, USA, 1957.
  41. Kumar, M.; Kumar, P.; Kumar, A.; Elbeltagi, A.; Kuriqi, A. Modeling stage–discharge–sediment using support vector machine and artificial neural network coupled with wavelet transform. Appl. Water Sci. 2022, 12, 87. [Google Scholar] [CrossRef]
  42. Xu, K.; Milliman, J.D. Seasonal variations of sediment discharge from the Yangtze River before and after impoundment of the Three Gorges dam. Geomorphology 2009, 104, 276–283. [Google Scholar] [CrossRef]
  43. Changjiang Water Resources Commission. Changjiang Sediment Bulletin; Changjiang Press: Wuhan, China, 2012. [Google Scholar]
  44. Dong, W.; Zhang, Y.; Zhang, L.; Chen, N.; Zou, Y.; Du, Y.; Liu, J. Study of the Three Gorges Dam’s Impact on the Discharge of Yangtze River during Flood Season after Its Full Operation in 2009. Water 2022, 14, 1052. [Google Scholar] [CrossRef]
  45. Chen, J.; Tian, Z.; Zhang, M. Analysis on the causes of bank collapse in the happy estuary section of the left branch of Shiyezhou in Zhenyang reach of the Yangtze River. Water Conserv. Constr. Manag. 2021, 41, 12–15. (In Chinese) [Google Scholar]
Figure 1. Location of the area of study (a) in Eastern China, (b) Southwestern Jiangsu Province, the apex of the Yangtze River Delta, and (c) the junction of Zhenjiang and Yangzhou.
Water 14 02478 g001
Figure 2. Flowchart of used data and methods.
Water 14 02478 g002
Figure 3. Map of the channel centerline and section position in Zhenyang Reach in different ages and related parameters.
Water 14 02478 g003
Figure 4. Changes of NSD and CMD of the channel centerline in Zhenjiang-Yangzhou reach. (a) Yizheng Curve; (b) North Branch of Shiyezhou; (c) South Branch of Shiyezhou; (d) Liuwei Curve; (e) North Branch of Hechangzhou; (f) South Branch of Hechangzhou; (g) Dagang Curve.
Water 14 02478 g004
Figure 5. The Migration Rate of Channel Centerline, Linear Regression Change Rate, and erosion risk identification on Yizheng Curve.
Water 14 02478 g005
Figure 6. The Migration Rate of Channel Centerline, Linear Regression Change Rate, and erosion risk identification on North Branch of Shiyezhou.
Water 14 02478 g006
Figure 7. The Migration Rate of Channel Centerline, Linear Regression Change Rate, and erosion risk identification on south branch of Shiyezhou.
Water 14 02478 g007
Figure 8. The Migration Rate of Channel Centerline, Linear Regression Change Rate, and erosion risk identification on Liuwei Curve.
Water 14 02478 g008
Figure 9. The Migration Rate of Channel Centerline, Linear Regression Change Rate, and erosion risk identification on North Branch of Hechangzhou.
Water 14 02478 g009
Figure 10. The Migration Rate of Channel Centerline, Linear Regression Change Rate, and erosion risk identification on South Branch of Hechangzhou.
Water 14 02478 g010
Figure 11. The Migration Rate of Channel Centerline, Linear Regression Change Rate, and erosion risk identification on Dagang Curve.
Water 14 02478 g011
Figure 12. Mud fracture structure of floodplain near Zhengrunzhou.
Water 14 02478 g012
Figure 13. Pores in middle layer, sand layer, and plant root of columnar sample.
Water 14 02478 g013
Figure 14. Typical bank collapse cases in Zhenyang Reach.
Water 14 02478 g014
Figure 15. Changes of water areas and rivers in the upper reaches of the Yangtze River in Zhenjiang from 1868 to 2019.
Water 14 02478 g015
Table 1. Annual average value statistics of flow and sediment at Dotong Station.
TimesFlowSediment Load
Before water storage28700 m3/s427 million tons
After water storage (2003–2020)27800 m3/s134 million tons
Table 2. Annual average value statistics of flow and sediment at Dotong Station.
Year1991–19981998–20012001–20062006–20112011–2016
Yizheng Curve1111.9−1253.0−776.7−339.7−578.2
North Branch of Shiyezhou1037.2−1158.1−1053.3−2735.4−1376.1
South Branch of Shiyezhou1936.0210.3−556.8−212.6−445.4
Confluence reach−209.5666.5411.9−803.5−371.6
Liuwei Curve−1084.3103.1701.8−1471.2−2104.7
Before shunt−1240.5325.6266.5−710.7−34.2
North Branch of Hechangzhou−2420.2−1704.0809.0−1161.7−1700.6
South Branch of Hechangzhou2068.1437.6677.6121.8−1399.4
Dagang Curve618.3−687.7−166.5−482.9−571.3
Total1817.1−3059.6646.7−7795.8−8581.5
Publisher’s Note: MDPI stays neutral with regard to jurisdictional claims in published maps and institutional affiliations.