Article

Evolution of Sustainable Water Resource Utilization in Hunan Province, China

1
College of Geography and Tourism, Hengyang Normal University, Hengyang 421002, China
2
Cooperative Innovation Center for Digitalization of Cultural Heritage in Traditional Villages and Towns, Hengyang Normal University, Hengyang 421002, China
3
International Centre on Space Technologies for Natural and Cultural Heritage (HIST), Hengyang Base, Hengyang 421002, China
4
Hunan Climate Center, Changsha 410118, China
5
School of Geography Science, Hunan Normal University, Changsha 410081, China
*
Author to whom correspondence should be addressed.
Water 2022, 14(16), 2477; https://doi.org/10.3390/w14162477
Submission received: 30 June 2022 / Revised: 8 August 2022 / Accepted: 8 August 2022 / Published: 11 August 2022
(This article belongs to the Special Issue Isotope Tracers in Watershed Hydrology)

Abstract

:
The demand for social and economic development has promoted research into water resources. The combined effects of natural conditions and human activities on regional water resource usage are not well understood. The sustainable utilization of water resources was assessed in terms of supply (e.g., precipitation) and demand (e.g., ecological water resources footprint (EFw)) sides in Hunan Province, China, from 2010 to 2019. The results showed that: (1) on the supply side, water resources were increased across Hunan Province. The spatial patterns of total water resources are significantly heterogeneous, with high values in the east and south, which are mainly affected by precipitation; (2) on the demand side, evapotranspiration was great in areas with high vegetation coverage. The EFw was high in relatively developed areas. The mean percentage of agricultural EFw remained dominant at approximately 60% with a steady decreasing trend, while that of eco-environmental EFw increased; and (3) the sustainable utilization of water resources in Hunan Province is generally rational. Moreover, the potential for water resource development and utilization is really significant in eastern and southern Hunan Province. The findings are beneficial in providing an important scientific basis for policymaking relating to the efficient utilization of regional water resources.

1. Introduction

Water resources are essential for human survival and socio-economic development [1]. Many cities have exceeded their sustainable limits as a result of a failure to properly manage water resource systems, posing a serious social and economic dilemma [2]. This is especially true when decisions that degrade hydrological ecosystems are based on political and financial considerations rather than hydrological ones [3]. In this sense, the evolution of sustainable water resource utilization is very important for environmental and natural resource research [4,5]. This is conducive to establishing or reforming economic and environmental policy and achieving reasonable allocation and sustainable use of water resources under a changing climate.
A recent review 1 highlighted that co-evolution of human-water systems should be the focus of future hydrological research. Emphasis should be placed on understanding the combined effects of climate change and human activities on hydrological processes and water resources across temporal and spatial scales. The Intergovernmental Panel on Climate Change indicated that a global warming of 1.5 °C will be exceeded during the 21st century and that the global climate system is experiencing rapid and extensive changes [6]. Temperature plays an important role across the entire hydrological cycle [7]. The frequency and/or intensity of extreme weather, i.e., flood and drought, is expected to increase in the near future [8,9], affecting the distribution of water resources on both temporal and spatial scales [10,11]. Water resources can be directly attributable to global warming, solar radiation, and atmospheric CO2 [12]. Furthermore, previous studies [13,14] have concluded that local water resources are influenced by tree restoration through their effects on radiation balance, infiltration and soil water storage, evapotranspiration (ET), streamflow, and precipitation. Many studies [15,16,17] have consistently concluded that tree planting increases annual evaporation and decreases streamflow.
The hydrological cycle is also profoundly affected by human activities and socio-economic development 1. In recent years, the rapid process of urbanization has caused some environmental problems, such as air and water pollution, land desertification, and biodiversity loss in many parts of the world, including China [18,19]. As a result of its rapid expansion and urbanization transition, China is confronted by severe water issues today, such as in the Yellow River Basin [20] and the upper Yangtze River [21]. China ranks 121st in the world in terms of per capita water resource availability, accounting for only a quarter of the global average, with insufficient water supply in over 400 cities [22]. Natural freshwater resource shortages are one of the top issues associated with the process of urbanization in two-thirds of Chinese cities [23]. Although it can be argued that there is sufficient precipitation in south China, freshwater resource trade-offs between environmental protection and development are likely to be inevitable in the future [24]. Hunan Province is such an example; it was ranked 9th among the 31 provinces of Chinese mainland in terms of gross domestic product (GDP) in 2020. The overall vegetation coverage temporal trend in this area has increased based on the Global Inventory Modeling and Mapping Studies 3 g Normalized Differential Vegetation Index [25]. The percentage of forest cover was 59.96% in 2020, up 0.06% from the previous year based on the data from Hunan Forestry Bureau (http://lyj.hunan.gov.cn/ (accessed on 10 May 2022)). The dynamics and sustainable utilization of water resources in this province are therefore worth exploring.
Many methods are available for achieving the sustainable utilization of water resources and for meeting regional water use demands, such as the analytical hierarchy process [26], data envelopment analysis [27], and evaluation index system method [28]. Fan [29] developed the water resources ecological footprint (hereafter EFw) model to quantify water consumption by human activities based on the concept of an ecological footprint [30,31]. The EFw model is used to calculate the human utilization of environmental resources from the demand side, and the carrying capacity of the ecological environment from the supply side (namely, the carrying capacity of water ecological resources, hereafter ECw), and analyze the sustainable development of the ecological environment on different scales by comparing them both. This provides a reliable means for comprehensively evaluating the sustainable utilization of water resources [23]. The EFw model has been widely used for estimating the sustainability of water resources in China, such as in Zhejiang Province [32], Shandong Province [33], and the Poyang Lake Basin [34], because it is closely related to population and economic development [35].
However, the quantitative characteristics of water resource use in a region are determined not only by anthropogenic factors, including the socio-economic development level, population size, and area of the territory served, but also by physiographic conditions, such as climate change. Their interaction determines the volume and structure of water resource use, as well as its dynamics and development patterns [36]. Therefore, both climatic and anthropogenic factors on the supply and demand sides should be considered when studying the sustainable utilization of water resources.
Against this backdrop, the objectives of this study were: (1) to explore the spatial and temporal variability of water resources on the supply side in Hunan Province, China; (2) to analyze the climatic and anthropogenic demand side of water resources in this province; and (3) to estimate the sustainability of water resources utilization in the target area. The overall findings of this study will be meaningful to deeply understand the combined effects of both climate change and human activities in terms of supply and demand sides on regional water resources utilization. The paper is structured as follows. Section 2 describes the study area, followed by data resources and methods. Section 3 introduces the results of water resource utilization in terms of both supply and demand. Discussion and Conclusion are presented in Section 4 and Section 5, respectively.

2. Materials and Methods

2.1. Study Area

Hunan Province lies between 24°39′ N and 30°08′ N to 108°47′ E and 114°15′ E in south China, in the middle reaches of the Yangtze River, covering an area of 21.18 × 10⁴ km2 (Figure 1a). It is tilted from west to east, with Xuefeng Mountain to the west and Dongting Lake to the north. It has a subtropical monsoon climate, characterized by hot and wet summers, and cold and dry winters [37], with a mean air temperature of 19 °C and average annual precipitation of 1953 mm. In 2019, it had a total population of 6.9 × 10⁷, a GDP of 4.05 × 10¹² Chinese yuan (CNY), and total water resources of 2.1 × 10¹¹ m3 based on the Hunan Statistical Yearbook (http://tjj.hunan.gov.cn/ (accessed on 12 March 2022)). This province includes 14 prefecture-level cities: Changsha, Zhuzhou, Xiangtan, Hengyang, Changde, Yueyang, Yiyang, Shaoyang, Loudi, Yongzhou, Chenzhou, Zhangjiajie, Huaihua, and Xiangxi. A basic overview of these 14 prefecture-level cities is shown in Figure 1b,c. Environmental (e.g., topography and natural resources) and societal (e.g., population and technology) differences among these cities have led to unbalanced socio-economic development in this province. Changsha is the capital city of Hunan Province; its per capita GDP is several times that of other cities. Some cities in southern and western Hunan Province, such as Xiangxi, Yongzhou, Huaihua, and Shaoyang, are subject to heavy economic growth pressure.

2.2. Data Sources

Precipitation data for the period 2010–2019 were collected from 96 weather stations of Hunan Province, obtained from the Hunan Climate Center. Annual precipitation (mm/year) was the sum of the daily precipitation of a year at each weather station. The inverse distance weight interpolation method was used to obtain the spatial distribution of annual precipitation in Hunan Province.
The MOD16 ET product was produced by the Moderate Resolution Imaging Spectroradiometer (USA) based on the improved Penman-Monteith approach by [38,39]. It showed superior performance with an 80–90% accuracy using the global measurements of FLUXNET towers [38,39]. Annual ET data with a spatial resolution of 500 m in Hunan Province were downloaded from the National Aeronautics and Space Administration MOD16A3 remote sensing dataset (https://ladsweb.modaps.eosdis.nasa.gov/ (accessed on 20 July 2021)). The Moderate Resolution Imaging Spectroradiometer Reprojection Tools were employed for extraction, format conversion, map projection transformation, and image mosaic. Image clipping in bulk using the boundary of Hunan Province was completed in ERDAS IMAGINE (USA). The MOD16 dataset uses specific values to mark areas such as cities, frozen soil, ice and snow, bare land, and water bodies, but does not calculate ET values. Therefore, these areas were excluded here by “Setting Null” in ArcGIS software. The real ET values were calculated with MOD16A3 data multiplied by the scaled factor (equaling 0.1).
The total volume of water consumption, including agricultural, industrial, domestic, and ecological water consumption, and the total amount of water resources, including surface water and ground water resources for each city were taken from the Water Resources Bulletin from each of the prefecture-level cities in Hunan Province from 2010 to 2019 (published by the Water Resources Conservancy Bureau of the prefecture-level cities). Population data and GDP were obtained from the Hunan Statistical Yearbook, published by the Hunan Provincial Bureau of Statistics.

2.3. Water Resources Ecological Footprint Model

The EFw model is widely used to study the temporal and spatial evolution of the ecological characteristics of water resources because of its intuitive concept, and strong maneuverability and regional comparability. It can be used to objectively reveal the relationship between natural resources and economic development and describe the metabolic intensity and consumption level of regional water resources. According to the description of the water resources ecological footprint, the ecological footprint converts the amount of water resources consumed into the production area of the corresponding account and divides by the water resources land area. After balancing, it finally obtains the equilibrium value that can be compared with different cities worldwide. The calculation model of the water resources’ ecological footprint can be expressed by the following formula [29,40]:
E F w = γ * ( W / P w )
where EFw (hm2) is water resources’ ecological footprint; γ is the global equivalence factor of water resources, divided by the average ecological productivity of various types of biological production areas worldwide. γ is the same for all countries, which was determined here as 5.19 based on the results of the World Wide Fund for Nature Earth Report (2002). W is water consumption (m3) usually comprising four types, namely agricultural, industrial, domestic, and ecological water consumption [41]; and Pw is the average global production capacity of water resources (m3/hm2). Based on [40], Pw equals 3140 m3/hm2.

2.4. Water Resources Ecological Carrying Capacity Model

The ecological carrying capacity of water resources (ECw) based on the ecological footprint model refers to the maximum sustainable utilization capacity of water resources that can meet the ecological water demand and maintain the limited development goal with regional socio-economic development. The water resources carrying capacity model [29] is shown as follows,
E C w = α * γ * Φ * ( Q / P w )
where ECw (hm2) is the regional water resources carrying capacity, Φ is the yield factor of regional water resources, equaling the ratio of the average production capacity of regional water resources (P, m3/hm2) to the average production capacity of global water resources (Pw), i.e., Φ = P/Pw. P is the ratio of the total amount of regional water resources in the calculation period (V, m3) to the area of the region (S, hm2). Q (m3) is the total regional water resources. α is the biodiversity compensation coefficient (expressed as the amount of water resources, deducted to sustain the ecological environment and biodiversity). The empirical coefficient of 0.4 proposed by [40] showed good applicability in analyzing the sustainable utilization of water resources in humid areas at different spatial scales in China [28].

2.5. Water Ecological Pressure Index

The water ecological pressure index (WEPI) 41 was adopted to indicate the sustainable utilization of water resources. It is the ratio of the water ecological footprint to the water ecological carrying capacity, and is calculated as:
E C w = α * γ * Φ * ( Q / P w )
The smaller the value of WEPI, the greater the profit of water resources in a certain region. A WEPI within the range of 0–0.5 indicates that the utilization of water resources is completely sustainable. A WEPI between 0.5 and 0.8 indicates a safe state and between 0.8 and 1 an unsafe state. If the WEPI is greater than 1, the utilization of water resources is unsustainable [41].

2.6. The 10,000 CNY GDP Water Ecological Footprint

The 10,000 CNY GDP water resources ecological footprint (hereafter WGDP, hm2/10,000 CNY) is an index used to evaluate the efficiency of sustainable water resource utilization. It can be expressed as [42]:
W GDP = E F w GDP
where the smaller the value, the greater efficiency of water resource utilization.

3. Results

3.1. Water Resource Supply

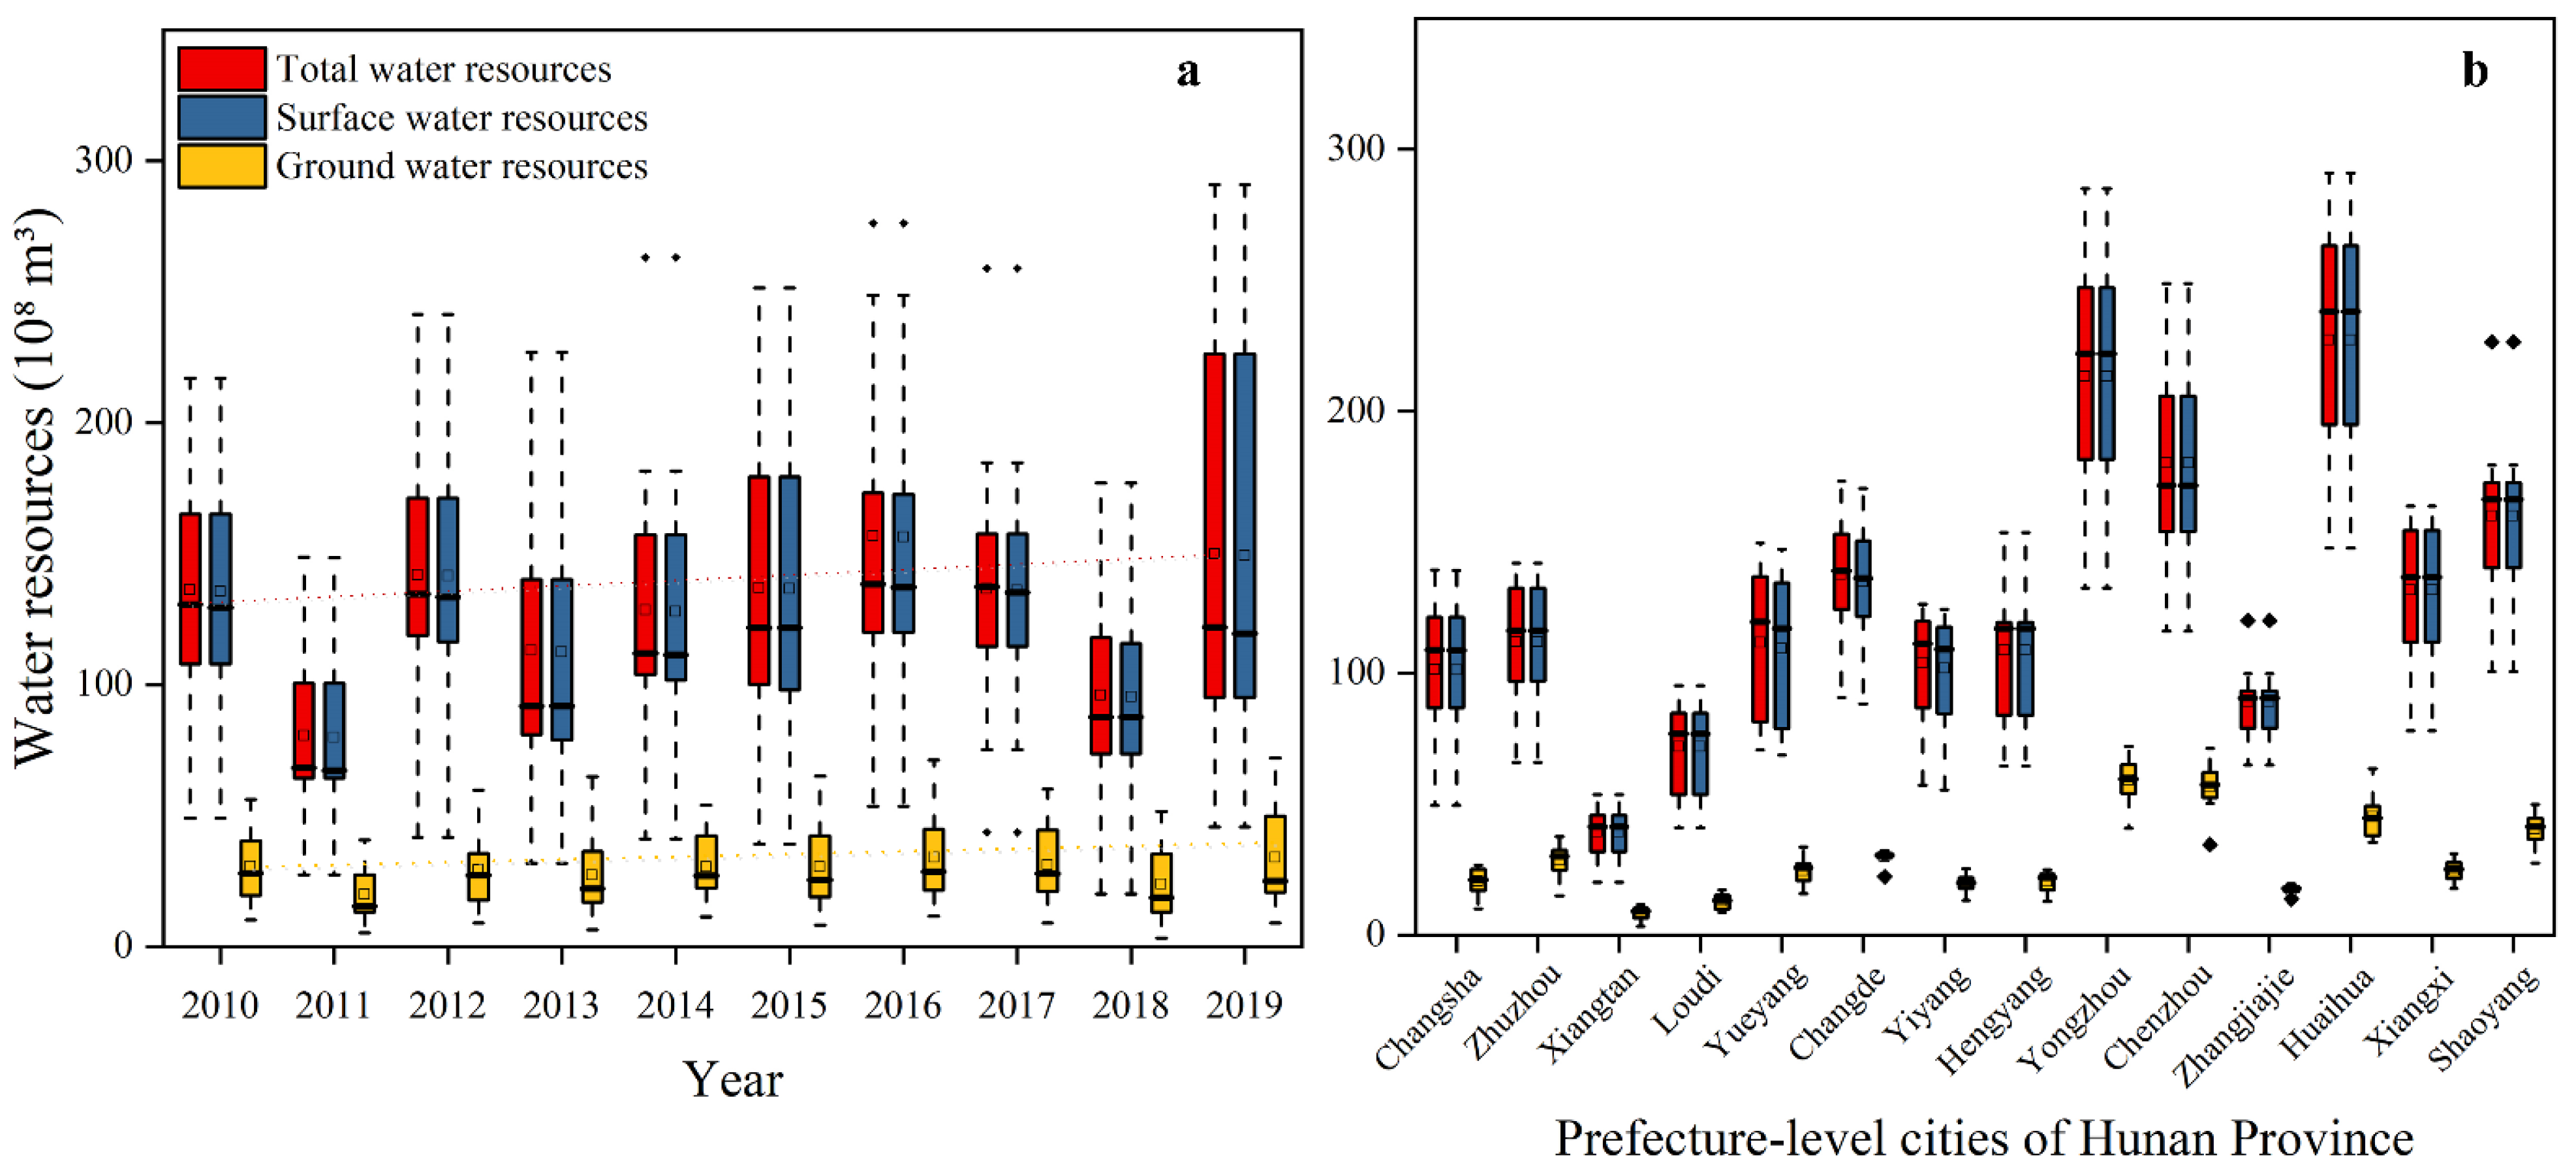
The calculation of total water resources can reflect the supply of water resources, which is the sum of surface water and groundwater resources, and the deduction of the repeated calculation between them. The dynamic water volume of “natural runoff” such as rivers, lakes, glaciers, and other surface water bodies refers to the amount of surface water resources. The recharge of precipitation and surface water into groundwater is classed as groundwater resources. Figure 2a shows the dynamics of the annual total water resources, surface water resources, and groundwater resources of the 14 prefecture-level cities in Hunan Province from 2010 to 2019. The amount of surface water resources was significantly greater (more than three-fold) than that of groundwater resources. Surface water resources were the dominant component of the total water resources in each year. The amount of annual total water resources was between 150 × 108 m3 and 250 × 108 m3, with an average of 178 × 108 m3 from 2010 to 2019. It was relatively low in 2011, 2013, and 2018, with mean values < 100 × 108 m3. Figure 2a reveals an increasing trend of both surface water resources and groundwater resources during this period. All three types of water resources varied within a large range in 2019, while their mean values remained stable, compared with those in other years. This indicates that there was significant spatial heterogeneity across these prefecture-level cities, rather than a dramatic increase in the whole province in this year.
The spatial patterns of the total water resources, surface water resources, and groundwater resources of the 14 prefecture-level cities are shown in Figure 2b. It also shows that surface water resources dominated the total water resources of all cities in Hunan Province. There was an obvious spatial heterogeneity in all types of water resources in Hunan Province. The highest values were located in southern Hunan Province, such as in Yongzhou, Chenzhou, and Shaoyang. The lowest values were recorded in the central area such as Changsha, Zhuzhou, and Xiangtan. The amount of total water resources and surface water resources of most cities, i.e., Changsha, Zhuzhou, Yueyang, Changde, Hengyang, Xiangxi, and Shaoyang, fluctuated around 100 × 108 m3, while that of Yongzhou, Chenzhou, and Huaihua varied over a wide range from 150 × 108 m3 to 300 × 108 m3, more than three-fold that of western cities, such as Xiangtan and Zhangjiajie.
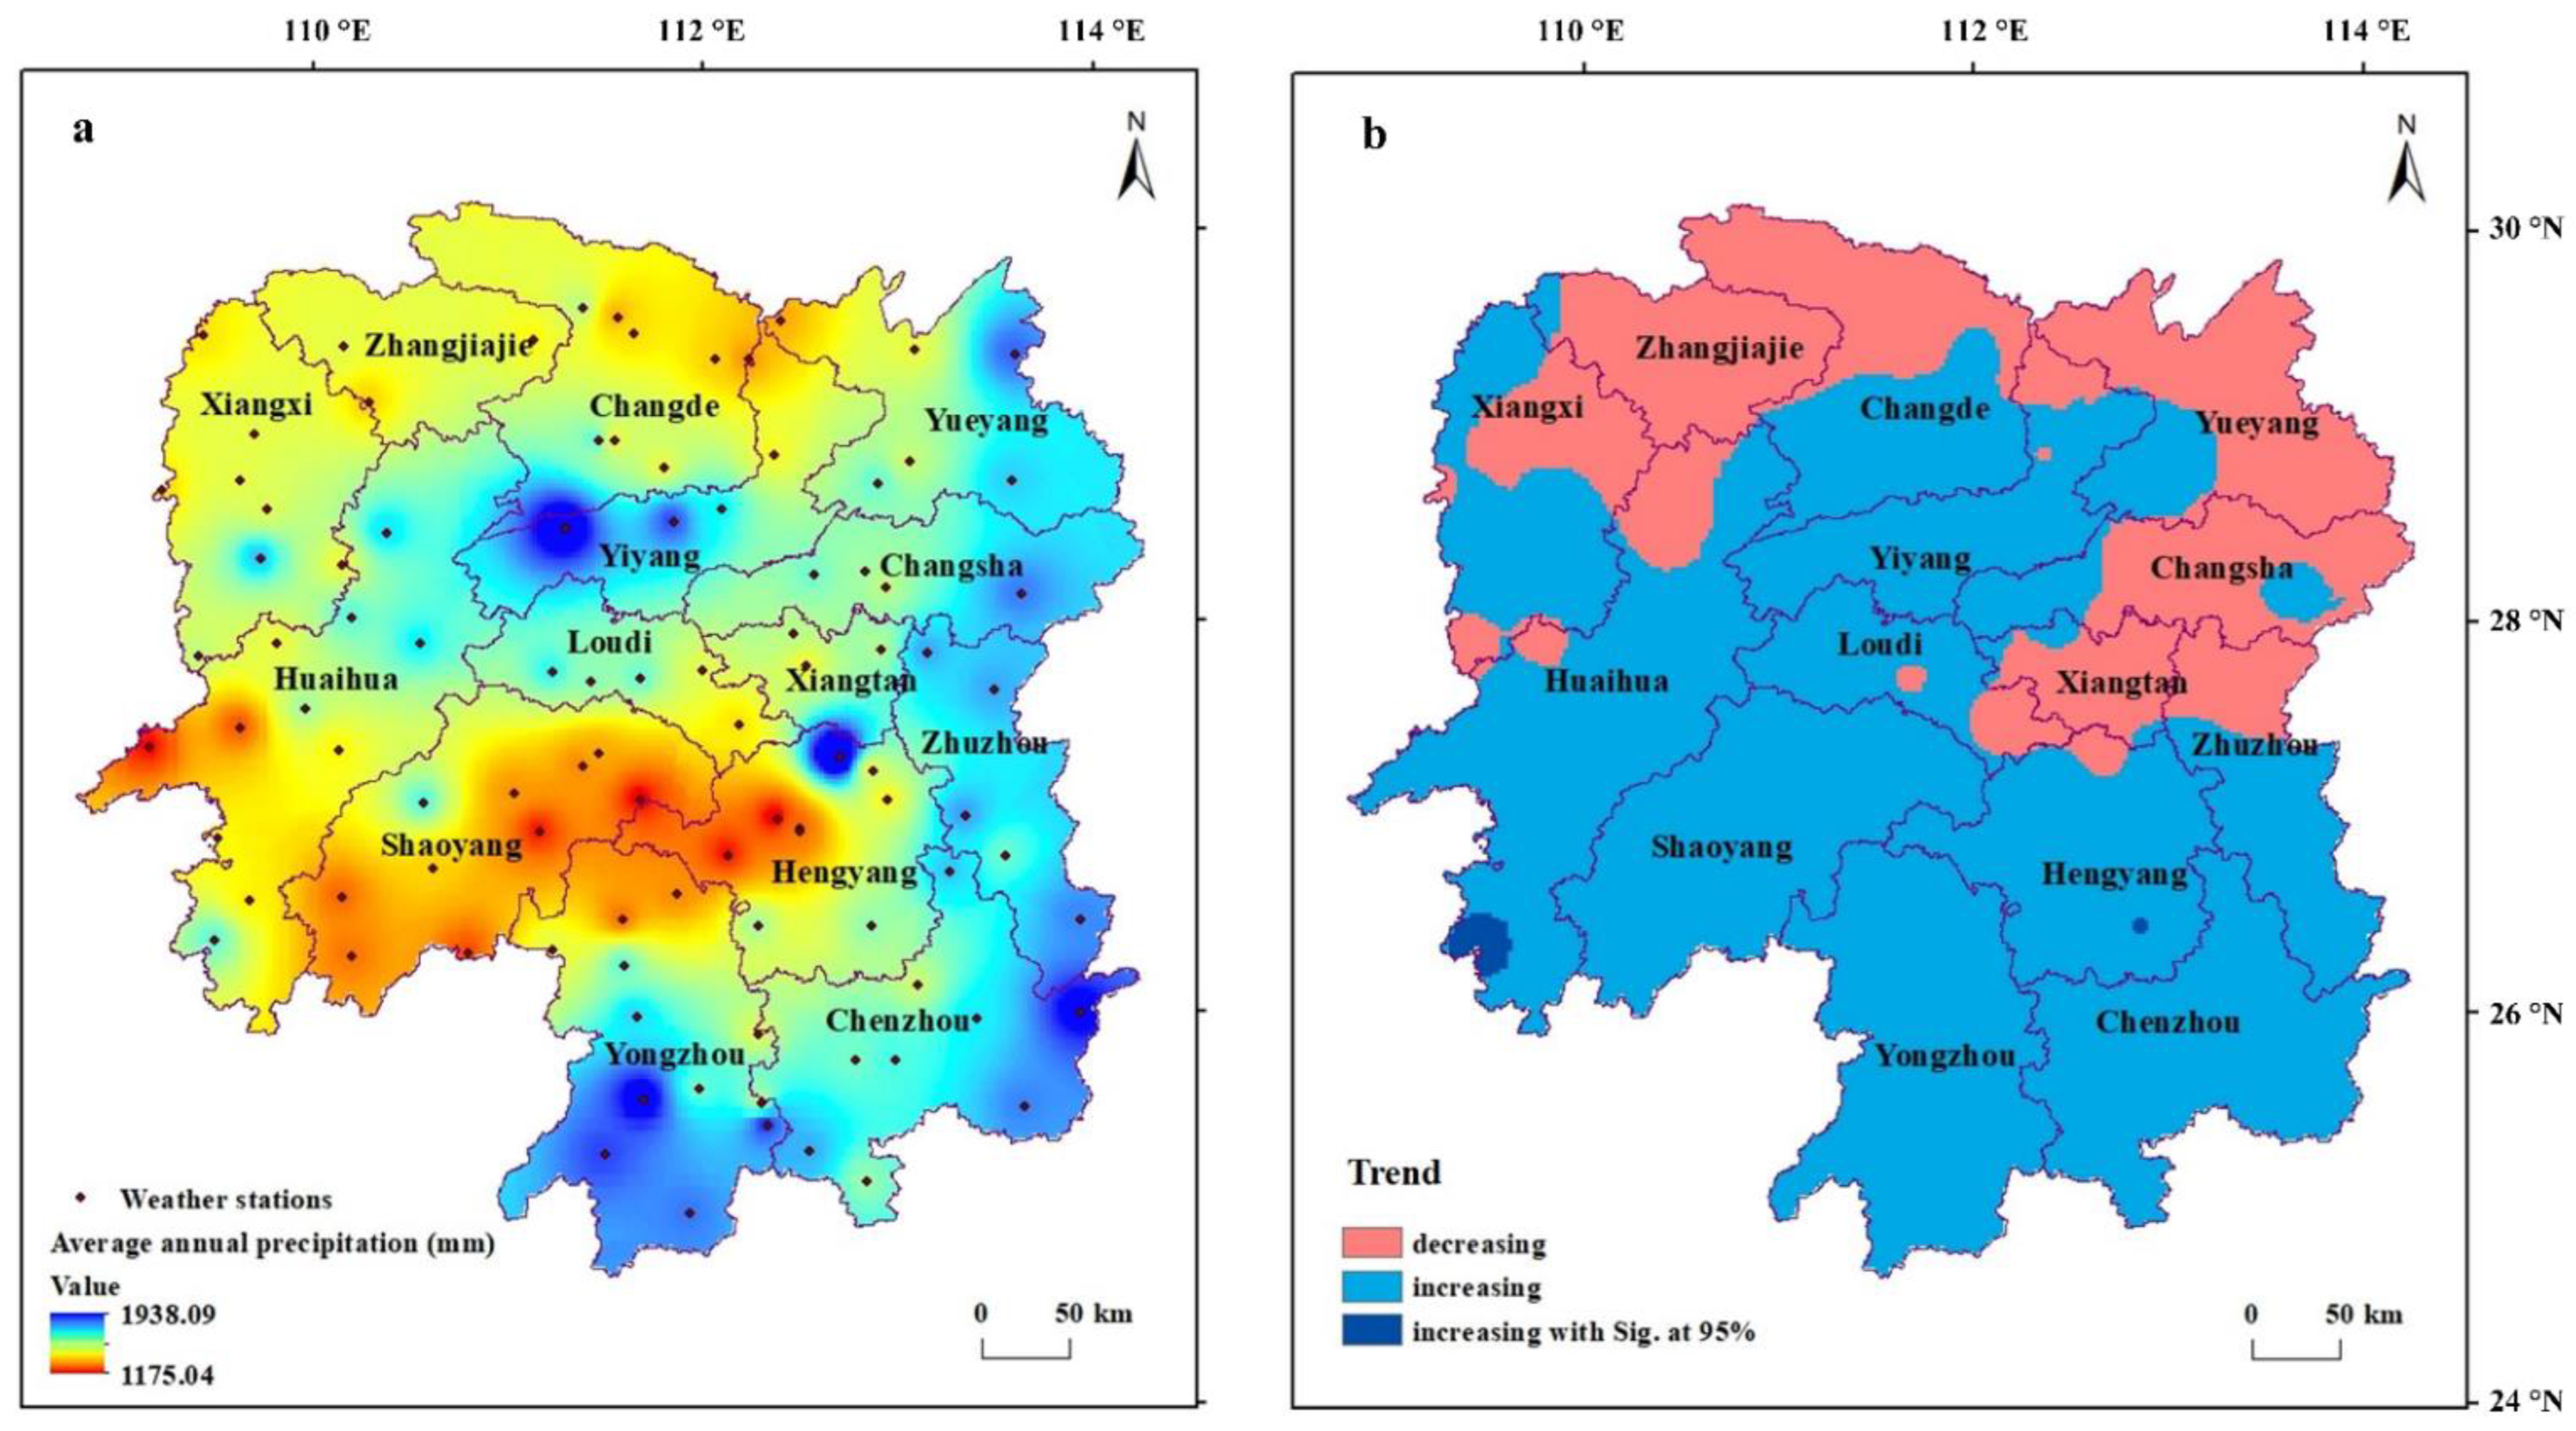
Precipitation is the primary source of freshwater in Hunan Province. Analyzing precipitation in terms of temporal and spatial patterns is important for understanding the variations in water resource supply in this region. The average annual precipitation in Hunan Province was within the range of 1175–1939 mm/year (Figure 3a). High values of average annual precipitation were concentrated in the south and east, with low values in the north and west. Both the lowest and the highest average annual precipitation rates were recorded in Hengyang: 1175.04 mm (weather station No. 57871 in Hengnan county) and 1938.65 mm (weather station No. 57776 at Nanyue Hengshan Mountain). Based on the DEM in Figure 1b, the spatial characteristics of precipitation were influenced by the local topography to a certain degree, with significantly higher precipitation in mountainous areas (e.g., Hengshan Mountain, Nanling Mountains in south Hunan Province, and Luoxiao Mountains in the east) than that in plain and basin areas (e.g., weather station No. 57871 in Hengyang basin). In particular, Hengyang and Shaoyang are located in Hengyang Basin, named the drought corridor of Hunan Province [43]. Based on the results of the slope and F test in Figure 3b, the annual precipitation showed an insignificant increasing trend in most regions of Hunan Province, including the prefecture-level cities such as parts of Huaihua, Shaoyang, Yongzhou, Hengyang, Chenzhou, Zhuzhou, Yiyang, and Changde. There was a small part of the region located in the south of Hengyang and Huaihua that showed a significant increasing trend within a 95% confidence interval (p < 0.05). While the average annual precipitation in northern Hunan Province, such as in Zhangjiajie, Xiangtan, and Changsha, showed an insignificant decreasing trend.

3.2. Water Resource Demand

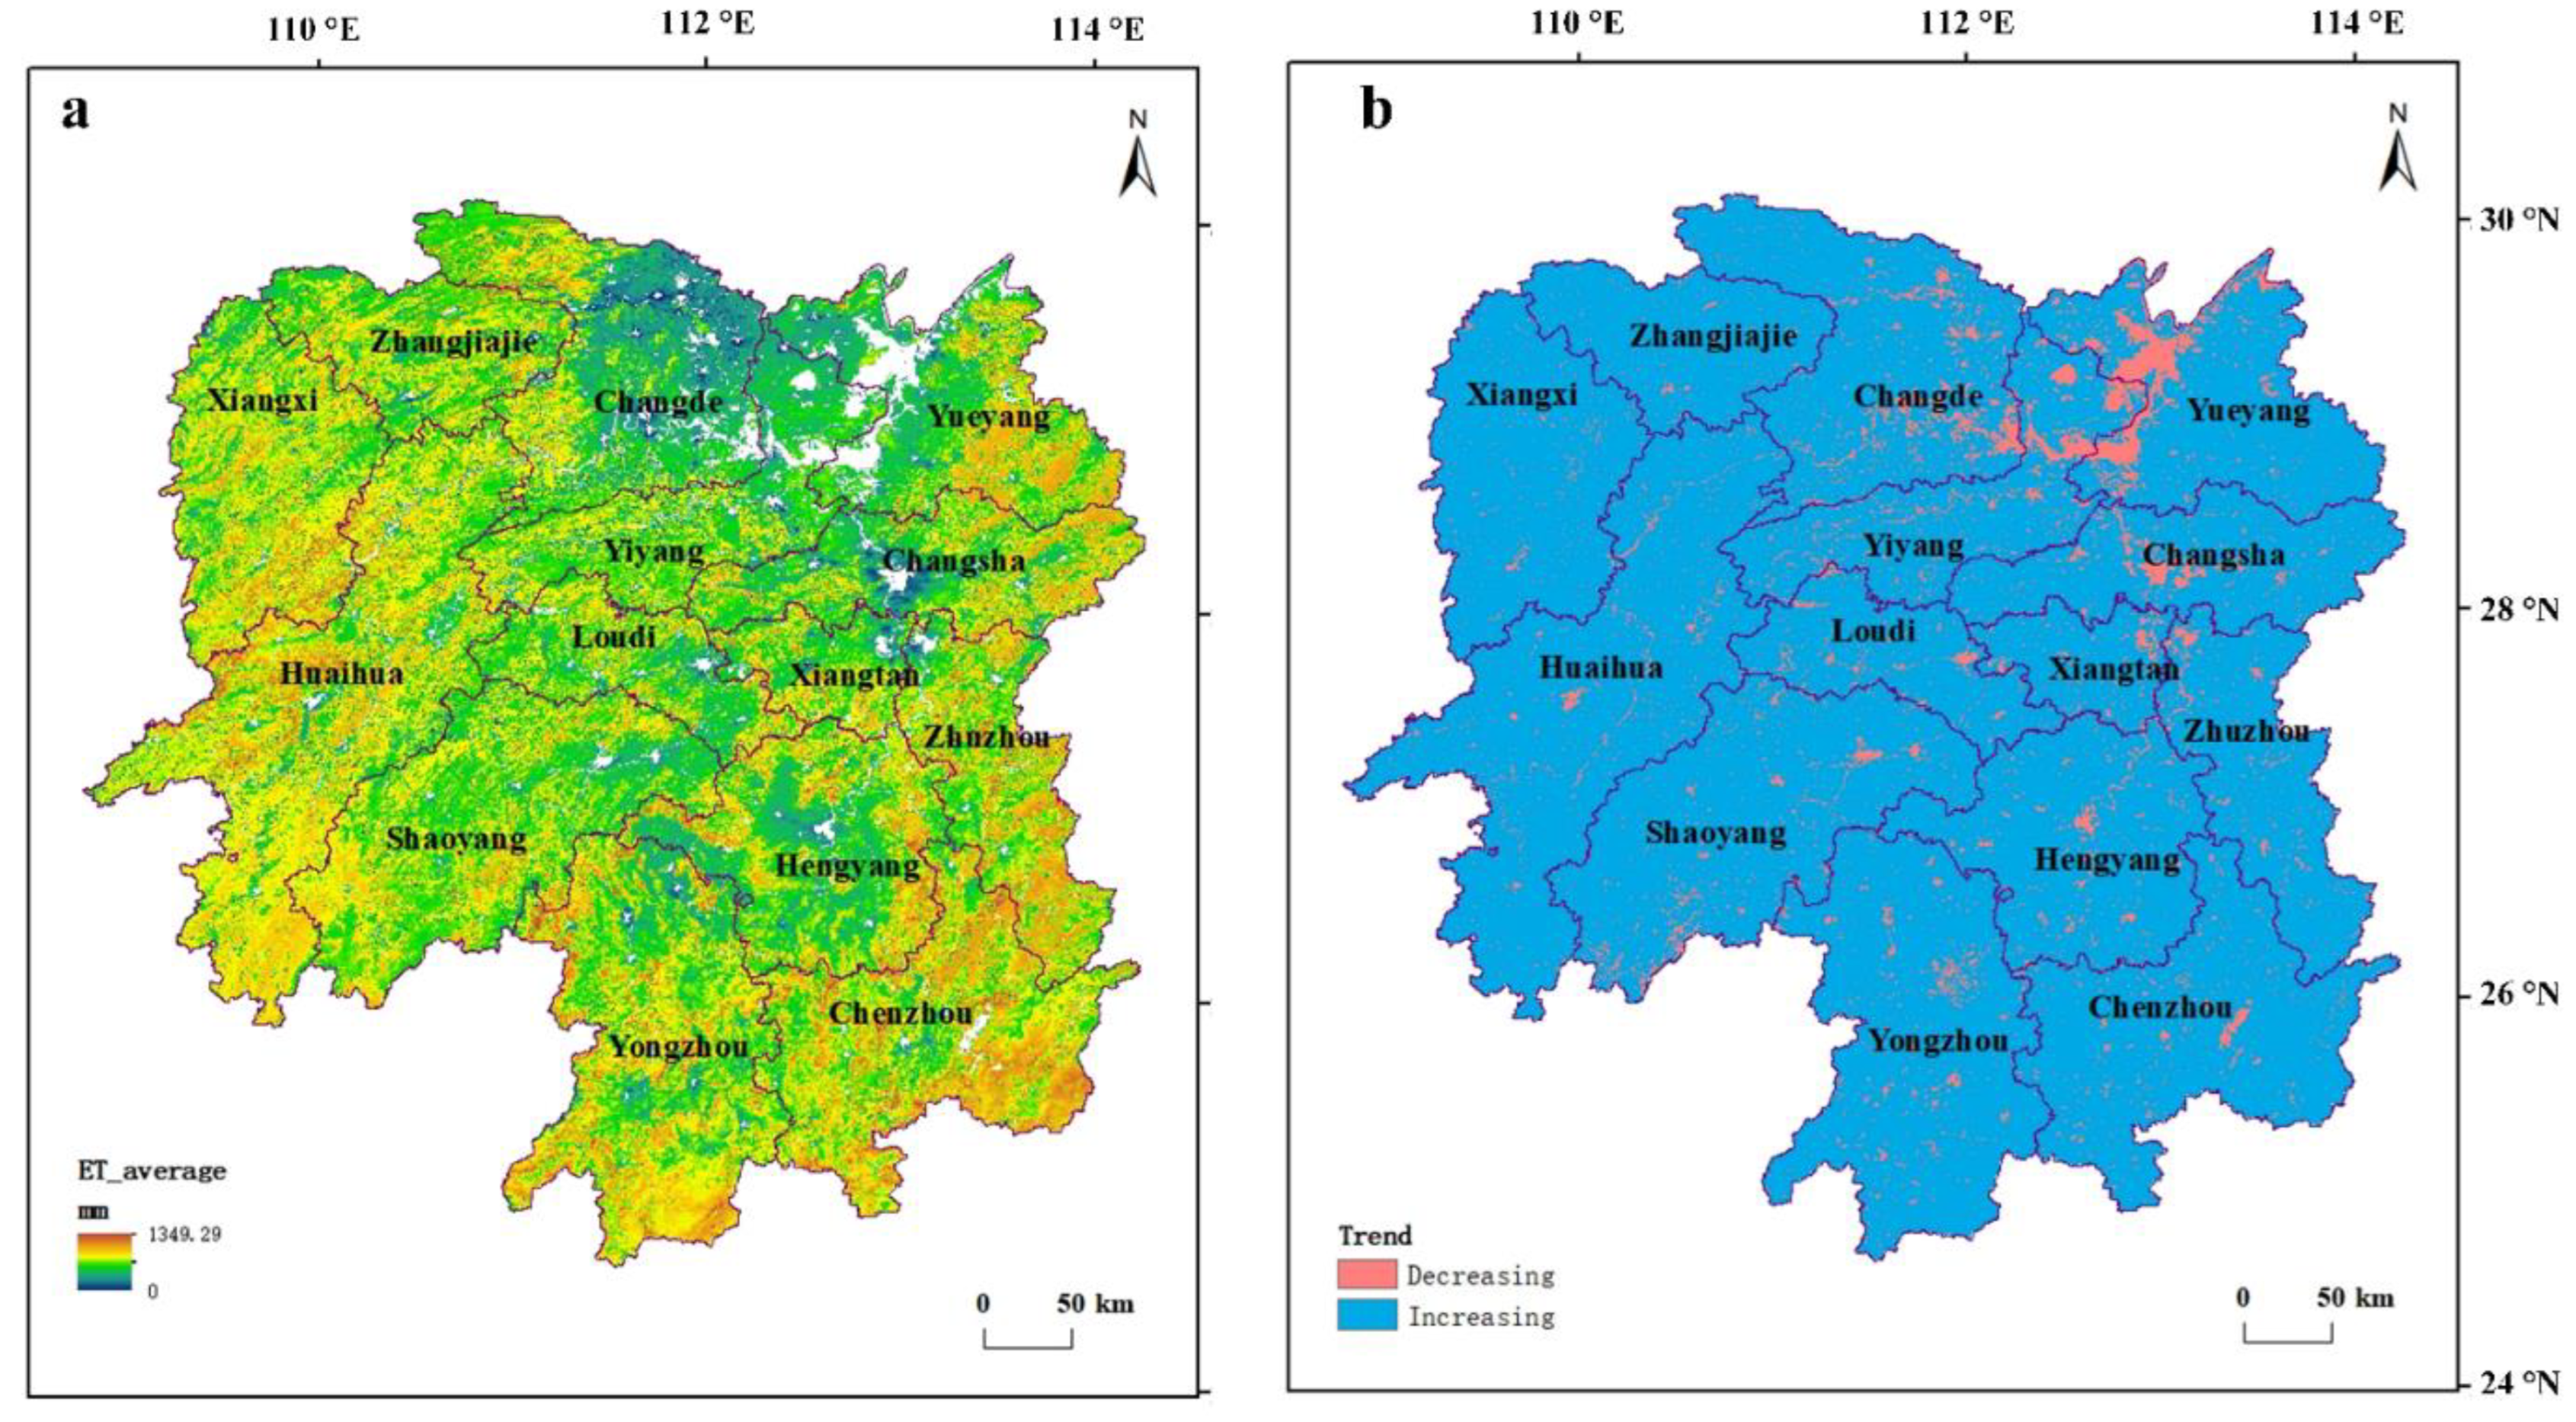
The ET is a critical measure of surface water resource loss [44]. Figure 4 shows the spatial distribution of the average annual ET and its trend from 2010 to 2019 based on the MOD16 ET data from Hunan Province. The average annual ET showed a high spatial heterogeneity (Figure 4a), with low values in the Dongting Lake area and high values in western, eastern, and southern Hunan Province. The average annual ET was approximately 819. 22 mm/year during 2010 and 2019 in Hunan Province. Annual ET showed an insignificant increasing trend in most areas of Hunan Province during this period (Figure 4b).
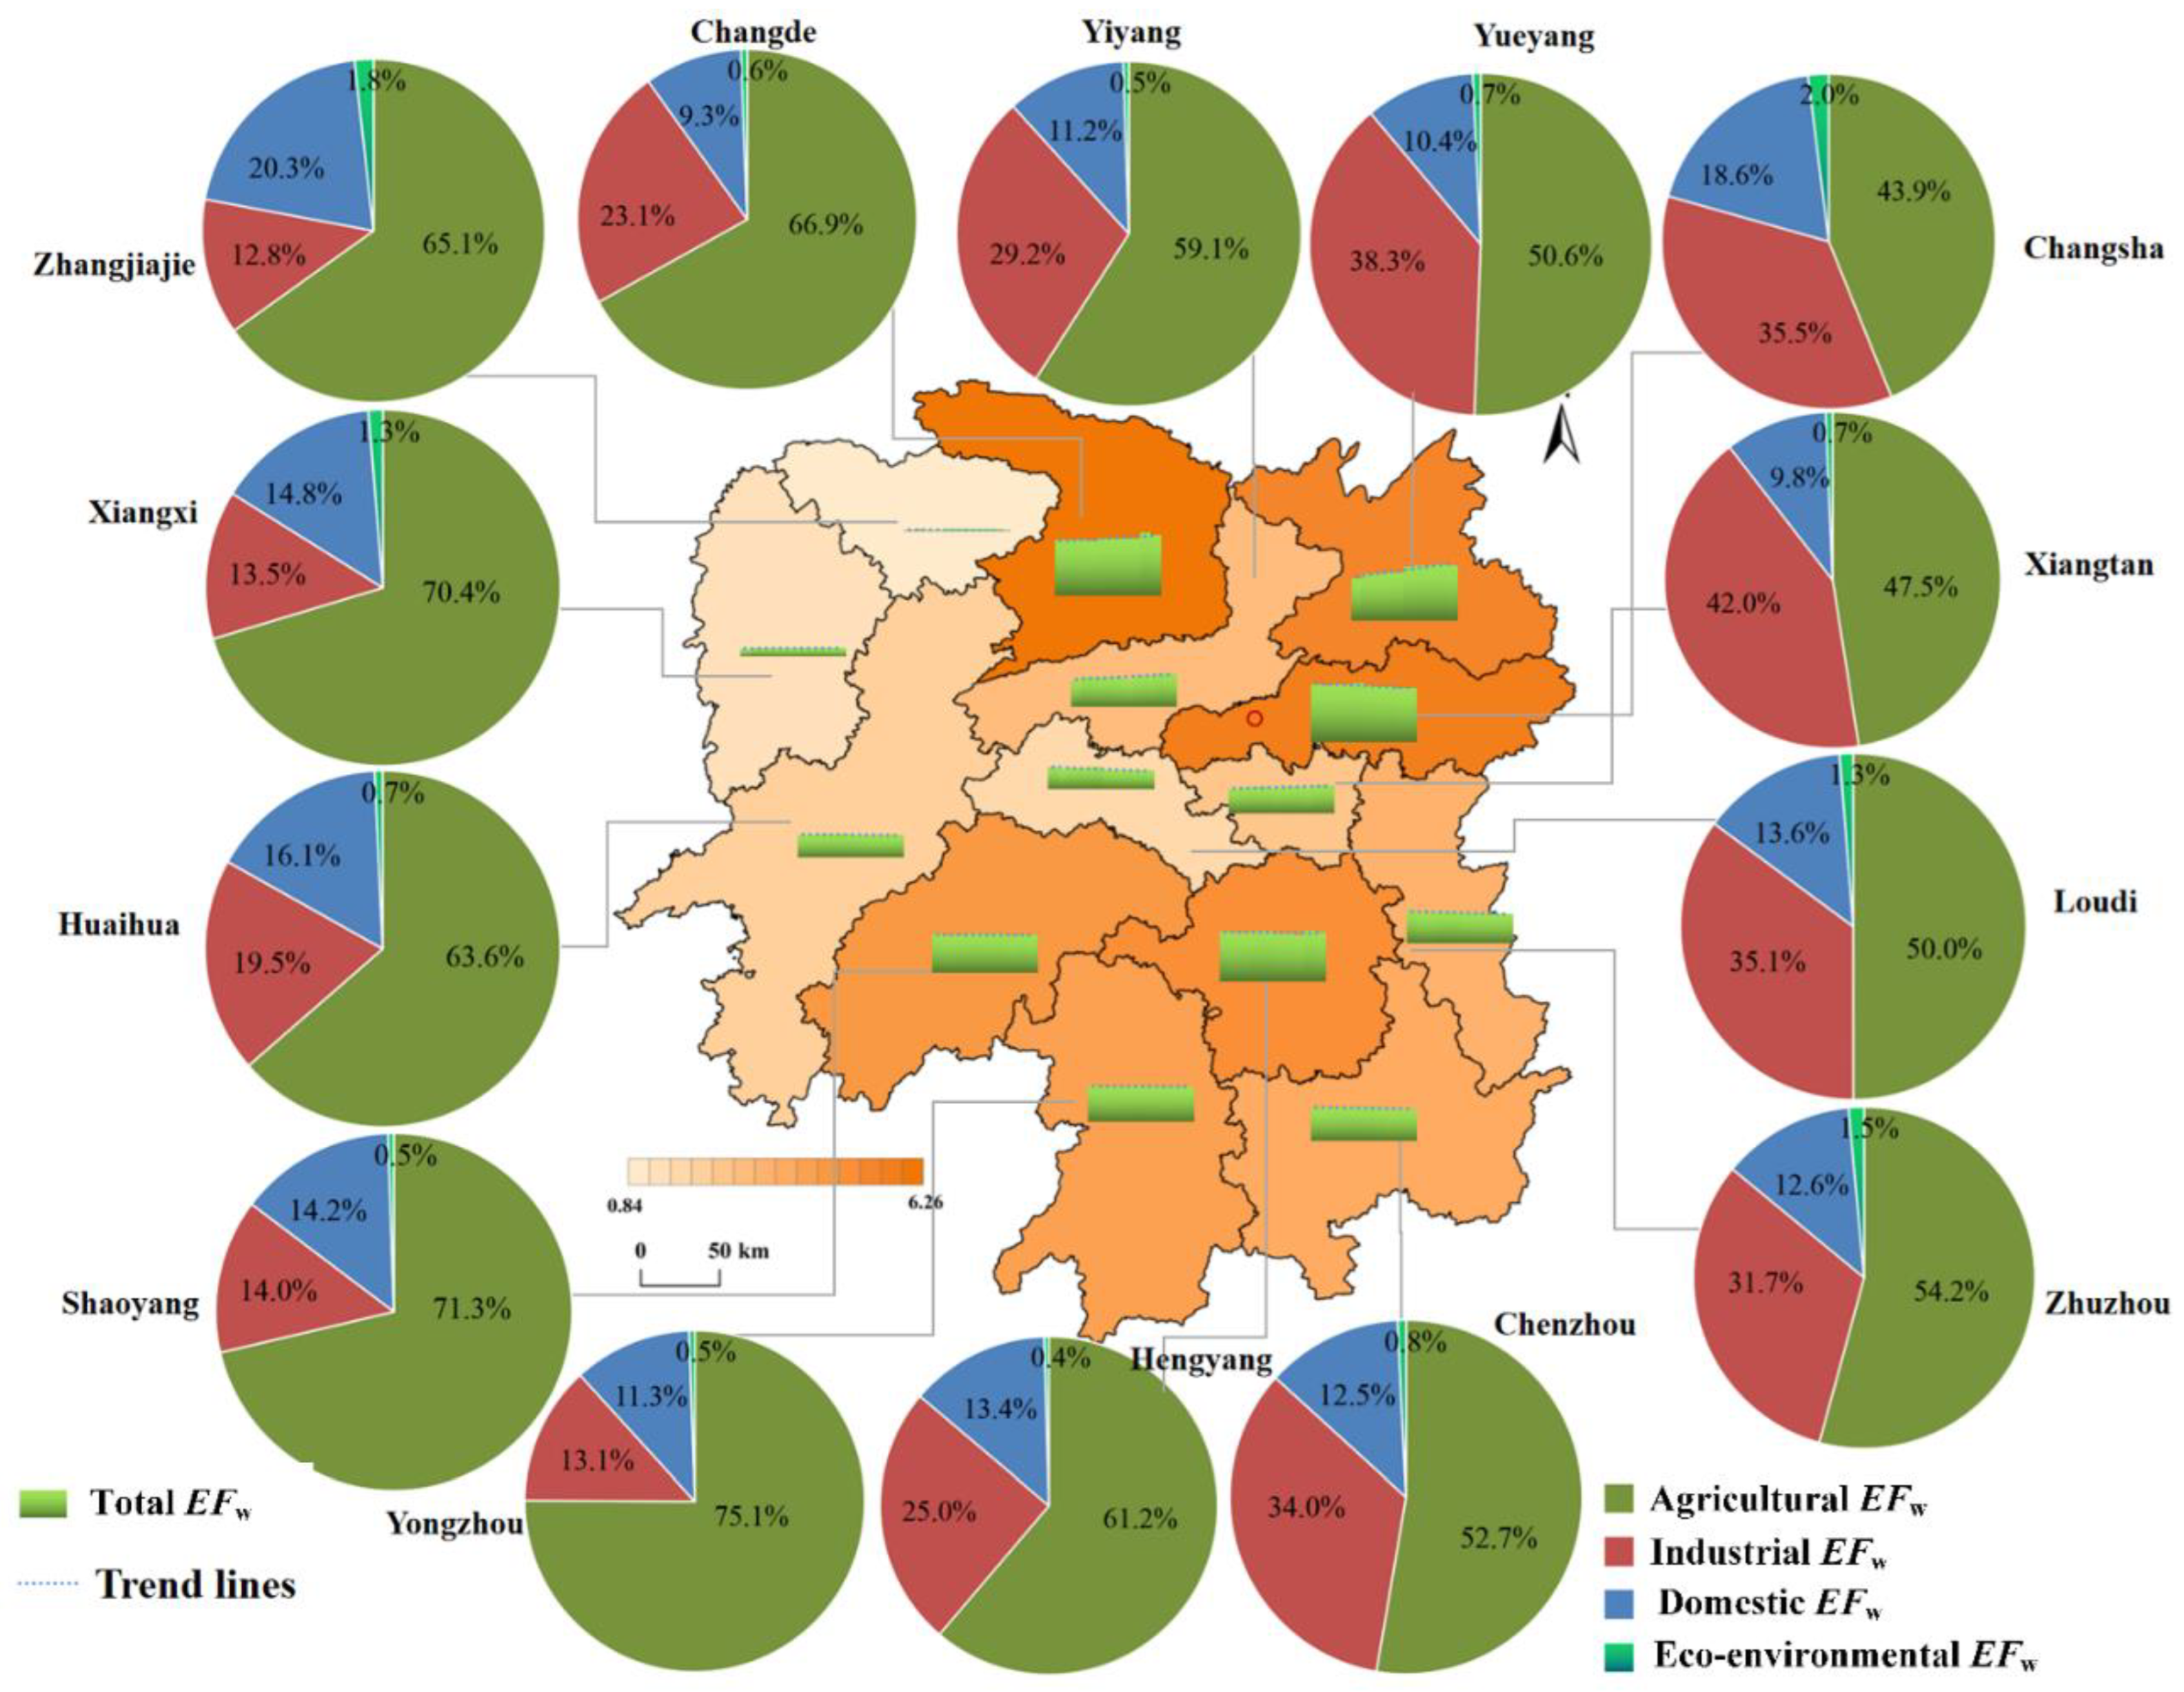
The EFw model is another method for estimating water resource demand regarding human activities. The dynamics of annual EFw and average annual EFw from 2010 to 2019 of 14 prefecture-level cities in Hunan Province are presented in Figure 5. The annual EFw of Changsha, Hengyang, Zhuzhou, Chenzhou, and Loudi decreased during this period. In contrast, that of Yueyang, Xiangtan, and Changde showed an increasing trend. The provincial average annual EFw was approximately 5.45 × 10⁶ hm2, with four prefecture-level cities (Changsha, Hengyang, Changde, and Yueyang) showing a higher EFw than the provincial average. In contrast, cities such as Zhangjiajie, Xiangxi, and Huaihua in western Hunan Province had the lowest EFw. Based on the GDP and population size of each city in Figure 1c, EFw was high in the cities with a flourishing economy, indicating that economic status and population size are the main factors for such a regional water footprint disparity.
Regarding the components of the EFw between 2010 and 2019 (Figure 5), agricultural EFw was the dominant one, followed by industrial and domestic EFw. Eco-environmental EFw showed the smallest contribution in all 14 cities. More than 50% of the total EFw was derived from the agricultural sector in all 14 cities, except Changsha and Xiangtan, but it still comprised the largest share for these two cities. Regarding the western and southern cities, Yongzhou, Shaoyang, and Xiangxi had the highest percentages of agricultural EFw, with values exceeding 70%. The highest percentage of industrial EFw (42%) was recorded in Xiangtan, an old industrial city. The proportion of industrial EFw exceeded 30% in other cities including Changsha, Chenzhou, Loudi, Yueyang, and Zhuzhou, while it was less than 15% in Zhangjiajie, Xiangxi, Shaoyang, and Yongzhou. These results correlate with the city’s economic development level. Regarding domestic EFw, there was little difference among the cities, with most of them showing a ratio between 10% to 20%. Changsha and Zhangjiajie had a high percentage of eco-environmental EFw; 2.0% and 1.8%, respectively.
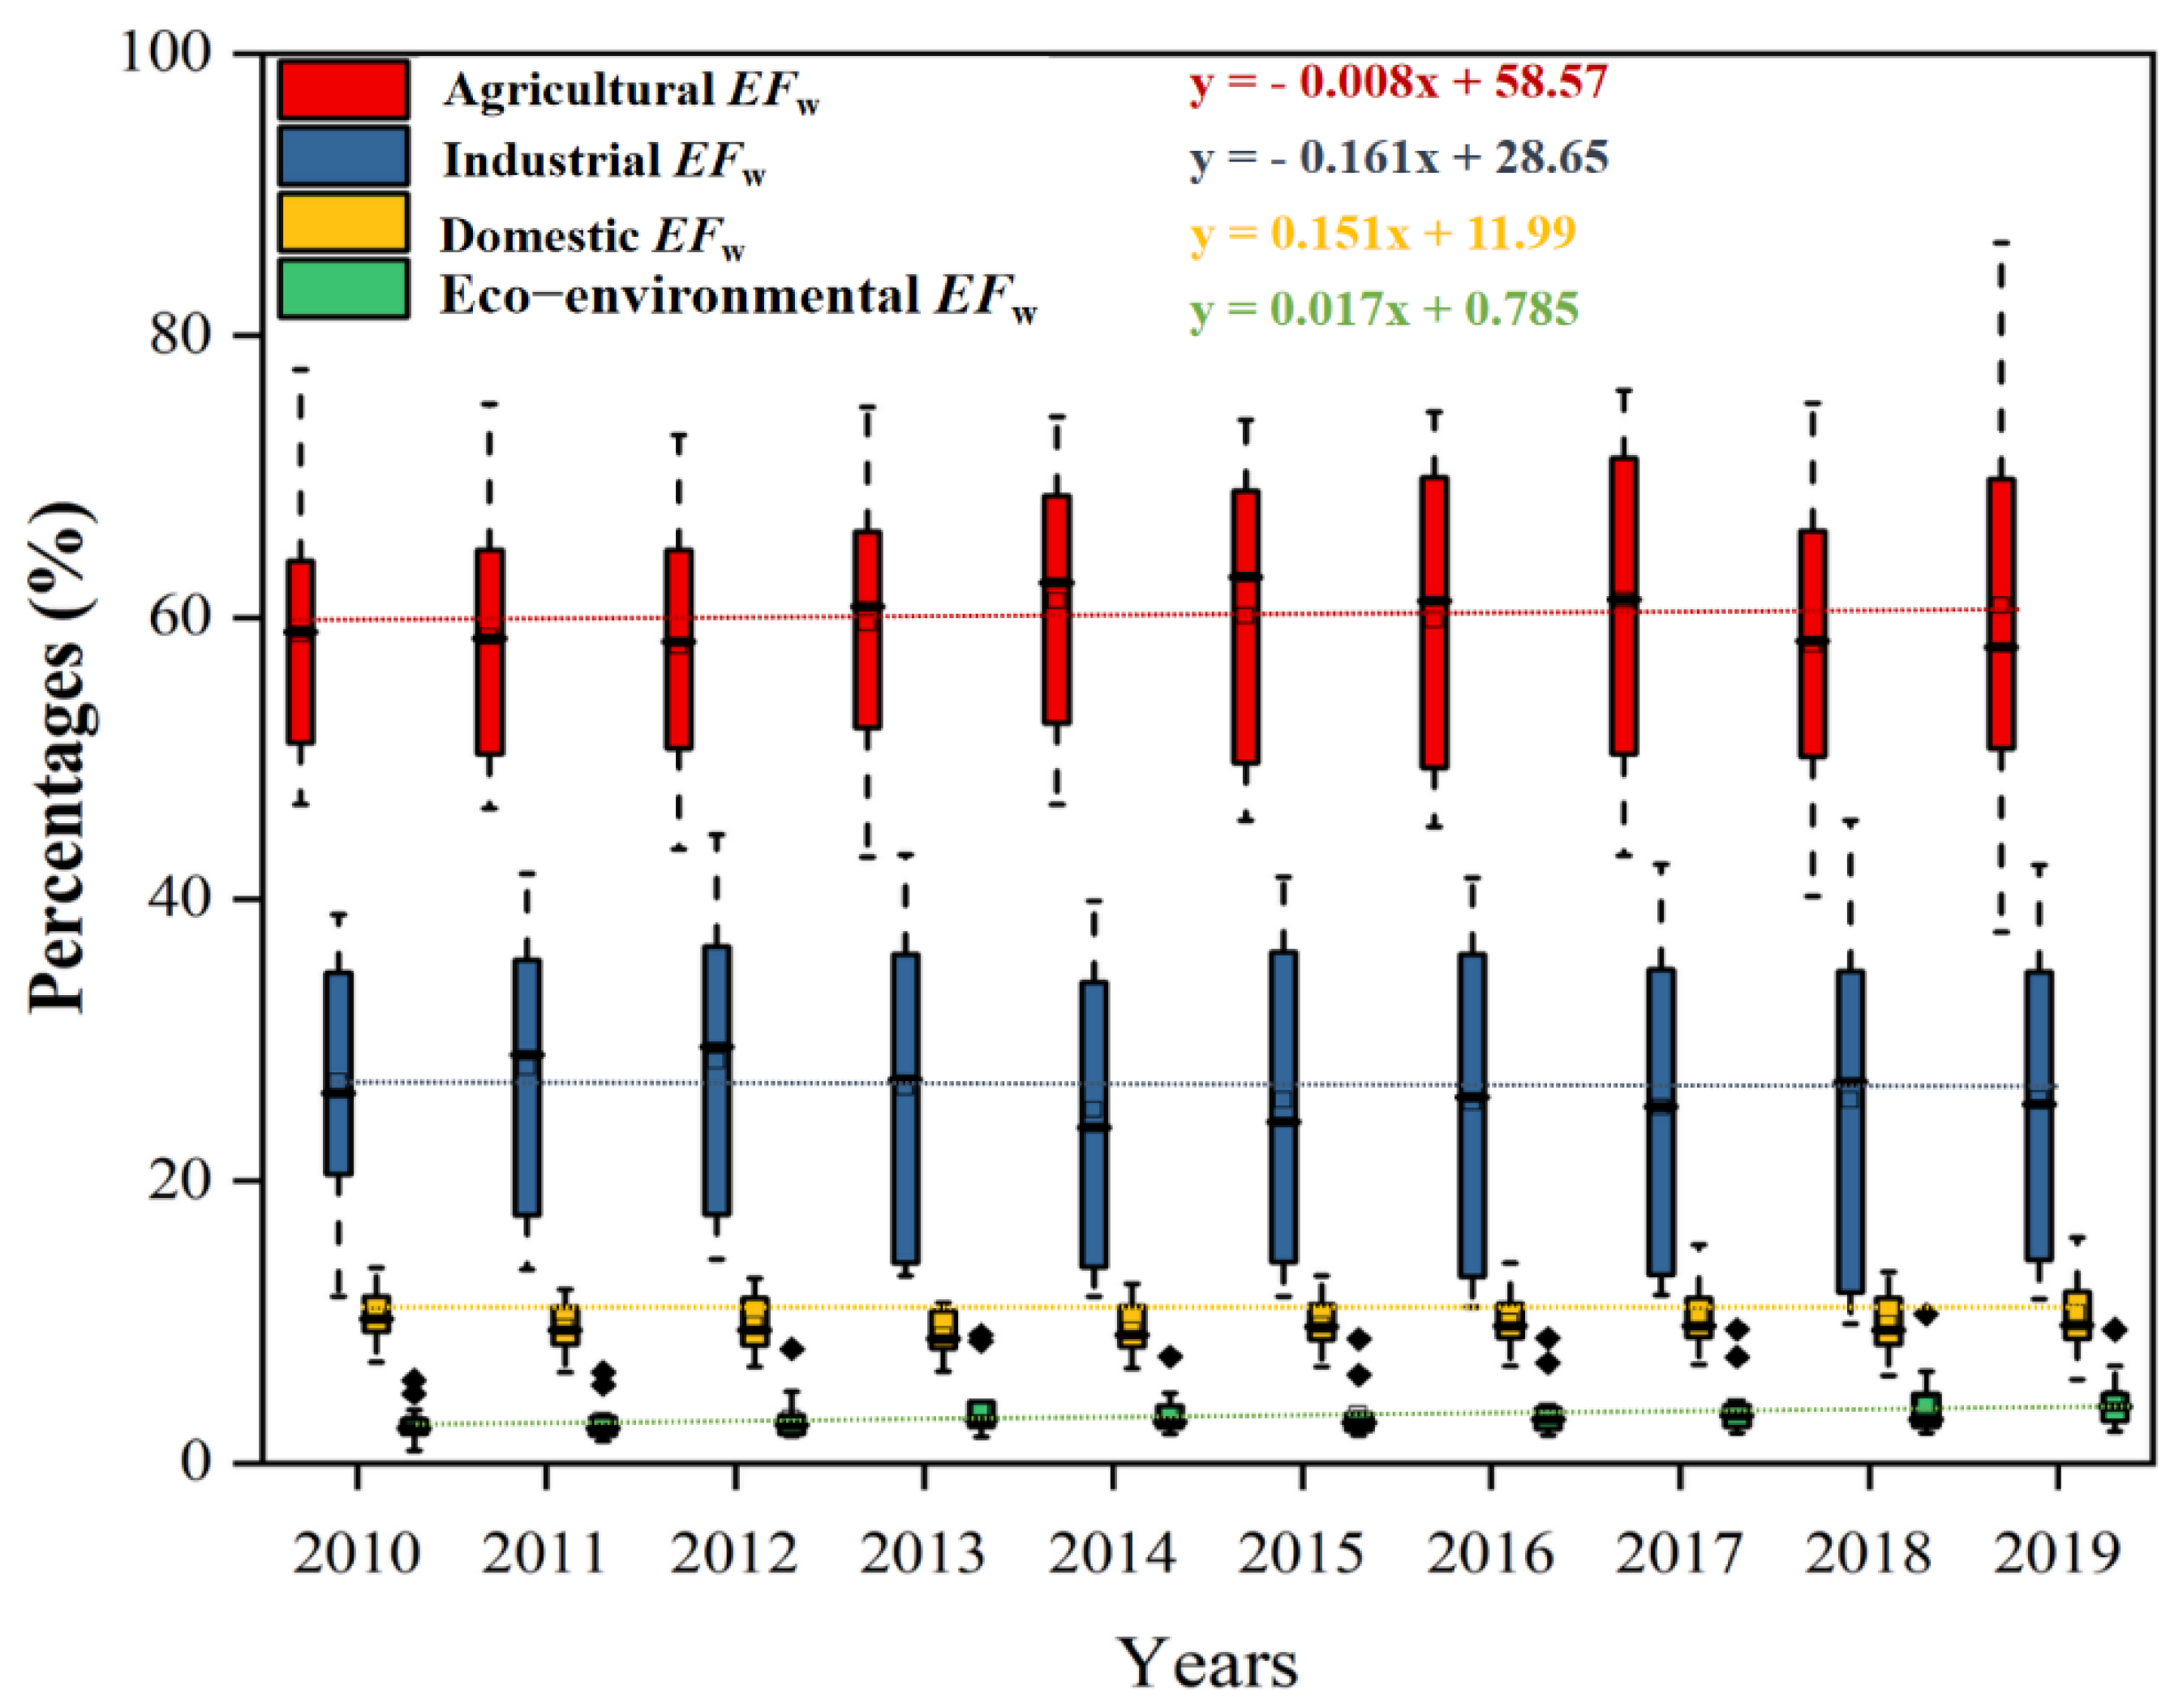
Figure 6 shows that the percentages of agricultural, industrial, domestic, and eco-environmental EFw of all prefecture-level cities changed steadily between 2010 and 2019. The mean percentage of agricultural EFw remained dominant at approximately 60% and showed a slight decrease, with a negative slope during this period. That of industrial EFw showed a similar trend. The proportions of both domestic and eco-environmental EFw showed a slightly increasing trend, with positive slope values.
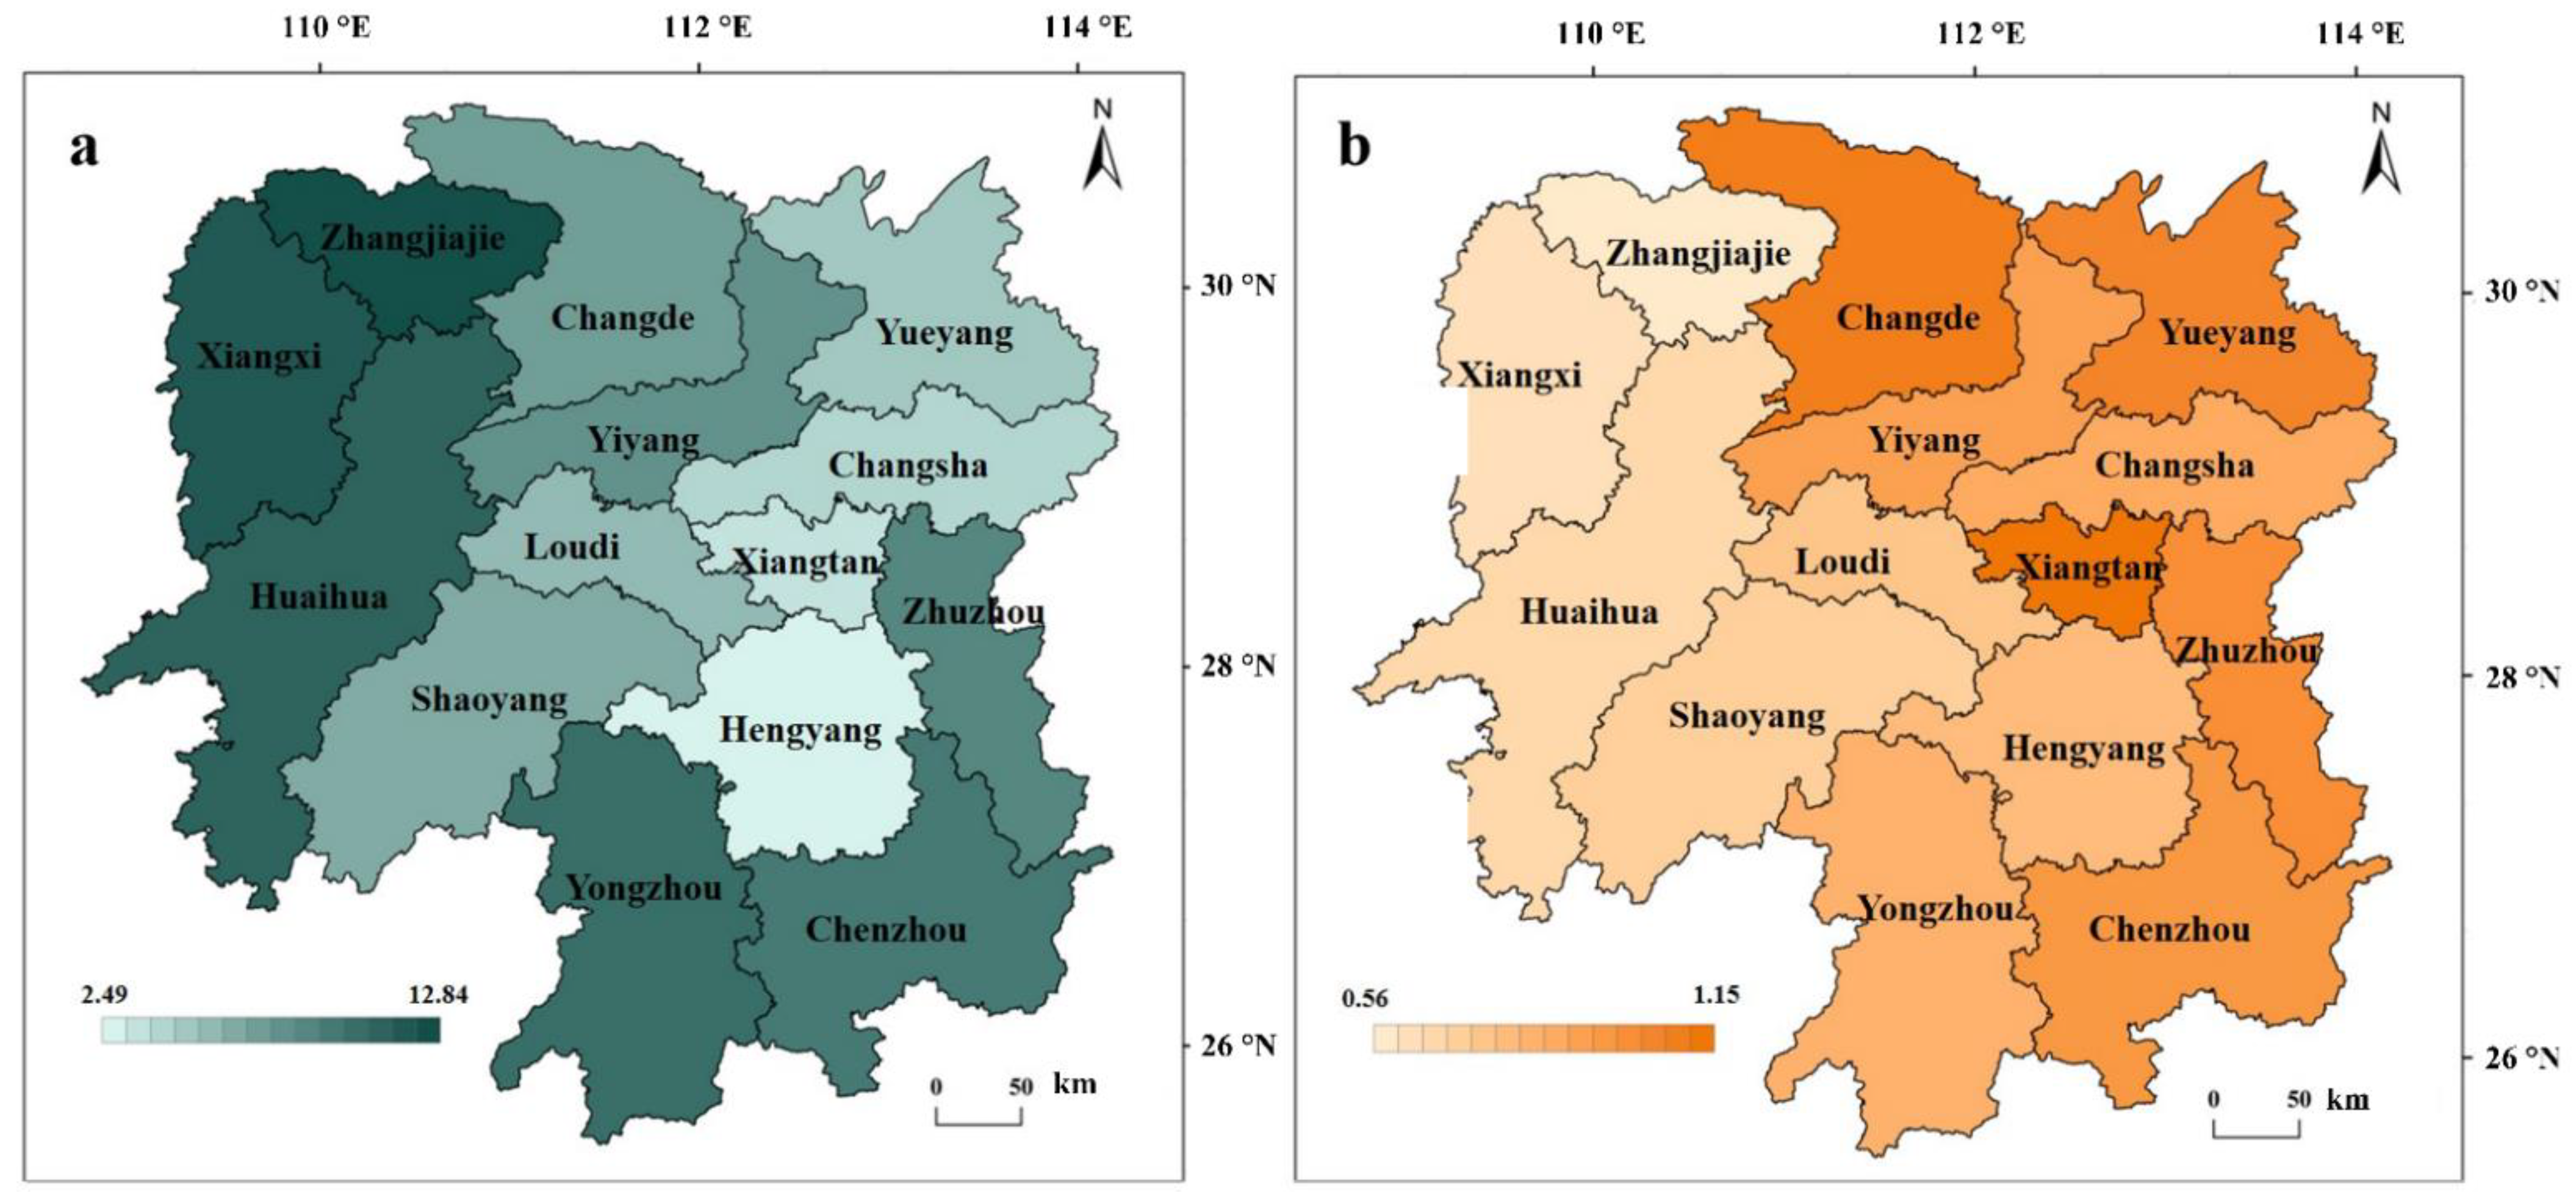
Figure 7 shows the spatial distribution of the average annual per capita ECw (Figure 7a) and EFw (Figure 7b) of the 14 prefecture-level cities. Figure 7a shows that the highest values (>6 hm2/ per capita) of per capita ECw in dark green were recorded in Yongzhou, Chenzhou, Huaihua, Xiangxi, Zhangjiajie, and Zhuzhou. This could potentially be explained by the large amount of water resources or the small population, or both (see Figure 1c). Hengyang had the lowest per capita ECw with 2.49 hm2/per capita, probably due to the low precipitation (Figure 3) and large population, ranking 3rd in Hunan Province (Figure 1c). Figure 7b shows that the relatively high values of per capita EFw in dark orange (>1 hm2/per capita) were found in northern Hunan Province, such as in Xiangtan, Changde, and Yueyang. Prefecture-level cities in western Hunan Province, such as Zhangjiajie, Xiangxin, and Huaihua, had the lowest per capita EFw, probably due to the small populations.

3.3. Evolution of the Sustainable Water Resource Utilization

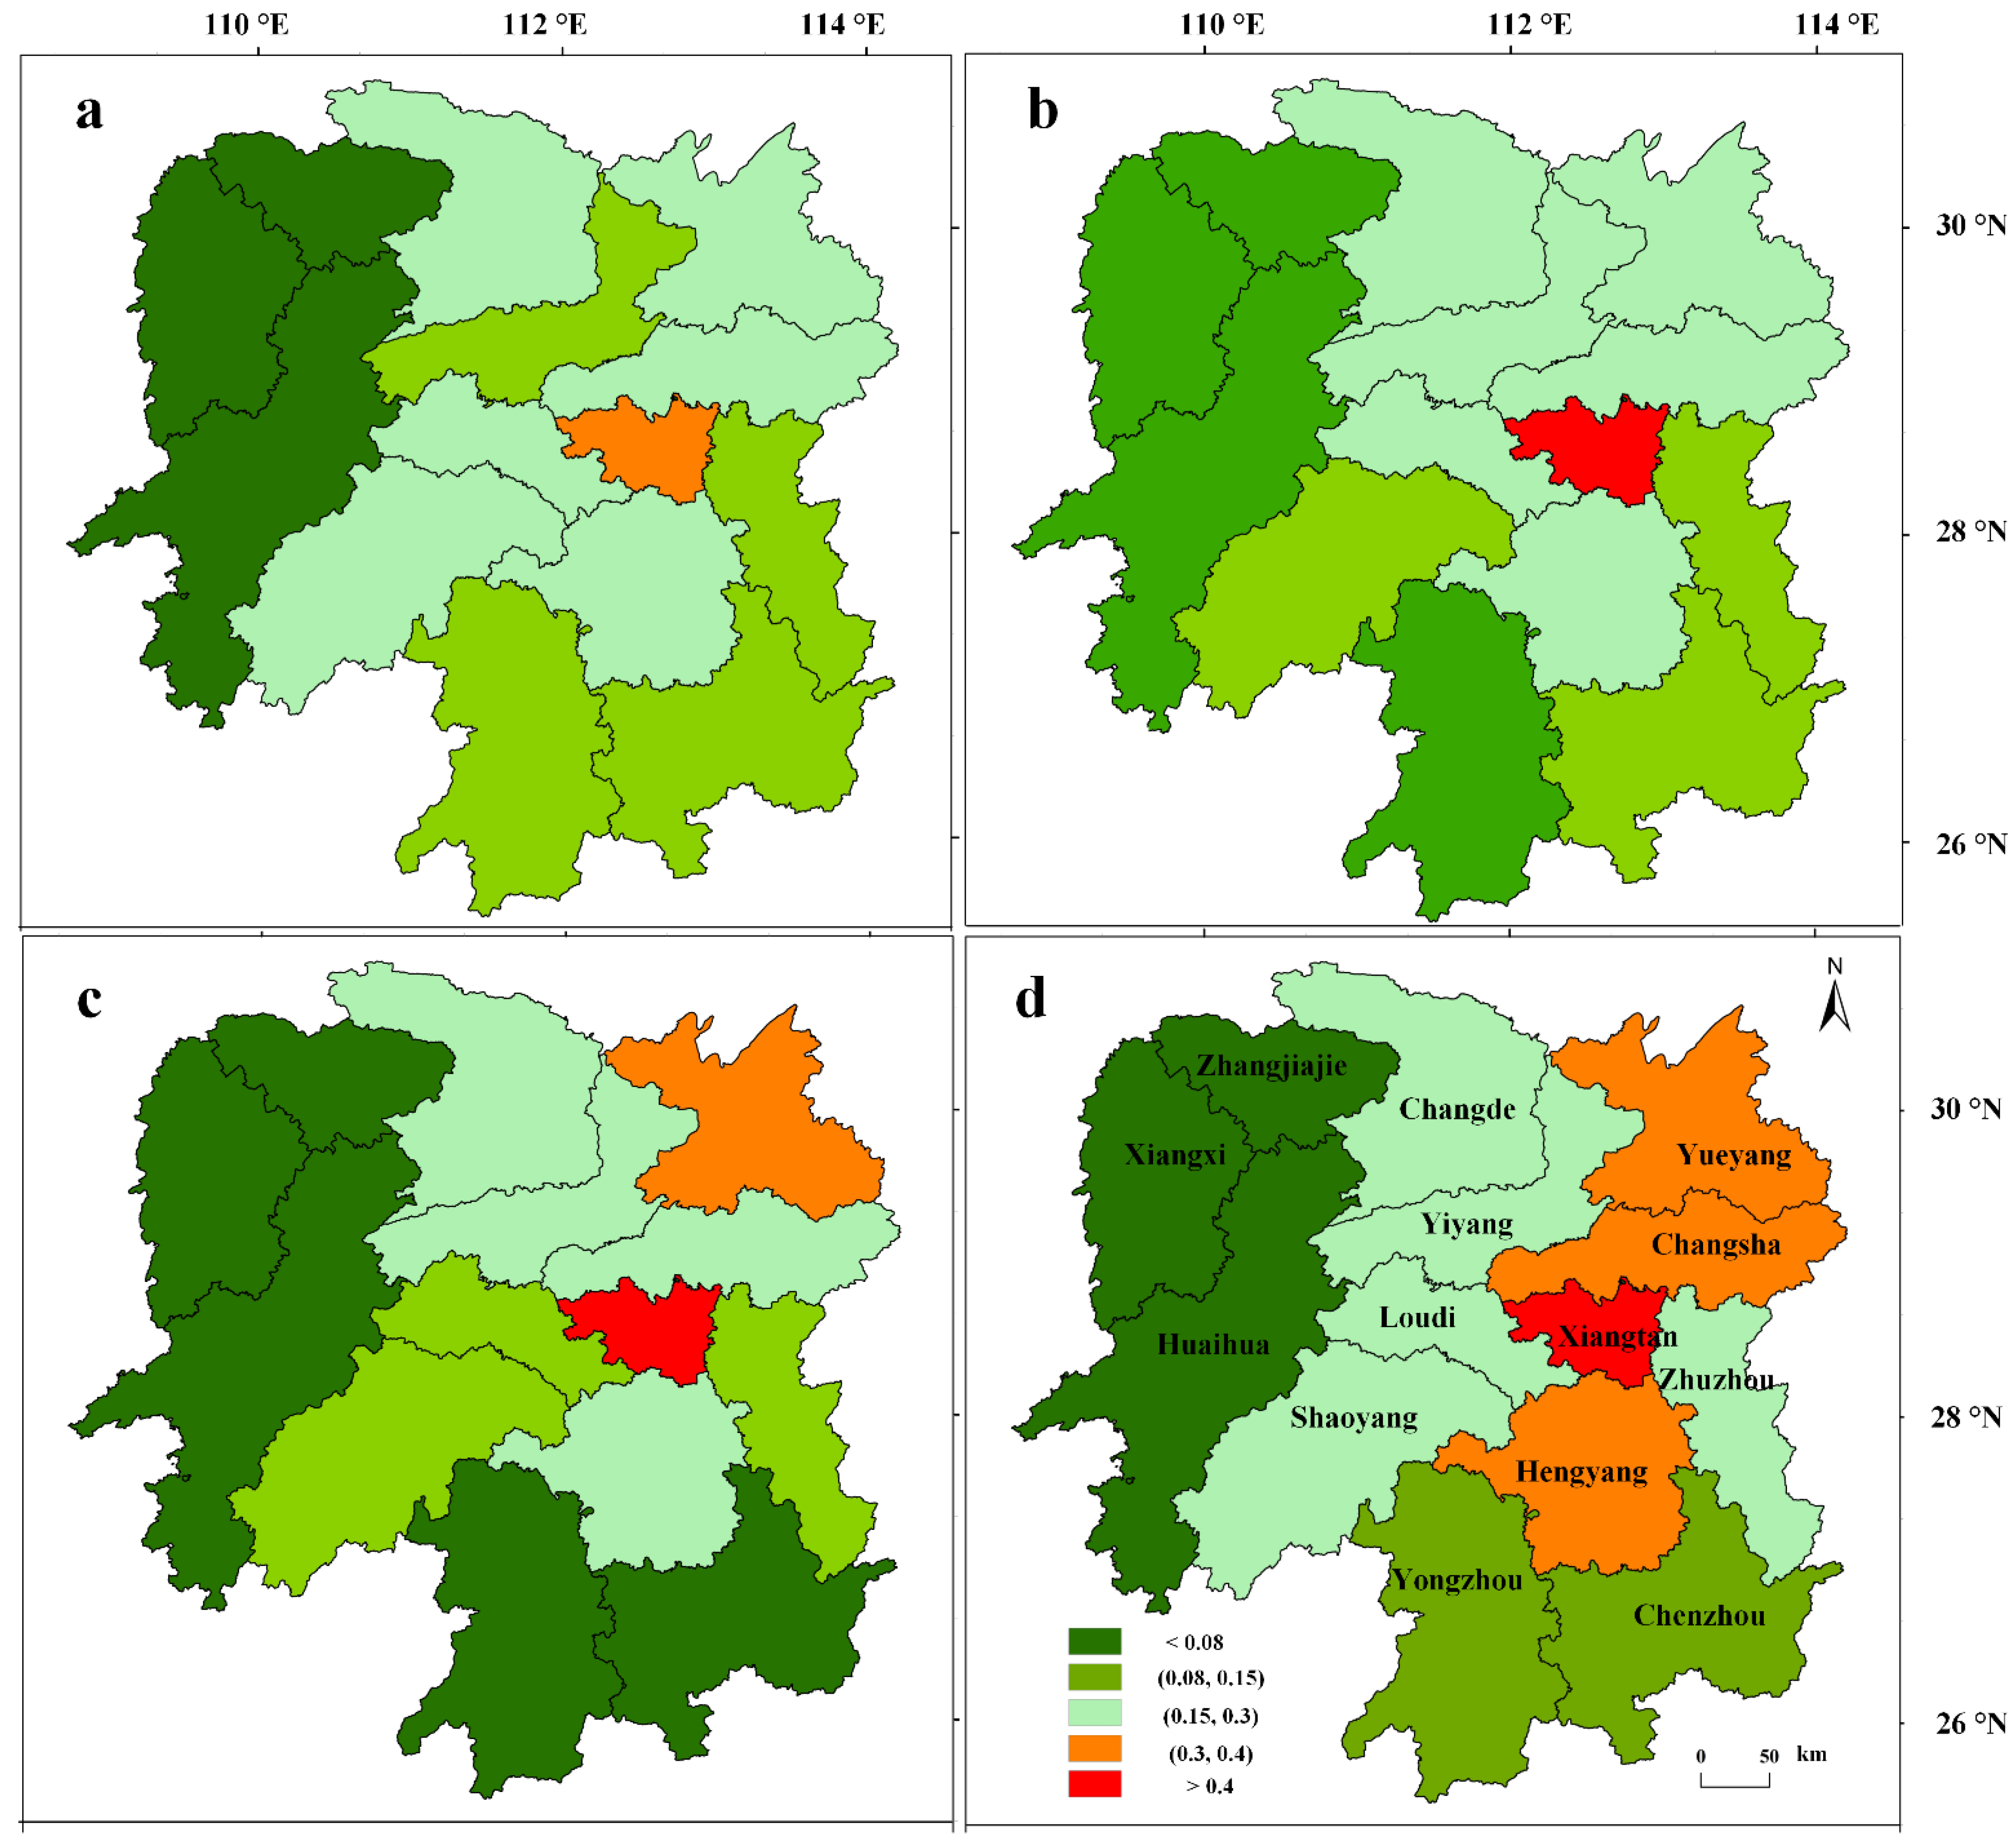
Based on the WEPI results in Figure 8, the water resource status across Hunan Province is generally secure with a WEPI < 0.5 between 2010 and 2019. In this period, the WEPI in most cities did not vary significantly. The lowest WEPI was recorded in the western cities, followed by the southern cities. Values of WEPI in Xiangtan, Changde, and Yueyang increased over the past 10 years. Two probable reasons for the high WEPI in Xiangtan are the high industrial EFw (Figure 5) and the decreasing precipitation trend (Figure 3b). The most likely explanation for Changde and Yueyang is the shrinking tendency of Dongting Lake [45], resulting in reduced water resource supply for these cities. The WEPI in Yongzhou and Chenzhou slightly increased, probably due to its increasing precipitation trend (Figure 3b). The average WEPI showed significant spatial heterogeneity across Hunan Province (Figure 8d). There was no water resource pressure in the west and south with WEPIs < 0.3. In comparison, cities in central and northern Hunan Province, such as Yueyang, Changsha, Xiangtan, and Hengyang, were under relatively high-water resource pressure.
Table 1 shows that Changsha had the lowest 10,000 CNY GDP water resources ecological footprint (WGDP) each year, with a relatively advanced economic development. The mean value was 0.082 hm2/10,000 CNY from 2010 to 2019, less than half of that of the whole Hunan Province (0.203 hm2/10,000 CNY). Only two cities, Changsha and Zhuzhou, had a lower WGDP than that of the whole Hunan Province. Relatively high values (>3.0 hm2/10,000 CNY) were recorded in Shaoyang, Yongzhou, and Xiangxi, indicating that natural resources and economic development widely varied among these cities. The WGDP steadily declined annually in all prefecture-level cities. For most cities, it decreased by more than 50% from 2010 to 2019. This demonstrates that total water resource use efficiency improved for all cities to varying degrees during this period. The GDP growth for the whole of Hunan Province is based on an efficient economic development model, not on high water resource consumption, which is important for achieving sustainable economic development and building a resource-conserving and environment-friendly society.

4. Discussion

4.1. The Relationship between Water Resources and Precipitation

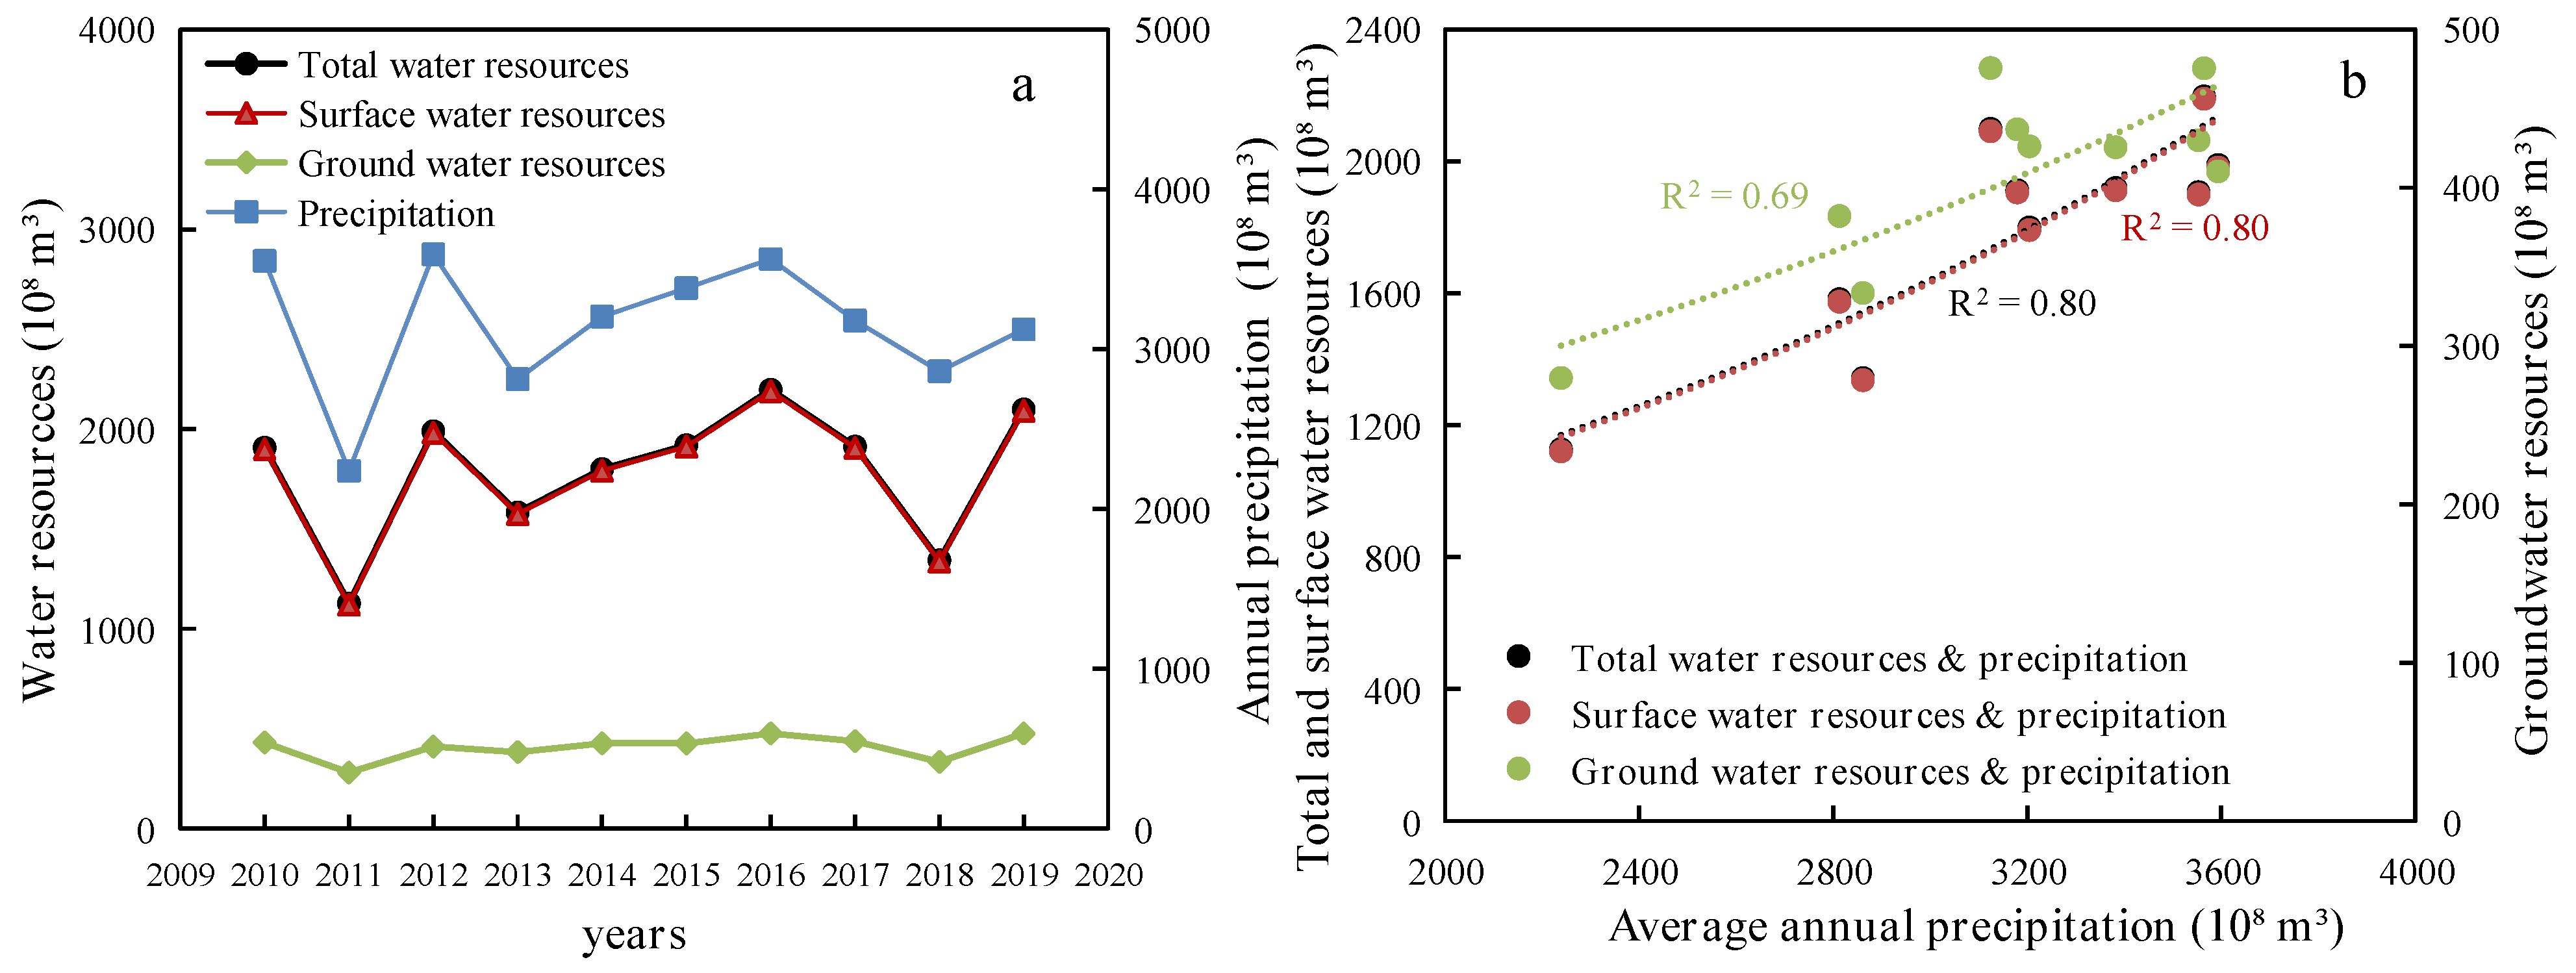
Precipitation and potential ET represent the water supply and water demand in a catchment, respectively [46,47]. Their temporal variability is the dominant driver of the temporal dynamics of catchment water storage [48]. The spatial pattern of average annual precipitation (Figure 3a) corresponds well with other studies [49,50]. These areas with a high ET are located in mountains with high perennial vegetation coverage; the maximum vegetation coverage exceeds 90%, resulting in significant transpiration [51]. Hunan Province comprises the main component (up to 82.7%) of the Dongting Lake Basin (see map in [52]), and can be regarded as a catchment. The temporal dynamics of all three types of water resources and precipitation are shown in Figure 9a. The dynamics of all water resources were in good agreement with those of precipitation. There was a marked positive correlation between water resources and precipitation (Figure 9b). Regarding the correlation between annual precipitation, and total water resources, surface water resources, and groundwater resources, R2 values were 0.80, 0.80, and 0.69, respectively. This indicates that precipitation could explain 80% and 69% of the surface (total) water resources and groundwater resources in Hunan Province, respectively. This is probably due to the dominant topographic area comprising mountainous and hilly terrain, and because precipitation is mostly concentrated on the surface to form runoff in Hunan Province. Other studies [53,54] also argued that with population growth and expansion of irrigated agriculture, water resources management to a great extent depends on changes in precipitation, especially in arid areas.
However, some cities, such as Changsha and Zhuzhou, had relatively high precipitation (Figure 3a) and few water resources (Figure 2b). In contrast, Huaihua had relatively low precipitation (Figure 3a) and abundant water resources (Figure 2b). A potential reason is the differences in water resource consumption, such as water use for human activities. For example, Changsha and Zhuzhou with large populations and high economic development levels had a large EFw, while Huaihua showed the opposite. Previous studies [55,56,57] investigated the relationship between urbanization, economic growth, and water use change for water resources management. The logarithm of total water use had a significant negative correlation with the logarithm of gross domestic product in Hunan Province [55], corresponding well with the results in this study.

4.2. Advantages and Limitations of This Study

This study evaluated the sustainable utilization of water resources in terms of supply and demand sides based on climate variability and human activities in Hunan Province, south China. Previous research focused on water resource footprint and/or water resource carrying capacity in water resource utilization at different scales [58,59,60], natural disasters (e.g., floods, droughts) [61] or were based on climate changes [62], but few studies considered both explicitly. Furthermore, many studies paid more attention to water resources research in arid and semi-arid regions [62,63]. However, a review [64] of sustainable water resources in China highlighted that frequent drought and water contamination caused by climate changes and economic development in some areas in south China, threatens the sustainability of water resources. Thus, it is worthwhile to explore the sustainable utilization of water resources based on both climate changes and socio-economic development explicitly in south China.
This study focused on the amount of water resources based on both climate changes and socio-economic development. Water quality is also the key to water resource management [17,65]. The most serious environmental and economic impacts were observed in Hunan Province across Chinese mainland due to chromium, cadmium, and arsenic emissions [66]. Heavy metal wastewater is the outstanding water pollution problem in Hunan Province in recent decades [66,67,68,69]. Thus, Future work in water resources should focus on both water quantity and quality in this area.
The results indicate that average annual precipitation is higher than ET in Hunan Province, and annual ET showed an increasing trend in most cities (Figure 4b), in agreement with the results using MOD16 data in China on a national scale [70,71,72] and a coupled ET and gross primary product model (PML-V2) at a global scale [73]. However, the ET trend has shown inconsistent results at a regional scale in China, e.g., an increasing trend in Henan Province [74] and a decreasing trend in Shangxi Province [75]. Due to the challenges in estimating ET at a large scale, previous studies have employed different remote sensing products or approaches, possibly resulting in uncertainty of ET estimation [76]. It should be noted that only MOD16A data were used in this study, an alternative range of ET products and methods should be adopted to explore the spatial-temporal ET in future studies.

5. Conclusions

The sustainable utilization of water resources in terms of supply and demand was evaluated in Hunan Province from 2010 to 2019 based on climate change (i.e., precipitation and actual ET) and human activities (i.e., EFw). The results indicate that: (1) on the supply side, overall water resources show an increasing tendency in Hunan Province. While the spatial patterns of water resources are highly heterogeneous, with high values in the east and south, and low values in the west and north of Hunan Province. This is mainly due to the spatial distribution of precipitation, which contributes up to 80% of the amount of total water resources, followed by human activities such as economic development and population numbers; (2) on the demand side, actual ET was high in mountains probably due to high vegetation coverage. EFw, mainly based on water consumption by human activities, was high in the relatively developed prefecture-level cities such as Changsha, Xiangtan, and Yueyang. The mean percentage of agricultural EFw remained dominant at approximately 60% but showed a steady decreasing trend during the period of 2010–2019. That of eco-environmental EFw was increasing; and (3) in general, the sustainable utilization of water resources in Hunan Province is rational. The water resource utilization pressure was slightly higher in relatively developed cities. The decreasing WGDP indicates that economic development is efficient in Hunan Province but does not involve high water consumption levels. The potential for water resource development and utilization is large in eastern and southern Hunan Province. This study evaluates the sustainable utilization of water resources based on both climate changes and socio-economic development explicitly. Moreover, these findings are beneficial for regulating resource allocation from the macro level, and for narrowing the differences among prefecture-level cities. It also provides useful information for the formulation of policies, such as the cross-regional mobilization of water resources.

Author Contributions

Conceptualization, N.L. and W.J.; Methodology, N.L., W.J. and L.H.; Formal analysis, N.L. and W.J.; Data curation, W.J., L.H. and Y.L.; Visualization, N.L. and W.J.; Writing—original draft preparation, N.L.; Writing—review & editing, N.L., W.J., C.Z. and Y.H.; Funding acquisition, N.L., W.J. and X.X. All authors have read and agreed to the published version of the manuscript.

Funding

This research was funded by the National Natural Science Foundation for Youth of China [grant number 42101053, 42101130], Natural Science Foundation for Youth in Hunan Province of China [grant number 2021JJ40013], Excellent Youth of Department of Education of Hunan Province [grant number 21B0631], Department of Education of Hunan Province [grant number, 21C0539], Launching project of doctoral research of Hengyang Normal University [grant number 2020QD01], and Open fund project of HIST Hengyang Base [grant number 2021HSKFJJ030].

Institutional Review Board Statement

Not applicable.

Informed Consent Statement

Not applicable.

Data Availability Statement

Not applicable.

Acknowledgments

The authors are grateful to four anonymous reviewers and the assistant editor Marijia Jovanovic for their invaluable comments and editing of the manuscript.

Conflicts of Interest

The authors declare that they have no known competing financial interest or personal relationship that could have appeared to influence the work reported in this paper.

References

  1. Yang, D.; Yang, Y.; Xia, J. Hydrological cycle and water resources in a changing world: A review. Geo. Sustain. 2021, 2, 115–122. [Google Scholar] [CrossRef]
  2. Li, Y.; Zhang, X. Assessment on carrying capacity of water resources in Yangze River economic zone based on principle component analysis. Bullet. Soil Water Conserv. 2017, 27, 172–178. (In Chinese) [Google Scholar]
  3. Chapagain, A.K.; Hoekstra, A.Y. Water footprints of nations. In Value of Water Research Report Series No. 16; UNESCO-IHE: Delft, The Netherlands, 2004. [Google Scholar]
  4. Xu, Z.M.; Cheng, G.D. The predicted demand of water resources in the middle reaches of the Heihe River from 1995 to 2050. J. Glaciolgy Geocryol. 2000, 2, 139–146. (In Chinese) [Google Scholar]
  5. Xia, J.; Zhang, Y.; Xiong, L.; He, S.; Wang, L.; Yu, Z. Opportunities and challenges of the Sponge City construction related to urban water issues in China. Sci. China Earth Sci. 2017, 60, 652–658. (In Chinese) [Google Scholar] [CrossRef]
  6. IPCC. Climate Change 2021: The Physical Science Basis. In Contribution of Working Group I to the Sixth Assessment Report of the Intergovernmental Panel on Climate Change; Masson-Delmotte, V., Zhai, P., Pirani, A., Connors, S.L., Péan, C., Berger, S., Caud, N., Chen, Y., Goldfarb, L., Gomis, M.I., et al., Eds.; Cambridge University Press: Cambridge, UK, 2021; In Press. [Google Scholar]
  7. Nogueira, M. The sensitivity of the atmospheric branch of the global water cycle to temperature fluctuations at synoptic to decadal time-scales in different satellite-and model-based products. Clim. Dynam. 2019, 52, 617–636. [Google Scholar] [CrossRef]
  8. Zhang, Q.; Gu, X.; Singh, V.P.; Xu, C.; Kong, D.; Xiao, M.; Chen, X. Homogenization of precipitation and flow regimes across China: Changing properties, causes and implications. J. Hydrol. 2015, 530, 462–475. [Google Scholar] [CrossRef]
  9. Yan, D.; Yao, M.; Ludwig, F.; Kabat, P.; Huang, H.Q.; Hutjes, R.W.A.; Werners, S.E. Exploring future water shortage for large river basins under different water allocation strategies. Water Resour. Manag. 2018, 32, 3071–3086. [Google Scholar] [CrossRef]
  10. Men, B.; Liu, H.; Tian, W.; Wu, Z.; Hui, J. The impact of reservoirs on runoff under climate change: A case of Nierji reservoir in China. Water 2019, 11, 1005. [Google Scholar] [CrossRef]
  11. Tukimat, N.; Harun, S. Comparative study on the reservoir operation planning with the climate change adaptation. SN Appl. Sci. 2019, 1, 1–11. [Google Scholar] [CrossRef]
  12. Jiao, W.; Wang, L.; Smith, W.K.; Chang, Q.; Wang, H.; D’Odorico, P. Observed increasing water constraint on vegetation growth over the last three decades. Nat. Commun. 2021, 12, 3777. [Google Scholar] [CrossRef] [PubMed]
  13. Ellison, D. Forests and Water, Background Analytical Study 2 (UN Forum on Forests), April 2018. Available online: https://www.researchgate.net/profile/David-Ellison-5/publication/324685224_From_Myth_to_Concept_and_Beyond_-_The_BioGeoPhysical_Revolution_and_the_Forest-Water_Paradigm/links/5adc6de6a6fdcc29358a3b41/From-Myth-to-Concept-and-Beyond-The-BioGeoPhysical-Revolution-and-the-Forest-Water-Paradigm.pdf (accessed on 10 June 2022).
  14. Hoek van Dijke, A.J.; Herold, M.; Mallick, K.; Benedict, I.; Machwitz, M.; Schlerf, M.; Pranindita, A.; Theeuwen, J.J.E.; Bastin, J.; Teuling, A.J. Shifts in regional water availability due to global tree restoration. Nat. Geosci. 2022, 15, 363–368. [Google Scholar] [CrossRef]
  15. Brown, A.E.; Zhang, L.; McMahon, T.A.; Western, A.W.; Vertessy, R.A.A. review of paired catchment studies for determining changes in water yield resulting from alterations in vegetation. J. Hydrol. 2005, 310, 28–61. [Google Scholar] [CrossRef]
  16. Ning, T.; Li, Z.; Feng, Q.; Chen, W.; Li, Z. Effects of forest cover change on catchment evapotranspiration variation in China. Hydrol. Process. 2020, 34, 2219–2228. [Google Scholar] [CrossRef]
  17. Zhang, L.; Dawes, W.R.; Walker, G.R. Response of mean annual evapotranspiration to vegetation changes at catchment scale. Water Resour. Res. 2001, 37, 701–708. [Google Scholar] [CrossRef]
  18. Geng, Y. Toward safe treatment of municipal solid wastes in China’s urban areas. Environ. Sci. Technol. 2012, 46, 7067–7068. [Google Scholar] [CrossRef] [PubMed]
  19. Newman, P. The environmental impact of cities. Environ. Urban. 2016, 18, 275–295. [Google Scholar] [CrossRef]
  20. Liu, Y.; Song, H.; An, Z.; Sun, C.; Trouet, V.; Cai, Q.; Zeng, X. Recent anthropogenic curtailing of Yellow River runoff and sediment load is unprecedented over the past 500 y. Proc. Natl. Acad. Sci. USA 2020, 117, 18251–18257. [Google Scholar] [CrossRef] [PubMed]
  21. Shi, R.; Wang, T.; Yang, D.; Yang, Y. Streamflow decline threatens water security in the upper Yangtze River. J. Hydrol. 2022, 606, 127448. [Google Scholar] [CrossRef]
  22. Wang, X.; Wang, Z.; Yang, W.; Xi, X.; Shi, L.; Dong, W.; Zhang, Q.; Zhou, Y. Shortage of water resources in China and counter measures. Water Pollut. Control 2014, 7, 1–5. (In Chinese) [Google Scholar]
  23. Su, Y.; Gao, W.; Guan, D.; Su, W. Dynamic assessment and forecast of urban water ecological footprint based on exponential smoothing analysis. J. Clean. Prod. 2018, 195, 354–364. [Google Scholar] [CrossRef]
  24. Rockström, J.; Lannerstad, M.; Falkenmark, M. Assessing the water challenge of a new green revolution in developing countries. Proc. Natl. Acad. Sci. USA 2007, 104, 6253–6260. [Google Scholar] [CrossRef] [PubMed]
  25. Guo, J.; Guan, H.; Zhang, X. Growing season NDVI variation in the Dongting Lake Watershed from 1982 to 2010 and the climatic and anthropogenic influences. Res. Environ. Yangze Basin 2015, 24, 1305–1314. (In Chinese) [Google Scholar]
  26. Yue, D.; Xu, X.; Hui, C.; Xiong, Y.; Han, X.; Ma, J. Biocapacity supply and demand in Northwestern China: A spatial appraisal of sustainability. Ecol. Econ. 2011, 70, 988–994. (In Chinese) [Google Scholar] [CrossRef]
  27. Zhao, M.Y.; Cheng, C.T.; Chau, K.W.; Li, G. Multiple criteria data envelopment analysis for full ranking units associated to environment impact assessment. Int. J. Environ. Pollut. 2006, 28, 448–464. [Google Scholar] [CrossRef]
  28. Zhang, Q.; Xie, S. Using Ecological Water Footprint Model to Analyze Sustainable Use of Water Resources in Chongqing. J. Irriga. Drain. 2019, 38, 1672–3317. [Google Scholar]
  29. Fan, X.Q. Research and Application of Water Resources Ecological Footprint. Ph.D. Thesis, Hohai University, Nanjing, China, 2005. (In Chinese). [Google Scholar]
  30. Wackenagel, M.; William, E.R. Our Ecological Footprint: Reducing Human Impact on the Earth; New Society Publishers: Gabriola Island, BC, Canada, 1996; pp. 3–34. [Google Scholar]
  31. Wackernagel, M.; Jonathan, L. Measuring Sustainable Development: Ecological Footprints; Centre for Sustainability Studies, Universidad Anahuac de Xalapa: Xalapa-Enríquez, Mexico, 2001. [Google Scholar]
  32. Zhao, C.; Dong, C.; Wu, L.; Tong, Y. Spatial-temporal pattern of water resources ecological footprint in Zhejiang Province. Bull. Soil Water Conserv. 2016, 36, 242–248. (In Chinese) [Google Scholar]
  33. Chen, Z.; Chen, X. Temporal and Spatial Distribution and Driving Effects of Water Ecological Footprint in Shandong Province. Yellow River 2020, 42, 76–80. (In Chinese) [Google Scholar]
  34. Xia, J.; Diao, Y.; She, D.; Li, X.; Zhang, Y.; Ding, W.; Yao, C.; Liu, Z. Analysis on ecological security and ecological carrying capacity of water resources in the Poyang Lake Basin. Water Res. Prot. 2022, 38, 1–24. [Google Scholar]
  35. Wang, Y.; Cheng, H.; Huang, L. Water resources carrying capacity evaluation of a dense city group: A comprehensive water resources carrying capacity evaluation model of Wuhan urban agglomeration. Urban Water J. 2018, 15, 615–625. [Google Scholar] [CrossRef]
  36. Shiklomanov, I.A. The world’s water resources. In Proceedings of the International Symposium to Commemorate; The United Nations Educational, Scientific and Cultural Organization: Paris, France, 1998; Volume 25, pp. 93–126. [Google Scholar]
  37. Liu, N.; Buckley, T.N.; He, X.; Zhang, X.; Zhang, C.; Luo, Z.; Wang, H.; Sterling, N.; Guan, H. Improvement of a simplified process-based model for estimating transpiration under water-limited conditions. Hydrol. Process. 2019, 33, 1670–1685. [Google Scholar] [CrossRef]
  38. Mu, Q.; Heinsch, F.A.; Zhao, M.; Running, S.W. Development of a global evapotranspiration algorithm based on MODIS and global meteorology data. Remote Sens. Environ. 2007, 111, 519–536. [Google Scholar] [CrossRef]
  39. Mu, Q.; Zhao, M.; Running, S.W. Improvements to a MODIS global terrestrial evapotranspiration algorithm. Remote Sens. Environ. 2011, 115, 1781–1800. [Google Scholar] [CrossRef]
  40. Huang, L.N.; Zhang, W.X.; Jiang, C.L.; Fan, X.Q. Ecological footprint method in water resources assessment. Acta Ecol. Sin. 2008, 3, 1279–1286. (In Chinese) [Google Scholar]
  41. Zhu, J.W.; Chen, Y.Y.; Wang, B.; Zhao, Y.; Wang, J.R.; Zhang, M. Analysis based on water ecological footprint for sustainable utilization of water resources in the Guanzhong plain, China. IOP Conf. Ser. Earth Environ. Sci. 2018, 191, 012106. [Google Scholar] [CrossRef]
  42. Zhang, Y. Evaluation of sustainable utilization of water resources in Hechi City based on ecological footprint model. S. N. Water Transf. Water Sci. Technol. 2013, 11, 26–30. (In Chinese) [Google Scholar]
  43. Deng, C.; Zhu, D.; Nie, X.; Liu, C.; Zhang, G.; Liu, Y.; Li, Z.; Wang, S.; Ma, Y. Precipitation and urban expansion caused jointly the spatiotemporal dislocation between supply and demand of water provision service. J. Environ. Manag. 2021, 299, 113660. [Google Scholar] [CrossRef]
  44. Pascolini-Campbell, M.; Reager, J.T.; Chandanpurkar, H.A.; Rodell, M. A 10 percent increase in global land evapotranspiration from 2003 to 2019. Nature 2021, 593, 543–547. [Google Scholar] [CrossRef]
  45. Hu, C.; Fang, C.; Cao, W. Shrinking of Dongting Lake and its weakening connection with the Yangtze River: Analysis of the impact on flooding. Int. J. Sediment Res. 2015, 30, 256–262. [Google Scholar] [CrossRef]
  46. Budyko, M.I.; Miller, D.H.; Miller, D.H. Climate and Life; Academic Press: New York, NY, USA, 1974. [Google Scholar]
  47. Han, J.; Yang, Y.; Roderick, M.L.; Mcvicar, T.R.; Yang, D.; Zhang, S. Assessing the steady-state assumption in water balance calculation across global catchments. Water Resour. Res. 2020, 56, e2020WR027392. [Google Scholar] [CrossRef]
  48. Yin, D.; Roderick, M.L. Inter-annual variability of the global terrestrial water cycle. Hydrol. Earth Syst. Sci. 2020, 24, 381–396. [Google Scholar] [CrossRef]
  49. Fu, J.; Kuan, W.; Deng, Y.; Tian, Y.; Zhao, S. Trends of precipitation variations and their spatial paterns in Hunan Province over 56 years (1960–2015). J. Southwest Uni. 2021, 43, 110–119. (In Chinese) [Google Scholar]
  50. Wang, X.; Xia, W.; Yang, Y.; Yang, Q. Spatio-temporal distribution and its dynamic trend of precipitation in Hunan Province. Hunan Agr. Sci. 2018, 1, 60–63. (In Chinese) [Google Scholar]
  51. Zhang, M.; Zeng, Y.; Qi, Y. Analyzing spatio-temporal variations of evapotranspiration in Dongting Lake Basin during 2000–2014 based on MOD16. Trans. Chin. Soc. Agric. Eng. 2018, 34, 160–168. (In Chinese) [Google Scholar]
  52. Li, P.; Sun, M.; Liu, Y.; Ren, P.; Peng, C.; Zhou, X.; Tang, J. Response of Vegetation Photosynthetic Phenology to Urbanization in Dongting Lake Basin, China. Remote Sens. 2021, 13, 3722. [Google Scholar] [CrossRef]
  53. Hartmann, H.; Snow, J.A.; Su, B.; Jiang, T. Seasonal predictions of precipitation in the Aksu-Tarim River basin for improved water resources management. Global Planet. Chang. 2016, 147, 86–96. [Google Scholar] [CrossRef]
  54. Ward, E.; Buytaert, W.; Peaver, L.; Wheater, H. Evaluation of precipitation products over complex mountainous terrain: A water resources perspective. Adv. Water Resour. 2011, 34, 1222–1231. [Google Scholar] [CrossRef]
  55. Bao, C.; He, D. The causal relationship between urbanization, economic growth and water use change in provincial China. Sustainability 2015, 7, 16076–16085. [Google Scholar] [CrossRef]
  56. Bao, C.; Chen, X.J. The driving effects of urbanization on economic growth and water use change in China: A provincial-level analysis in 1997–2011. J. Geogr. Sci. 2015, 5, 530–544. [Google Scholar] [CrossRef]
  57. Yang, Z.W.; Liu, H.L.; Xu, X.Y.; Yang, T.T. Applying the water footprint and dynamic structural decomposition analysis on the growing water use in China during 1997–2007. Ecol. Indic. 2016, 60, 634–643. [Google Scholar] [CrossRef]
  58. Wang, Y.; Zhou, X.; Engel, B. Water environment carrying capacity in Bosten Lake basin. J. Clean. Prod. 2018, 199, 574–583. [Google Scholar] [CrossRef]
  59. Kisakye, V.; Bruggen, B. Effects of climate change on water savings and water security from rainwater harvesting systems. Resour. Conserv. Recycl. 2018, 138, 49–63. [Google Scholar] [CrossRef]
  60. Wang, Y.; Wang, Y.; Su, X.; Qi, L.; Liu, M. Evaluation of the comprehensive carrying capacity of interprovincial water resources in China and the spatial effect. J. Hydrol. 2019, 575, 794–809. [Google Scholar] [CrossRef]
  61. Pietrucha-Urbanik, K. Assessment model application of water supply system management in crisis situations. Glob. NEST J. 2014, 16, 893–900. [Google Scholar]
  62. Luo, M.; Liu, T.; Meng, F.; Duan, Y.; Bao, A.; Xing, W.; Feng, X.; Maeyer, P.; Frankl, A. Identifying climate change impacts on water resources in Xinjiang, China. Sci. Total Environ. 2019, 676, 613–626. [Google Scholar] [CrossRef]
  63. Wang, P.; Wei, Y.; Zhong, F.; Song, X.; Wang, B.; Wang, Q. Evaluation of Agricultural Water Resources Carrying Capacity and Its Influencing Factors: A Case Study of Townships in the Arid Region of Northwest China. Agriculture 2022, 12, 700. [Google Scholar] [CrossRef]
  64. Li, P.; Qian, H. Water resources research to support a sustainable China. Int. J. Water Resour. D. 2018, 34, 327–336. [Google Scholar] [CrossRef]
  65. Ober, J.; Karwot, J.; Rusakov, S. Tap water quality and habits of its use: A comparative analysis in poland and ukraine. Energies 2022, 15, 981. [Google Scholar] [CrossRef]
  66. Chen, B.; Wang, M.; Duan, M.; Ma, X.; Hong, J.; Xie, F.; Zhang, R.; Li, X. In search of key: Protecting human health and the ecosystem from water pollution in China. J. Clean. Prod. 2019, 228, 101–111. [Google Scholar] [CrossRef]
  67. Chai, L.; Li, H.; Yang, Z.; Min, X.; Liao, Q.; Liu, Y.; Men, S.; Yan, Y.; Xu, J. Heavy metals and metalloids in the surface sediments of the Xiangjiang River, Hunan, China: Distribution, contamination, and ecological risk assessment. Environ. Sci. Pollut. R. 2017, 24, 874–885. [Google Scholar] [CrossRef] [PubMed]
  68. Hu, B.; Shao, S.; Ni, H.; Fu, Z.; Hu, L.; Zhou, Y.; Min, X.; She, S.; Chen, S.; Huang, M.; et al. Current status, spatial features, health risks, and potential driving factors of soil heavy metal pollution in China at province level. Environ. Pollut. 2020, 266, 114961. [Google Scholar] [CrossRef]
  69. Li, X.; Zhao, Z.; Yuan, Y.; Wang, X.; Li, X. Heavy metal accumulation and its spatial distribution in agricultural soils: Evidence from Hunan province, China. RSC Adv. 2018, 8, 10665–10672. [Google Scholar] [CrossRef]
  70. Cheng, M.; Jiao, X.; Jin, X.; Li, B.; Liu, K.; Shi, L. Satellite time series data reveal interannual and seasonal spatiotemporal evapotranspiration patterns in China in response to effect factors. Agric. Water Manag. 2021, 255, 107046. [Google Scholar] [CrossRef]
  71. Fu, J.; Gong, Y.; Zheng, W.; Zou, J.; Zhang, M.; Zhang, Z.; Qin, J.; Liu, J.; Quan, B. Spatial-temporal variations of terrestrial evapotranspiration across China from 2000 to 2019. Sci. Total Environ. 2022, 825, 153951. [Google Scholar] [CrossRef] [PubMed]
  72. Li, X.; He, Y.; Zeng, Z.; Lian, X.; Wang, X.; Du, M.; Jia, G.; Li, Y.; Ma, Y.; Tang, Y.; et al. Spatiotemporal pattern of terrestrial evapotranspiration in China during the past thirty years. Agric. For. Meteorol. 2018, 259, 131–140. [Google Scholar] [CrossRef]
  73. Zhang, Y.; Kong, D.; Zhang, X.; Tian, J.; Li, C. Impacts of vegetation changes on global evapotranspiration in the period 2003–2017. Acta Geogr. Sin. 2017, 76, 584–594. [Google Scholar]
  74. Ma, J.; Chen, Y.; Hao, X.; Li, D. Temporal and spatial changes of surface evapotranspiration and its influencing factors in Henan Province from 2001 to 2019. Res. Soil Water Conserv. 2021, 28, 134–151. (In Chinese) [Google Scholar]
  75. Wen, Y.; Zhao, J.; Wang, Y.; Wang, Y.; Wang, J. Spatiotemporal variation characteristics of surface evapotranspiration in Shanxi Province based on MOD16. Prog. Geogr. 2020, 39, 255–264. (In Chinese) [Google Scholar] [CrossRef]
  76. Shao, X.; Zhang, Y.; Liu, C.; Chiew, F.H.; Tian, J.; Ma, N.; Zhang, X. Can indirect evaluation methods and their fusion products reduce uncertainty in actual evapotranspiration estimates? Water Resour. Res. 2022, 58, e2021WR031069. [Google Scholar] [CrossRef]
Figure 1. Location of Hunan Province highlighted in blue (a). Basic overview of the 14 prefecture-level cities in Hunan Province in terms of the environment, including main rivers and digital elevation model (DEM, m) (b), and society, including gross domestic product (GDP) and population (c).
Water 14 02477 g001
Figure 2. Temporal (a) and spatial (b) variations in total water resources, surface water resources, and groundwater resources among the 14 prefecture-level cities from 2010 to 2019. The whiskers represent the maximum and minimum values, the top and bottom of the boxes are the 25th and 75th percentiles, respectively, the median is represented by the horizontal line, and the mean by the open rectangle. The dotted lines in (a) are the trend lines of surface water resources in red and groundwater resources in yellow.
Water 14 02477 g002
Figure 3. Spatial distribution of average annual precipitation based on data from 2010 to 2019 in Hunan Province (a), and the average annual precipitation trend during this period (b).
Water 14 02477 g003
Figure 4. Spatial distribution of average annual evapotranspiration (ET) based on the data from 2010 to 2019 in Hunan Province (a), and its trend during this period (b).
Water 14 02477 g004
Figure 5. Regional average annual water resources ecological footprint (EFw) (106 hm2) and its components from 2010 to 2019 over 14 prefecture-level cities in Hunan Province. Dynamics of total EFw from 2010 to 2019 of each city are shown in mini green histograms. The X-axis range of all green histograms is set as (0.76, 6.7) (106 hm2).
Water 14 02477 g005
Figure 6. Change in the percentage of EFw components from 2010 to 2019 of the 14 prefecture-level cities. Dotted lines in red, blue, yellow, and green are the trend lines of mean values of agricultural, industrial, domestic, and eco-environmental EFw, respectively.
Water 14 02477 g006
Figure 7. Average annual per capita EFw (a) and ECw (b) (hm2/per capita) over the 14 prefecture-level cities.
Water 14 02477 g007
Figure 8. Spatial patterns of per capita water ecological pressure index (WEPI) in 2010 (a), 2015 (b), and 2019 (c), and the average from 2010 to 2019 (d).
Water 14 02477 g008
Figure 9. Temporal dynamics of water resources and precipitation from 2010 to 2019 (a) and the relationship between average annual precipitation (in units of 108 m3/year converted from mm/year from multiple areas of Hunan Province), and annual total water resources (in black), surface water resources (in red), and groundwater resources (in green) (b).
Water 14 02477 g009
Table 1. The 10,000 CNY GDP water resources ecological footprint (hm2/10,000 CNY).
Years2010201120122013201420152016201720182019Mean
Cities
Changsha0.1380.1110.0980.0890.0810.0730.0650.0590.0640.0510.082
Zhuzhou0.3090.2330.2110.1960.1770.1570.1460.1420.1380.1210.183
Xiangtan0.3470.2860.2550.2270.2020.1930.1750.1590.1600.1530.216
Hengyang0.3880.3110.2760.2590.2340.2070.1870.1800.1860.1600.239
Shaoyang0.6150.4800.4280.3960.3580.3210.2930.2680.2500.2030.361
Yueyang0.3150.2770.2380.2190.2000.2050.1940.1940.1790.1590.218
Changde0.4090.2400.2980.2670.2460.2300.2120.2000.2000.1810.258
Zhangjiajie0.3600.2920.2600.2390.2120.1890.1700.1580.1420.1380.216
Yiyang0.4550.4160.3530.3230.2830.2520.2460.2320.2250.2170.300
Chenzhou0.3630.2940.2630.2420.2170.2000.1800.1730.1600.1590.225
Yongzhou0.5540.4350.3860.3540.3200.2940.2640.2470.2300.2060.329
Huaihua0.4320.3450.2970.2660.2510.2280.2060.2030.1900.1780.260
Loudi0.4300.3110.2790.2510.2340.2000.1790.1770.1630.1550.238
Xiangxi0.4580.4410.3910.3620.3320.3040.2920.2690.2520.2150.332
Hunan Province0.3290.2680.2360.2150.1960.1790.1640.1550.1480.1360.203
Publisher’s Note: MDPI stays neutral with regard to jurisdictional claims in published maps and institutional affiliations.