Article

Comparison of Urbanization, Climate Change, and Drainage Design Impacts on Urban Flashfloods in an Arid Region: Case Study, New Cairo, Egypt

1
Water Resources Research Institute (WRRI), National Water Research Center (NWRC), Shoubra El-Kheima 13411, Egypt
2
Environmental Engineering Department, The American University in Cairo (AUC), New Cairo 11835, Egypt
*
Author to whom correspondence should be addressed.
Water 2022, 14(15), 2430; https://doi.org/10.3390/w14152430
Submission received: 1 July 2022 / Revised: 29 July 2022 / Accepted: 30 July 2022 / Published: 5 August 2022
(This article belongs to the Special Issue Urban Floods in a Changing Climate)

Abstract

:
Urban flooding is considered one of the hazardous disasters in metropolitan areas, especially for those located in arid regions. Due to the associated risks of climate change in increasing the frequency of extreme rainfall events, climate-induced migration to urban areas leads to the intensification of urban settlements in arid regions as well as an increase in urban expansion towards arid land outskirts. This not only stresses the available infrastructure but also produces substantial social instability due to unplanned urban growth. Therefore, this study sheds light on the main factors that are increasing the flood risk, through examining the consequences of rapid urban growth and the performance of drainage networks on urban flood volumes and comparing it with the effects induced by climate change on the surface runoff. The effect of urbanization is assessed through land use maps showing the historical urbanization conditions for the past 30 years, while considering the role of urban planning and its effect on exacerbating surface runoff. Six climate projection scenarios adopted from three Global Climate Models under two Representative Concentration Pathways (4.5 and 8.5) during the period (2006–2020) were compared to ground observed rainfall data to identify which climate scenario we are likely following and then evaluate its effects on the current rainfall trends up to the year 2050. The significance of the drainage design in the mitigation or increase of surface runoff is evaluated through capacity-load balance during regular and extreme storms. It is found that using impervious surfaces coupled with poor planning causing the blockage of natural flood plains led to an increase in the total runoff of about 180%, which is three times more than the effect induced by climate change for the same analysis period. Climate change decreased the intensities of 2- and 5-year rainfall events by 6% while increasing the intensities of extreme events corresponds to 100-year by 17%. Finally, the urban drainage had a distinguished role in increasing surface runoff, as 70% of the network performed poorly during the smallest rainfall event of 2-year return period. The study emphasizes the urgency to re-evaluate the existing and future urban drainage design approach: although urban development and climate change have inevitable effects on the increase in urban flood volumes, it could be alleviated through improved infrastructures.

1. Introduction

Climate change coupled with population growth poses an imminent threat to human sustainability and livelihoods [1]. Rapid and unplanned population growth has prompted a surge in urbanization rate on a planetary level [2]. Urbanization has had to cope with the swift increase in the percentages of city dwellers due to an intricate multi-factorial equation that comprises both population growth and rural/urban migration [3,4]. This phenomenon is most apparent in the continents of Africa, where it is expected that by 2050, 2.4 billion more people will inhabit it in addition to its current 1.1 billion individuals [5]. The dilemma is further exacerbated when the issue of poor urban planning is factored into the equation. Poor urban planning has increased the vulnerability of contemporary urban areas to the adverse effects of climate change and population growth, more specifically the flash floods occurring in urban areas [6,7,8]. Urban flash floods constitute a critical risk to the urban conglomerations, more specifically the urban mega-cities that are in geographically arid regions, as flooding is expected to increase globally, especially in densely populated metropolitans [9]. As a result, the arid regions are becoming significantly vulnerable to environmental fluctuations, which causes growing risk for people’s lives, infrastructure, and environment [9,10].
Arid regions, especially the Middle East and North Africa (MENA) region, are categorized as part of the developing nation regions suffering from a compounded quandary. They are faced with a decline in precipitation because of climate change, and an increase in out-of-season flash floods [11], that have drastic negative ramifications on their socio-economic sustainability. Despite the high water needs of such arid regions, the MENA area is regarded as having the least amount of water globally [12]. The MENA region’s climate is expected to undergo significant precipitation decrease, according to the Intergovernmental Panel on Climate Change (IPCC)’s 4th Assessment Report [13]. On the other hand, the 6th IPCC report projected that extreme rainfall events as well as pluvial areas are projected to increase in the MENA region with high confidence [14]. Climate change impacts are evaluated through climate scenarios that seek to predict and fixate the ever-changing factors of the climate change equation [15]. The climate change projections are based mainly upon human activities and their nature [16]. The IPCC scenarios oscillate between severe adverse climatic impact upon the human conglomerations to mild impact. However, regardless of the climate scenario, there is an increased chance of out-of-season floods and water runoffs with a medium-to-high degree of certainty. For example, the runoff is projected to increase up to 40% in higher latitude wet areas, while the arid areas suffering from drought may increase in size, although the extreme rainfall events are expected to increase [16]. The IPCC calls for a thorough assessment impact analysis to be executed on a regional level to further the efforts that are directed towards procreating adequate and comprehensive adaptation plans.
Due to the anticipated negative effects on coastal zones, agriculture, water security, and social and health effects of climate change, Egypt is one of the most endangered countries [17]. Moreover, due to Egypt’s large population and their dense residence in the Nile delta, it is vulnerable to any extreme rain events [18]. Although Egypt is mostly an arid country with an average rainfall of 19 mm per year on most of its area [19], since 2015 rainfall events are becoming extreme and occurring almost every year, which disturb the essential services of individuals like transportation, electricity, water supply, and drainage [20]. For instance, flash floods hit various parts of Egypt in 2015 and 2016 caused by severe rainfall of an intensity that exceeds 40 millimeters per day, resulting in the loss of tens of lives and infrastructure destruction [21]. Furthermore, in 2018 and 2020, Egypt witnessed unprecedented extreme weather events including heavy rainfall that exceeded 60 millimeters per day, thunderstorms, and flash floods, which affected more than 20 thousand families and resulted in more than 430 injuries and 40 mortalities. In addition, the storms caused destruction to main highways and the closure of key facilities like airports, seaports, schools, and businesses [22,23]. After these dramatic repercussions of extreme rainfall events that were not experienced previously in this arid area, concerns were raised regarding the forthcoming storms and how to prepare for them properly, as currently the government announces an emergency state during any upcoming storm regardless of its intensity to avoid any catastrophic consequences [24]. Therefore, understanding the drivers behind urban floods is vital to assist in the alleviation of future impacts of extreme rainfall events and to aid in the reduction of their devastating impacts. It is worth noting that urban flooding is not just influenced by urbanization and climate change; future flood management strategies may also be challenged by the inadequate drainage network [25,26,27].
The drainage systems adopted in most of the urban cities of developing nations are usually combined sewer systems with relatively low capacity. Most of the combined sewer systems were designed without regard to the alteration in land uses intersecting with the natural routes of flashfloods. That in turn increased the susceptibility of the sewer systems to flash floods, as they became the main route for runoff discharges rather than t natural recourse routes. Additionally, the increased extreme rainfall events along with the enlarged wastewater discharges due to population increases are all factors that have a drastic negative effect by overwhelming the drainage systems, causing sudden overflows [28]. The current drainage systems that are present prohibit the adequate discharge of the rainfall excesses or the preservation of such a valuable water source for direct and indirect consumption [2,28]. The importance of adequately studying flash floods and designing contemporary frameworks for safeguarding and adaptation to the changing patterns of flash floods can be further highlighted when taking into account that, according to the UN, 43% of the natural disasters worldwide from the year 1995 till the year 2015 were caused by floods, affecting around 56% of those plighted by natural disasters, with a relatively high percentage of casualties reaching around 25% [29].
The main objective of this research is to identify the key driver(s) influencing urban flash floods occurring in a major city that represents a typical urban settlement in a developing arid country, particularly through studying the impacts of urbanization and climate change on urban runoff volumes while considering the role of the drainage system and its impact on the surface runoff. Firstly, the effect of urbanization on the surface runoff was assessed through spatially distributed land use maps showing the historical urbanization conditions for the past 30 years between 1990 to 2020, where the impact is assessed through simulating rainfall corresponds to different return periods and at different urbanization levels; furthermore, the weight of urban planning and its effect upon exacerbating surface runoff was also considered. Secondly, the effect of climate change was studied through six climate change projection scenarios extracted from three Global Climate Models (GCMs) under two Representative Concentration Pathways (RCPs), 4.5 and 8.5, during the period (2006–2020); the scenarios were then compared with ground observed rainfall data, followed by an evaluation of the analysis to comprehend effects on the current rainfall trends up to the year 2050. Finally, an assessment is conducted for the current drainage system through simulating actual drainage loads and conducting a capacity balance during normal operation conditions and extreme rainfall storms. This study is the first urban runoff analysis and modeling work to be undertaken for the chosen study area, to the best of the author’s knowledge, and it has significant implications for many developing arid-region countries, which are anticipated to undergo rapid urbanization with large-scale land use changes.

2. Materials and Methods
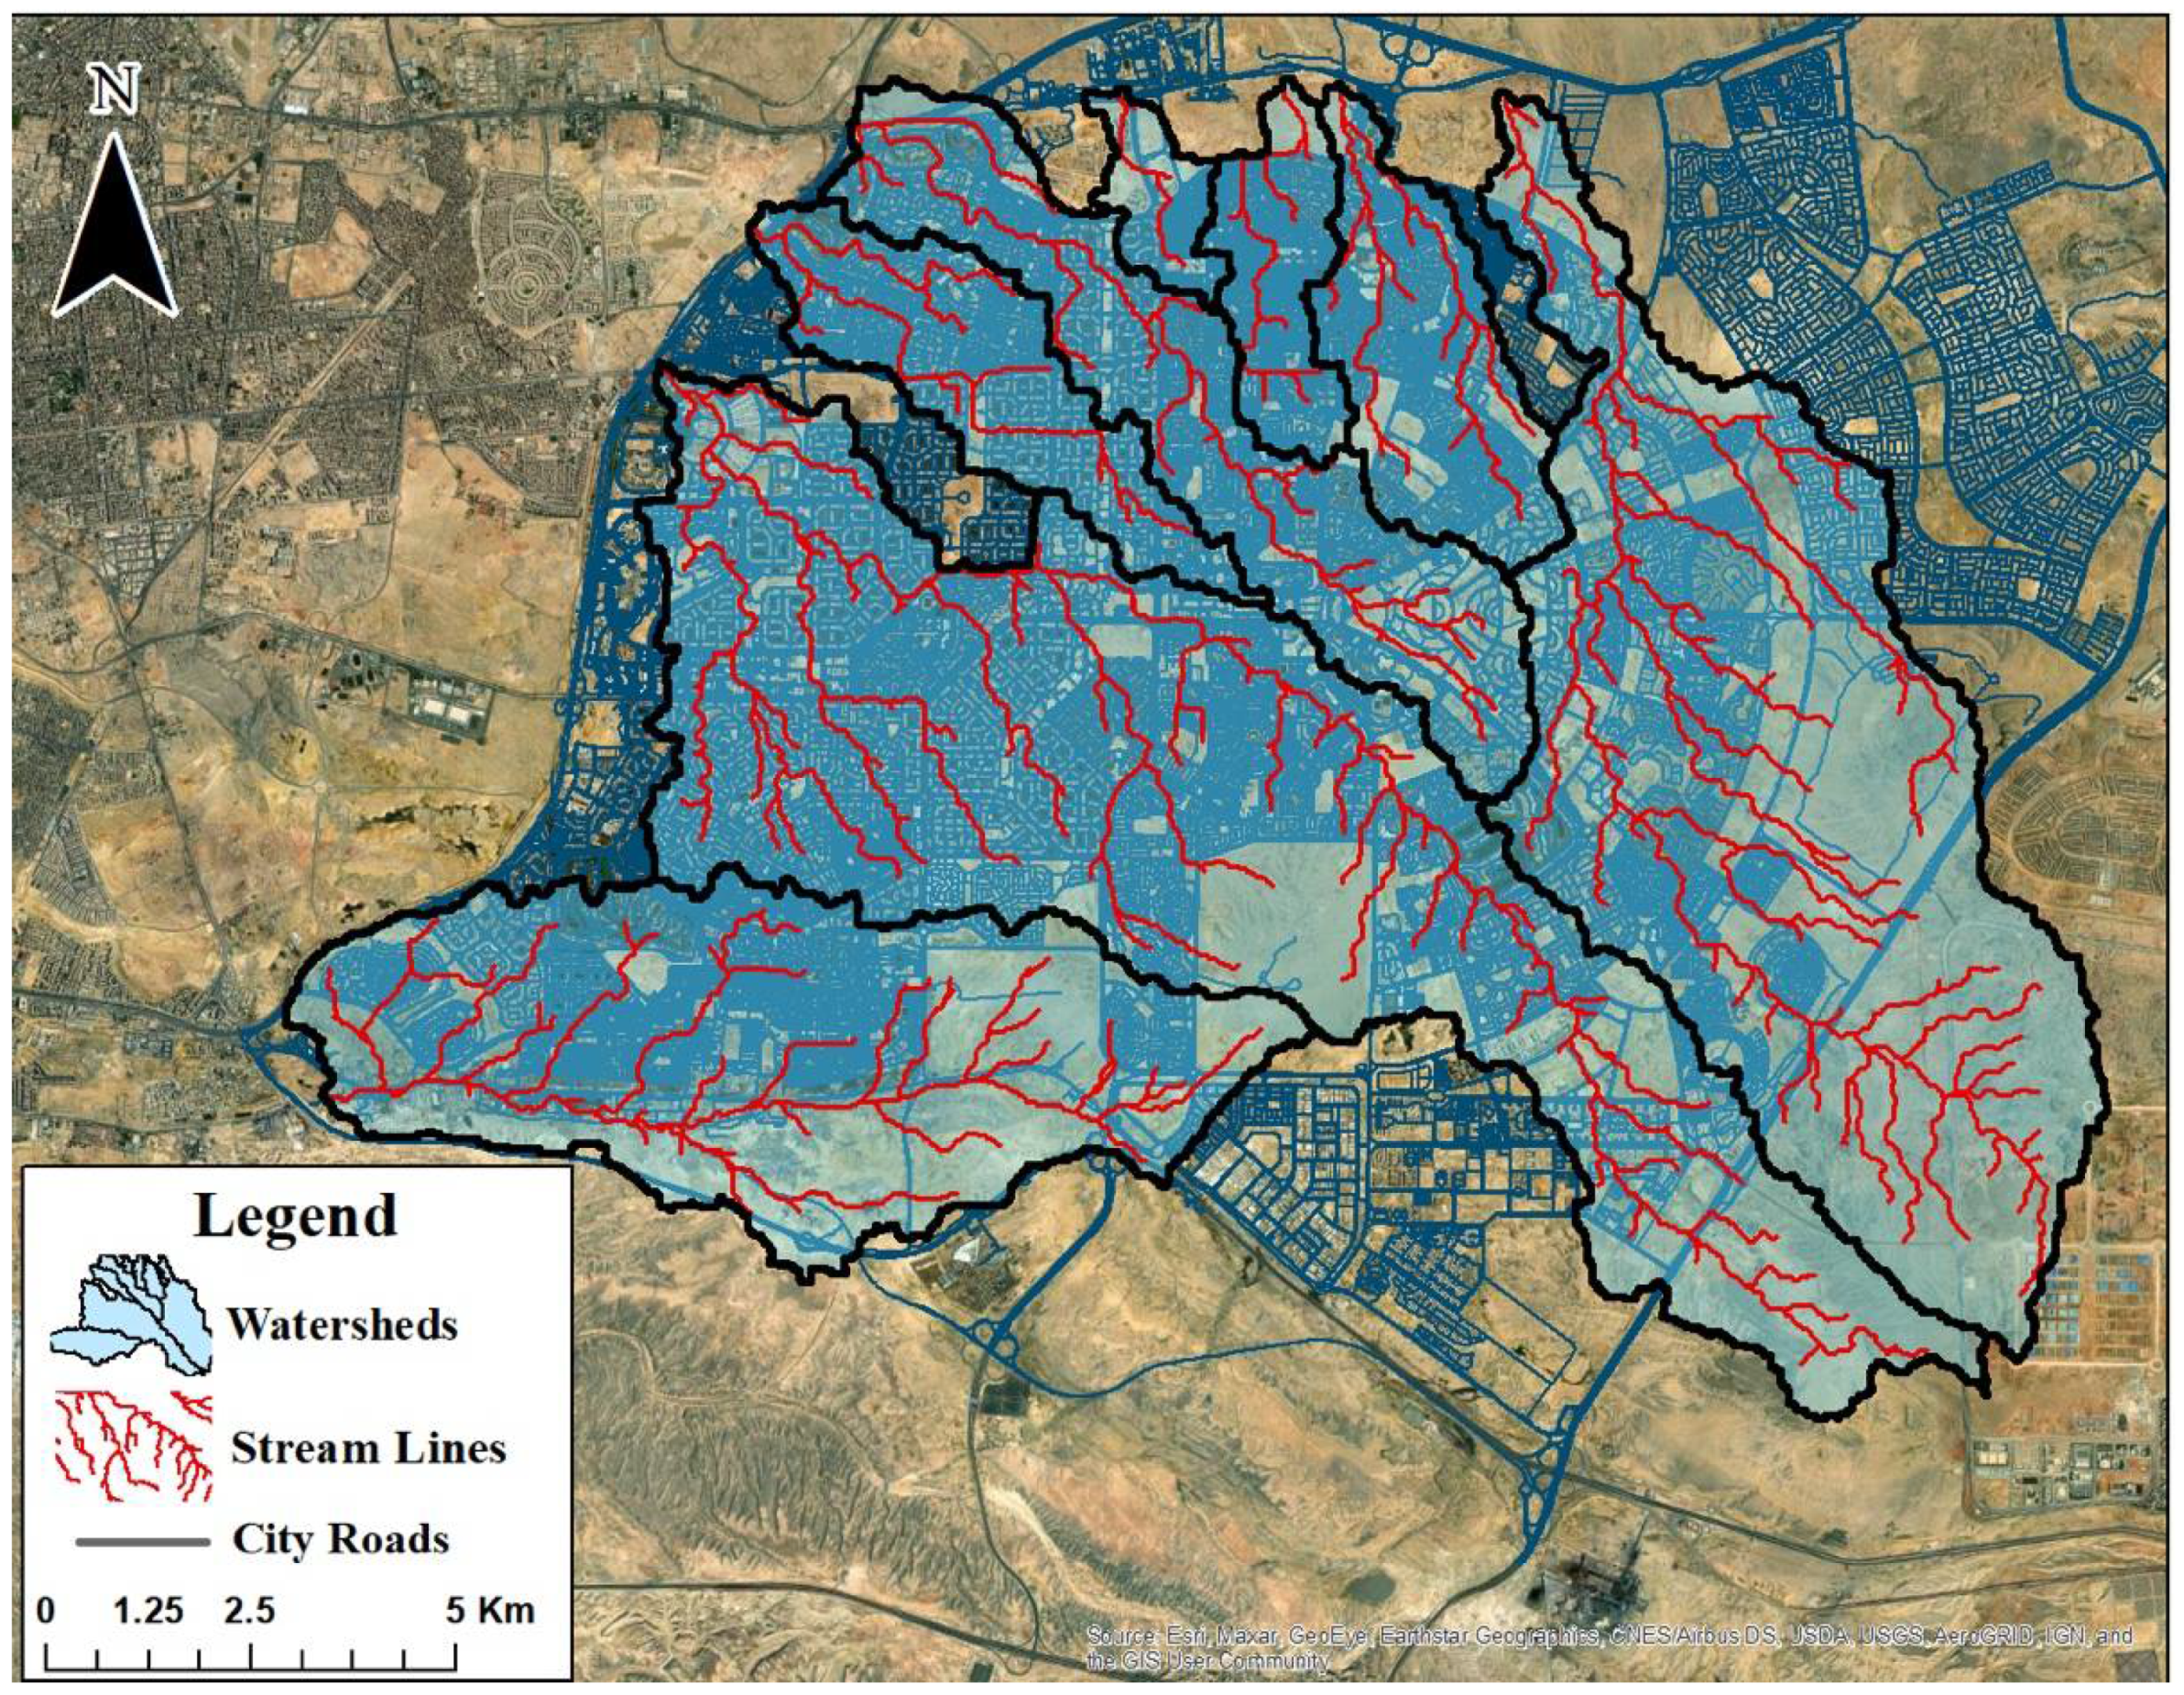
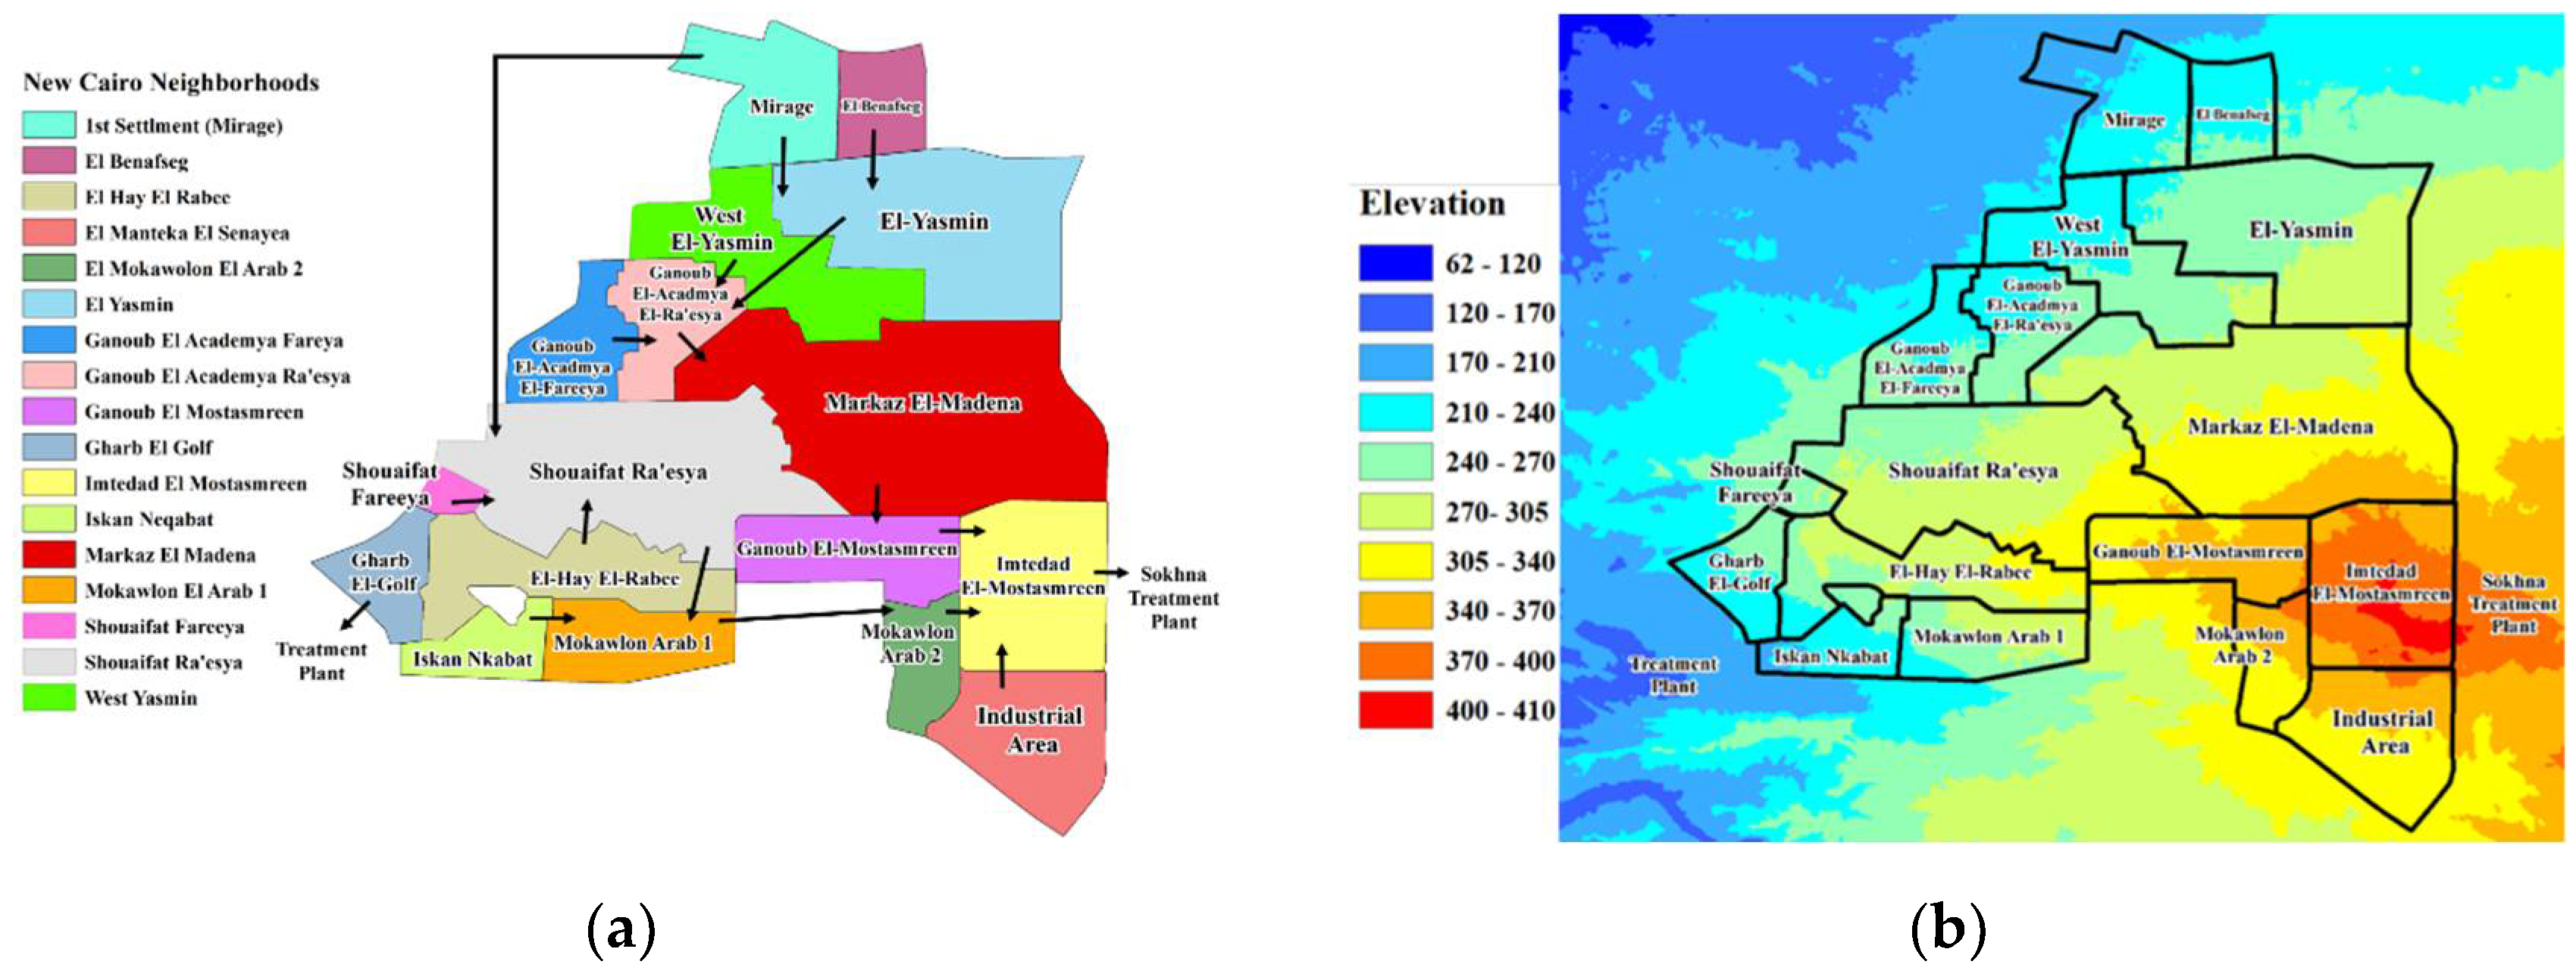
2.1. Study Area

New Cairo is the capital of Egypt (Figure 1). The city was established in the year 2000, with a total area of about 250 km2 and targeted population of four million residents. The city contains different land uses such as residential, industrial, recreational, and services areas. For this study, the land use is divided into two main groups, which are urbanized and un-urbanized areas; the urbanized areas include areas under construction, fully urbanized areas and urban areas that have more than 50% green space, while the un-urbanized areas are rural areas that does not have any human interventions. The city was constructed on a fluvial area, where the topography is high at the southeastern boundary with elevation of 420 m above mean sea level (amsl) and low towards the northwestern boundary of the study area with elevation of 142 m amsl, while the slopes average between 0º and 5º, reaching 13º on the western side of the catchment area [30].
The rain falls between November to April, with a mean annual precipitation in the study area of around 13 mm and with a maximum 1-day rainfall of 25 mm [31]. In recent years, especially on 24 April 2018 and 12 March 2020, New Cairo was affected by heavy rainfall events that turned roads into lakes of flooded water; basements, low-level houses, and cars were entirely covered with rainwater [32]. As most of the cities in Egypt, the drainage system in New Cairo is combined. Local water authorities claim that flooding has been both more frequent and severe in recent years; the flood events in the past six years have caused a complete power outage and manholes in the streets exploded with backflow; consequently, drainage during storms have relied heavily on mobile pumping units as a backup of the drainage system. This increase in runoff can be blamed on many factors, such as extreme rainfall events due to climate change, effects of urbanization, or the undersized drainage system [33].

2.2. Data Sets

Five types of data were gathered and used in this research: (a) historical land use change maps from 1990 to 2020 [34], (b) topographic maps with scale 1:100,000 for the identification of flood plains and determination of watershed paths inside New Cairo city [35], (c) ground measured rainfall data from the nearest meteorological station, Cairo Airport station, starting from the year 1976 to 2020, (d) current as built drainage network data, and (e) climate change projection scenarios up to the year 2050 [36]. The data were provided in formats of documents, images, and datasets; therefore, data preprocessing was required to prepare them for use in ArcGIS and SewerGEMS analysis.
The multi-temporal land use maps and topographic maps were obtained based on historical remote sensing images and city layout provided by the local authorities [34,35]; moreover, using ArcGIS, all maps were georeferenced. The historical land use maps were outlined manually and validated using published reports, literature, and layouts provided by local authorities to guarantee a sufficient degree of accuracy [37,38]; whereas the topographical maps were used to delineate watersheds previously located in the area before urbanization using the Watershed Modeling System (WMS). Primary drainage system data were also gathered from municipal authorities, who provided drainage network records and relevant modeling parameters such as population, construction year, pipe diameter, and length. In addition, they provided flood data including recent flood observations and inundation locations within the study area.
Gauge-observed rainfall data were collected from the Egyptian Metrological Station (EMA) for the nearest meteorological station, 8 km away from the study area (30°7′40.39″ N, 31°24′7.77″ E) as shown in Figure 1. The rainfall data were collected for a total of 45 years from 1976 to 2020 and they were provided in terms of maximum rainfall in 24 hours per year and total monthly rainfall. In order to evaluate the current design of the drainage system using the same design approach, the rainfall design storm distribution followed the conventional technique stated in the Egyptian Code of Practice (ECP) for designing water and wastewater drainage networks [39]. In addition, the Soil Conservation Services (SCS) hypothetical storms profiles type II was used, as it is one of the most regularly used distribution hyetographs in Egypt as well as in the Middle East area [40], being suggested for use in the arid regions of the United States of America for its conservative approach [41,42]. Furthermore, this method is widely listed in the code of practice in several Arab countries [43,44]. Finally, the climate change projections were obtained from the Regional Initiative for the Assessment of Climate Change Impacts on Water Resources and Socio-Economic Vulnerability in the Arab Region (RICCAR) [36]. The climate change projections used are bias corrected, downscaled climate models acquired from three Global Climate Models (GCMs) adopted from the Coordinated Regional Climate Downscaling Experiment (CORDEX) data for MENA region. Specifically, we considered the European community Earth-System (EC-Earth), the Geophysical Fluid Dynamics Laboratory Earth System Model with Modular Ocean Model (GFDL-ESM2M) and the Centre National de Recherches Meteorologiques Coupled Global Climate Model, version 5 (CNRM-CM5) under two representative concentration pathways (RCPs 4.5 and 8.5). The RCP 4.5 represents a “stabilization scenario”, where efforts are made to stabilize the greenhouse gases emissions at 4.5 W/m2, while RCP 8.5 represent the failure of decreasing carbon emissions by 2100, which is considered a non-mitigation scenario [45,46].

2.3. Modeling

The Watershed Modelling System (WMS 11.0) is a hydrologic modeling system that provides tools for watershed modeling and hydrologic parameter calculation [47]. WMS was used for the runoff analysis as it provides the ability to spatially distribute the soil characteristics according to the land use, which can yield an accurate value for the surface runoff changes with the urbanization levels. The four main inputs for running the WMS are (a) Digital Elevation Model (DEM) with 30 m resolution acquired from United States Geological Survey (USGS), (b) land use and land cover data, (c) soil classification and characteristics using SCS Curve Number (CN) method [48], and (d) maximum daily rainfall correspond to different return periods. Since there are no recorded surface runoff flows, WMS was used as it models surface runoff using HEC-HMS, which has proved its effectiveness in simulating stream runoff in ungauged basins [49,50,51] without data validation or calibration [52,53]. However, it is crucial to check the accuracy of HEC-HMS model inputs to get a valid simulation of flows. HEC-HMS calculates the runoff via the following equations:
Q = P I a 2 P I a + S  
I a = 0.2 S
S = 100 C N 10
where:
Q is the excess rainfall, P is the rainfall depth, Ia is the initial abstraction, S is the potential maximum soil retention after the start of rainfall event.
Sanitary and Combined Sewer Modeling Software (SewerGEMS) is one of the best-known rainfall–runoff simulation models that have been applied in extensive studies on urban drainage and floods; it efficiently analyzes all the sewer network components such as slopes, diameters, etc., generates layouts and cross sections of the pipe network, and identifies areas that have been flooded and shows the water levels inside the sewerage systems [54,55,56]. In this study, the Storm Water Management Model (SWMM) solver inside SewerGEMS was used; it calculates the water ponding and surface water accumulation using the following equation [55]:
Q_Storage = Q_Input − Q_Output
where Q storage is the maximum surface storage (m3/s), Q input is the surface rainfall and wastewater discharge (m3/s), Q output is the outflow including surface runoff, infiltrations, and evaporation (m3/s).
On the other hand, the runoff is based on the continuity equation; it occurs when the depth of the water surpasses the network storage and is calculated using Manning Equation [57].
Q = 1.49 n   A R 2 / 3 S 1 / 2
where Q is the runoff flow rate (m3/s), A is the sub-catchment area (m2), R is the hydraulic radius sub-catchment, S is the slope of sub-catchment, and n is the manning roughness coefficient.
The infiltration is calculated using SCS curve number method. Several data inputs are used for the SewerGEMS simulation. First, the actual wastewater discharge, acquired from local authorities. Second, the rainfall data that corresponds to different return periods. Third, pipelines characteristics (i.e., diameter, shape, material, length, and location), the invert levels and street levels for the pipes and manholes, and pump station properties such as pumping curve and elevation are all key parameters to be inputted in the model acquired from the as built drawings of the sewer network. Finally, the shape of the catchment area, topography, imperviousness, and land use [54]. SewerGems is capable of steady-state simulation as well as transient simulations.

2.4. Methodology

2.4.1. Runoff Modeling Using Historical Urbanization Data

The impact of urbanization on surface runoff was investigated by simulating flow rates at different urbanization levels. The urbanization expansion and land use changes are manually identified from satellite images at five years’ interval from 1990 to 2020.
The maximum daily rainfall data, acquired from the nearest meteorological station in the study area, are statistically analyzed correspond to different return periods (2, 5, 10, 20, 50, and 100 years) [58]. Illustration of meteorological rainfall station data is shown in Figure 2, while the results of return period analysis are shown in Table 1. Furthermore, in order to assess the weight of urban planning and its effect upon exacerbating surface runoff, topographic maps as well as digital elevation models are obtained to be processed for the delineation of any watersheds that existed before urbanization, to make certain weather urban planning considered, or constriction of the natural water drainage channels [59,60,61].

2.4.2. Climate Change Projections Comparison and Evaluation

Climate change scenarios are compared to ground observed rainfall data to investigate whether the patterns of major rainstorms recorded are repercussions of climate change projection or a mere reoccurrence of the normal historical trends. If the hypothesis that the experienced rainfall events are closely related to one of the climate models is deemed true, it will greatly assist in understanding the future impacts of the current climate scenario and in creating a contemporary holistic adaptation plan that might comprehensively tackle the multifactorial equation pertaining to urban floods. Instead of utilizing raw climate data, downscaled and bias-adjusted climate models are employed due to the substantial uncertainties involved with the raw climate models. This pre-processing may also to some extent reduce the systematic errors in climate models. Therefore, six ensembles are used to be compared with ground observed data. They are downscaled and bias-corrected against ground-measured rainfall data by RICCAR from the year 1986 to 2005 by one Regional Climate Model (RCM) to a resolution of 0.44°, then the climate model is projected from the year 2006 to 2100. The total monthly data are the most suitable temporal resolution for comparison, where the monthly accumulation reduces the noise in the data, and it includes all the rainy days in a certain given month [62]. Consequently, the comparison is conducted based on six statistical indicators for the common period between the actual ground data that already occurred and the climate projections starting from the year 2006 to 2020 for a total period of 15 years. If a climate model is found to represent the current extreme events, an evaluation and analysis can be conducted to comprehend its effects on the current rainfall trends up to the year 2050. Moreover, its effect on runoff volumes can be evaluated and compared with the effects induced due to urbanization. A summary of the statistical indicators equations and ranges are shown in Table 2 [63,64], while the detailed limits of all statistical criteria are shown in Table 3 [63,64].

2.4.3. Drainage Network Evaluation

Due to the country’s severe limitations in data collection and availability, the sewer network capacity and current wastewater loads were only collected for 17 neighborhoods, representing 53% of the current total urbanized areas in New Cairo (Figure 3). A sewer network assessment of New Cairo was conducted to understand the contribution of the current drainage system to the urban flood volumes through validating its accommodation for the normal drainage operation, followed by an actual drainage load-capacity balance during storms, to evaluation of the performance of the drainage network with various rainfall frequencies (i.e., 2, 5, 10, 20, 50, and 100 years). The evaluation was conducted with this approach as the design of the combined sewer network has a predictive methodology by which the designer should include rainfall quantities according to the desired return period; however, the return period is identified according to the risk probability of the project’s location to face flashfloods and according to the required degree of conservativity in the network design. In this research, there is no information regarding the return period or the exact storm intensity that the sewer network was designed for, therefore it is important to simulate different return periods in order to evaluate the current drainage system and identify its capacity to ensure if the drainage is designed properly and that the previous urban flood volumes were influenced by other factors and not due to drainage network under-design.
The evaluation was conducted for three scenarios: (i) the base scenario, where the sewer network discharges wastewater only, to ensure that the system is sufficient for the wastewater flows they usually manage; (ii) the evaluation of the drainage network through drainage load-capacity balance during rainfall storms that correspond to six return periods (i.e., 2, 5, 10, 20, 50, and 100 years) along with the wastewater loads; (iii) discharging the normal wastewater loads along with the maximum storm occurred in March 2020, which may resemble a 100- or 200-year event according to the return period frequency analysis and their confidence intervals (Table 1). The performance of the drainage system is reflected by total excess runoff volume that overflowed from the drainage system at each scenario. Hence, to calculate the runoff quantities in each district and compare it with the drainage network capacity, three main data sets were used; first, the total rainfall volumes calculated using the rational method, illustrated by the following formula [39,65].
Q = C I A*,
where Q is the total discharge resulted from rainfall event (m3/d); I is the rainfall intensity (m/d); C is the rational coefficient (depends on the land use type as shown in Table 4).; A is the catchment area (m2).
The second data set is the land use and total area of each district, which was manually identified by using satellite images acquired from USGS [66] along with the rational method coefficient values correspond to each use. The land use coefficient for each district is calculated by the weighted mean method to account for impermeable factors of all land uses within the sub-catchments. The land uses for the seventeen districts are shown in Figure 4. The final data set required is the drainage network’s total capacity for each district attained from local authorities.
Since there are not precise data regarding surface runoff observed flows, the sewer network evaluation is validated by comparing simulated inundated locations during rainfall storms with the water accumulation areas recorded by local authorities from previous rainfall events. This validation is possible using (SewerGEMS) V8i [63]; furthermore, the simulation aids in identifying the percentages used of the sewer network and calculating the excess water discharges, which enables the validation of the network’s evaluation results obtained from the rational method. In this study, we have conducted a continuous simulation; therefore, the rainfall data is distributed using the synthetic SCS type II hyetograph, while the wastewater discharges are distributed according to the ECP’s drainage pattern [39].

3. Results

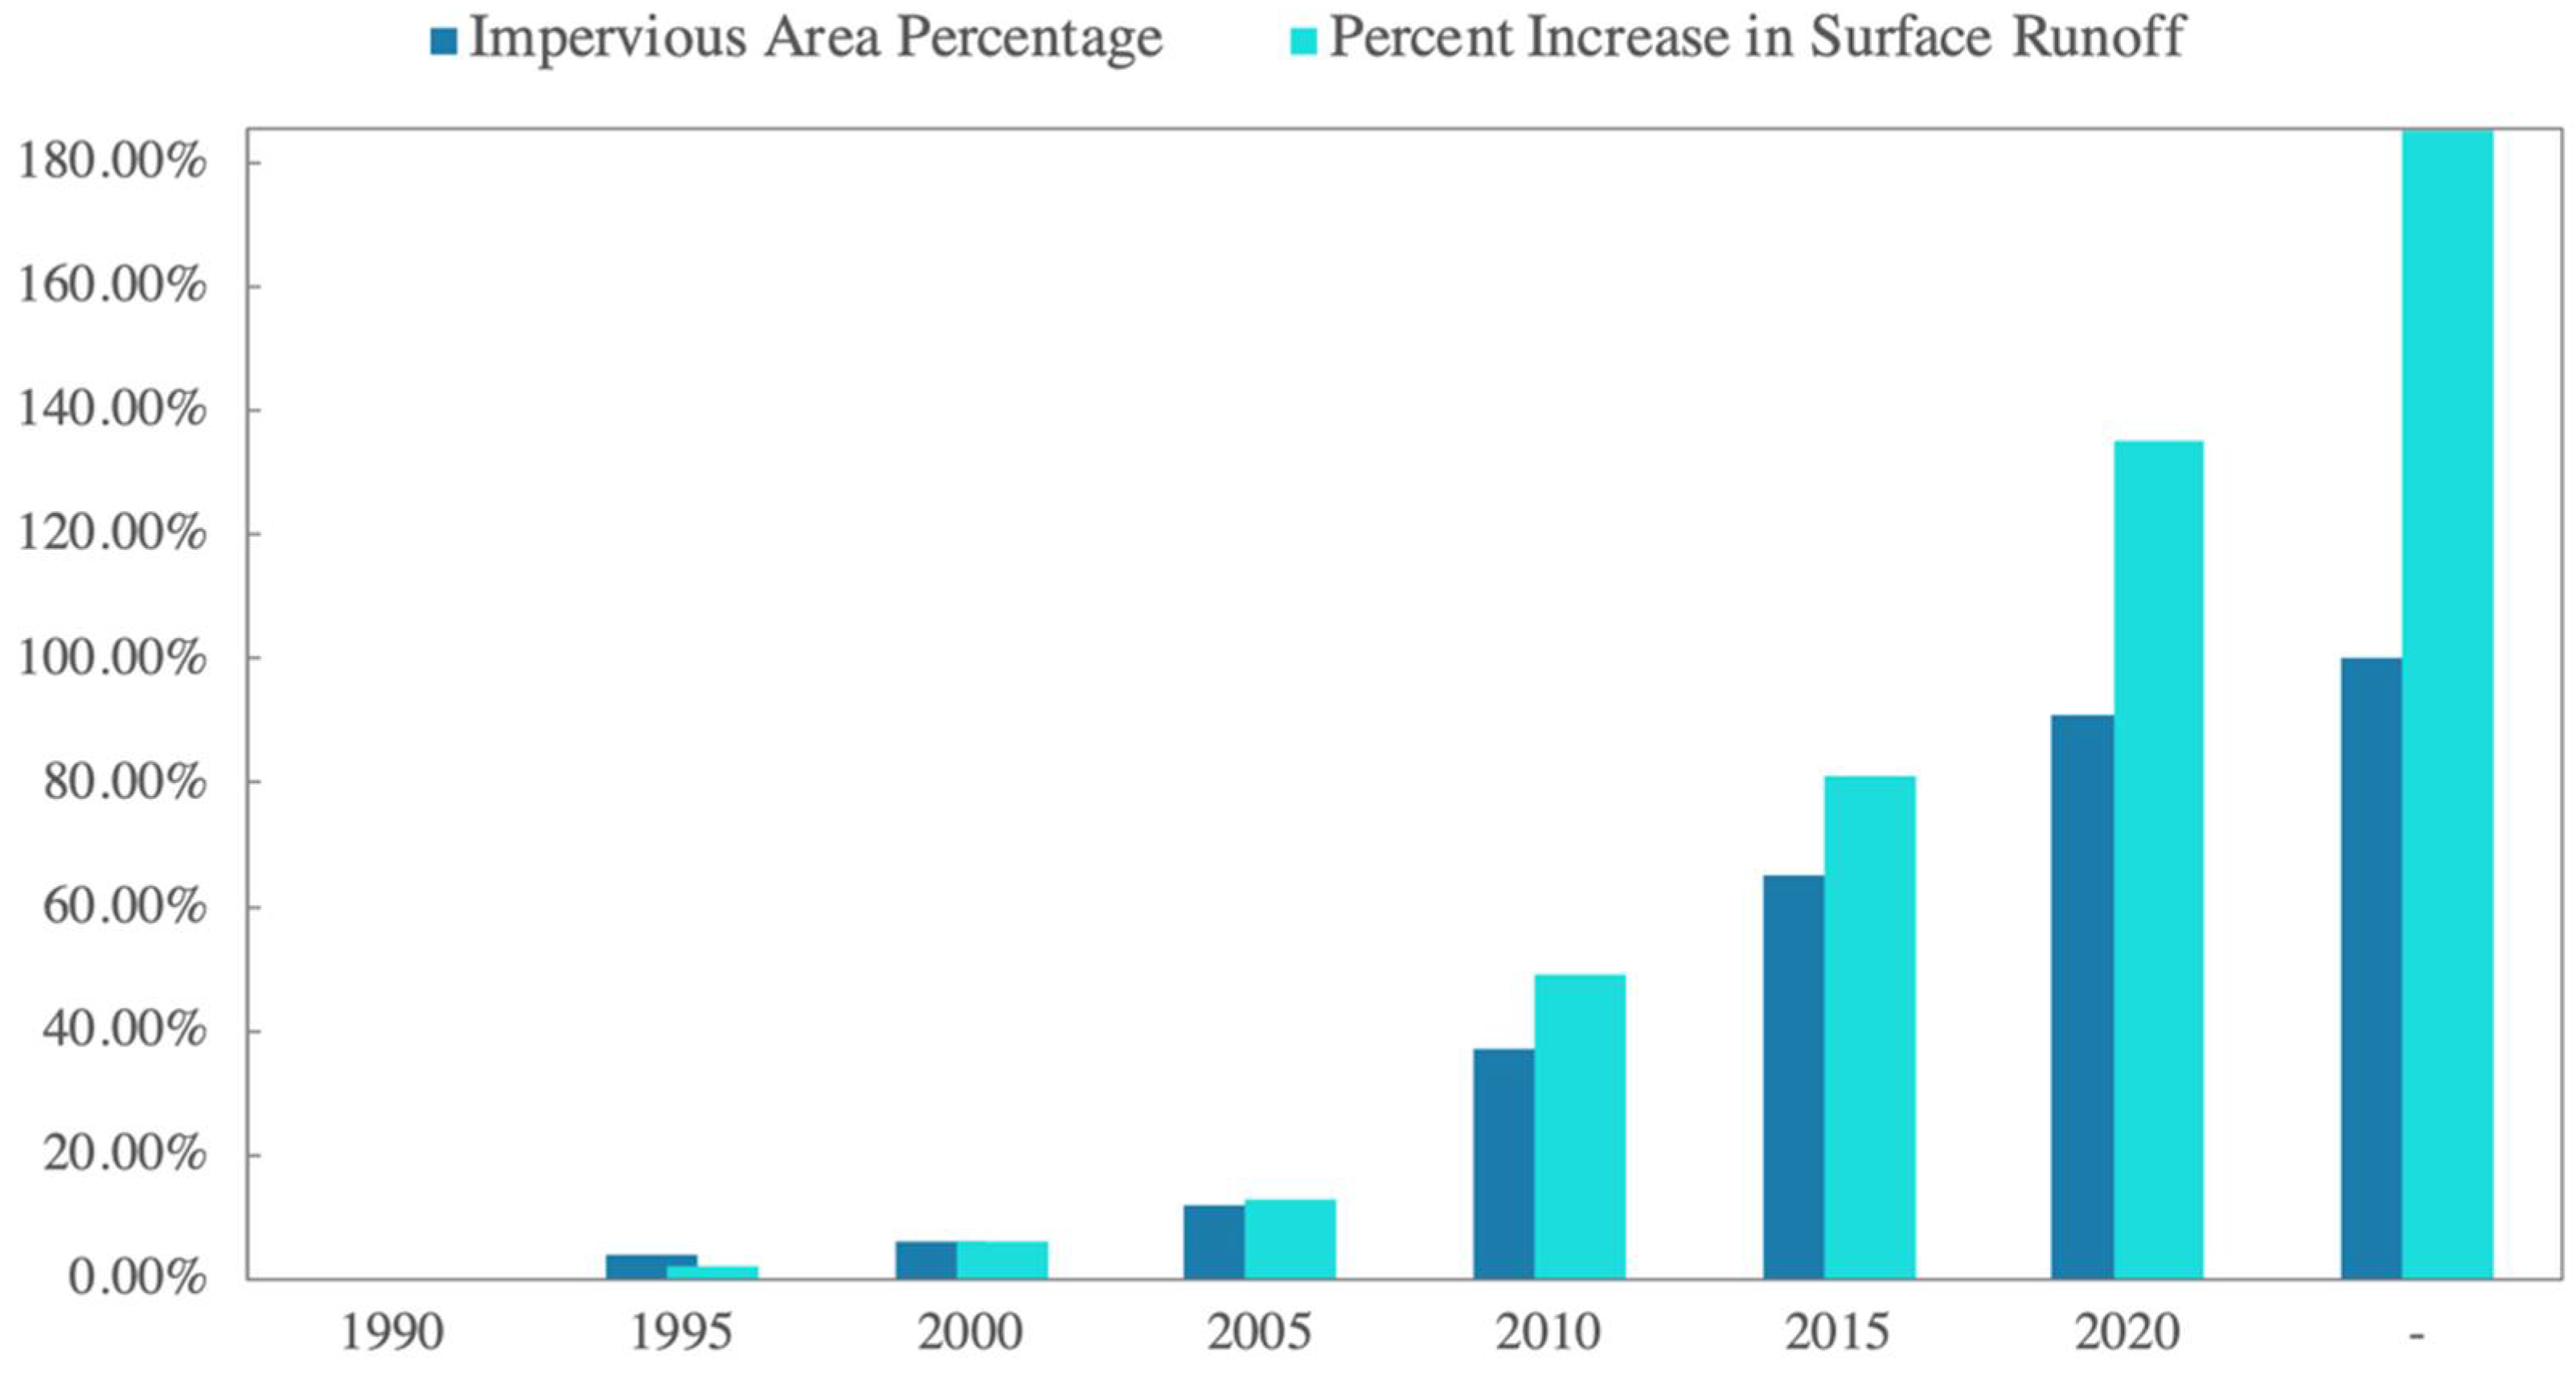
3.1. Impacts of Urbanization on Surface Runoff

The study area represented a typical emerging metropolis in Egypt with significant urbanization progression in terms of residential and public facilities growth between 1990 to 2020. The city’s initial urbanization settlement happened around 1995, and the area subsequently grew into minor urban centers. Since then, urban areas have grown gradually but at a rather stable rate. Beginning in 2005, a booming trend started in the region toward urbanizing the area, due to socioeconomic development [67,68]; the city has witnessed major land use change and municipal expansion in the years since. Figure 5 depicts more information on levels of urbanization and changes in land use patterns for each year.
From the analysis of the topographic maps and previous watersheds delineation, unfortunately, the natural drainage patterns have been significantly altered due to urbanization. This problem is significant as the urban areas avert the runoff to be disposed away from the city, creating inundation areas within the city as a final disposal point for storm water. Moreover, the problem has significantly increased with the city expansion, as a result of population growth, putting a great stress on the existing drainage systems. Figure 6 shows streamlines passing through New Cairo city from the southwest part of the city to the northern west, that are totally blocked with urbanization.
Detailed values are compiled to demonstrate historical changes in total area. Figure 7a, shows the total urban areas for the six time periods (i.e., 1995, 2000, 2005, 2010, 2015, and 2020), which are 10.3, 22.1, 34.3, 100.6, 160.6, and 223 km2, respectively. From 1995 to 2005, the overall area of urban land increased steadily, but by 2010, it had nearly tripled. There has been a significant increase in impermeable areas, which is anticipated to increase runoff significantly. As demonstrated in Figure 7b, the decrease in rural land and increase in other categories (e.g., Impervious Areas, Areas Under Construction, Green Areas) are noticeable throughout the investigated period. Currently, the original rural lands have been almost fully replaced by impermeable areas, showing a rapid transfer of land use from rural to the other types of urban usage.
The total runoff values correspond to six return periods and different urbanization percentages are summarized in Table 5. Due to the major land use changes, a significant increase in the overall runoff volume was observed (Figure 8). In 30 years, the runoff values are amplified with the increase of urbanization; 91% of the total area of New Cairo was urbanized through utilizing impervious surfaces, which corresponded to a significant increase in surface runoff by 135%. Moreover, for only 9% increase in urbanization to reach 100% urbanization level, the runoff flood volumes will increase by 40% more to reach total runoff increase of 185% compared to runoff generated before urbanization.

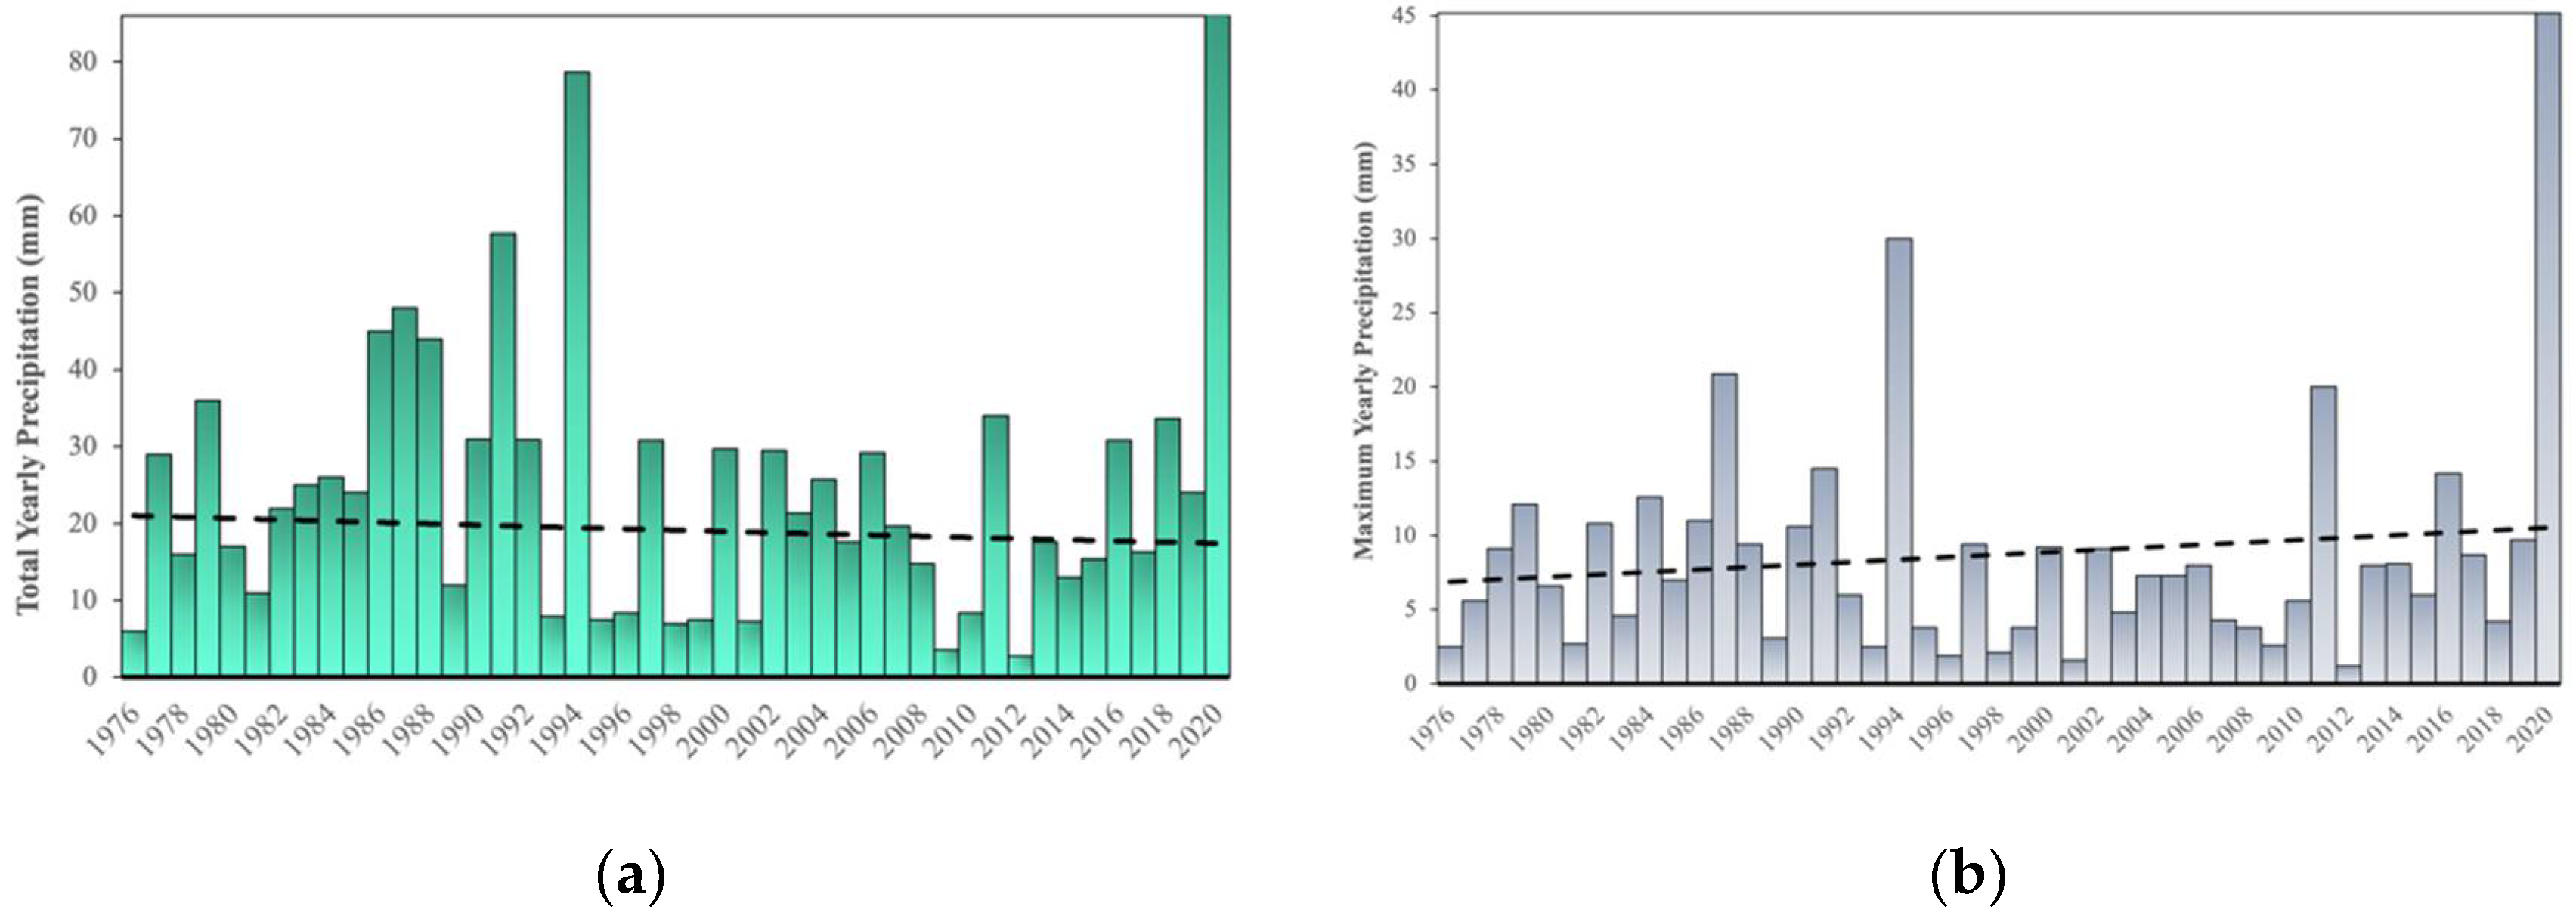
3.2. Climate Projections Scenarios Comparison and Its Effect on Flood Volumes

The six climate change scenarios were evaluated against Cairo ground station using the statistical indicators. The total comparison points were seventy-nine months that had rainfall events occur for total fifteen years from 2006 to 2020. The results of the statistical analysis of climate change scenarios are shown in Table 6. The statistical indicators for the climate change ensembles showed that the output from GCM model CNRM for the moderate emission scenario RCP4.5 have overall acceptable correlation with the ground measured data. Moreover, it was the only climate model that projected high precipitation value for Cairo; in March 2020, close to the extreme value occurred: a total monthly precipitation of 46.5 mm/month was predicted, while the actual monthly rainfall occurred was 61 mm/month.
The precipitation trends shows that extreme rainfall events’ frequency has an increasing trend (Figure 9b), although the total annual precipitation values have a decreasing trend (Figure 9a). This observation is consistent with the reports of the Intergovernmental Panel on Climate Change (IPCC) [69] that climate change is likely to increase the frequency of single day extreme rainfall event in the 21st century despite the decrease in the total annual rainfall. Moreover, it is also consistent with CNRM rainfall output for the moderate emission scenario RCP4.5 projection, as shown in Figure 9c. According to CNRM model with RCP4.5, the extreme storm that occurred in March 2020 could be considered an extreme weather event due to climate change. Figure 9c, shows the annual projection of rainfall from CNRM4.5 during the period 2006 to 2050. Furthermore, looking at the future projections, the year 2048 might experience an extreme rainfall event larger than or equal March 2020; therefore, future drainage plans should take into account this extreme storm probability.
The effects of climate change on urban flood conditions are obvious and are predicted to worsen for all return periods compared to the baseline year (i.e before 2000), with higher increases in severe precipitation occurrences, even if there are uncertainties resulting from climate forecasts. Table 7 shows the return period intensities threshold with data adopted from the period of 1976 to 1999 (24 years) compared with return period intensities calculated by rainfall data recorded from 2000 to 2020 (21 years). As illustrated, there is an increase of the rainfall intensities for all return periods; however, the most affected was the 100-year storm, which increased by 17%, followed by the 50-year storm, which increased by 12%, where both represent the extreme rainfall events. On the other hand, lower return periods are anticipated to have the smallest changes rainfall intensities; for example, the 2-year storm increased by 6%, while the 5-year storm increased by only 1%. Because the percentage of total runoff rises as rainfall intensities do, this table provides strong indication that climate change increases the surface runoff; without considering the effect of land use, climate change increased the total runoff volumes by 48% from 1990 to 2020. In addition, looking at the number of events occurred for each return period in both time ranges (i.e, before the year 2000 and after), as shown in Figure 10, the 2-year and 5-year events decreased by 30% between the two time periods. On the other hand, the period between 1976 to 1999 shows that a 50-year event occurred; however, in the following period, a 100-year event also took place, which transpired much earlier than its time; this might be a result of climate change.

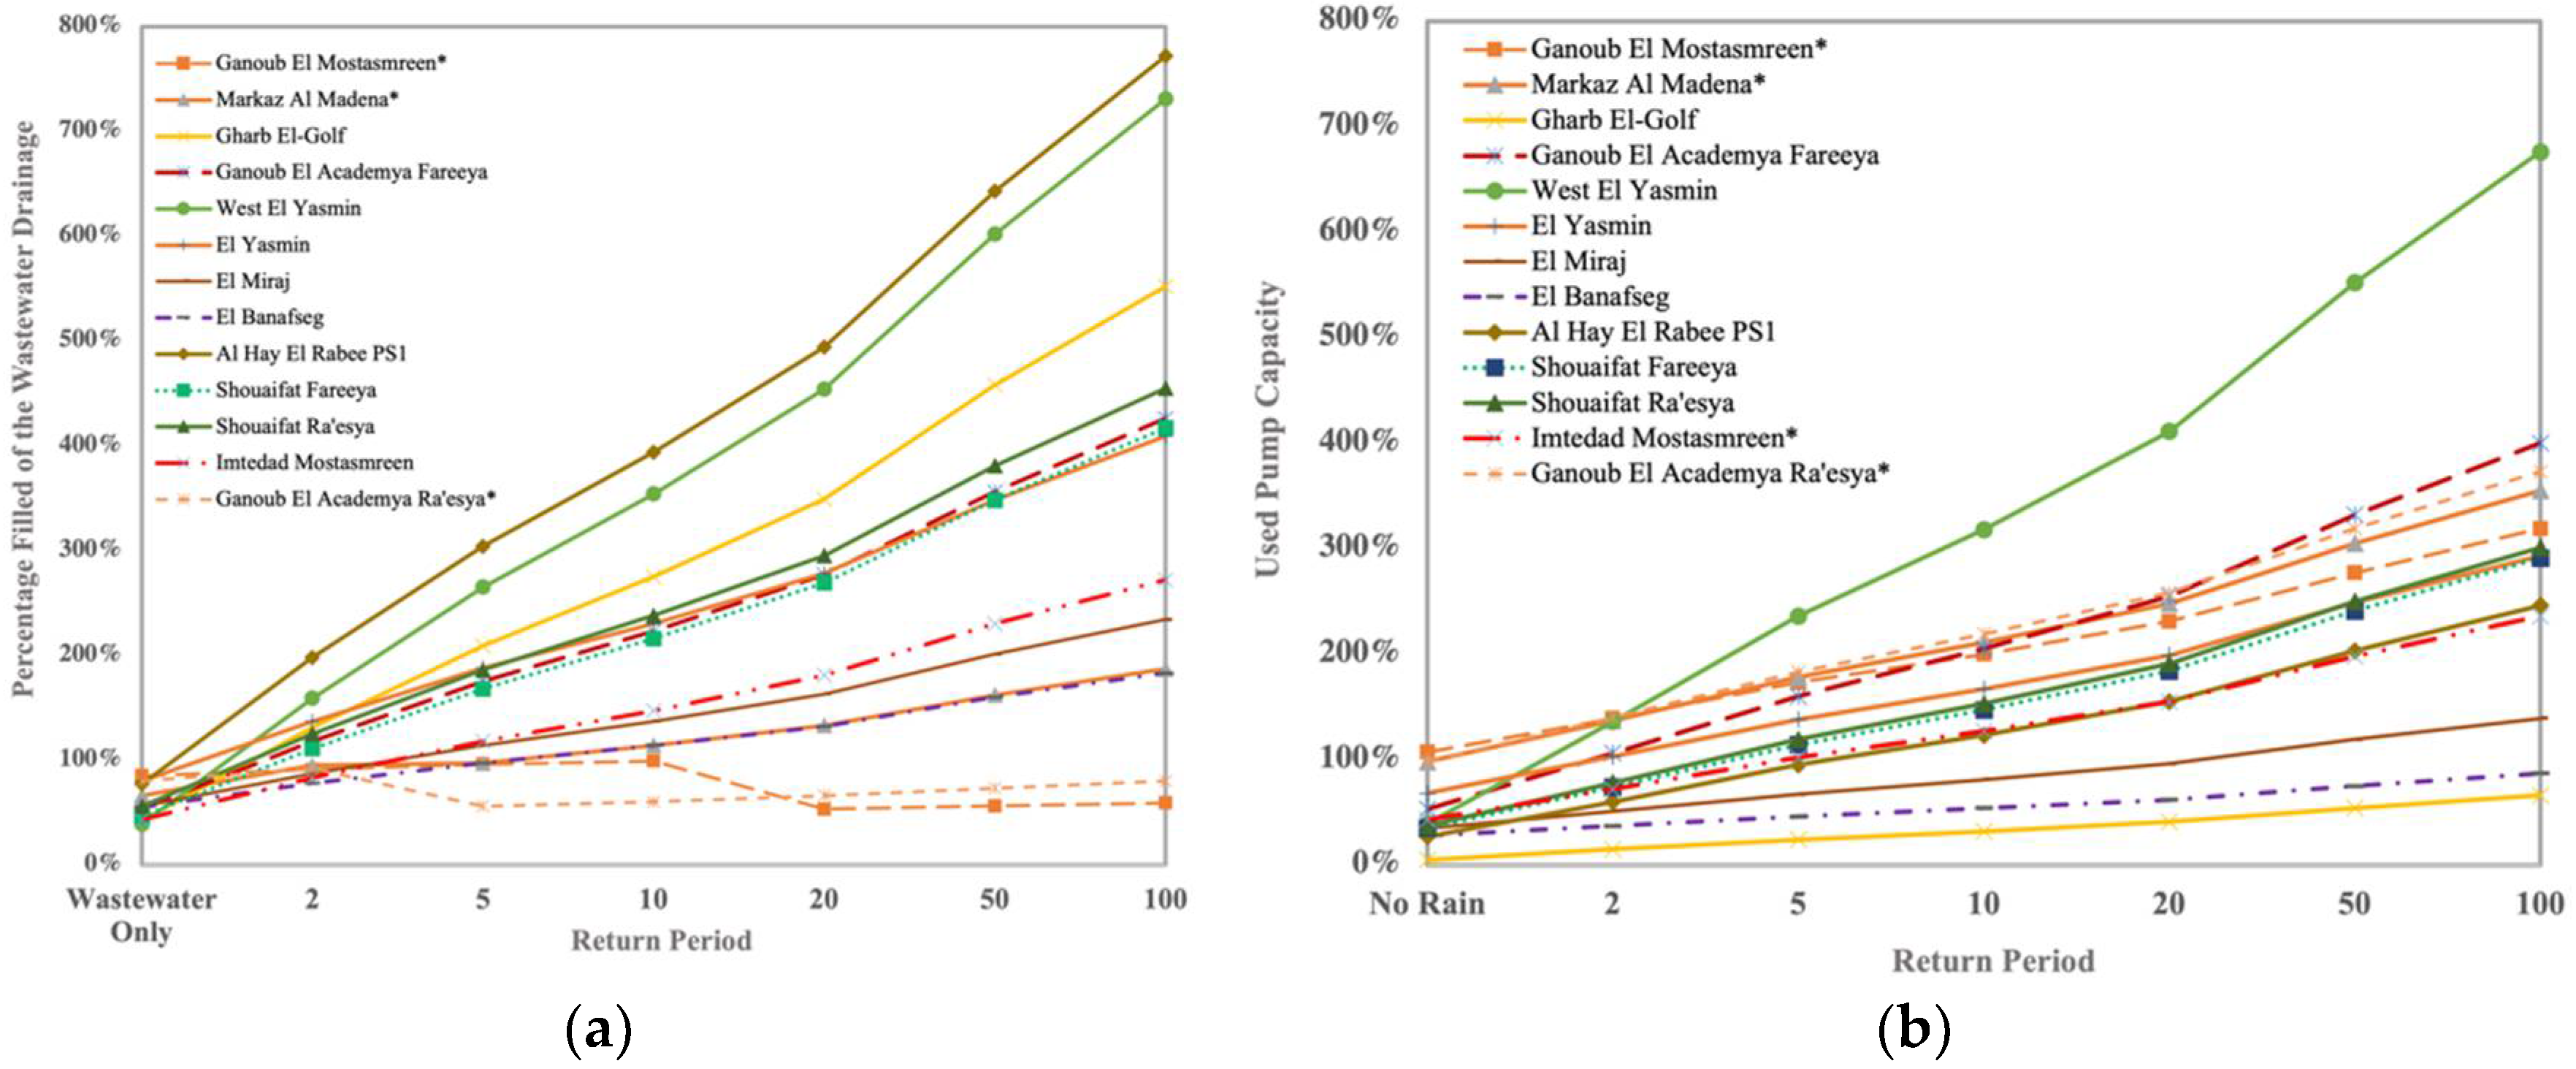
3.3. Effect of the Drainage Design on Urban Runoff Volumes

The results of the drainage network evaluation showed that each neighborhood has a pumping station at its outfall, as the final destination of the total drainage network is a treatment plant located on higher elevation than the entire city. Figure 11a shows a schematic plan for pumping stations’ discharge destinations for all the districts, where the pumping network starts at El-Mirage and El-Banafseg areas and ends at Imtedad El-Mostasmreen before discharging to the treatment plant; on the other hand, Figure 11b shows the elevation map for all neighborhoods. As illustrated, the lowest elevation neighborhood is at the beginning of the drainage network, while the highest location in the area is the final destination, which should have been the opposite, as it is better to drain from higher to lower elevations [70]. Moreover, minimizing the number of pump stations in the system is preferable for the optimal operation, as it is proved that they pose risks on the level of service during major rainfall events, due to electricity instability [71,72].
Using a typical design approach, the drainage was constructed to service the major metropolitan area (i.e., handle wastewater loads and rainfall events with low return periods). Only a few pipes were replaced during the city’s history; therefore, the upgrading of the drainage capacity lagged behind the rate of development, causing overflooding with the smallest return period storm in some areas. According to the runoff calculations and pipeline capacities (Figure 12a), seven neighborhoods may not be able to afford the minimum rainfall event that correspond to 2-year storms; therefore, they are in a critical condition and need an urgent upgrade. Moreover, eight neighborhoods cannot afford 5-year storms beside the wastewater discharges they normally manage. Generally, the stress on the sewer network increase with the increase of rainfall intensity according to the return period. On the other hand, eight neighborhoods out of seventeen can accommodate for 5-year storms, six neighborhoods accommodate for 10-year storms and five accommodate for 20-year storms. Finally, two districts were able to accommodate the maximum storm that occurred in March 2020, which are Imtedad Mostasmreen and Ganoub El Mostasmreen, if the wastewater flows remain the same. For the pump stations (Figure 12b), during the minimum rainfall of 2-year return period, six pump stations cannot drain the combined sewer, which can cause flooding and water shortages. Furthermore, one pump station can afford up to 10-year storms and three were able to accommodate more than 20 year storms. Finally, none of the districts were able to accommodate the maximum climate change projected storm.
The SewerGems evaluation of the drainage network was conducted on Al Academya El-Fareeya neighborhood because it is one of the critical neighborhoods as illustrated in Figure 12. The model was performed as a transient analysis, where the storm and the drainage loads are entered as 24-hr hydrographs. Table 8 shows the results summary of the three scenarios simulated in SewerGEMS model. The performance of the drainage system and magnitude of the excess rainfall flood volumes are reflected by the drainage system overflow, which summarizes the overflows from all overloaded manholes in the area. The simulation results showed that the drainage network over-flowed with the smallest rainfall return period of 2-years, which validates the load-capacity balance results (Figure 12). Moreover, according to the head of New Cairo City Authority, this area suffered from frequent water outages and flooding due to the underperformance of this pump station, especially with every rainfall event that occurred in this area [73]. As for the simulation of the extreme rainfall event in March 2020, it resulted in a complete failure for the drainage system; the outcomes showed that the drainage network had an overflow of 17,772 m3/d, which is considered 93% of the total network capacity; the overflow caused flooding in the streets and backflow in the households in addition to the failure of 30% of all pipelines. On the other hand, the simulated flooded areas show an almost perfect agreement with the flood-prone areas that were recorded by the local authorities (Figure 13).

4. Discussion

This study contributes to a better understanding of the factors affecting urban floods in a typical urban area in a developing country by comparing the effects of rapid urbanization and climate change on increasing surface runoff, while considering the role of drainage design in increasing or mitigating surface flood volumes. A detailed assessment of urbanization was conducted through monitoring the changes of the spatial urban sprawl, which affected the land use and the ability of the soil to infiltrate rainwater. The assessment was performed by employing GIS spatial datasets along with Rainfall–Runoff models to study the effect of urbanization on the increase of runoff under different periods, with seven land use maps from different years (1990, 1995, 2000, 2005, 2010, 2015, and 2020) and eight simulated conditions (0%, 10%, 15%, 40%, 65%, 90%, and 100% urbanized area percentages). The urbanization has a direct impact on increasing surface runoff due to changing the natural land use to impervious surfaces that prevent the rainwater from seeping into the ground. Moreover, due to poor planning, the natural streams and flood plains were not preserved nor integrated within the design, which could have prevented the increasing volumes of runoff, as they are natural management systems for flashfloods.
The investigation of whether the current intensities of major storm events that occurred in New Cairo are connected to climate change or are mere recurrence of the normal historical trends was judged by comparing climate change scenarios against ground-measured rainfall data. The evaluation showed that the ground-observed rainfall data are in good agreement with CNRM 4.5 scenario. It was the only scenario within the six scenarios that projected the extreme rainfall event in March 2020, which was the most extreme such event that Egypt has faced in its history. The yearly observed precipitation of New Cairo showed that the extreme rainfall events are becoming more frequent, and their intensities are increasing with time, although the total annual precipitation values have a decreasing trend; this agrees with climate change studies reported by the (IPCC) [14]. The ground-observed rainfall data showed that the threshold of return period intensities increased by only 6% for the 2-year return period and increased by 17% for the 100-year in the period between 2000 to 2020 compared to the period of 1976 to 1999. Moreover, as a comparison between the two time periods, the 2-year and 5-year rainfall decreased by 30% while the 100-year event occurred soon after a 50-year rainfall event, which was proven to have occurred due to climate change as it was projected by CNRM4.5 climate change scenario.
The results showed that the rapid and unplanned urban development and changes in land use types caused significant increase in surface runoff; over a period of 30 years, the runoff due to urbanization increased by 140%, while the peak discharge increased by 88% and the time to peak discharge slightly decreased by 5%. Therefore, the increase in impervious surface has a direct impact on increasing surface flows, which stresses the drainage system. Furthermore, the urban drainage has a distinguished role in increasing the surface runoff. Where 70% of the total evaluated neighborhoods showed poor performance, nine drainage networks and eight pump stations can not afford a 2-year return period storm, in addition to three pump stations that are not sufficient to discharge the base scenario. Therefore, urban flooding might occur in New Cairo with the smallest rainfall event. On the other hand, climate change affects only the increase in total runoff volumes by 48% from 1990 to 2020, excluding land use effect. However rapid urban expansion led to an increase of 140% for the same period, which is almost three times higher than what is induced by climatic changes. However, extreme rainfall events due to climate change on an urbanized area magnified the runoff volumes.
Our study represents a case of a typical ungauged city in a developing country facing multiple future challenges, namely (a) the likely effect of climate change on urban flash floods, (b) increased urban runoff driven by imperviousness and urban planning, and (c) the traditional drainage system that amplifies the urban flood complications. Developing countries have very limited resources and very limited data availability, both of which can greatly hinder reaching any results regarding what exactly the underlying causes of urban flash floods in such areas are. This usually leads third world countries to invest millions of dollars to address the wrong drivers behind urban flooding (due to lack of research), causing increasing losses in lives and property every year. Our study has three main significant findings:
  • Based on a comprehensive review of the literature, very few studies included drainage design as a factor for urban floods and focused mostly on the effect of climate change and land use change.
  • Comparing ground-measured rainfall data with projected climate scenarios for a common period yielded useful insight for future predictions in flood modeling.
  • Overcoming data scarcity and shortage and conducting an integrated framework that is considered novel for the area will prove useful for assessing other ungauged basins with similar conditions.
Finally, this study has significant implications for many of the developing arid-region countries, which are anticipated to undergo rapid urban expansion with large-scale land use changes. Climate change impacts and its associated risks of increasing the frequency of extreme rainfall events lead to an increase in climate-induced migration to urban areas, which intensifies the density of urban settlements in arid regions as well as increase the number of urban settlements due to the urban expansion towards arid land outskirts [74,75]. This not only increases the stress on the available infrastructure but also produces substantial social instability due to unplanned urban growth. Therefore, the study sheds light on the main factors that are increasing the flood risk in such areas and emphasizes the importance of urban planning approaches and upgrading the drainage system design policy to make it more resilient to climate change and stress induced by urbanization; a matter that is expected to be exasperated due to current economic conditions both locally and internationally and the increasing susceptibility of rural areas to economic fluctuations.

5. Conclusions

The findings revealed that rapid urbanization has had a major effect in increasing surface runoff due to poor planning, which did not consider natural flood plains in increasing impervious surface area, which amplifies runoff volumes and stresses the drainage system. Moreover, the rainfall patterns that recently occurred were influenced by climate change, as it increased the frequency of extreme rainfall events by 17% from 2000 to 2020 compared to the rainfall patterns before 1999. Finally, the urban drainage system plays a significant role in contributing to the increase of runoff with undersized drainage systems. Due to continuous urban growth with poor planning, impervious surfaces, and inadequate drainage design, areas vulnerable to flash floods are growing, and the severity of urban flooding is projected to increase if appropriate precautions are not adopted.
To cope with the increasing runoff volumes, an assessment for current drainage systems and future development plans are essential in the light of climate change. Although the expansion in urban development has a major and inevitable effect on the increase in urban flood volumes, it could be quantified and alleviated through improved infrastructure, new design policies, and adaptation plans. However, climate change has long-term and unforeseen impacts; therefore, policy makers should have better knowledge on the role of climate change and prioritize appropriate mitigation and adaptation strategies. The current study findings and methodology could be used in the future to create an abstract guideline that can be utilized as a tool to assess the water resources management in different regions that are susceptible to similar conditions.
The results may have uncertainties, which may be due to the assumptions of land use and land cover runoff coefficients, the usage of simplified equations, data limitation, and in some cases, inadequate quality of the data, as well as verifying climate change data with only one meteorological station. Finally, using only six ensembles of climate change scenarios might not be enough to study the impact of climate change. However, the research indeed highlights the importance of the drainage design: although urbanization and climate change increase urban runoff volumes, the deficient performance of the drainage network with the smallest rainfall event increased the flood-prone areas as well as the vulnerability of residential areas to flood.

Author Contributions

Conceptualization, B.T.H., D.A. and M.Y.; methodology, B.T.H., D.A. and M.Y.; software, B.T.H.; validation, B.T.H., D.A. and M.Y.; formal analysis, B.T.H.; investigation, B.T.H.; resources, B.T.H.; data curation, B.T.H.; writing—original draft preparation, B.T.H.; writing—review and editing, B.T.H., D.A. and M.Y.; visualization, B.T.H.; supervision, M.Y. and D.A.; project administration, M.Y.; funding acquisition, B.T.H. All authors have read and agreed to the published version of the manuscript.

Funding

This research received no external funding.

Data Availability Statement

Not Applicable.

Acknowledgments

The Authors acknowledge the Water Resources Research Institute (WRRI), for funding the APC, as well as, providing complementary rainfall intensities and drainage networks data. The Authors also acknowledge the American University in Cairo for their support to the research through funding data and software purchases [Research Grant 39].

Conflicts of Interest

The authors declare no conflict of interest. Moreover, the funders had no role in the design of the study; in the collection, analyses, or interpretation of data; in the writing of the manuscript; or in the decision to publish the results.

References

  1. Narbondo, S.; Gorgoglione, A.; Chreties, C. Improving the Performance of an Operational Flood Early Warning System with the Assimilation of Satellite-Soil-Moisture Data. In Proceedings of the Computational Science and Its Applications—ICCSA 2021, Cagliari, Italy, 13–16 September 2021; Springer: Cham, Switzerland, 2021; pp. 34–46. [Google Scholar]
  2. Zhou, Q.; Leng, G.; Su, J.; Ren, Y. Comparison of urbanization and climate change impacts on urban flood volumes: Importance of urban planning and drainage adaptation. Sci. Total Environ. 2018, 658, 24–33. [Google Scholar] [CrossRef] [PubMed]
  3. Asadzadeh, A.; Kötter, T.; Fekete, A.; Moghadas, M.; Alizadeh, M.; Zebardast, E.; Weiss, D.; Basirat, M.; Hutter, G. Urbanization, migration, and the challenges of resilience thinking in urban planning: Insights from two contrasting planning systems in Germany and Iran. Cities 2022, 125, 103642. [Google Scholar] [CrossRef]
  4. Dodman, D.; Leck, H.; Rusca, M.; Colenbrander, S. African Urbanisation and Urbanism: Implications for risk accumulation and reduction. Int. J. Disaster Risk Reduct. 2017, 26, 7–15. [Google Scholar] [CrossRef]
  5. United Nations Department of Economic and Social Affairs. Population Division World Population Prospects Highlights, 2019 Revision Highlights, 2019 Revision; United Nations: New York, NY, USA, 2019; ISBN 978-92-1-148316-1.
  6. Abdrabo, K.I.; Kantosh, S.A.; Saber, M.; Sumi, T.; Elleithy, D.; Habiba, O.M.; Alboshy, B. The Role of Urban Planning and Landscape Tools Concerning Flash Flood Risk Reduction Within Arid and Semiarid Regions. In Wadi Flash Floods. Natural Disaster Science and Mitigation Engineering: DPRI Reports; Sumi, T., Kantoush, S.A., Saber, M., Eds.; Springer: Singapore, 2022. [Google Scholar] [CrossRef]
  7. Echendu, A.J. Relationship between urban planning and flooding in Port Harcourt city, Nigeria; insights from planning professionals. J. Flood Risk Manag. 2021, 14, e12693. [Google Scholar] [CrossRef]
  8. Sohail, M.T.; Elkaeed, E.B.; Irfan, M.; Acevedo-Duque, Á.; Mustafa, S. Determining Farmers’ Awareness About Climate Change Mitigation and Wastewater Irrigation: A Pathway Toward Green and Sustainable Development. Front. Environ. Sci. 2022, 10, 193. [Google Scholar]
  9. Kaykhosravi, S.; Khan, U.T.; Jadidi, M.A. The Effect of Climate Change and Urbanization on the Demand for Low Impact Development for Three Canadian Cities. Water 2020, 12, 1280. [Google Scholar] [CrossRef]
  10. Negm, A. Flash Floods in Egypt; Springer: Cham, Switzerland, 2020; pp. 3–9. ISBN 978-3-030-29634-6. [Google Scholar]
  11. Chan, N.W.; Tan, M.L.; A Ghani, A.; A Zakaria, N. Sustainable urban drainage as a viable measure of coping with heat and floods due to climate change. IOP Conf. Series: Earth Environ. Sci. 2019, 257, 012013. [Google Scholar] [CrossRef]
  12. Lange, M.A. Impacts of Climate Change on the Eastern Mediterranean and the Middle East and North Africa Region and the Water–Energy Nexus. Atmosphere 2019, 10, 455. [Google Scholar] [CrossRef] [Green Version]
  13. IPCC. Climate Change 2007: Impacts, Adaptation and Vulnerability. Contribution of Working Group II to the Fourth Assessment Report of the IPCC; Cambridge University Press: Cambridge, UK, 2007; p. 976. [Google Scholar]
  14. IPCC. Contribution of Working Group I to the Sixth Assessment Report of the Intergovernmental Panel on Climate Change; Cambridge University Press: Cambridge, UK, 2021. [Google Scholar] [CrossRef]
  15. Kershaw, T. Climate Change and Its Impacts. In Climate Change Resilience in the Urban Environment. IOP Publishing: Bristol, UK, 2017. [Google Scholar]
  16. IPCC. Climate Change 2022: Impacts, Adaptation, and Vulnerability. Contribution of Working Group II to the Sixth Assessment Report of the Intergovernmental Panel on Climate Change; Cambridge University Press: Cambridge, UK, 2022. [Google Scholar]
  17. Schilling, J.; Hertig, E.; Tramblay, Y.; Scheffran, J. Climate change vulnerability, water resources and social implications in North Africa. Reg. Environ. Chang. 2020, 20, 15. [Google Scholar] [CrossRef] [Green Version]
  18. ElGanzori, A. Towards a Climate Change Adaptation Strategy for the Water Sector in Egypt; UNESCO: Cairo, Egypt, 2012. [Google Scholar]
  19. Hamed, M.M.; Nashwan, M.S.; Shahid, S. Climatic zonation of Egypt based on high-resolution dataset using image clustering technique. Prog. Earth Planet. Sci. 2022, 9, 1–16. [Google Scholar] [CrossRef]
  20. Gado, T.A.; El-Hagrsy, R.M.; Rashwan, I.M.H. Spatial and temporal rainfall changes in Egypt. Environ. Sci. Pollut. Res. 2019, 26, 28228–28242. [Google Scholar] [CrossRef] [PubMed]
  21. Elnazer, A.A.; Salman, S.; Asmoay, A. Flash flood hazard affected Ras Gharib city, Red Sea, Egypt: A proposed flash flood channel. Nat. Hazards 2017, 89, 1389–1400. [Google Scholar] [CrossRef]
  22. IFRC. Flash Floods Emergency Plan of Action (EPoA); Egypt: International Federation of Red Cross and Red Crescent Societies (IFRC). 2020. Available online: https://reliefweb.int/report/egypt/egypt-flash-floods-emergency-plan-action-epoa-final-report-dref-n-mdreg015 (accessed on 13 September 2021).
  23. MoSS Ministry of Social Solidarity; Egypt. 2020. Available online: https://www.eeas.europa.eu/delegations/egypt/ministry-social-solidarity-european-union-and-undp-sign-%E2%82%AC6-million-project_en?s=95 (accessed on 13 September 2021).
  24. Abd El-Halim, H. Cairo Governorate Imposes Emergency in New Cairo Due to Rain - Egypt Independent. Egypt Independent. 2019. Available online: https://egyptindependent.com/cairo-governorate-imposes-emergency-in-new-cairo-due-to-rain/5 (accessed on 15 September 2021).
  25. Arnone, E.; Pumo, D.; Francipane, A.; La Loggia, G.; Noto, L.V. The role of urban growth, climate change, and their interplay in altering runoff extremes. Hydrol. Process. 2018, 32, 1755–1770. [Google Scholar] [CrossRef]
  26. Jung, M.; Kim, H.; Mallari, K.J.B.; Pak, G.; Yoon, J. Analysis of effects of climate change on runoff in an urban drainage system: A case study from Seoul, Korea. Water Sci. Technol. 2014, 71, 653–660. [Google Scholar] [CrossRef]
  27. Kleidorfer, M.; Mikovits, C.; Jasper-Tönnies, A.; Huttenlau, M.; Einfalt, T.; Rauch, W. Impact of a Changing Environment on Drainage System Performance. Procedia Eng. 2014, 70, 943–950. [Google Scholar] [CrossRef] [Green Version]
  28. Luo, H.; Oberg, N.; Landry, B.J.; García, M.H. Assessing the system performance of an evolving and integrated urban drainage system to control combined sewer overflows using a multiple-layer based coupled modeling approach. J. Hydrol. 2021, 603, 127130. [Google Scholar] [CrossRef]
  29. CRED/UNISDR The Human Cost of Weather Related Disasters (1995–2015). 2016. Available online: https://www.unisdr.org/2015/docs/climatechange/COP21_WeatherDisastersReport_2015_FINAL.pdf (accessed on 10 July 2021).
  30. USGS Shuttle Radar Topography Mission (SRTM) 1 Arc-Second Global. 2017. Available online: https://earthexplorer.usgs.gov (accessed on 10 July 2021).
  31. Hewaidy, A.G.A.H.; Abu El Hassan, M.; Salama, A.; Ahmed, R. Flash Flood Risk Assessment of Wadi Degla Basin Protected Area, East of Maadi, Cairo, Egypt Based on Morphometric Analysis Using GIS Techniques. Hydrology 2021, 9, 66. [Google Scholar] [CrossRef]
  32. Mabrouk, N.; Sarnouby, I. Stories After the Disaster [Interview]. Al Dostor Newspaper. 2018. Available online: https://akhbarak.net/news/15488059/articles/30815149 (accessed on 13 October 2021).
  33. Zhou, Q.; Leng, G.; Huang, M. Impacts of future climate change on urban flood volumes in Hohhot in northern China: Benefits of climate change mitigation and adaptations. Hydrol. Earth Syst. Sci. 2018, 22, 305–316. [Google Scholar] [CrossRef] [Green Version]
  34. Google Earth New Cairo City, Egypt. 30°1′32.28″N, 31°28′30.57″E, Eye Alt 17 Mi. 2020. Available online: https://earth.google.com/web/@30.01896478,31.47750293,358.18031989a,126098.99097372d,35y,0h,0t,0r (accessed on 9 July 2021).
  35. ESA Topographical Maps of Egypt 1:100,000 [Report].; Egyptian Surveying Authority (ESA). 1950. Available online: https://maps.lib.utexas.edu/maps/ams/egypt/ (accessed on 9 July 2021).
  36. RICCAR Background of The Regional Knowledge Hub|RICCAR. Available online: https://riccar.org/welcome-to-the-regional-knowledge-hub. (accessed on 2 July 2021).
  37. Hafez, R.M. New cities between sustainability and real estate investment: A case study of New Cairo city. HBRC J. 2017, 13, 89–97. [Google Scholar] [CrossRef] [Green Version]
  38. Farid, M.; El Shafie, H. An Assessment of the New Cairo City. J. Eng. Appl. Sci. 2002, 49, 681–698. [Google Scholar]
  39. MHUC. ECP Egyptian Code of Practice (102) for Designing Basis of Water and Waste Water Drainage Networks; Egypt Ministry of Housing, Utility and Urban Communities (MHUC): Cairo, Egypt, 2010; Volume 1.
  40. Awadallah, A.G.; Magdy, M.; Helmy, E.; Rashed, E. Assessment of Rainfall Intensity Equations Enlisted in the Egyptian Code for Designing Potable Water and Sewage Networks. Adv. Meteorol. 2017, 2017, 1–10. [Google Scholar] [CrossRef]
  41. Awadallah, A.; Younan, N. Conservative design rainfall distribution for application in arid regions with sparse data. J. Arid Environ. 2012, 79, 66–75. [Google Scholar] [CrossRef]
  42. Cronshey, R. Urban Hydrology for Small Watersheds; US Department of Agriculture, Soil Conservation Service, Engineering Division: Washington, DC, USA, 1986.
  43. MWRI. In Egyptian Code of Practice for Flood Protection; Ministry of Water Resources and Irrigation of Egypt (MWRI): Giza, Egypt, 2011.
  44. Riyadh Municipality. Engineering Guidelines for Flood Protection Works; Ministry of Municipal and Rural Affairs: Riyadh, Saudi Arabia, 2017.
  45. José, R.S.; Pérez, J.L.; González, R.M.; Pecci, J.; Garzón, A.; Palacios, M. Impacts of the 4.5 and 8.5 RCP global climate scenarios on urban meteorology and air quality: Application to Madrid, Antwerp, Milan, Helsinki and London. J. Comput. Appl. Math. 2016, 293, 192–207. [Google Scholar] [CrossRef]
  46. Moss, R.H.; Babiker, M.; Brinkman, S.; Calvo, E.; Carter, T.; Edmonds, J.A.; Elgizouli, I.; Emori, S.; Lin, E.; Hib-bard, K.; et al. Towards New Scenarios for Analysis of Emissions, Climate Change, Impacts, and Response Strategies; Intergovernmental Panel on Climate Change: Geneva, Switzerland, 2008.
  47. Khidir, K.M.; Al-Sha’Ar, M.T. Estimating Storm Direct Runoff Using Synthetic Unit Hydrograph Methods by (WMS) Model (Solag Basin as a Case Study). J. Univ. Duhok 2017, 20, 727–735. [Google Scholar] [CrossRef] [Green Version]
  48. SCS Urban Hydrology for Small Watersheds; Technical Release 55; Soil Conservation Service. p. 1986. Available online: https://www.nrcs.usda.gov/Internet/FSE_DOCUMENTS/stelprdb1044171.pdf (accessed on 20 September 2021).
  49. Khanchoul, K.; Boukhrissa, Z.; Bouchebcheb, A. Application of WMS in Flow Discharge Prediction for the Un-gauged Wadi Bougous, Algeria. IAHS-AISH Publ. 2010, 338, 104–105. [Google Scholar]
  50. Natarajan, S.; Radhakrishnan, N. Flood hazard delineation in an ungauged catchment by coupling hydrologic and hydraulic models with geospatial techniques—A case study of Koraiyar basin, Tiruchirappalli City, Tamil Nadu, India. Environ. Monit. Assess. 2020, 192, 1–26. [Google Scholar] [CrossRef]
  51. Gumindoga, W.; Rwasoka, D.T.; Nhapi, I.; Dube, T. Ungauged runoff simulation in Upper Manyame Catchment, Zimbabwe: Application of the HEC-HMS model. Phys. Chem. Earth, Parts A/B/C 2017, 100, 371–382. [Google Scholar] [CrossRef]
  52. Saber, M.; Abdrabo, K.I.; Habiba, O.M.; Kantosh, S.A.; Sumi, T. Impacts of Triple Factors on Flash Flood Vulnerability in Egypt: Urban Growth, Extreme Climate, and Mismanagement. Geosciences 2020, 10, 24. [Google Scholar] [CrossRef] [Green Version]
  53. Prama, M.; Omran, A.; Schröder, D.; Abouelmagd, A. Vulnerability assessment of flash floods in Wadi Dahab Basin, Egypt. Environ. Earth Sci. 2020, 79, 1–17. [Google Scholar] [CrossRef] [Green Version]
  54. Rafiee, M.; Rasouli, D.; Zolghadr, M.; Mahbod, M. Evaluation of EPA SWMM, ASSA and SewerGEMS Models in Analysis of Urban Flood Collected by Surface Drainage Network (Case Study: Lar New City). Water Resour. Eng. 2021, 14. [Google Scholar] [CrossRef]
  55. Khan, A.; Regulwar, D.G. Design of Sanitary -Storm Network Using SewerGEMS: A Case Study. J. Water Resour. Eng. Manag. 2020, 7, 6–15. [Google Scholar]
  56. Katti, M.; Krishna, B.M.; Kumar, M. Design of Sanitary Sewer Network Using Sewer GEMS V8i Software. Int. J. Sci. Technol. Eng. 2015, 2, 254–258. [Google Scholar]
  57. Rossman, L.A. Storm Water Management Model User’s Manual Version 5.1; EPA—United States Environmental Protection Agency: Washington, DC, USA, 2015; p. 353.
  58. Elbarbary, S.; Araffa, S.A.; El-Shahat, A.; Zaher, M.A.; Khedher, K.M. Delineation of water potentiality areas at Wadi El-Arish, Sinai, Egypt, using hydrological and geophysical techniques. J. Afr. Earth Sci. 2020, 174, 104056. [Google Scholar] [CrossRef]
  59. Abuzied, S.M.; Mansour, B.M.H. Geospatial hazard modeling for the delineation of flash flood-prone zones in Wadi Dahab basin, Egypt. J. Hydroinformatics 2018, 21, 180–206. [Google Scholar] [CrossRef] [Green Version]
  60. El-Wahed, M.A. Comparative study of the drainage basin morphometry extracted from topographic maps and SRTM DEMs: An example from Ghadir watershed, Eastern Desert, Egypt. Delta J. Sci. 2018, 39, 52–64. [Google Scholar] [CrossRef]
  61. Abdel-Fattah, M.; Saber, M.; Sumi, T.; Kantoush, S.A.; Khalil, M.F.; Sefelnasr, A.M. A Hydrological and Geomorphometric Approach to Understanding the Generation of Wadi Flash Floods. Water 2017, 9, 553. [Google Scholar] [CrossRef] [Green Version]
  62. Dembélé, M.; Zwart, S.J. Evaluation and comparison of satellite-based rainfall products in Burkina Faso, West Africa. Int. J. Remote Sens. 2016, 37, 3995–4014. [Google Scholar] [CrossRef] [Green Version]
  63. Moriasi, D.N.; Arnold, J.G.; Van Liew, M.W.; Bingner, R.L.; Harmel, R.D.; Veith, T.L. Model Evaluation Guide-lines for Systematic Quantification of Accuracy in Watershed Simulations. Trans. ASABE 2007, 50, 885–900. [Google Scholar] [CrossRef]
  64. Moore, D.; Notz, W.; Flinger, M.A. The Basic Practice of Statistics; Freeman and Company: New York, NY, USA, 2013; Volume 6. [Google Scholar]
  65. Chow, V.; Maidment, D.; Mays, L. Applied Hydrology; Clark, B., Morris, J., Eds.; McGraw-Hill: Singapore, 1988; Volume 4. [Google Scholar]
  66. USGS. Landsat-7 Image of New Cairo, Egypt; Courtesy of the U.S. Geological Survey: Reston, VA, USA, 2021.
  67. Mahmoud, S.; Gan, T.Y. Long-term impact of rapid urbanization on urban climate and human thermal comfort in hot-arid environment. Build. Environ. 2018, 142, 83–100. [Google Scholar] [CrossRef]
  68. Bayoumi, W.N.A. The Tale of the Unsettled New Cairo City-Egypt: A Review for the Implications of the Adopted Privatization and Laissez-Fair Policies on Excluding the Poor from Its Housing Market. Young Academics Network Vienna 2009, 17. Available online: https://citeseerx.ist.psu.edu/viewdoc/download?doi=10.1.1.169.8086&rep=rep1&type=pdf (accessed on 8 November 2021).
  69. Nicholls, N.; Easterling, D.; Goodess, C.; Kanae, S.; Kossin, J.; Luo, Y.; Marengo, J.; McInnes, K.; Rahimi, M.; Reichstein, M.; et al. Changes in Climate Extremes and Their Impacts on the Natural Physical Environment. In Managing the Risks of Extreme Events and Disasters to Advance Climate Change Adaptation A Special Report of the Intergovernmental Panel on Climate Change (IPCC); Cambridge University Press: Cambridge, UK; New York, NY, USA, 2012. [Google Scholar]
  70. Chang, T.-J.; Wang, C.-H.; Chen, A.S. A novel approach to model dynamic flow interactions between storm sewer system and overland surface for different land covers in urban areas. J. Hydrol. 2015, 524, 662–679. [Google Scholar] [CrossRef] [Green Version]
  71. Semadeni-Davies, A.; Hernebring, C.; Svensson, G.; Gustafsson, L.-G. The impacts of climate change and urbanisation on drainage in Helsingborg, Sweden: Combined sewer system. J. Hydrol. 2008, 350, 100–113. [Google Scholar] [CrossRef]
  72. Yazdi, J.; Choi, H.S.; Kim, J.H. A Methodology for Optimal Operation of Pumping Stations in Urban Drainage. J. Hydro-Environ. Res. 2016, 11, 101–112. [Google Scholar] [CrossRef]
  73. Saleh, S. New Cairo City Authority Comments on the Frequent Wastewater Flooding in New Cairo. El-Watan News. 2021. Available online: https://www.elwatannews.com/news/details/5672947 (accessed on 4 September 2021).
  74. Delazeri, L.M.M.; da Cunha, D.A.; Couto-Santos, F.R. Climate Change and Urbanization: Evidence from The Semi-Arid Region of Brazil. Rev. Bras. De Estud. Reg. E Urbanos 2018, 12, 129–154. [Google Scholar]
  75. Portnov, B.; Paz, S. Climate Change and Urbanization in Arid Regions. Ann. Arid Zone 2008, 47, 1–15. [Google Scholar]
Figure 1. Location and topography of the study area.
Water 14 02430 g001
Figure 2. Characteristics of rainfall data from Cairo Airport Station. The average cumulative monthly rainfall data is represented by the histogram, while the horizontal lines represent the maximum and minimum mean monthly data. The yellow oval, on the secondary axis, represents the maximum daily rainfall that occurred each month from the year 1976 to 2020.
Water 14 02430 g002
Figure 3. New Cairo’s 17 neighborhoods included in the study showing their locations and areas (km2).
Water 14 02430 g003
Figure 4. Land use percentages of 17 neighborhoods in New Cairo for four main categories (impervious areas, gardens, unurbanized areas and industrial areas) [66].
Water 14 02430 g004
Figure 5. The results of historical land use changes for the years (a) 1990; (b) 1995; (c) 2000; (d) 2005; (e) 2010; (f) 2015; (g) 2020. The land use includes rural presented in beige, green areas in green, urban areas in red, and urban under construction in yellow.
Water 14 02430 g005
Figure 6. Previous watershed passed through New Cairo before urbanization. Currently the natural streamlines are totally blocked due to the land use changes.
Water 14 02430 g006
Figure 7. Land use historical changes between 1990 to 2020; (a) shows the total area in km2 and percent change; (b) shows land use percentages which can significantly affect runoff values.
Water 14 02430 g007
Figure 8. The change in runoff corresponding to the increase of urbanized area from 1990 to 2020 for the whole New Cairo Watershed.
Water 14 02430 g008
Figure 9. (a) Total rainfall every year (mm/year) for the period of 1976 to 2020; (b) maximum rainfall event in each year (mm/day) for the period of 1976 to 2020; (c) total annual projected precipitation during the period 2006 to 2050 from the CNRM model for RCP4.5; the dashed inclined lines show the trend of the rainfall (whether increasing or decreasing).
Water 14 02430 g009aWater 14 02430 g009b
Figure 10. Total number of rainfall events occurred for each return period for two time periods (1976 to 1999 and 2000 to 2020).
Water 14 02430 g010
Figure 11. (a) Pumping stations schematic plan for New Cairo’s districts showing their discharge destinations; (b) elevation map of New Cairo neighborhoods.
Water 14 02430 g011
Figure 12. (a) Percentage used of the drainage network at different scenarios; (b) percentage used of the pump stations with different return periods. Shown for all 17 neighborhoods. * These areas had planned upgrade and the extra capacity was added in the calculations.
Water 14 02430 g012
Figure 13. (a) Inundation areas simulated during March 2020 storm; (b) inundation areas recorded by local authorities during rainstorms.
Water 14 02430 g013
Table 1. Rainfall corresponds to different return periods used in the study to calculate runoff.
Return PeriodRainfall (mm/day)Confidence Interval
26.754.58–8.92
512.77.92–17.5
1017.79.93–25.5
2023.311.6–34.9
5031.613.4–49.9
10038.814.3–63.3
20046.814.9–78.7
Table 2. Summary of Statistical Indicators Equations and Ranges [63,64].
Statistical IndicatorEquation *RangeIdeal Value
Mean Absolute Error (MAE) 1 n i = 1 n P i O i 0 to ∞0
Root Mean Square Error (RMSE) i = 1 n P i O i 2 n 0 to ∞0
Coefficient of Determination (R2) i = 1 n ( O i O ¯ ) P i P ¯ i = 1 n O i O ¯ 2 i = 1 n P i P ¯ 2 0 to 11
Percent Bias (PBIAS) i = 1 n ( O i P i ) × 100 O i –∞ to ∞0
RMSE-Observation Standard
Deviation (RSR)
R M S E S T D E V O b s 0 to ∞0
Nash Sutcliffe Efficiency (NSE) 1 i = 1 n O i P i 2 i = 1 n O i O ¯ 2 –∞ to 11
* Where P i is the climate change precipitation data; O i is the observed ground measured data; n is the number of total population data; O ¯ is the mean value for ground measured data; P ¯ is the mean value for satellite data.
Table 3. Summary of Statistical Criteria limits [63,64].
AssessmentPBIASNSERSRR2RMSEMAE
Very Good≤±100.75 to 10 to 0.5>0.7The value can range from 0 to ∞, generally the lower the better
Good±10 to ±150.65 to 0.750.5 to 0.60.5 to 0.7
Satisfactory±15 to ±250.50 to 0.650.6 to 0.70.3 to 0.5
Unsatisfactory≥±25≤0.5>0.7<0.3
Table 4. Rational Method Runoff Coefficient Values [39].
Land UseC
Paved Roads and Building Surfaces0.70–0.95
Exposed Soil, Undeveloped Roads0.10–0.20
Residential Areas (Flat)0.50–0.30
Residential Areas (Mountainous)0.50–0.70
Industrial Areas (Light)0.55–0.65
Industrial Areas (Heavy)0.60–0.80
Paved Roads and Building Surfaces0.70–0.95
Table 5. Runoff values for New Cairo at different urbanization level percentages correspond to six return period storms.
YearPercent
Imperviousness
Runoff Value (Mm3)
25102050100
19900%-0.331.062.214.406.60
19954%0.16 × 10−30.351.092.274.486.70
200010%529 × 10−30.371.142.344.616.85
200515%0.0050.431.252.504.817.10
201040%0.0750.791.833.325.908.40
201565%0.1791.132.364.026.809.43
202091%0.3551.723.255.218.3511.23
-100%0.6362.374.166.339.8612.74
Table 6. Results of the comparison between climate change projection models and ground measured rainfall data using six statistical indicators. The results are color coded where the green indicate a high correlation, while the red indicate a very weak correlation between both data.
IndicatorRCP4.5RCP8.5
CNRMEC-EarthGFDLCNRMEC-EarthGFDL
RMSE6.709.1810.0410.358.345.60
RSR0.681.061.151.201.031.32
% Bias−6.1264.43−42.60−20.33−31.27−36.54
R20.640.09−0.13−0.040.20−0.16
MAE0.291.902.040.971.481.21
Strong Correlation Water 14 02430 i001 Weak Correlation.
Table 7. Comparison of return period intensities between the periods of 1976 to 1999 and 2000 to 2020.
Return
Period
1976–19992000–2020Percent of
Increase
Rainfall (mm/d)Confidence
Interval
Rainfall (mm/d)Confidence
Interval
10033.120.3–45.838.814.3–63.317%
5028.317.5–39.131.613.4–49.912%
2022.113.8–30.323.311.6–34.95%
1017.311.0–23.717.79.93–25.52%
512.68.19–17.012.77.92–17.51%
26.354.45–8.256.754.58–8.926%
Table 8. Comparison of return period intensities between the periods of 1976 to 1999 and 2000 to 2020.
Scenario
Name
Velocities (m/s)
Gravity Pipes
Velocities (m/s)
Pressure Pipes to
Pump Station
System Overflow (m3/d)
Min.Max.
Base Scenario33.120.3–45.82.13-
2-Year Return Period28.317.5–39.12.283919
March 2020 Storm22.113.8–30.32.2817,772
Publisher’s Note: MDPI stays neutral with regard to jurisdictional claims in published maps and institutional affiliations.

