
Game Analysis and Simulation Study of Hydropower Development Interests


Abstract
:1. Introduction
2. Theoretical Basis
2.1. Research Status
2.2. Game Relationship Analysis
2.2.1. The Game between RDP and Hydropower Developers
2.2.2. The Game between RDP and Government Departments
2.2.3. The Game between Government Departments and Hydropower Developers
2.3. Game Evolution Theory
3. Analysis of the Evolutionary Game between RDP and Hydropower Developers
3.1. Basic Assumptions of the Model
- (1)
- Both players are finite rational groups, with imperfect symmetry of information; the game is random and uncertain; and the goal is to maximize benefits.
- (2)
- Each participant has only two strategies to choose from. The set of strategies for RDP is {cooperate, do not cooperate}; and for hydropower developers it is {compromise, do not compromise}.
- (3)
- Assumptions about RDP. The compensation received by RDP,, includes compensation for the expropriation of requisitioned land, compensation for seedlings, compensation for forest trees, compensation for houses and appurtenances, relocation subsidy, transitional living subsidy, land acquisition and infrastructure construction for new sites, compensation for scattered trees, and so on. Their cost when cooperating with the relocation is , and when not cooperating is If the hydropower developer chooses a compromise strategy, the RDP who cooperate receive a reward of If the demands of RDP who do not cooperate are satisfied, the RDP receive additional compensation, . If not cooperating, the RDP will need to invest more time and effort. Therefore, .
- (4)
- Assumptions about hydropower developers. The benefits to the developer are . The cost under the compromise strategy is . The cost under the no-compromise strategy is. Under a no-compromise strategy, a hydropower developer needs to invest more human resources to deal with RDP disputes. Therefore, . If the RDP issue is not handled and the project is delayed, the developer bears additional losses, .
- (5)
- If the probability that the RDP cooperate with relocation is , then their probability of not cooperating is . If the probability that the developer compromises is , then their probability of adopting a no-compromise strategy is .
3.2. Model Construction
3.3. Stability Analysis of Equilibrium Points
- (1)
- Equilibrium Conditions
- (2)
- Stability Conditions
3.4. Numerical Simulation
- (1)
- The simulation results are consistent with the theoretical calculations, with corresponding evolutionary results obtained when different evolutionary conditions are satisfied. By adjusting parameters such as the rewards and punishments from hydropower developers to RDP and the losses to hydropower developers when conflicts break out, the gains of both sides can be adjusted so that the strategies adopted by both sides gradually evolve in the preferred direction.
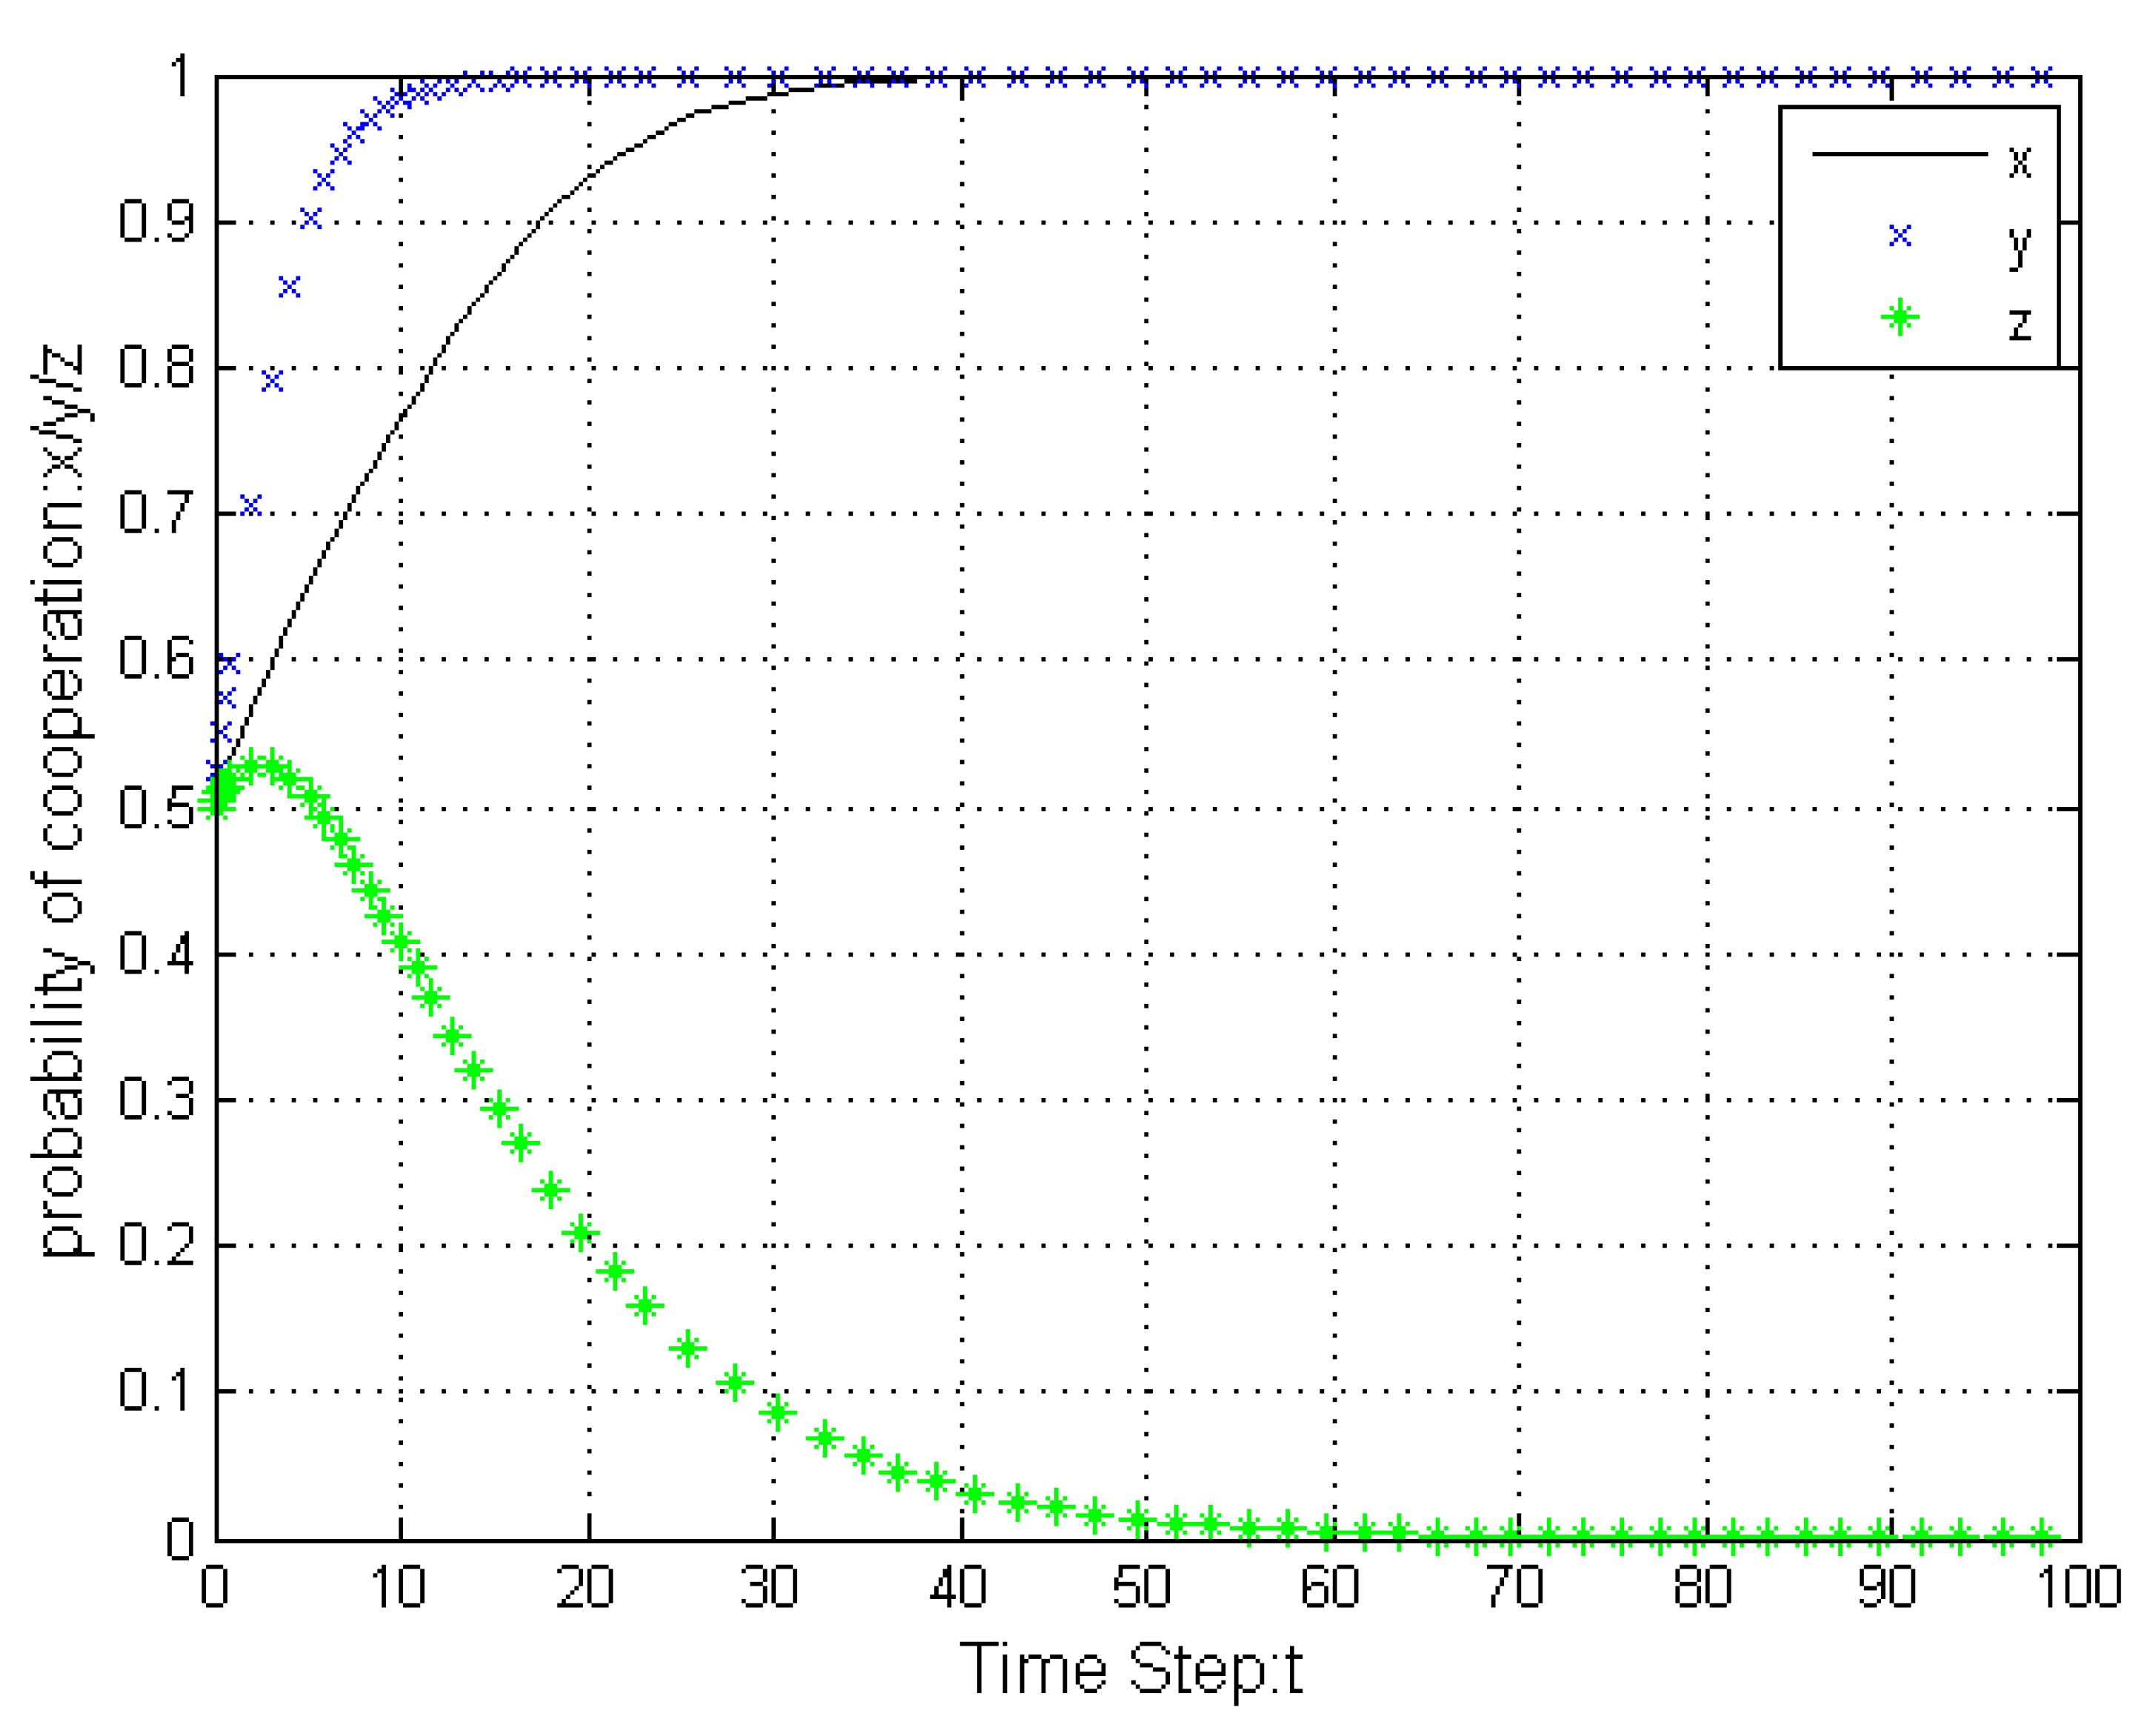
- (2)
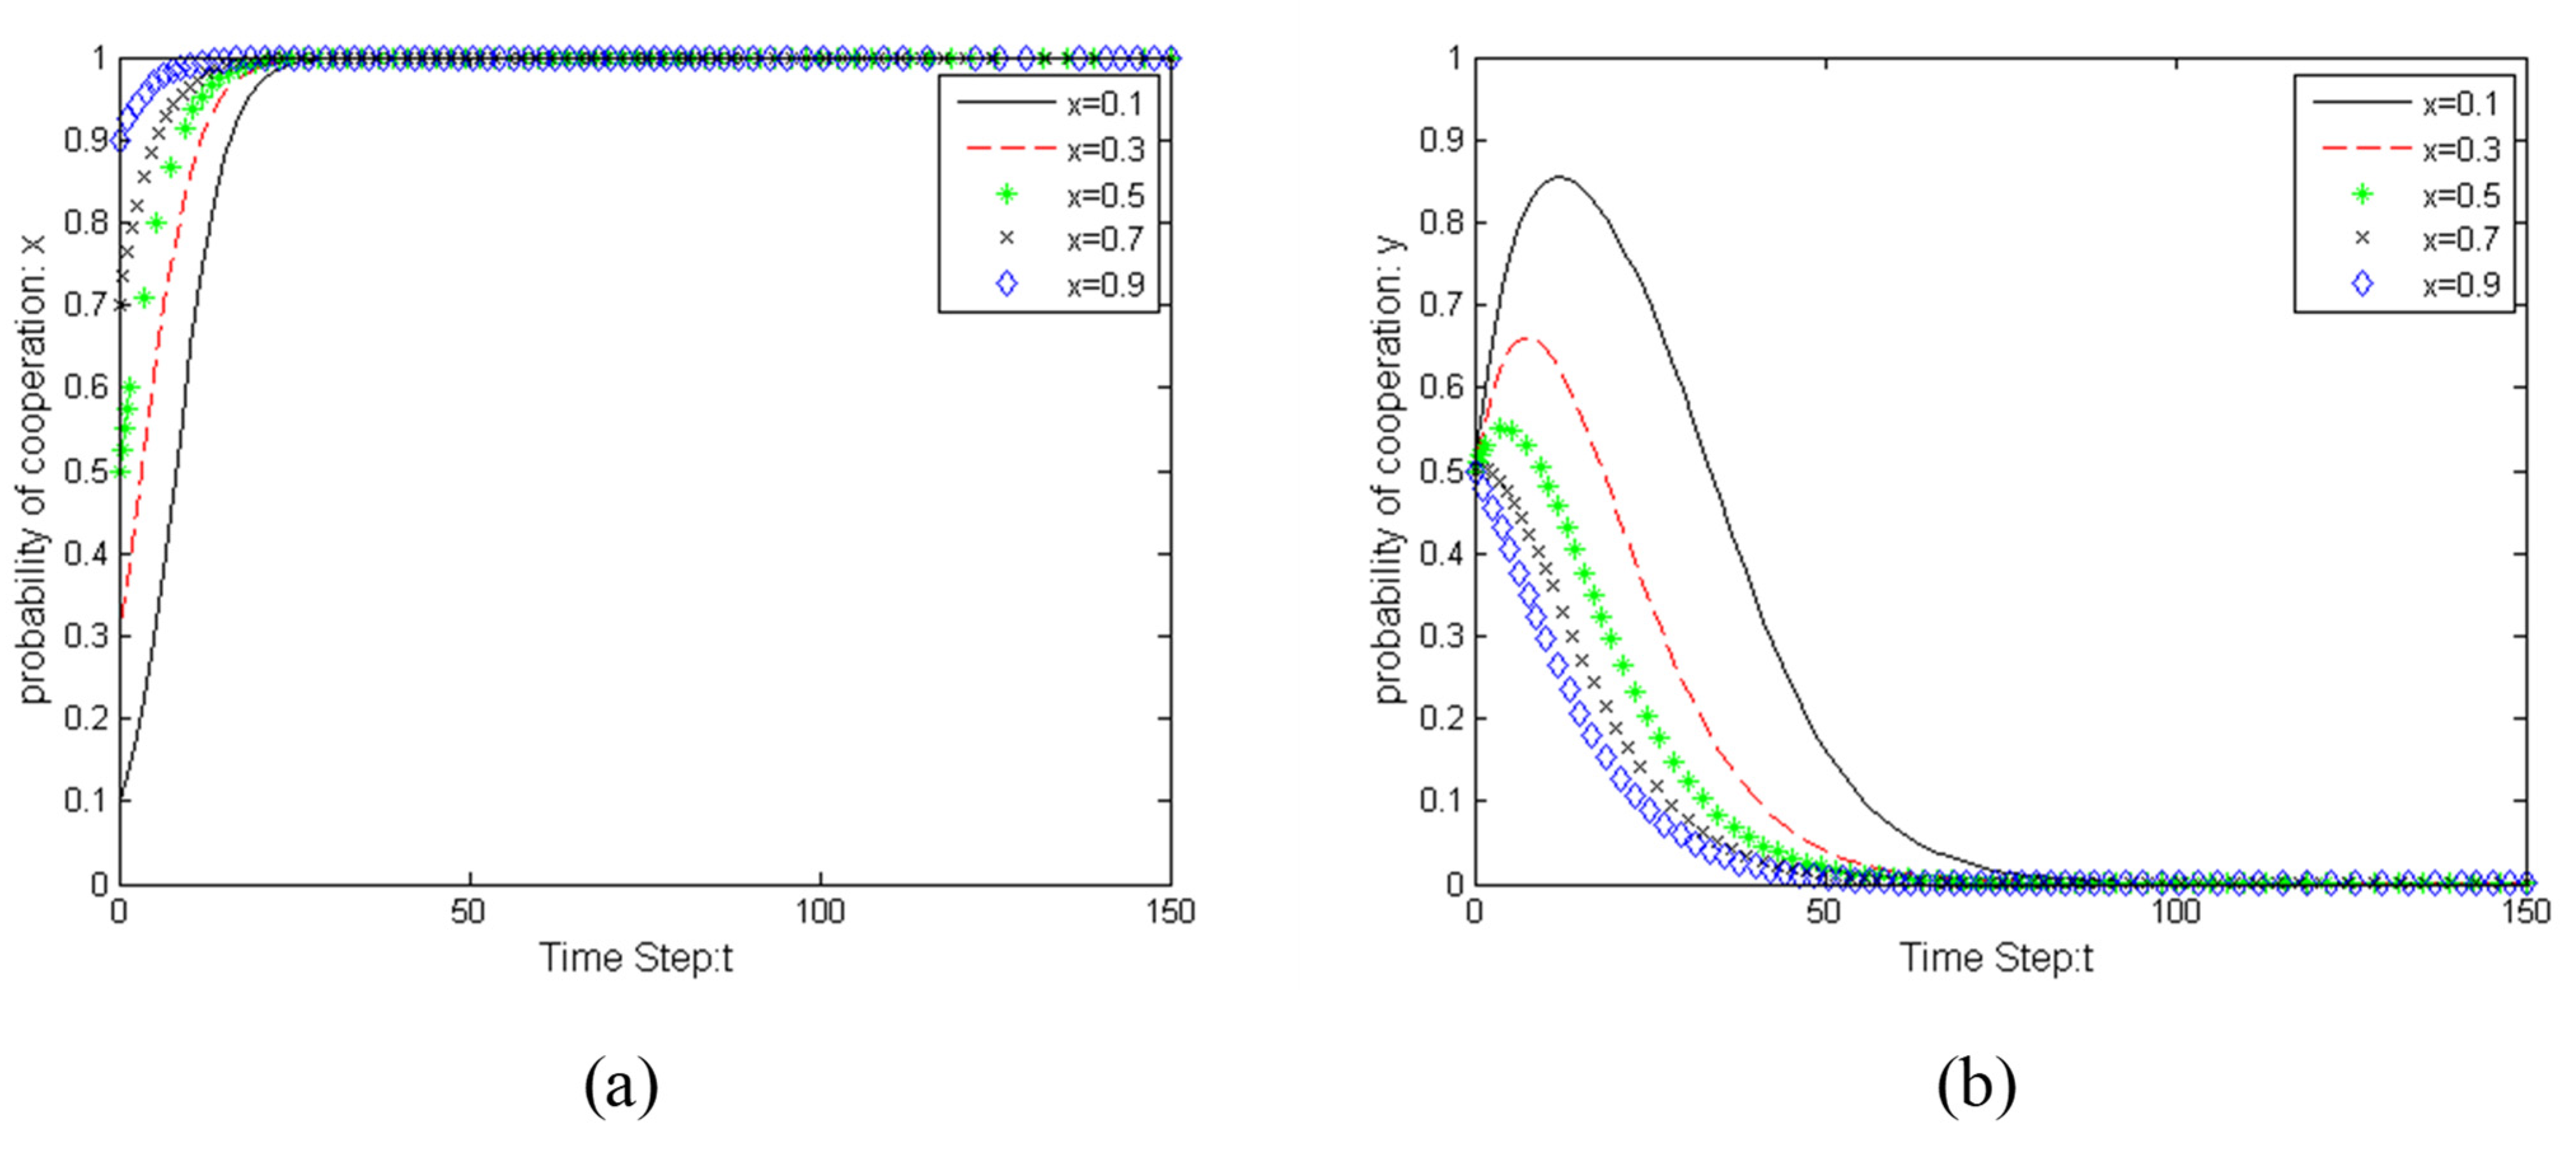
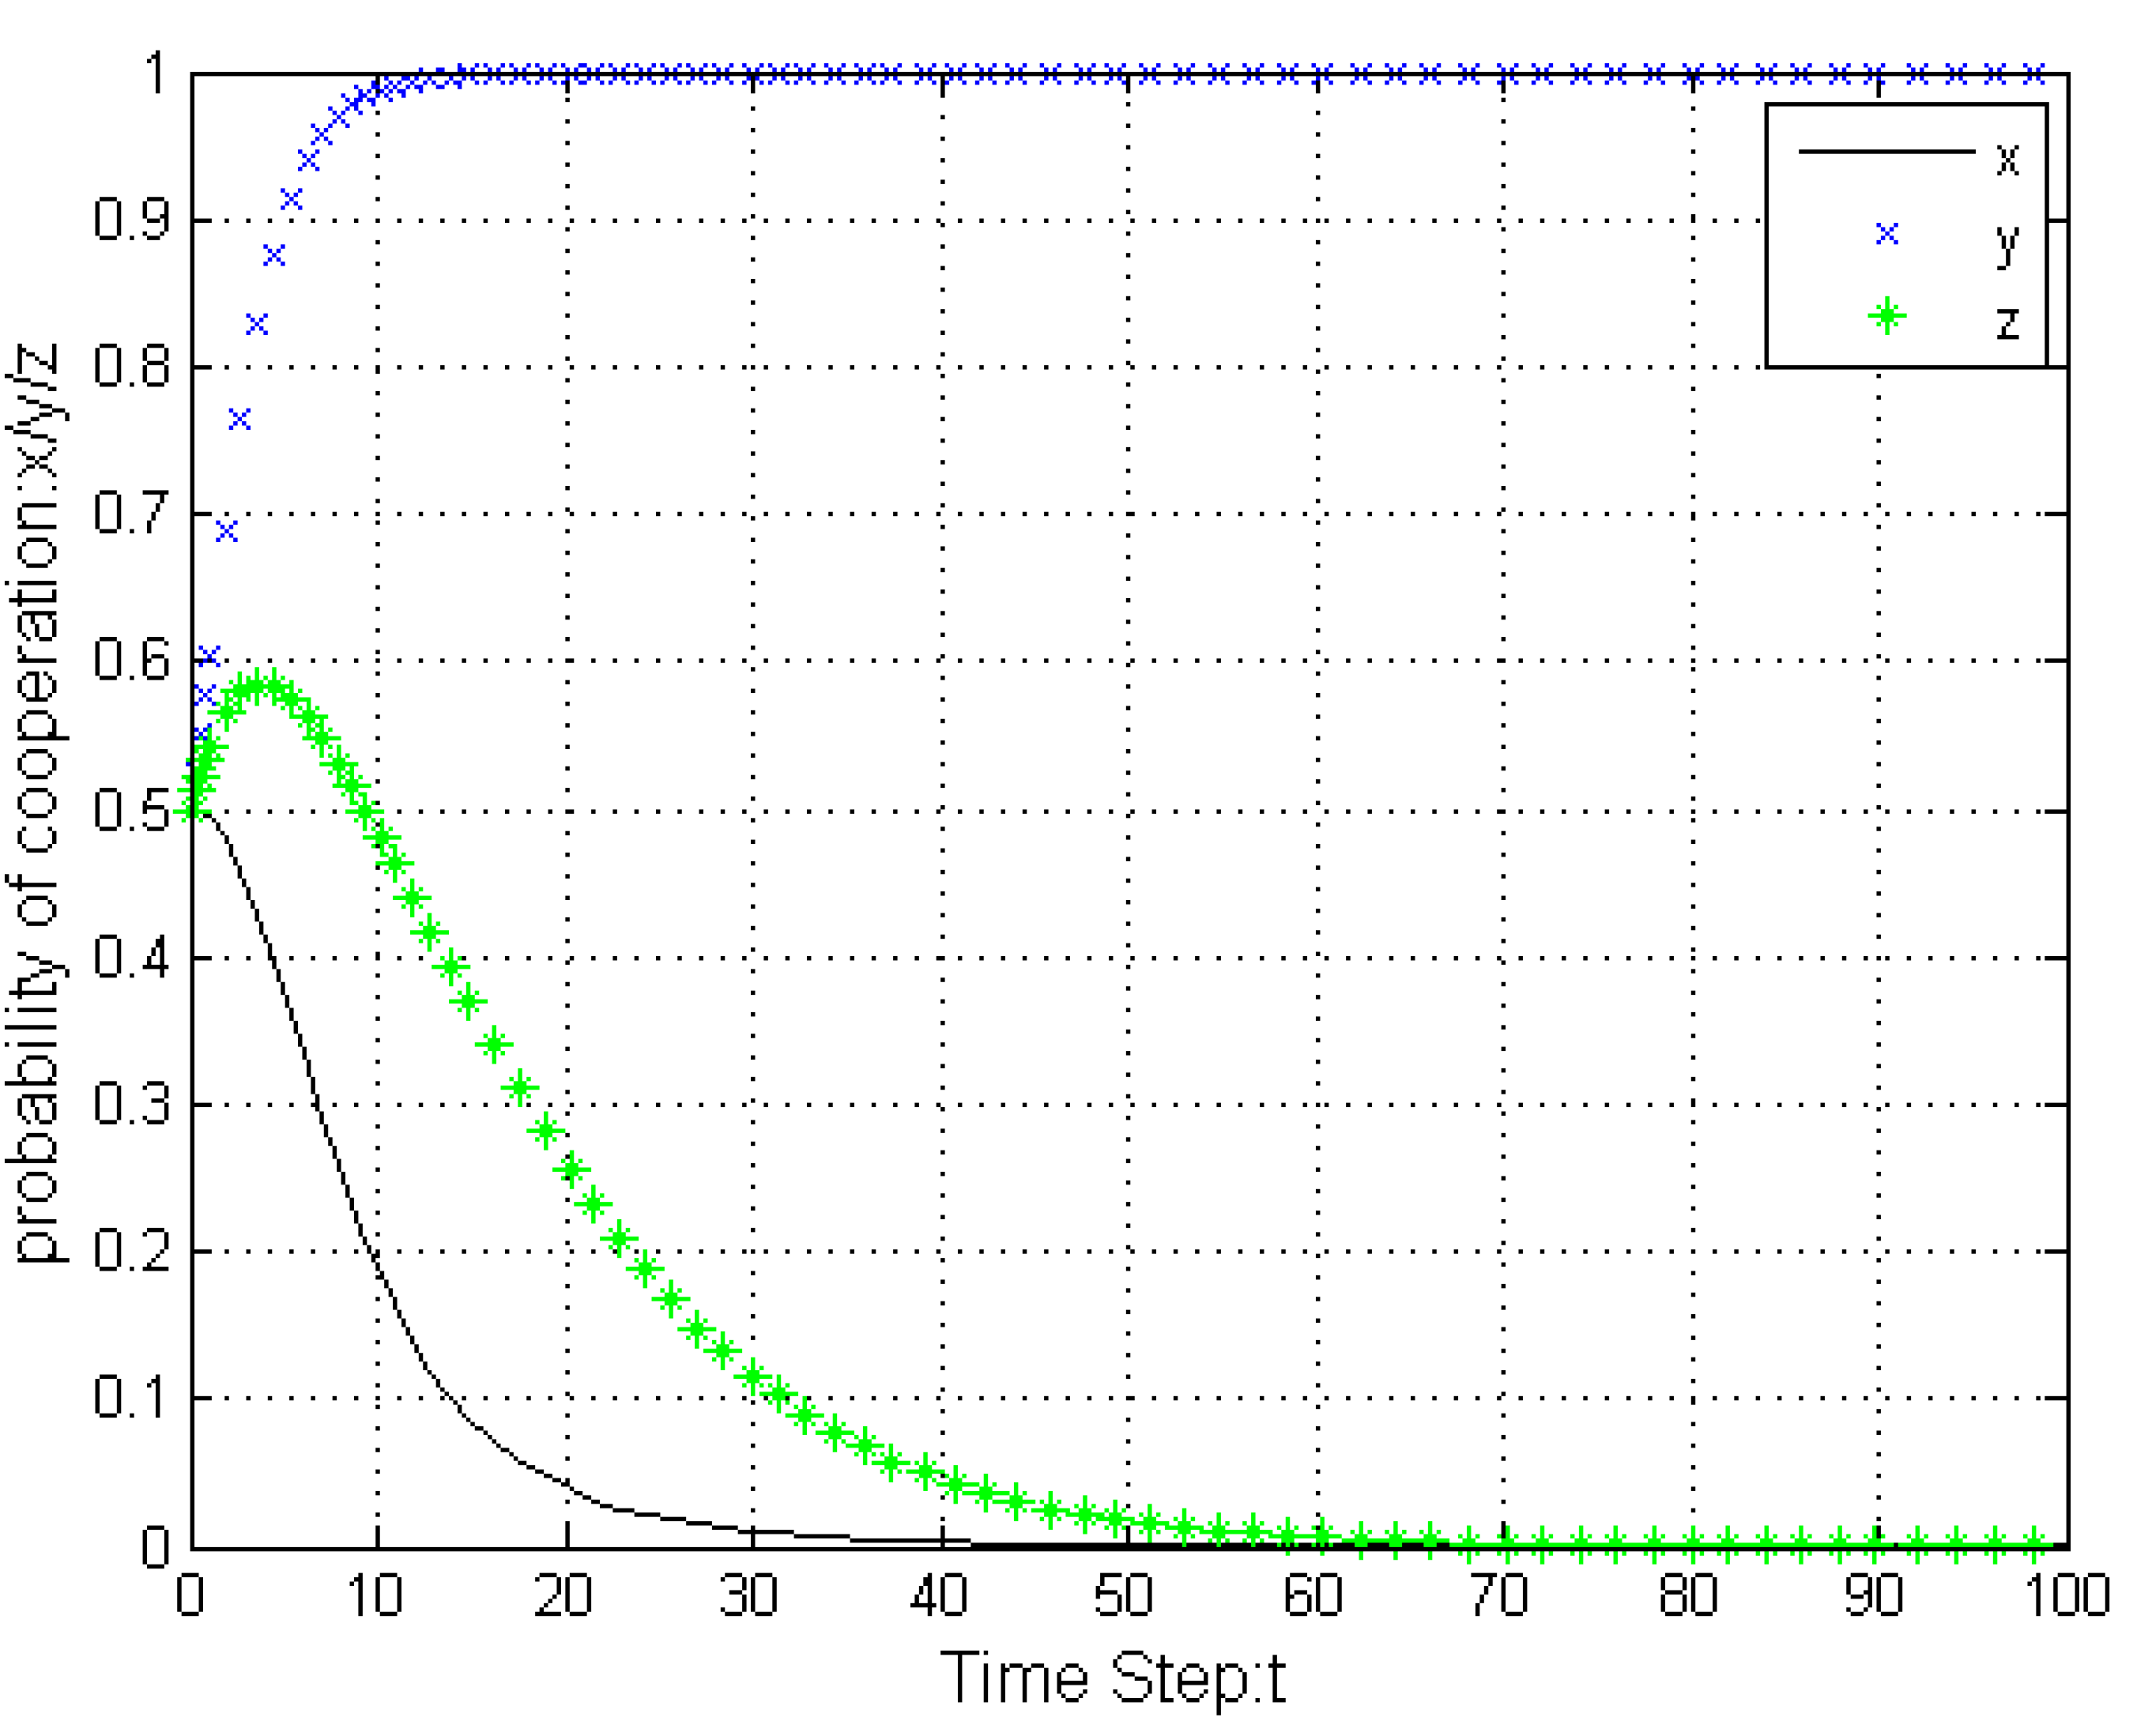
- When there is an evolutionarily stable strategy, the initial willingness of the players to participate does not affect the final game outcome, but it will change the evolutionary duration. As seen in Figure 1, variations in RDP willingness to cooperate all eventually lead to full cooperation, but that evolution takes longer when the initial willingness is low.
- (3)
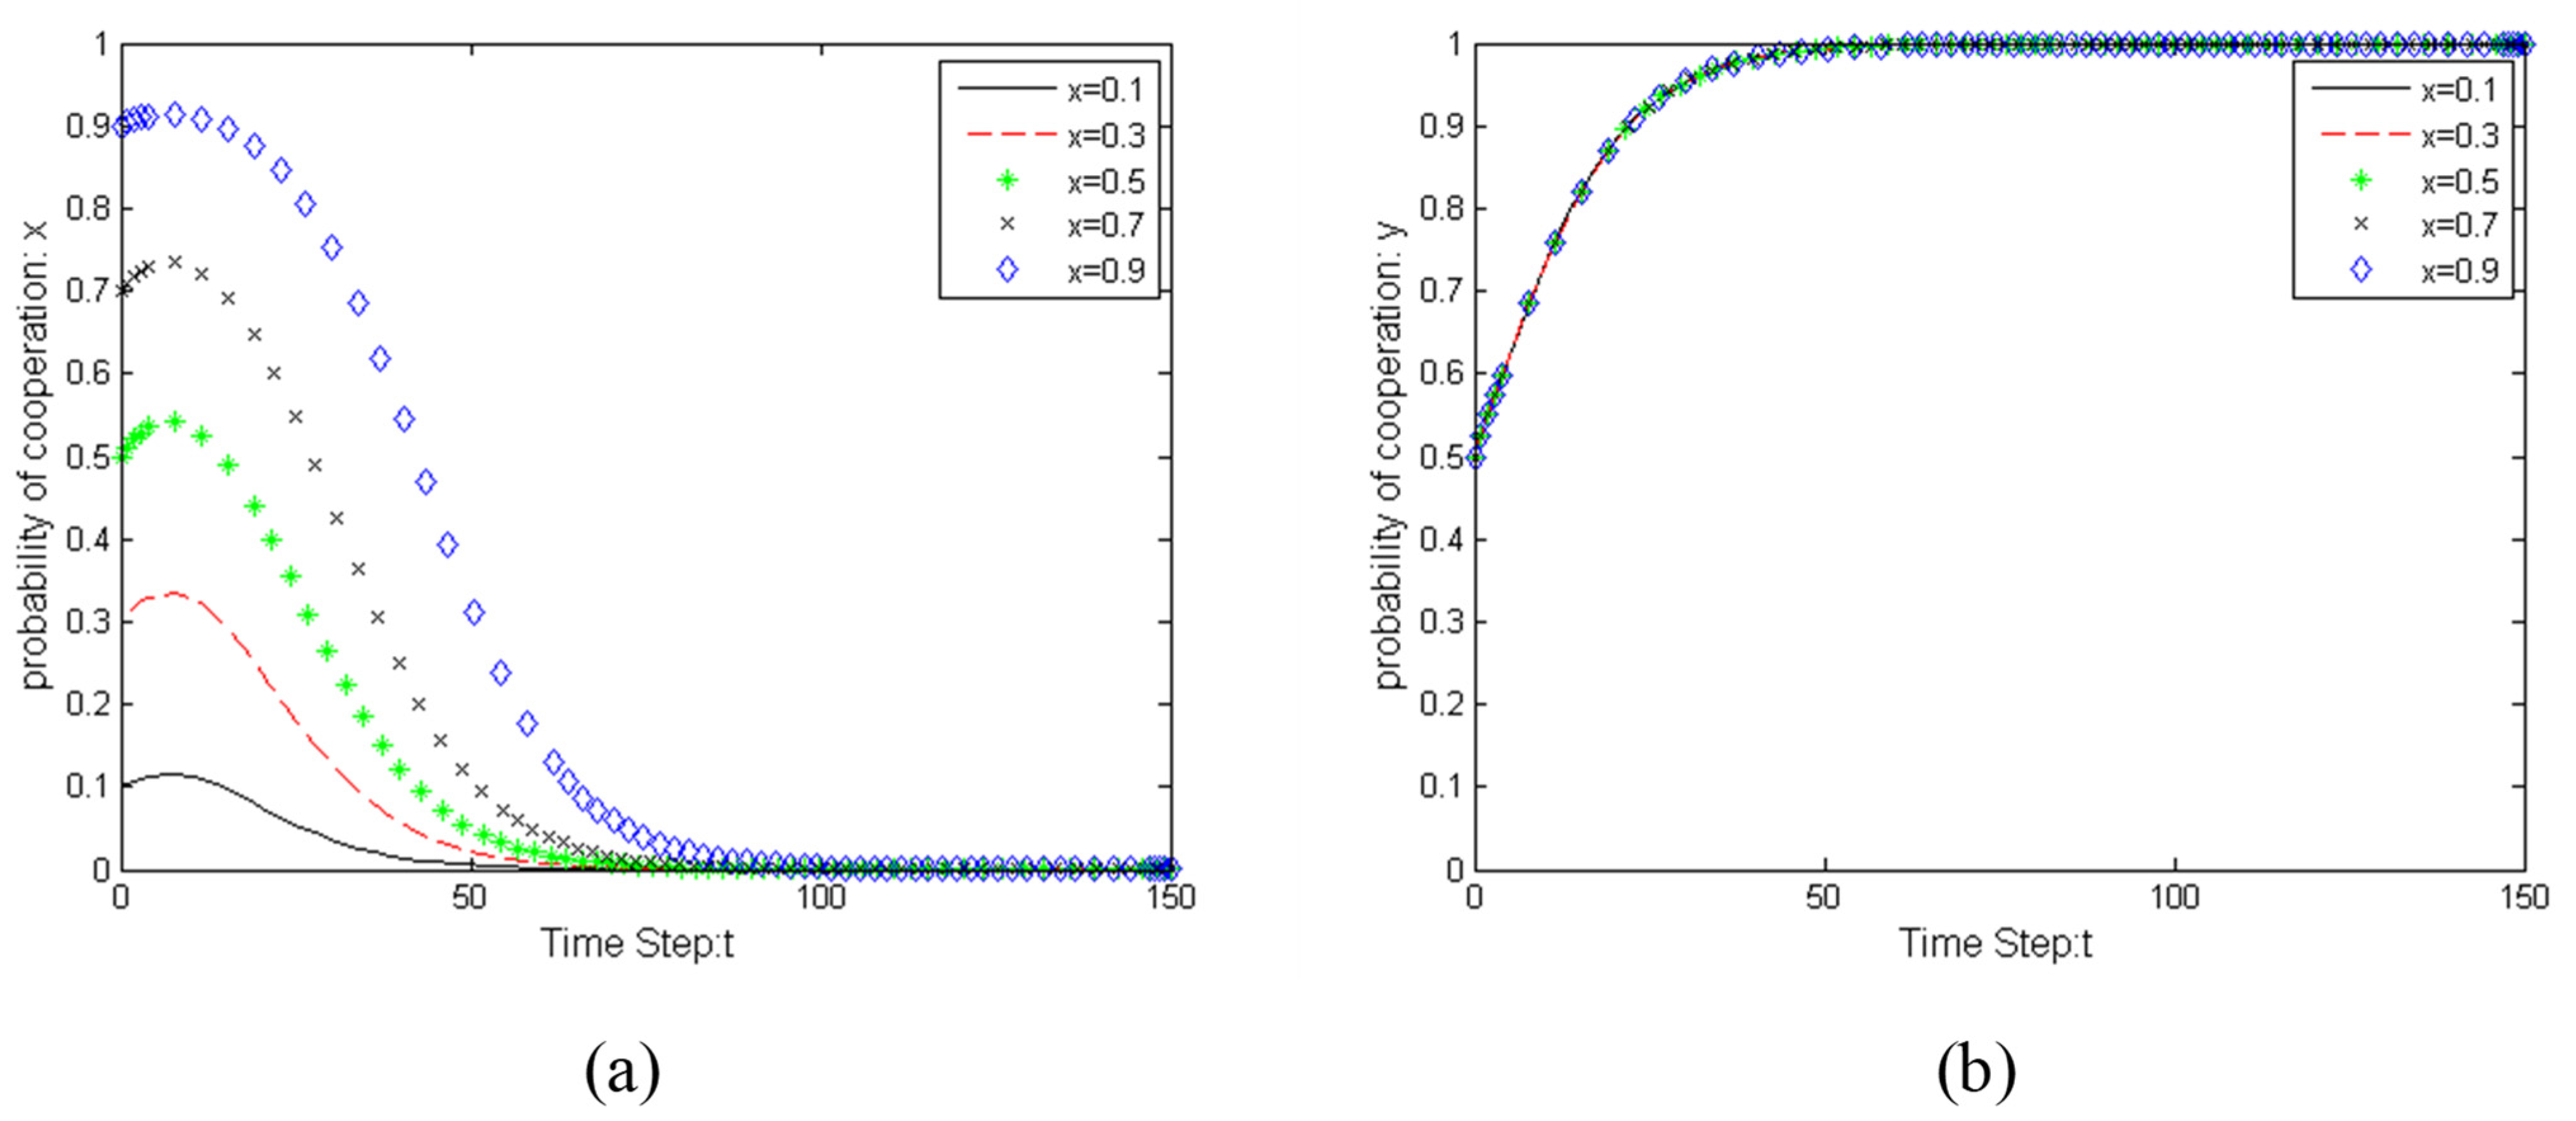
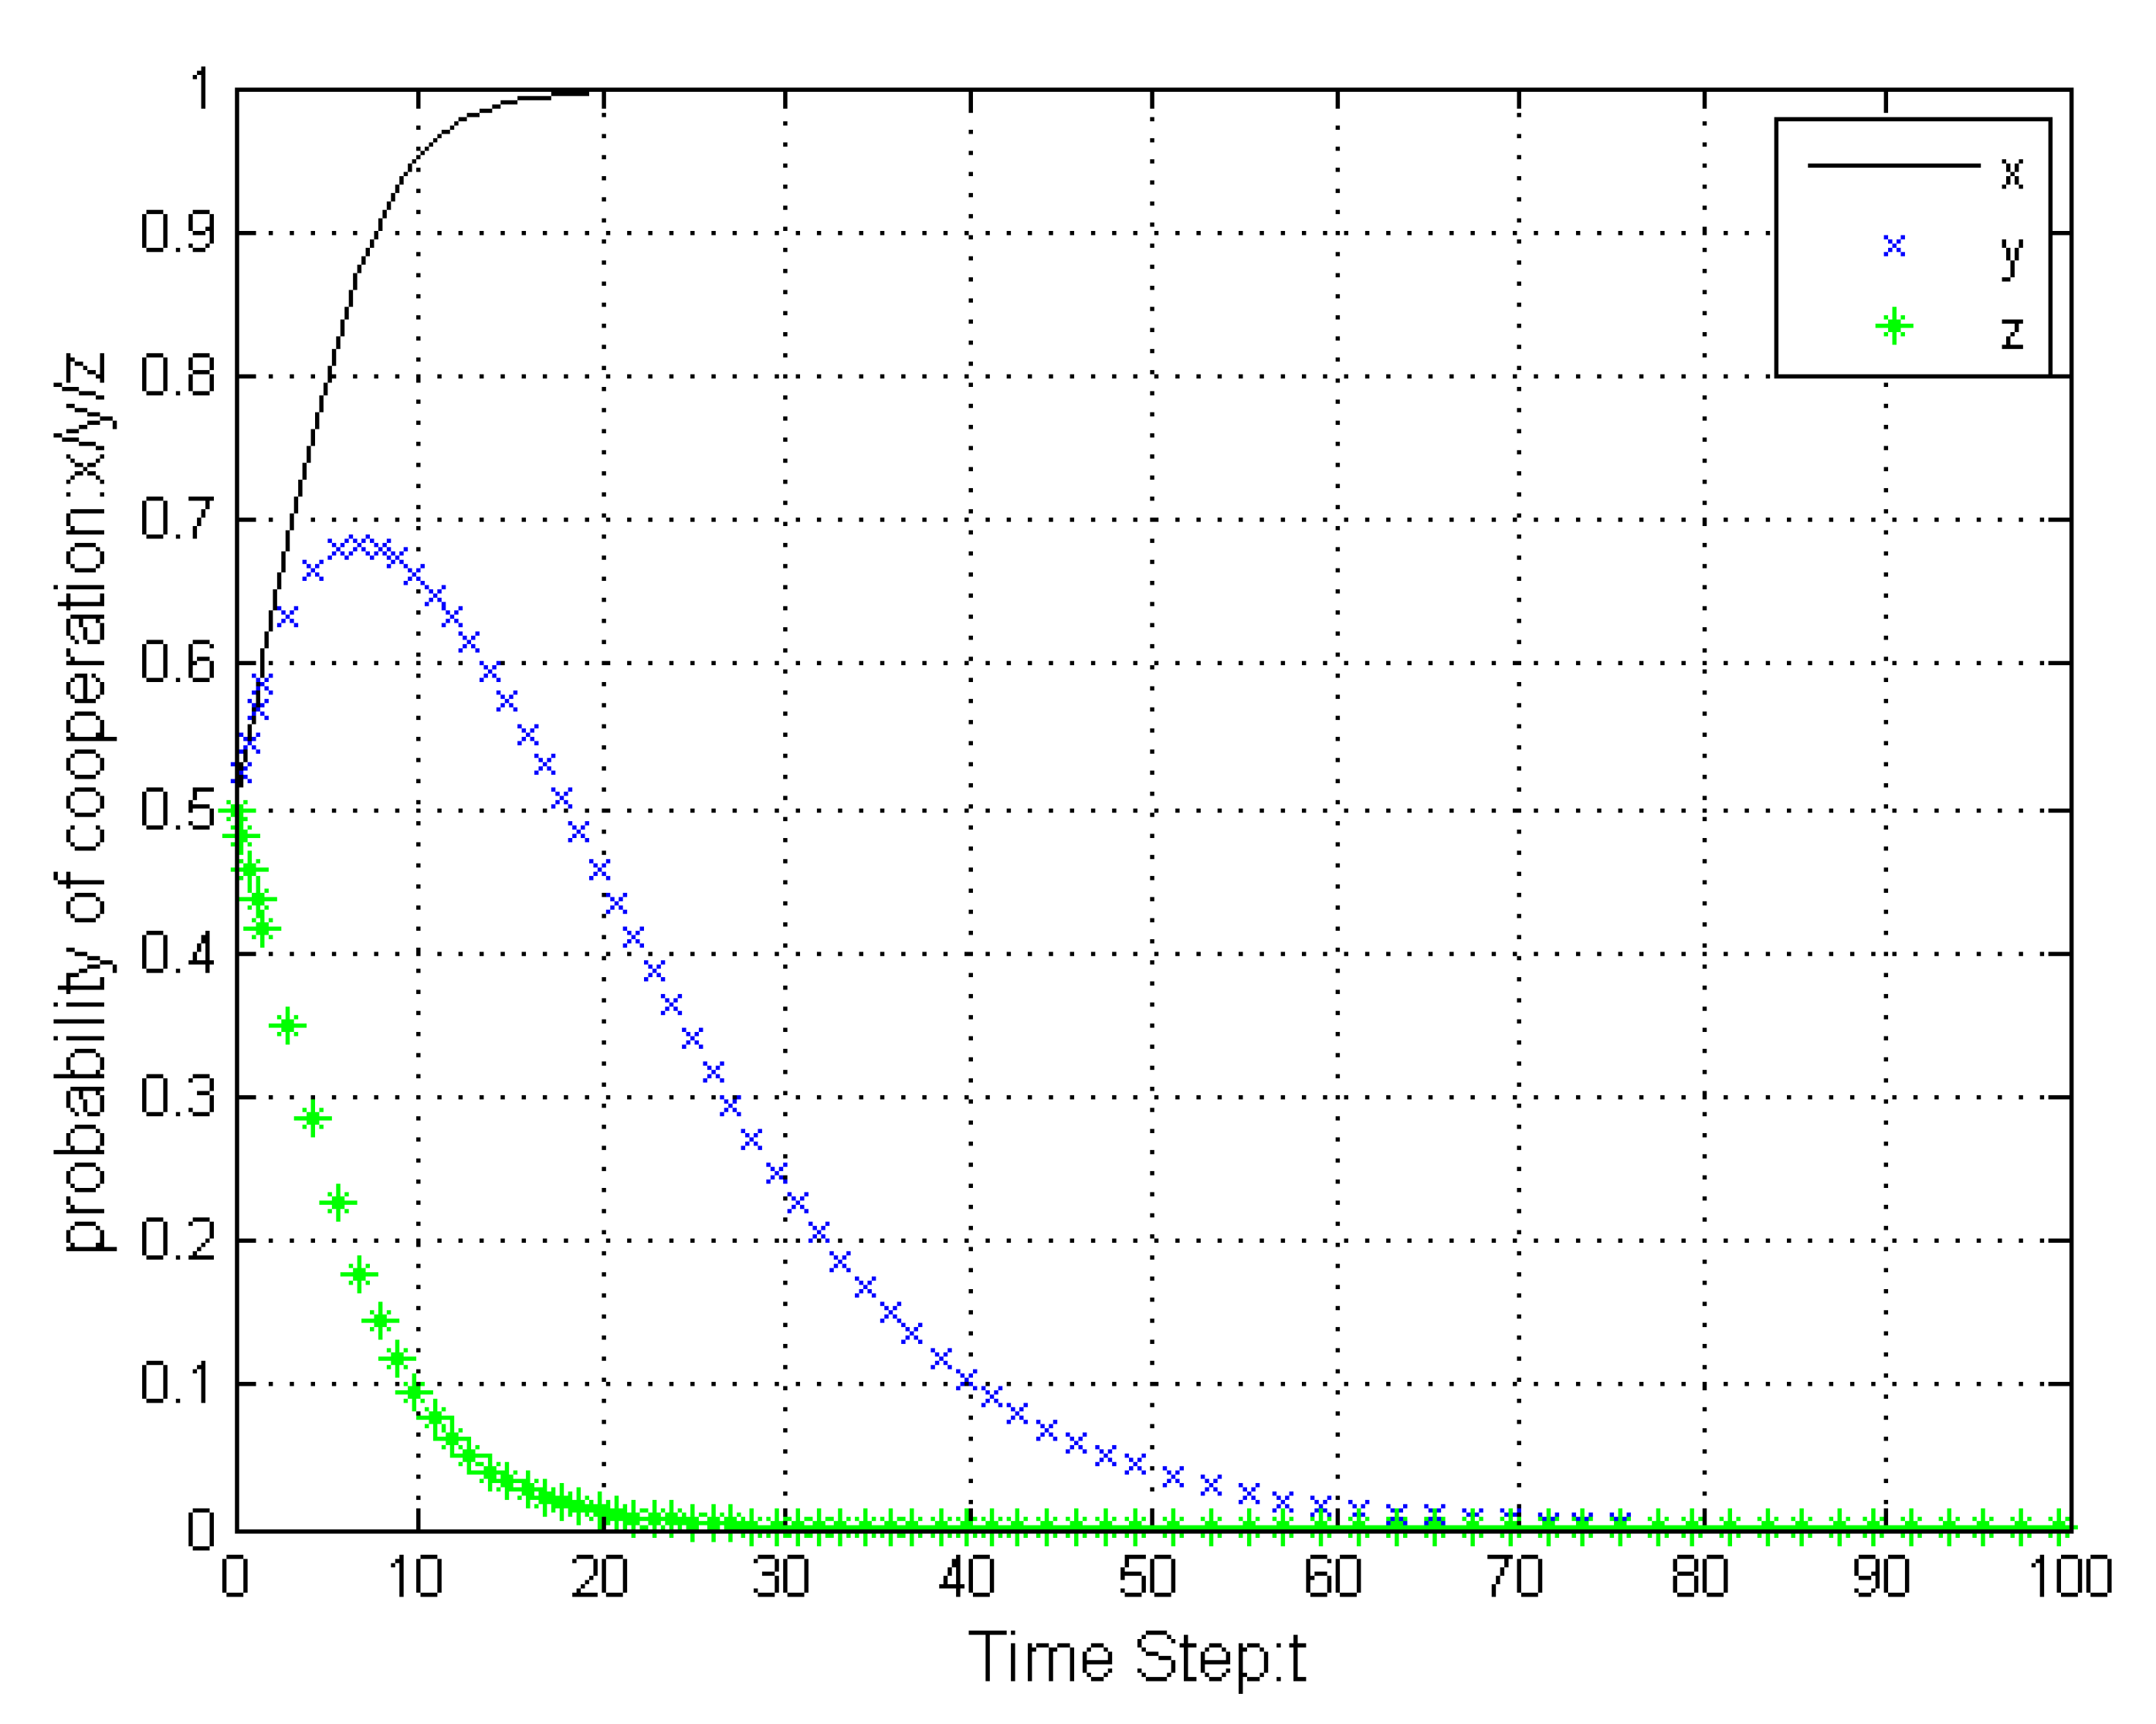
- Since the strategies of the players mutually interact, they may be perturbed away from the stable strategy and then return, as shown in Figure 2. The developer is more likely to compromise when the RDP do not cooperate, and more likely not to compromise (to reduce expenses) when the RDP do cooperate. So, when RDP’s willingness to cooperate starts out low, the developer is likely to compromise, but as the probability of RDP cooperation increases, the developer will become less likely to compromise.
- (4)
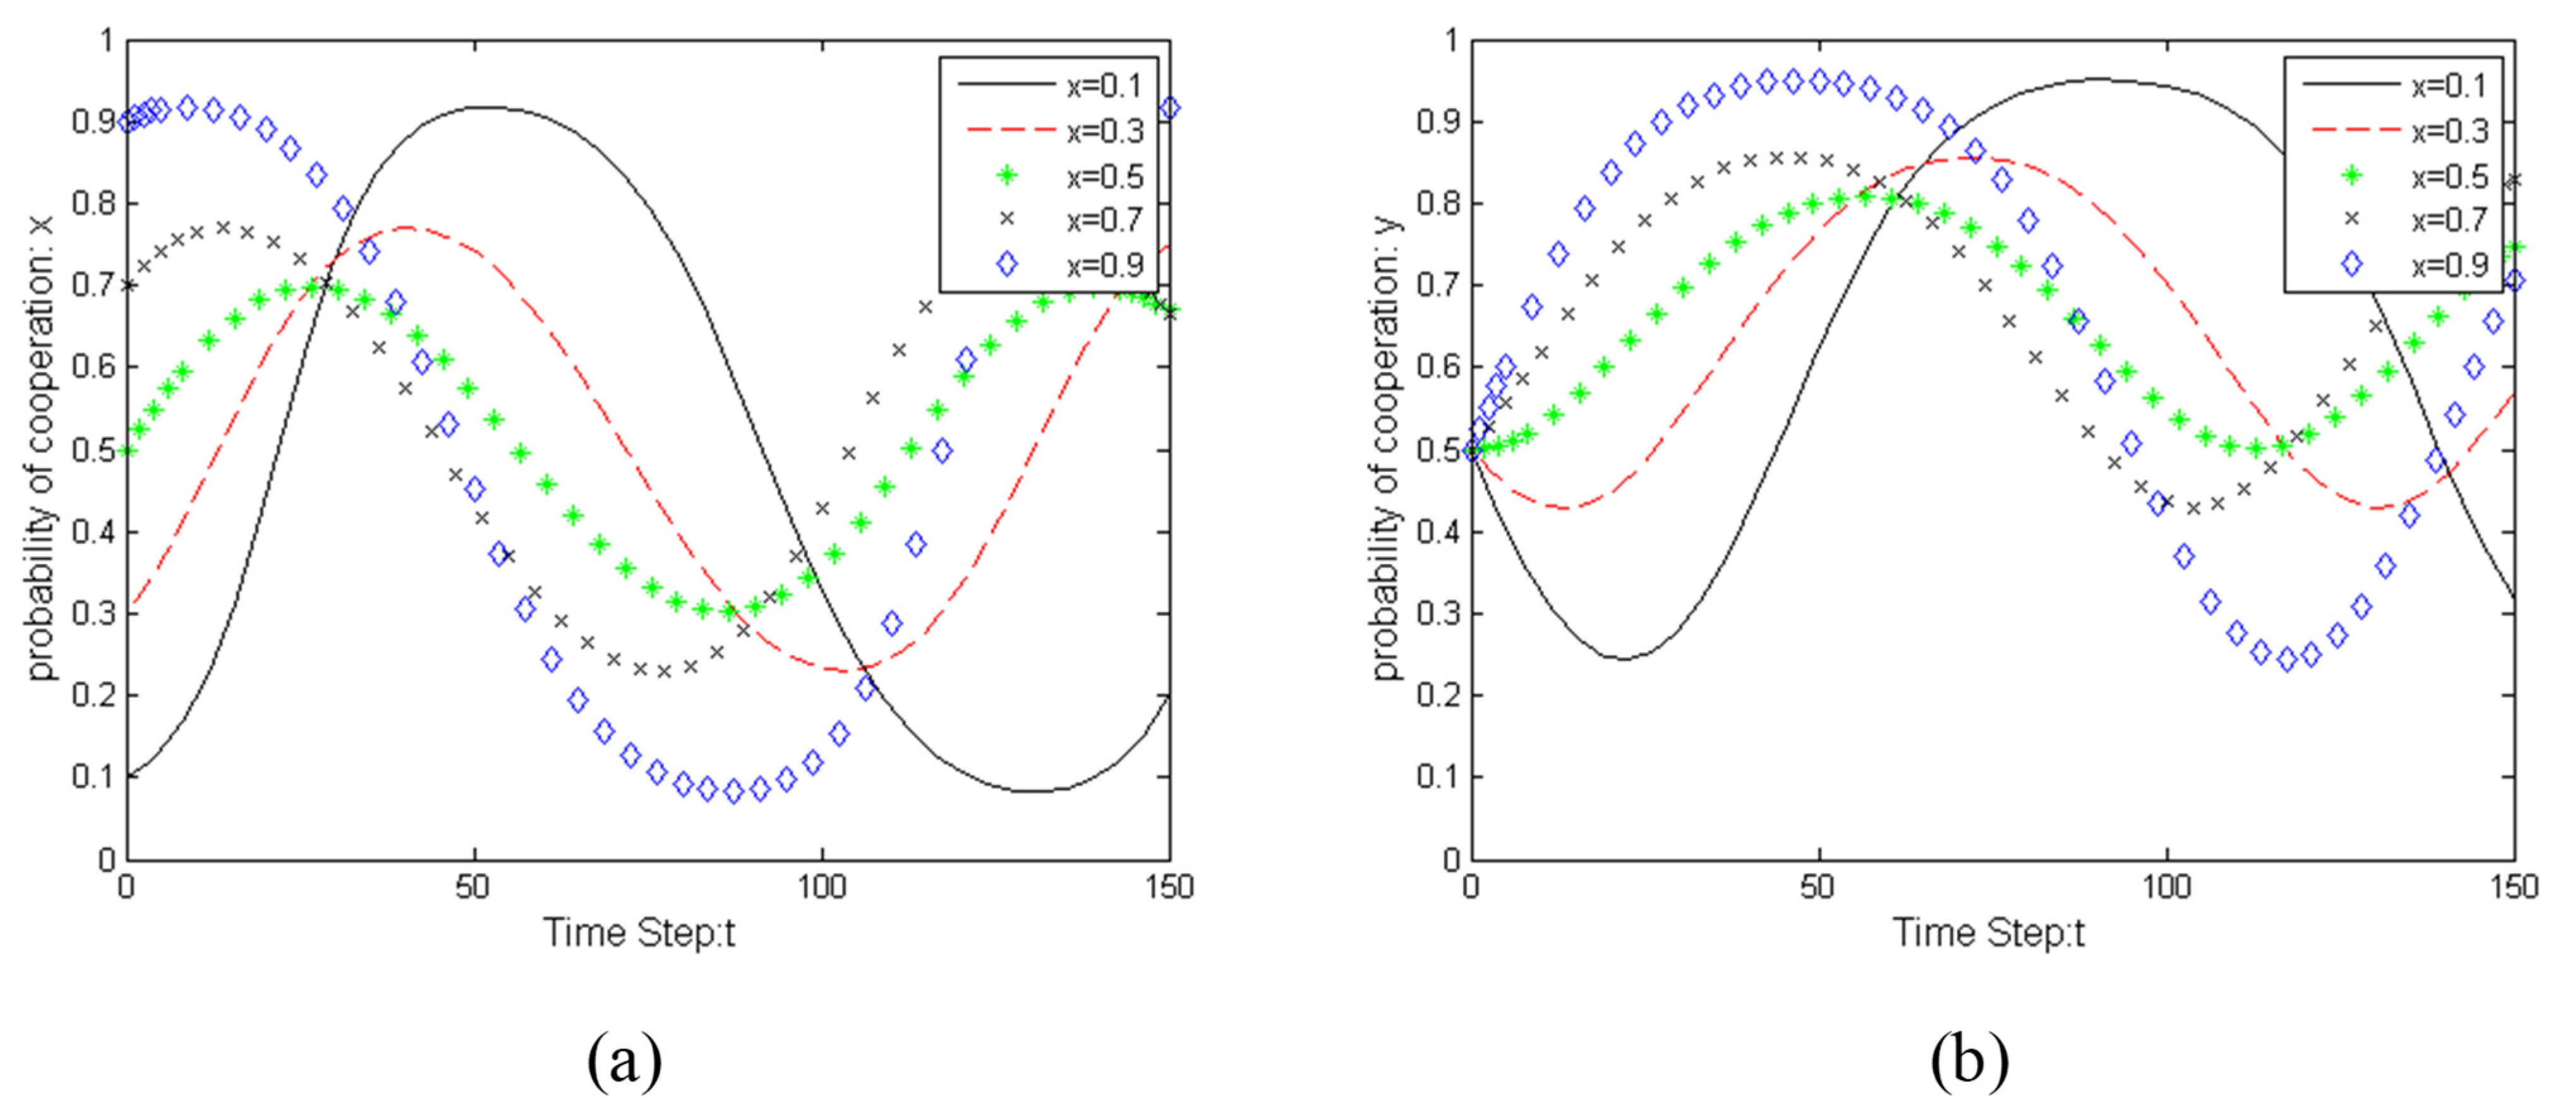
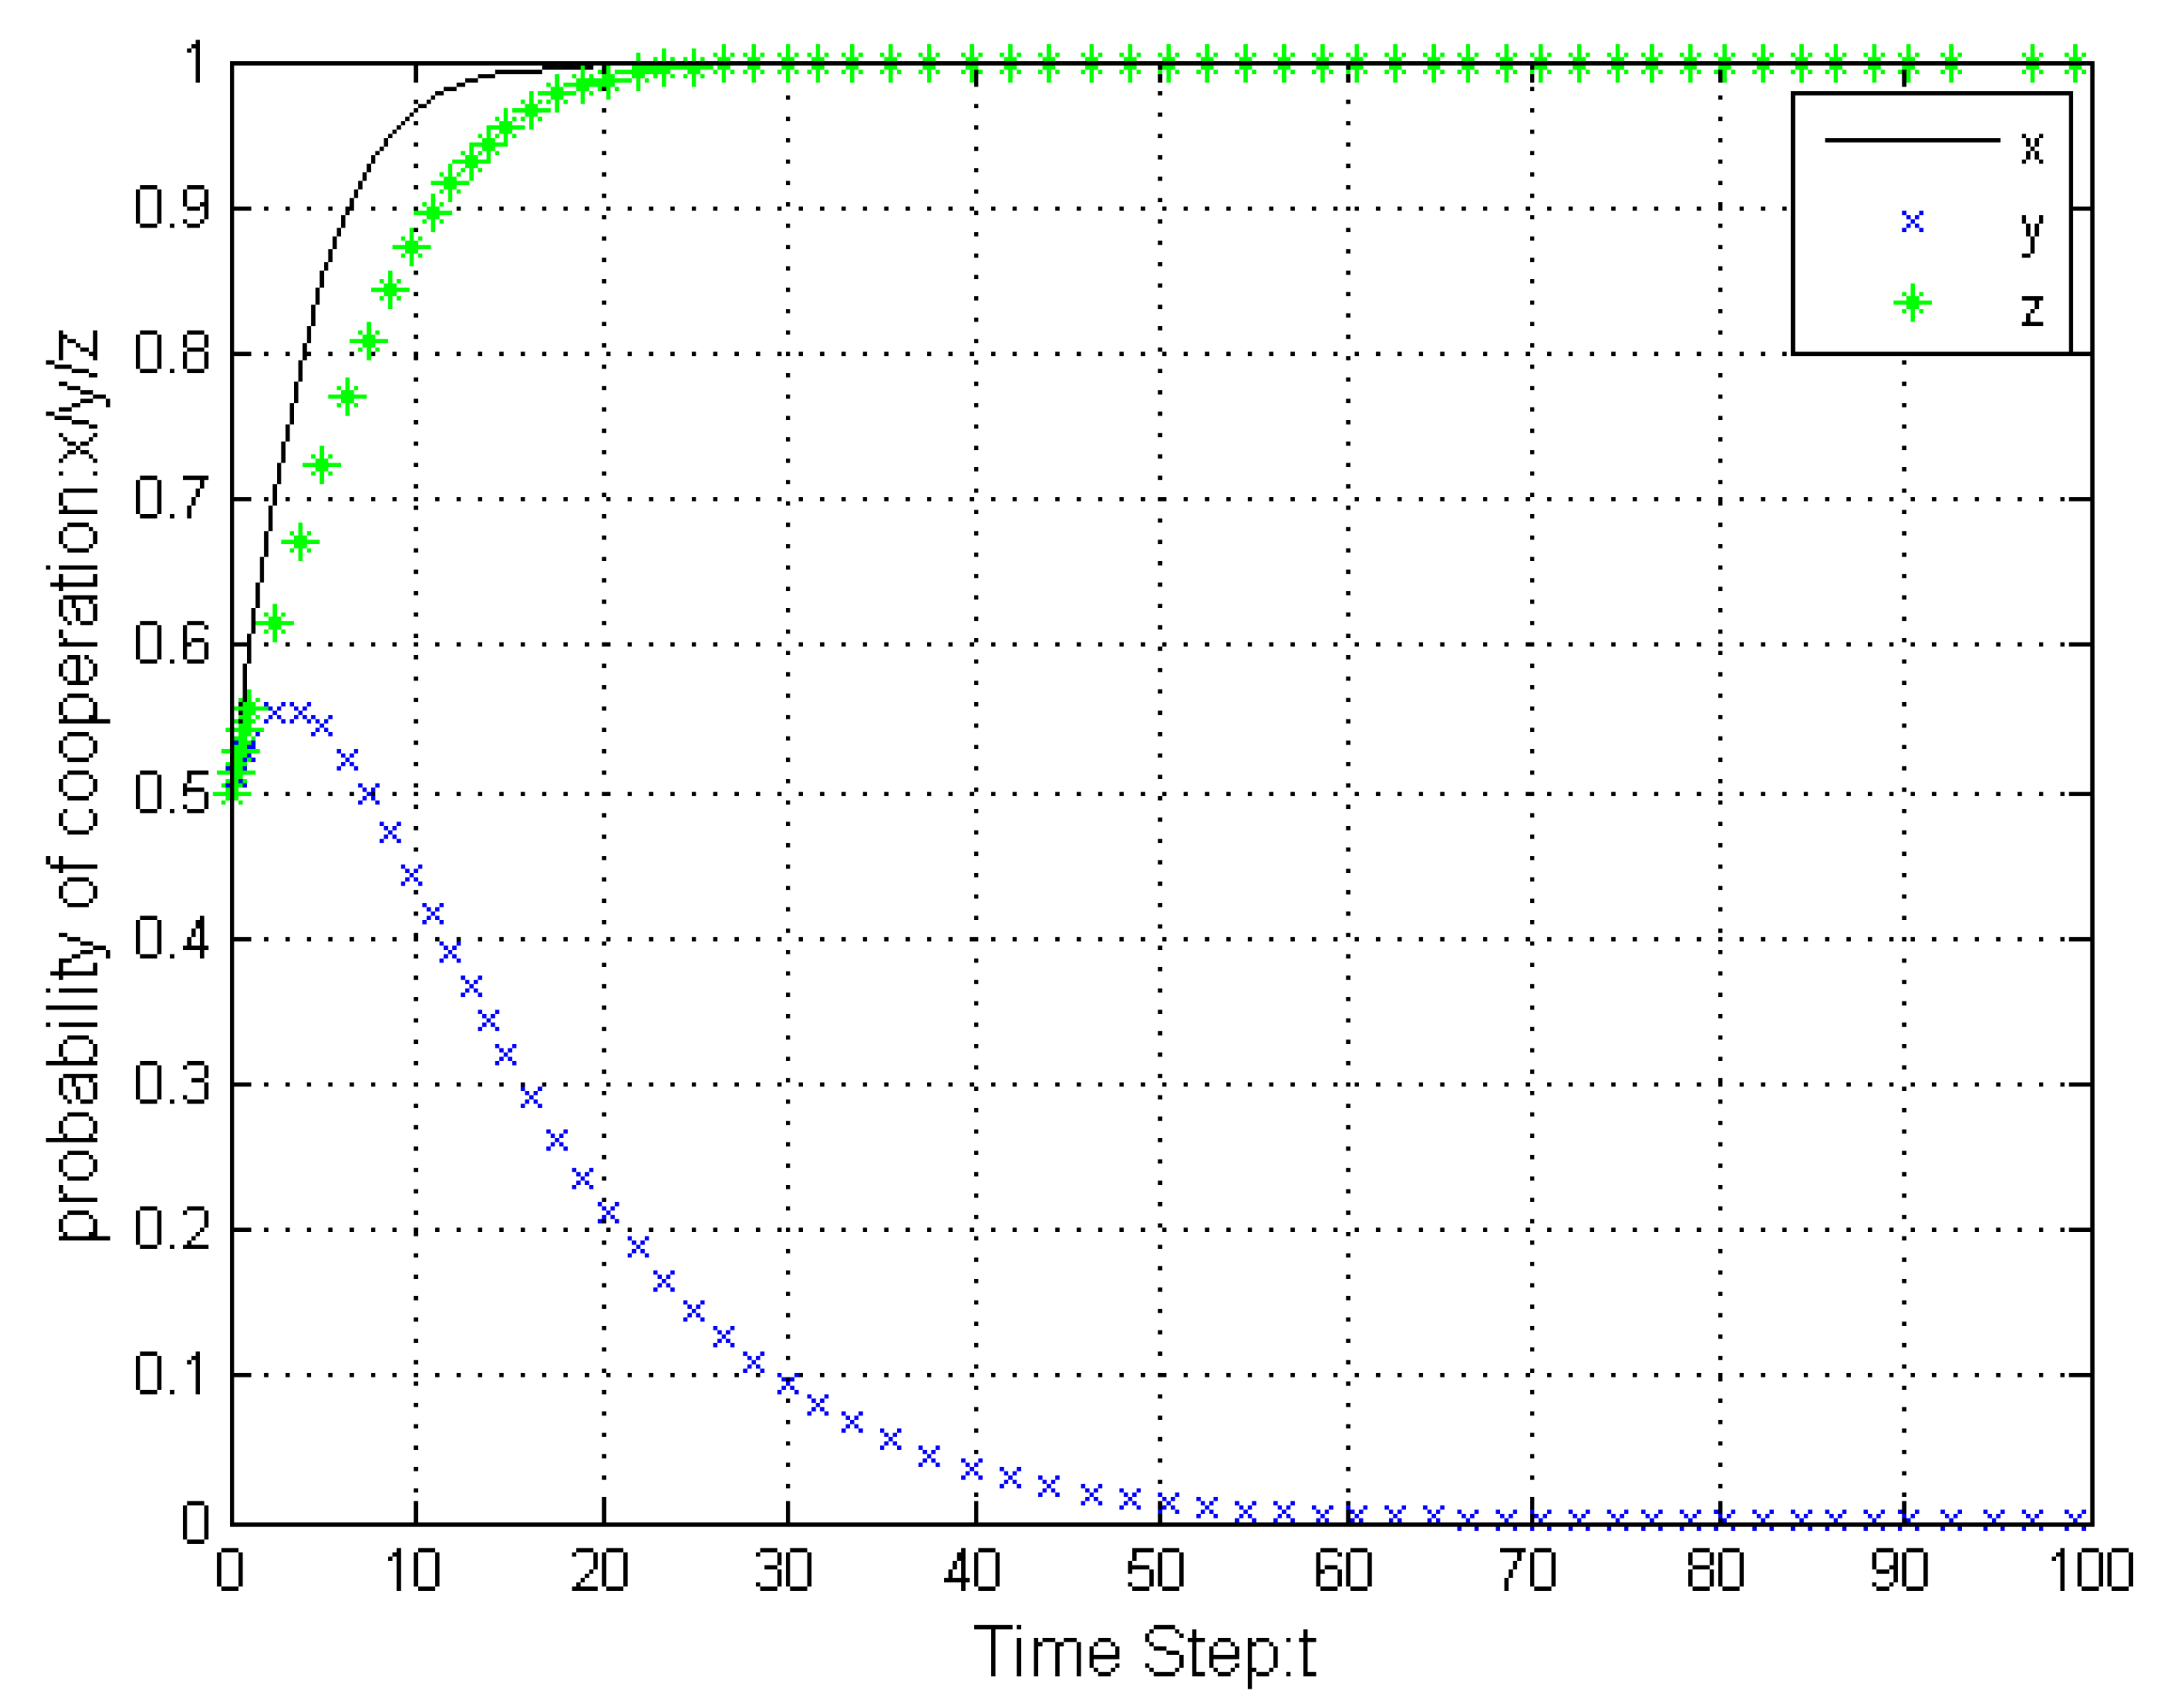
- When the game does not have an evolutionarily stable strategy, its outcome is influenced by the initial willingness of both. As shown in Figure 4, the RDP can gain more benefits by not cooperating with relocation when the developer adopts a compromise strategy, and by cooperating when the developer chooses not to compromise. Meanwhile, the developer will benefit more from compromising if the RDP do not cooperate, and from not compromising if the RDP do cooperate, so a cycle develops: Compromise/no cooperation/no compromise/cooperation/compromise with amplitude and frequency influenced by the initial willingness to cooperate.
4. Evolutionary Game Analysis among RDP, Hydropower Developers, and Government Departments
4.1. Basic Assumptions of the Model
4.2. Model Construction
4.3. Stability Analysis of Equilibrium Points
- (1)
- Equilibrium Conditions
- (2)
- Stability Conditions
- If all the characteristic roots λ of the Jacobi matrix are less than 0, the equilibrium point is an evolutionarily stable strategy (ESS).
- If all the characteristic roots λ of the Jacobi matrix are greater than 0, the equilibrium point is unstable.
- If some of the characteristic roots λ of the Jacobian matrix are greater than 0 and some are less than 0, the equilibrium point is a saddle point.
4.4. Numerical Simulation
- (1)
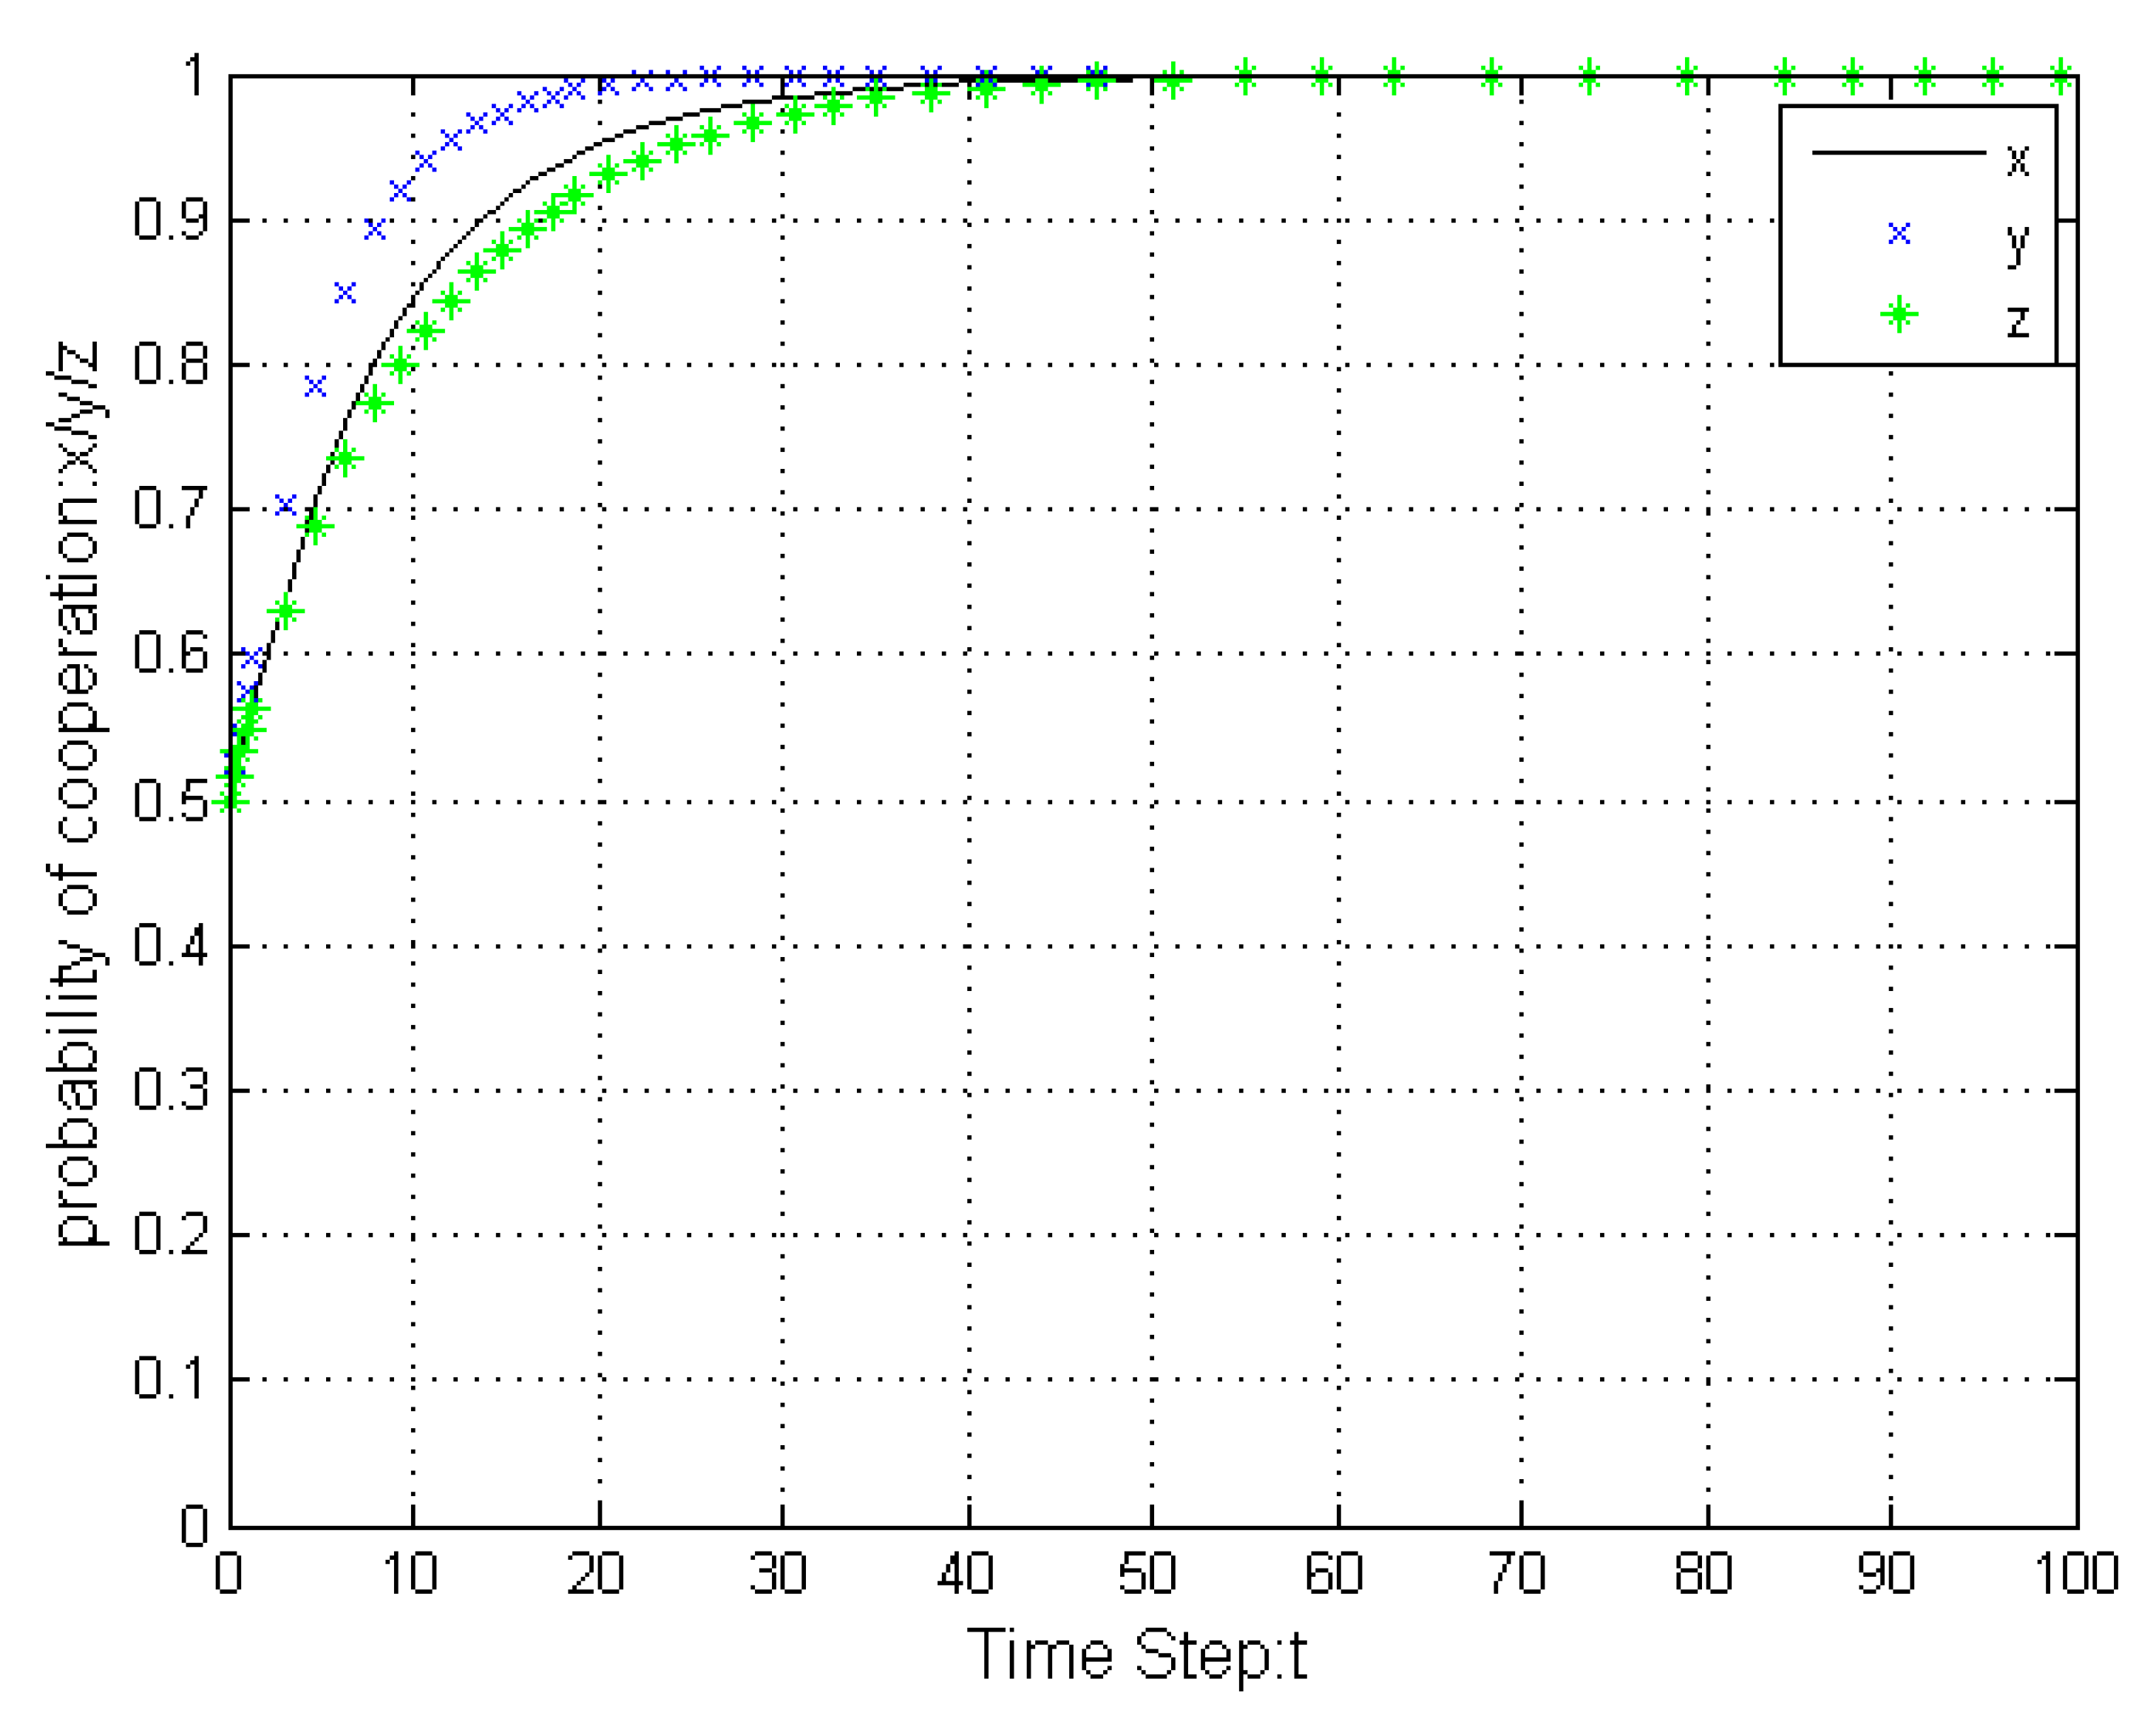
- The simulation results are consistent with the theoretical calculations, with corresponding evolutionary results obtained when different evolutionary conditions are satisfied. The strategy finally chosen by each player is closely related to its cost—the punishments and rewards it faces. Varying the parameter values leads to obvious differences in the results of the three-player game: Regardless of the initial values of x, y, and z, the direction of evolution of each player’s behavior can be changed by means of rewards and punishments to promote the convergence of the system to the ideal state.
- (2)
- When the government adopts a loose regulatory strategy, the strategy choice between the RDP and the hydropower developer operates according to a market mechanism, and the evolutionary results are consistent with the “RDP versus hydropower developer” model, as detailed in the previous section.
- (3)
- When the government department adopts an active regulatory strategy, it can regulate the hydropower development environment by changing the rewards and penalties for hydropower developers and the confrontation costs for uncooperative RDP. The theoretical calculations in the previous section indicate that the evolutionary conditions of all six of these scenarios are related to the rewards and punishments meted out by the government, and the evolutionary direction of the system can be effectively controlled under this macro-regulation. The regulation should start from its evolutionary stable condition. For example, the evolutionary stability condition of is , , . In this case, hydropower developers will tend to choose the no-compromise strategy, even if the government increases the incentives given to the developer .
5. Conclusions and Recommendations
5.1. Conclusions
5.2. Recommendations
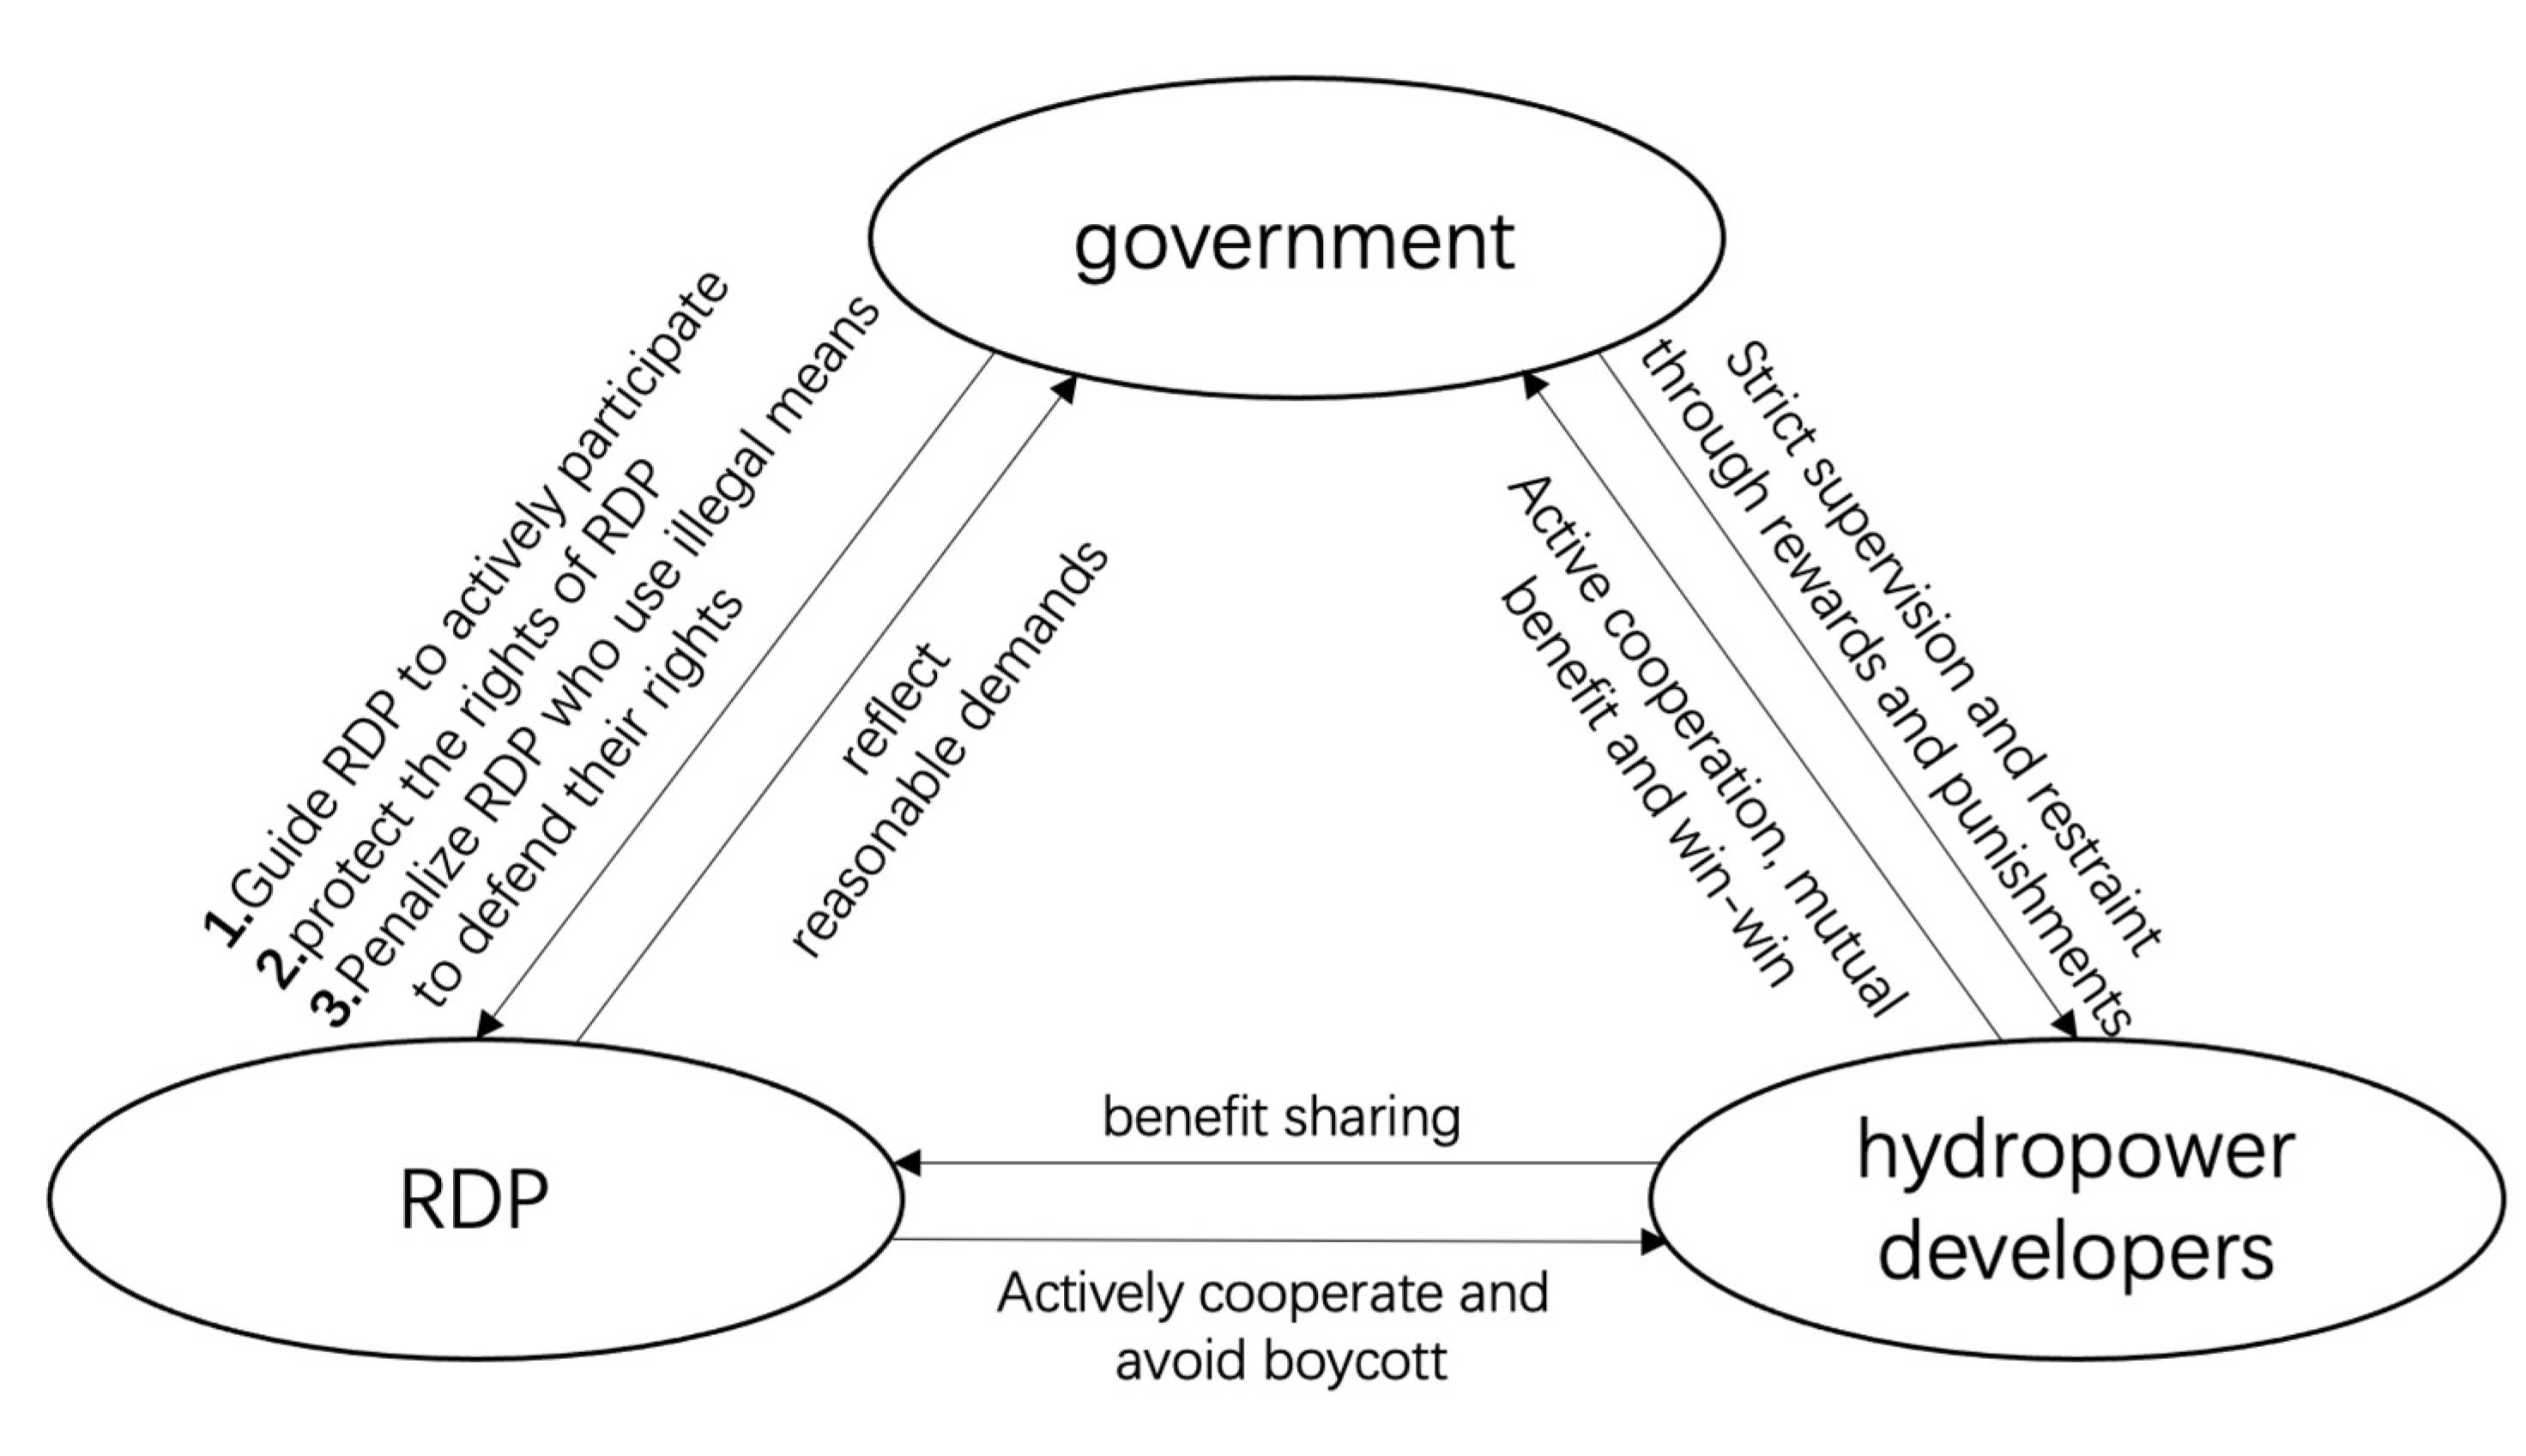
5.2.1. Strengthen Public Policy to Foster the Active Participation of RDP
5.2.2. Adjust Hydropower Development Revenue within Reasonable Limits to Achieve a Win–Win Situation
5.2.3. Strengthen the Government’s Close Supervision to Protect the Rights and Interests of All Parties
Author Contributions
Funding
Institutional Review Board Statement
Informed Consent Statement
Data Availability Statement
Conflicts of Interest
References
- Li, X.; Chen, Z.; Fan, X.; Cheng, Z. Hydropower Development Situation and Prospects in China. Renew. Sustain. Energy Rev. 2018, 82, 232–239. [Google Scholar] [CrossRef]
- Sheng, Z.; Jingyu, J. Evolutionary Game Analysis between Immigration and Developers: A Case Study of Hydropower Development Project. Int. J. Saf. Secur. Eng. 2014, 4, 154–163. [Google Scholar] [CrossRef]
- Zhang, R. Research on Influencing Factors of Hydropower Development in Southeast Asia—Based on the Perspective of Policy System. Res. Nanyang Issues 2022, 1, 39–52. [Google Scholar]
- Liu, L. Research on Land Transfer Compensation in Reservoir Resettlement Area. Ph.D. Thesis, Huazhong Agricultural University, Wuhan, China, 2010. [Google Scholar]
- Yao, K. Research on Reservoir Resettlement; China Water Power Press: Beijing, China, 2008. [Google Scholar]
- Yao, Y. 70 Years of Land Acquisition and Resettlement for Water Conservancy and Hydropower Projects. Hydropower 2020, 5, 8–12+55. [Google Scholar]
- Wang, Z. Talking about the Control of Immigration Investment in Hydropower Projects. Low Carbon World 2019, 9, 54–55. [Google Scholar]
- Zhu, W.; Shi, G. Discussion on the Mechanism and Method of Sharing Engineering Benefits in the Resettlement System. Water Conserv. Econ. 1995, 1, 58–61. [Google Scholar]
- Lv, J. Research on the Cost of Ecological Resettlement Relocation in Southern Shaanxi. Ph.D. Thesis, Northwest University, Xi’an, China, 2014. [Google Scholar]
- Shen, J. Research on the Evaluation System of Flooding Loss of Water Conservancy Project Resettlement. Ph.D. Thesis, Xi’an University of Technology, Xi’an, China, 2018. [Google Scholar]
- Sun, H. Discussion on the Compensation Mechanism of Land Acquisition for the Benefit Sharing of Reservoir Resettlement. J. Three Gorges Univ. 2018, 1, 34–37. [Google Scholar]
- Cernea, M.M. Financing for Development: Benefit-Sharing Mechanisms in Population Resettlement. Econ. Political Wkly. 2007, 42, 1033–1046. [Google Scholar]
- Sheng, Z.; Zheng, B.; Qingmei, T. Sustainable Hydropower Development Research in China–Based on Tripartite Evolutionary Game. Int. Energy J. 2019, 19, 1–10. [Google Scholar]
- Pang, L.; Zhao, M. On the Benefit Sharing of Resource Development in the Eastern and Western Regions. Coast. Enterp. Sci. Technol. 2006, 3, 128–130+113. [Google Scholar]
- Chen, S.; Meng, J. Calculation Method of Shapley Compensation for Resettlement and Relocation of Hydropower Project Construction. J. Hydropower Gener. 2018, 6, 15–24. [Google Scholar]
- Han, Z.; Fei, C. Cooperative Game Analysis of the Conflict of Resettlement for Hydropower in Wujiang River Basin. Water Conserv. Econ. 2017, 2, 69–74+78. [Google Scholar]
- Ren, A. Thinking on Pareto Efficiency of Resettlement for Hydropower Development and the Game of Land for Local Development. J. Three Gorges Univ. 2020, 6, 7–10. [Google Scholar]
- Zhao, Y.; Sun, Y.; Wu, Z. Research on Several Game Problems in Water Conservancy and Hydropower Construction. J. Yangtze River Acad. Sci. 2004, 1, 56–59. [Google Scholar]
- Jia, L.; Zeng, L.; Tian, Z. Three-Party Game Analysis of Hydropower Engineering Claims. Water Conserv. Econ. 2010, 3, 63–66+70+78. [Google Scholar]
- Sheng, J.; Shi, G.; Shang, K. Evolutionary Game Analysis of Mass Emergencies of Hydropower Migrants. Stat. Decis. 2009, 13, 60–62. [Google Scholar]
- Zeng, Y. Game Analysis of Public Interests in Hydropower Project Construction. Sci. Educ. J. 2012, 22, 232–233. [Google Scholar]
- Ren, L.; Chen, Y.; Wu, M. Stability Analysis of Land Conflict Situation in Hydropower Resettlement—Based on Asymmetric Eagle-Dove Game Model. People’s Yangtze River 2015, 9, 111–115. [Google Scholar]
- Xu, J.; Shi, G.; Zheng, R. Analysis of Stakeholders and Their Activities in Hydropower Resettlement. Anhui Agric. Sci. 2008, 25, 11102–11104+11131. [Google Scholar]
- Shi, G.; Kong, L. Stakeholder Analysis of Hydropower Development Enterprises and Realization of Ownership. Econ. Res. 2008, 17, 38–39. [Google Scholar]
- Liu, B.; Yao, K.; Wang, F.; Chi, X.; Gong, Y. Benefit Sharing in Hydropower Development: A Model Using Game Theory and Cost–Benefit Analysis. Water 2022, 14, 1208. [Google Scholar] [CrossRef]
- He, Z. Research on Cooperative Evolution Based on Adaptive Migration. Master’s Thesis, Yunnan University of Finance and Economics, Yunnan, China, 2021. [Google Scholar]
- Weng, Y. Game Analysis and Simulation Research of Shared Bicycle Stakeholders. Master’s Thesis, Changzhou University, Changzhou, China, 2021. [Google Scholar]
- Xiao, Q. Research on the Development Countermeasures of Shared Bicycles in My Country Based on Evolutionary Games. Master’s Thesis, Fujian Normal University, Fuzhou, China, 2019. [Google Scholar]
- Hu, W. Stability, Bifurcation and Chaos of Evolutionary Game Dynamical Systems. Ph.D. Thesis, Hebei Normal University, Shijiazhuang, China, 2020. [Google Scholar]
- Liu, M. Research on Evolutionary Game Behavior of Cooperative Network. Ph.D. Thesis, Shandong Normal University, Wuhan, China, 2021. [Google Scholar]


| Stakeholders | Characteristic | Behavior | Committed Resources | Main Risks | Expected Return |
|---|---|---|---|---|---|
| Hydropower developers | Proactive | Investment, construction | Financial resources, human resources | Financial | Project economic benefits |
| Government departments | Proactive | Administration | Administrative resources | Political | Tax, social benefits |
| Displaced persons | Passive | Relocation | Land resources, socio-economic relations, etc. | Poverty | Compensation, subsidies, and post-completion support |
| Parameter | Meaning |
|---|---|
| Compensation received by RDP in the project | |
| Costs when RDP cooperate with relocation | |
| Costs when RDP do not cooperate with relocation | |
| Rewards for RDP who cooperate under a compromise strategy | |
| Additional compensation given by hydroelectric developer after compromise when reservoir migrants did not cooperate | |
| Hydropower developer’s gain from the project | |
| Cost for hydropower developer under compromise strategy | |
| Cost for hydropower developer under a no-compromise strategy | |
| Additional losses for hydropower developer due to project delays due to RDP conflicts | |
| Probability of RDP choosing to cooperate | |
| Probability of hydropower developer choosing a compromise strategy |
| Developer | ||
|---|---|---|
| RDP | ||
| Balancing Point | ||
|---|---|---|
| 0 | - |
| Binding Conditions | Balancing Point | Results | |||
|---|---|---|---|---|---|
| Condition 1 | + N N − | + − − + | Unstable Saddle point Saddle point Stability (ESS) | ||
| Condition 2 | + N − N | + − + − | Unstable Saddle point Stability (ESS) Saddle point | ||
| Condition 3 | N + N − | − + − + | Saddle point Unstable Saddle point Stability (ESS) | ||
| Condition 4 | + − N N | + + − − | Unstable Stability (ESS) Saddle point Saddle point | ||
| Condition 5 | N + − N | − + + − | Saddle point Unstable Stability (ESS) Saddle point | ||
| Condition 6 | + − − + | + + + + | Unstable Stable Stability (ESS) Unstable | ||
| Condition 7 | N N N N | − − − − | Saddle point Saddle point Saddle point Saddle point | ||
| Condition 8 | N N − + | − − + + | Saddle point Saddle point Stability (ESS) Unstable |
| Scenario | |||||||
|---|---|---|---|---|---|---|---|
| 1 | 0.7 | 0.9 | 0.4 | 0.6 | 0.3 | 0.2 | 0.3 |
| 2 | 0.7 | 0.9 | 0.4 | 0.6 | 0.1 | 0.2 | 0.3 |
| 3 | 0.7 | 0.9 | 0.4 | 0.6 | 0.1 | 0.4 | 0.3 |
| 4 | 0.7 | 0.9 | 0.4 | 0.6 | 0.1 | 0.4 | 0.1 |
| Strategy Choice | RDP Cooperate | RDP Do Not Cooperate | ||
|---|---|---|---|---|
| Developer Compromises | Developer Does Not Compromise | Developer Compromises | Developer Does Not Compromise | |
| Gov’t uses active regulation | ||||
| Gov’t uses loose regulation | ||||
| Balancing Point | |||
|---|---|---|---|
| Scenario | |||||||||||
|---|---|---|---|---|---|---|---|---|---|---|---|
| 5 | 0.7 | 0.9 | 0.4 | 0.6 | 0.5 | 0.7 | 0.4 | 0.3 | 0.1 | 0.3 | 0.3 |
| 6 | 0.7 | 0.9 | 0.4 | 0.6 | 0.5 | 0.3 | 0.1 | 0.1 | 0.3 | 0.1 | 0.3 |
| 7 | 0.7 | 0.9 | 0.4 | 0.6 | 0.5 | 0.7 | 0.2 | 0.1 | 0.1 | 0.1 | 0.3 |
| 8 | 0.7 | 0.9 | 0.4 | 0.6 | 0.5 | 0.7 | 0.1 | 0.1 | 0.5 | 0.1 | 0.3 |
| 9 | 0.7 | 0.9 | 0.4 | 0.6 | 0.5 | 0.7 | 0.1 | 0.1 | 0.1 | 0.3 | 0.3 |
| 10 | 0.7 | 0.9 | 0.4 | 0.6 | 0.5 | 0.7 | 0.1 | 0.1 | 0.2 | 0.1 | 0.3 |
Publisher’s Note: MDPI stays neutral with regard to jurisdictional claims in published maps and institutional affiliations. |
© 2022 by the authors. Licensee MDPI, Basel, Switzerland. This article is an open access article distributed under the terms and conditions of the Creative Commons Attribution (CC BY) license (https://creativecommons.org/licenses/by/4.0/).
Share and Cite
Liu, B.; Yao, K.; Wang, F.; Zhang, D.; Chi, X. Game Analysis and Simulation Study of Hydropower Development Interests. Water 2022, 14, 2331. https://doi.org/10.3390/w14152331
Liu B, Yao K, Wang F, Zhang D, Chi X. Game Analysis and Simulation Study of Hydropower Development Interests. Water. 2022; 14(15):2331. https://doi.org/10.3390/w14152331
Chicago/Turabian StyleLiu, Bingwen, Kaiwen Yao, Feilong Wang, Dan Zhang, and Xu Chi. 2022. "Game Analysis and Simulation Study of Hydropower Development Interests" Water 14, no. 15: 2331. https://doi.org/10.3390/w14152331