Article

Numerical Limit Analysis of the Stability of Reinforced Retaining Walls with the Strength Reduction Method

1
CCCC Investment Company Limited, Beijing 100088, China
2
School of Hydraulic Engineering, Faculty of Infrastructure Engineering, Dalian University of Technology, Dalian 116024, China
3
State Key Laboratory of Coastal and Offshore Engineering, Dalian University of Technology, Dalian 116024, China
*
Author to whom correspondence should be addressed.
Water 2022, 14(15), 2319; https://doi.org/10.3390/w14152319
Submission received: 7 July 2022 / Revised: 17 July 2022 / Accepted: 20 July 2022 / Published: 26 July 2022
(This article belongs to the Special Issue Safety Evaluation of Dam and Geotechnical Engineering)

Abstract

:
The failure mechanism of MSE (mechanically stabilized earth) walls was studied via numerical analysis with the finite element strength reduction method, which was verified as an effective technique by simulating the experimental results reported in previous papers. The finite element program was applied to explore the effects of reinforcement, geometry, and seismic parameters on failure mechanism control at the design stage of MSE walls to avoid the unavoidable errors experienced in common numerical analysis caused by the assumptions of the failure mode and complex input parameters. The research parameters included the wall height, length, and spacing of the geogrid-reinforced retaining wall and seismic load. The results indicated that the wall height and reinforcement length play a major role in failure mode change. When the reinforcement length is less than 2 m, overturning failure could occur, which was unrelated to the other parameters in all cases studied in this paper. In this paper, the parametric study results were presented by evaluating the critical reinforcement length, generating the failure surface pattern, and summarizing design recommendation.

1. Introduction

MSE walls represent a more economical alternative to traditional gravity-type walls. MSE walls are mainly applied in bridge abutments, wing walls, and areas where excavation and slope construction cannot be conducted. Under poor foundation conditions, MSE walls provide significant technical and cost advantages.
Over the past few decades, due to the contradiction between land restrictions and infrastructure development, an increasing number of MSE walls has been applied in slope construction and research [1,2,3,4,5,6,7,8,9,10,11,12]. Field experiments are an important way to study the failure mechanism of MSE walls, which can be divided into full-scale and proportional experiments [13,14,15,16]. The relationship among wall deflection, earth pressure behind the wall, wall height, and the secondary geogrid was obtained by measuring the wall pressure and strain in field experiments [13,14]. It was confirmed that secondary reinforcement played an important role in decreasing wall-facing deflection and generating a uniform, lateral earth-pressure distribution. Yazdandoust and Ghalandarzadeh [15] performed shaking table scaled model tests to obtain the failure pattern of reinforced walls, which reflects the influence of a nonuniform acceleration distribution on the value of the seismic coefficient for reinforced soil structures. Safaee et al. [17] measured values of the most critical dynamic parameters of single-layer and multi-layer walls subjected to different seismic loads. The behavior of wall stability was obtained from the comparison of single-layer and multi-layer walls.
MSE wall stability analysis theory is also an effective way to explore the wall failure mechanism. According to the limit equilibrium method, Bilgin [1] studied the effect of the reinforcement length on the MSE wall failure mode. In his research, it was concluded that the reinforcement length could be reduced to less than 70% of the wall height under the condition of perfect parameters. In addition, the type of reinforcement exerted an important impact on the wall stability [18]. However, simple theoretical analysis is limited by the inherent shortcomings of analysis theory.
The most common research topic in numerical parameter analysis is the limit equilibrium theory, which constitutes the theoretical basis of current design manuals [2,13,19,20]. The influence of the extension and the strengthening of the stability of reinforced soil wall was studied by using the finite element model [2]. Leshchinsky et al. [19] proposed a new limit analysis framework verified by parametric analysis. Their research results revealed that the proposed framework was reasonable, including the influence of facing blocks, seismicity, reinforcement length, and secondary reinforcement. Finite element analysis of MSE walls yielded more accurate results, but the calculation process is time-consuming [20]. By examining the overall stability evaluation of the finite element method, Razeghi et al. [16] provided suggestions for wall designers to quickly check the overall stability of retaining walls. Jiang et al. [13] indicated that secondary reinforcement resulted in a uniform, lateral earth-pressure distribution. However, these simulation experiments were based on theoretical analysis of the slope stability, which often produced a high safety factor for circular failure surfaces and a low safety factor for V-shaped failure surfaces. Liu et al. [21] proposed a novel finite element limit equilibrium method (FELEM) to enhance the applicability of slope stability of FELEM which was validated by five slope problems. The limit equilibrium method must assume a general form of the failure mechanism for calculation, which often leads to inaccurate calculation results [5]. The influence of geosynthetic reinforcement on the stability of the retaining structure was conducted by using the finite element limit analysis method. Hassen et al. [22] proposed a new calculation method (multiphase model) to numerically analyze the stability of reinforced soil structures which showed good performance and computing capabilities. Kazimierowicz-Frankowska and Kulczykowski [23] analyzed that the selected analysis method can accurately predict the deformation of reinforced soil structure under service load. By numerical analysis, Mirmoradi et al. [24] studied the factors affecting the foundation stability, including foundation stiffness and geometry, wall height, and reinforcement stiffness. The numerical model calculation carried out parameter analysis to investigate the influence of the reinforcement spacing, wall height, and foundation location, and reinforcement design on the stability of back-to-back reinforced soil-retaining walls [25]. The limit equilibrium method must assume a general form of the failure mechanism for calculation, which often leads to inaccurate calculation results. Finite element analysis of MSE walls yielded more accurate results, but the calculation process is time consuming.
The main objective of this paper is to investigate the stability of reinforced retaining walls using the lower- and upper-bound principles in the classical plasticity theory. The analyses are carried out by the software OptumG2 (Copenhagen, Denmark) [26], which is based on the methodology in Sloan [27], giving rigorous lower and upper bounds on the failure load. This is known as numerical limit analysis, which only requires soil strength parameters that are familiar to geotechnical engineers. In this paper, this method is used to examine the effects of wall geometry, reinforcement, and seismic parameters on the failure mechanism and factor of safety of geogrid reinforced retaining walls. As numerical analysis can account for a wider range of influential parameters, it is a useful complement to experimental studies (typically limited). The numerical analysis results can help engineers better understand the mechanism of the problem. The lower and upper bounds are invaluable in practice, which enable accurate failure loads to be obtained by error estimates and the adaptive meshing technique.

2. Numerical Limit Analysis

The classical limit analysis method was proposed by Drucker and Prager [28] and has been applied in many geotechnical engineering practices. Following previous work in limit analysis, many studies have been performed to upgrade limit analysis; e.g., Sloan [27] achieved great progress in regard to the FELA method, which was implemented in other research studies [29].

2.1. Theory

This paper analyzed the stability of MSE walls with the finite element strength reduction method, which was originally developed by Sloan and includes the theory of lower and upper bounds [30,31]. The adopted analysis software is OptumG2 [26], which is related to 2D modeling.

2.2. Lower-Bound Principle

The lower-bound theory involves an objective function that should be maximized when the structure is subjected to a collapse load under the equilibrium equality constraints expressed in Equation (1), the discontinuity equilibrium defined in Equations (2)–(5), and the yield condition described in Equations (6)–(10).
In the equilibrium state of each element, the constraint must achieve equilibrium in each element, as expressed in Equations (2)–(5), which is consistent with Equation (1).
σ x x + τ x y y + b x = 0 σ y y + τ x y x + b y = 0
[ A equil   e ] { σ } = { b equil   e }
where:
[ A equil   e ] = 1 2 A e [ T 1 T 2 T 3 ] , T i = [ η i 0 ζ i 0 ζ i η i ]
{ σ } = { σ x , 1 σ y , 1 τ x y , 1 σ x , 2 σ y , 2 τ x y , 2 σ x , 3 σ y , 3 τ x y , 3 } T
{ b equil   e } = { 0 γ e } T
where σ and τ are the stress in soil elements; A e refers to stress boundary conditions of the area of the element; η i and ζ i are constants that depend on the nodal co-ordinates; γ e is the soil unit weight.
In the limit analysis method, the element corresponds to an individual node, so under the condition of stress balance in the region, the normal and shear nodal stresses along the edge of an element must be equal. The constraints on the different regions at each edge can be described with Equation (3), where α is expressed with respect to the x-axis.
[ A equil   d ] { σ } = { b equil   d }
[ A equil d ] = [ T T 0 0 0 0 T T ] , T = [ sin 2 α cos 2 α s i n 2 α 0.5 s i n 2 α 0.5 s i n 2 α c o s 2 α ]
{ σ } = { σ x , 1 σ y , 1 τ x y , 1 σ x , 2 σ y , 2 τ x y , 2 σ x , 3 σ y , 3 τ x y , 3 σ x , 4 σ y , 4 τ x y , 4 } T
{ b equil   d } = { 0 0 0 0 } T
The Mohr-Coulomb strength criterion provides additional yield condition constraints to ensure that no point stress exceeds the yield value (Sloan, 2013), which is defined as Equation (3). Function f contains the yield limit formed by all the above stresses.
f ( σ i ) 0

2.3. Upper-Bound Principle

The objective function of the upper-bound theory should be minimized when the internal power dissipation rate decreases, which satisfies the continuum flow rule defined in Equation (11), the velocities in the discontinuities satisfy the flow rule expressed in Equation (12), and the stresses in the elements satisfy the yield condition described in Equation (13).
ε ˙ x x p = λ ˙ f / σ x x ε ˙ y y p = λ ˙ f / σ y y γ ˙ x y p = λ ˙ f / τ x y λ ˙ 0 , λ ˙ f ( σ e ) = 0
Δ u n = λ ˙ f ( σ n , τ ) / σ n Δ u s = λ ˙ f ( σ n , τ ) / τ λ ˙ 0 , λ ˙ f ( σ n , τ ) = 0
f ( σ e ) 0
where λ ˙ is the plastic multiplier and f ( σ e ) is the yield condition for each element. A more detailed introduction to the lower- and upper-bound principles was provided by Lyamin and Sloan [32]. The subscript in these equations indicates the direction of the stress/strain in three-dimensional co-ordinates. Subscript n indicates the normal direction.

2.4. Mesh Detail

A comparison of 10,000 and 20,000 adaptive, refined element meshes for this problem is shown in Figure 1. When the number of grid elements exceeded 10,000, there was a slight difference between the failure surface diagrams and safety factor values. The simulation process relied on an adaptive mesh, which could reduce the computational costs, while a refined mesh could closely capture the failure mechanism. In all cases in this study, the above lower- and upper-bound principles were applied to analyze the factor of safety (FS), and 10,000 upper- and lower-bound elements were considered with three adaptivity iterations.

3. Verification of the Numerical Model

3.1. Case 3-1

Two model walls in the critical state were analyzed according to the AASHTO design method with the FLAC model according to EHWA-RD-03-04 [33,34]. The purpose was to compare OptumG2 predictions to results obtained with an existing limit analysis method. The following two cases were selected to represent different failure mechanisms identified with OptumG2, as shown in Figure 2.
The data input for verification is listed in Table 1, in which the same wall geometry, rigid block facing, water-free foundation, and reinforcement were considered. Major FLAC and OptumG2 simulation results are provided in Table 1. Case 3-1 indicated that, according to FLAC analysis, the wall occurred in the failure state due to overturning failure (FS = 1.09). The OptumG2 results for Case 3-1 confirmed that under a reinforcement length of l = 1.5 m, the wall was at the verge of overturning failure (FS = 1.075), which coincided with the FLAC analysis results regarding the failure mechanism and safety factor. OptumG2 predicted the same overturning mode of failure and safety factor identified via FLAC calculations. The safety factor for the reinforcements obtained via FLAC and OptumG2 calculations is provided in Table 2.

3.2. Case 3-2

Another case [35] was selected to represent different failure mechanisms identified with both OptumG2 (Fs = 1.059) and FLAC (Fs = 1.07), as shown in Figure 3. The data input is listed in Table 2. The triangle marked in the image is the failure surface in which there is a slight difference between OptumG2 and FLAC. The failure mechanism results shown in Figure 3 indicate that the failure modes determined with the two simulation methods were consistent under the same input parameters (global failure).

4. Parametric Study and Results

There are two major parts of the research results. The first part of the results includes the relationship between the identified failure mechanism and influence of the following parameters: (A) reinforcement parameter, (B) geometry of the wall, and (C) horizontal seismic load. The second part illustrates the influence of variables on the safety factor. In the Experimental Discussion section, the obtained conclusion was supported by calculating the minimum length of the reinforcement zone to maintain the failure mechanisms in each case. Each wall was simulated but the failure mechanism was altered by increasing the reinforcement length while maintaining the wall height at 10 m. Three common failure mechanisms are often considered: overturning failure, sliding failure, and global failure. In the simulations, the failure mechanism was defined by determining the two critical reinforcement lengths of sliding failure. The critical reinforcement lengths of sliding failure were identified as follows: (1) the failure surface was straight, (2) a slip surface was fully developed through the reinforced wall, and (3) there was a horizontal movement of the wall, as shown in Figure 4.

4.1. Numerical Model

4.1.1. Parameter Value Ranges and Baseline Case

A basic model was defined, as shown in Figure 5. The block in front of the reinforcement soil in the base case comprised a stiff material, with a thickness of 500 mm and a height of 300 mm without a footing underneath the wall. The height of the reinforced wall is 10 m. In addition, the soil models in this paper, including reinforced and retained soil models, were all elastic to perfectly plastic models. The ranges considered in this paper referred to the parameters of most MSE walls in the field [36].
Some meaningful simulation results of the geogrid (reinforcement) length in the transformation process between the above three failure mechanisms are shown in this section. The influence of each parameter in the numerical model was identified by exploring its impact on the critical value of the geogrid length by varying a single parameter while the other parameters remained constant.

4.1.2. Geometry and Boundary Conditions

In the present study, the parameter range in the base case encompasses average values previously reported in the literature. The height and width of the foundation were 20 and 60 m, respectively, which were beyond the standard values to minimize boundary effects, as shown in Figure 5. The height and width of the wall facing were 12 m and 0.5 m, respectively. The width of the reinforcement soil zones was 10 m.
The deformation-limiting boundary conditions of the model in this paper are consistent with those in most numerical analysis experiments in the literature (Jiang et al., 2019). The bottom was constrained along the normal and tangential directions, and the sides were constrained only along the normal direction. The influence of groundwater was not considered in this study.

4.1.3. Soil Constitutive Models and Properties

The soil models in this paper, including reinforced and retained soil models, were all elastic–perfectly plastic models, as listed in Table 3. The foundation soil and block facing were simulated with linearly elastic models. In the literature, relevant experiments [37] with the MC model have been reported in terms of the establishment of a soil model for MSE wall simulation, which have demonstrated the feasibility of MSE simulation.

4.1.4. Reinforcement Properties

The type of reinforcement in the numerical simulations was a geogrid, which entailed a linearly elastic–perfectly plastic model allowing small deformations. The weightless geogrid cannot sustain uniaxial compression and offers no resistance to bending. The detailed parameters are listed in Table 4.

4.1.5. Interface Properties

The numerical model considered two types of interfaces, as listed in Table 5. The shear stress of the interface surface is directly proportional to the displacement, which reflects linear elastic to perfectly plastic properties. The reduced strength of the interface in the numerical calculation was 0.85. The cohesion of the backfill-reinforcement interface was assumed to reach zero, and the dilation angle was 5°.

4.1.6. Critical Reinforcement Lengths

The significant impact of the geogrid length on the failure mechanism is shown in Figure 6. When the geogrid length was smaller than 4 m, the safety factor rapidly increased with increasing geogrid length, and the failure mechanism transitioned from overturning into sliding. However, when the geogrid length was larger than 10 m, the safety factor slowly increased. This suggests that when the geogrid length reaches the critical length, the overall materials in the reinforced retaining wall experience antifailure deformation, and the overall structure fully absorbs the failure energy. The two inflection points in Figure 6 denote the approximate values of the critical length. More details on the failure mechanism are described, considering the geometric parameters of the MSE wall.

4.2. Wall Height

The geometry of the reinforced retaining wall is a crucial factor influencing the evaluation results of MSE wall design stability. Figure 7 shows that FS significantly increased with increasing geogrid length and decreased with increasing wall height when the wall height was varied from 5 to 15 m. In addition, the increase in FS at a wall height of 5 m changed more obviously than that at a wall height of 15 m.
Based on the three regions separated by the dotted line in Figure 7, it could be observed that the three geogrid lengths corresponded to distinct failure mechanisms. Both the geogrid length and wall height contributed to the observed change in the failure mechanism. Moreover, when the change in wall height did not exceed 9 m, the failure mechanism was mainly affected by the length of the geogrid, and an increase in wall height could not alter the overturning failure mechanism, as shown in Figure 8. Each study case is marked with black points in Figure 8, and the parameters and failure mechanism are summarized in Table 6. Three failure mechanisms in cases with geogrid lengths l = 2 m, 10 m, and 15 m are shown in Figure 9. When the range of reinforced soil is very limited, the soil failure surface transects the bottom, and the reinforced wall is directly overturned, with which an increase in the reinforced soil area imposes a significant influence on the safety factor, as shown in Figure 9a. When the geogrid length was further increased, the slope-sliding failure mechanism emerged, as shown in Figure 9b. However, when the length of the geogrid exceeded the critical length, due to its large scale and high strength, the failure surface did not penetrate the reinforced wall, as shown in Figure 9c. An increase in the wall height could yield many negative effects, including an increase in the active earth pressure, a decrease in the factor of safety, and an increase in the critical length, which could reduce the overall stability of the structure, and wall failure mode variation required greater reinforcement.
Cases 1 to 6 in Table 6 represent the failure mechanism with the wall height. In Cases 1 to 3, although the transition state also hardly occurred, it was obvious that the change in wall height did not greatly influence the transition state of the failure mechanism similarly to Case 1. In Cases 4 to 6, the numerical results indicated the transition state from sliding failure to global failure. In these cases, a higher wall resulted in a longer duration of the transition state.

4.3. Reinforcement Spacing

The influence of the reinforcement spacing on the stability of MSE walls is shown in Figure 10. Since the AASHTO manual requires that the spacing should be smaller than 0.8 m, the variation range of the spacing considered in the parameter study is 0.3–0.9 m. The results are shown in Figure 10, in which the change in spacing did not affect the critical value of global failure occurrence but greatly impacted the overturning failure mode when the reinforcement vertical spacing was smaller than 0.5 m. In addition, when the reinforcement spacing exceeded 0.8 m, the failure mode mainly depended on the reinforcement length. This occurred because the low density of reinforcement reduced the bearing capacity of the reinforcement zone.
A summary of all parametric study results is given in Table 6, in which Cases 7 to 12 represent the failure mechanism as a function of the spacing. In each case, numerical experiments below the critical reinforcement value were performed. In Cases 7 to 9, if the reinforcement length was larger than 1 m, the failure mode transitioned into sliding failure, which reflects the transition state change from overturning failure to sliding failure. In the cases with a small spacing, the transition state hardly occurred. Due to the large spacing of the reinforcement zone, the influence of the reinforcement length on the strength decreased. In Cases 10 to 12, the inclination angle of the sliding failure surface gradually increased. Because the strength of the reinforcement zone decreased with increasing spacing, the failure surface more easily penetrated the reinforcement zone. These results in Figure 10 are consistent with the safety factor change trend.

4.4. Horizontal Seismic Load Originating from Earthquake

Cases with seismic coefficient values of K = gh/gv, with gv = 9.8 m/s2, were considered. The effect of the seismic load, ranging from 0.05 g to 0.2 g, on the critical reinforcement length is shown in Figure 11. An increase in seismic coefficient value required a larger critical length of the reinforcement to satisfy the stability requirements of the sliding and global failure modes.
Cases 13 to 16, as listed in Table 6, represent the base case failure mechanism under seismic loading. An increased seismic coefficient value resulted in a longer transition state and higher inclination angle of the failure surface.

5. Recommendations for Design

The existing design method involves internal and external stability analysis based on the limit state method. In this design method, the location of the damaged surface is often assumed, and assessment calculations are then carried out. This method generally incorporates experience-based knowledge, and the assumptions before calculation are often difficult to verify in practical applications. However, this design method does not consider the relationship between the parameters of MSE walls and failure mode. The equilibrium conditions of the analysis method proposed in this paper are applicable to the whole soil area, and the safety factor is defined in a very small range, so that engineers can meet different design requirements in the seismic design of structures according to the range. The research results of this paper provide engineers with rich references. Specific suggestions and contributions are as follows:
(1) Length of the reinforcement. A minimum reinforcement length of 0.7 H is recommended for MSE walls. In areas with poor foundation conditions and areas of a high seismic grade, larger lengths are required, as listed in Table 7.
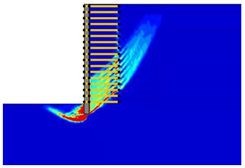
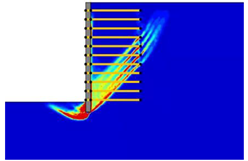
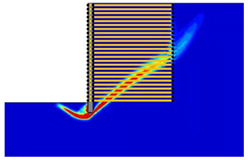
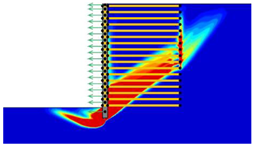
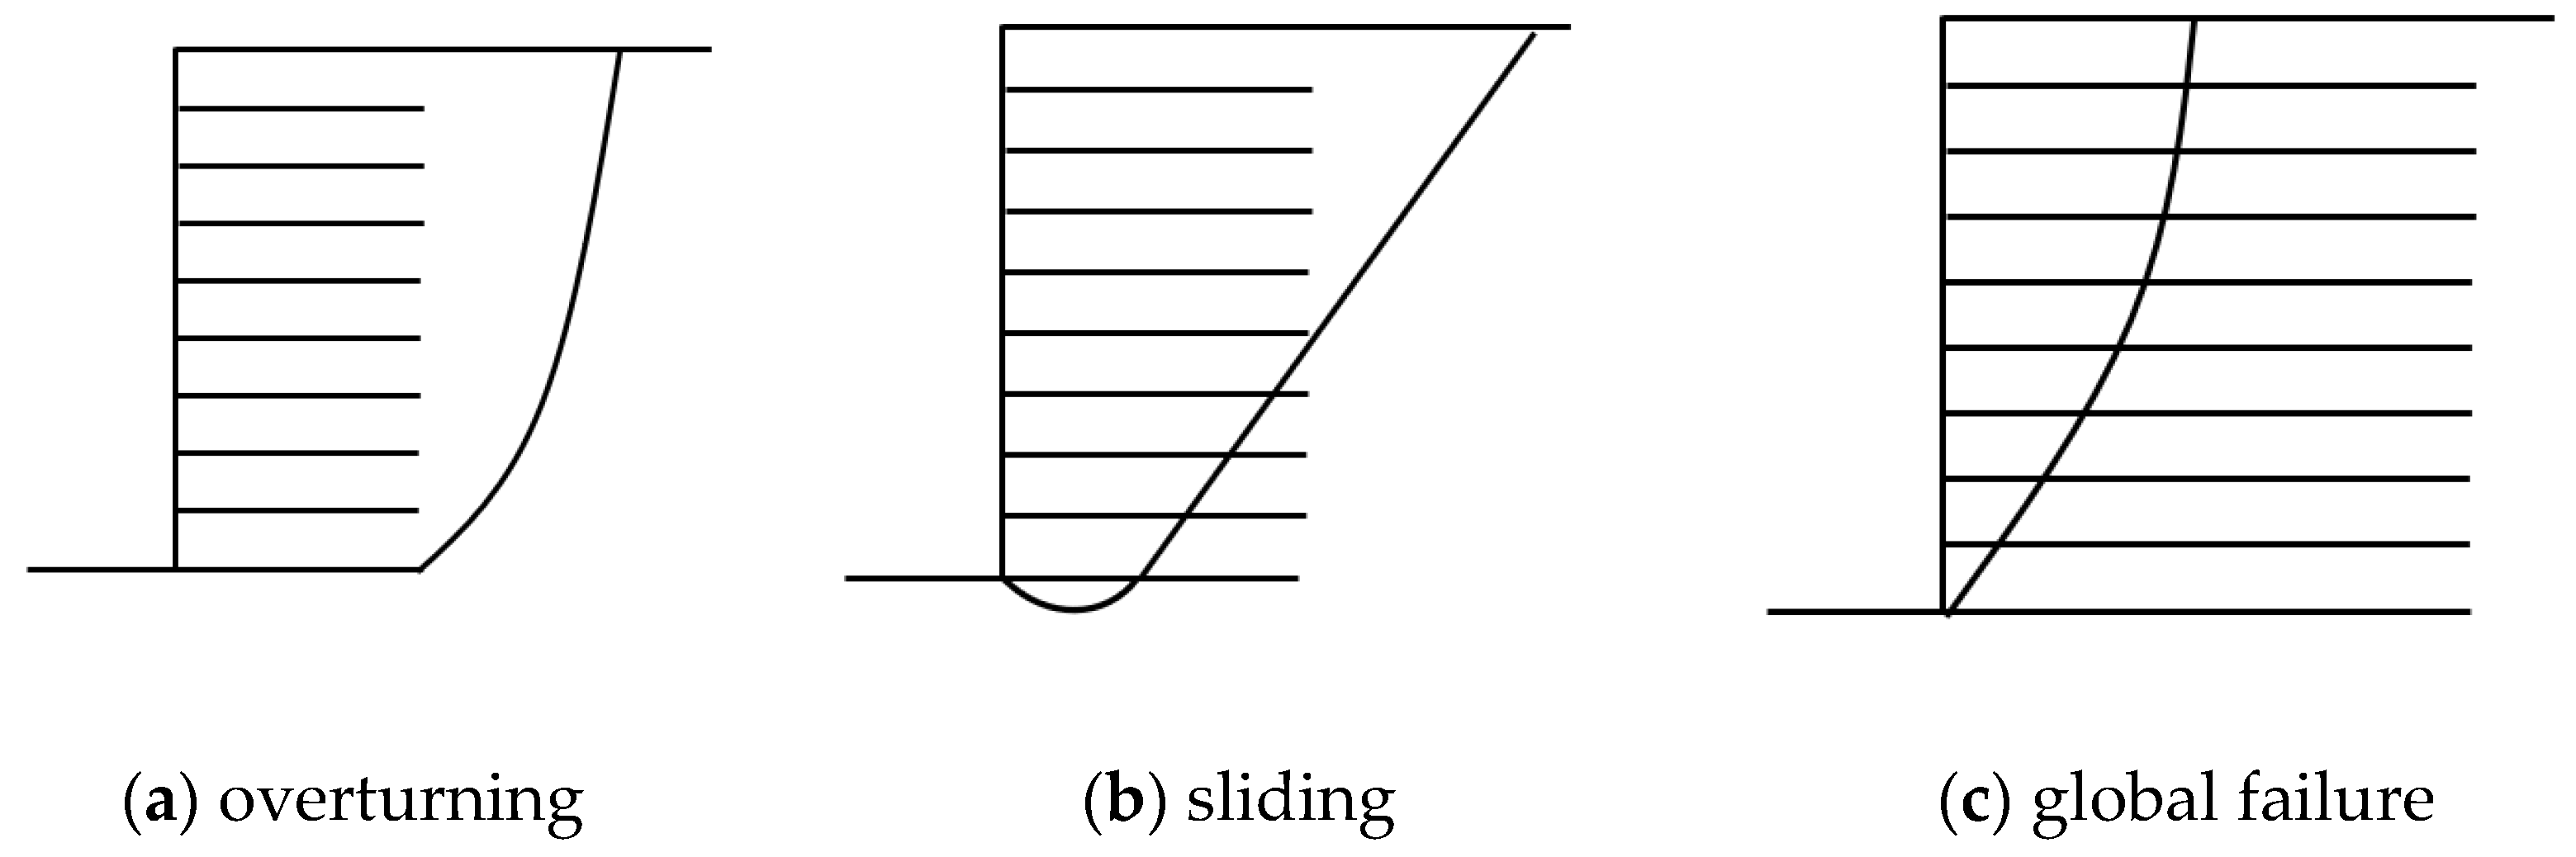
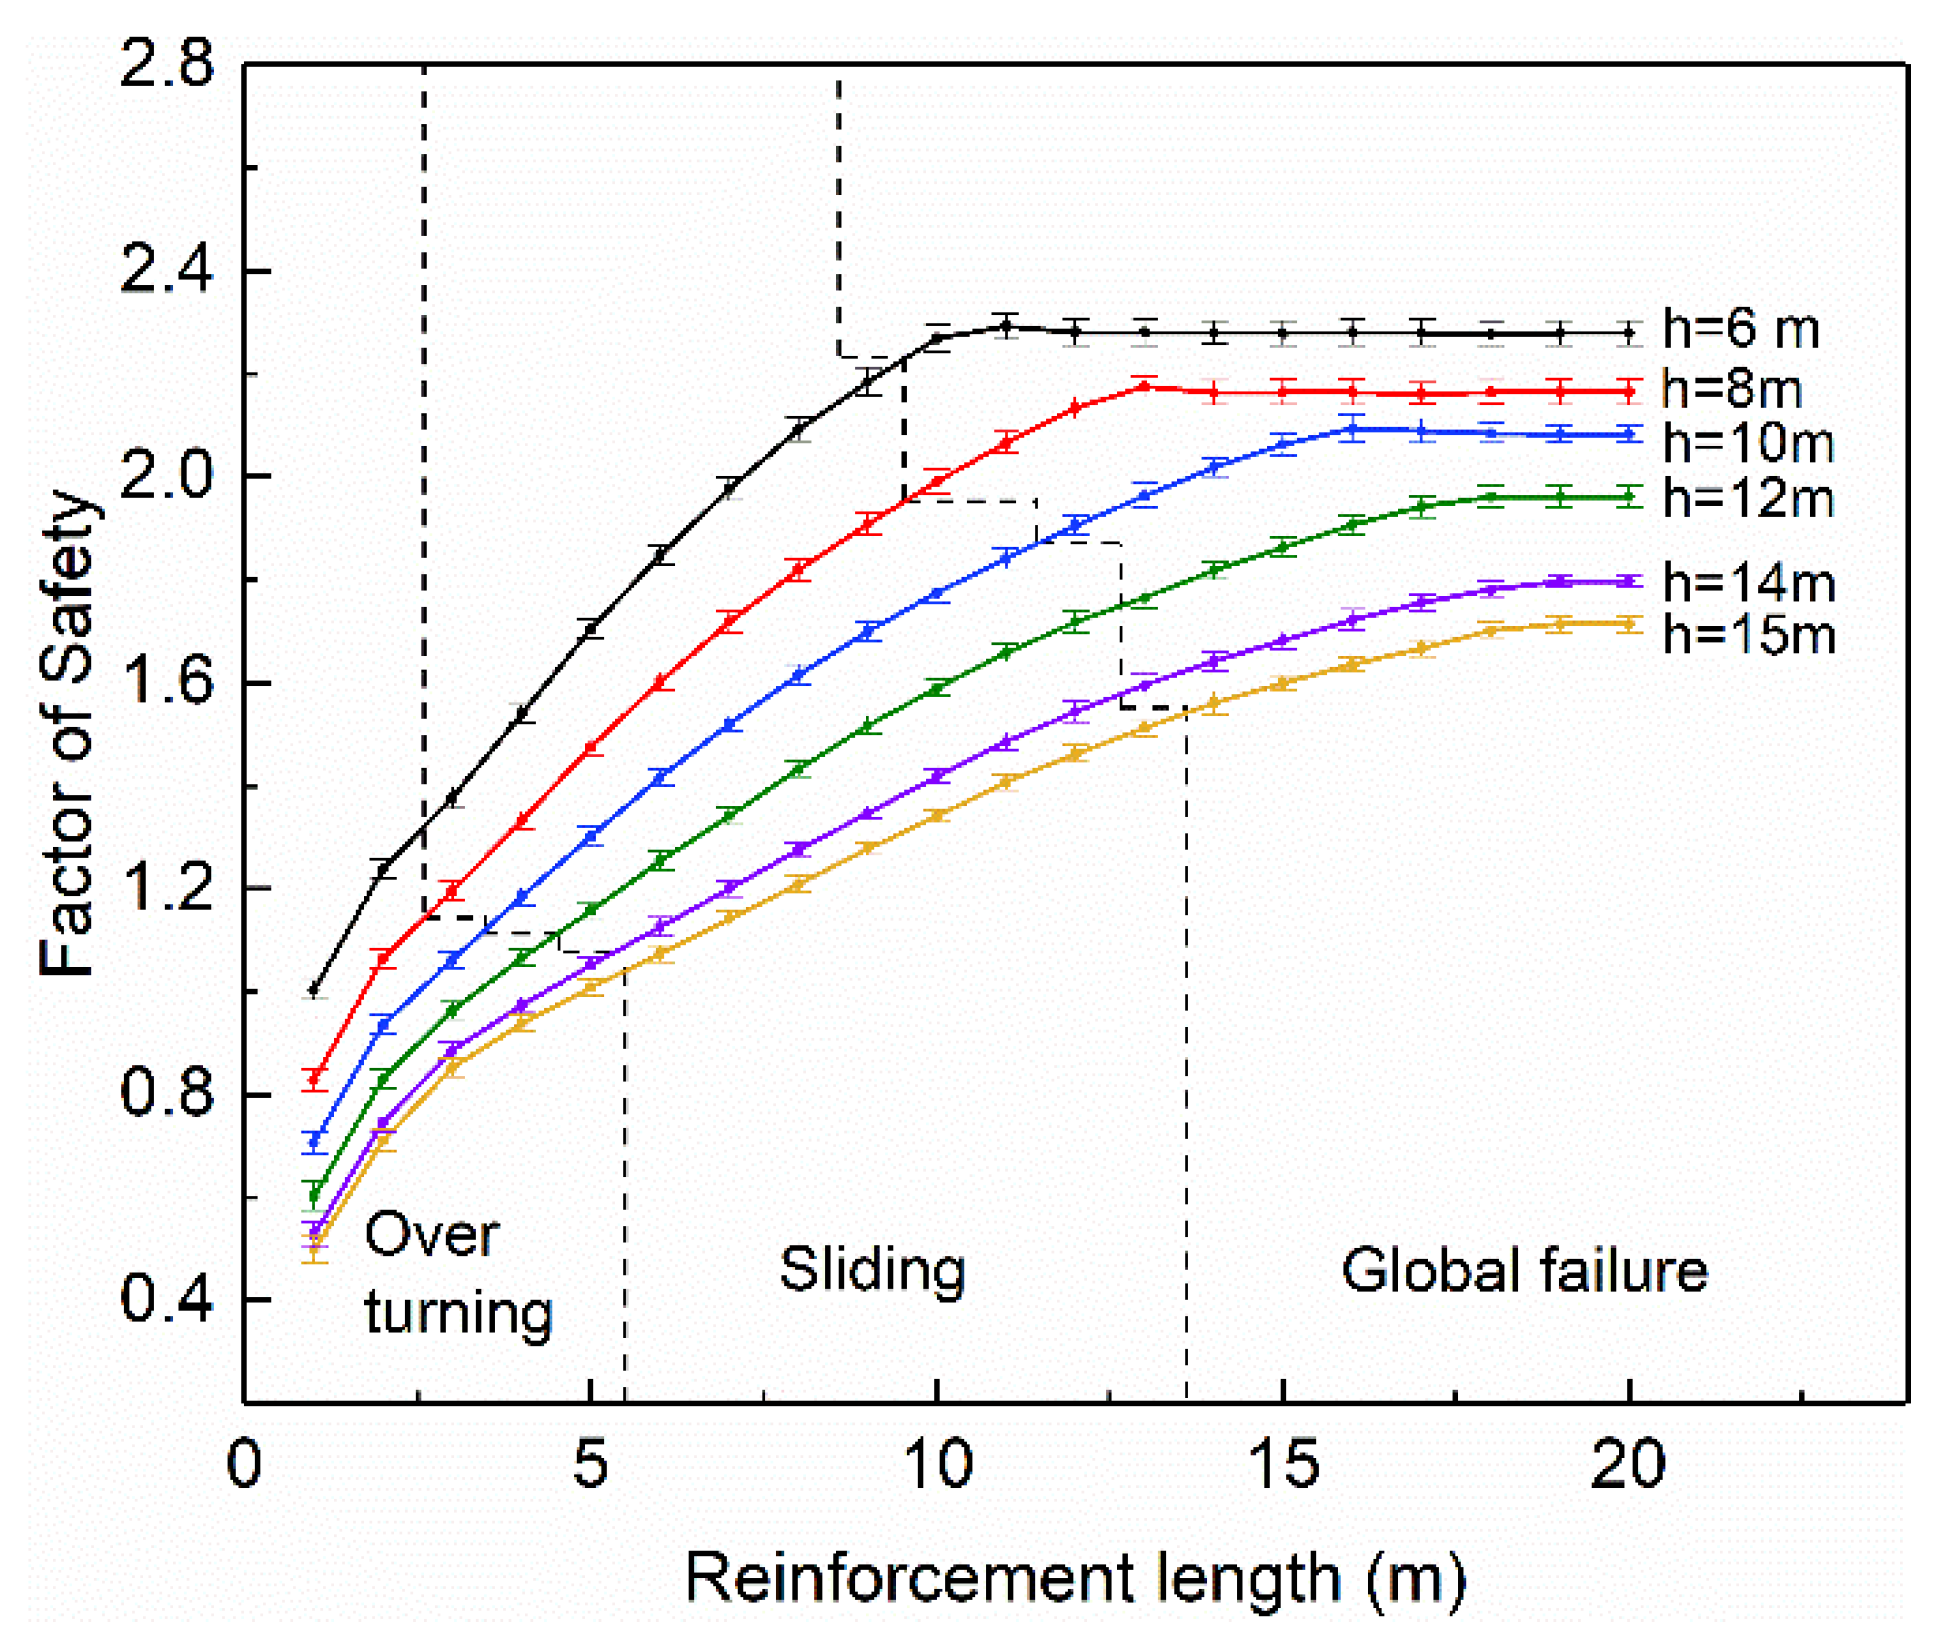
(2) Spacing of the reinforcement. When the spacing of the reinforcement is smaller than 0.6 m, the position of the sliding surface could occur behind the reinforced area. In the simulation analysis experiments in this paper, if the overturning failure mode emerged, the length-to-height ratio of reinforcement varied between 0.23 and 0.4. When the ratio was higher than 0.9, the global failure mode emerged. However, under normal conditions, parametric analysis indicated that the wall stability was not only determined by the length-to-height ratio but also determined by the reinforcement length. When the foundation conditions were limited, the stability of the wall could be improved by increasing the reinforcement length and reducing the spacing, as listed in Table 8.
(3) Horizontal seismic load. The seismic load could significantly reduce the wall stability. Maintaining the wall in the global failure mode required higher wall design conditions. Under the baseline conditions, the reinforcement length and the length-to-height ratio of reinforcement could be increased to improve the wall stability. When the reinforcement length was limited due to the construction environment, the wall stability could be improved by decreasing the spacing of the reinforcement.

6. Conclusions

The critical reinforcement values resulting in MSE wall failure mechanism transition under the effect of various parameters were studied under different conditions. The influence of the length of the reinforcement in different cases on the stability of MSE walls was studied. The research obtained rich and interesting results, provided design suggestions for engineers, and made contributions to the field of seismic design of retaining walls. According to this research, the following conclusions can be drawn:
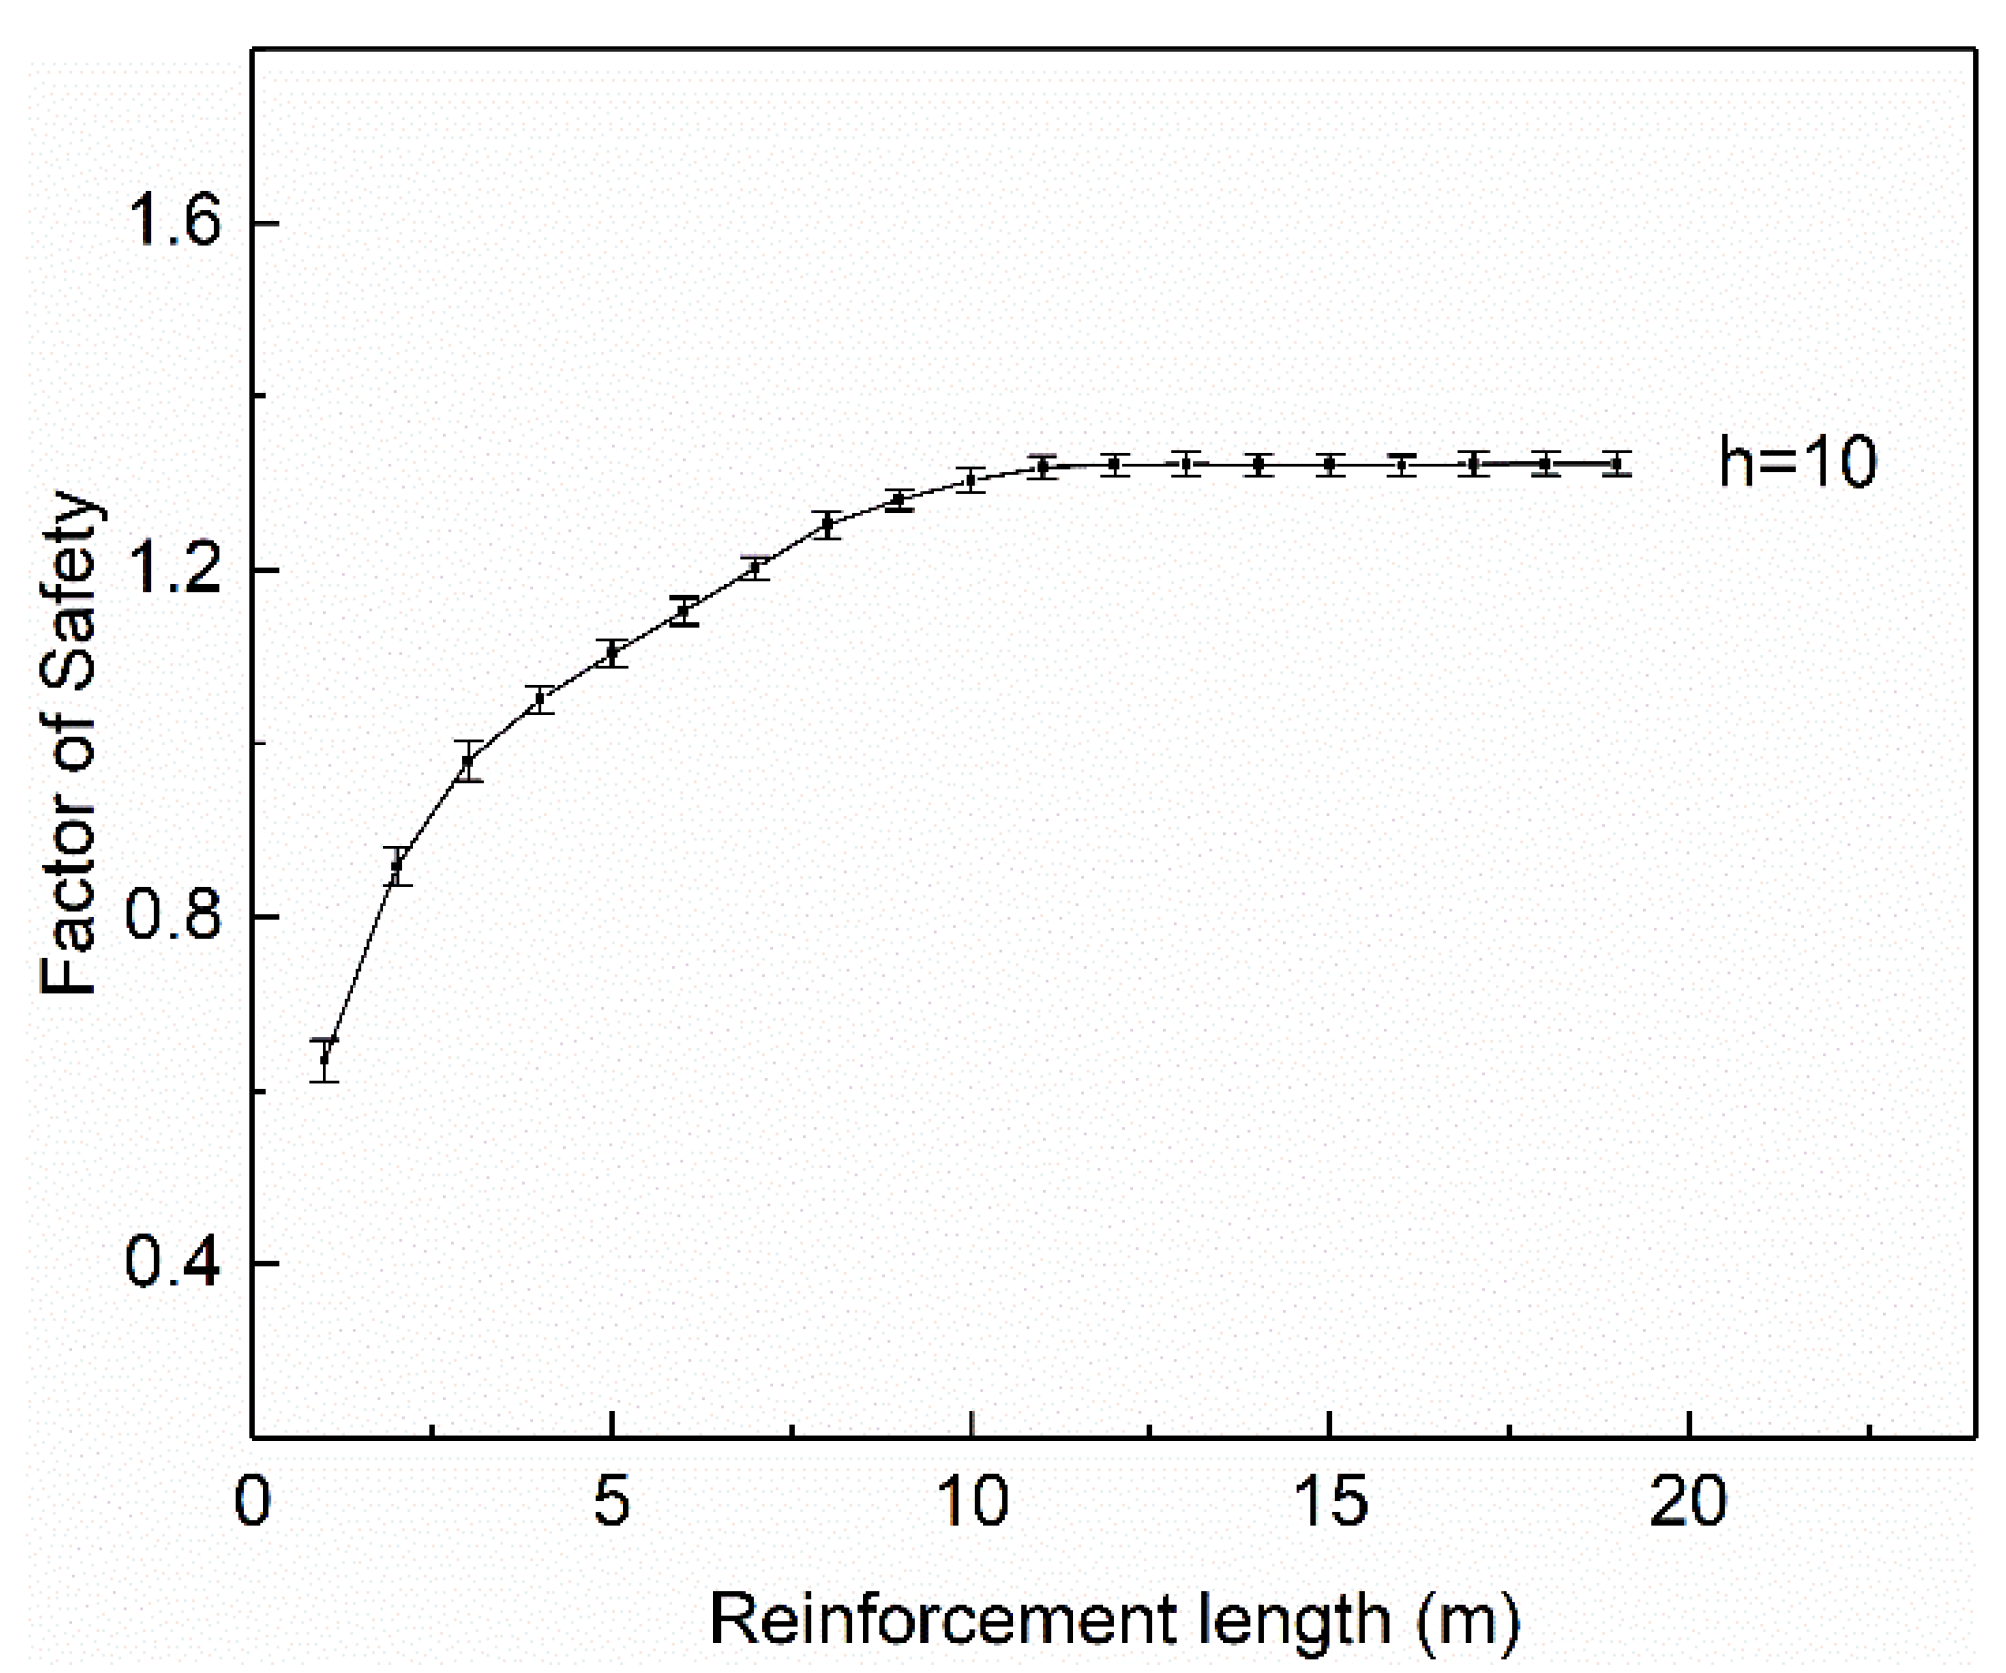
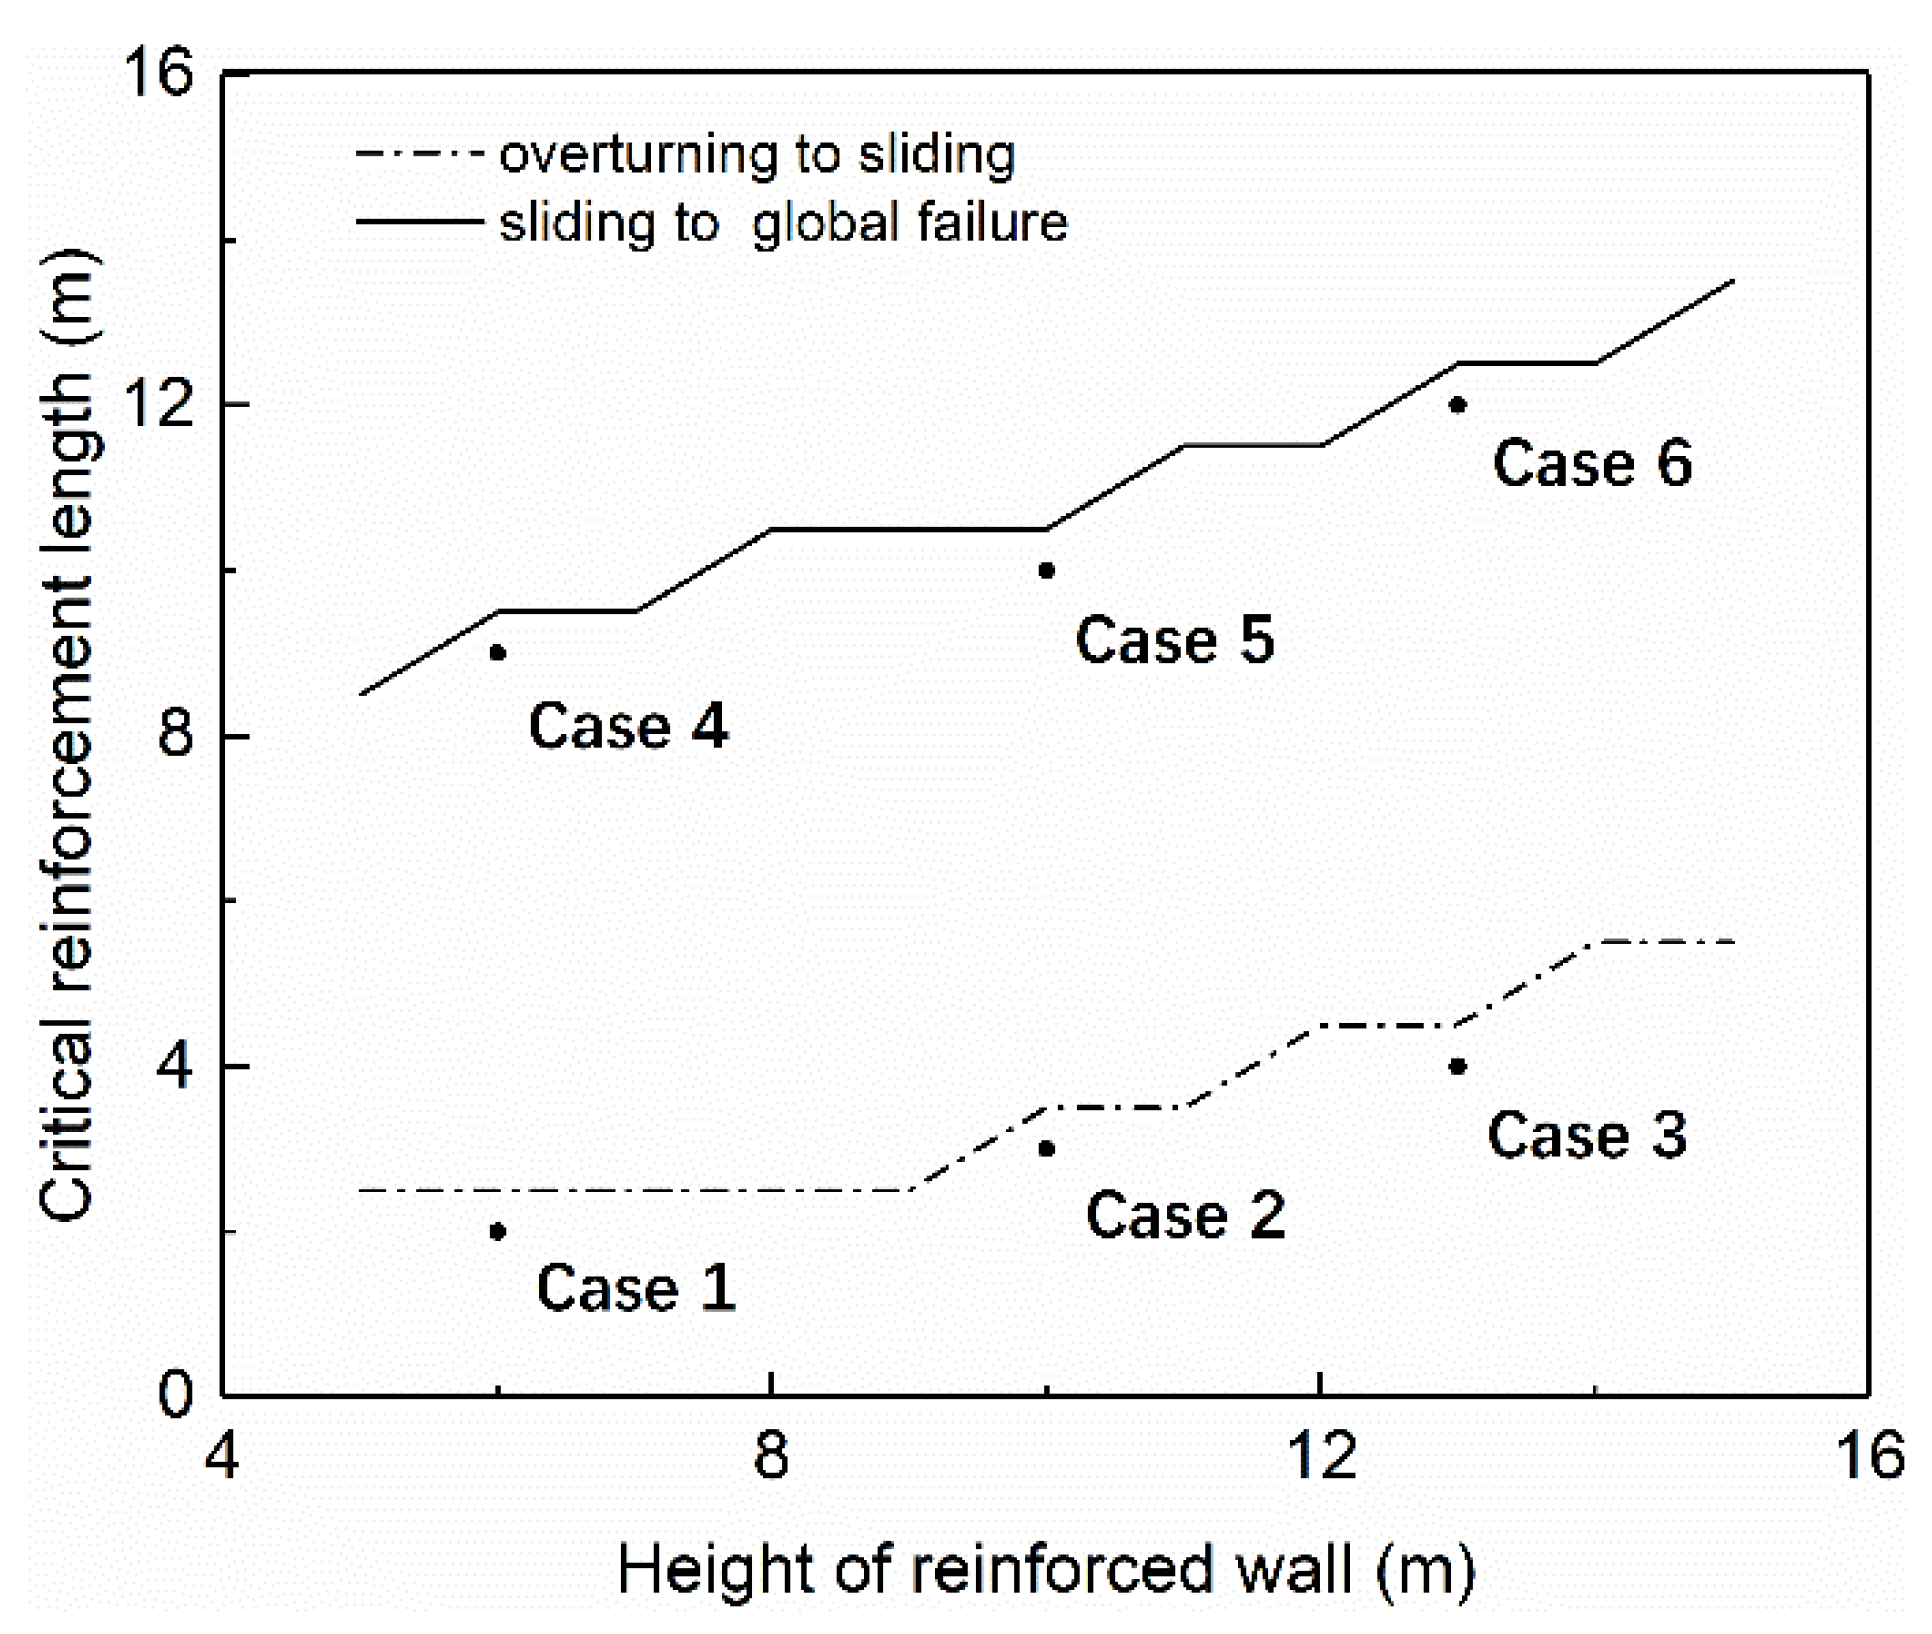
(1) Both the reinforcement length and wall height greatly affected the change in failure mode of MSE walls, based on the parameter study in this paper. When the wall height was greater than 9 m, an increase in height could reduce the strengthening effect of the reinforcement, in which maintaining a favorable failure mode required a longer reinforcement length.
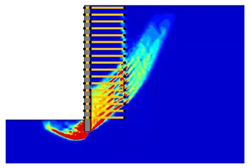
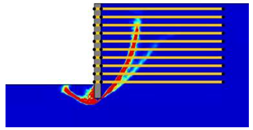
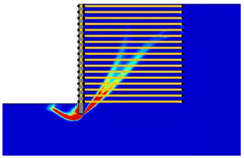
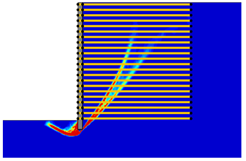
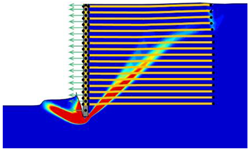
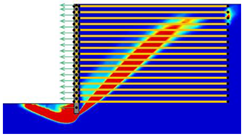
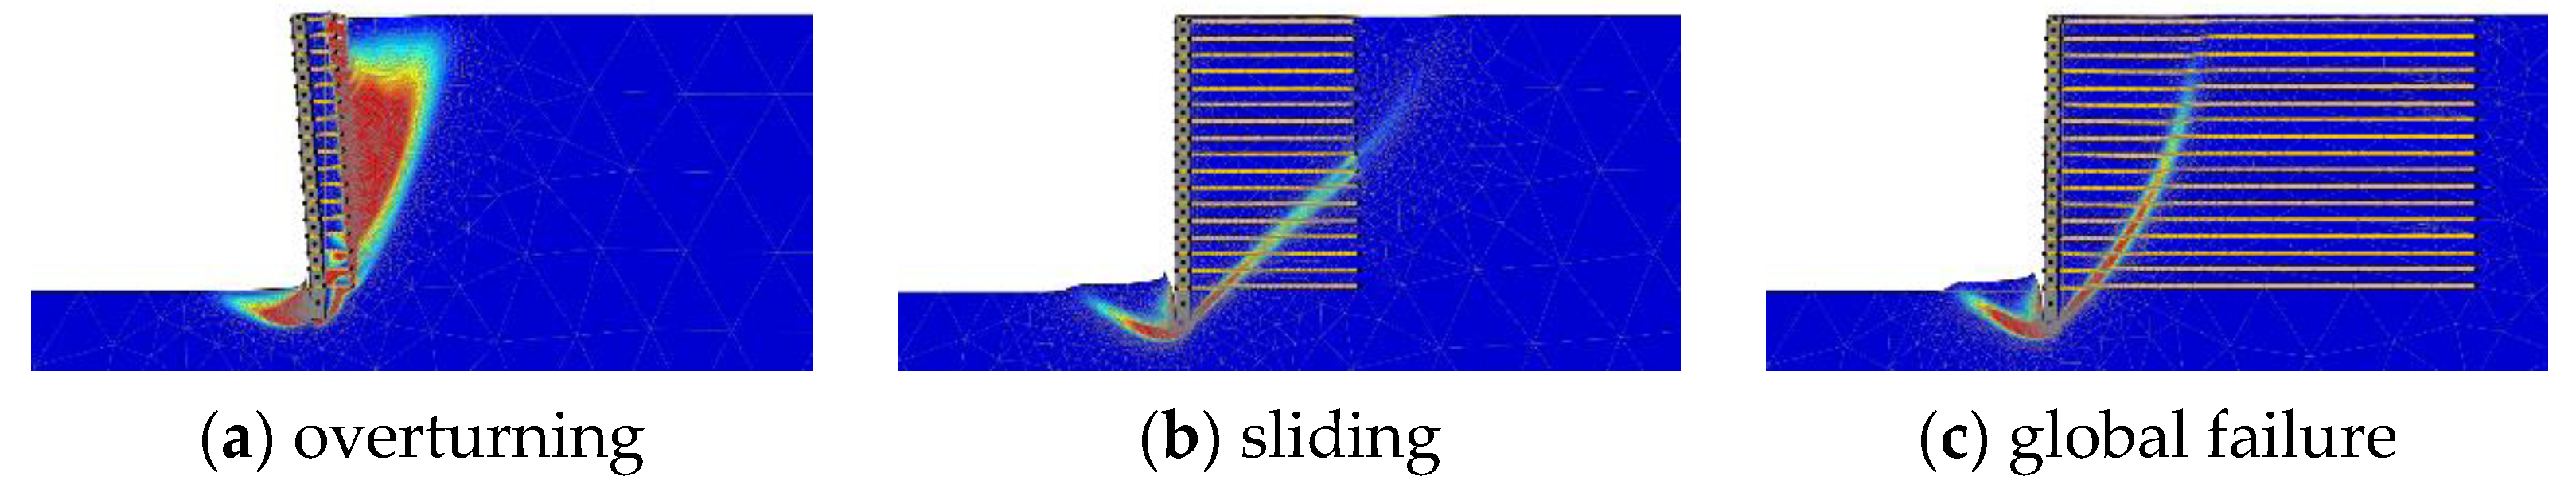
(2) With the properties involved in this paper, the critical length of the reinforcement was determined as approximately 0.4-H and 0.9-H, which divided the various failure modes into overturning failure, sliding failure, and global failure.
(3) The reinforcement spacing was an important factor influencing the failure mode of MSE walls. Increasing the reinforcement spacing from 0.3 to 0.9 m reduced the safety factor and altered the failure mode. In particular, when the reinforcement spacing was above 0.5 m, the critical length of the reinforcement increased from overturning failure to sliding failure, and when the reinforcement spacing was above 0.8 m, the critical length of the reinforcement decreased from sliding failure to global failure.
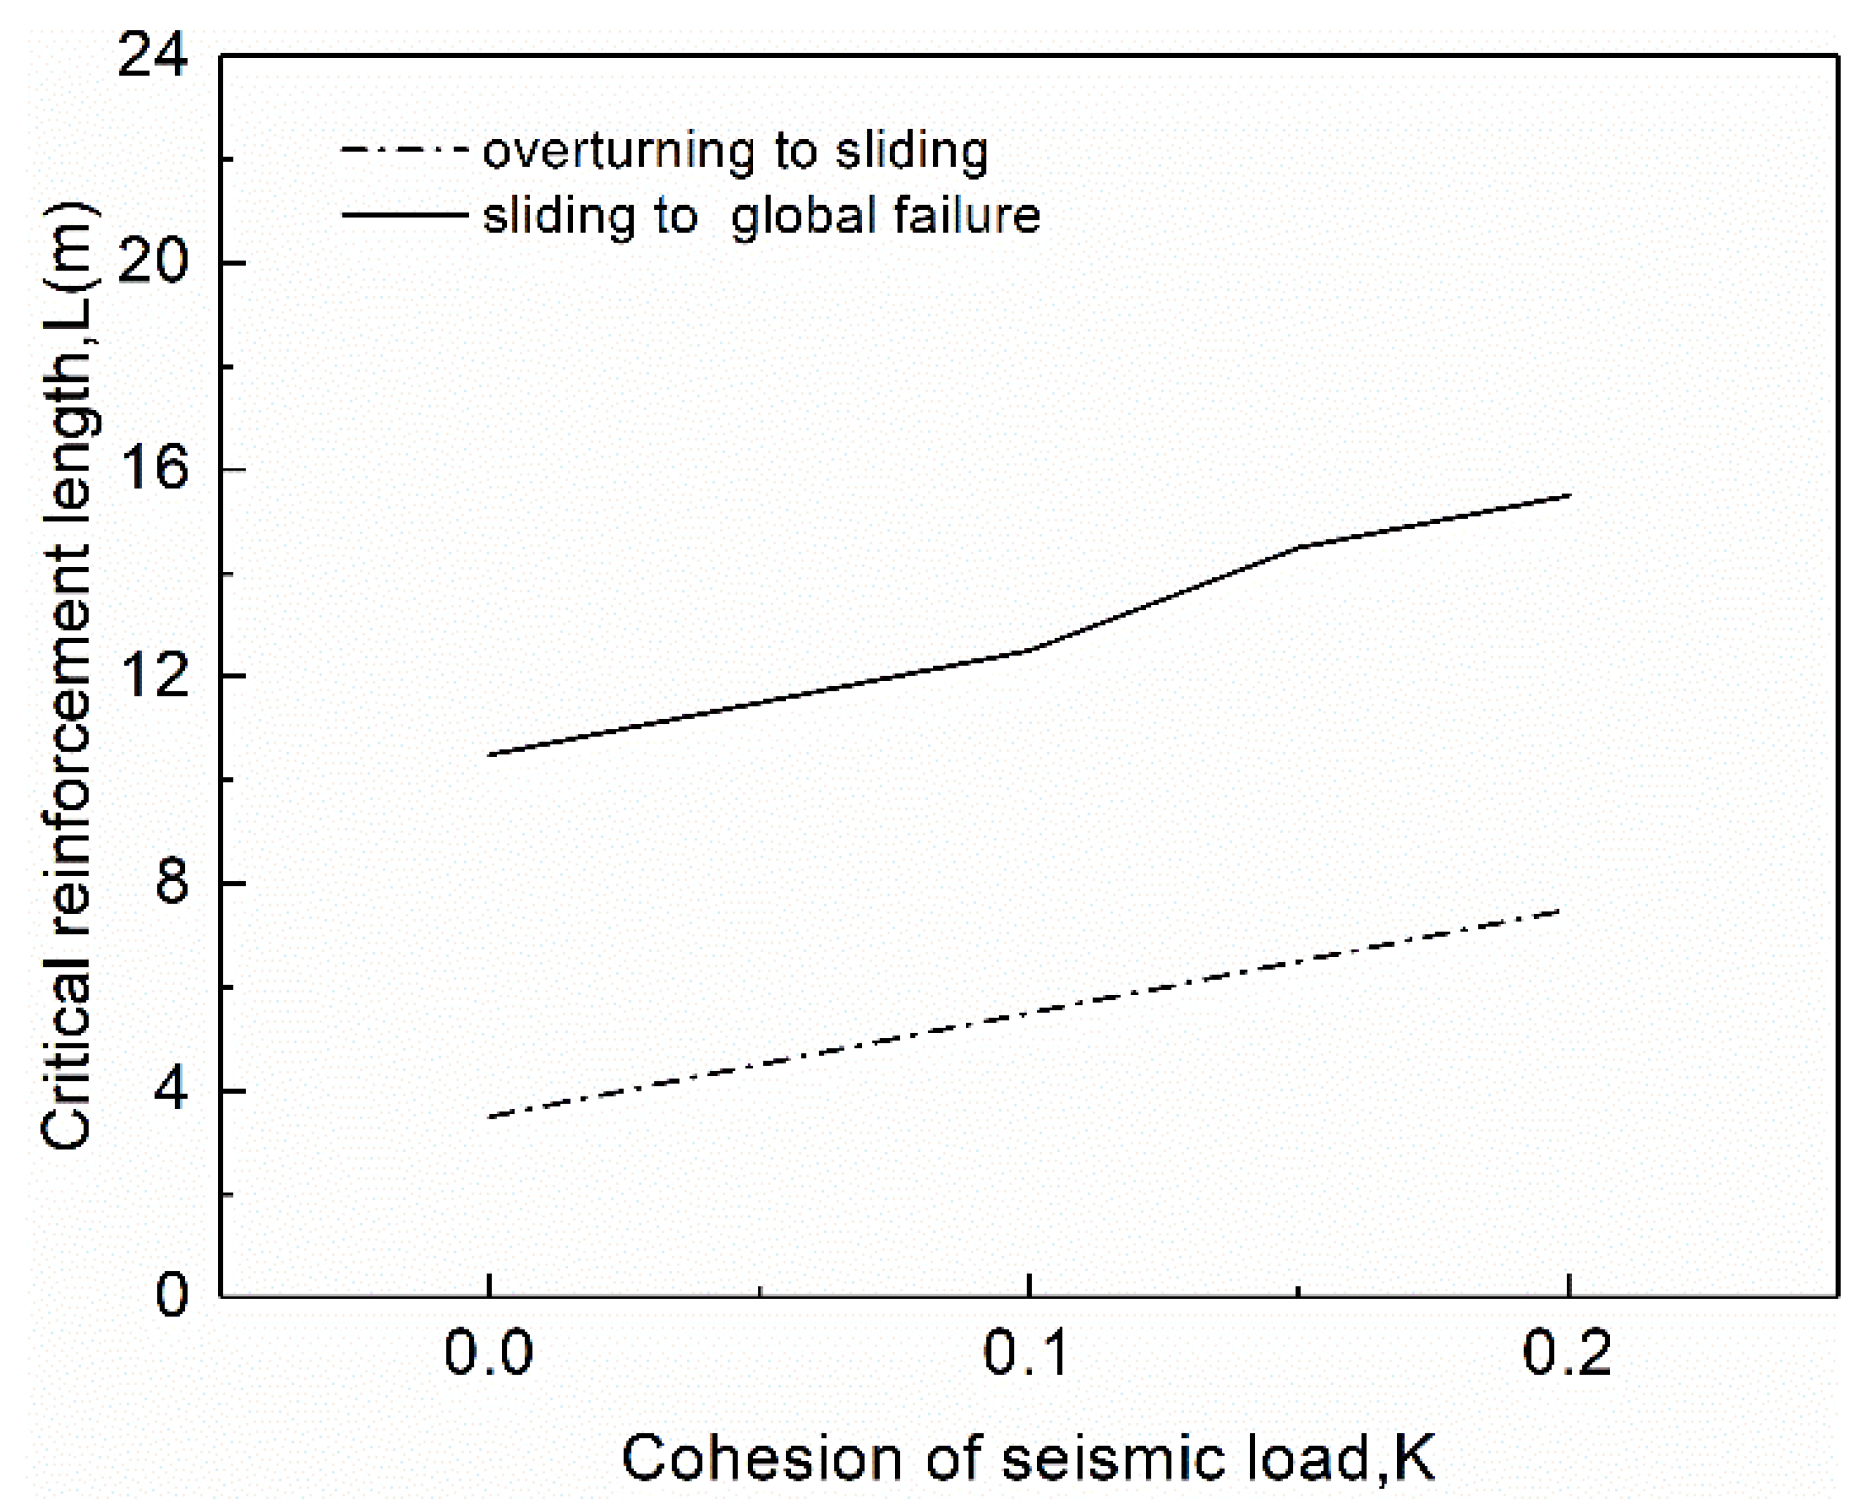
(4) The seismic coefficient obviously affected the stability of MSE walls. The required reinforcement length to maintain the wall stability in the case with a seismic coefficient value of 0.2 was almost 1.5 times larger than that in the case without a seismic load.
The assumption in this study is that elastic–perfectly plastic models cannot consider deformation. In stability analysis, there are numerous parameters in the elastic–plastic constitutive model, and inappropriate parameter selection could cause large errors. The following research direction will be to integrate the advantages of both models for parametric analysis.

Author Contributions

Conceptualization, J.L.; data analysis, X.L.; formal analysis, M.J.; project, R.P. All authors have read and agreed to the published version of the manuscript.

Funding

China National Natural Science Foundation (Grant Nos. 52009017, 51979026).

Institutional Review Board Statement

Institutional review board approval of our university was obtained for this study.

Informed Consent Statement

All study participants provided informed consent.

Data Availability Statement

Data openly available in a public repository.

Conflicts of Interest

The authors declare no conflict of interest.

References

  1. Bilgin, Ö. Failure mechanisms governing reinforcement length of geogrid reinforced soil retaining walls. Eng. Struct. 2009, 31, 1967–1975. [Google Scholar] [CrossRef]
  2. Chen, J.-F.; Liu, J.-X.; Xue, J.-F.; Shi, Z.-M. Stability analyses of a reinforced soil wall on soft soils using strength reduction method. Eng. Geol. 2014, 177, 83–92. [Google Scholar] [CrossRef]
  3. Song, F.; Liu, H.; Ma, L.; Hu, H. Numerical analysis of geocell-reinforced retaining wall failure modes. Geotext. Geomembr. 2018, 46, 284–296. [Google Scholar] [CrossRef]
  4. Pang, R.; Xu, B.; Zhou, Y.; Song, L. Seismic time-history response and system reliability analysis of slopes considering uncertainty of multi-parameters and earthquake excitations. Comput. Geotech. 2021, 136, 104245. [Google Scholar] [CrossRef]
  5. Fathipour, H.; Payan, M.; Chenari, R.J. Limit analysis of lateral earth pressure on geosynthetic-reinforced retaining structures using finite element and second-order cone programming. Comput. Geotech. 2021, 134, 104119. [Google Scholar] [CrossRef]
  6. Pang, R.; Xu, B.; Kong, X.J.; Zhou, Y.; Zou, D.G. Seismic performance evaluation of high CFRD slopes subjected to near-fault ground motions based on generalized probability density evolution method. Eng. Geol. 2018, 246, 391–401. [Google Scholar] [CrossRef]
  7. Pang, R.; Xu, B.; Zou, D.G.; Kong, X.J. Stochastic seismic performance assessment of high CFRDs based on generalized probability density evolution method. Comput. Geotech. 2018, 97, 233–245. [Google Scholar] [CrossRef]
  8. Pang, R.; Xu, B.; Kong, X.J.; Zou, D.G.; Zhou, Y. Seismic reliability assessment of earth-rockfill dam slopes considering strain-softening of rockfill based on generalized probability density evolution method. Soil Dyn. Earthq. Eng. 2018, 107, 96–107. [Google Scholar] [CrossRef]
  9. Pang, R.; Xu, B.; Zhou, Y.; Zhang, X.; Wang, X.L. Fragility analysis of high CFRDs subjected to mainshock-aftershock sequences based on plastic failure. Eng. Struct. 2020, 206, 110152. [Google Scholar] [CrossRef]
  10. Li, Y.; Pang, R.; Xu, B.; Wang, X.; Fan, Q.; Jiang, F. GPDEM-based stochastic seismic response analysis of high concrete-faced rockfill dam with spatial variability of rockfill properties based on plastic deformation. Comput. Geotech. 2021, 139, 104416. [Google Scholar] [CrossRef]
  11. Xu, B.; Pang, R.; Zhou, Y. Verification of stochastic seismic analysis method and seismic performance evaluation based on multi-indices for high CFRDs. Eng. Geol. 2020, 264, 105412. [Google Scholar] [CrossRef]
  12. Zai, D.; Pang, R.; Xu, B.; Fan, Q.; Jing, M. Slope system stability reliability analysis with multi-parameters using generalized probability density evolution method. B. Eng. Geol. Environ. 2021, 80, 8419–8431. [Google Scholar] [CrossRef]
  13. Jiang, Y.; Han, J.; Zornberg, J.; Parsons, R.L.; Leshchinsky, D.; Tanyu, B. Numerical analysis of field geosynthetic-reinforced retaining walls with secondary reinforcement. Géotechnique 2019, 69, 122–132. [Google Scholar] [CrossRef]
  14. Jiang, Y.; Han, J.; Parsons, R.L.; Brennan, J.J. Field Instrumentation and Evaluation of Modular-Block MSE Walls with Secondary Geogrid Layers. J. Geotech. Geoenviron. Eng. 2016, 142, 05016002. [Google Scholar] [CrossRef]
  15. Yazdandoust, M.; Ghalandarzadeh, A. Pseudo-Static Coefficient in Reinforced Soil Structures. Int. J. Phys. Model. Geotech. 2020, 20, 320–337. [Google Scholar] [CrossRef]
  16. Razeghi, H.R.; Viswanadham, B.; Mamaghanian, J. Centrifuge and numerical model studies on the behaviour of geogrid reinforced soil walls with marginal backfills with and without geocomposite layers. Geotext. Geomembr. 2019, 47, 671–684. [Google Scholar] [CrossRef]
  17. Safaee, A.M.; Mahboubi, A.; Noorzad, A. Experimental investigation on the performance of multi-tiered geogrid mechanically stabilized earth (MSE) walls with wrap-around facing subjected to earthquake loading. Geotext. Geomembr. 2020, 49, 130–145. [Google Scholar] [CrossRef]
  18. Bilgin, Ö.; Mansour, E. Effect of reinforcement type on the design reinforcement length of mechanically stabilized earth walls. Eng. Struct. 2014, 59, 663–673. [Google Scholar] [CrossRef]
  19. Leshchinsky, D.; Kang, B.; Han, J.; Ling, H. Framework for Limit State Design of Geosynthetic-Reinforced Walls and Slopes. Transp. Infrastruct. Geotechnol. 2014, 1, 129–164. [Google Scholar] [CrossRef]
  20. Reed, E.C.; Vandenberge, D.R. Comparison of FEA and analytical methods for determining stability of a RAP supported MSE wall. DFI J. J. Deep Found. Inst. 2018, 12, 122–129. [Google Scholar] [CrossRef]
  21. Liu, S.; Su, Z.; Li, M.; Shao, L. Slope stability analysis using elastic finite element stress fields. Eng. Geol. 2020, 273, 105673. [Google Scholar] [CrossRef]
  22. Hassen, G.; Donval, E.; De Buhan, P. Numerical stability analysis of reinforced soil structures using the multiphase model. Comput. Geotech. 2021, 133, 104035. [Google Scholar] [CrossRef]
  23. Kazimierowicz-Frankowska, K.; Kulczykowski, M. Deformation of model reinforced soil structures: Comparison of theoretical and experimental results. Geotext. Geomembr. 2021, 49, 1176–1191. [Google Scholar] [CrossRef]
  24. Mirmoradi, S.; Ehrlich, M.; Magalhães, L. Numerical evaluation of the effect of foundation on the behaviour of reinforced soil walls. Geotext. Geomembr. 2021, 49, 619–628. [Google Scholar] [CrossRef]
  25. Xu, P.; Yang, G.; Li, T.; Hatami, K. Finite element limit analysis of bearing capacity of footing on back-to-back reinforced soil retaining walls. Transp. Geotech. 2021, 30, 100596. [Google Scholar] [CrossRef]
  26. OptumCE. OptumG2 v. 2021. Available online: https://optumce.com/products/brochure-and-datasheet/ (accessed on 24 January 2021).
  27. Sloan, S. Geotechnical stability analysis. Géotechnique 2013, 63, 531–571. [Google Scholar] [CrossRef] [Green Version]
  28. Drucker, D.C.; Prager, W. Soil mechanics and plastic analysis or limit design. Q. Appl. Math. 1952, 10, 157–165. [Google Scholar] [CrossRef] [Green Version]
  29. Schmüdderich, C.; Lavasan, A.A.; Tschuchnigg, F.; Wichtmann, T. Behavior of Nonidentical Differently Loaded Interfering Rough Footings. J. Geotech. Geoenviron. Eng. 2020, 146, 04020041. [Google Scholar] [CrossRef]
  30. Lyamin, A.; Sloan, S.W. Upper bound limit analysis using linear finite elements and non-linear programming. Int. J. Numer. Anal. Methods Géoméch. 2002, 26, 181–216. [Google Scholar] [CrossRef]
  31. Sloan, S.W. Lower bound limit analysis using finite elements and linear programming. Int. J. Numer. Anal. Methods Géoméch. 1988, 12, 61–77. [Google Scholar] [CrossRef]
  32. Lyamin, A.V.; Sloan, S.W.; Krabbenhøft, K.; Hjiaj, M. Lower bound limit analysis with adaptive remeshing. Int. J. Numer. Methods Eng. 2005, 63, 1961–1974. [Google Scholar] [CrossRef]
  33. Zornberg, J.G.; Sitar, N.; Mitchell, J.K. Limit Equilibrium as Basis for Design of Geosynthetic Reinforced Slopes. J. Geotech. Geoenviron. Eng. 1998, 124, 684–698. [Google Scholar] [CrossRef] [Green Version]
  34. Vulova, C.; Leshchinsky, D. Effects of Geosynthetic Reinforcement Spacing on the Performance of Mechanically Stabilized Earth Walls; No. FFHWA-RD-03-048; The National Academies of Sciences, Engineering, and Medicine: Washington, DC, USA, 2003. [Google Scholar]
  35. Berg, R.R.; Christopher, B.R.; Samtani, N.C. Design of Mechanically Stabilized Earth Walls and Reinforced Soil Slopes–Volume I; No. FHWA-NHI-10-024; United States, Department of Transportation, Federal Highway Administration: Washington, DC, USA, 2009. [Google Scholar]
  36. Koerner, R.M.; Koerner, G.R. An extended data base and recommendations regarding 320 failed geosynthetic reinforced mechanically stabilized earth (MSE) walls. Geotext. Geomembr. 2018, 46, 904–912. [Google Scholar] [CrossRef]
  37. Yu, Y.; Bathurst, R.J.; Allen, T.M. Numerical Modeling of the SR-18 Geogrid Reinforced Modular Block Retaining Walls. J. Geotech. Geoenviron. Eng. 2016, 142, 04016003. [Google Scholar] [CrossRef]
Figure 1. Comparison of the different numbers of elements. (a) Safety factor = 0.8752 (elements = 10,000). (b) Safety factor = 0.8781 (elements = 20,000).
Water 14 02319 g001
Figure 2. Comparison of the FLAC and OptumG2 results for case 3-1.
Water 14 02319 g002
Figure 3. Comparison of the FLAC and OptumG2 results for case 3-2.
Water 14 02319 g003
Figure 4. Three different failure mechanisms in the cases.
Water 14 02319 g004
Figure 5. Geometry of the numerical model.
Water 14 02319 g005
Figure 6. Effect of the reinforcement length on the factor of safety.
Water 14 02319 g006
Figure 7. Safety factor with the wall height and critical reinforcement length.
Water 14 02319 g007
Figure 8. Effect of the reinforced wall height on the critical reinforcement length.
Water 14 02319 g008
Figure 9. Three failure mechanism cases.
Water 14 02319 g009
Figure 10. Effect of the reinforcement spacing on the critical reinforcement length.
Water 14 02319 g010
Figure 11. Effect of the seismic load on the critical reinforcement length.
Water 14 02319 g011
Table 1. Input data for verification of the numerical analysis models.
Input DataCase 3-1Case 3-2
Wall height8.212.1
Reinforcement spacing (m)0.41.34
Reinforcement length (m)1.57.5
Reinforcement soil unit weight (kN/m3)2215.64
Reinforcement soil angle of friction (°)4539.5
Retaining soil unit weight (kN/m3)2215.64
Retaining soil angle of friction (°)4539.5
Foundation soil unit weight (kN/m3)2215.64
Foundation soil angle of friction (°)4539.5
Ultimate strength of geogrid reinforcement (kN/m)9.010.0
Soil–geogrid angle of friction (°)3539
Table 2. Safety factor results for Case 1 with the numerical model.
Safety FactorLower BoundUpper BoundAverage ValueFLAC Analysis
Case 3-11.0391.1101.0751.09 (1)
Table 3. Soil parameters in the numerical model.
MaterialReinforced SoilRetained SoilFoundation SoilBlock Facing
Constitutive modeMohr-CoulombMohr-CoulombLinearly elasticLinearly elastic
Unit weight (kN/m3)18181823
Young’s modulus (MPa)20202000-
Poisson’s ratio0.30.30.3-
Cohesion (kPa)000-
Friction angle (°)35353535
Dilation angle (°)555-
Table 4. Modeling of the reinforcement stiffness.
MaterialsSecant Stiffness at 2%,
J2% (kN/m2)
Tensile Strength (kN/m2)
geogrid40020
Table 5. Interface parameters.
InterfaceFriction Angle (°)Dilation Angle (°)Cohesion (kPa)NormalShear Stiffness
Backfill-reinforcement3550--
Block-reinforcement2500--
Table 6. Summary of the failure mechanism cases.
CaseParameter in the Numerical ModelFailure Mechanism
Wall Height (m)Reinforcement Length (m)Reinforcement Space (m)K (g)
1620.60 Water 14 02319 i001
21030.60 Water 14 02319 i002
31340.60 Water 14 02319 i003
4690.60 Water 14 02319 i004
510100.60 Water 14 02319 i005
613120.60 Water 14 02319 i006
71020.40 Water 14 02319 i007
81030.60 Water 14 02319 i008
91050.90 Water 14 02319 i009
101080.40 Water 14 02319 i010
111080.60 Water 14 02319 i011
121090.90 Water 14 02319 i012
131050.60.1 Water 14 02319 i013
141070.60.2 Water 14 02319 i014
1510120.60.1 Water 14 02319 i015
1610150.60.2 Water 14 02319 i016
Table 7. Minimum length of the reinforcement.
CaseL/HLength (m)
Base conditions0.812
Seismic loading0.915
Table 8. Maximum spacing of the reinforcement.
CaseSpacing (m)
Base conditions0.7
Seismic loading0.5
Limited reinforcement length0.5
Publisher’s Note: MDPI stays neutral with regard to jurisdictional claims in published maps and institutional affiliations.

