
Measuring Technical Efficiency for Closuring Yield Gap and Improving Water Productivity of the Irrigated Durum Wheat in Tunisia

 , , , ,
Abstract
:1. Introduction
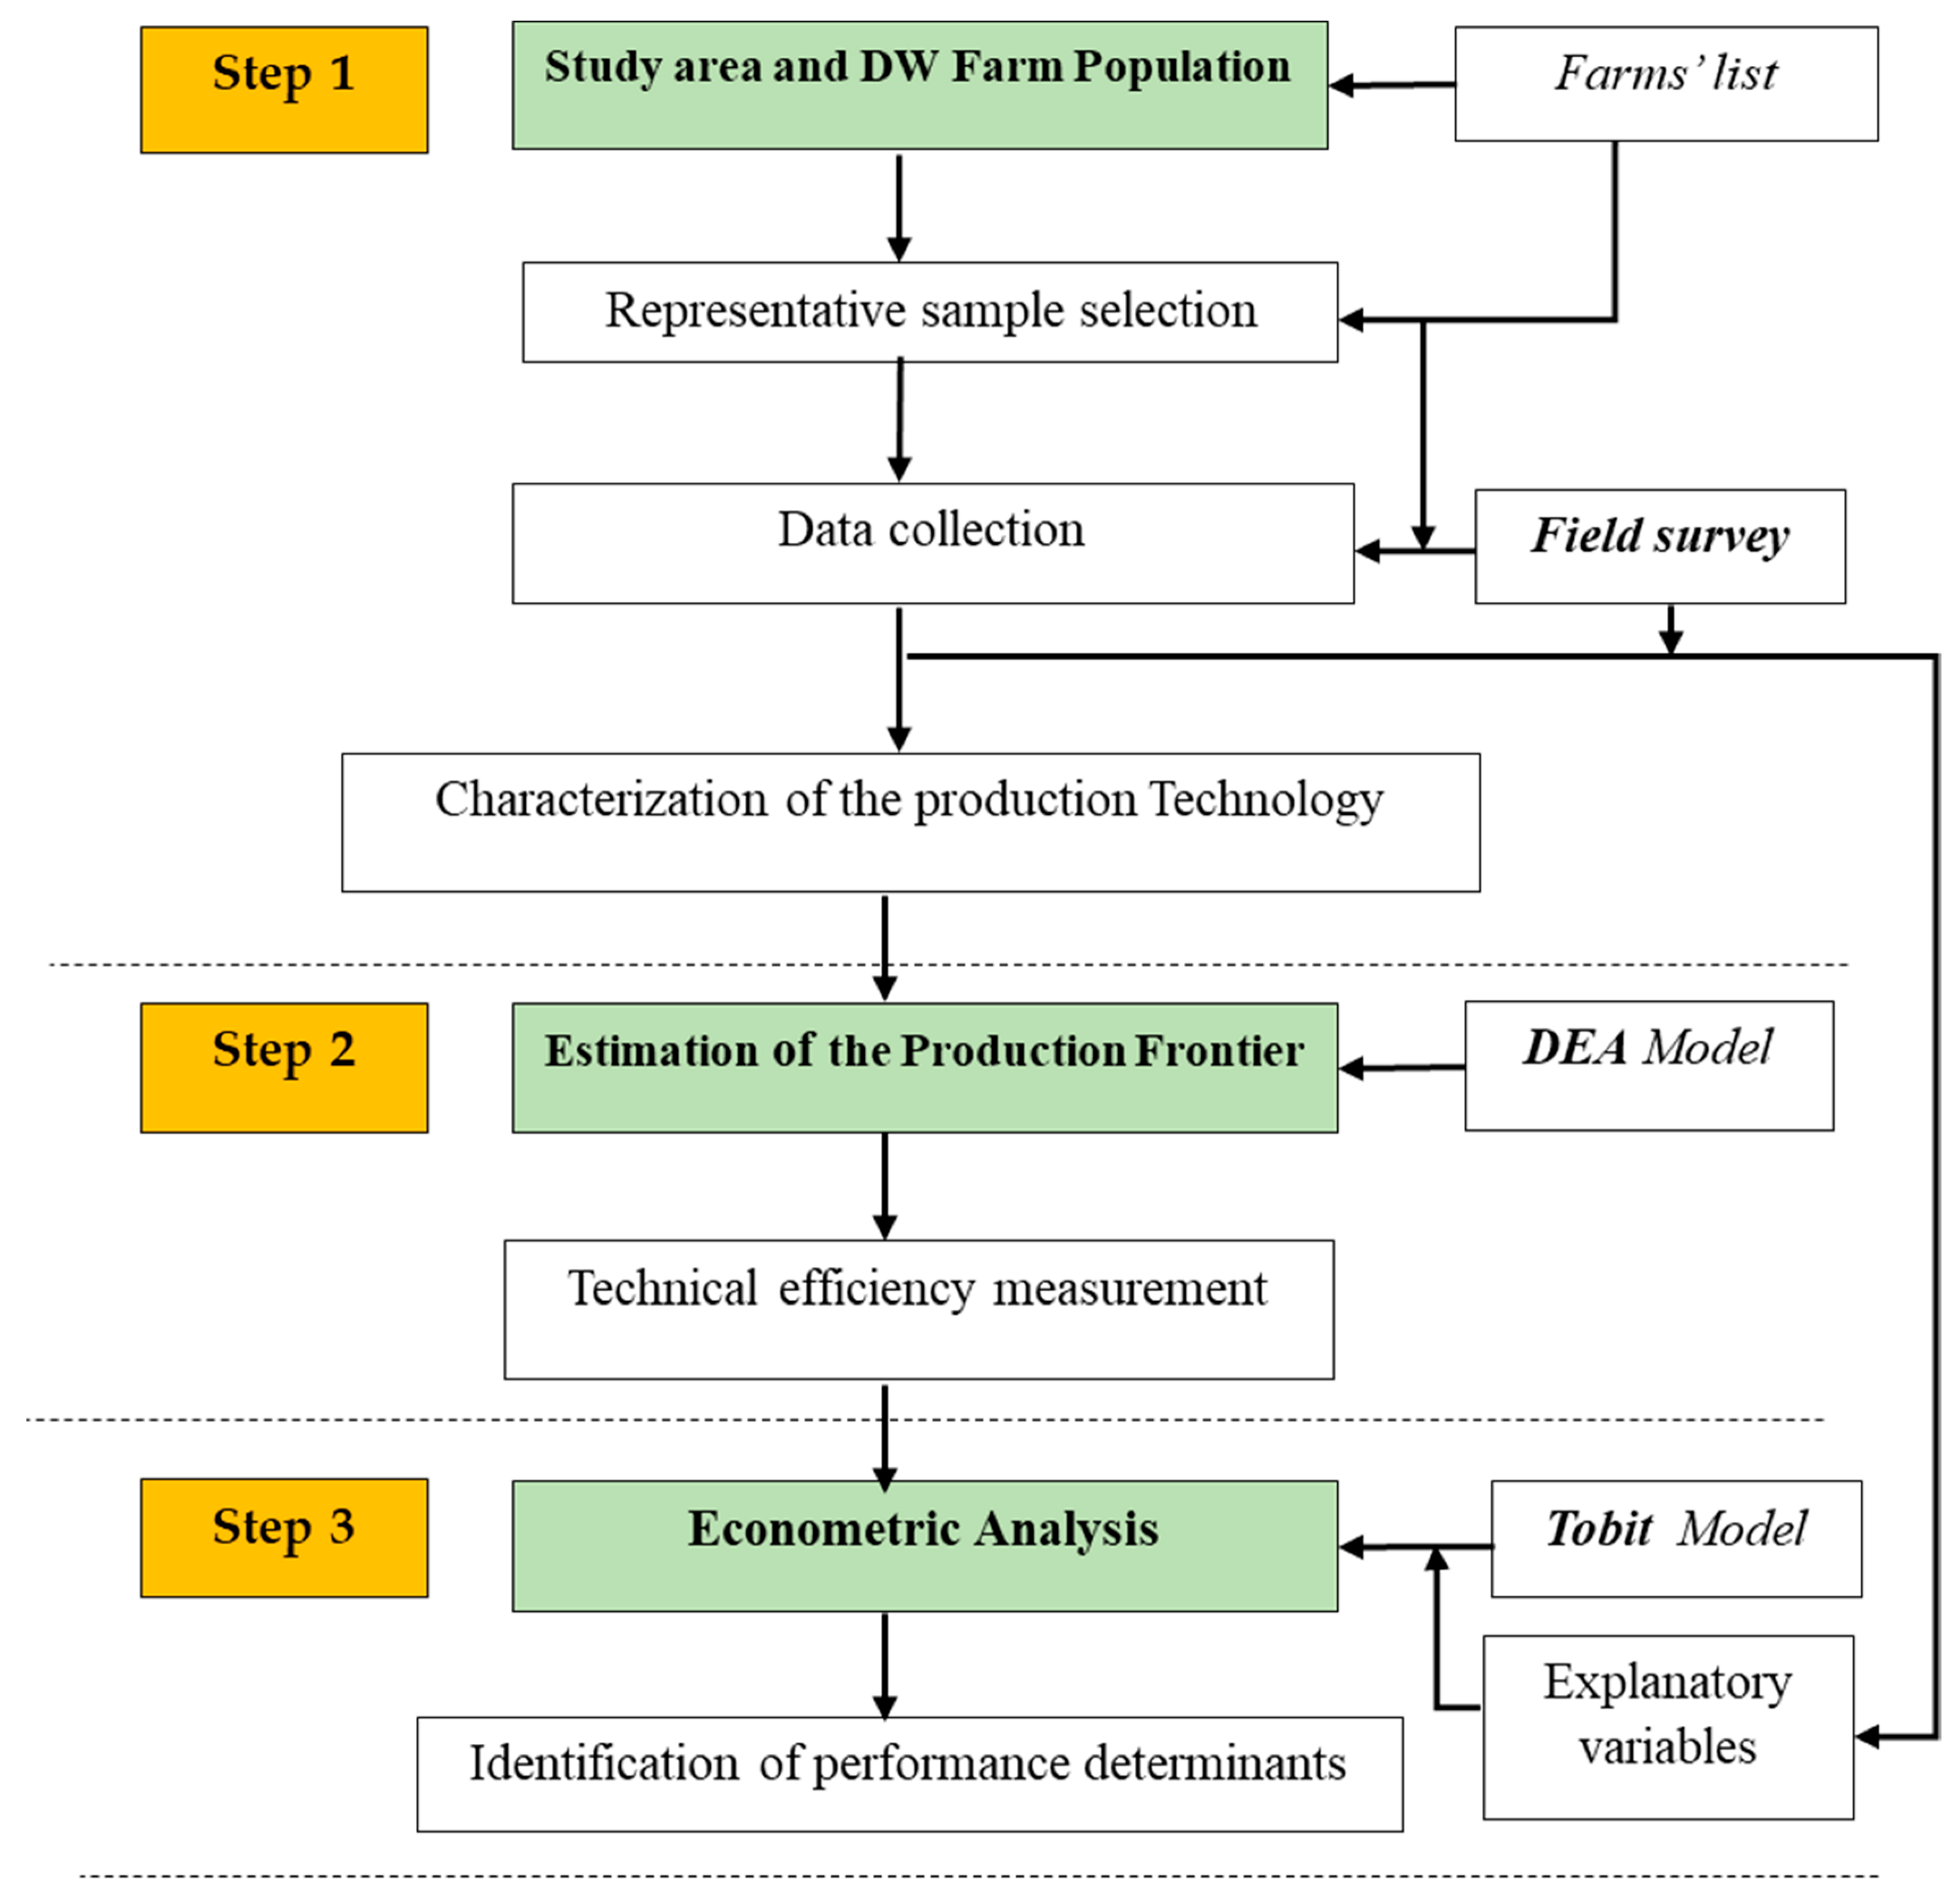
2. Materials and Methods
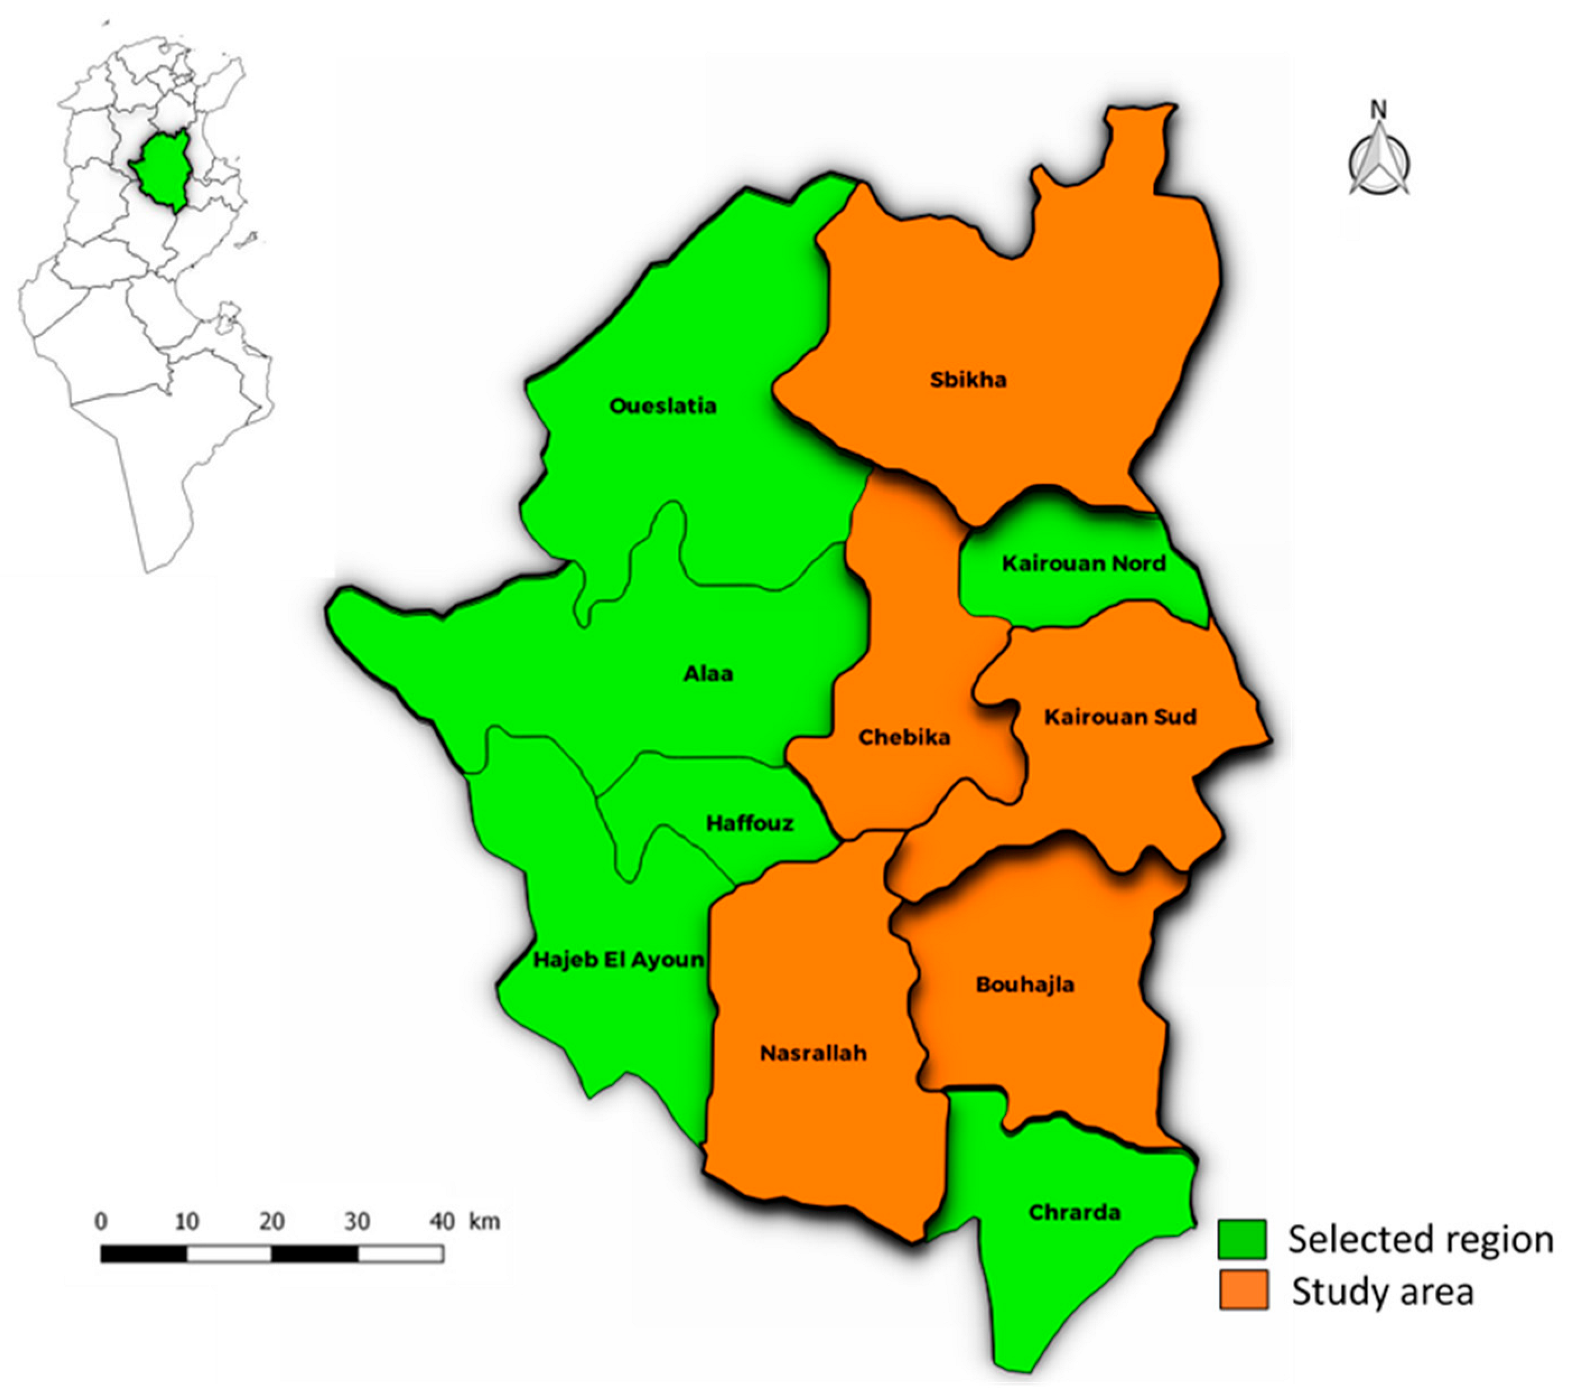
2.1. Study Area and Farm Population
2.1.1. Study Area
2.1.2. Sampling and Data Collection
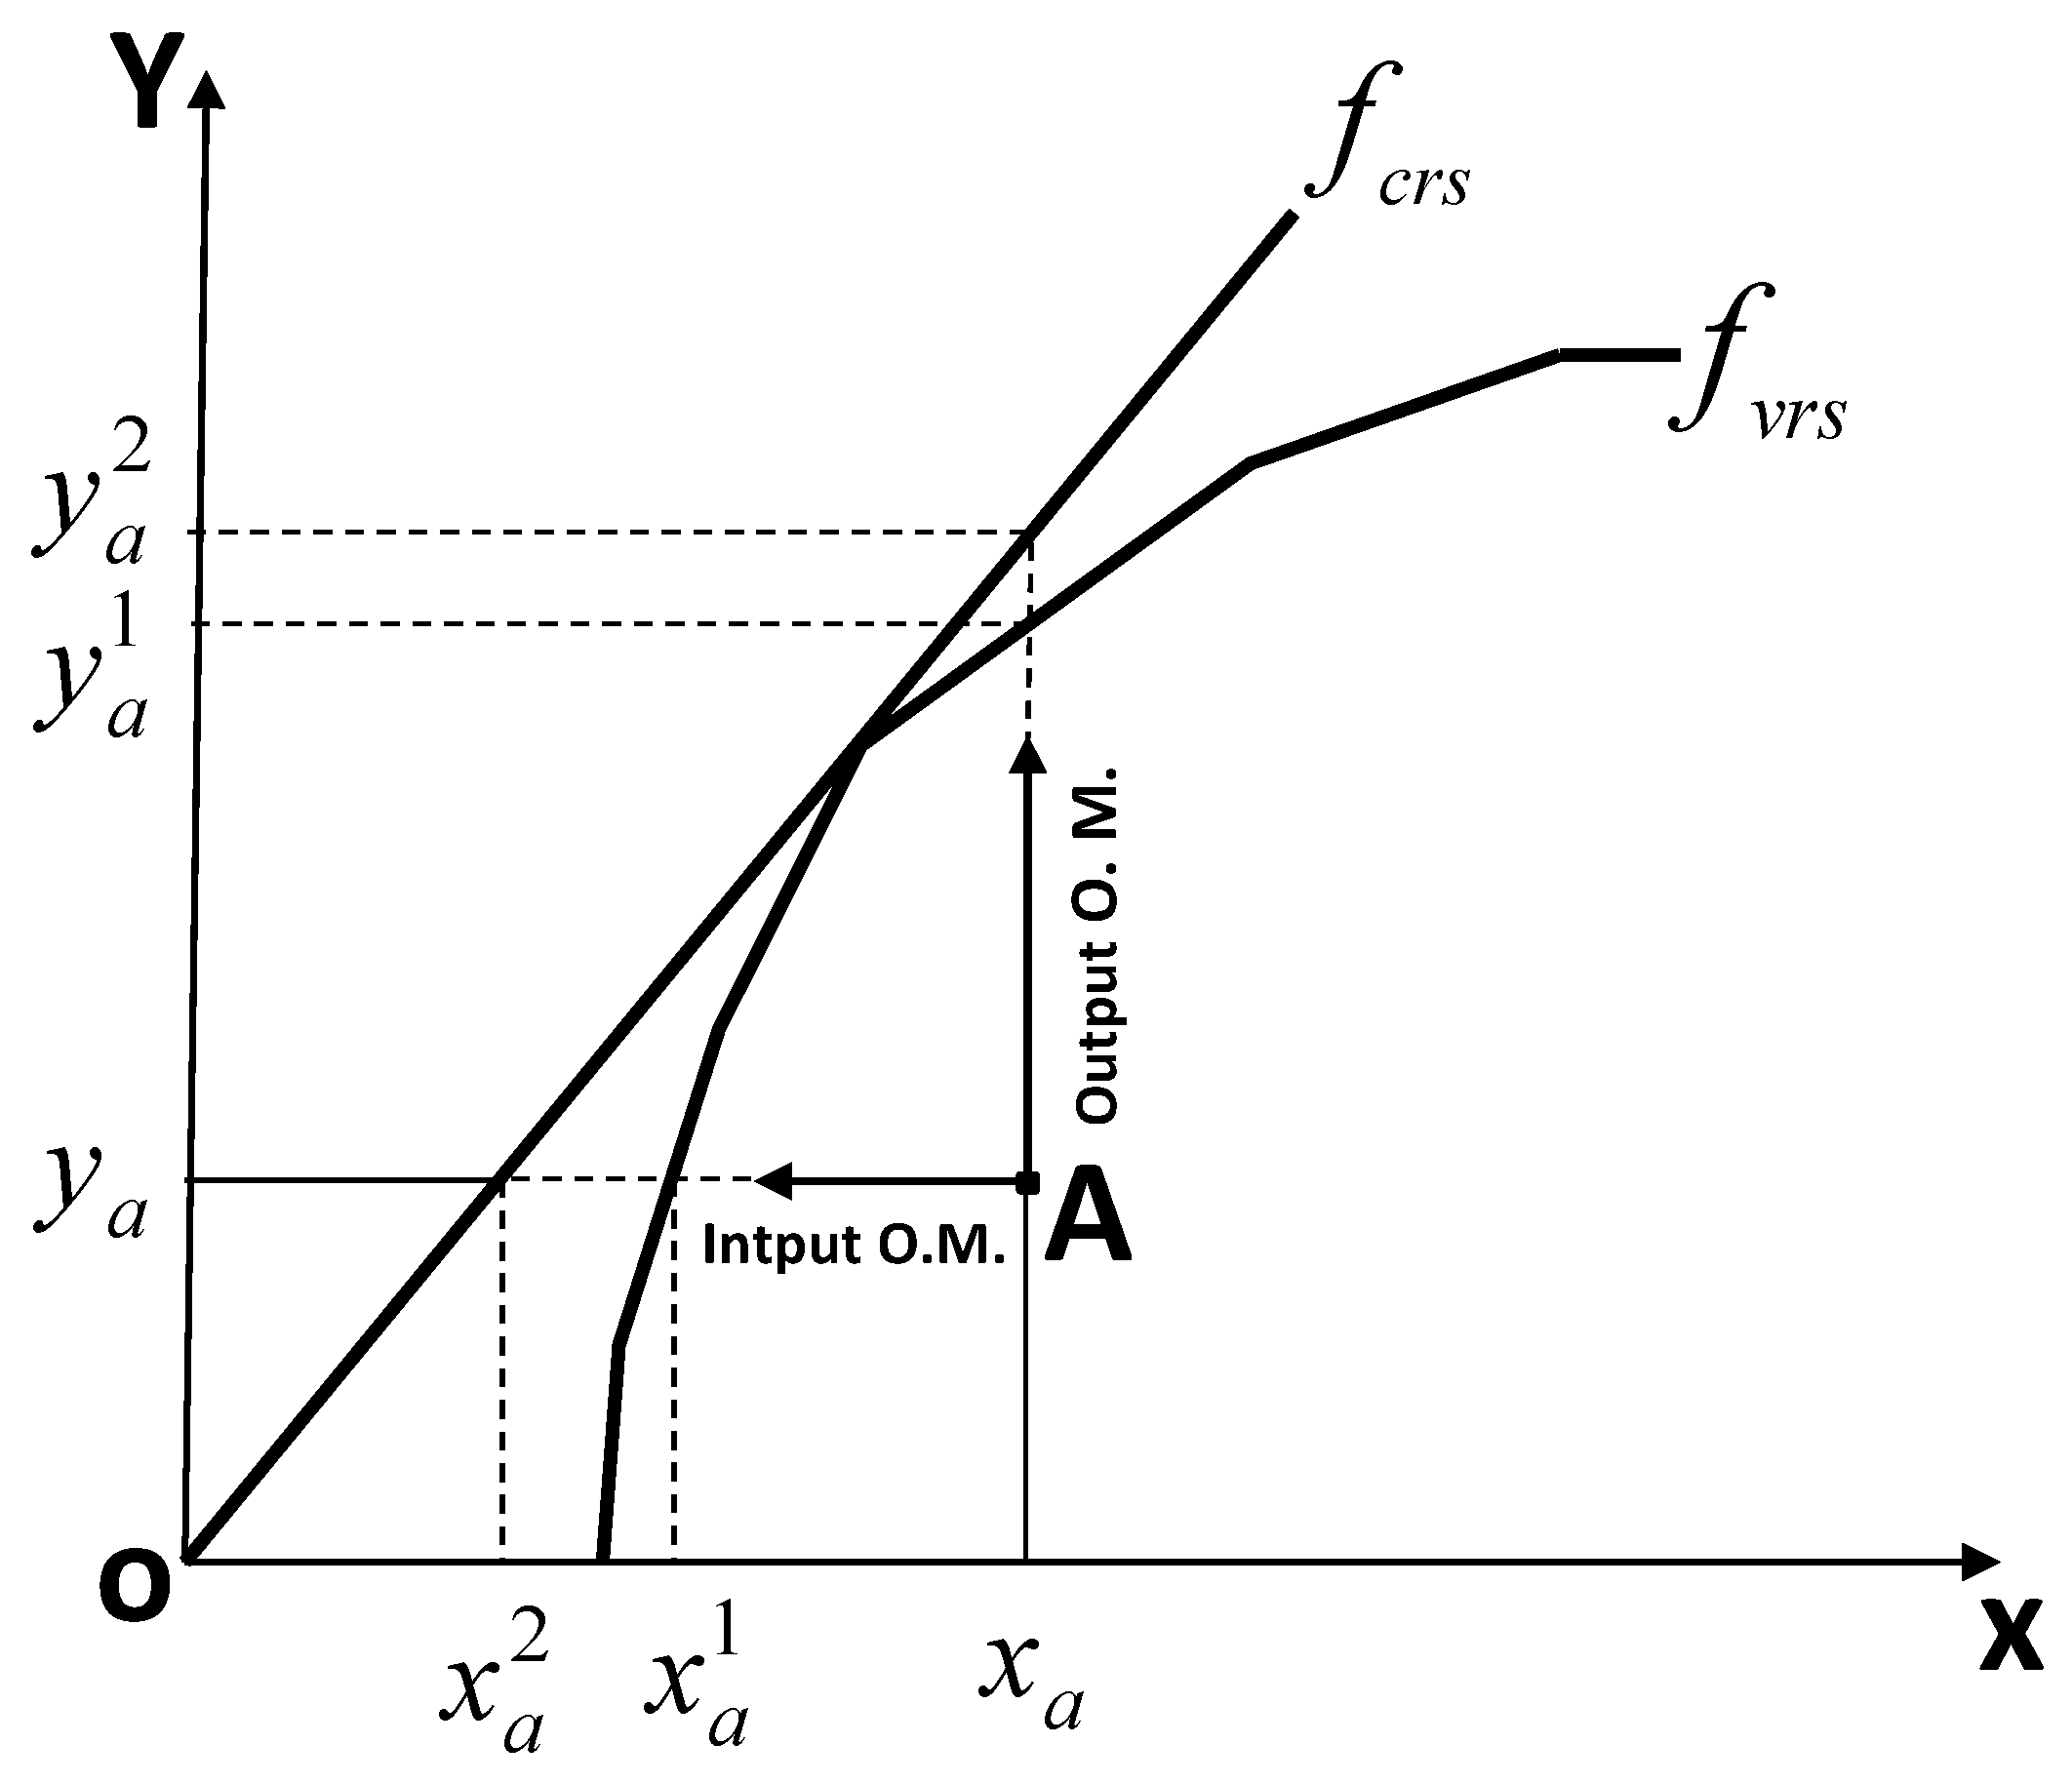
2.2. Data Envelopment Analysis Approach (DEA Model)
2.3. Tobit Model and Expected Determinants
3. Results
3.1. Descriptive Analysis
3.2. Technical Performances and Water Productivity
3.3. Determinants of Technical Performance
4. Discussion
5. Conclusions
Supplementary Materials
Author Contributions
Funding
Institutional Review Board Statement
Informed Consent Statement
Data Availability Statement
Conflicts of Interest
References
- FAO. Water for Sustainable Food and Agriculture, a Report Produced for the G20 Presidency of Germany; Food and Agriculture Organization of the United Nations: Rome, Italy, 2017; 33p, Available online: https://www.fao.org/3/i7959e/i7959e.pdf (accessed on 3 June 2022).
- FAO. The State of the World’s Land and Water Resources for Food and Agriculture, (SOLAW)—Managing Systems at Risk; Food and Agriculture Organization of the United Nations: Rome, Italy; Earth Scan: London, UK, 2011; 308p, Available online: https://www.fao.org/3/i1688e/i1688e.pdf (accessed on 3 June 2022).
- Alexandratos, N.; Bruinsma, J. World agriculture towards 2030/2050: The 2012 revision. In ESA Working paper No. 12-03; FAO: Rome, Italy, 2012; Available online: https://www.fao.org/3/ap106e/ap106e.pdf (accessed on 3 June 2022).
- UN. Sustainable Development Goals. 2016. Available online: https://sustainabledevelopment.un.org/sdgs (accessed on 8 March 2022).
- Ndlovu, P.V.; Mazvimavi, K.; An, H.; Murendo, C. Productivity and efficiency analysis of maize under conservation agriculture in Zimbabwe. Agric. Syst. 2014, 124, 21–31. [Google Scholar] [CrossRef] [Green Version]
- AlHinai, A.; Jayasuriya, H. Enhancing economic productivity of irrigation water by product value addition: Case of dates. J. Saudi Soc. Agric. Sci. 2020, 20, 553–558. [Google Scholar] [CrossRef]
- Van Halsema, G.E.; Vincent, L. Efficiency and productivity terms for water management: A matter of contextual relativism versus general absolutism. Agric. Water Manag. 2012, 108, 9–15. [Google Scholar] [CrossRef]
- De Fraiture, C.; Molden, D.; Wichelns, D. Investing in water for food, ecosystems, and livelihoods: An overview of the comprehensive assessment of water management in agriculture. Agric. Water Manag. 2010, 97, 495–501. [Google Scholar] [CrossRef]
- Molden, D.; Oweis, T.; Steduto, P.; Bindraban, P.; Hanjra, M.A.; Kijne, J. Improving agricultural water productivity: Between optimism and caution. Agric. Water Manag. 2010, 97, 528–535. [Google Scholar] [CrossRef]
- Ozcelik, N.; Rodríguez, M.; Lutter, S.; Sartal, A. Indicating the wrong track? A critical appraisal of water productivity as an indicator to inform water efficiency policies. Resour. Conserv. Recycl. 2012, 168, 105452. [Google Scholar] [CrossRef]
- Hamdy, A.; Ragab, R.; Scarascia-Mugnozza, E. Coping with water scarcity: Water saving and increasing water productivity. J. Int. Commiss. Irrig. Drain. 2003, 52, 3–20. [Google Scholar] [CrossRef]
- Jiang, Y.; Xu, X.; Huang, Q.; Huo, Z.; Huang, G. Assessment of irrigation performance and water productivity in irrigated areas of the middle Heihe River basin using a distributed agro-hydrological model. Agric. Water Manag. 2015, 147, 67–81. [Google Scholar] [CrossRef]
- Pereira, L.S.; Cordery, I.; Iacovides, I. Improved indicators of water use performance and productivity for sustainable water conservation and saving. Agric. Water Manag. 2012, 108, 39–51. [Google Scholar] [CrossRef]
- Zwart, S.J.; Bastiaanssen, W.G.M.; De Fraiture, C.; Molden, D.J. A global benchmarkmap of water productivity for rained and irrigated wheat. Agric. Water Manag. 2010, 97, 1617–1627. [Google Scholar] [CrossRef]
- Sadras, V.O.; Cassman, K.G.; Grassini, P.; Hall, A.J.; Bastiaanssen, W.G.M.; Laborte, A.G.; Milne, A.E.; Sileshi, G.; Steduto, P. Yield Gap Analysis of Field Crops, Methodsand Case Studies (FAO Water Reports 41); FAO: Rome, Italy, 2015; Available online: http://www.fao.org/3/ai4695e.pdf (accessed on 4 March 2022).
- Löw, F.; Biradar, C.; Fliemann, E.; Lamers, J.P.A.; Conrad, C. Assessing gaps inirrigated agricultural productivity through satellite earth observations—A case study of the Fergana Valley, Central Asia. Int. J. Appl. Earth Obs. Geoinf. 2017, 59, 118–134. [Google Scholar] [CrossRef]
- Cai, X.; Molden, D.; Mainuddin, M.; Sharma, B.; Ahmad, M.D.; Karimi, P. Producing more food with less water in a changing world: Assessment of water productivity in 10 major river basins. Water Int. 2011, 36, 42–62. [Google Scholar] [CrossRef]
- Rong, L.B.; Gong, K.Y.; Duan, F.Y.; Li, S.K.; Zhao, M.; He, J.; Zhou, W.B.; Yu, Q. Yield gap and resource utilization efficiency of three major food crops in the world—A review. J. Integr. Agric. 2021, 2, 349–362. [Google Scholar] [CrossRef]
- Kruseman, G.; Abdul, M.K.; Tesfaye, K.; Bairagi, S.; Robertson, R.; Mandiaye, D.; Frija, A.; Gbegbelegbe, S.; Alene, A.; Prager, S. Rural transformation and the future of cereal-based agri-food systems. Glob. Food Secur. 2020, 26, 100441. [Google Scholar] [CrossRef]
- Getnet, M.; Descheemaeker, K.; Van Ittersum, M.K.; Hengsdijk, H. Narrowing crop yield gaps in Ethiopia under current and future climate: A model-based exploration of intensification options and their trade-offs with the water balance. Field Crops Res. 2022, 278, 108442. [Google Scholar] [CrossRef]
- Shao, J.-J.; Zhao, W.-Q.; Zhou, Z.-G.; Du, K.; Kong, L.-J.; Wang, Y.-H. A new feasible method for yield gap analysis in regions dominanted by smallholder farmers, with a case study of Jiangsu Province, China. J. Integr. Agric. 2021, 20, 460–469. [Google Scholar] [CrossRef]
- Qiao, L.; Silva, J.V.; Fan, M.; Mehmood, I.; Fan, J.; Li, R.; van Ittersum, M.K. Assessing the contribution of nitrogen fertilizer and soil quality to yield gaps: A study for irrigated and rainfed maize in China. Field Crops Res. 2012, 273, 108304. [Google Scholar] [CrossRef]
- Silva, J.V.; Reidsma, P.; Baudron, F.; Laborted, A.G.; Giller, K.E.; van Ittersum, M.K. How sustainable is sustainable intensification? Assessing yield gaps at field and farm level across the globe. Glob. Food Secur. 2021, 30, 100552. [Google Scholar] [CrossRef]
- Nayak, H.S.; Silva, J.V.; Parihar, C.M.; Kakraliya, S.K.; Krupnik, T.J.; Bijarniya, D.; Jat, L.M.; Sharma, G.P.; Jat, S.H.; Sidhu, S.H.; et al. Rice yield gaps and nitrogen-use efficiency in the Northwestern Indo-Gangetic Plains of India: Evidence based insights from heterogeneous farmers’ practices. Field Crops Res. 2022, 275, 108328. [Google Scholar] [CrossRef]
- Schils, R.; Olesen, J.E.; Kersebaum, K.C.; Rijk, B.; Oberforster, M.; Kalyada, V.; Khitrykau, M.; Gobin, A.; Kirchev, H.; Manolova, V.; et al. Cereal yield gaps across Europe. Eur. J. Agron. 2018, 101, 109–120. [Google Scholar] [CrossRef]
- Timsina, J.; Wolf, J.; Guilpart, N.; van Bussel, L.G.J.; Grassini, P.; van Wart, J.; Hossaind, A.; Rashid, H.; Islam, S.; van Ittersum, M.K. Can Bangladesh produce enough cereals to meet future demand? Agric. Syst. 2018, 163, 36–44. [Google Scholar] [CrossRef] [PubMed]
- Liu, Y.-E.; Li, Y.-X.; Lü, T.-F.; Xing, J.-F.; Xu, T.-J.; Cai, W.-T.; Zhang, Y.; Zhao, J.; Wang, R.-H. The priority of management factors for reducing the yield gap of summer maize in the north of Huang-Huai-Hai region, China. J. Integr. Agric. 2020, 20, 450–459. [Google Scholar] [CrossRef]
- Silva, J.V.; Baudron, F.; Reidsma, P.; Giller, K.E. Is labour a major determinant of yield gaps in sub-Saharan Africa? A study of cereal-based production systems in Southern Ethiopia. Agric. Syst. 2019, 174, 39–51. [Google Scholar] [CrossRef]
- Ministry of Agriculture. 2021. Available online: http://www.agridata.tn/dataset?groups=activites-arboricole-et-maraicheres&organization=dgeda&_tags_limit=0 (accessed on 10 October 2021).
- Mailhol, J.C.; Zaïri, A.; Slatni, A.; Ben Nouma, B.; El Amani, H. Analysis of irrigation systems and irrigation strategies for durumwheat in Tunisia. Agric. Water Manag. 2004, 70, 19–37. [Google Scholar] [CrossRef]
- Ben Zekri, Y.; Barkaoui, K.; Marrou, H.; Mekki, I.; Belhouchette, H.; Wery, J. On farm analysis of the effect of the preceding crop on Nuptake and grain yield of durum wheat (Triticumdurum Desf.) in Mediterranean conditions. Arch. Agron. Soil Sci. 2019, 5, 596–611. [Google Scholar] [CrossRef]
- Ben Nouna, B.; Rezgui, M.; Kanzari, S. Performance des Calendriers d’irrigation Basés sur un Modèle Agro-météorologique: Cas du blé dur en Conditions Semi-arides et Arides de la Tunisie. J. New Sci. Agric. Biotechnol. 2018, 51, 3198–3203. [Google Scholar]
- Khila, S.B.; Douh, B.; Mguidiche, A.; Boujelben, A. Effets de la contrainte hydrique et des changements climatiques sur la productivité du blé dur en conditions climatiques semi arides de Tunisie. LARHYSS J. 2015, 23, 69–85. Available online: http://larhyss.net/ojs/index.php/larhyss/article/viewFile/292/282 (accessed on 13 January 2022).
- Debreu, G. The coefficient of resource utilization. Econometrica 1951, 19, 273–292. Available online: https://www.jstor.org/stable/1906814 (accessed on 15 February 2022). [CrossRef]
- Farrell, M.J. The measurement of productive efficiency. J. R. Stat. Soc. 1957, 120, 253–281. [Google Scholar] [CrossRef]
- Farrell, M.J.; Fieldhouse, M. Estimating Efficient Production Functions under Increasing Returns to Scale. J. R. Stat. Soc. Ser. A 1962, 125, 252–267. [Google Scholar] [CrossRef]
- Charnes, A.; Cooper, W.W.; Rhodes, E. Measuring the efficiency of decision-making units. Eur. J. Oper. Res. 1978, 2, 429–444. [Google Scholar] [CrossRef]
- Banker, R.; Charnes, A.; Cooper, W.W. Some models for estimating technical and scale inefficiencies in data envelopment analysis. Manag. Sci. 1984, 30, 1078–1092. [Google Scholar] [CrossRef] [Green Version]
- Färe, R.; Grosskopf, S.; Lovell, C.A.K. Production Frontiers; Cambridge University Press: Cambridge, UK, 1994. [Google Scholar]
- Emrouznejad, A.; Yang, G.L. A survey and analysis of the first 40 years of scholarly literature in DEA: 1978-2016. Socio Econ. Plan. Sci. 2018, 61, 4–8. [Google Scholar] [CrossRef]
- Liu, J.S.; Lu, L.Y.Y.; Lu, W.M.; Lin, B.J.Y. A survey of DEA applications. Omega 2013, 41, 893–902. [Google Scholar] [CrossRef]
- Lasram, A.; Masmoudi, M.M.; Ben Mechlia, N. Efficience technique et productivité de l’eau sur le blé dur irrigué en Tunisie. In Proceedings of the Actes de la Journée Nationale sur la Valorization des Résultats de la Recherché dans le Domaine des Grandes Cultures, Hammamet, Tunisie, 17 April 2014; pp. 68–72. Available online: http://www.iresa.agrinet.tn/announce/Actes_de_la%20journee_nationale_.pdf (accessed on 3 June 2022).
- Azizi, A.; Morardet, S.; Montginoul, M.; Fusillier, J.L. Performances de la Gestion Collective de l’Irrigation et Dynamique d’Expansion des Forages Privés dans la Plaine de Kairouan. In 10 Ème Journées de Recherches en Sciences Sociales (JRSS). INRAE, SFER, CIRAD. Paris: SFER, 1–25. Journées de Recherches en Sciences Sociales. 10, Paris, France, 8 Décembre 2016/9 Décembre 2016. Available online: https://www.sfer.asso.fr/event/view/5 (accessed on 3 June 2022).
- Frija, A.; Chebil, A.; Speelman, S.; Fayesse, N. A critical assessment of groundwater governance in Tunisia. Water Policy 2014, 16, 358–373. [Google Scholar] [CrossRef]
- Massuel, S.; Riaux, J. Groundwater overexploitation: Why is the red flag waved? Case study on the Kairouan plain aquifer (central Tunisia). Hydrogeol. J. 2017, 25, 1607–1620. [Google Scholar] [CrossRef]
- Chemak, F.; Boussemart, J.P.; Jacquet, F. Farming system performance and water use efficiency in the Tunisian semi-arid region: Data envelopment analysis approach. Int. Trans. Oper. Res. 2010, 17, 381–396. [Google Scholar] [CrossRef]
- Ben Alaya, A.; Souissi, A.; Stambouli, T.; Albouchi, L.; Chebil, A.; Frija, A. Eau Virtuelle et Sécurité Alimentaire en Tunisie: Du Constat à l’Appui au Développement (EVSAT-CAD); Rapport Technique Final École Supérieure d’Agriculture de Mograne, Juillet 2015, 34 p. Available online: http://hdl.handle.net/10625/54813 (accessed on 3 June 2022).
- Zulkifli, M.; Ar Nuhfil, H.; Muslich, M.M.; Yafrial, S. Analyse of technical efficiency and competitiveness of Maize farming in gorontalo province, Indonesia. RJOAS 2018, 5, 309–319. [Google Scholar] [CrossRef]
- Veysset, P.; Lherm, M.; Roulenc, M.; Troquier, C.; Bébin, D. Productivity and technical efficiency of suckler beef production systems: Trends for the period 1990 to 2012. Animal 2015, 9, 2050–2059. [Google Scholar] [CrossRef] [Green Version]
- Latruffe, L. Competitiveness, productivity and efficiency in the agricultural and agri-food sectors. In OECD Food, Agriculture and Fisheries Papers; OECD: Paris, France, 2010. [Google Scholar] [CrossRef]
- Chebil, A.; Frija, A.; Thabet, C. Economic efficiency measures and its determinants for irrigated wheat farms in Tunisia: A DEA approach. New Medit 2015, 2, 32–38. [Google Scholar]
- Lasram, A.; Dellagi, H.; Masmoudi, M.M.; Ben Mechlia, N. Productivité de l’eau du blé dur irrigué face à la variabilité climatique. New Medit 2015, 1, 61–66. Available online: https://newmedit.iamb.it/share/img_new_medit_articoli/1010_61lasram.pdf (accessed on 3 June 2022).
- Zhou, W.; Wang, H.; Hu, X.; Duan, F. Spatial variation of technical efficiency of cereal production in China at the farm level. J. Integr. Agric. 2021, 20, 470–481. [Google Scholar] [CrossRef]
- Latruffe, L.; Balcombe, K.; Davidova, S.; Zawalinski, K. Determinants of Technical Efficiency of Crop and Livestock Farms in Poland; Working Paper 02-05; Institut National de la Recherche Agronomique: Rennes, France, 2002. [Google Scholar]
- Yuan, W. Irrigation water use efficiency of farmers and its determinants: Evidence from a survey in Northwestern China. Agric. Sci. China 2010, 9, 1326–1337. [Google Scholar] [CrossRef]
- Bozoglu, M.; Ceyhan, V. Measuring the technical efficiency and exploring the inefficiency determinants of vegetable farms in Samsun province, Turkey. Agric. Syst. 2007, 3, 649–656. [Google Scholar] [CrossRef]
- Mezgebo, G.K.; Mekonen, D.G.; Gebrezgiabher, K.T. Do smallholder farmers ensure resource use efficiency in developing countries? Technical efficiency of sesame production in Western Tigrai, Ethiopia. Heliyon 2021, 7, e07315. [Google Scholar] [CrossRef] [PubMed]
- Tian, X.; Sun, F.; Zhou, Y.h. Technical efficiency and its determinants in China’s hog production. J. Integr. Agric. 2016, 14, 1057–1068. [Google Scholar] [CrossRef]
- Daniel, O.N.; Gideon, A.O.; John, M.O.; Wilson, N. Technical efficiency in resource use: Evidence from smallholder Irish potato farmers in Nyandarua North District, Kenya. Drain Eng. 2010, 6, 423–442. Available online: http://www.academicjournals.org/AJAR (accessed on 4 March 2022).
- Ullah, I.; Shahid, A.; Sufyan, U.K.; Muhammad, S. Assessment of technical efficiency of open shed broiler farms: The case study of Khyber Pakhtunkhwa province Pakistan. J. Saudi Soc. Agric. Sci. 2019, 18, 361–366. [Google Scholar] [CrossRef]
- Pakage, S.; Hartono, B.; Fanani, Z.; Nugroho, B. Analysis of technical, allocative and economic efficiency of broiler production using closed house system in Malang District of East Java Indonesia. Livest. Res. Rural. Dev. 2015, 27, 1–9. Available online: http://www.lrrd.org/lrrd27/9/paka27174.html (accessed on 28 February 2022).
- Mathijs, E.; Vranken, L. Farm restructuring efficiency in transition: Evidence from Bulgaria and Hungary; Selected paper. In Proceedings of the American Agricultural Association Annual Meeting, Tampa, FL, USA, 30 July–2 August 2000; Available online: https://ageconsearch.umn.edu/record/21886/files/sp00ma01.pdf (accessed on 3 June 2022).
- Hong, Y.; Heerinkb, N.; Zhao, M.; van der Werfd, W. Intercropping contributes to a higher technical efficiency in smallholder farming Evidence from a case study in Gaotai County, China. Agric. Syst. 2019, 173, 317–324. [Google Scholar] [CrossRef]
- Rached, Z.; Sonia, A.; Chebil, A.; Raoudha, K. Évaluation de la rentabilité et de la productivité totale des facteurs de production des exploitations céréalières: Cas de la culture du blé dur au Nord de la Tunisie. Mediterr. J. Econ. 2021, 2, 107–124. [Google Scholar] [CrossRef]
- Beres, B.L.; Rahmani, E.; Clarke, J.M.; Grassini, P.; Pozniak, C.J.; Geddes, C.M.; Ransom, J.K. A systematic review of durum wheat: Enhancing production systems by exploring genotype, environment, and management (G × E × M) synergies. Front. Plant Sci. 2020, 11, 568657. [Google Scholar] [CrossRef]
- Maruod, E.; Breima, E.; Elkhidir, E.; Ahmed, M.E. Impact of improved seeds on small farmers’ productivity, income and livelihood in umruwaba locality of North Kordofan, Sudan. Int. J. Agric. For. 2013, 6, 203–208. [Google Scholar] [CrossRef]
- Shavgulidze, R.; Bedoshvili, D.; Aurbacher, J. Technical efficiency of potato and dairy farming in mountainous Kazbegi district, Georgia. Ann. Agrar. Sci. 2017, 15, 55–60. [Google Scholar] [CrossRef]


| Variables | Description | Expected Sign |
|---|---|---|
| DWLand | Cultivated area in ha | + |
| WResource | Type of water resource (dummy variable 1 if PRIA and 0 if PBIA) | + |
| Age | Age of household heads in years | + |
| Education | Education level (dummy variable, 0 if non educate or primary school, 1 otherwise) | + |
| QualitySeed | Dummy variable (1 if farmer used improved seed, 0 if farmer used their own seed) | + |
| ProdMarket | The share of the production sold on the market in % | + |
| Unit | PBIA (60) | PRIA (371) | |||||
|---|---|---|---|---|---|---|---|
| Quantity | Price (TND) | Total | Quantity | Price (TND) | Total | ||
| Seeds | kg | 212 | 0.76 | 161.12 | 214 | 0.79 | 169.06 |
| Tillage | h | 6.22 | 25 | 155.5 | 6.18 | 25 | 154.5 |
| Sowing | h | 0.47 | 25 | 11. 75 | 0.46 | 25 | 11.5 |
| DAP | kg | 138 | 0.52 | 71.76 | 150 | 0.52 | 78 |
| Amm. | kg | 229 | 0.42 | 96.18 | 217 | 0.42 | 91,14 |
| Trait. | TND | - | - | 15.21 | - | - | 29.62 |
| Water | m3 | 3061 | 0.065 | 198.965 | 3692 | 0.403 | 1487.876 |
| Harvest | h | 1.31 | 82 | 107.42 | 1.37 | 82 | 112.34 |
| Pres. | Ball | 106 | 1 | 106 | 148 | 1 | 148 |
| Work | j | 24 | 9 | 216 | 26 | 9 | 234 |
| Total Costs (TND) | 1139.905 | 2516.036 | |||||
| Grain Yield | t | 3.274 | 660 | 2160.84 | 3.588 | 660 | 2368.08 |
| Paille | Ball | 106 | 2.8 | 296.8 | 148 | 2.8 | 414.4 |
| Total Production Value (TND) | 2457.64 | 2782.48 | |||||
| Gross Margin (TND) | 1317.735 | 266.444 | |||||
| Variable | Description of Variable | Unit of Measurement | Mean | S.D. | Q1 | Q3 | Median | Min | Max |
|---|---|---|---|---|---|---|---|---|---|
| Yield | Grain yield | tha−1 | 3.54 | 13.92 | 2.5 | 4.5 | 3.6 | 0.8 | 6.8 |
| Seed | Quantity of DW seed | kg ha−1 | 214 | 75 | 160 | 250 | 200 | 50 | 500 |
| Fert | Fertilizer (Urea and DAP) | kg ha−1 | 369 | 214 | 200 | 500 | 330 | 0 | 1250 |
| Mecan | Mechanization | hour ha−1 | 6.66 | 2.56 | 5 | 8 | 6.5 | 1 | 15 |
| Labor | Number of labor days | day ha−1 | 26 | 18.10 | 13.3 | 32.5 | 21 | 2 | 120 |
| Water | water irrigation | m3 ha−1 | 3604 | 2245 | 1728 | 5184 | 3085 | 201 | 8640 |
| Average | SD | Median | Min | Max | |
|---|---|---|---|---|---|
| TEvrs | 0.63 | 0.23 | 0.61 | 0.12 | 1 |
| TEcrs | 0.50 | 0.22 | 0.45 | 0.09 | 1 |
| SE | 0.78 | 0.14 | 0.78 | 0.25 | 1 |
| WUE | 0.30 | 0.31 | 0.16 | 0.02 | 1 |
| WP0 | 8.15 | 4.46 | 7.28 | 1.02 | 19.84 |
| WP1 | 10.58 | 5.11 | 9.81 | 1.02 | 25.37 |
| WP2 | 17.02 | 7.98 | 16.98 | 1.02 | 32.83 |
| Average | Number of Farms (%) | |||||
|---|---|---|---|---|---|---|
| CRS | VRS | SE | CRS | VRS | SE | |
| TE ≤ 0.5 | 0.34 | 0.36 | 0.41 | 244 (56%) | 142 (33%) | 12 (3%) |
| 0.5 < TE ≤ 0.75 | 0.60 | 0.62 | 0.65 | 128 (30%) | 152 (35%) | 163 (36%) |
| TE > 0.75 | 0.93 | 0.91 | 0.88 | 59 (14%) | 137 (32%) | 256 (61%) |
| TE = 1 | 1 | 1 | 1 | 29 (7%) | 54 (12.5%) | 30 (7%) |
| Total | 0.50 | 0.63 | 0.78 | 431 | 431 | 431 |
| Variables | Unit | Average | Min | Max | S.D. |
|---|---|---|---|---|---|
| DWLand | Ha | 4.28 | 0,5 | 20 | 3.46 |
| WResource | 0.85 | 0 | 1 | 0.35 | |
| Age | Year | 43.17 | 17 | 95 | 14.81 |
| Education | 0.40 | 0 | 1 | 0.49 | |
| QualitySeed | 0.37 | 0 | 1 | 0.48 | |
| ProdMarket | % | 81.92 | 0 | 100 | 29.70 |
| Variable | Coefficient | St. E. | t | Prob > |t| |
|---|---|---|---|---|
| DWLand | 0.0105 | 0.0037 | 2.788 | 0.0053 *** |
| WResource | 0.0642 | 0.0359 | 1.787 | 0.0739 * |
| Age | 0.0012 | 0.0008 | 1.462 | 0.1437 |
| Education | 0.0637 | 0.0254 | 2.509 | 0.0121 ** |
| QualitySeed | 0.0739 | 0.0257 | 2.875 | 0.0040 *** |
| ProdMarket | 0.0751 | 0.0426 | 1.760 | 0.0784 * |
| Intercept | 0.3057 | 0.0724 | 4.219 | 0.0000 *** |
| LogSigma | −1.3687 | 0.0377 | −36.263 | 0.0000 *** |
| Stratum | ]0–5] | ]5–10] | ]10–20] | Total | ||||
|---|---|---|---|---|---|---|---|---|
| DW Seeds | Farms | Yield | Farms | Yield | Farms | Yield | Farms | Yield |
| Autoproduction | 212 | 3.37 | 43 | 3.62 | 15 | 3.47 | 270 | 3.41 |
| Improved | 119 | 3.66 | 32 | 4 | 10 | 4.24 | 161 | 3.76 |
| Total | 331 | 3.47 | 75 | 3.78 | 25 | 3.78 | 431 | 3.54 |
Publisher’s Note: MDPI stays neutral with regard to jurisdictional claims in published maps and institutional affiliations. |
© 2022 by the authors. Licensee MDPI, Basel, Switzerland. This article is an open access article distributed under the terms and conditions of the Creative Commons Attribution (CC BY) license (https://creativecommons.org/licenses/by/4.0/).
Share and Cite
Chemak, F.; Mazhoud, H.; Rached, Z.; Gara, A.; Rahmeni, R.; Ghannem, H. Measuring Technical Efficiency for Closuring Yield Gap and Improving Water Productivity of the Irrigated Durum Wheat in Tunisia. Water 2022, 14, 2270. https://doi.org/10.3390/w14142270
Chemak F, Mazhoud H, Rached Z, Gara A, Rahmeni R, Ghannem H. Measuring Technical Efficiency for Closuring Yield Gap and Improving Water Productivity of the Irrigated Durum Wheat in Tunisia. Water. 2022; 14(14):2270. https://doi.org/10.3390/w14142270
Chicago/Turabian StyleChemak, Fraj, Houda Mazhoud, Zouhair Rached, Anissa Gara, Rahma Rahmeni, and Habib Ghannem. 2022. "Measuring Technical Efficiency for Closuring Yield Gap and Improving Water Productivity of the Irrigated Durum Wheat in Tunisia" Water 14, no. 14: 2270. https://doi.org/10.3390/w14142270
APA StyleChemak, F., Mazhoud, H., Rached, Z., Gara, A., Rahmeni, R., & Ghannem, H. (2022). Measuring Technical Efficiency for Closuring Yield Gap and Improving Water Productivity of the Irrigated Durum Wheat in Tunisia. Water, 14(14), 2270. https://doi.org/10.3390/w14142270