
Parametric Vine Copula Framework in the Trivariate Probability Analysis of Compound Flooding Events


Abstract
:1. Introduction
2. Methodological Framework
2.1. Trivariate Joint Probability Analysis via a Fully Nested Copula Framework
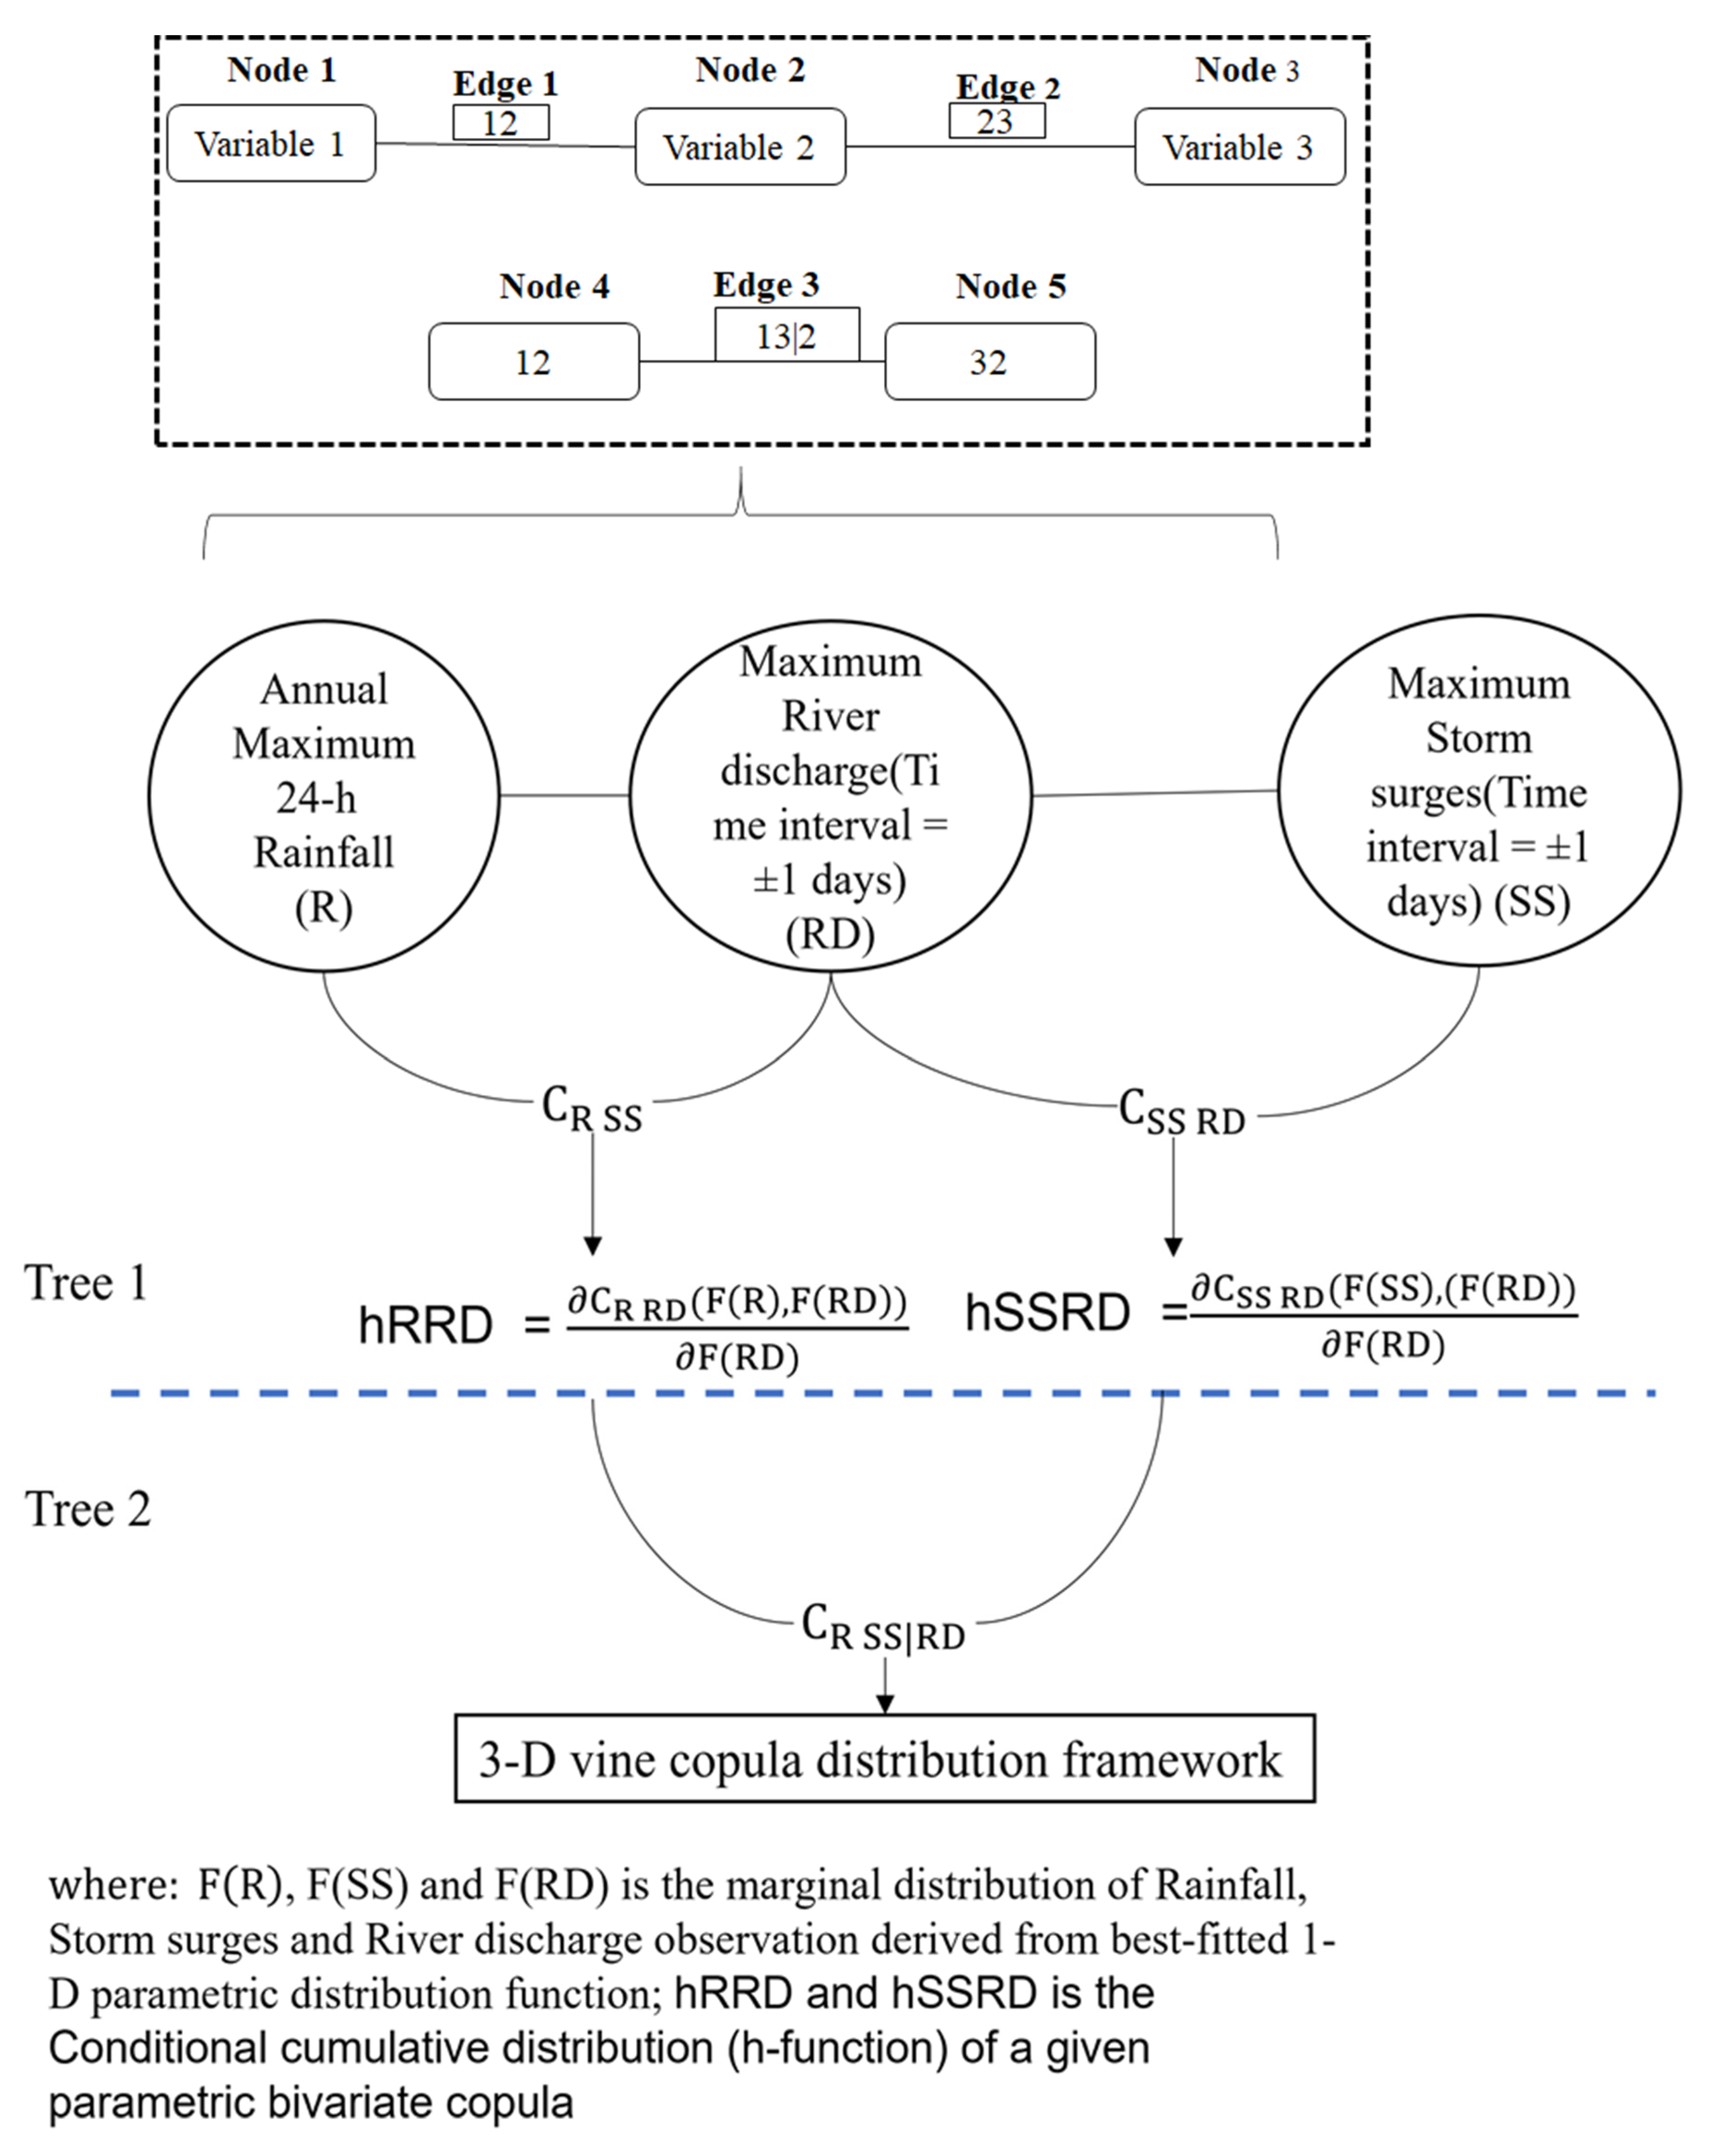
2.2. A 3D Vine Copula Framework for the Trivariate Analysis
2.3. Generating Random Observations from the Selected D-Vine Copula Structure
- Step 1: Estimating the first random variable,
- Step 2: Estimating the second random variable, , where
- Step 3: Estimating the third random variable, , where
- Step 4: Finally, the corresponding value of the flood characteristics (rainfall (R), storm surge (SS), and river discharges (RD)) are estimated by taking the inverse of the univariate marginal cumulative distribution function, Simulated rainfall (R) observations; Simulated storm surge (SS) observation; Simulated river discharge (RD) observations.
2.4. Probabilistic Analysis of Compound Flooding Events
2.4.1. Joint and Conditional Return Periods
2.4.2. Hydrologic Risk Evaluation of Flood Events
3. Application
3.1. Study Area and Delineation of Compound Flooding Characteristics
3.2. Marginal Behaviour of the Targeted Flood Characteristics
3.3. Incorporating Vine Copula in the Trivariate Flood Dependence Structure
3.3.1. Approximating Bivariate Joint Dependence Structure via 2D Copulas
3.3.2. Constructing the D-Vine Copula Structure in the Trivariate Analysis
3.4. Assessing the Hydrologic Risk of Compound Flooding Events
3.4.1. Primary OR and AND Joint Return Period
3.4.2. Conditional Joint Return Periods of CF Events
3.4.3. Analysing the Hydrologic Risk of Flooding Events
4. Research Summary and Conclusions
- No significant trend and serial correlation are identified within the time series of annual maximum 24-h rainfall and maximum river discharge (time interval = ±1 day). Moreover, both series exhibited homogenous behaviour. The maximum storm surge (time interval = ±1 day) showed a significant time trend and non-homogenous behaviour.
- The association among these mutually correlated flood variables is examined and used for dependency structure modelling of 3D copulas. The graphical and analytical investigation found that the dependence structure is statistically significant with positive dependency. Finally, the copula-based methodology is adopted for risk analysis of compound events.
- Firstly, BB7, Gumbel–Hougaard (G–H), and Survival BB7 copula are the most appropriate for describing dependence structures for flood pair rainfall–storm surge, storm surge–river discharge, and rainfall–river discharge, respectively. Besides this, upper tail dependence coefficient assessments confirm that the selected 2D copulas capture the extreme of observed data well. The copula dependence parameters are estimated using the maximum pseudo-likelihood (MPL) estimation procedure.
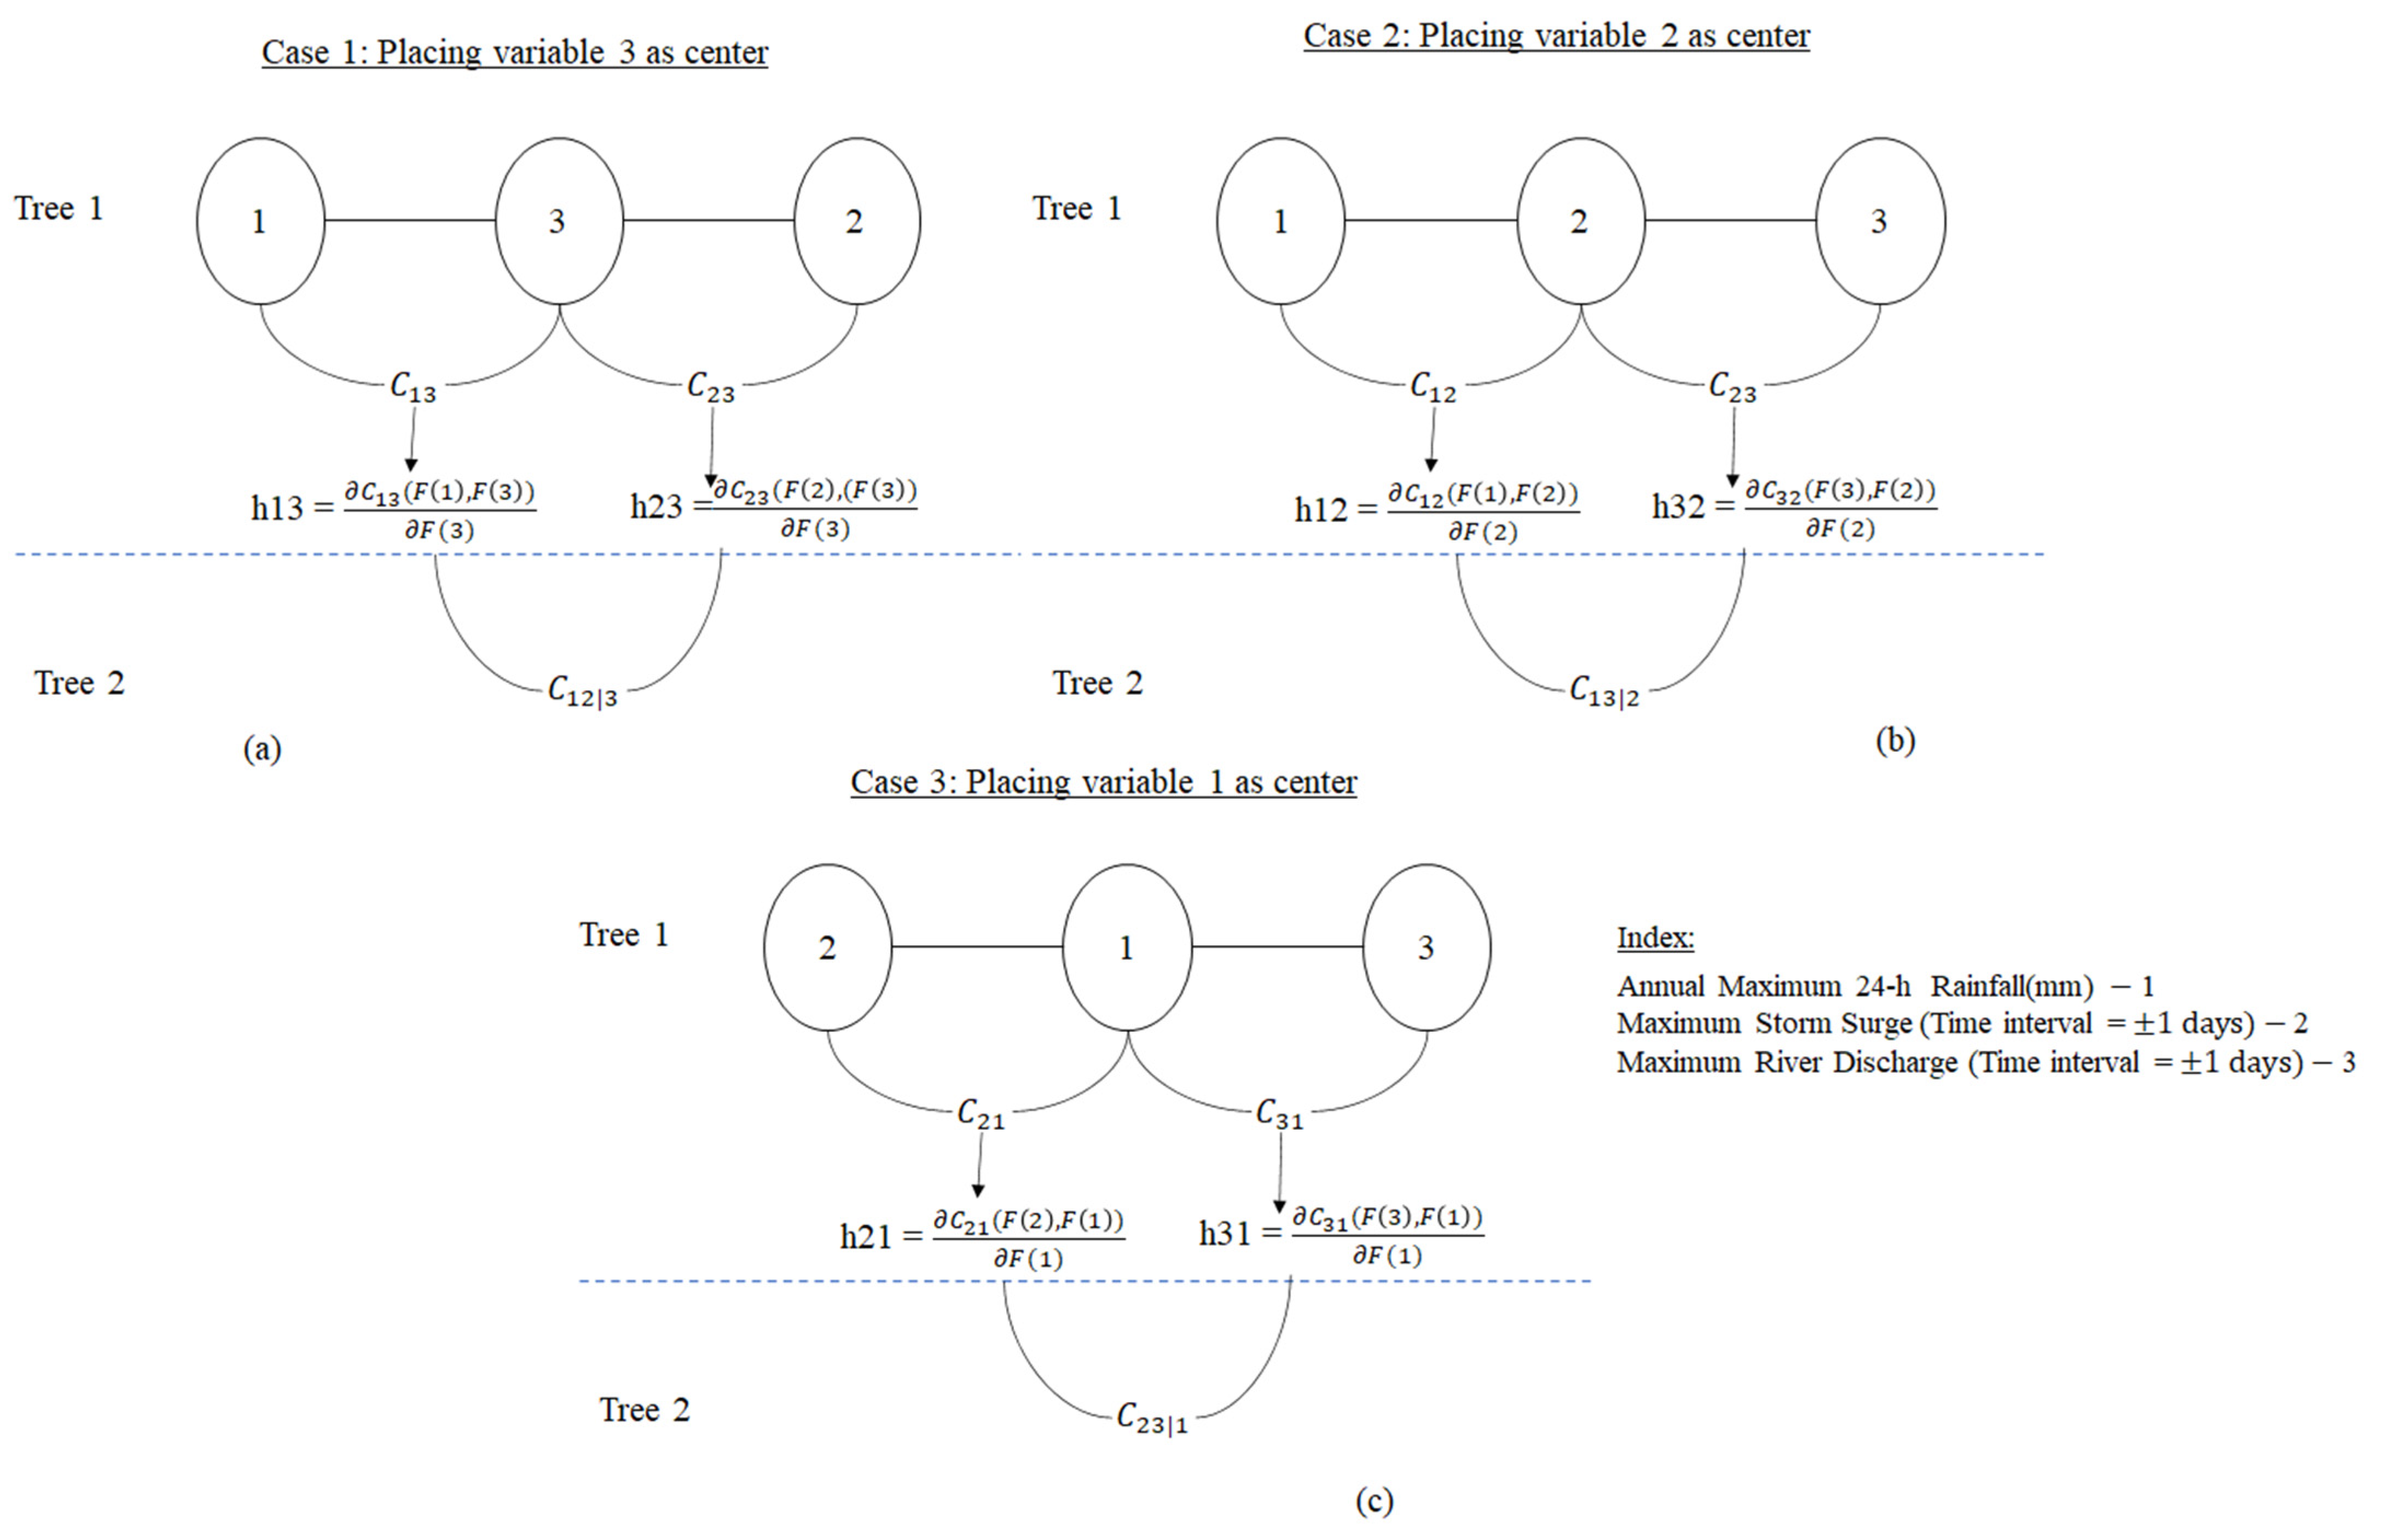
- Three different forms of the D-vine copula are constructed by the permutation of a conditioning variable in the first tree (Tree 1, refer to Figure 3). It is observed that developing a vine structure by changing the location of the conditional variable facilitates high flexibility and is much more practical. The best-fitted D-vine structure is selected by comparing the estimated AIC, BIC, and model LL values. The D-vine structure 1 with river discharge as a conditioning variable is the best. The performance of the selected D-vine structure is compared further with frequently used asymmetric copulas analytically and graphically. The selected D-vine copula structure 1 outperforms asymmetric copulas and is thus employed in estimating trivariate JCDFs and their associated joint and conditional return periods. The D-vine framework can approximate heterogeneous dependency of compound events much better than asymmetric FNA structure due to the conditional mixing approach. In reality, assigning a fixed trivariate structure to the given observation is not a comprehensive way of constructing joint density; the given flood characteristics can exhibit a different strength of dependency between them. Table 4 points out the reliability and suitability of the incorporated vine framework. The selected D-vine structure regenerates the dependence structure of historical flood characteristics more effectively than the FNA framework because of the minimum gap observed between theoretical and empirical Kendal’s correlation measures.
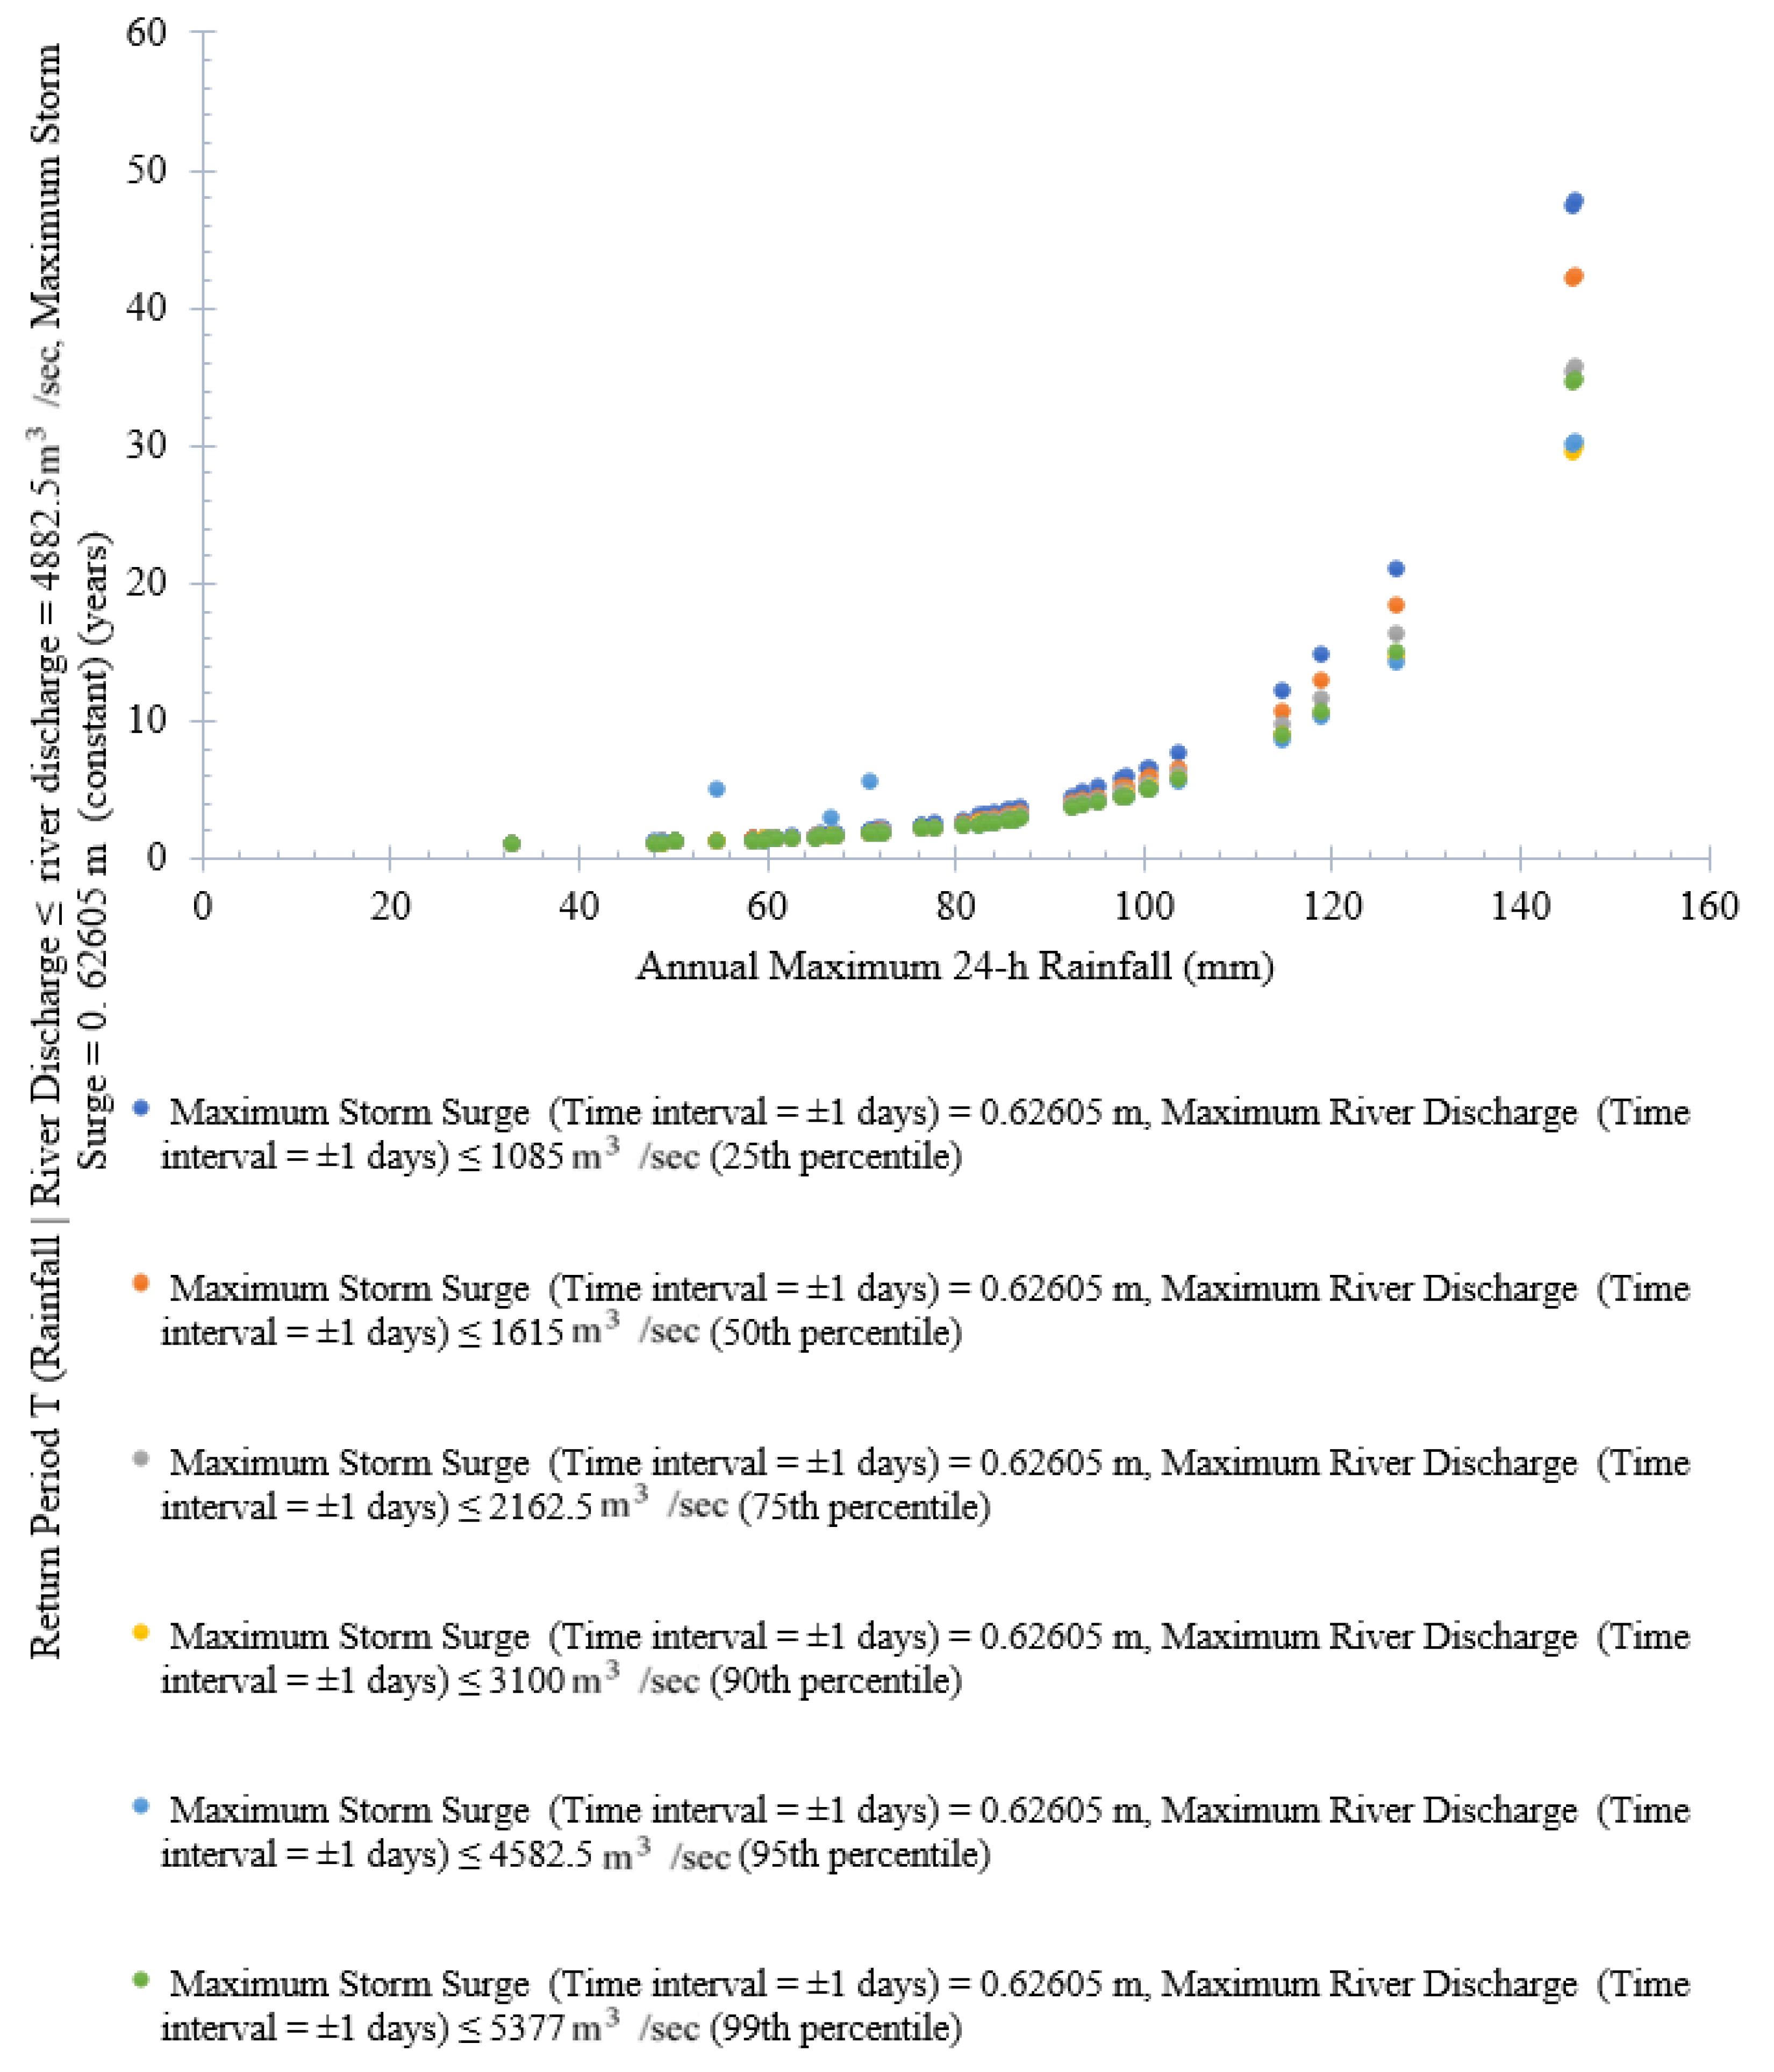
- The return periods for trivariate and bivariate OR- and AND-joint cases and univariate cases are estimated, and comparative analysis is performed. It is concluded that the AND-joint case produces a higher return period than the OR-joint case for the same flood variables. Estimating trivariate return periods of compound events is vital to understand the risk of flood extreme and their magnitude of influence if they occur simultaneously. The return period’s importance depends solely on the nature of the undertaken problem. The importance of different return periods cannot be interchanged, and it is not easy to select them consistently. The appropriate choice of return period can depend on the impact of design variable quantiles. Besides the importance of joint RP, the significance of the conditional joint return periods is often crucial in water infrastructure design. It is found that, at the lower value of both conditional variables, storm surge and river discharge, return periods are higher than those obtained at a lower value of the above conditional variables for the same specified value of the rainfall events. Also, trivariate return periods of rainfall and storm surges, conditional to the river discharge series, increase with a decrease in the value of the conditional variable (river discharge). In addition, the return periods of one variable conditioning to the second variable with the constant value of the third variable are also estimated. In summary, the trivariate return period of rainfall events decreases with an increase in the conditional variable storm surge at the fixed value of river discharge events. Similarly, the trivariate return period of rainfall events is lower at a higher value of river discharge events with a constant value of storm surge events.
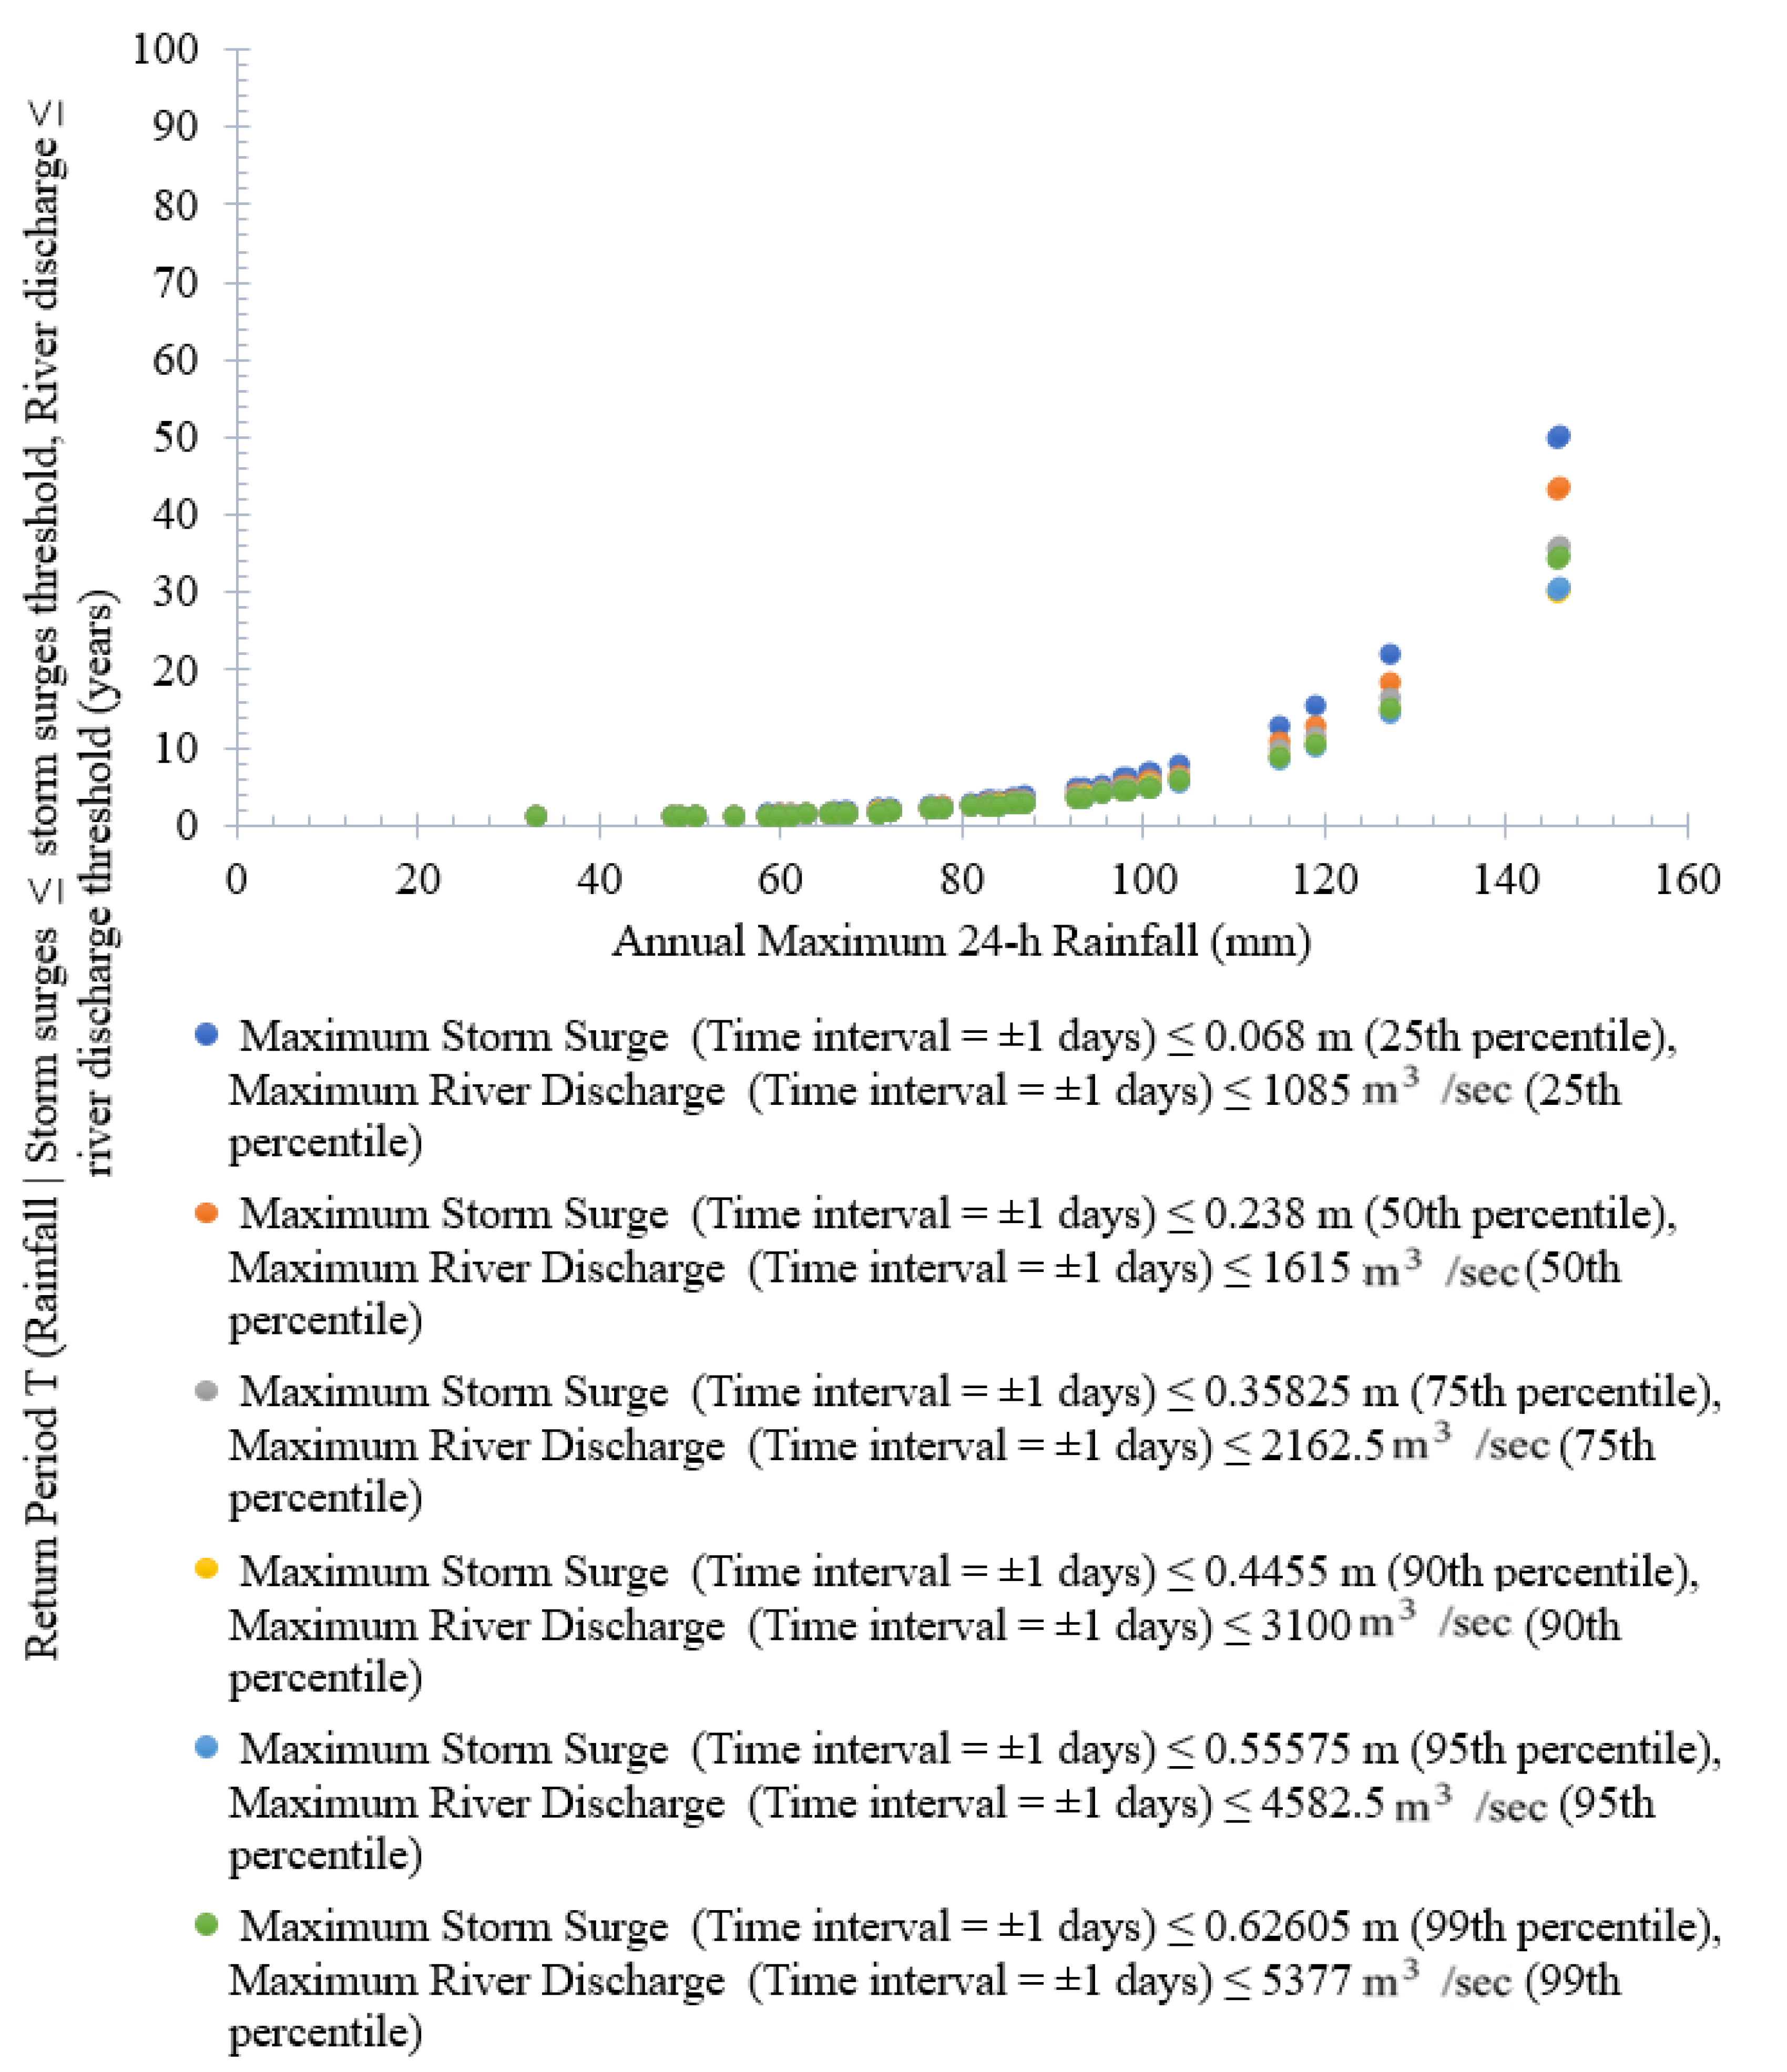
- The conditional return periods for bivariate joint cases are also estimated. It is observed that higher return periods can result in higher rainfall events when conditioning to storm surge events and vice-versa. It is also inferred that higher return periods are obtained when conditioned to rainfall events than when considering storm surge events as a conditioning variable. Similarly, when observing the conditional relationship between river discharge and rainfall events, return periods of river discharge (or rainfall) events are inversely proportional to the percentile value of rainfall (or river discharge) events. It is also observed that higher return periods have resulted when conditioning to rainfall events than river discharge series.
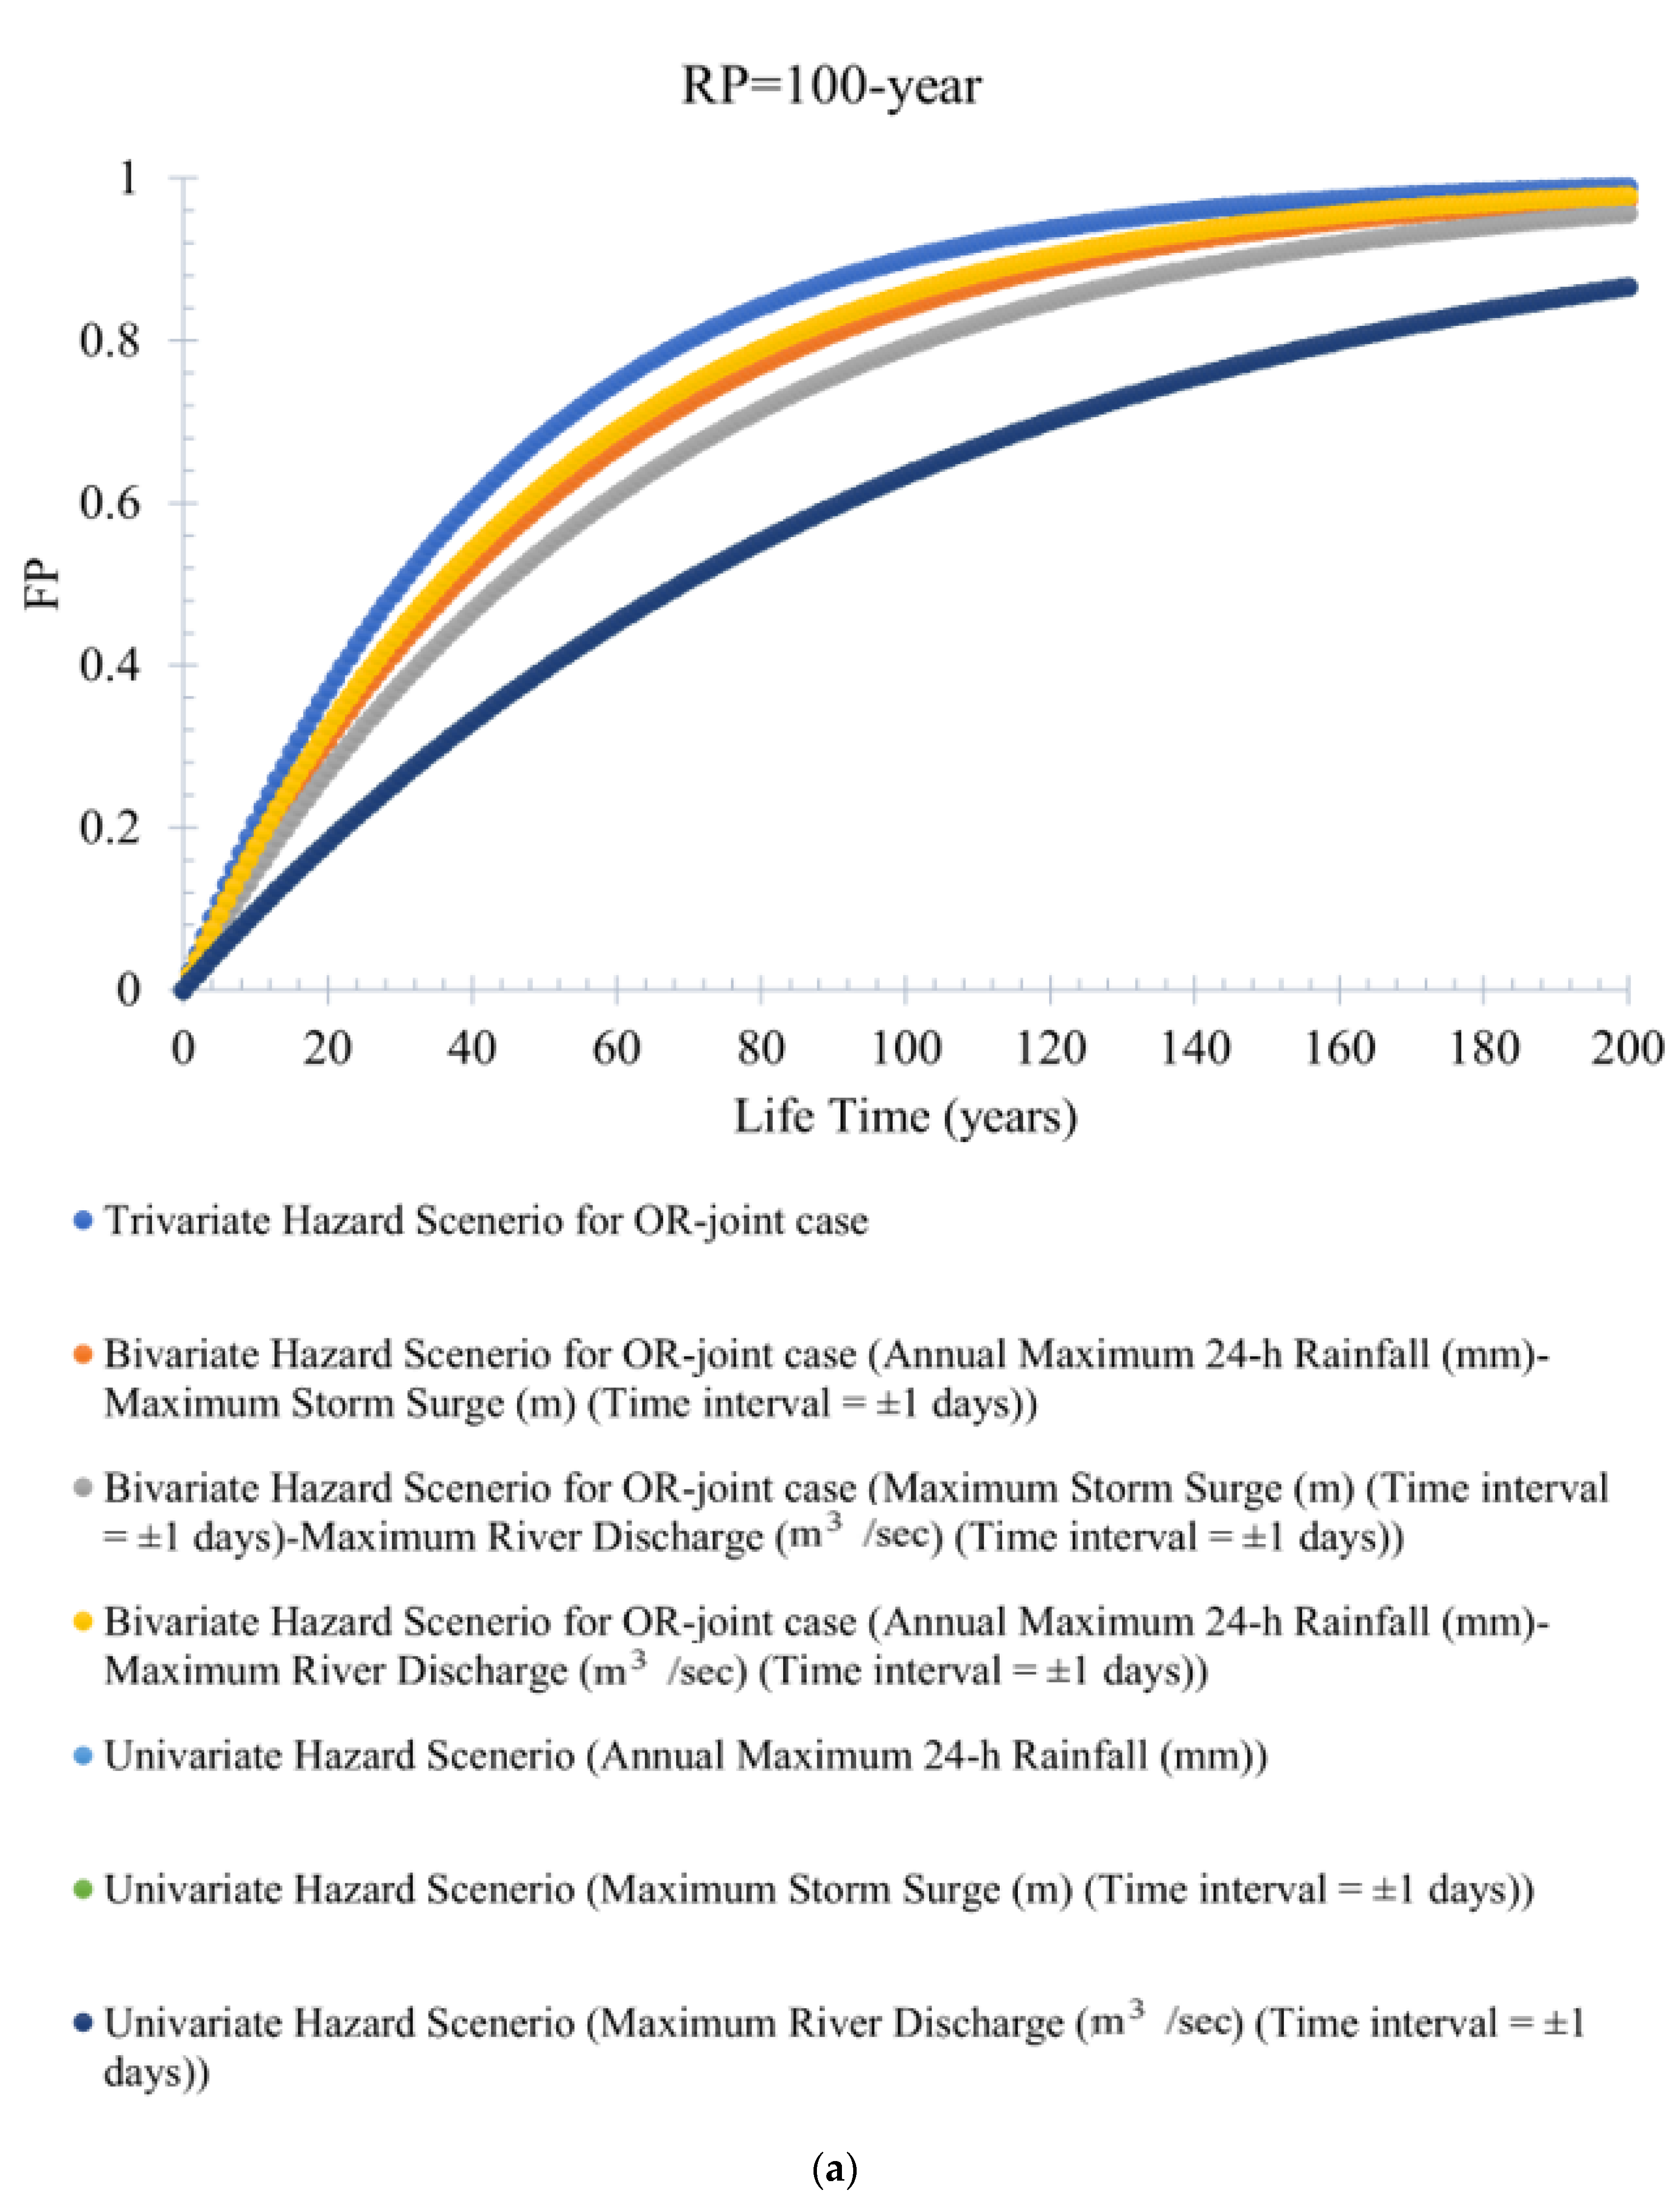
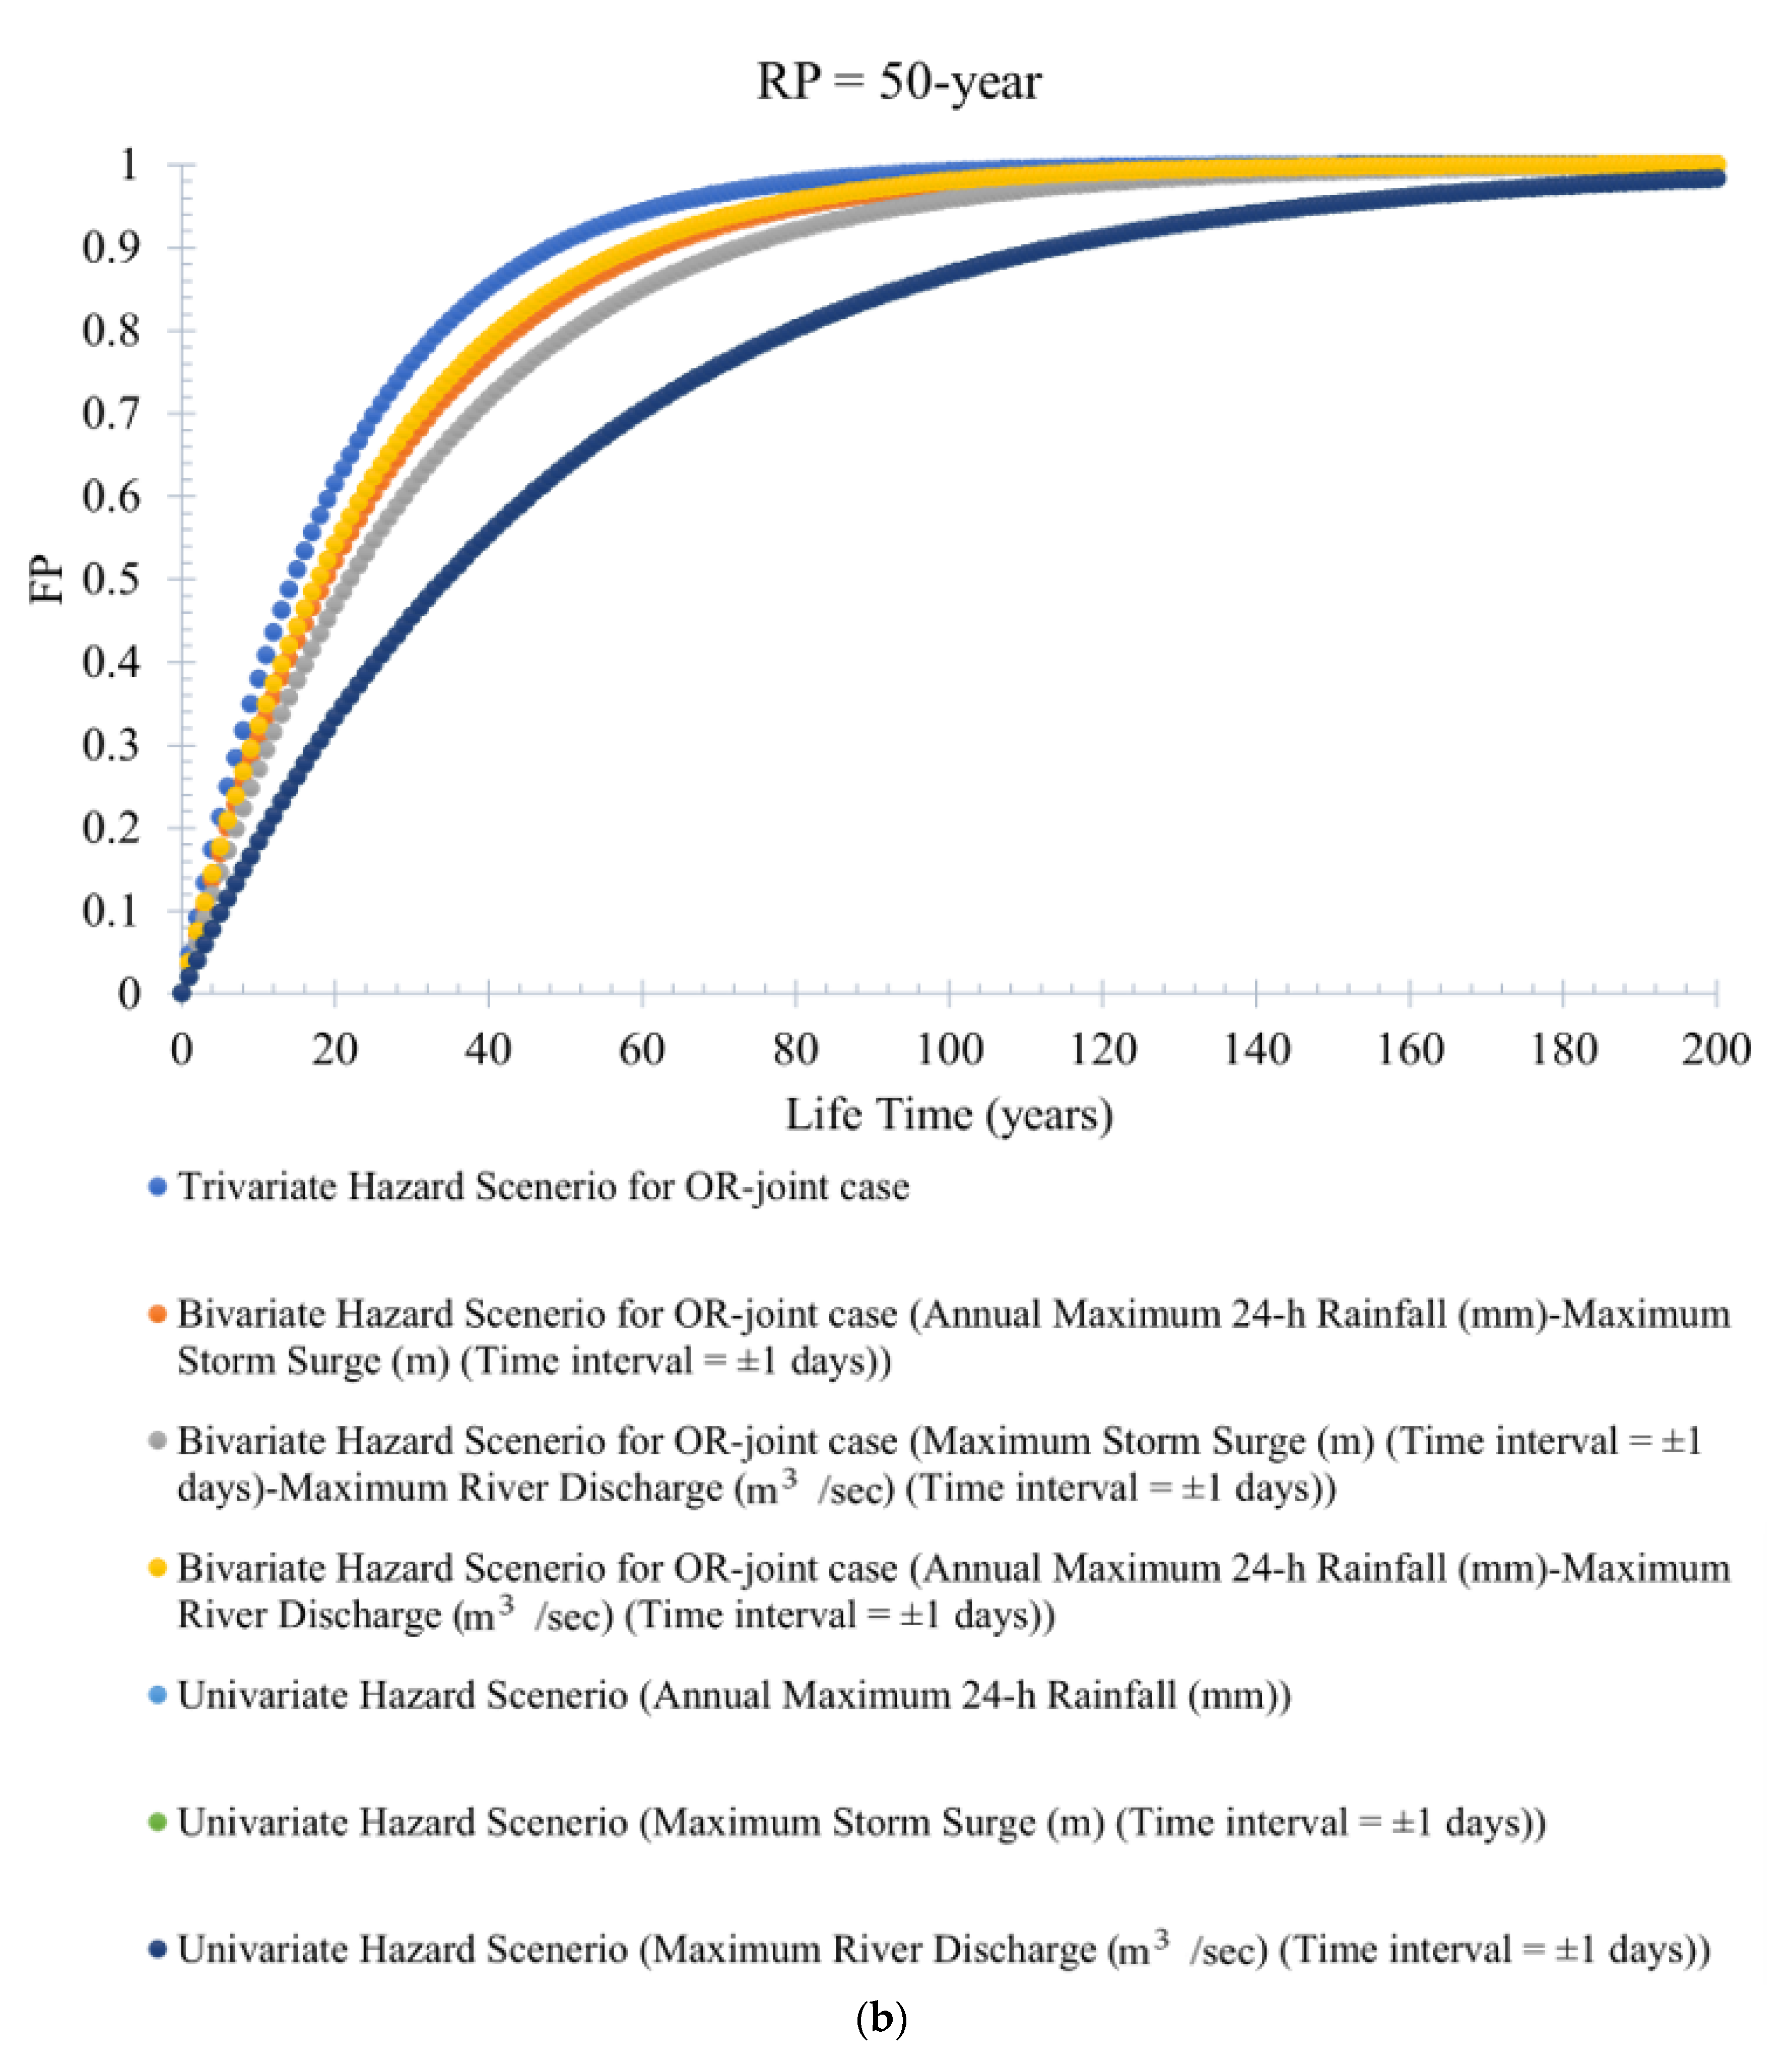
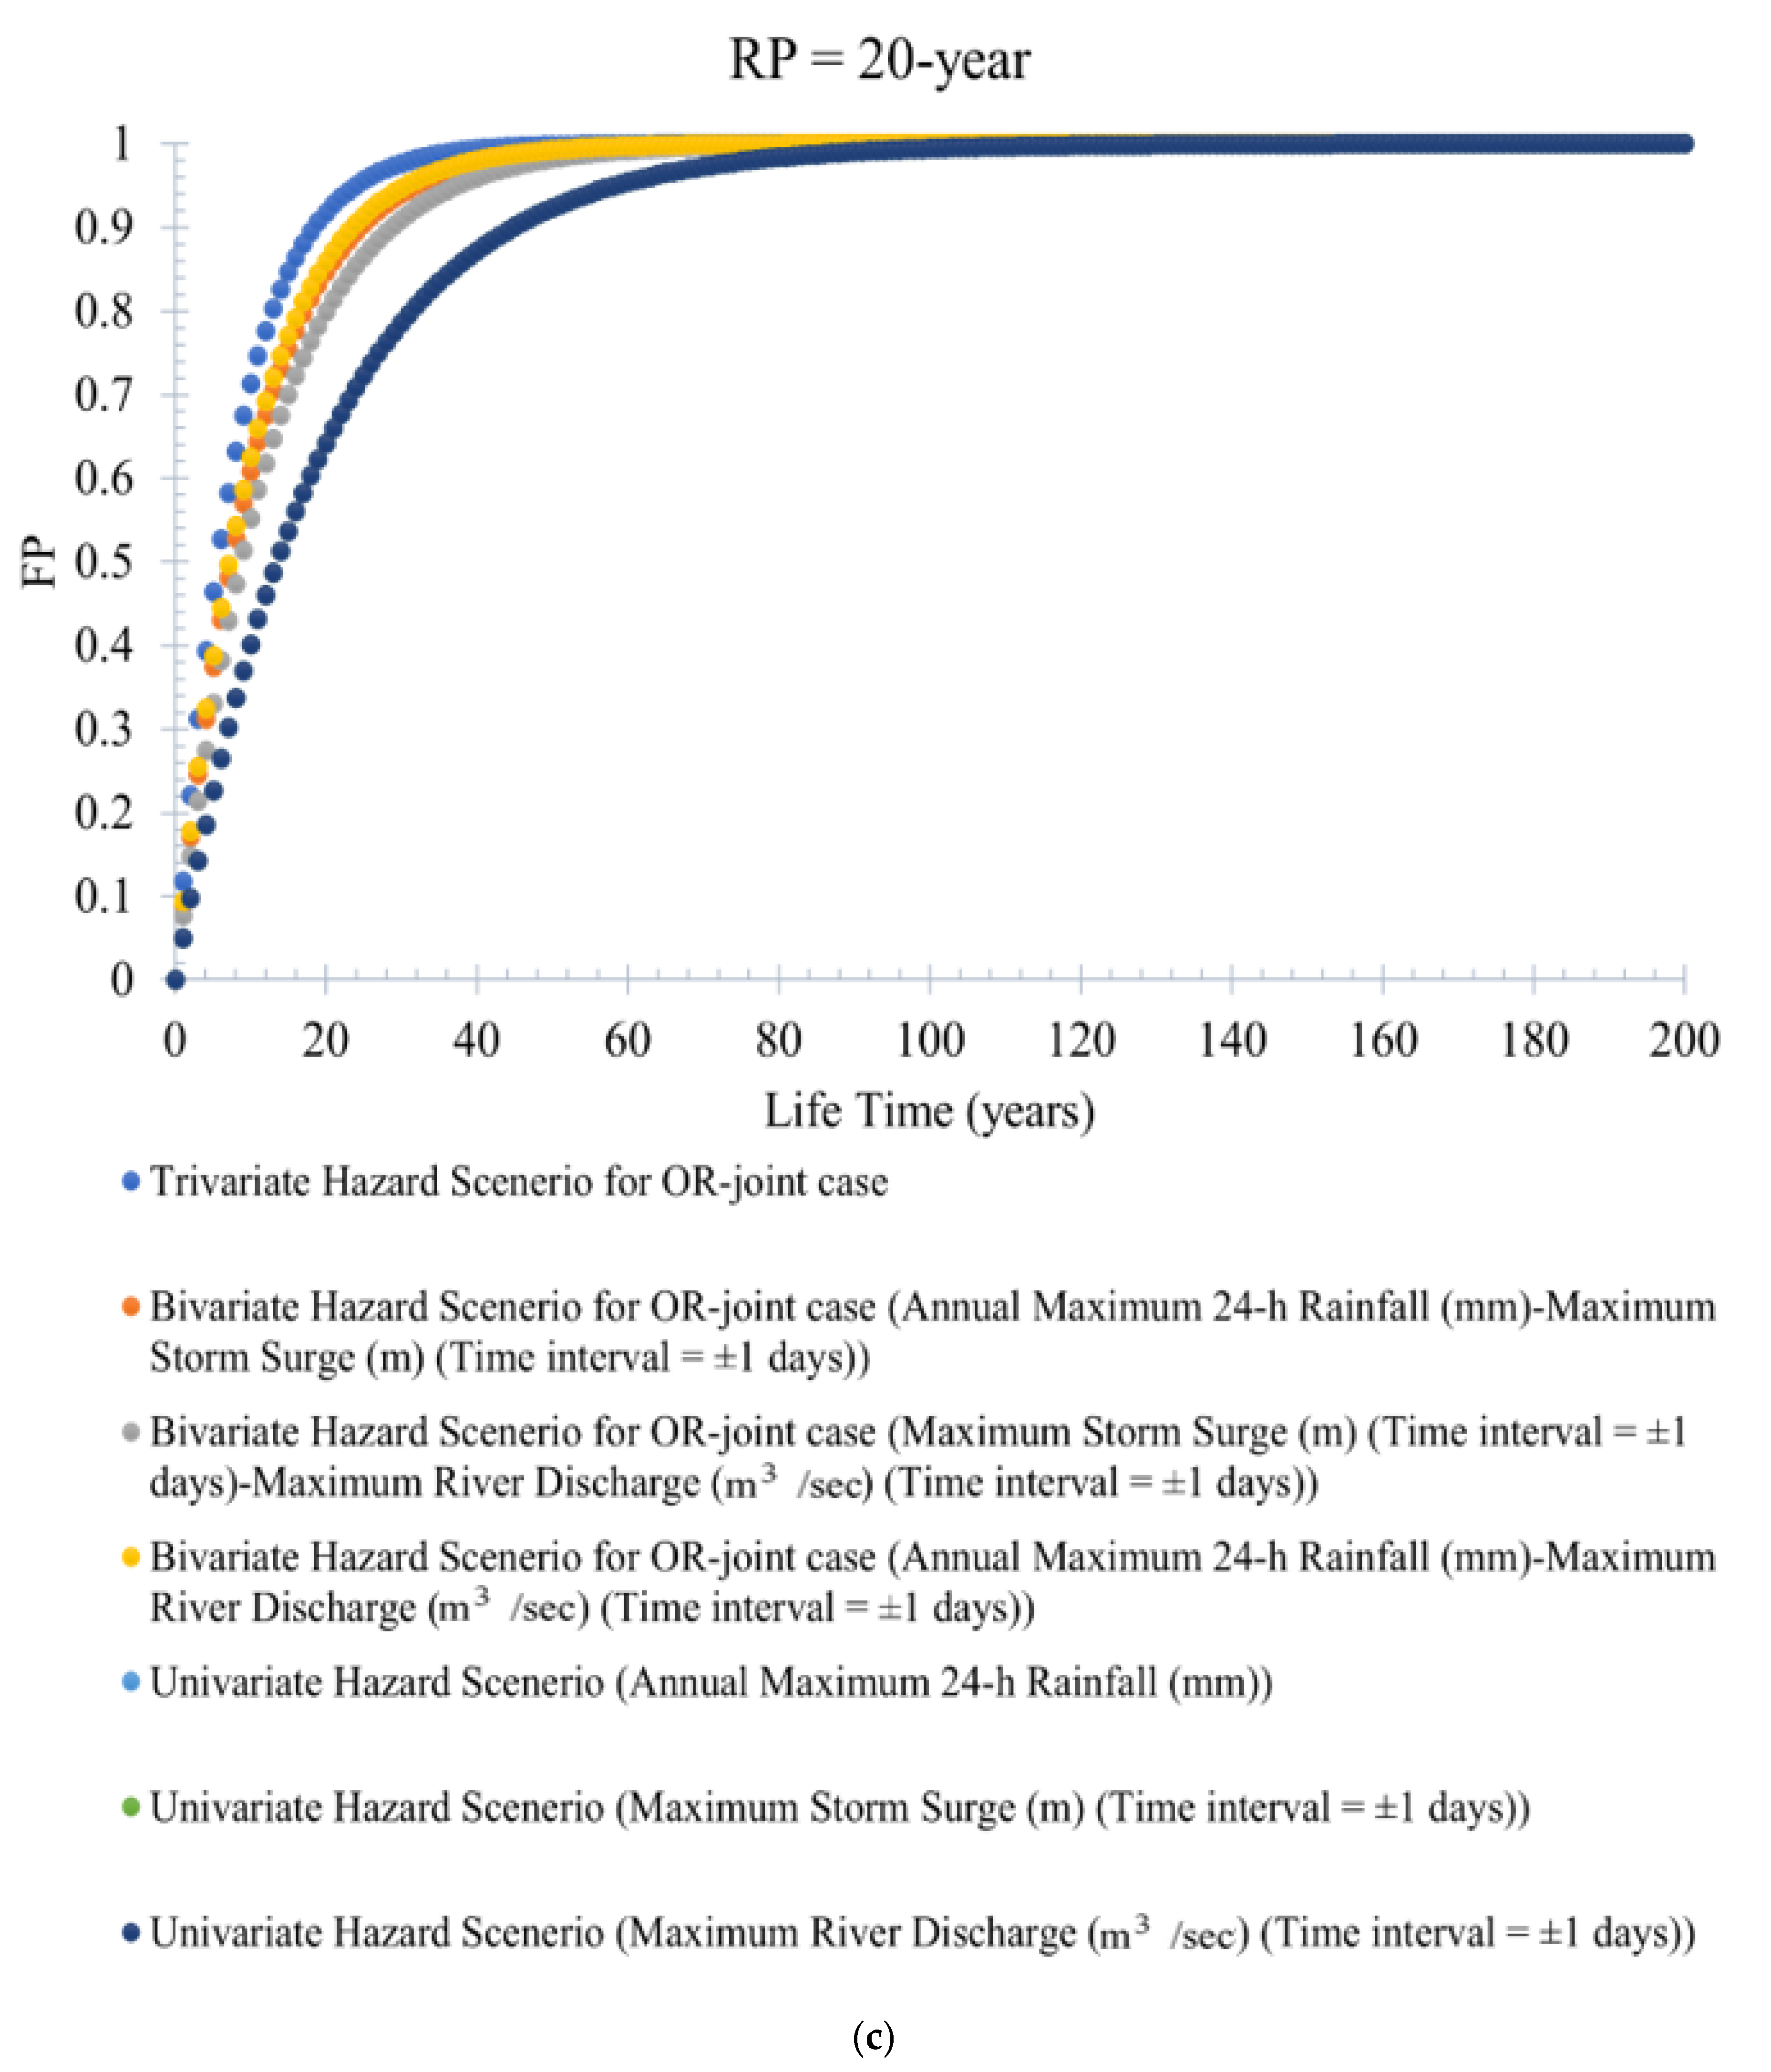
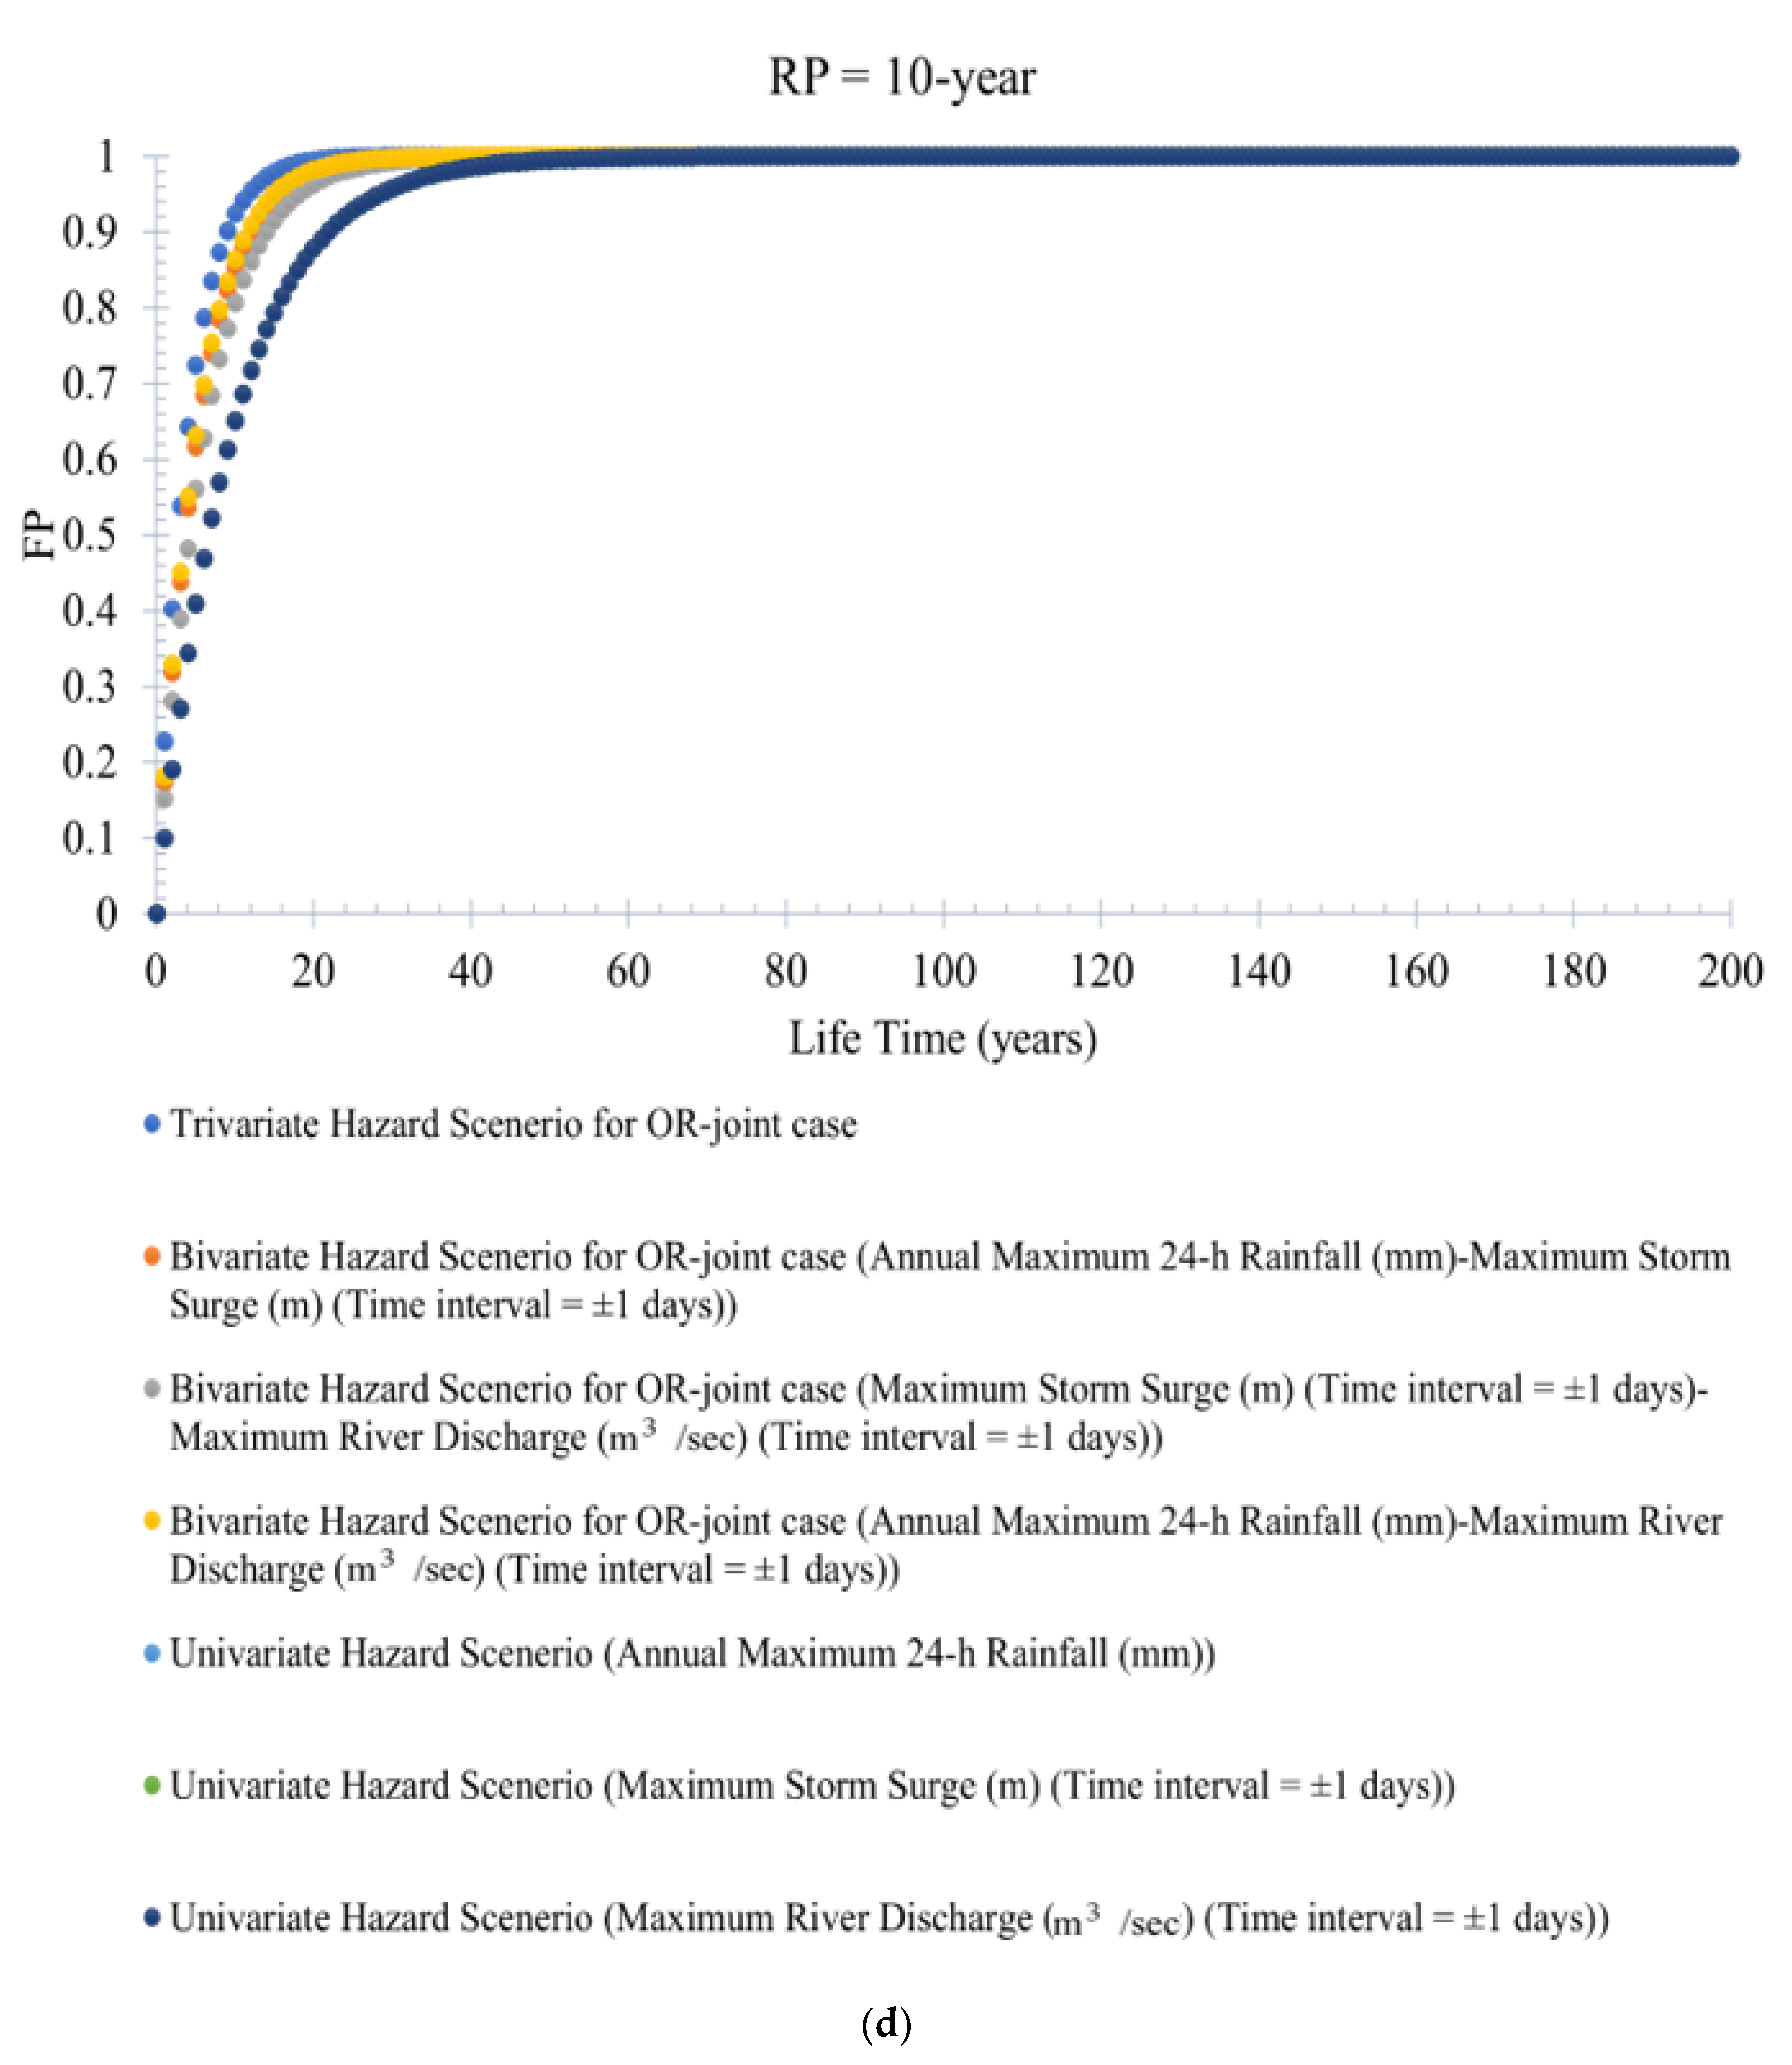
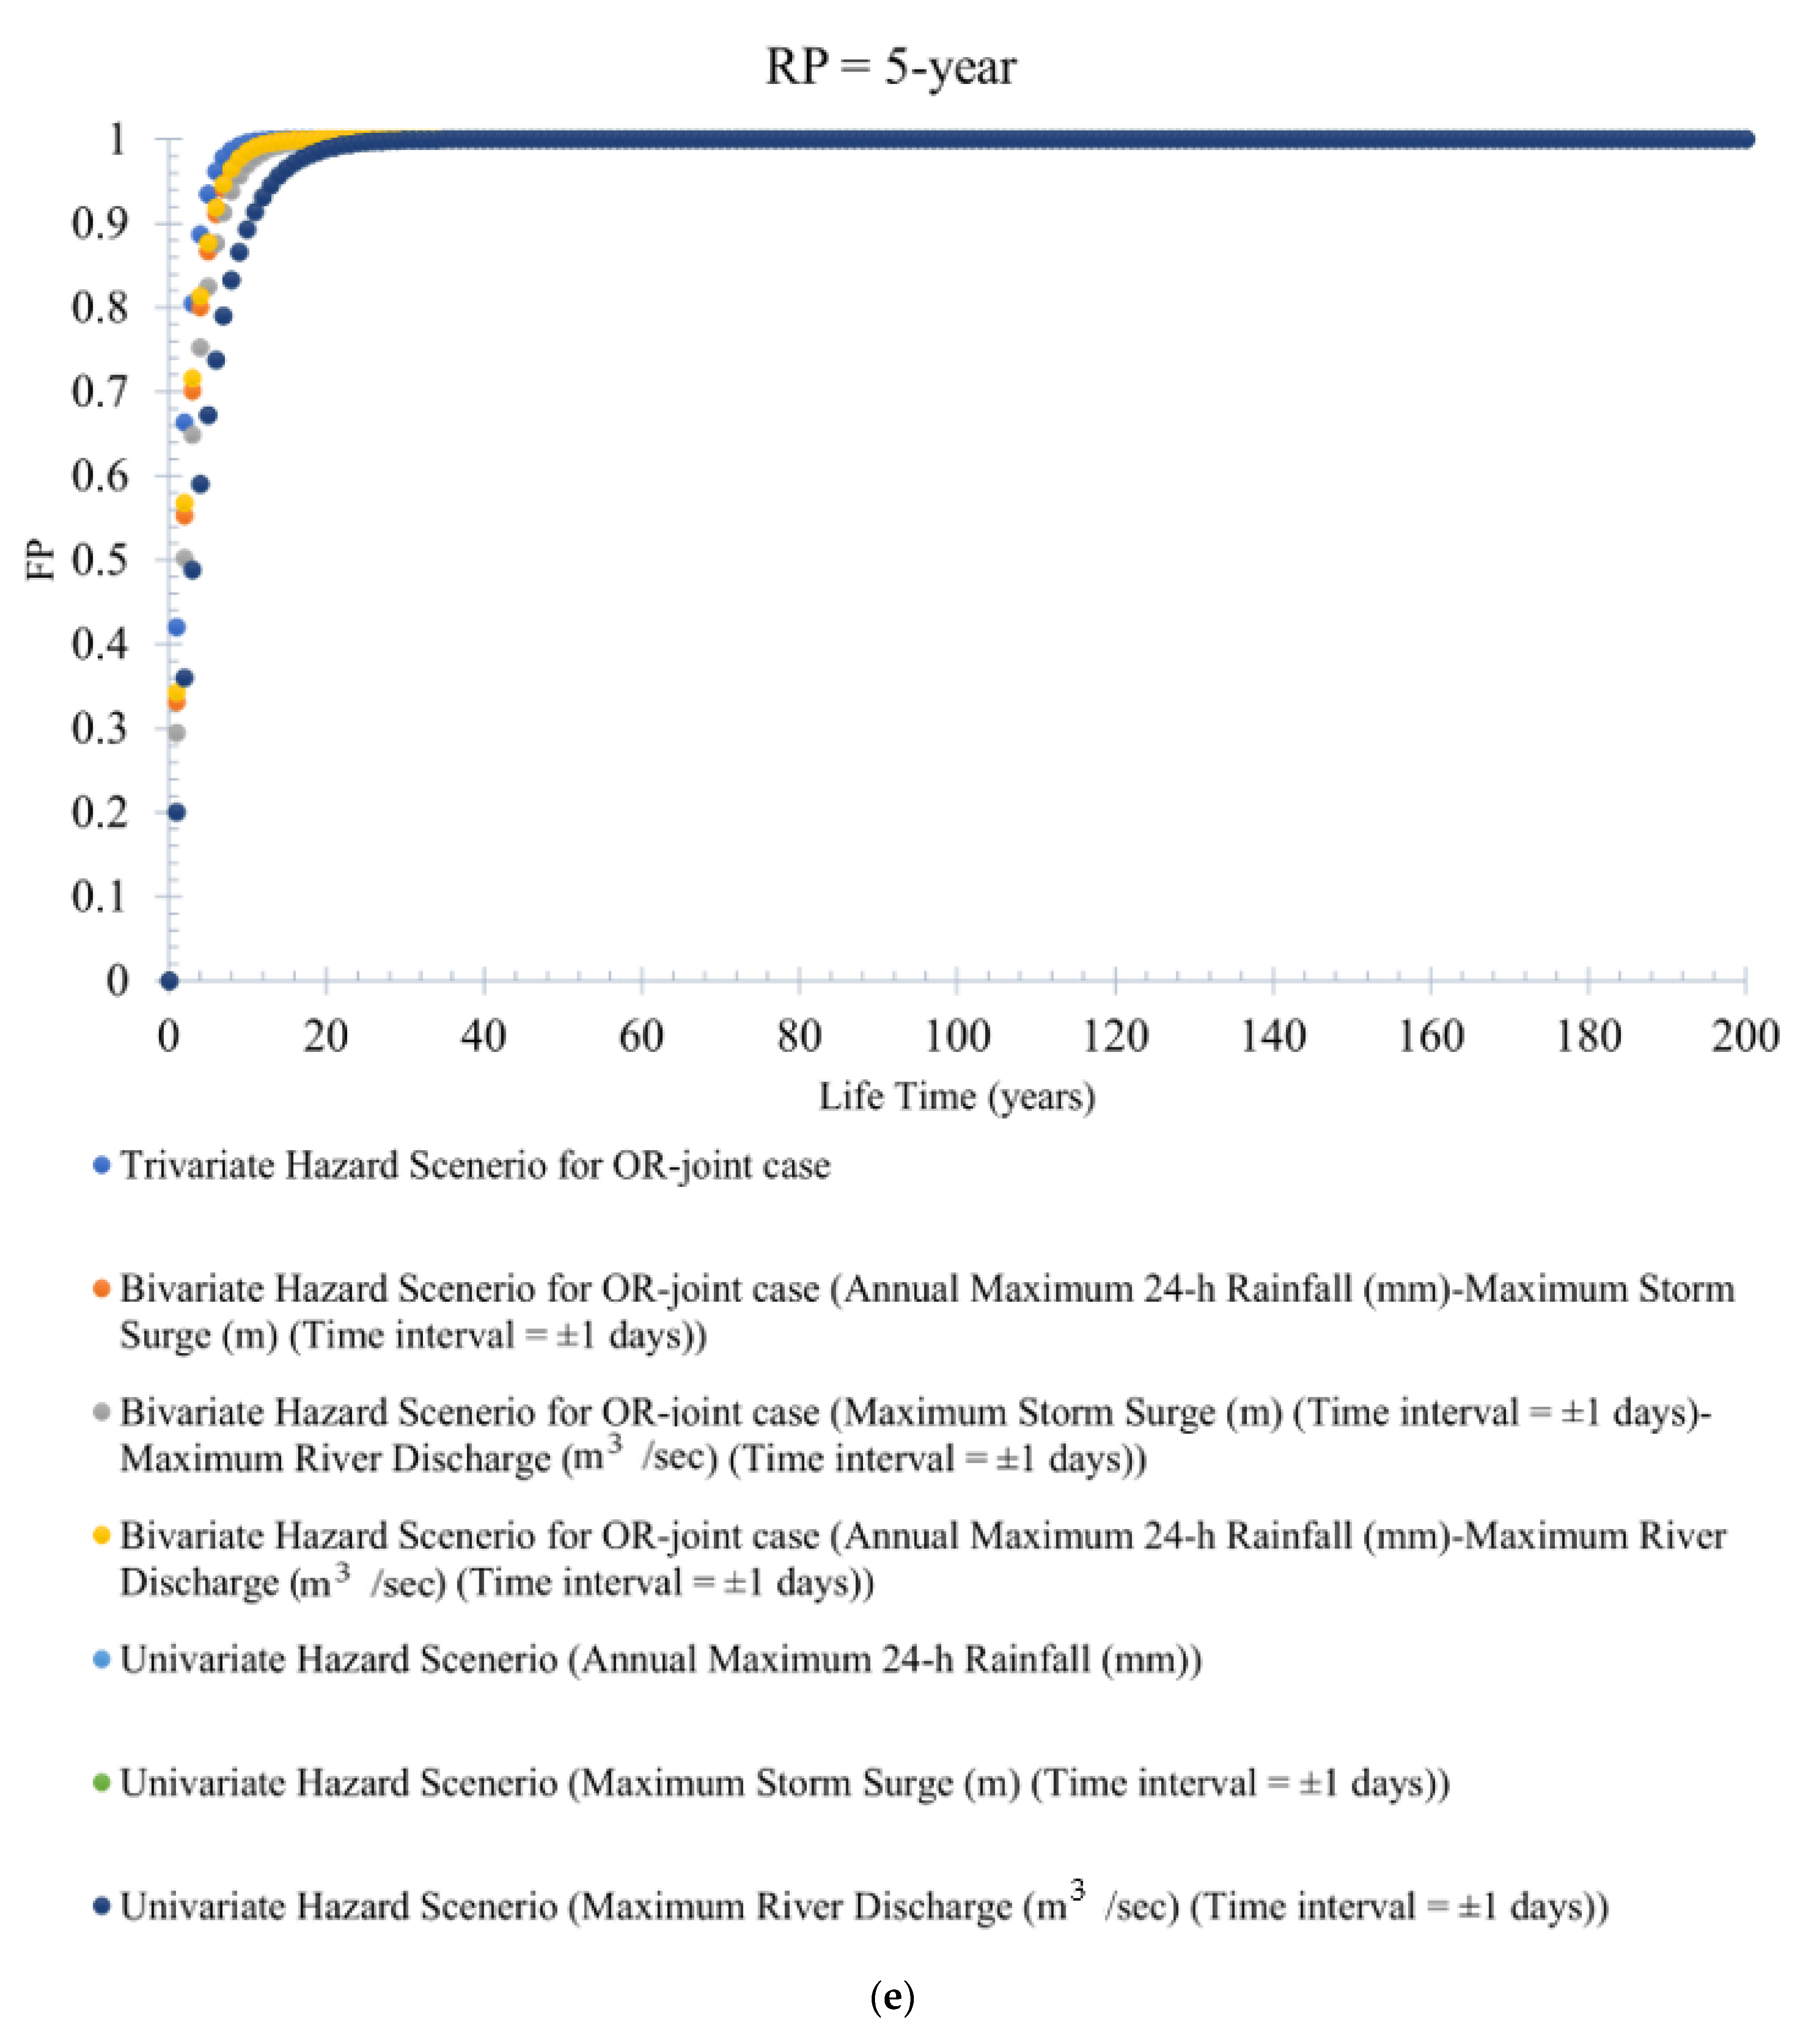
- The estimated trivariate and bivariate joint CDFs are used further to assess the risk of failure associated with trivariate (and bivariate) return periods. It is concluded that the failure probability would be an underestimation if the trivariate joint probability analysis is ignored in compounding the collective impact of the selected flood variables. The trivariate flood events produced higher FP than the bivariate (or univariate) events. The investigation also revealed that trivariate (also bivariate) hydrologic risk decreases with increased return periods. At the same time, FP increases with the increase in the service lifetime of the water infrastructure. Changes in the bivariate hydrologic risk following rainfall events in differently designed storm surges and river discharge are also examined, derived from CDF of best-fitted 2D copulas. Both designed events are considered for different RPs (refer to Figures S17a–c and S18a–c), and three different project design lifetimes are considered (e.g., 100 years, 50 years, and 30 years).
Supplementary Materials
Author Contributions
Funding
Institutional Review Board Statement
Informed Consent Statement
Data Availability Statement
Acknowledgments
Conflicts of Interest
List of Important Symbols and Acronyms
| CF | Compound Flooding |
| CDF | Cumulative Distribution Function |
| JCDF | Joint Cumulative Distribution Function |
| Probability Density Function | |
| FNA | Fully Nested Archimedean |
| FP | Failure Probability |
| PCC | Pair-copula Construction |
| RP | Return Period |
| MLE | Maximum Likelihood Estimation |
| MPL | Maximum Pseudo-likelihood |
| Laplace Transforms | |
| Composite Function | |
| Generator Function of Archimedean Copulas | |
| Inverse of Archimedean’s Copula Generator | |
| Copula Dependence Parameter | |
| C-vine | Canonical Vine |
| D-vine | Drawable Vine |
| CCDF | Conditional Cumulative Distribution Function |
| R | Rainfall or Annual Maximum 24-h Rainfall |
| SS | Storm Surge or Maximum Storm Surge (Time interval = ±1 days) |
| RD | River Discharge or Maximum River Discharge (Time interval = ±1 days) |
| KDE | Kernel Density Estimation |
| UTDC | Upper Tail Dependence Coefficient |
References
- Hendry, A.; Haigh, I.D.; Nicholls, R.J.; Winter, H.; Neal, R.; Wahl, T.; Joly-Laugel, A.; Darby, S.E. Assessing the characteristics and drivers of compound flooding events around the UK coast. Hydrol. Earth Syst. Sci. 2019, 23, 3117–3139. [Google Scholar] [CrossRef] [Green Version]
- Wahl, T.; Jain, S.; Bender, J.; Meyers, S.; Luther, M.E. Increasing risk of compound flooding from storm surge and rainfall for major US cities. Nat. Clim. Change 2015, 5, 1093–1097. [Google Scholar] [CrossRef]
- Moftakhari, H.R.; Salvadori, G.; AghaKouchak, A.; Sanders, B.F.; Matthew, R.A. Compounding effects of sea level rise and fluvial flooding. Proc. Natl. Acad. Sci. USA 2017, 114, 9785–9790. [Google Scholar] [CrossRef] [Green Version]
- Pirani, F.J.; Najafi, M.R. Recent Trends in Individual and Multivariate Compound Flood Drivers in Canada’s Coasts. Water Resour. Res. 2020, 56, WR027785. [Google Scholar] [CrossRef]
- Emanuel, K. Assessing the present and future probability of Hurricane Harvey’s rainfall. Proc. Natl. Acad. Sci. USA 2017, 114, 12681–12684. [Google Scholar] [CrossRef] [PubMed] [Green Version]
- Fritz, H.M.; Blount, C.D.; Thwin, S.; Thu, M.K.; Chan, N. Cyclone Nargis storm surge in Myanmar. Nat. Geosci. 2009, 2, 448–449. [Google Scholar] [CrossRef]
- Jonkman, S.N.; Maaskant, B.; Boyd, E.; Levitan, M.L. Loss of Life Caused by the Flooding of New Orleans After Hurricane Katrina: Analysis of the Relationship Between Flood Characteristics and Mortality. Risk Anal. 2009, 29, 676–698. [Google Scholar] [CrossRef]
- Milly, P.C.D.; Wetherald, R.T.; Dunne, K.A.; Delworth, T.L. Increasing risk of great floods in a changing climate. Nature 2002, 415, 514–517. [Google Scholar] [CrossRef]
- Wilby, R.L.; Beven, K.J.; Reynard, N.S. Climate Change and Fluvial Flood Risk in the UK: More of the Same? Hydro-Log. Processes 2008, 22, 2511–2523. [Google Scholar] [CrossRef]
- Almedia, B.A.; Mostafavi, A. Resilience of infrastructure systems to sea-level rise in coastal areas: Impacts, adapta-tion measures, and implementation challenges. Sustainability 2016, 8, 1115. [Google Scholar]
- Resio, D.T.; Westerink, J.J. Modeling the physics of storm surges. Phys. Today 2008, 61, 33–38. [Google Scholar] [CrossRef] [Green Version]
- Zheng, F.; Westra, S.; Sisson, S.A. Quantifying the between extreme rainfall and storm surge in the coastal zone. J. Hydrol. 2013, 505, 172–187. [Google Scholar] [CrossRef]
- Lian, J.J.; Xu, K.; Ma, C. Joint impact of Rainfall and tidal level on flood risk in a coastal city with a complex river network: A case study of Fuzhou City, China. Hydrol. Earth Syst. Sci. 2013, 17, 679–689. [Google Scholar] [CrossRef] [Green Version]
- Olbert, A.I.; Comer, J.; Nash, S.; Hartnett, M. High-resolution multi-scale modelling of coastal flooding due to tides, storm surges and rivers inflows. A Cork City example. Coast. Eng. 2017, 121, 278–296. [Google Scholar] [CrossRef]
- Coles, S.; Heffernan, J.; Tawn, J. Dependence Measures for Extreme Value Analyses. Extremes 1999, 2, 339–365. [Google Scholar] [CrossRef]
- Coles, S. An Introduction to Statistical Modeling of Extreme Values; Springer: Berlin/Heidelberg, Germany, 2001. [Google Scholar]
- Boldi, M.-O.; Davison, A.C. A mixture model for multivariate extremes. J. R. Stat. Soc. Ser. B 2007, 69, 217–229. [Google Scholar] [CrossRef]
- De Michele, C. A Generalized Pareto intensity-duration model of storm rainfall exploiting 2-Copulas. J. Geophys. Res. 2003, 108, 4067. [Google Scholar] [CrossRef]
- Salvadori, G.; De Michele, C. Frequency analysis via copulas: Theoretical aspects and applications to hydrological events. Water Resour. Res. 2004, 40, W12511. [Google Scholar] [CrossRef]
- Karmakar, S.; Simonovic, S.P. Bivariate flood frequency analysis. Part-2: A copula-based approach with mixed marginal distributions. J. Flood Risk Manag. 2009, 2, 32–44. [Google Scholar] [CrossRef]
- Latif, S.; Mustafa, F. Bivariate joint distribution analysis of the flood characteristics under semiparametric copula distribution framework for the Kelantan River basin in Malaysia. J. Ocean Eng. Sci. 2020, 6, 128–145. [Google Scholar] [CrossRef]
- Xu, H.; Xu, K.; Lian, J.; Ma, C. Compound effects of rainfall and storm tides on coastal flooding risk. Stoch. Environ. Res. Risk Assess. 2019, 33, 1249–1261. [Google Scholar] [CrossRef]
- Serinaldi, F.; Grimaldi, S. Fully Nested 3-Copula: Procedure and Application on Hydrological Data. J. Hydrol. Eng. 2007, 12, 420–430. [Google Scholar] [CrossRef]
- Kao, S.-C.; Govindaraju, R. Trivariate statistical analysis of extreme rainfall events via the Plackett family of copulas. Water Resour. Res. 2008, 44, W02415. [Google Scholar] [CrossRef]
- Genest, C.; Favre, A.C.; Beliveau, J.; Jacques, C. Metaelliptical copulas and their use in frequency analysis of multivariate hydrological data. Water Resour. Res. 2007, 43, W09401. [Google Scholar] [CrossRef] [Green Version]
- Reddy, M.J.; Ganguli, P. Probabilistic assessments of flood risks using trivariate copulas. Theor. Appl. Climatol. 2013, 111, 341–360. [Google Scholar] [CrossRef]
- Whelan, N. Sampling from Archimedean copulas. Quant. Financ. 2004, 4, 339–352. [Google Scholar] [CrossRef]
- Savu, C.; Trede, M. Hierarchies of Archimedean copulas. Quant Financ. 2010, 10, 95–304. [Google Scholar] [CrossRef]
- Hofert, M.; Pham, D. Densities of nested Archimedean copulas. J. Multivar. Anal. 2013, 118, 37–52. [Google Scholar] [CrossRef]
- Joe, H. Multivariate Models and Dependence Concept; CRC Press: Boca Raton, FL, USA, 1997. [Google Scholar]
- Bedford, T.; Cooke, R. Probability density decomposition for conditional dependent random variables modelled by vines. Ann. Math. Artif. Intell. 2001, 32, 245–268. [Google Scholar] [CrossRef]
- Bedford, T.; Cook, R.M. Vines-a new graphical model for dependent random variables. Ann. Stat. 2002, 30, 1031–1068. [Google Scholar] [CrossRef]
- Aas, K.; Berg, D. Models for construction of multivariate dependence—A comparison study. Eur. J. Financ. 2009, 15, 639–659. [Google Scholar] [CrossRef]
- Aas, K.; Czado, K.C.; Frigessi, A.; Bakken, H. Pair-copula constructions of multiple dependence. Insur. Math. Econ. 2009, 44, 182–198. [Google Scholar] [CrossRef] [Green Version]
- Daneshkhan, A.; Remesan, R.; Omid, C.; Holman, I.P. Probabilistic modelling of food characteristics with parametric and minimum information pair-copula model. J. Hydrol. 2016, 540, 469–487. [Google Scholar] [CrossRef] [Green Version]
- Tosunoglu, F.; Gürbüz, F.; Ispirli, M.N. Multivariate modeling of flood characteristics using Vine copulas. Environ. Earth Sci. 2020, 79, 1–21. [Google Scholar] [CrossRef]
- Saghafian, B.; Mehdikhani, H. Drought characterization using a new copula-based trivariate approach. Nat. Hazards 2013, 72, 1391–1407. [Google Scholar] [CrossRef]
- Vernieuwe, H.; Vandenberghe, S.; De Baets, B.; Verhoest, N.E.C. A continuous rainfall model based on vine copulas. Hydrol. Earth Syst. Sci. 2015, 19, 2685–2699. [Google Scholar] [CrossRef] [Green Version]
- Bevacqua, E.; Maraun, D.; Hobæk Haff, I.; Widmann, M.; Vrac, M. Multivariate statistical modelling of compound events via pair-copula constructions: Analysis of floods in Ravenna (Italy). Hydrol. Earth Syst. Sci. 2017, 21, 2701–2723. [Google Scholar] [CrossRef] [Green Version]
- Jane, R.; Cadavid, L.; Obeysekera, J.; Wahl, T. Multivariate statistical modelling of the drivers of compound flood events in south Florida. Nat. Hazards Earth Syst. Sci. 2020, 20, 2681–2699. [Google Scholar] [CrossRef]
- Public Safety Report Canada. 2021. Available online: https://www.publicsafety.gc.ca/cnt/mrgnc-mngmnt/ntrl-hzrds/fld-en.aspx (accessed on 15 April 2021).
- Lemmen, D.S.; Warren, F.J.; James, T.S.; Mercer Clarke, C.S.L. (Eds.) Canada’s Marine Coasts in a Changing Climate; Government of Canada: Ottawa, ON, Canada, 2016; 274p.
- Atkinson, D.E.; Forbes, D.L.; James, T.S. Dynamic coasts in a changing climate. In Canada’s Marine Coasts in a Changing Climate; Lemmen, D.S., Warren, F.J., James, T.S., Mercer Clarke, C.S.L., Eds.; Government of Canada: Ottawa, ON, Canada, 2016; pp. 27–68. [Google Scholar]
- British Columbia Ministry of Environment. Sea Level Rise Adaptation Primer, a Tool Kit to Build Adaptive Capacity on Canada’s South Coasts. 2013. Available online: https://www2.gov.bc.ca/assets/gov/environment/climate-change/adaptation/resources/slr-primer.pdf (accessed on 14 April 2021).
- Shahid, L.; Simonovic, S.P. Compounding joint impact of rainfall, storm surge and river discharge on coastal flood risk: An approach based on 3D Fully Nested Archimedean Copulas. Environ. Earth Sci. 2022; preprint. [Google Scholar] [CrossRef]
- Saklar, A. Functions de repartition n dimensions et leurs marges. Publ. L’institut Stat. L’université Paris 1959, 8, 229–231. [Google Scholar]
- Nelsen, R.B. An Introduction to Copulas; Springer: New York, NY, USA, 2006. [Google Scholar]
- Klein, B.; Schumann, A.H.; Pahlow, M. Copulas-New Risk Assessment Methodology for Dam Safety, Food Risk Assessment and Management; Springer: New York, NY, USA, 2011; pp. 149–185. [Google Scholar]
- Kojadinovic, I.; Yan, J. Modeling multivariate distributions with continuous margins using the copula R package. J. Stat. Softw. 2010, 34, 1–20. [Google Scholar] [CrossRef] [Green Version]
- Reddy, M.J.; Ganguli, P. Bivariate Flood Frequency Analysis of Upper Godavari River Flows Using Archimedean Copulas. Water Resour. Manag. 2012, 26, 3995–4018. [Google Scholar] [CrossRef]
- Venter, G.; Barnett, J.; Kreps, R.; Major, J. Multivariate copulas for financial modeling. Variance 2007, 1, 103–119. [Google Scholar]
- Gräler, B.; Berg, M.J.V.D.; Vandenberghe, S.; Petroselli, A.; Grimaldi, S.; De Baets, B.; Verhoest, N.E.C. Multivariate return periods in hydrology: A critical and practical review focusing on synthetic design hydrograph estimation. Hydrol. Earth Syst. Sci. 2013, 17, 1281–1296. [Google Scholar] [CrossRef] [Green Version]
- Czado, C.; Jeske, S.; Hofmann, M. Selection strategies for regular vine copulae. J. French Society Stat. 2013, 154, 174–190. [Google Scholar]
- Kurowicka, D.; Cooke, R. Uncertainty Analysis with High Dimensional Dependence Modelling; John Wiley: Hoboken, NJ, USA, 2006. [Google Scholar]
- De Michele, C.; Salvadori, G.; Passoni, G.; Vezzoli, R. A multivariate model of sea storms using copulas. Coast Eng. 2007, 54, 734–751. [Google Scholar] [CrossRef]
- Shiau, J.T. Return period of bivariate distributed hydrological events. Stoch. Environ. Res. Risk Assess 2003, 17, 42–57. [Google Scholar] [CrossRef]
- Salvadori, G. Bivariate return periods via-2 copulas. J. R. Stat. Soc. Ser. B 2004, 1, 129–144. [Google Scholar] [CrossRef]
- Zhang, L.; Singh, V.P. Trivariate flood frequency analysis using the Gumbel-Hougaard copula. J. Hydrol. Eng. 2007, 12, 431–439. [Google Scholar] [CrossRef]
- Salvadori, G.; De Michele, C. Multivariate multiparameter extreme value models and return periods: A copula approach. Water Resour. Res. 2010, 46, W10501. [Google Scholar] [CrossRef]
- Sraj, M.; Bezak, N.; Brilly, M. Bivariate flood frequency analysis using the copula function: A case study of the Litija station on the Sava River. Hydrol. Process. 2014, 29, 225–238. [Google Scholar] [CrossRef]
- Brunner, M.I.; Seibert, J.; Favre, A. Bivariate return periods and their importance for flood peak and volume estimation. WIREs Water 2016, 3, 819–833. [Google Scholar] [CrossRef] [Green Version]
- Salvadori, G.; De Michele, C.; Durante, F. Multivariate design via copulas. Hydrol. Earth Syst. Sci. Disc. 2011, 8, 5523–5558. [Google Scholar]
- Qiang, H.; Zishen, C. Multivariate flood risk assessment based on the secondary return period. J. Lake Sci. 2015, 27, 352–360. [Google Scholar] [CrossRef]
- Read, L.K.; Vogel, R.M. Reliability, return periods, and risk under nonstationarity. Water Resour. Res. 2015, 51, 6381–6398. [Google Scholar] [CrossRef]
- Yen, B.C. Risk analysis in design of engineering projects. J. Hydrol. Eng. 1970, 96, 959–966. [Google Scholar]
- Salvadori, G.; Durante, F.; De Michele, C.; Bernardi, M.; Petrella, L. A multivariate copula-based framework for dealing with hazard scenarios and failure probabilities. Water Resour. Res. 2016, 52, 3701–3721. [Google Scholar] [CrossRef] [Green Version]
- Serinaldi, F. Dismissing return periods! Stoch. Hydrol. Hydraul. 2014, 29, 1179–1189. [Google Scholar] [CrossRef] [Green Version]
- Xu, Y.; Huang, G.; Fan, Y. Multivariate flood risk analysis for Wei River. Stoch. Hydrol. Hydraul. 2015, 31, 225–242. [Google Scholar] [CrossRef]
- Ljung, G.M.; Box, G.E.P. On a measure of lack of ft in time series models. Biom. Etrika 1978, 65, 297–303. [Google Scholar]
- Mann, H.B. Nonparametric test against trend. Econometrics 1945, 13, 245–259. [Google Scholar] [CrossRef]
- Kendall, M.G. Rank Correlation Methods, 4th ed.; Charles Griffn: London, UK, 1975. [Google Scholar]
- Hamed, K.H.; Rao, A.R. A modified Mann-Kendall trend test for autocorrelated data. J. Hydrol. 1998, 204, 182–196. [Google Scholar] [CrossRef]
- Pettitt, A.N. A Non-Parametric Approach to the Change-Point Problem. Appl. Stat. 1979, 28, 126–135. [Google Scholar] [CrossRef]
- Alexandersson, H. A homogeneity test applied to precipitation data. J. Clim. 1986, 6, 661–675. [Google Scholar] [CrossRef]
- Buishand, T.A. Some methods for testing the homogeneity of rainfall records. J. Hydrol. 1982, 58, 11–27. [Google Scholar] [CrossRef]
- Jaiswal, R.K.; Lohani, A.K.; Tiwari, H.L. Statistical Analysis for Change Detection and Trend Assessment in Climatological Parameters. Environ. Process. 2015, 2, 729–749. [Google Scholar] [CrossRef] [Green Version]
- Anderson, T.W.; Darling, D.A. A test of goodness of fit. J. Am. Stat. Assoc. 1954, 49, 765–769. [Google Scholar] [CrossRef]
- Cramér, H. On the composition of elementary errors. Scand. Actuar. J. 1928, 1928, 13–74. [Google Scholar] [CrossRef]
- Von Mises, R.E. Wahrscheinlichkeit, Statistik und Wahrheit; Julius Springer: Berlin, Germany, 1928. [Google Scholar]
- Fisher, N.I.; Switzer, P. Graphical assessments of dependence: Is a picture worth 100 tests? Am. Stat. 2001, 55, 233–239. [Google Scholar] [CrossRef]
- Genest, C.; Boies, J.C. Detecting dependence with Kendall plots. Am. Stat. 2003, 57, 275–284. [Google Scholar] [CrossRef]
- Constantino, M.; Larran, M.; Brebbia, C.A. Computational Fnance and Its Applications III, Volume 41 of WIT Transactions on Information and Communication Technologies; WIT Press: Southampton, UK, 2008. [Google Scholar]
- Tang, Y.; Huynh, V.N.; Lawry, J. Integrated Uncertainty in Knowledge Modelling and Decision Making—4th International Symposium, Proceedings, LNAI 9376; Springer: Berlin, Germany, 2015. [Google Scholar]
- Li, F. Modeling Covariate-Contingent Correlation and Tail Dependence with Copulas. 2016. Available online: https://arxiv.org/pdf/1401.0100.pdf (accessed on 22 May 2021).
- Genest, C.; Rémillard, B. Validity of the parametric bootstrap for goodness-of-ft testing in semiparametric models. Ann. L’inst Henri. Poincare Prob. Stat. 2008, 44, 1096–1127. [Google Scholar]
- Genest, C.; Rémillard, B.; Beaudoin, D. Goodness-of-ft tests for copulas: A review and a power study. Insur. Math. Econ. 2009, 44, 199–214. [Google Scholar] [CrossRef]
- Poulin, A.; Huard, D.; Favre, A.C.; Pugin, S. Importance of tail dependence in bivariate frequency analysis. J. Hydrol. Eng. 2007, 12, 394–403. [Google Scholar] [CrossRef] [Green Version]
- Capéraà, P.; Fougères, A.-L.; Genest, C. A nonparametric estimation procedure for bivariate extreme value copulas. Biometrika 1997, 84, 567–577. [Google Scholar] [CrossRef]
- R Development Core Team. R: A Language and Environment for Statistical Computing; R Foundation for Statistical Computing: Vienna, Austria, 2013; Available online: https://www.R-project.org/ (accessed on 10 April 2021).
- Nagler. Vine Copula: Statistical Inference of Vine Copulas 2.3.4. 2021. Available online: https://CRAN.R-project.org/package=VineCopula (accessed on 30 May 2021).
- Gonzalez-Fernandez. Vines: Multivariate Dependence Modeling with Vines 1.1.5. 2016. Available online: https://CRAN.R-project.org/package=vines (accessed on 12 May 2021).
- Akaike, H. A new look at the statistical model identification. IEEE Trans. Autom. Control 1974, 19, 716–723. [Google Scholar] [CrossRef]
- Schwarz, G. Estimating the Dimension of a Model. Ann. Stat. 1978, 6, 461–464. [Google Scholar] [CrossRef]
- Okhrin, O.; Ristig, A. Hierarchical Archimedean Copulae: The HAC Package. J. Stat. Softw. 2014, 58, 1–20. Available online: https://www.jstatsoft.org/v58/i04/ (accessed on 7 June 2021). [CrossRef]
- Latif, S.; Mustafa, F. Bivariate flood distribution analysis under parametric copula framework: A case study for Kelantan River basin in Malaysia. Acta Geophys. 2020, 68, 821–859. [Google Scholar] [CrossRef]


| Dependency Measure Statistics | Compound Flood Variables | ||
|---|---|---|---|
| Annual Maximum 24-h Rainfall-Maximum Storm Surge (Time Interval = ±1 Days) | Maximum Storm Surge (Time Interval = ±1 Days)—Maximum River Discharge (Time Interval = ±1 Days) | Annual Maximum 24-h Rainfall-Maximum River Discharge (Time Interval = ±1 Days) | |
| Pearson | 0.301 | 0.469 | 0.118 |
| Kendall | 0.208 | 0.341 | 0.094 |
| Spearman | 0.297 | 0.504 | 0.122 |
| Vine Structure (Conditioning Variable) | Tree Level | Flood Attribute Pairs | Most Parsimonious or Best-Fitted Copula | Log-Likelihood (LL) | Akaike Information Criterion (AIC) | Bayesian Information Criterion (BIC) | ||
|---|---|---|---|---|---|---|---|---|
| Case 1 (1-3-2) * | is placed in the center) | Tree 1 | 1-3 (Rain-River discharge) | Survival BB7 (Rotated BB7 180 degrees) | 9.53788 | −10.87909 | −3.564521 | |
| 3-2 (Storm surge-River discharge) | Gumbel | = par= 1.554 | ||||||
| Tree 2 | 12|3 | Clayton | 0.3688 | |||||
| Case 2 (1-2-3) | placed in the center) | Tree 1 | 1-2 (Rain—Storm surge) | BB7 (Joe-Clayton) | 8.194824 | −6.389647 | 2.75356 | |
| 2-3 (Storm surge—River discharge) | Gumbel | = par = 1.554 | ||||||
| Tree 2 | 13|2 | Rotated BB8 270 degrees | = par = −1.083(delta) = par2 = −1.000 | |||||
| Case 3 (2-1-3) | D-vine structure 1 (Variable 1 or Annual maximum 24-h rainfall placed in the center) | Tree 1 | 2-1 (Storm surge-Rain) | BB7 (Joe-Clayton) | 9.34687 | −8.693741 | 0.449466 | |
| 3-1 (River discharge-rainfall) | Survival BB7 (Rotated BB7 180 degrees) | |||||||
| Tree 2 | 23|1 | Frank | 3.689 |
| Trivariate Distribution Framework | Copula Function | Log-Likelihood (LL) | Akaike Information Criterion (AIC) | Bayesian Information Criterion (BIC) | |
|---|---|---|---|---|---|
| Parametric 3D Vine or Pair-Copula Construction (PCC) | D-Vine Copula * | 9.53788 | −10.87909 | −3.564521 | |
| Estimated Parameters | Log-Likelihood (LL) | ||||
| Asymmetric or fully nested Archimedean (FNA) framework (parametric marginals) | Gumbel copula | 9.063 | −0.408 | 3.248 | |
| Clayton copula | 5.627 | 0.544 | 4.201 | ||
| Frank copula | 8.594 | −0.302 | 3.355 | ||
| Flood Attribute Pairs | |||
|---|---|---|---|
| Annual maximum 24-h rainfall (mm)-Maximum storm surge (m) (Time interval = | 0.207 | 0.192 | 0.196 |
| Maximum storm surge (m) (Time interval = | 0.341 | 0.358 | 0.342 |
| Annual maximum 24-h rainfall (mm)—Maximum river discharge (m3/s) (Time interval = | 0.093 | 0.156 | 0.120 |
| Flood Quantiles Estimated Using the Inverse of the Best-Fitted Marginal Cumulative Distribution Functions (CDFs) | Bivariate Joint Return Periods (JRPs) | Trivariate Joint Return Periods (JRPs) Estimated Using the Best-Fitted D-Vine Copula Structure (Case 1, Refer to Table 2) | |||||||||
|---|---|---|---|---|---|---|---|---|---|---|---|
| Return Period (RPs) (Years), T | Annual Maximum 24-h Rainfall (R) (mm) | Maximum Storm Surge (m) (SS) (Time Interval = ±1 Days) | Maximum River Discharge (RD) (m3/s) (Time Interval = ±1 Days)) | ||||||||
| 5 | 102.90 | 0.145 | 2412.582 | 3.01 | 14.58 | 2.91 | 17.43 | 3.40 | 9.40 | 2.380 | 19.31 |
| 10 | 120.68 | 0.221 | 3374.429 | 5.72 | 39.47 | 5.52 | 52.75 | 6.60 | 20.57 | 4.40 | 50.98 |
| 20 | 138.75 | 0.284 | 4685.815 | 11.18 | 94.71 | 10.71 | 150.38 | 13.01 | 43.13 | 8.52 | 133.76 |
| 50 | 163.73 | 0.354 | 7215.067 | 27.59 | 265.73 | 26.17 | 557.63 | 32.26 | 110.99 | 21.48 | 964.97 |
| 100 | 183.68 | 0.401 | 10,005.067 | 54.98 | 551.45 | 51.80 | 1435.13 | 64.35 | 224.15 | 43.90 | 1280 |
| 200 | 204.69 | 0.444 | 13,886.119 | 109.78 | 1121.95 | 102.87 | 3575.25 | 128.52 | 450.51 | 79.19 | 1002.40 |
| 500 | 234.24 | 0.497 | 21,446.821 | 274.22 | 2830.45 | 255.57 | 11,454.75 | 321.05 | 1129.56 | 188.38 | 1596.42 |
| 1000 | 258.04 | 0.533 | 29,822.745 | 548.27 | 5678.59 | 509.45 | 26,954.17 | 641.93 | 2261.42 | 364.00 | 2508.15 |
Publisher’s Note: MDPI stays neutral with regard to jurisdictional claims in published maps and institutional affiliations. |
© 2022 by the authors. Licensee MDPI, Basel, Switzerland. This article is an open access article distributed under the terms and conditions of the Creative Commons Attribution (CC BY) license (https://creativecommons.org/licenses/by/4.0/).
Share and Cite
Latif, S.; Simonovic, S.P. Parametric Vine Copula Framework in the Trivariate Probability Analysis of Compound Flooding Events. Water 2022, 14, 2214. https://doi.org/10.3390/w14142214
Latif S, Simonovic SP. Parametric Vine Copula Framework in the Trivariate Probability Analysis of Compound Flooding Events. Water. 2022; 14(14):2214. https://doi.org/10.3390/w14142214
Chicago/Turabian StyleLatif, Shahid, and Slobodan P. Simonovic. 2022. "Parametric Vine Copula Framework in the Trivariate Probability Analysis of Compound Flooding Events" Water 14, no. 14: 2214. https://doi.org/10.3390/w14142214
APA StyleLatif, S., & Simonovic, S. P. (2022). Parametric Vine Copula Framework in the Trivariate Probability Analysis of Compound Flooding Events. Water, 14(14), 2214. https://doi.org/10.3390/w14142214