Article

Insight into Groundwater Resources along the Coast of Benin (West Africa) through Geochemistry and Isotope Hydrology; Recommendations for Improved Management

1
Institut National de l’Eau, Université d’Abomey Calavi, Cotonou 01 BP 4521, Benin
2
Faculté des Sciences, Université de Douala, Douala P.O. Box 24157, Cameroun
3
Département d’Hydrogéologie, Université de Corse Pascal Paoli, Campus Grimaldi, BP52, 20250 Corte, France
4
CNRS, UMR 6134 SPE, BP52, 20250 Corte, France
5
UMR CNRS 6249 Chrono-Environnement, Université de Bourgogne Franche-Comté, 16 Route de Gray, 25030 Besançon, France
*
Author to whom correspondence should be addressed.
Water 2022, 14(14), 2154; https://doi.org/10.3390/w14142154
Submission received: 12 April 2022 / Revised: 10 May 2022 / Accepted: 5 July 2022 / Published: 7 July 2022
(This article belongs to the Section Hydrogeology)

Abstract

:
Along the West-African coast, groundwater is under several threats coming from both human activities and climate change. However, hydrogeological studies have so far been conducted in a piecemeal way, city by city. In this paper, a regional study was conducted along the Beninese coast, combining hydrogeochemistry and water stable isotopes. Monthly rainfall samples were analyzed in terms of chemistry and isotopes as well as groundwater from Holocene (upper aquifer) and Mio-Plio-Pleistocene (lower aquifer). This allowed to determine the recharge timing of aquifers (April to October, excluding August). Rainwater then infiltrates the soil with a slight evaporation. The upper aquifer, more heterogeneous, is displaying many different water types while the lower aquifer shows mainly a Na-Cl water type. While the upper aquifer shows many signs of contamination from human activities and saltwater intrusion from lakes and lagoons, the deeper aquifer is more influenced by a geogenic signature. These results are then interpreted regarding the demographic trends and climate change scenario. In the long-term, the groundwater level of the lower aquifer is expected to decrease as the rate of abstraction increases and recharge rate decreases. It is therefore recommended to develop adapted and urgent protection measures of the water resource to ensure sustainable and healthy groundwater exploitation.

1. Introduction

According to recent data provided by the United Nations Environmental Program [1], approximately 60% of the world’s population lives within 60 km of a coast. This proportion is expected to increase to 75% within the next two decades [2,3]. However, human settlement, together with the development of agricultural, industrial, and tourist activities, have adversely impacted coastal water resources and especially groundwater [4]. Indiscriminate withdrawal of groundwater to meet the growing demand for various purposes generally leads to a decrease in piezometric level, which induces seawater intrusion. In addition, the extent of urbanization and industrialization in these areas also impacts the quality of groundwater. This has already been reported in many parts of the world: Mediterranean region [5,6], south America [7], Israel [8], Eastern Africa [9,10], and Western Africa [11]. This latter case is very interesting as the Gulf of Guinea is the most dynamic region in sub-Saharan Africa [12]. This dynamism is demographically characterized by a growth of rare magnitude (on average 2.2–4% per year over the last three decades) expressed by a large movement of people from the countryside to the coastal cities due to economic reasons. However, this population growth in coastal areas is not generally followed by clear land-use planning and sustainable development challenges are now increasingly developing. Moreover, the more the coastal population grows, the more the water demand increases substantially. People need water and shallow groundwater from unconsolidated and consolidated sediments appears as the most accessible potable water to deal with failures of the different national water companies tapping both surface water and deep aquifers [13,14,15,16], respectively, for Lagos in Nigeria, Douala in Cameroon, Cotonou in Benin, and Abidjan in Côte d’Ivoire. In this part of Africa, previous studies have so far been carried out at city scale mainly focusing on degradation of the water resource, e.g., [17,18,19]. However, there are few studies at a basin scale and therefore no complete information on hydrogeological functioning and geochemical processes occurring all along the aquifers. The coastal sedimentary basin of Benin is one of the least documented, recording only few studies on major ion chemistry and geophysical methods [20,21,22,23]. From these previous works, and from others which focused on the very urban area of Cotonou [18,24], some knowledge gaps remain on: (i) the interaction between fresh (groundwater) and saline/brackish (sea, lake and lagoons) water; (ii) the identification of natural and anthropogenic factors controlling groundwater chemistry; and (iii) the knowledge on natural background levels. Based on sampling extended to the entire coastal area of Benin and by applying isotope hydrology techniques, this paper aims to provide a conceptual model of the multilayer coastal aquifer of Benin in order to contribute to an adapted exploitation strategy towards sustainable management of the groundwater resource.

2. Study Area

2.1. General Features

The study area is located in the southern part of Benin and extends over the entire width of the territory from the borders of Togo in the west (marked by Mono River) to Nigeria in the east; thus, covering approximately 12,000 km2, i.e., 10% of Beninese territory. It is limited in the north by the plateaus of Allada (west of Azili Lake), Come (north of Ahémé Lake), and Sakaté (north of Porto-Novo lagoon) and in the south by the Atlantic Ocean (Figure 1). The location of this area corresponds to the subequatorial zone characterized by a warm and wet climate with two rainy (from mid-March to mid-August and from mid-September to November) and dry (from mid-August to mid-September and from December to mid-March) seasons. Average annual rainfall increases from 900 mm/year in the west to 2400 mm/year [25] in the east. Over the period 1987–2019, inter-annual rainfall average recorded at the station of Cotonou (Figure 1) is 1300 mm. Annual average temperature and potential evapotranspiration were, respectively, 26.8 °C and 829 mm. The topography of the region is relatively flat with altitudes varying between 0 and 35 m. This marginal-coastal environment is characterized by the presence of many water courses, lakes, and brackish lagoons (Figure 1).
The hydrodynamic of surface waters is strongly related to rainfall regime. There is an increase in water level in May with a maximum in October related to floods coming from the north of the country in addition to the autochthonous precipitation during the short rainy season. In addition, the authors of [26] showed that there is an intrusion of salt water in some local rivers during the low water period. The penetration length of salt water upstream is about 25 km along the Ouémé River (NE upstream of Lake Nokoué) against 30 km along the Sô River (NW upstream of Lake Nokoué) according to [27,28]. Like the Ouémé-Sô system, the dynamic of the Mono River (west of the Beninese coast, close to the border with Togo) is subordinated to rainwater dynamic and marine intrusion at Grand-Popo [29].

2.2. Geological and Hydrogeological Settings

The geology of the study area consists of coastal sedimentary deposits of the vast sedimentary basin of the Guinean Gulf and peculiarly of the Keta basin [30] which extends from Ghana (in the West) to Nigeria (in the East). These deposits have a monoclinal structure characterized by a growing differential subsidence towards the southeast (Figure 2). They consist of detrital formations (sand, gravel, and clay), marls, and limestones. The thickness and the lithology vary widely from the north to the south and from the east to the west. Eight stratigraphic units extending from the upper Cretaceous (Turonian-Coniacian) to the Quaternary have been identified based on the lithology and sedimentary indicators [31,32]. These coastal sedimentary deposits are arranged in four aquifers separated from each other by clays and marls layers [33]: (i) the aquifer of the Turonian-Coniacian made of detrital and marine formations from the bottom to the top; (ii) the aquifer of the Lower Paleocene made of limestones, (iii) the Mio-Plio-Pleistocene (Continental Terminal) aquifer which is mainly characterized by terrigenous rocks, and (iv) the Holocene aquifer which has a structure similar to that of Continental Terminal (CT) with an alternation of clay and sands.
The present study focuses on the Continental Terminal and Holocene formations, hereafter called lower and upper aquifers, respectively.
According to [30], the Continental Terminal begins with a sandy clay marine layer, containing glauconite, covered by more detrital and coarse continental formations (sand, sandy clay, clay and sandstone). For this aquifer extending from the northern inner plateaus to the littoral plain in the south, layers are discontinuous and irregular with lenticular structure. The thickness of deposits ranges between 60 m in the north and about 200 m in the south (Figure 2). The geological cross section (Figure 2) shows the structure and geometry of this multi-layer aquifer. The Continental Terminal is unconfined in the north and becomes progressively confined towards the Atlantic Ocean. Hydraulic gradients are generally low (0.1–0.3‰) confirming the confined conditions in the aquifer without any preferential direction of flow.
The Holocene sands are observed along the rivers (alluvium) and in the form of cords parallel to the shore and separated by swamps, lakes, and lagoons (Figure 1). This aquifer is unconfined and has a thickness up to 20 m. In contrary to the Continental Terminal, it is remarkably homogeneous horizontally (Figure 3). Water table depth varies on average between 0 and 2 m [20,21,26]. Moreover, previous works from [21,22,23,24,25,26] show that hydraulic gradients vary between 2 and 3‰ with no preferential direction flow. The permeability is approximately equal to 8 × 10⁻⁴ m. s−1; the transmissivity varies from 4 × 10⁻³ to 14 × 10−3 m2. s−1 and the storage coefficient is ranging between 2 × 10⁻⁴ and 9 × 10⁻⁴ [26].

3. Material and Methods

In total, 55 open wells, 36 piezometers, and 39 boreholes were sampled both for Upper and Lower aquifers. In addition, rainwater was sampled on a monthly basis in 2013, surface water (2 samples from the Lake Nokoué) and seawater (1 sample) were collected. The sampling campaign was carried out in January 2012 for evaluation of ion chemistry and water stable isotopes. Physico-chemical parameters, including temperature, pH, electrical conductivity, total dissolved solids, and dissolved oxygen, were measured using multi-parameter WTW 340i until measured levels did not vary, allowing for temperature compensations and calibrations with appropriate standards, such as calibration of the pH meter, which was performed every day during the field campaign. Alkalinity was determined in the field by titration with 0.02 N H2SO4 using HACH kits. After taking the coordinates of each point, the in situ parameters were recorded, the wells were purged, and water was then collected. Samples for major ion chemistry were collected in two 30 mL polyethylene bottles after filtration through 0.45 μm nitrocellulose membranes and those for cation analysis were acidified with ultrapure HNO3- at 70%. Samples for stable isotopes of the water molecule were stored in 20 mL amber glasses bottles. Care was taken to avoid evaporation and all the bottles were filled to the top with no headspace and kept at 4 °C until being transferred to the laboratory.
In addition, rainwater was also sampled at Cotonou station for 2013 in order to obtain information on local rainfall chemistry and stable isotope content (data available in S2 documents). Meteorological or hydro-climatic data were obtained from the weather station of Cotonou (Figure 1). Potential Evapo-Transpiration was determined by using the Penman method [34] which takes into account four measurements: mean air temperature, saturated vapor pressure at the dew point, hours of bright sunshine, and mean wind speed at 2 m above the surface.
The Department of Hydrogeology of the University of Corsica, France (CNRS UMR 6134 SPE), performed all the analyses (major ions, minor ions, and water stable isotopes). Chemical analyses (Cl, NO3, SO42−, HCO3, Na+, K+, Mg2+, Ca2+, and Br) were conducted by ionic chromatography using a Dionex ICS 1100 chromatograph. The quality of the analysis was checked by calculating the ionic balance error: analyses were rejected if the ionic balance error was greater than 5%. Whilst isotope (δ18O and δ2H) measurements were performed using a liquid–water stable isotope analyzer DLT-100 (Los Gatos Research) according to the analytical scheme recommended by the International Atomic Energy Agency [35]. Values are reported in per mil units (‰) compared to Vienna Standard Mean Ocean Water standard (VSMOW). The quality of the isotopic analysis was checked using a standard deviation up to 1‰ for δ2H and up to 0.1‰ for δ18O. Moreover, monthly precipitation isotopes data (2008–2013) from the Global Network of Isotopes in Precipitation station of Abomey-Calavi (Figure 1) were used in order to have an input function to the groundwater system.

4. Results

4.1. Water Chemistry

Physicochemical and isotopic data for the different water samples are summarized in Supplementary Tables S1 and S2 and the statistical results of those data are presented in Table S1. Rainwater pH varies from 6.5 to 7.3 with a mean of 6.8. Precipitation is relatively low mineralized with electrical conductivity ranging from 21.4 to 82.3 µS/cm (Table S2). Groundwater temperatures (mean values of 29.9 and 28.9 °C, respectively, for lower and upper aquifers), are within the range of air temperatures in January (25 to 30.9 °C) when the field measurements were carried out. It is clear that temperatures increase slightly with depth as water from the deep system presents the highest values in terms of the maximum, mean, and median (Table 1). Table 1 also shows that the electrical conductivity of the upper aquifer varies from 57.7 to 12,360 mg/L with a mean value of 766.49 mg/L and that of the lower aquifer ranges from 31.1 to 483 mg/L with an average value of 90.57 mg/L (Table 1). These low values of electrical conductivity for the deep aquifer indicate that the groundwater in this system is mainly fresh (<500 mg/L) according to [36]. However, it is worthwhile noting that the electrical conductivity is relatively high in water from the superficial aquifer. The wide range of values reflects various influences on this shallow system. Therefore, it is already possible to hypothesize that the upper aquifer is the most affected by various inputs entering the system such as industrial effluents, water from pit latrines, leaking of solid waste and saltwater from ocean or surrounding brackish lakes and lagoons. The pH value of the Holocene sandy aquifer groundwater varies from 3.4 to 7.9 with an average value of 5.8 and that from confined groundwater changes from 4.2 to 7.1 with a mean value of 5.1 (Table 1). Therefore, coastal groundwater in the study area is generally acidic. Nevertheless, as for electrical conductivity, water from the shallow system presents the widest range; from strong acidic conditions to slightly alkaline.
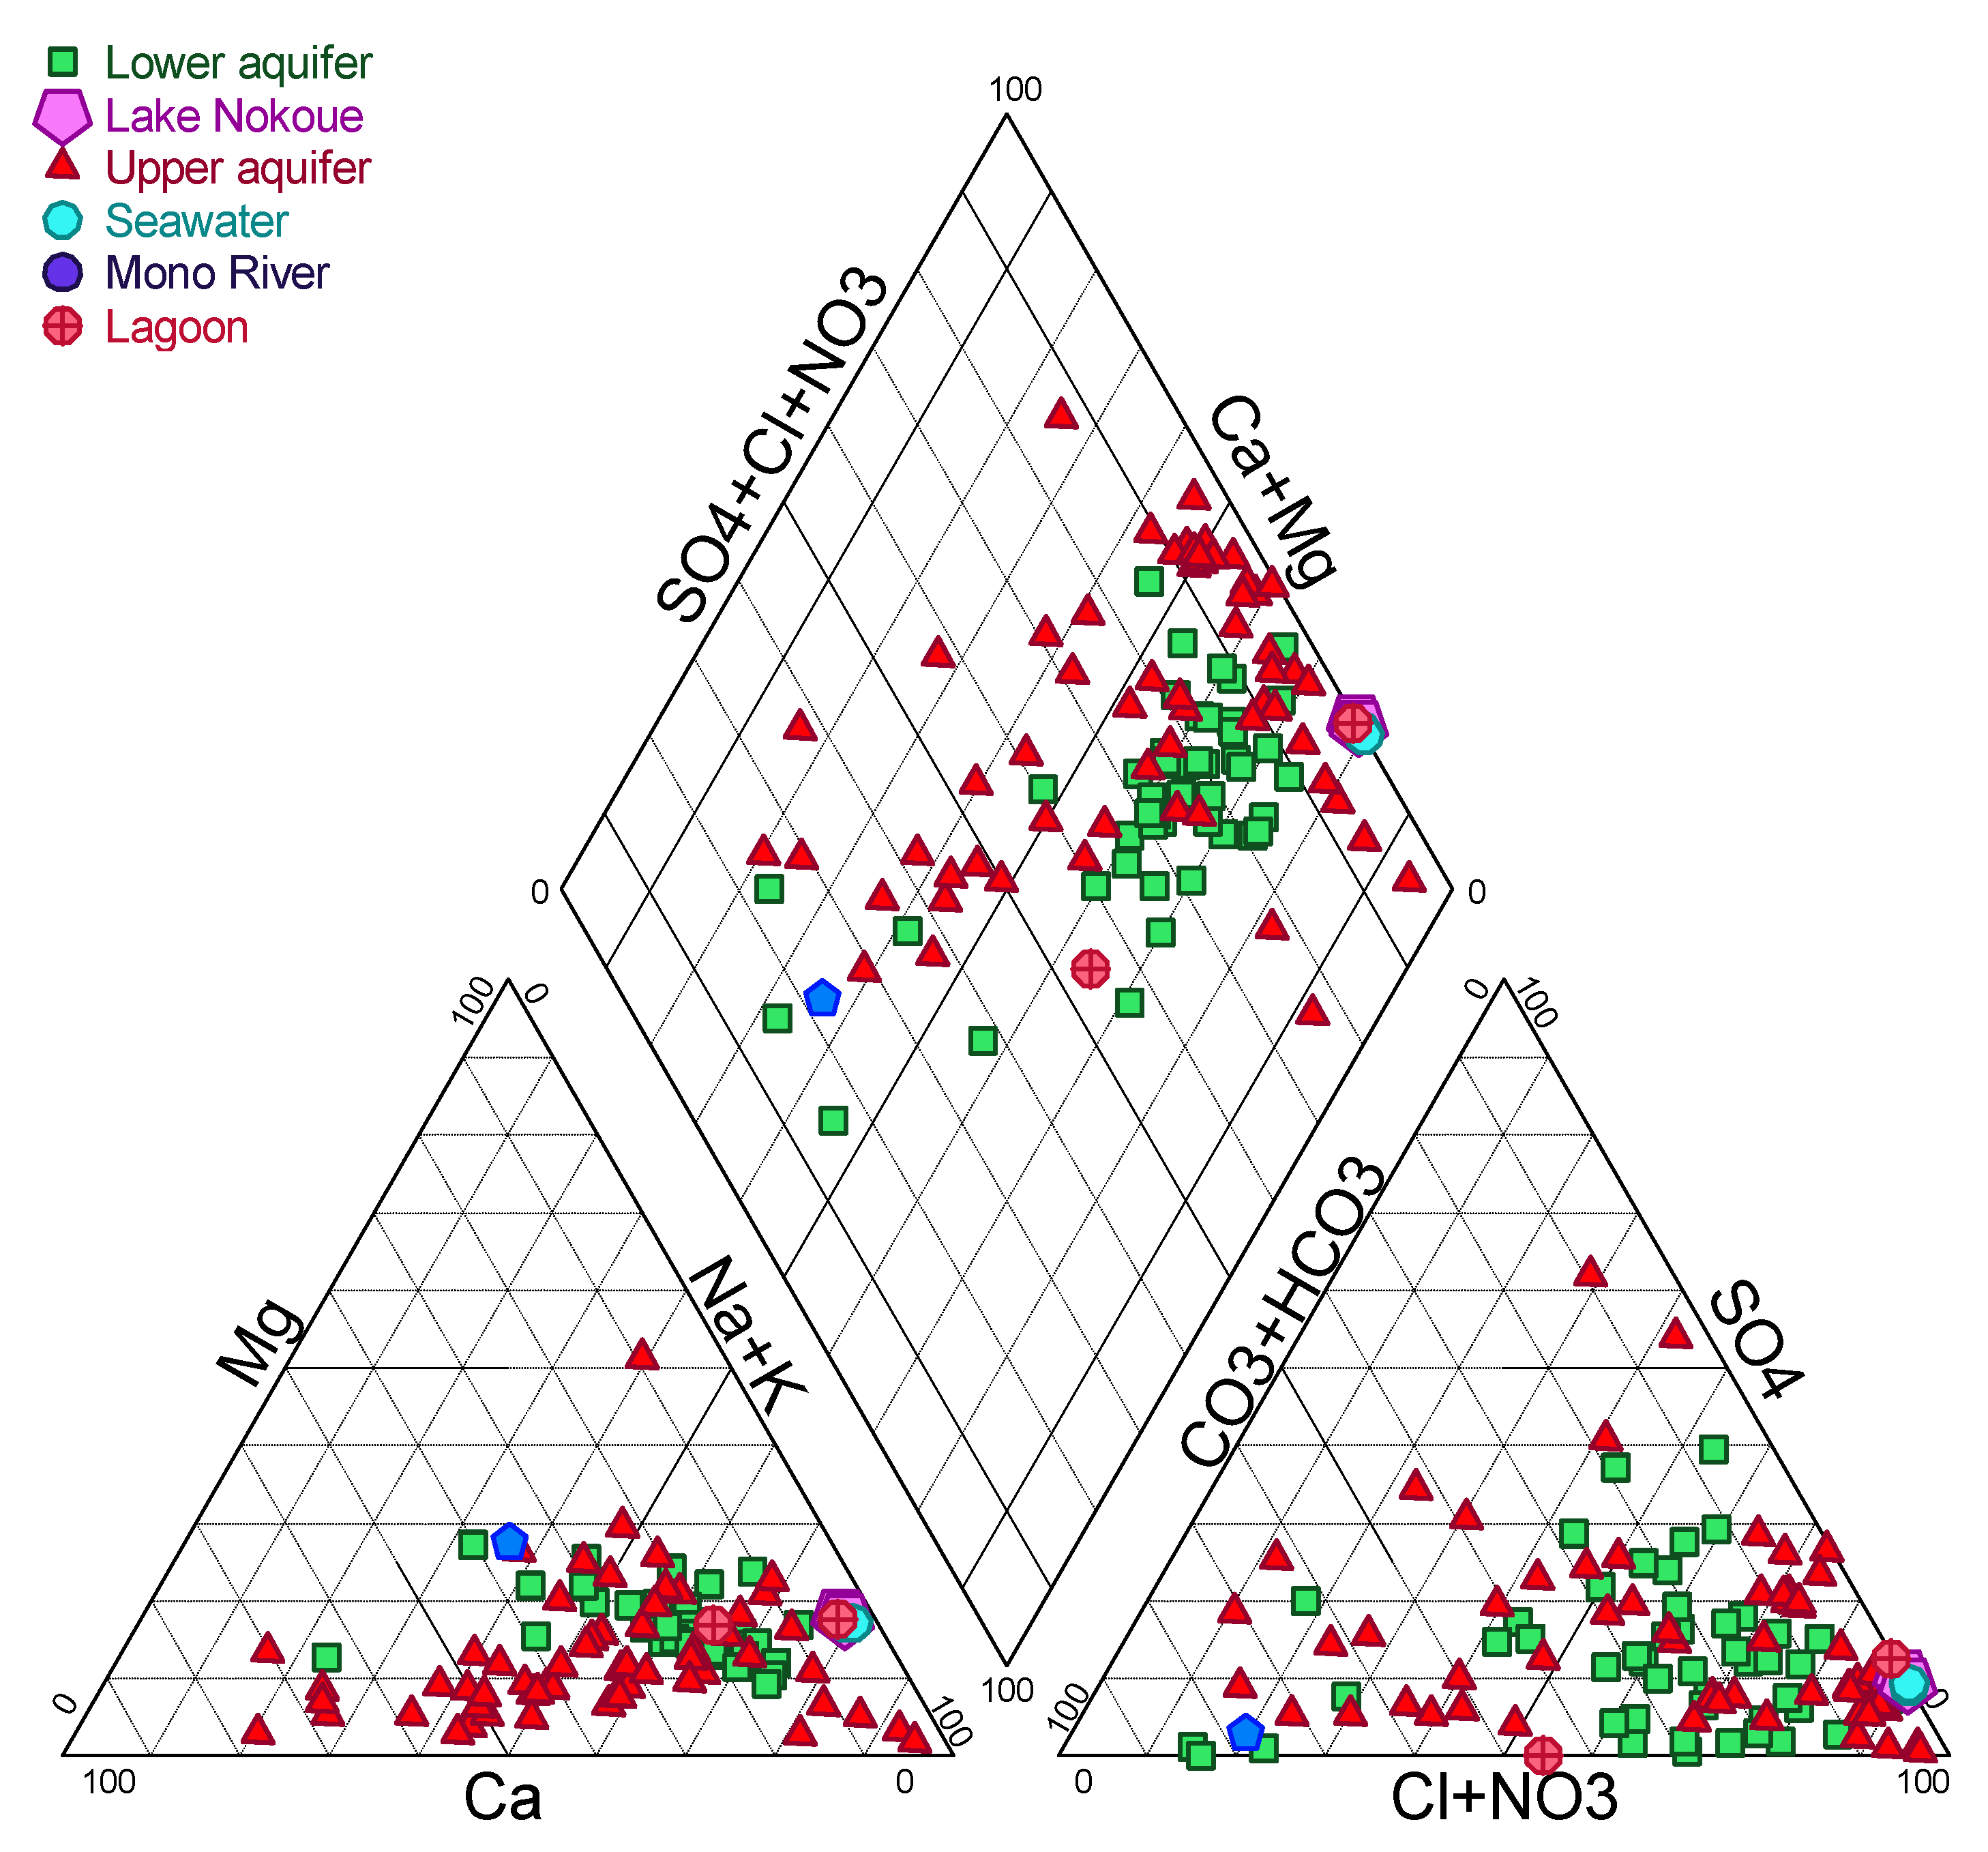
The average concentrations of major cations in the upper and lower aquifers follow the order of Na+ > Ca2+ > Mg2+ > K+ and Na+ > Ca2+ > K+ > Mg2+, respectively, and those of the major anions follow the order of Cl > HCO3 > SO42− > NO3 and HCO3 > Cl > NO3 > SO42−, respectively, for upper and lower aquifers. According to the different ionic concentrations shown in Table 1, the Piper plot was created (Figure 4) in order to highlight the different groundwater types. Holocene groundwater is characterized by Na-Cl (54.3%), Ca-HCO3 (24.6%), and Ca-Cl (21.1%) water types. The lower aquifer from Continental Terminal appears more homogeneous with a high dominance of the Na-Cl water type (85.4%) followed by Ca-HCO3 (8.3%), Ca-Cl (4.2%), and Na-HCO3 water types. This relative homogeneity of the lower aquifer in terms of water type is in agreement with the distribution of in situ parameters presented above. Likewise, the water types observed correspond to the order of abundance of ions. Surface water from the Lake Nokoué is the most mineralized with a pH of 7.5 and electrical conductivity values varying between 26,300 and 34,800 µS/cm. Furthermore, it is highlighted on the Piper diagram (Figure 4) that the water from Lake Nokoué is very close to seawater composition.

4.2. Water Stable Isotopes

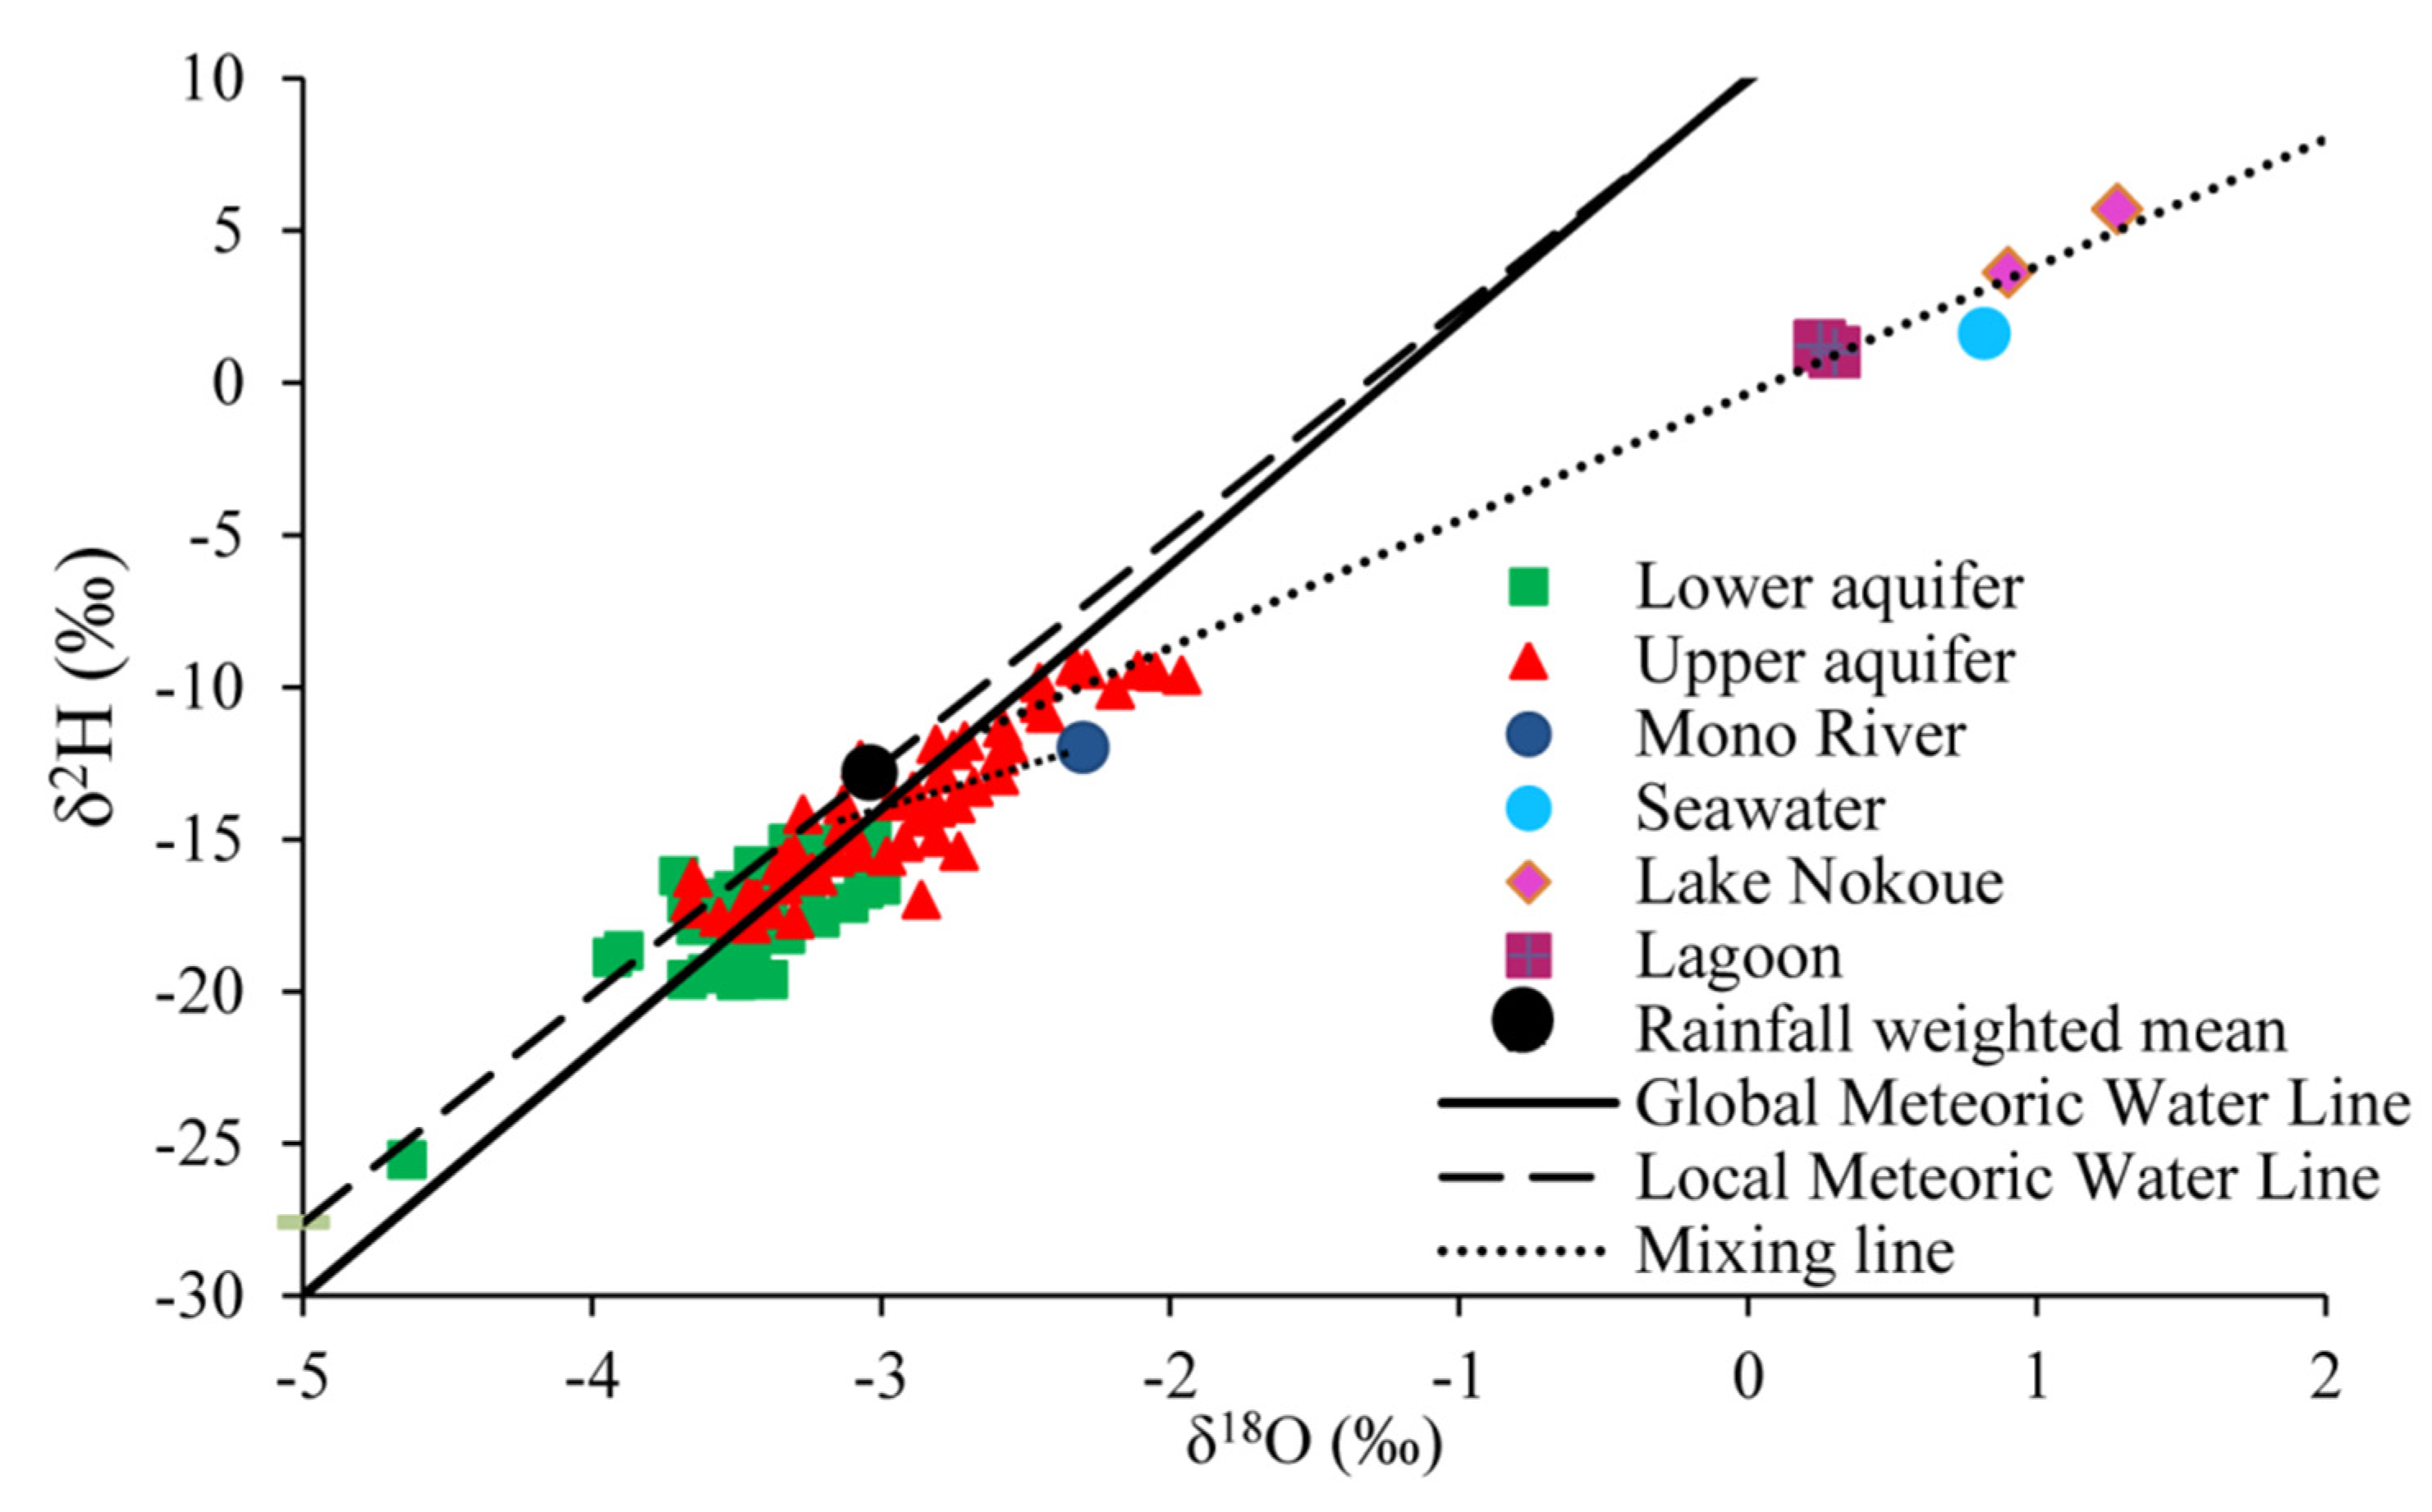
The results of δ18O and δ2H analysis are shown in Supplementary Material S1, Table S1, and Figure 5. Precipitation isotope contents (from the station of Abomey-Calavi, 2009–2013) are ranging between −5.5 and 1.8‰ δ18O and −36.1 and 15.8‰ δ2H with, respectively, weighted mean values of −2.5‰ and −10.9‰. In shallow groundwater, δ2H and δ18O vary, respectively, from −9.3‰ to −17.8‰ (average = −14.2‰) and from −2‰ to −3.7‰ (average = −3‰). In the deep aquifer, a range of δ2H and δ18O from −15‰ to −25.5‰ (with a mean value of −17.4‰) and from −3‰ to −4.6‰ (with a mean value of −3.4‰) is observed, respectively. Finally, saline water from sea, lagoons, and Lake Nokoué are the most enriched with mean values of 0.8‰ δ18O and 3.9‰ δ2H while the Mono River presents an isotopic signature similar to that of groundwater (δ18O = −2.3‰; δ2H = −12.7‰).
According to long-term monthly rainwater data (n = 131) obtained from the station of Abomey-Calavii (Figure 1), the local meteoric water line was calculated as δ2H = 7.5 δ18O + 10 (Figure 5). The weighted means for rainwater, groundwater, and surface water samples are plotted on the diagram δ2H versus δ18O (Figure 5). In term of average values, it is clear that the isotope signal observed in rainwater is approximately the same as in the shallow Quaternary aquifer while there is a slight depletion in the lower aquifer.

5. Discussion

5.1. Groundwater Recharge and Mechanisms Involved

In order to compare the chemical composition of groundwater and recharge water, concentrations of the effective rainfall were calculated for each month and for each element with the following formulas [37].
EF = Hprecipitation/(Hprecipitation − Hevapotranspiration)
[X]infiltration = EF × [X]precipitation
where EF is the enrichment factor, Hprecipitation is the annual amount of precipitation, Hevapotranspiration is the annual evapotranspiration, [X]infiltration and [X]precipitation, respectively, are the concentration of the element X in the infiltration and in the total precipitation.
Findings from equation 1 show a positive EF from April to July and from September to October suggesting a groundwater recharge at this time. Excluding negative EF when evapotranspiration (measured directly at the weather station of Cotonou) is more important than precipitation amount, an average value of EF is found around 1.99 with min and max of 1.16 (June) and 3.36 (April), respectively. Then, based on EF obtained, chemical contents of groundwater with respect to effective rain concentration are shown in Table 1. It appears that mineralization of infiltration waters is multiplied by a factor of 1.3 and 11.3, respectively, in lower and upper aquifers when looking at mean electrical conductivity values. For the main anions and cations controlling the water chemistry, infiltration waters show concentrations of about 2.2 mg/L for Na+; 2.1 mg/L for Ca2+; 8.5 mg/L for HCO3; and 4.2 mg/L for Cl. Whilst in groundwater, Na+, Ca2+, HCO3-, and Cl have average concentrations of 98.6 mg/L (9.1 mg/L), 46.7 mg/L (4.4 mg/L), 55.9 mg/L (16.6 mg/L), and 157.4 mg/L (11.6 mg/L) for the upper (lower) aquifer (Table 1). The increase in mineralization from rainwater to groundwater is due to the exchange processes between the geological matrix and the low mineralized rainwater. These water–rock interactions are related to silicate hydrolysis of the sandy formations. However, it is worth noting that the upper aquifer shows chemical contents largely more important than that recorded in the lower aquifer. Therefore, the role of the water residence time is secondary in this case. During its infiltration towards the lower aquifer, in addition to silicate weathering, rainwater is loaded with various elements deposited on the surface, mainly because of human activities. Whereas recharge of the lower aquifer would occur more slowly thanks to the less permeable cover layer fostering a great filtration of water reaching the saturated zone.
As a large majority of samples plot along the Global Meteoric Water Line [38] and Local Meteoric Water Line with a distribution around the weighted mean rainfall value (Figure 5), stable isotopes confirm that groundwater on the Beninese coast is mainly of meteoric origin. However, Figure 5 highlights for the upper aquifer the existence of some samples relatively enriched in stable isotopes (compared to rainwater). These samples deviate slightly from the Local Meteoric Water Line and are plotted along the mixing lines with brackish/salt water from Lake Nokoué, lagoons and seawater (Figure 5). They are characterized by high levels of electrical conductivity (mean of 1169.8 µS/cm) and pH (mean of 7.3), which may be an indication of the influence of salt water from lake/lagoons/seawater. However, since deuterium excess < 10‰ is observed in 62.7% of samples, a slight influence of evaporation can also be mentioned to explain this isotopic enrichment [39]. Furthermore, Figure 5 also shows a mixing trend between some groundwater samples and the Mono River. Isotopes clearly show that shallow groundwater at the western side of the coast is recharged by Mono River. This is in agreement with the hydrological behavior of the Mono River near the coast. Indeed, during high water level, the river gets out of its bed and spreads into lateral depressions; thus, recharging the shallow aquifer. In addition, at the mouth of the river, alluvium often acts as a barrier, absorbing the water from the Mono [29]. It is worth noting that groundwater sampling points along the mixing line with Mono River have a mean electrical conductivity of 195.6 µS/cm and correspond to water with Ca-HCO3 water type. This suggests a freshwater signature similar to that of the river (Figure 4). This process of surface water loss to groundwater has long been recognized in arid regions, but it also has been documented in humid regions [40]. It depends on the geology (alluvium generally fosters this kind of exchange) and the landscapes (riverine terrains or valleys) according to [41,42]. Therefore, regarding the results from chemistry and isotopes, and the natural conditions in this part of the study area, this finding of shallow groundwater recharge by Mono River must be taken into consideration to design a conceptual model of the regional aquifers.
Isotope contents in Continental Terminal samples are more depleted; lower than the weighted mean rainfall: the deeper the aquifer is, the more depleted the isotopic data are. Thus, the coastal sedimentary aquifers of basins gather water corresponding to different recharge periods. The PZ1 sample which exhibits a strongly depleted signature (−4.6‰ δ18O) compared to the other points is an example of “paleo-groundwater” i.e., water sourced from rainfall recharged during a relative ancient period with a colder climate. An evaporation effect is also identified for this aquifer in agreement with the slow infiltration mentioned above. However, in this case, this phenomenon is limited to 45% of groundwater samples.

5.2. Groundwater Recharge and Mechanisms Involved

5.2.1. Anthropogenic Input

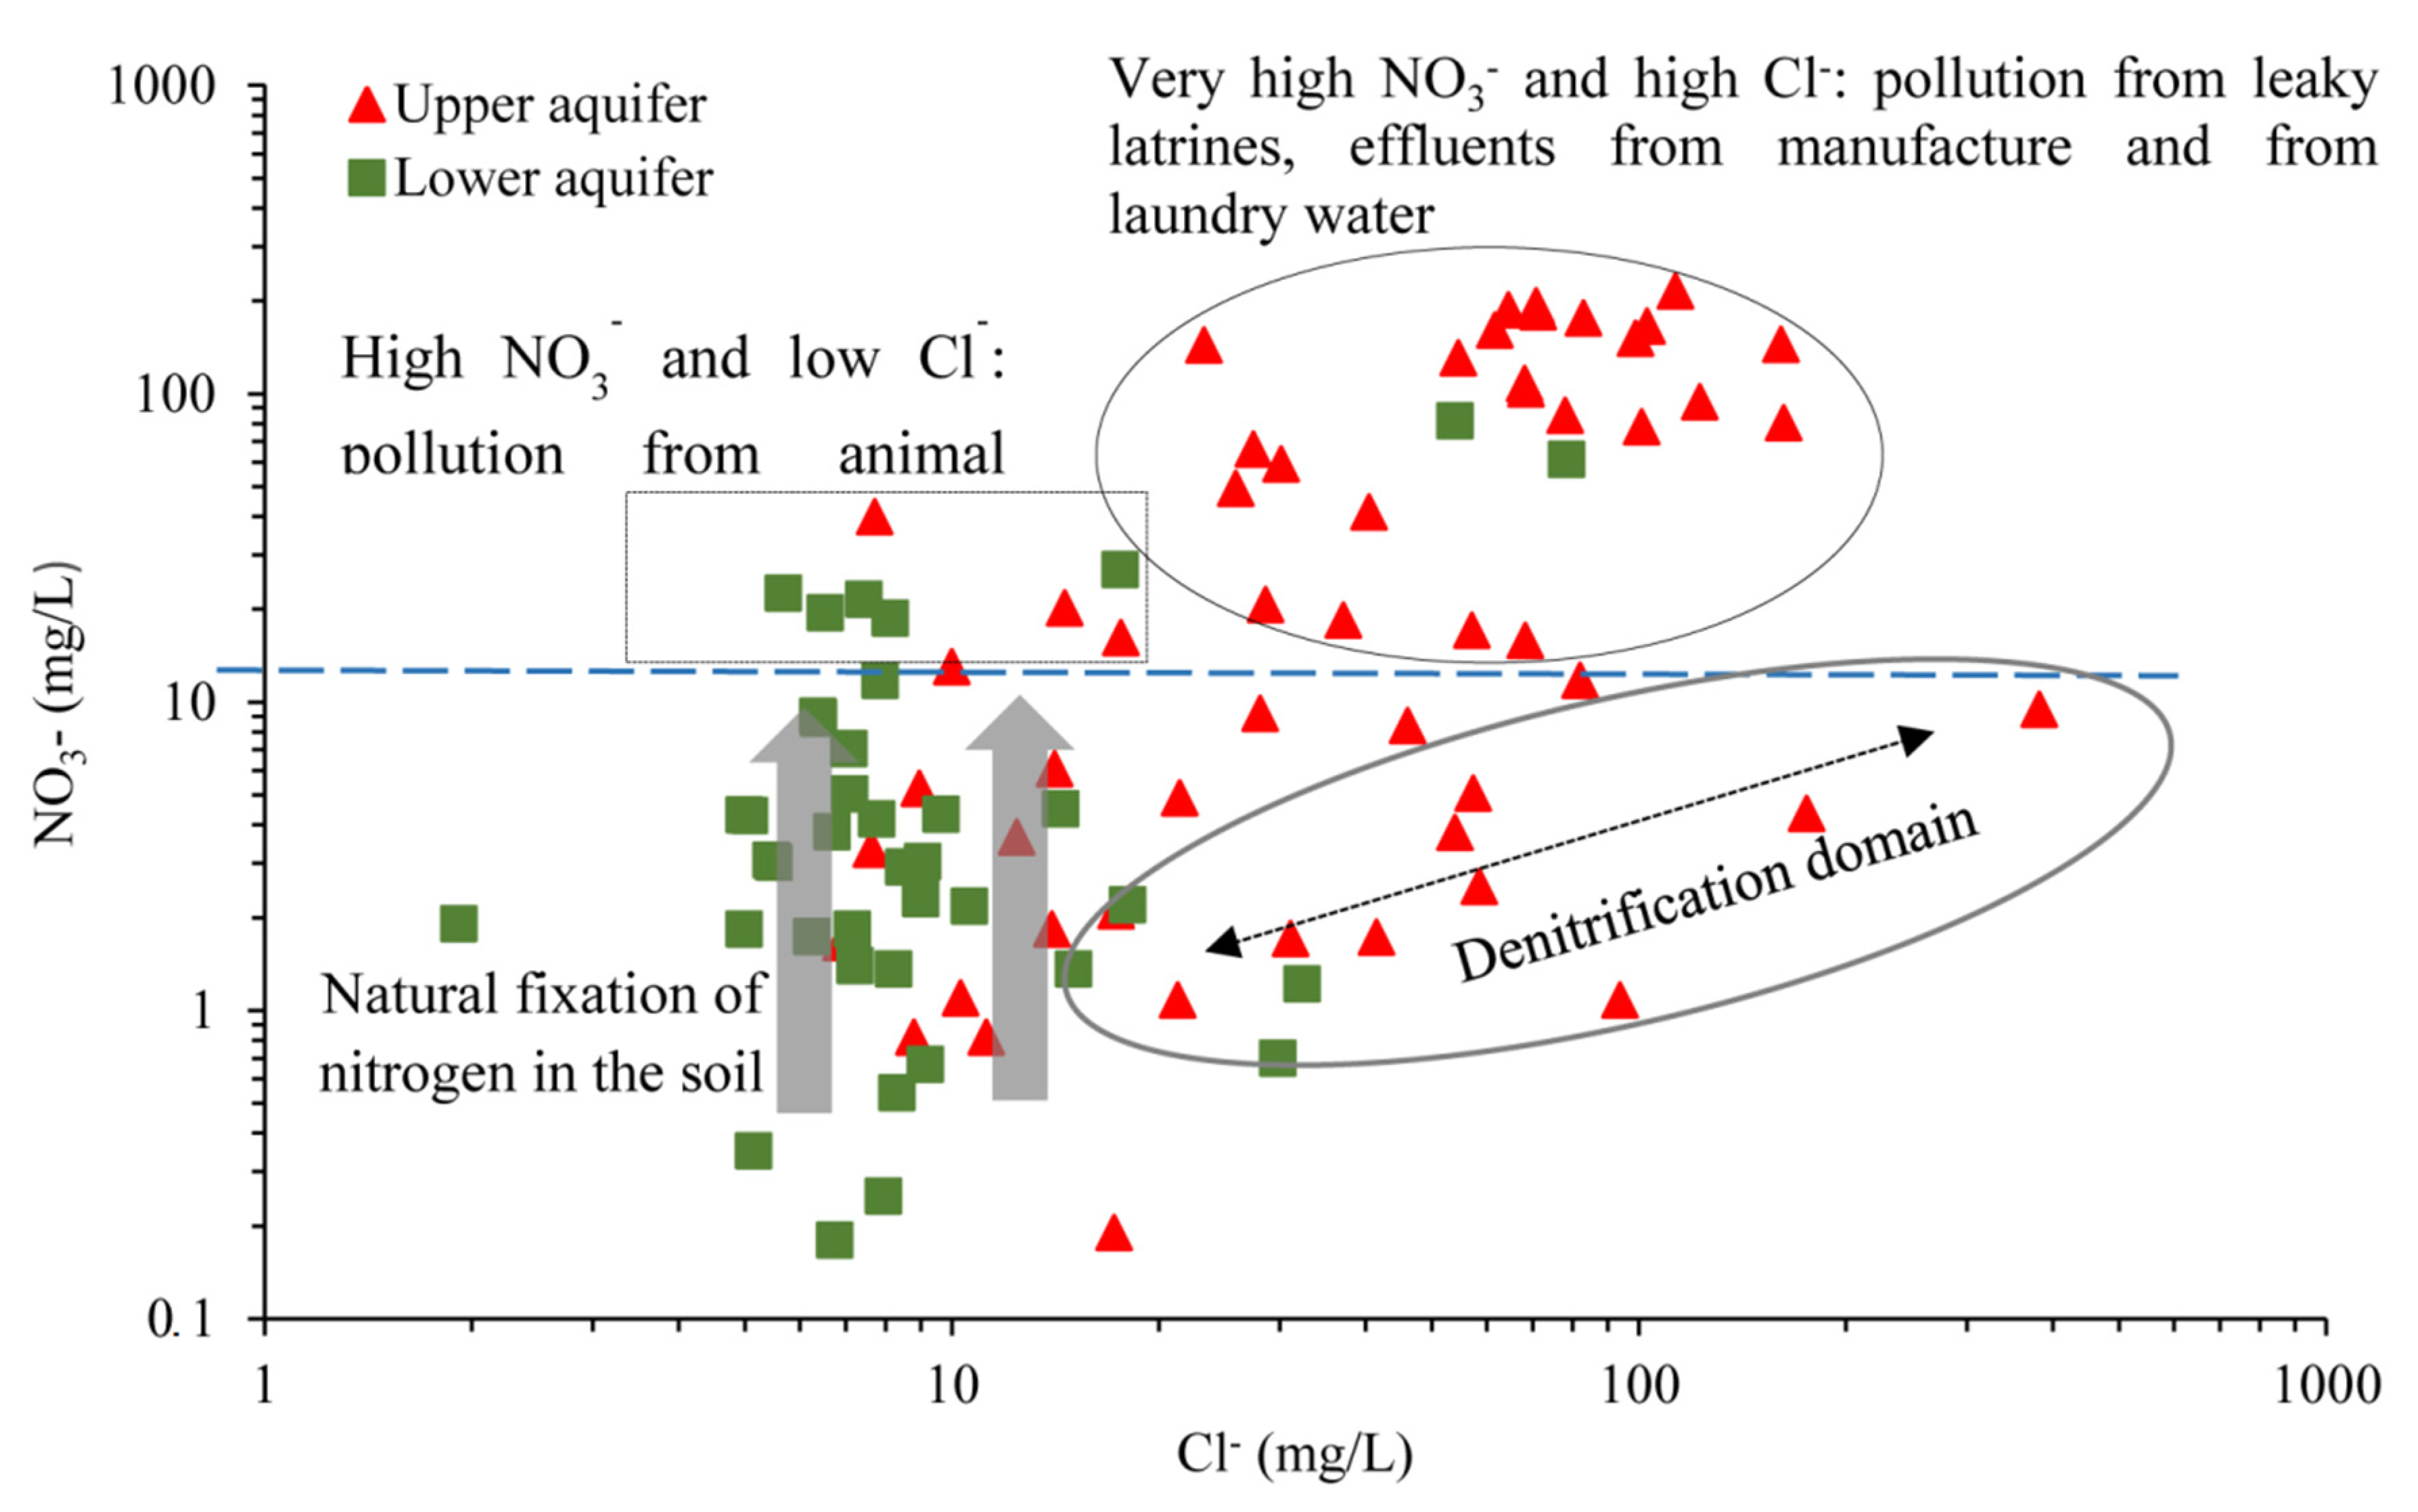
By taking into consideration the concentrations of NO3 in groundwater (Table 1 and Table S1), this section aims to evaluate the anthropogenic influence on groundwater chemistry. The NO3 concentrations in the samples of the unconfined Quaternary aquifer range from 0 to 215.2 mg/L with an average value of 48.7 mg/L (Table 1), approximately close to the quality standard of the World Health Organization (WHO) of 50 mg/L [43]. However, 33% of groundwater samples show NO3 above the WHO limit meaning that the upper aquifer is already strongly influenced by human activities and explaining why concentrations of major ions in this aquifer are largely over those observed in recharge water. In the lower confined aquifer, the NO3 concentrations of groundwater vary between 0 and 81.8 mg/L, with a mean value of 7.4 mg/L (Table 1) consistent with the natural background level of 10 mg/l [37]. Only 4% of samples present nitrate concentrations above 50 mg/L while 83% exhibits concentrations lower than 10 mg/L. This indicates that anthropogenic influence on the confined groundwater is minor. These findings are in total agreement with the description of physico-chemical parameters previously described. However, Figure 6 highlights that the two studied aquifers undergo different nitrate pollution mechanisms. Indeed, high NO3 contents are not associated with high levels in Cl for the lower aquifer while the two ions generally both increase in the upper aquifer (Figure 6). For this last case, pollution may originate from leaky latrines, effluents from manufacture, and from laundry water discharged into nature [18]. Two points from Continental Terminal are affected by this kind of pollution (Figure 6). On the other hand, the increase in NO3 independently to Cl can suggest a natural fixation of nitrogen in the soil or is due to human defecation or animal waste in the streets (Figure 6) according to [18]. Finally, it is worthwhile noting that a large number (51%) of water samples from a shallow aquifer exhibit NO3 below the natural background level of nitrates. This fact can be explained by a denitrification process linked to organic biodegradation according to [44] and to investigations carried out at Cotonou by [18]. The control of the redox process on water chemistry has also been mentioned in the Nigerian part of the basin by [45]. Nevertheless, a dilution phenomenon can be hypothesized for low NO3 associated to low Cl (mg/L) in this upper aquifer.

5.2.2. Salinity and Seawater Intrusion Processes

In the coastal sites of Benin where there is high water demand associated to demographic growth, it is important to understand the relationships between freshwater and surrounding brackish or saline waters. Each potential source of salinization can be characterized by a distinguishable chemistry and well-known ionic ratio associated to different geochemical processes [46,47,48].
For instance, the Mg2+/Ca2+ ratio is an indicator of seawater intrusion as freshwater is dominated by calcium, whereas seawater by magnesium. It is in this order that a Mg2+/Ca2+ ratio > 5 is a direct indicator of seawater contamination [49]. Likewise, seawater diluted with freshwater has distinguished geochemical characteristics [50,51]. For the upper aquifer, two sampling points (Pz2 and P39) are showing Mg2+/Ca2+ > 1 with electrical conductivity of 2500 and 650 µS/cm (Table S1). Regarding the shallow character of this groundwater, it is not possible to refer to deep brine upconing [51] but it is clear that saltwater intruded this part of the aquifer though it is diluted by freshwater.
Sodium and chloride are the dominant ions in saltwater. Thus, even at an early stage of the salinization processes, Na+/Cl ratios when combined with other geochemical parameters can be an indicator of the origin of the salts. In the study area, they are characterized by a Na+/Cl ratio ranging from 0.53 to 0.6 for seawater and 0.46–0.53 (0.6–0.7) for lake (lagoon) intrusion. Seawater solutes are specifically characterized by an excess of Cl over the alkali ions (Na+ and K+). The Na+/Cl ratios (0.46–0.53) at sampling points F53, P37, P76 having EC and NO3 ranging from 588 to 12,360 µS/cm and 0 to 9.5 mg/L, respectively, suggests an intrusion of saltwater from the lake in the aquifer system. On the other hand, the sampling points P115 and Pz2 (already highlighted by Mg2+/Ca2+ ratio) exhibit a contamination by the lagoons (Table S1).
The value of the ionic ratio of K+/Cl is similar in lake, seawater, and lagoon varying between 0.018 and 0.020 (Table S1). Here, it is observed that only the sample P39 (already highlighted by Mg2+/Ca2+ ratio) has a similar molar ratio.
Ionic ratio SO42−/Cl = 0.15 at sampling site F15 (Table S1) suggests once again the contamination of groundwater by lake Nokoué waters. Finally, the Cl/Br ratios show that 13.8% of samples from the upper aquifer are contaminated by saltwater (molar ratios ranging from 325 to 263; Table S1).
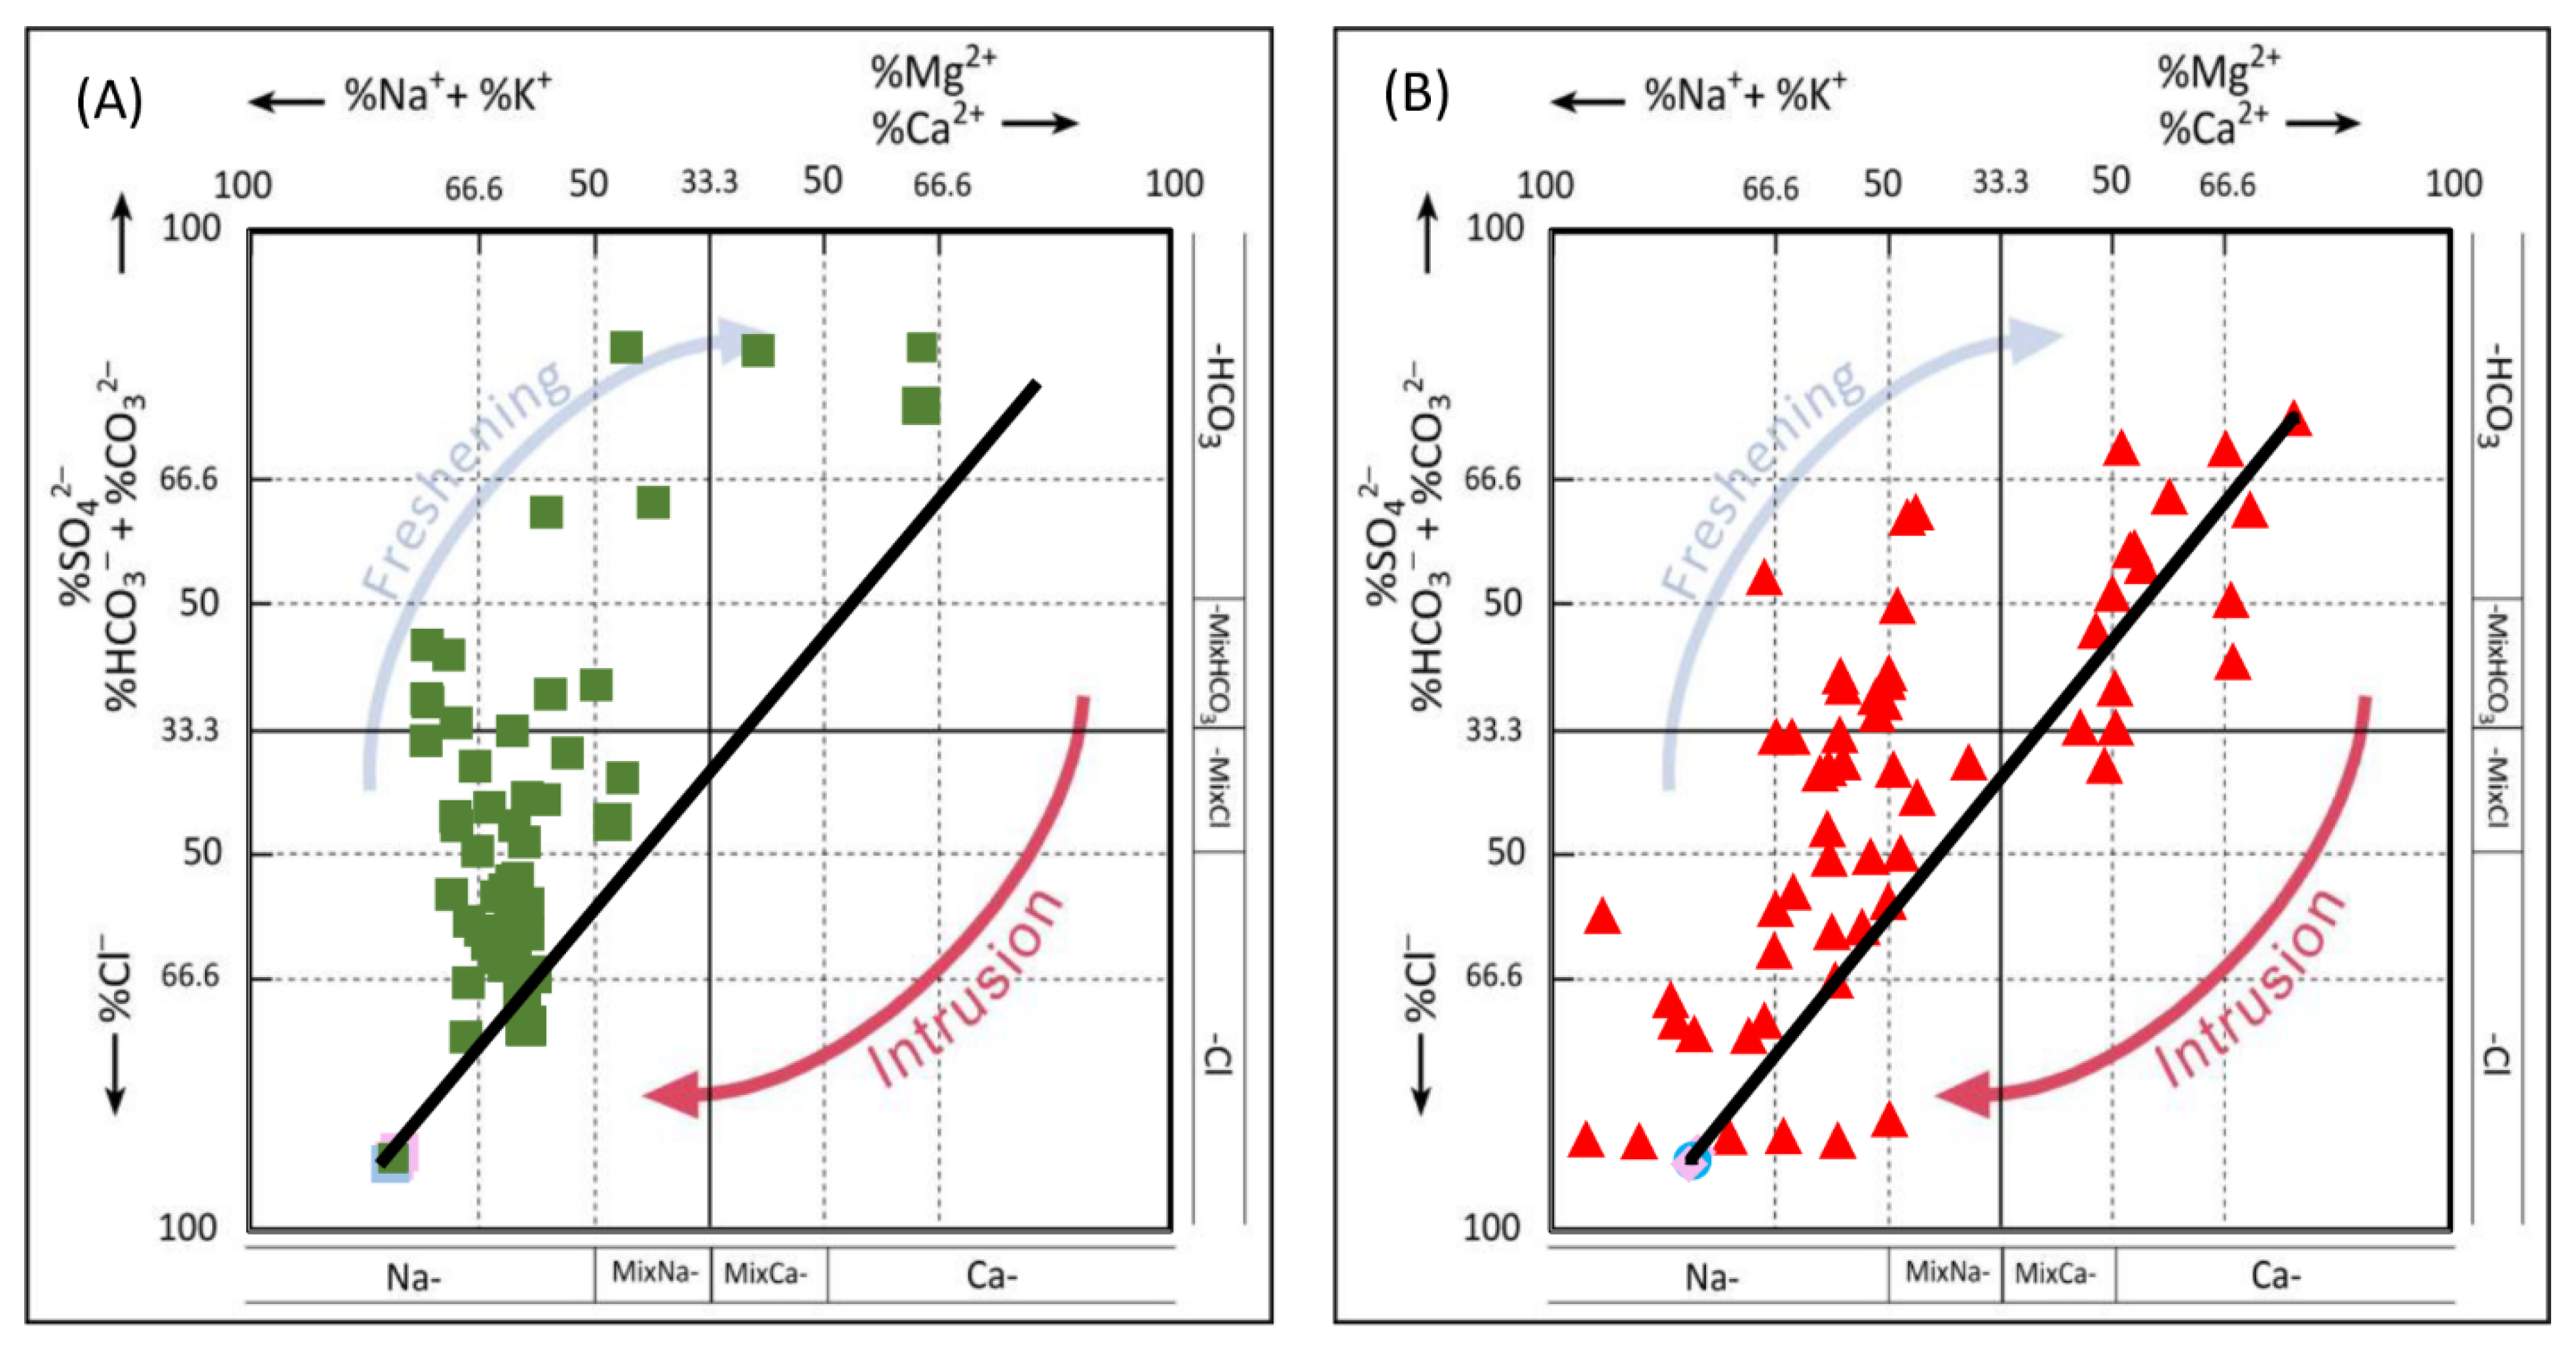
In summary, the use of chemical molar ratios seems to reveal a contamination of the shallow aquifer by lake and lagoons rather than the ocean while there is no identification of saline intrusion in the lower aquifer. This is confirmed on the Hydrochemical Facies Evolution diagram where 17.5% of the investigated wells from the upper aquifer plot below the mixing line (Figure 7), experiencing saltwater intrusion with many samples close to lake/lagoon/ocean. Whilst approximately all the Continental Terminal samples plot above the mixing line, suggesting a freshening process according to [52].

5.2.3. Water–Rock Interactions

According to the Hydrochemical Facies Evolution diagram, with the majority of samples above the mixing line, indicating a dominance of the freshening process for the different aquifers, the rock weathering can be considered as the major mechanism controlling the groundwater chemistry of the multilayered coastal aquifer system of Benin. However, to identify the dominant minerals which contribute to groundwater mineralization, bivariate plots of molar ratios were created. As shown in Figure 8, groundwater is mainly influenced by silicate weathering, especially for the confined groundwater which is less influenced by human pollution. This is in good agreement with the local geology. Furthermore, the good homogeneity in water chemistry for the lower aquifer confirms a global unique source of ions. On the other hand, the strong heterogeneity observed for molar ratios (Figure 8) in the upper aquifer confirms the existence of various influences on the chemistry of this shallow resource.
In addition to these graphs, the plot of Ca2+ + Mg2+ versus HCO3 + SO42− (Figure 9) shows that most samples plot below the 1:1 line; thus, confirming once again the dominance of silicate weathering on water mineralization. This increase in Ca2+ + Mg2+ (Figure 9) and the excess of Na+ + K+ (Figure 9) is evidence that there is no cation exchange in the aquifer system. This evidence was also highlighted on the Piper diagram (Figure 4) since there is no Na-HCO3 end-member.

5.3. Hydrogeological Synthesis and Sustainability of Beninese Coastal Groundwater

By studying the different geochemical processes characterizing the coastal aquifers of Benin, this paper brings out the main hydrogeological features of urban coastal groundwater. Thanks to major ions chemistry of rainfall and groundwater, the recharge timing was determined. Results show that the aquifers are recharged during 6 months, indicating the great quantitative potential of the studied aquifers. Moreover, this information on recharge timing is consistent with that recorded in other humid African regions [56,57].
However, since climate scenarios predict a decrease trend in total annual precipitation and in number of very heavy precipitation days (≥20 mm) [58] a reduction in annual recharge is expected. The infiltration of rainwater towards the saturated zone seems to occur with a slight evaporation influence but not at the same magnitude compared to that observed in semi-arid regions [59]. This evaporation effect is due to relative slow infiltration of water for the lower aquifer and certainly due to the low thickness of the vadose zone as well as the shallower character of the upper aquifer. In general, the two aquifers display distinct geochemical features. Shallow groundwater is heterogeneous in terms of chemistry and stable isotopes with a close relationship with rivers. Thus, this aquifer is undergoing various influences from the surface and sub-surface. It is already strongly marked by a human pollution fingerprint. Rather than a seawater intrusion, geochemical tools reveal a contamination by saltwater from neighboring brackish water lakes and lagoons. It is also interesting to observe the close relationships between the Mono River and Holocene groundwater in swampy areas. This corroborates with the identification by [18] of recharge areas where there is surface inundation. However, deep groundwater from Continental Terminal is more homogeneous with only very few signs of anthropogenic pollution. While there is no saltwater contamination indication, the geogenic signature is more predominant in the chemistry of this resource. The depleted contents in stable isotopes of water from Continental Terminal suggest that this aquifer has a relatively long residence time compared to the Holocene aquifer. Anyway, this resource is more inertial than the upper one. Such information is capital for the drinking water supply and the lower aquifer must be prioritized by the local population and stakeholders. Nevertheless, the urban pressure should be taken into account for the abstraction and the future exploitation of this aquifer. Indeed, the Continental Terminal is currently already intensively exploited for drinking water supply at Cotonou, a large city which experiences exponential demographic growth [11]. Since Figure 5 shows a large proportion of groundwater samples of upper and lower aquifers with overlapping isotopic signatures, the hypothesis of hydraulic connection between the two aquifer systems can be mentioned and it is possible to suspect a water leak (through semi-permeable layers) of shallow water towards deeper levels. In the long-term, regarding the urban pressure, the multiplication of boreholes with multi-strainers, this phenomenon is supposed to become more important, and a decrease in Continental Terminal groundwater level is also expected. The water level is declining, as the rate of abstraction is greater than the rate of recharge. This was observed for instance in the neighboring coastal plain sands aquifer of Lagos, Nigeria [59]. Therefore, it is urgent to protect the water resource of the Continental Terminal to ensure sustainable and healthy groundwater exploitation. Otherwise, a decline in groundwater level can result in some areas, in an irreversible side effect, which involves the encroachment of saline water (if coastal hydraulic gradients are reduced or reversed). This effect is quasi-irreversible, because the saline water invades macro pores and diffuses rapidly into the aquifer matrix under the prevailing high salinity gradients and later takes decades to be flushed out even after the flow of freshwater has been re-established [59].
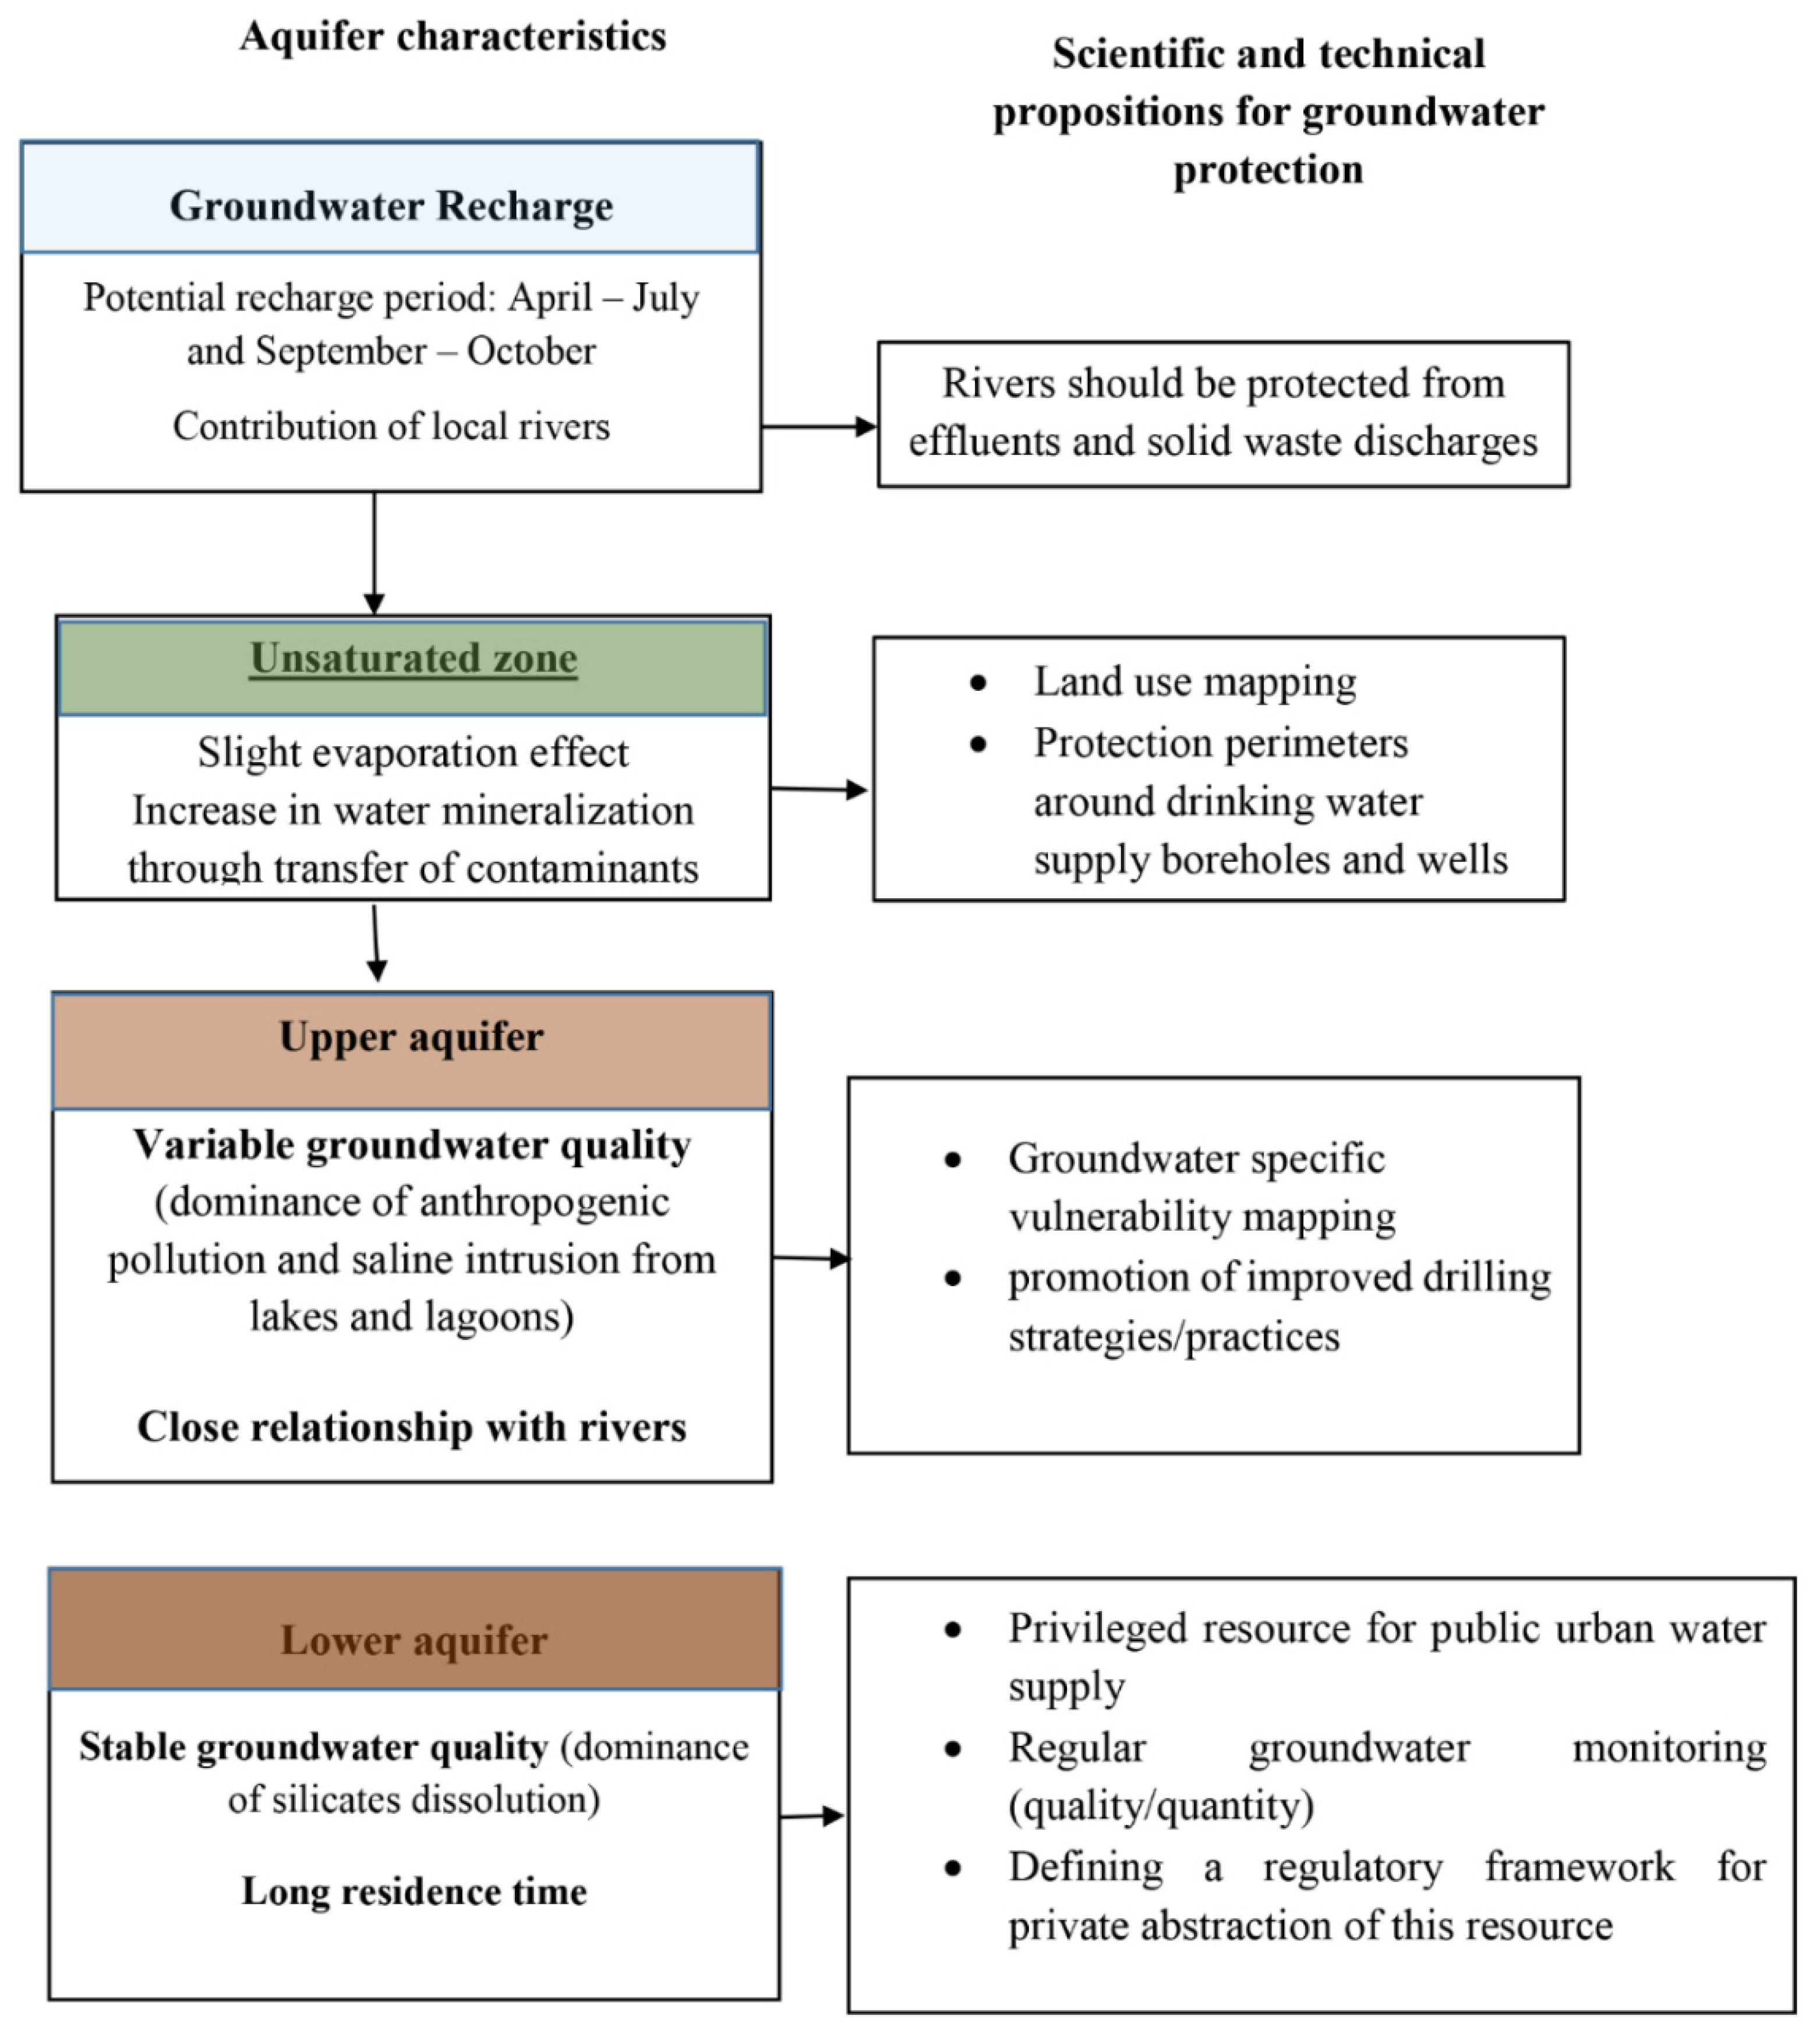
The protection of this aquifer must be based on a solid legal framework for groundwater abstraction, mainly for drilling. Likewise, it is important to limit the influence of human activities on water resources through better land use management. Figure 10 synthetizes the characteristics of the two studied aquifers and propositions of scientific and technical measures for groundwater protection. Regarding the conclusions of this work and those from [10,11,18], an improved legal framework must now be established for the sustainable use of groundwater. For instance, abstraction of Continental Terminal groundwater must be planned and only reserved to public authorities. Furthermore, multilevel screened wells must be prohibited to avoid mixing between different aquifers. In addition, stakeholder participation through local committees for environment protection should be in charge of the maintenance of landfills in settlements and/or watersheds. This is essential to limit the influence of human activities on the aquifer system through better land use management. Even though there is no seawater intrusion in the upper aquifer, scientific and local authorities must continue developing an improved monitoring system of this resource and control its exploitation in order to avoid any irreversible processes.

6. Conclusions

The combined use of major ions and stable isotopes was effective to elucidate the behavior of coastal groundwater in Benin, West Africa. Based on sampling integrating rainwater, surface waters from river, lakes, and lagoons in addition to groundwater, the study highlights the relationships between these different components of the local hydrological cycle and therefore the hydrogeological functioning of studied aquifers and their environmental issues. The occurrence of several groundwater types such as calcium sulfate waters, sodium chloride waters, sodium bicarbonate waters, and calcium bicarbonate waters was highlighted. The investigation of the saltwater intrusion problem using molar ratios, stable isotopes, and Hydrochemical Facies Evolution diagram shows a shallow groundwater contamination coming from lakes and lagoons rather than from the ocean. However, most of the groundwater from the deep aquifer experienced the freshening process. Nevertheless, abstraction of this resource must be controlled to avoid significant decrease in potentiometric levels which can lead to seawater intrusion. Groundwater isotope data gives information on water origins and evidence of surface water contribution to the underground flow. An indication of long residence time groundwater is also highlighted in the deep Continental Terminal aquifer. Furthermore, the methods used in this work can be generalized to all coastal aquifers under strong and combined anthropogenic and climatic pressures. Considering future changes in regional climate (fluctuations in precipitation and sea-level rise), the vulnerability of these coastal waters to deterioration will grow. It is therefore strongly advised to develop quantitative and qualitative monitoring networks on aquifers, particularly addressing the salinity evolution and groundwater levels.

Supplementary Materials

The following supporting information can be downloaded at: https://www.mdpi.com/article/10.3390/w14142154/s1 Table S1: In situ measurements, geochemical and isotopic data of surface and groundwater samples of the study area; Table S2: Physico-chemistry and isotopic data for monthly rainwater collected at Cotonou-IITA in 2013.

Author Contributions

Conceptualization, F.H. and H.C.; data curation, D.O., B.N. and E.G.; formal analysis, E.G.; investigation, D.O. and G.S.; methodology, D.O., B.N., F.H. and H.C.; resources, F.H., A.A. and M.B.; software, B.N.; supervision, F.H., H.C., A.A. and M.B.; validation, F.H., H.C. and M.B.; visualization, F.H.; writing—original draft, D.O. and B.N.; writing—review and editing, D.O., B.N., F.H., H.C., E.G., A.A. and M.B. All authors have read and agreed to the published version of the manuscript.

Funding

This research received no external funding.

Institutional Review Board Statement

Not applicable.

Informed Consent Statement

Not applicable.

Data Availability Statement

Not applicable.

Conflicts of Interest

The authors declare no conflict of interest.

References

  1. UNEP-WCMC. United Nations Environment-World Conservation Monitoring Centre: Global Distribution of Coastal and Oceanic Habitats. Available online: http://data.unep-wcmc.org/datasets (accessed on 5 March 2021).
  2. Neumann, B.; Vafeidis, A.T.; Zimmermann, J.; Nicholls, R.J. Future coastal population growth and exposure to sea-level rise and coastal flooding-a global assessment. PLoS ONE 2015, 10, e0118571. [Google Scholar]
  3. Lincke, D.; Hinkel, J. Economically robust protection against 21st century sea-level rise. Glob. Environ. Chang. 2018, 51, 67–73. [Google Scholar] [CrossRef]
  4. Lu, C.; Werner, A.; Simmons, C. Threats to coastal aquifers. Nat. Clim. Chang. 2013, 3, 605. [Google Scholar] [CrossRef]
  5. Pulido-Bosch, A.; Tahiri, A.; Vallejos, A. Hydrogeochemical characteristics of processes in the Temara aquifer in northwestern Morocco. Water Air Soil Pollut. 1999, 114, 323–337. [Google Scholar] [CrossRef]
  6. Alfarrah, N.; Walraevens, K. Groundwater Overexploitation and Seawater Intrusion in Coastal Areas of Arid and Semi-Arid Regions. Water 2018, 10, 143. [Google Scholar] [CrossRef] [Green Version]
  7. Mahlknecht, J.; Merchán, D.; Rosner, M.; Meixner, A.; Ledesma-Ruiz, R. Assessing seawater intrusion in an arid coastal aquifer under high anthropogenic influence using major constituents, Sr and B isotopes in groundwater. Sci. Total Environ. 2017, 587, 282–295. [Google Scholar] [CrossRef]
  8. Kafri, U.; Goldman, M.; Lyakhovsky, V.; Scholl, C.; Helwig, S.; Tezkan, B. The configuration of the fresh–saline groundwater interface within the regional Judea Group carbonate aquifer in northern Israel between the Mediterranean and the Dead Sea base levels as delineated by deep geoelectromagnetic soundings. J. Hydrol. 2007, 344, 123–134. [Google Scholar] [CrossRef]
  9. Steyl, G.; Dennis, I. Review of coastal-area aquifers in Africa. Hydrogeol. J. 2009, 18, 217–225. [Google Scholar] [CrossRef]
  10. Comte, J.-C.; Cassidy, R.; Obando, J.; Robins, N.; Ibrahim, K.; Melchioly, S.; Mjemah, I.; Shauri, H.; Bourhane, A.; Mohamed, I.; et al. Challenges in groundwater resource management in coastal aquifers of East Africa: Investigations and lessons learnt in the Comoros Islands, Kenya and Tanzania. J. Hydrol. Reg. Stud. 2016, 179, 2214–5818. [Google Scholar] [CrossRef]
  11. Nlend, B.; Celle-Jeanton, H.; Huneau, F.; Ketchemen-Tandia, B.; Fantong, W.Y.; Boum-Nkot, S.N.; Etame, J. The impact of urban development on aquifers in large coastal cities of West Africa: Present status and future challenges. Land Use Policy 2018, 75, 352–363. [Google Scholar] [CrossRef]
  12. Jenkins, R.; Edwards, C. The economic impacts of China and India on sub-Saharan Africa: Trends and prospects. J. Asian Econ. 2006, 17, 207–215. [Google Scholar] [CrossRef]
  13. Lagos Water Corporation. Stakeholder/CSO Interaction Policy with LSWC; Nigeria Network of NGOs: Lagos, Nigeria, 2016. [Google Scholar]
  14. Camwater. Planification et Maîtrise du Developpement Urbain: Passer des Idées Aux Actes; 1st National Urban Forum: Yaounde, Cameroon, 2014. (In French) [Google Scholar]
  15. SONEB. Alimentation en Eau Potable Des Populations au Bénin. 2013. Available online: http://wwwsonebcom/soneb2/99-archives/2016-01/10ans-yayiphp (accessed on 5 March 2021).
  16. SODECI. 1960/2010: Cinquante Ans au Service de la Cote D’Ivoire; SODECI: Abidjan, Côte d’Ivoire, Document Spécial; 2011; p. 51. (In French) [Google Scholar]
  17. Re, V.; Cissé Faye, S.; Faye, A.; Faye, S.; Gaye, C.B.; Sacchi, E.; Zuppi, G.M. Water quality decline in coastal aquifers under anthropic pressure: The case of a suburban area of Dakar (Senegal). Environ. Monit. Assess. 2011, 172, 605–622. [Google Scholar] [CrossRef]
  18. Houéménou, H.; Tweed, S.; Dobigny, G.; Mama, D.; Alassane, A.; Silmer, R.; Babic, M.; Ruy, S.; Chaigneau, A.; Gauthier, P.; et al. Degradation of Groundwater Quality in Expanding Cities in West Africa. A Case Study of the Unregulated Shallow Aquifer in Cotonou. J. Hydrol. 2020, 582, 124438. [Google Scholar] [CrossRef]
  19. Hounsinou, S.P. Assessment of potential seawater intrusion in a coastal aquifer system at Abomey-Calavi, Benin. Heliyon 2020, 6, e03173. [Google Scholar] [CrossRef]
  20. Maliki, R. Etude Hydrogéologique du Littoral Béninois Dans la Région de Cotonou (AO). Ph.D. Thesis, University of Cheick Anta Diop, Dakar, Senegal, 1993; p. 162. [Google Scholar]
  21. Boukari, M. Fonctionnement du Système Aquifère Exploité Pour L’approvisionnement en Eau de la Ville de Cotonou sur le Littoral Béninois. Impact du Développement Urbain sur la Qualité Des Ressources. Ph.D. Thesis, University of Cheick Anta Diop, Dakar, Senegal, 1998. [Google Scholar]
  22. McInnis, D.; Silliman, S.; Boukari, M.; Yalo, N.; Orou-Pete, S.; Fertenbaugh, C.; Sarre, K.; Fayomi, H. Combined Application of Electrical Resistivity and Shallow Groundwater Sampling to Assess Salinity in a Shallow Coastal Aquifer in Benin, West Africa. J. Hydrol. 2013, 505, 335–345. [Google Scholar] [CrossRef]
  23. Alassane, A.; Trabelsi, R.; Dovonon, L.F.; Odeloui, D.J.; Boukari, M.; Zouari, K.; Mama, D. Chemical evolution of the continental terminal shallow aquifer in the south of the coastal sedimentary basin of Benin (West Africa) using multivariate factor analysis. J. Water Resour. Prot. 2015, 7, 496–515. [Google Scholar] [CrossRef] [Green Version]
  24. Boukari, M.; Gaye, C.B.; Faye, A.; Faye, S. The Impact of Urban Development on Coastal Aquifers near Cotonou, Benin. J. Afr. Earth Sci. 1996, 22, 403–408. [Google Scholar] [CrossRef]
  25. Alahacoon, N.; Edirisinghe, M.; Simwanda, M.; Perera, E.; Nyirenda, V.R.; Ranagalage, M. Rainfall Variability and Trends over the African Continent Using TAMSAT Data (1983–2020): Towards Climate Change Resilience and Adaptation. Remote Sens. 2022, 14, 96. [Google Scholar] [CrossRef]
  26. Alassane, A. Etude Hydrogéologique du Continental Terminal et des Formations de la Plaine Littorale Dans la Région de Porto-Novo (Sud du Bénin): Identification des Aquifères et Vulnérabilité de la Nappe Superficielle. Ph.D. Thesis, University of Cheick Anta Diop, Dakar, Sénégal, 2004; p. 145. [Google Scholar]
  27. Chouti, W.; Mama, D.; Alapini, F. Étude des variations spatio-temporelles de la pollution des eaux de la lagune de Porto-Novo (sud Bénin). Int. J. Biol. Chem. Sci. 2010, 4, 1017–1029. [Google Scholar] [CrossRef]
  28. Mama, D.; Deluchat, V.; Bowen, J.; Chouti, W.; Yao, B.; Gnon, B.; Baudu, M. Caractérisation d’un Système Lagunaire en Zone Tropicale: Cas du lac Nokoué (Bénin). Eur. J. Sci. Res. 2011, 56, 516–528. [Google Scholar]
  29. Amoussou, E.; Camberlin, P.; Totin, S.H.; Tramblay, Y.; Houndenou, C.; Mahé, G.; Paturel, J.-E.; Boko, M. Evolution des précipitations extrêmes dans le bassin versant du mono (bénin-togo) en contexte de variabilité/changement climatique. In Climat: Système & Interactions. 27ème Colloque de l’Association Internationale de Climatologie; Association Internationale de Climatologie: Dijon, France, 2014. (In France) [Google Scholar]
  30. Slansky, M. Contribution à L’étude Géologique du Bassin Sédimentaire Côtier du Dahomey et du Togo; série 59, 165. Mém; BRGM n°11: Orléans, France, 1962. [Google Scholar]
  31. Oyédé, L.M. Dynamique Sédimentaire Actuelle et Messages Enregistrés Dans Les Séquences Quartenaires et Néogènes Du Domaine Margino Littoral Du Bénin (l’Afrique de l’Ouest). Ph.D. Thesis, Université de Bourgogne, Dijon, France, 1991. [Google Scholar]
  32. Lang, J.; Anthony, E.-J.; Oyédé, L.-M. Late quaternary sediments in incised coastal valleys in Benin: A preliminary sequence-stratigraphic interpretation. Quat. Int. 1995, 29, 31–39. [Google Scholar] [CrossRef]
  33. Penman, H.L. The dependence on transpiration on weather and soil conditions. J. Soil Sci. 1949, 1, 74. [Google Scholar] [CrossRef]
  34. Pallas, P. Contribution à L’étude des Ressources en Eau Souterraine du Bassin Côtier du Bénin. Confrontation Ressources—Besoins; Rapport du Projet PNUD: Cotonou, Bénin, 1988. [Google Scholar]
  35. Penna, D.; Stenni, B.; Sanda, M.; Wrede, S.; Bogaard, T.A.; Gobbi, A.; Borga, M.; Fischer, B.M.C.; Bonazza, M.; Charova, Z. On the reproducibility and repeatability of laser absorption spectroscopy measurements for δ2H and δ18O isotopic analysis. Hydrol. Earth Syst. Sci. Discuss. 2010, 14, 2975–3014. [Google Scholar] [CrossRef] [Green Version]
  36. Davis, S.; DeWiest, R.M. Hydrogeology; Wiley: New York, NY, USA, 1966. [Google Scholar]
  37. Foster, S.S.D.; Hirata, R.; Gomes, D.; D’Elia, M.; Paris, M. Groundwater Quality Protection: A Guide for Water Utilities, Municipal Authorities and Environment Agencies; World Bank: Washington, DC, USA, 2003. [Google Scholar]
  38. Craig, H. Isotopic variation in meteoric waters. Science 1961, 1133, 1702–1703. [Google Scholar] [CrossRef] [PubMed]
  39. Dansgaard, W. Stable isotopes in precipitation. Tellus 1964, 16, 436–468. [Google Scholar] [CrossRef]
  40. Winter, T.C.; Harvey, O.; Franke, L.; Alley, W. Ground Water and Surface Water: A Single Resource; U.S. Geological Survey Circular: Denver, CO, USA, 1998; Volume 1139. [Google Scholar]
  41. Sophocleous, M. Interactions between groundwater and surface water: The state of the science. Hydrogeol. J. 2002, 10, 52–67. [Google Scholar] [CrossRef]
  42. Winter, T.C. Relation of streams, lakes, and wetlands to groundwater flow systems. Hydrogeol. J. 1999, 7, 28–45. [Google Scholar] [CrossRef]
  43. WHO. Guidelines for Drinking Water Quality, 4th ed.; World Health Organization: Geneva, Switzerland, 2011. [Google Scholar]
  44. McArthur, J.M.; Sikdar, P.K.; Hoque, M.A.; Ghosal, U. Waste-water impacts on groundwater: Cl/Br ratios and implications for arsenic pollution of groundwater in the Bengal Basin and Red River Basin, Vietnam. Sci. Total Environ. 2012, 437, 390–402. [Google Scholar] [CrossRef] [Green Version]
  45. Aladejana, J.A.; Kalin, R.M.; Sentenac, P.; Hassan, I. Assessing the Impact of Climate Change on Groundwater Quality of the Shallow Coastal Aquifer of Eastern Dahomey Basin, Southwestern Nigeria. Water 2020, 12, 224. [Google Scholar] [CrossRef] [Green Version]
  46. Vengosh, A.; Ben-Zvi, A. Formation of salt plume in the coastal plain aquifer of Israel: The Be’er Toviyya region. J. Hydrol. 1994, 160, 21–52. [Google Scholar] [CrossRef]
  47. Vengosh, A.; Rosenthal, E. Saline groundwater in Israel: Its bearing on the water crisis in the country. J. Hydrol. 1994, 156, 389–430. [Google Scholar] [CrossRef]
  48. Raghunath, H.M. Text Book of Ground Water, 3rd ed.; New Age International Publishers: New Delhi, India, 2005. [Google Scholar]
  49. Metcalf and Eddy Consultant Co. (Camp Dresser and McKee Inc.). Coastal Aquifer Management Program, Integrated Aquifer Management Plan (Gaza Strip); Metcalf and Eddy Consultant Co. (Camp Dresser and McKee Inc.): Gaza, Palestine, 2001. [Google Scholar]
  50. Ghabayen, S.M.S.; McKee, M.; Kemblowski, M. Ionic and isotopic ratios for identification of salinity sources and missing data in the Gaza aquifer. J. Hydrol. 2006, 318, 360–373. [Google Scholar] [CrossRef]
  51. Maurya, P.; Kumari, R.; Mukherjee, S. Hydrochemistry in integration with stable isotopes (δ18O and δD) to assess seawater intrusion in coastal aquifers of Kachchh district, Gujarat, India. J. Geochem. Explor. 2019, 196, 42–56. [Google Scholar] [CrossRef]
  52. Stuyfzand, P.J. Base exchange indices as indicators of salinization or freshening of (coastal) aquifers. In Proceedings of the 20th Salt Water Intrusion Meeting, Naples, FL, USA, 23–27 June 2008; pp. 262–265. Available online: http://www.swim-site.nl/pdf/swim20/file281-284.pdf (accessed on 12 April 2021).
  53. Appelo, C.A.J.; Postma, D. Geochemistry, Groundwater and Pollution, 2nd ed.; Appelo, C.A.J., Postma, D., Eds.; CRC Press: Boca Raton, FL, USA, 2005. [Google Scholar] [CrossRef]
  54. Rina, K.; Datta, P.S.; Singh, C.; Mukherjee, S. Characterization and evaluation of processes governing the groundwater quality in parts of the Sabarmati basin, Gujarat using hydrochemistry integrated with GIS. Hydrol. Processes 2011, 26, 1538–1551. [Google Scholar] [CrossRef]
  55. Han, G.; Liu, C.-Q. Water geochemistry controlled by carbonate dissolution: A study of the river waters draining karst-dominated terrain, Guizhou Province, China. Chem. Geol. 2004, 204, 1–21. [Google Scholar] [CrossRef]
  56. Nlend, B.; Celle-Jeanton, H.; Huneau, F.; Garel, E.; Boum-Nkot, S.; Etame, J. Shallow urban aquifers under hyper-recharge equatorial conditions and strong anthropogenic constrains. Implications in terms of groundwater resources potential and integrated water resources management strategies. Sci. Total Environ. 2021, 757, 143887. [Google Scholar] [CrossRef]
  57. Chung, I.M.; Sophocleous, M.A.; Mitiku, D.B.; Kim, N.W. Estimating groundwater recharge in the humid and semi-arid African regions: Review. Geosci. J. 2016, 20, 731–744. [Google Scholar] [CrossRef]
  58. N’Tcha M’Po, Y.; Lawin, E.A.; Yao, B.K.; Oyerinde, G.T.; Attogouinon, A.; Afouda, A.A. Decreasing Past and Mid-Century Rainfall Indices over the Ouémé River Basin, Benin (West Africa). Climate 2017, 5, 74. [Google Scholar] [CrossRef] [Green Version]
  59. Onwuka, M.; Adekile, D. Demand-Recharge Study of the Groundwater Resources of the Ikeja Area of Lagos State, Nigeria. In Proceedings of the 1st Annual Symposium on Aquifer Vulnerability and Risk, Lagos, Nigeria; Nigeria Water and Sanitation Association: Lagos, Nigeria, 1986; pp. 175–197. [Google Scholar]
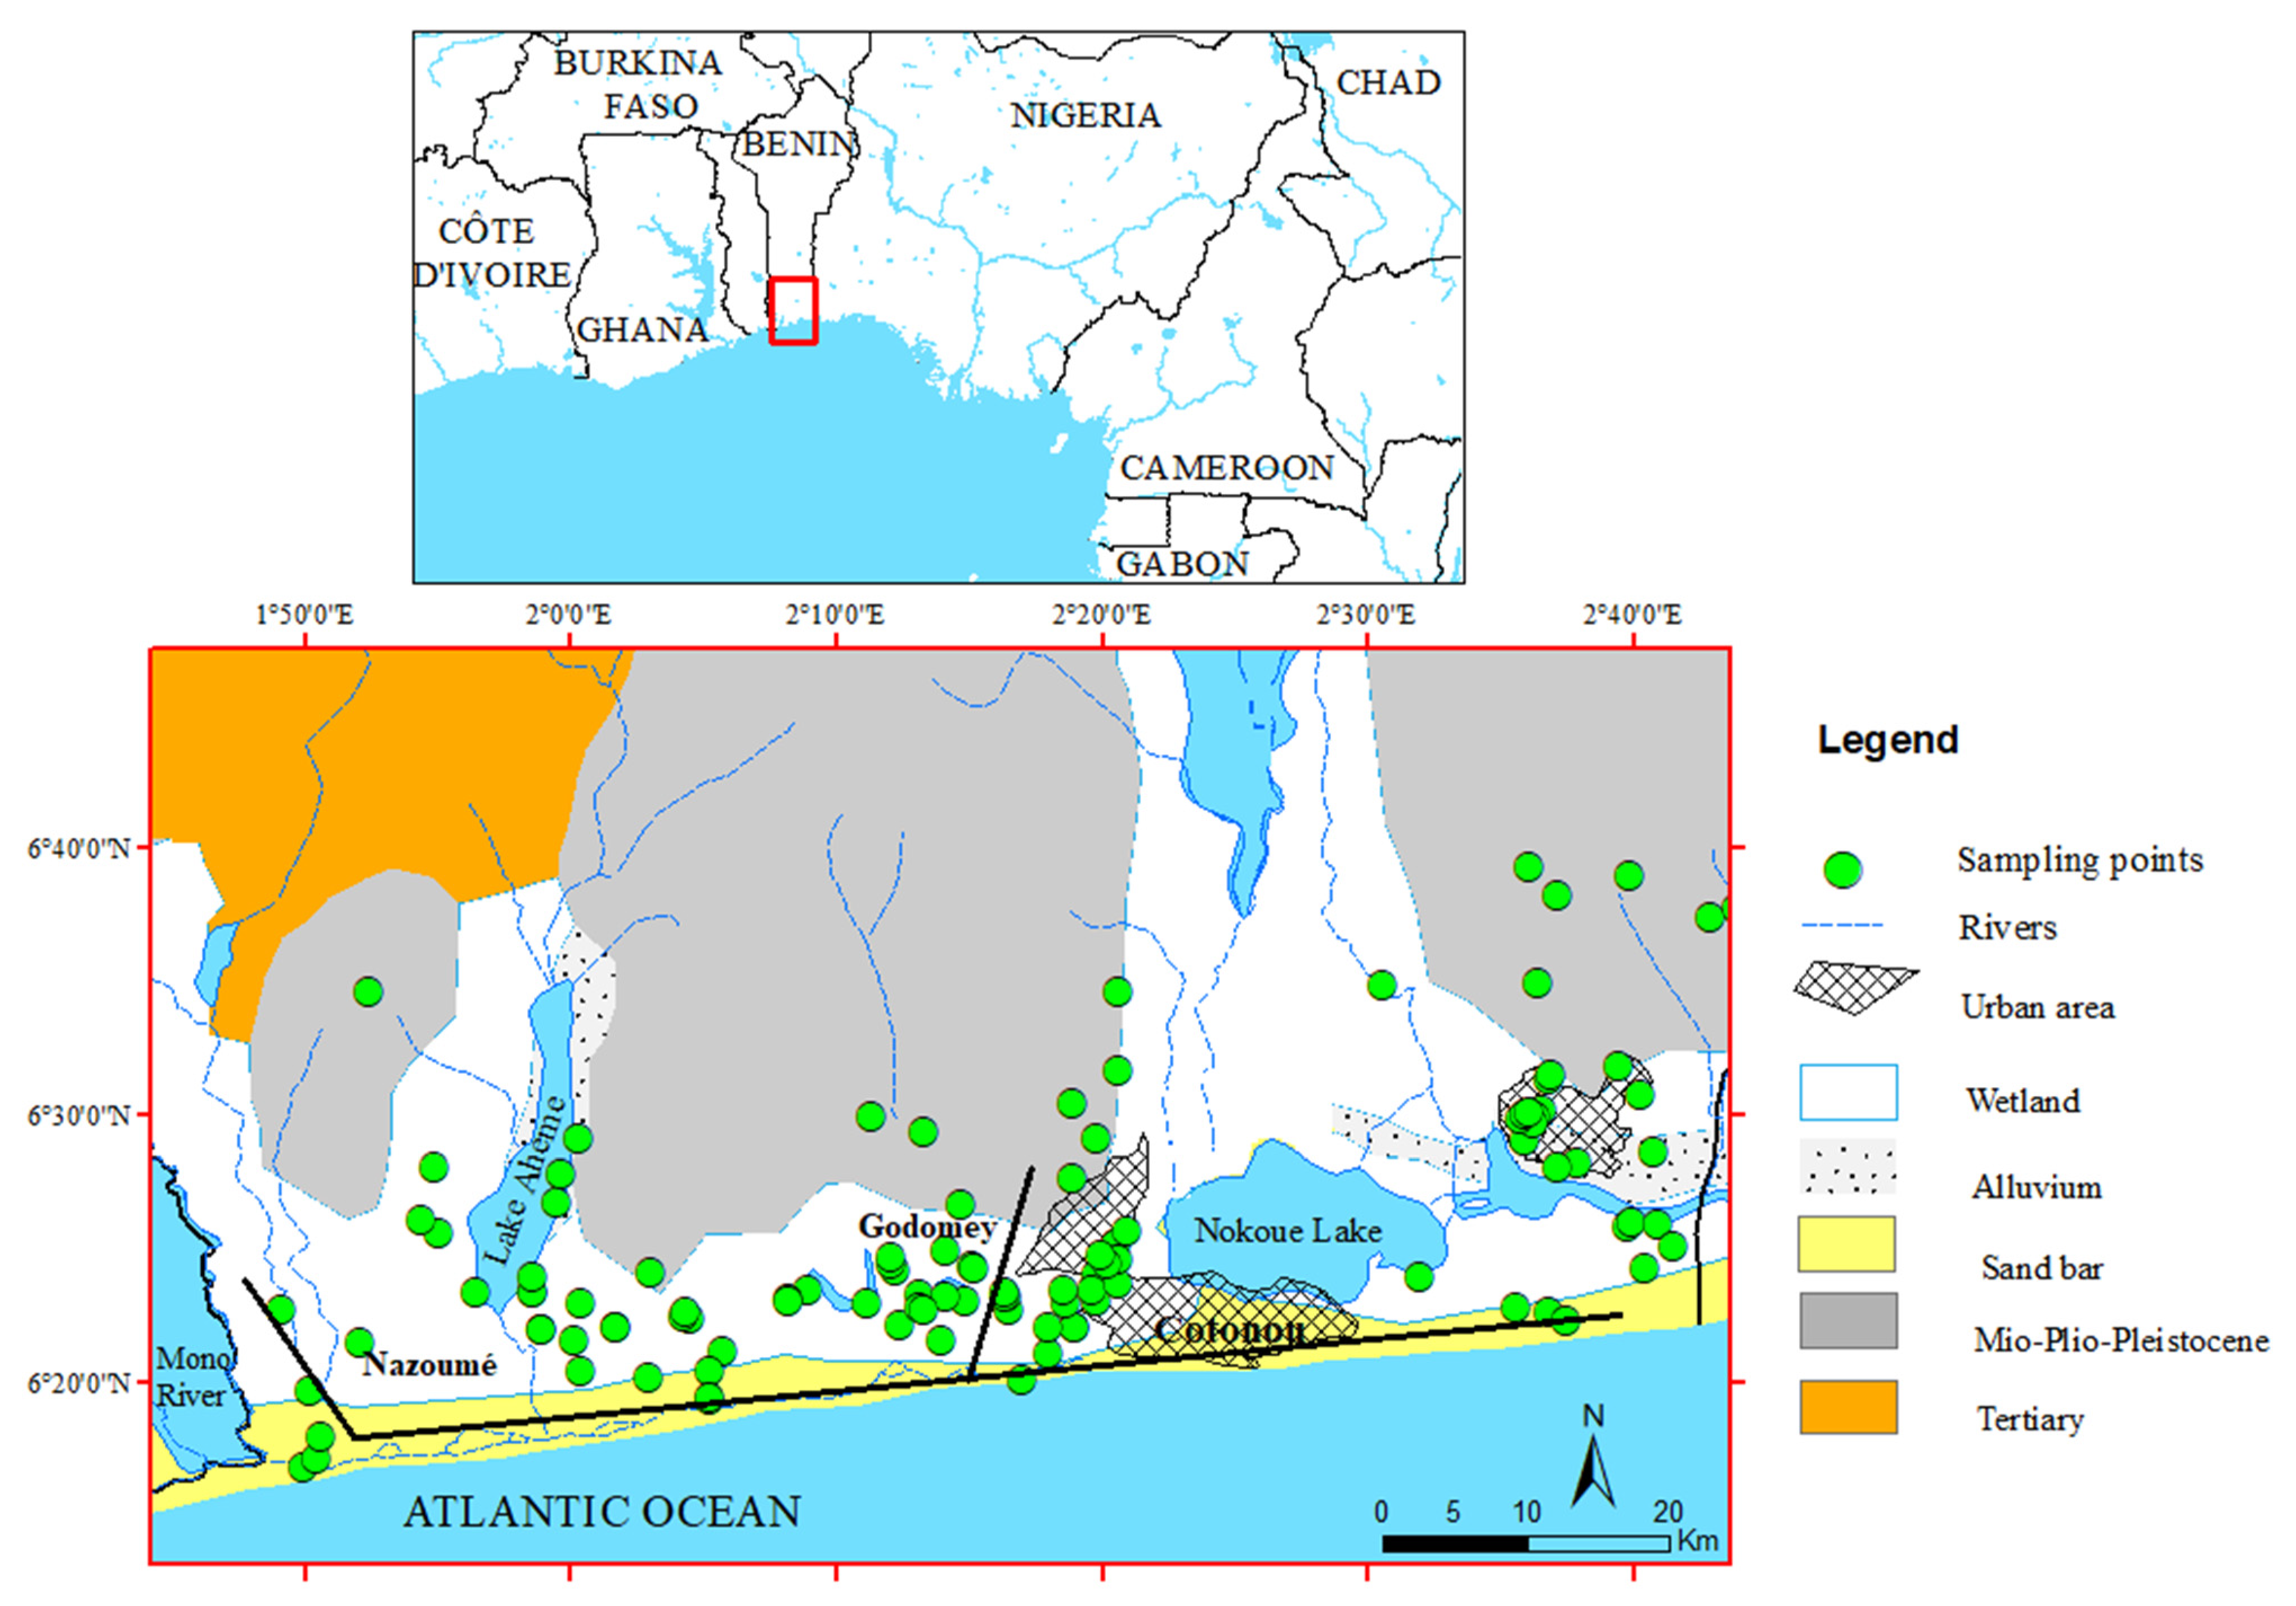
Figure 1. Location and geology of the study area with sampling points. The urban areas of Cotonou (the southernmost), Abomey-Calavi (north of Cotonou), and Porto-Novo (the easternmost) are also highlighted. Black straight lines represent cut line used later for geological cross sections.
Water 14 02154 g001
Figure 2. Longitudinal NNW-SSE geological cross section of the coastal sedimentary basin of Benin (modified from [21]). Question marks indicate levels or depths with no available data or references. Vertical axis is in meters above sea level (m asl).
Water 14 02154 g002
Figure 3. West–East geological cross section along the coastal plain of Benin [20,21,26]. Question marks indicate levels or depths with no available data or references. Vertical axis is in meters above sea level.
Water 14 02154 g003
Figure 4. Piper diagram of coastal groundwater in Benin. The chemical composition of seawater, Mono River, Lake Nokoué, and lagoons are also plotted.
Water 14 02154 g004
Figure 5. Stable isotope compositions of groundwater in the coastal area of Benin. The isotope contents of Mono River, Lake Nokoué, local lagoons, and seawater are also plotted as well as the Local Meteoric Water Line (δ2H = 7.5δ18O + 10), the Global Meteoric Water Line (δ2H = 8δ18O + 10), the lines showing trends of mixing between ground and surface waters, and also the weighted mean rainfall composition.
Water 14 02154 g005
Figure 6. Plot of NO3 (mg/L) versus Cl (mg/L) showing different sources of pollution. The dashed line corresponds to NO3 natural background level.
Water 14 02154 g006
Figure 7. Hydrochemical Facies Evolution diagram of groundwater samples for the (A) lower aquifer and (B) upper aquifer in southern Benin.
Water 14 02154 g007
Figure 8. Bivariate plots of molar ratio according to [53,54,55]. (A) Na-normalized Ca versus Na-normalized HCO3. (B) Na-normalized Ca versus Na-normalized Mg for upper (red color) and lower (green color) aquifers.
Water 14 02154 g008
Figure 9. Bivariate plots of ionic relation. (A) Na+ + K+ versus Cl-. (B) Ca2+ + Mg2+ versus HCO3 + SO42− for coastal aquifers in Benin. The bisector represents the 1:1 dissolution line.
Water 14 02154 g009
Figure 10. Main hydrogeological characteristics and proposals to enhance the aquifer protection strategies.
Water 14 02154 g010
Table 1. Statistical description of field and laboratory data.
pHECTNa+K+Mg2+Ca2+ClBrNO3SO42−HCO3δ18Oδ2HD-Excess
Upper aquifer
(n = 59)
Min3.457.727.55.20.10.30.76.90.00.00.82.40.70.05.9
Max7.912,360.031.21678.397.5420.2803.13693.223.3215.2557.6414.82.318.913.9
Median5.8391.028.936.45.45.022.546.10.211.817.334.21.31.79.7
Average5.8766.528.998.612.716.746.7157.40.848.649.355.91.32.39.5
SD0.8711.90.6105.912.020.240.9196.31.054.350.648.60.31.41.2
Lower aquifer
(n = 48)
Min4.231.128.13.30.10.41.01.90.00.00.02.4−4.6−25.57.5
Max7.1483.032.148.944.011.845.978.50.281.836.0176.9−3.0−15.013.4
Median5.052.629.85.70.40.81.77.80.02.22.87.3−3.4−17.110.1
Average5.190.629.99.12.11.74.411.60.07.44.316.6−3.4−17.410.1
SD0.457.20.75.72.71.54.67.20.08.73.417.60.21.21.1
Effective rainfallMin-24.9-1.20.40.20.92.20.021.01.81.7---
Max-115.6-3.82.10.63.56.20.043.65.617.4---
Median-68.0-2.21.00.42.04.20.032.13.46.6---
Average-67.6-2.21.20.42.14.20.032.03.58.5---
SD-29.0-0.30.20.10.81.30.010.91.36.2---
EC: electrical conductivity in µS/cm, T: temperature in °C. Major ions are expressed in mg/L and δ18O, δ2H, and d-excess (deuterium-excess) are given in ‰ VSMOW.
Publisher’s Note: MDPI stays neutral with regard to jurisdictional claims in published maps and institutional affiliations.