Article

Study on the Mechanism and Prevention Method of Frozen Wall Maldevelopment Induced by High-Flow-Rate Groundwater

1
School of Civil Engineering and Architecture, Anhui University of Science and Technology, Huainan 232001, China
2
Postdoctoral Research Station, China Coal Mine Construction Group Co., Ltd., Hefei 230091, China
3
Safety Science and Engineering Postdoctoral Research Station, Anhui University of Science and Technology, Huainan 232001, China
*
Author to whom correspondence should be addressed.
Water 2022, 14(13), 2077; https://doi.org/10.3390/w14132077
Submission received: 13 May 2022 / Revised: 23 June 2022 / Accepted: 28 June 2022 / Published: 29 June 2022

Abstract

:
In order to solve the engineering problem of the increase in closure time or even the failure of closure of the frozen wall in the high-velocity permeable stratum, the maldevelopment mechanism of frozen walls induced by high-flow-rate groundwater was studied by a similar physical model test. The results show that the flowing groundwater reduced the heat transfer efficiency of the freezing pipes and changed the spatial distribution of the frozen area. The closure time of the frozen wall and the non-uniformity coefficient of the frozen wall thickness increased with the increase of the groundwater velocity. Based on the maldevelopment mechanism of frozen wall induced by groundwater, the artificial freezing scheme of permeable stratum with high seepage velocity was optimized. For the scheme of single-circle freezing holes, the optimization method of reducing the spacing between freezing holes and adding auxiliary freezing holes upstream of water flow was proposed. For the scheme of double-circle freezing holes, the optimization method of local variable pipe spacing was proposed. The optimization effect of several schemes was predicted and analyzed by numerical calculation, the results show that: in the optimized design scheme of single-circle freezing holes, both methods of local compaction and adding auxiliary freezing holes upstream could effectively shorten the closure time of frozen walls, and increase the maximum velocity at which the frozen wall can be closed. The optimum spacing of auxiliary freezing pipes under different groundwater velocity was obtained by calculation. In the optimized design scheme of double-circle freezing holes, the spacing of freezing holes in different regions was optimized and adjusted according to the degree of influence of water flow on freezing temperature fields under the condition that the number of freezing holes was kept constant. After adopting this optimization scheme, the limit flow velocity of frozen walls can be closed increased significantly. This study could provide reference for the arrangement of freezing holes in high-velocity permeable formation.

1. Introduction

Since German engineer Poetsch proposed the principle of artificial ground freezing in 1984 and successfully applied it to the shaft sinking project of the No. 9 shaft of the Albali Coal Mine, this method had gradually developed into one of the main construction methods for underground engineering construction in water-rich formations [1,2,3,4,5,6,7,8]. Theoretical research and a large number of engineering practices showed that the main natural factors affecting the formation of the frozen wall were soil (lithology), water content, and groundwater flow velocity [9,10,11,12,13,14,15]. Among them, due to the lack of attention to the influence of groundwater velocity in the freezing design, engineering problems such as the time lag of the closure or even the failure of the closure of the frozen wall had occurred from time to time. Some examples of projects that were adversely affected by groundwater are shown in Table 1. Therefore, it was of great engineering significance to study the mechanism of maldevelopment of frozen walls induced by high-flow-rate groundwater and to propose an optimal layout scheme for freezing holes.
In response to this problem, in terms of experimental research, a large number of scholars have conducted similar model tests on the formation of single-pipe, double-pipe and multi-pipe freezing temperature fields under the action of groundwater [9,10,11,12,13,14,15,16,17,18,19,20]. In terms of numerical calculation research, in the 1970s, Harlan [21] was the first to put forward the coupled model of hydrothermal migration. Subsequently, many scholars at home and abroad made extensive studies on this basis. Xu et al. [22] synthesized the research results at home and abroad and presented a coupled mathematical model of temperature field–seepage field of low-temperature rock mass with phase change. Gao et al. [23] and Liu et al. [24] studied the formation rules of temperature fields in vertical shafts and horizontal freezing under the action of groundwater by using the finite element method, respectively. In order to simulate the artificial ground freezing process in saturated non-deformable porous media under seepage conditions. Vitel et al. [25,26,27] constructed a hydrothermal numerical model consistent with thermodynamics and simplified the commonly used restrictive assumptions. Ahmed et al. [28] combined with “ant colony algorithm”, optimized the layout position of the freezing pipe under the action of groundwater with low flow rate, thus shortening the closure time of the frozen wall and making the thickness of the frozen wall more uniform. Zhou et al. [29,30] proposed a three-phase finite element model to describe the THM (thermos–hydro–mechanics) coupling behavior of frozen soil within the framework of hot hole plasticity and pre-melting dynamics, and verified the applicability of the model through soil freezing tests during tunneling. Mahmoud et al. [31,32] used enthalpy-porosity methods to build a numerical calculation model of hydrothermal coupling, and verified the rationality of the model through experiments. Hu et al. [33] established a fully coupled numerical model to simulate the changes of temperature field and subsurface flow field based on the heat transfer and seepage theory of the finite element method in porous media. Huang et al. [34,35,36] developed a hydrothermal coupling model to simulate the influence of water flow on the freezing process, and combined the model with the Nelder–Mead simplex method based on the COMSOL multi-physical field platform to optimize the placement of freezing pipes around the circular tunnel. Zhang et al. [37] established a numerical model of plate-comb freezing based on physical model tests, which can effectively reflect the results of physical model tests and reappear the development of freezing morphology, revealing the forming and temporal and spatial development of temperature fields of plate-comb freezing under seepage conditions.
The purpose of the study of the hydrothermal coupling problem should be to solve the adverse effects of groundwater on the artificial freezing temperature field. However, at present, the research results on the hydrothermal coupling calculation were mainly focused on the calculation theory and methods, and there were few studies on the optimization method of the freezing scheme under the action of groundwater and the only results were difficult to implement in practical projects. In this research, the mechanism of maldevelopment of frozen wall induced by groundwater was explored by model tests. Based on the results of model tests, considering the convenience and efficiency of the scheme in engineering site implementation, optimization schemes were proposed for freezing temperature fields of single-circle holes and multi-circle holes, respectively, and the effect of optimization schemes was predicted and analyzed by numerical calculation methods.

2. Experimental Study on the Mechanism of Maldevelopment of Frozen Wall Induced by High-Flow-Rate Groundwater

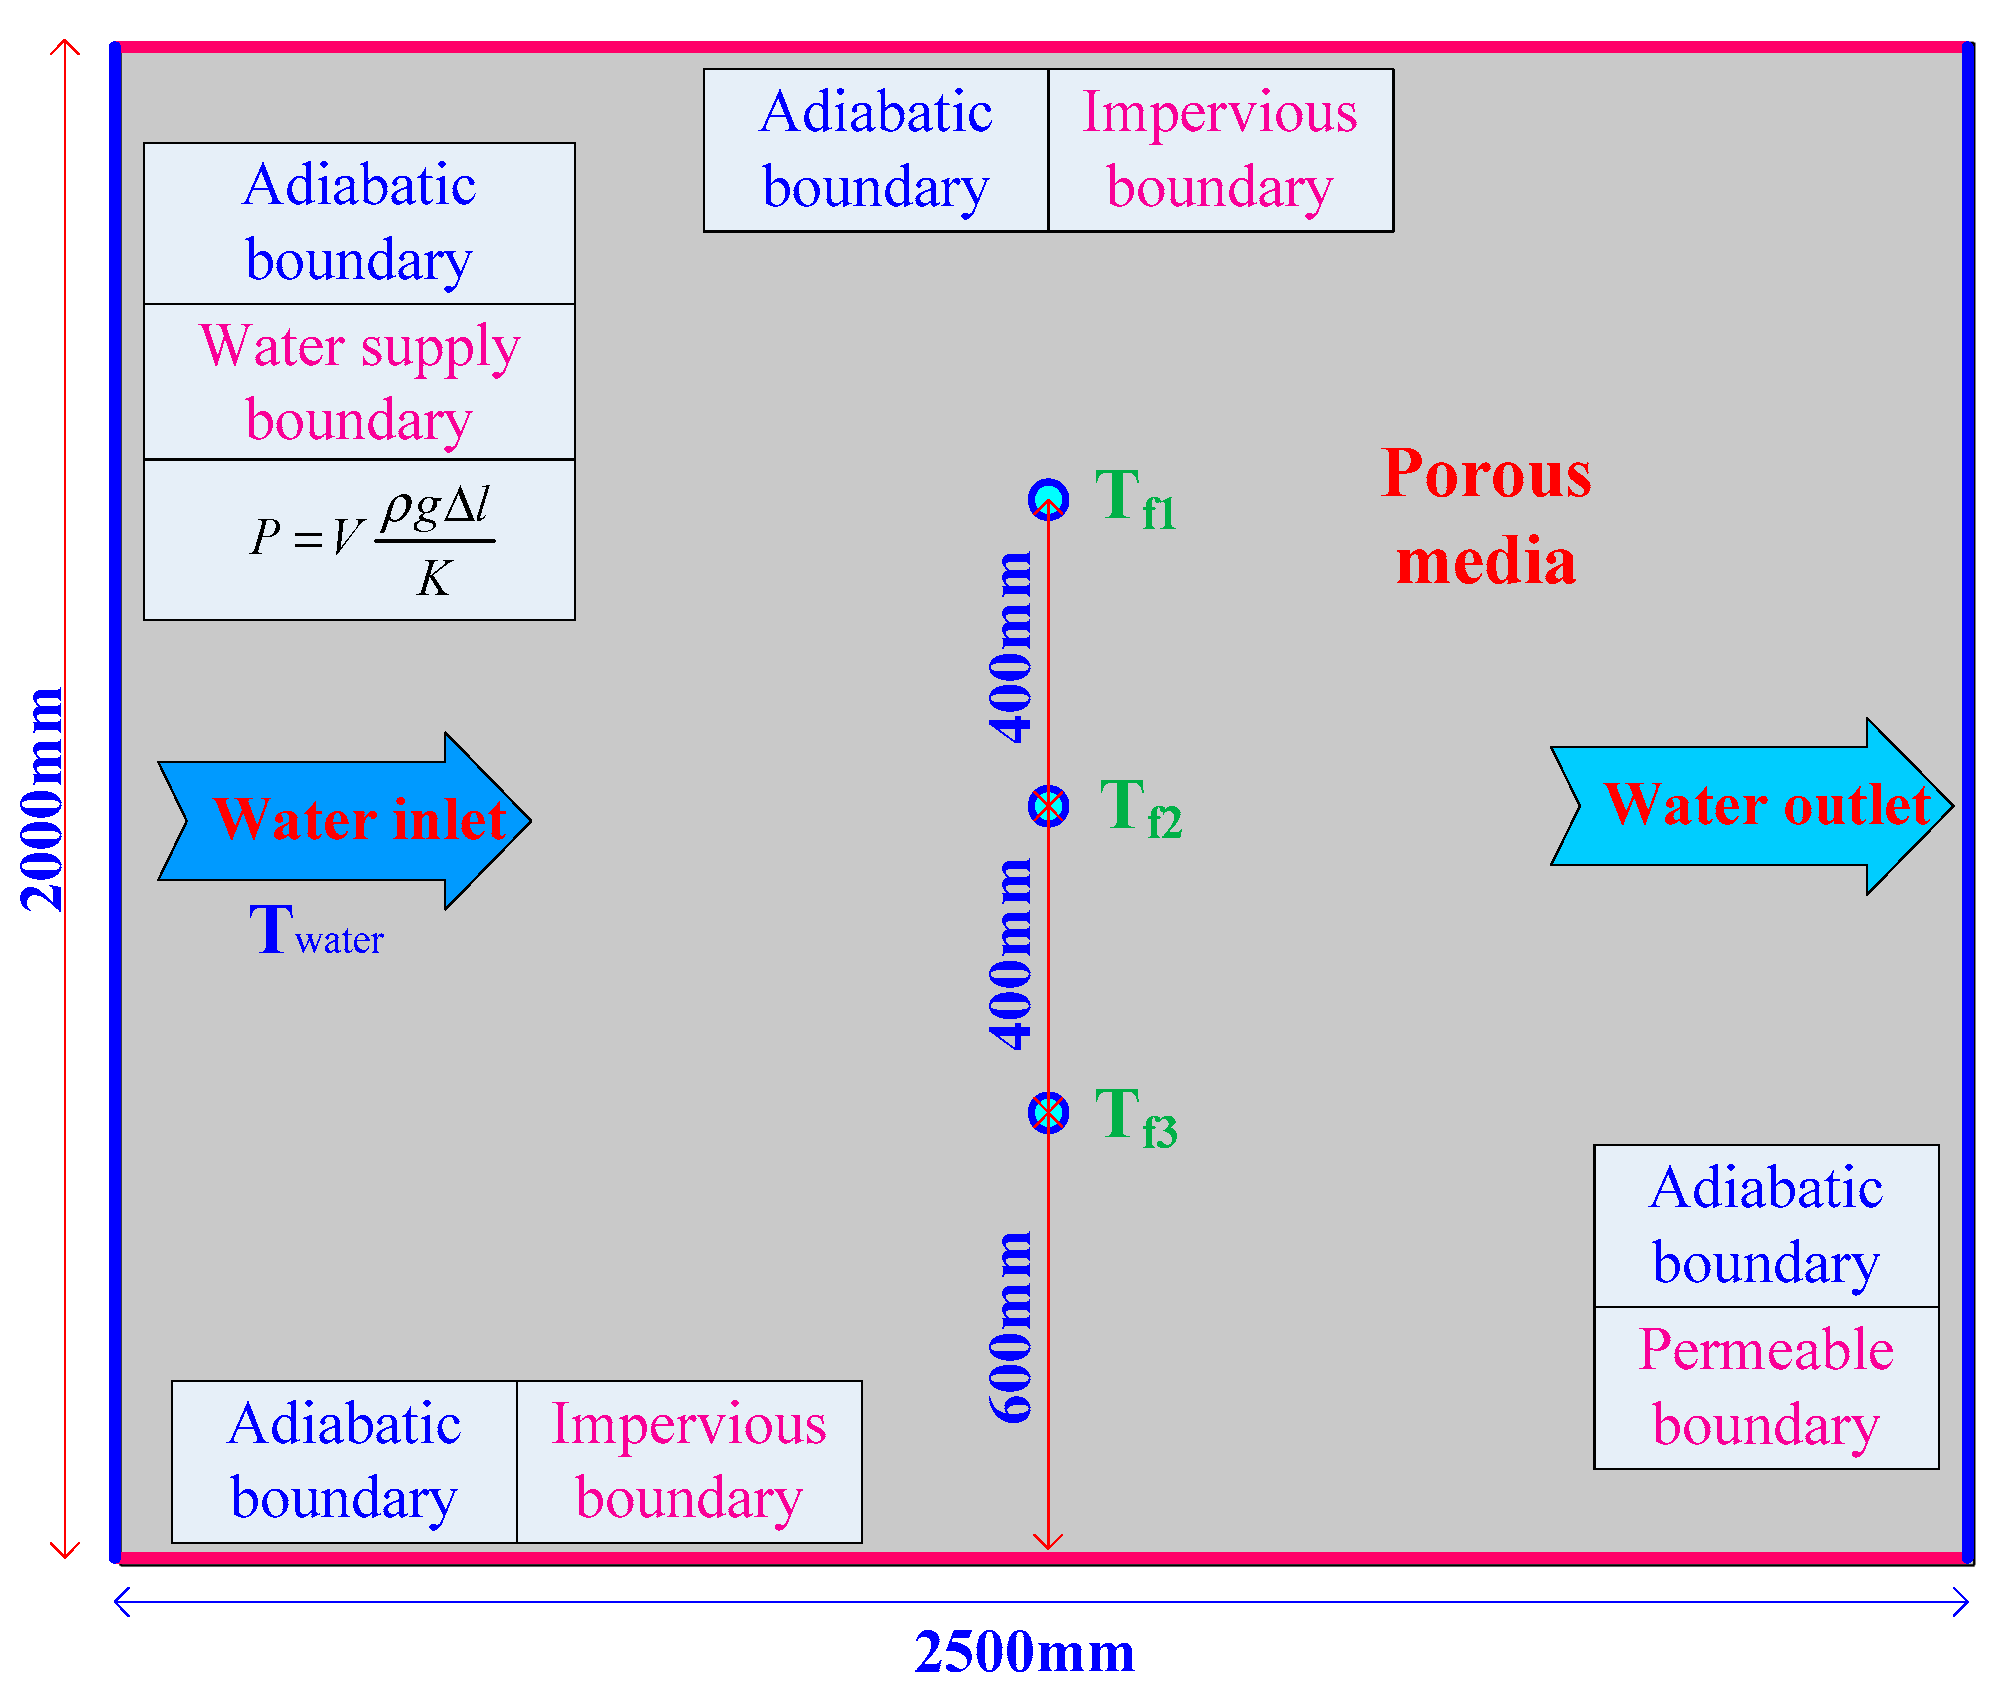
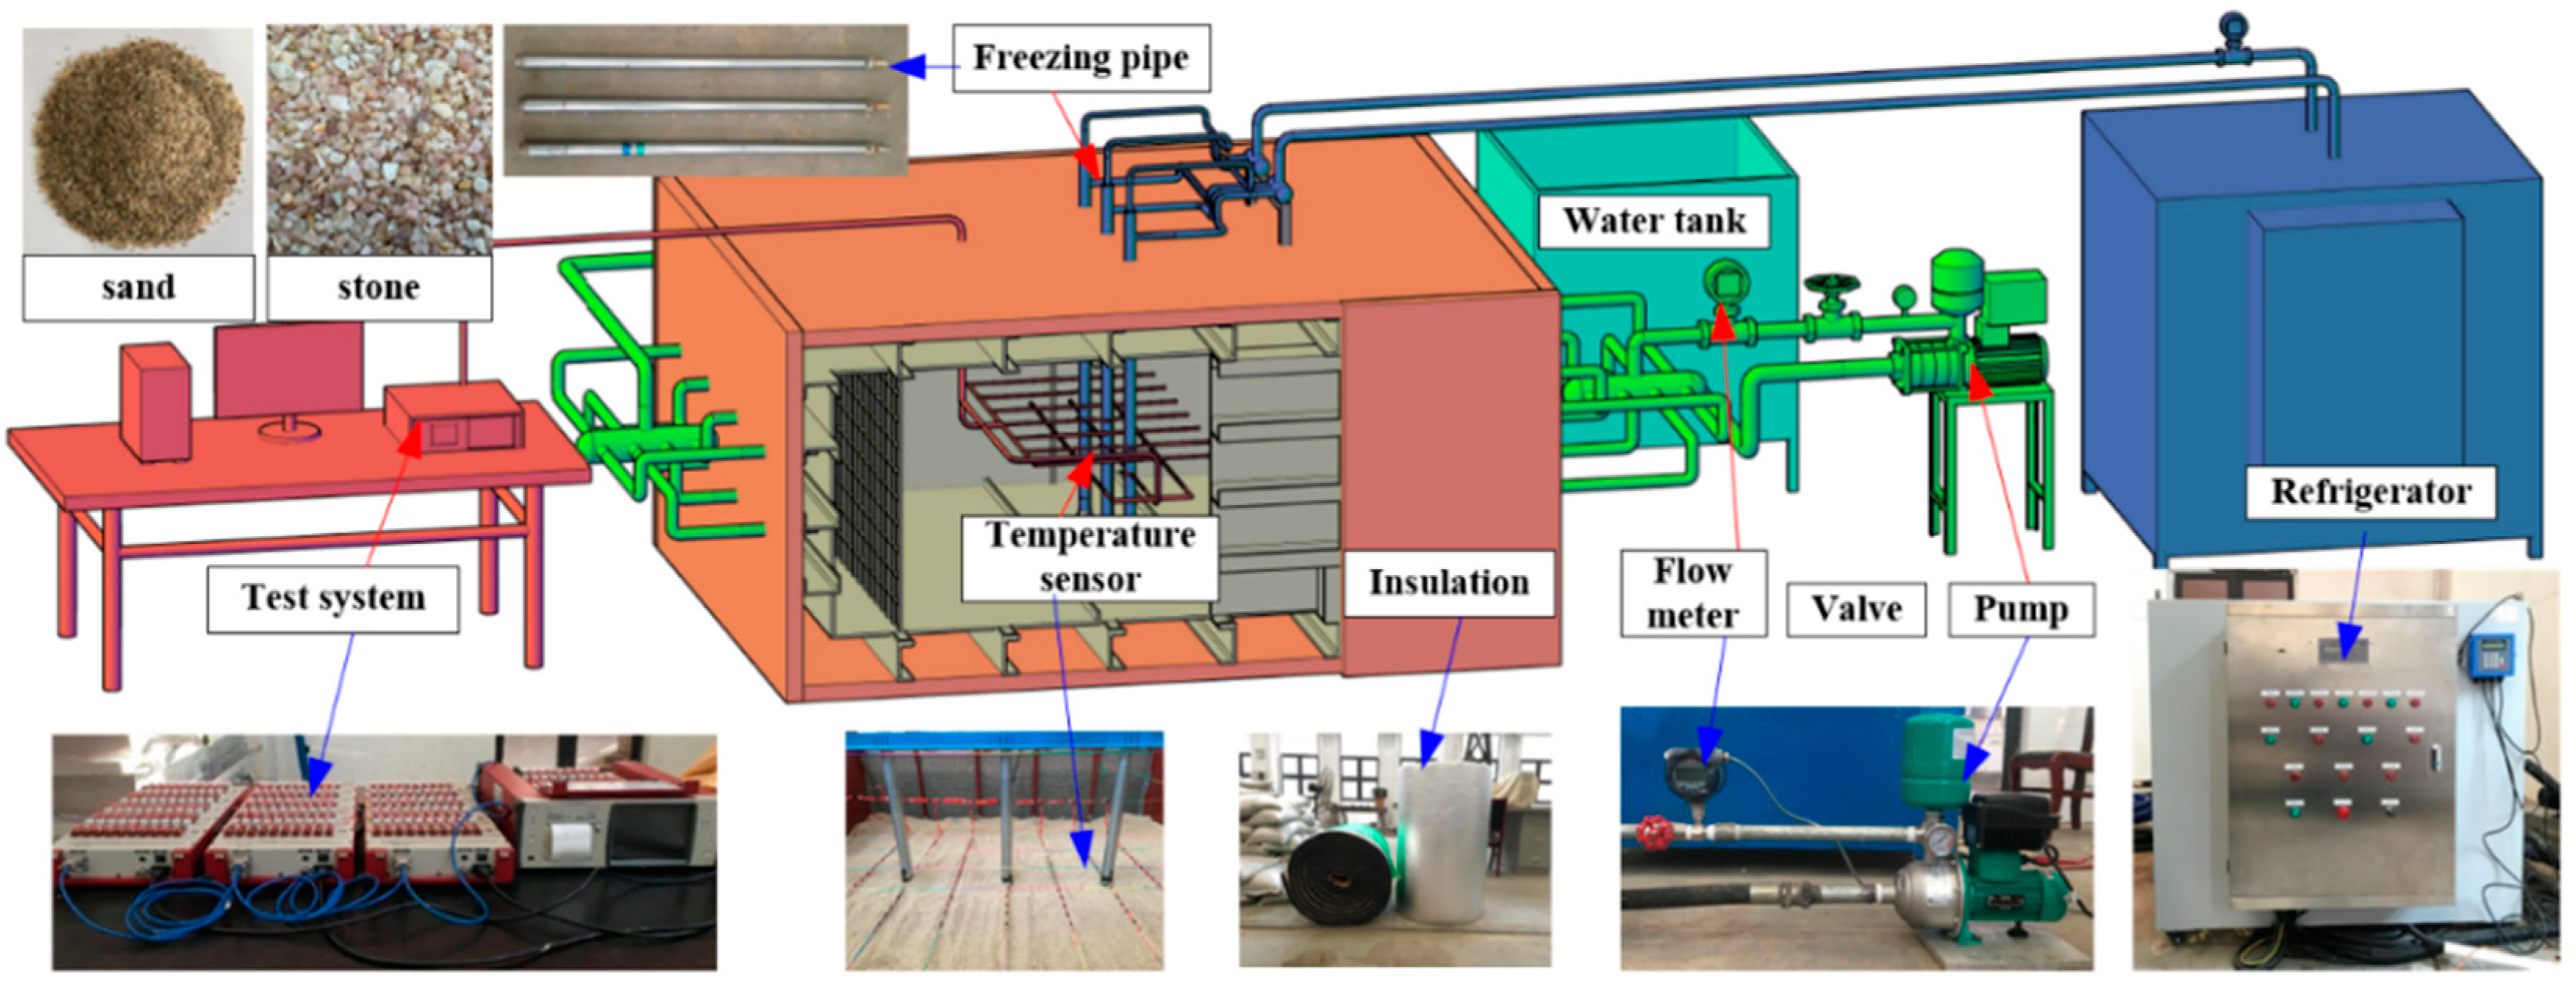
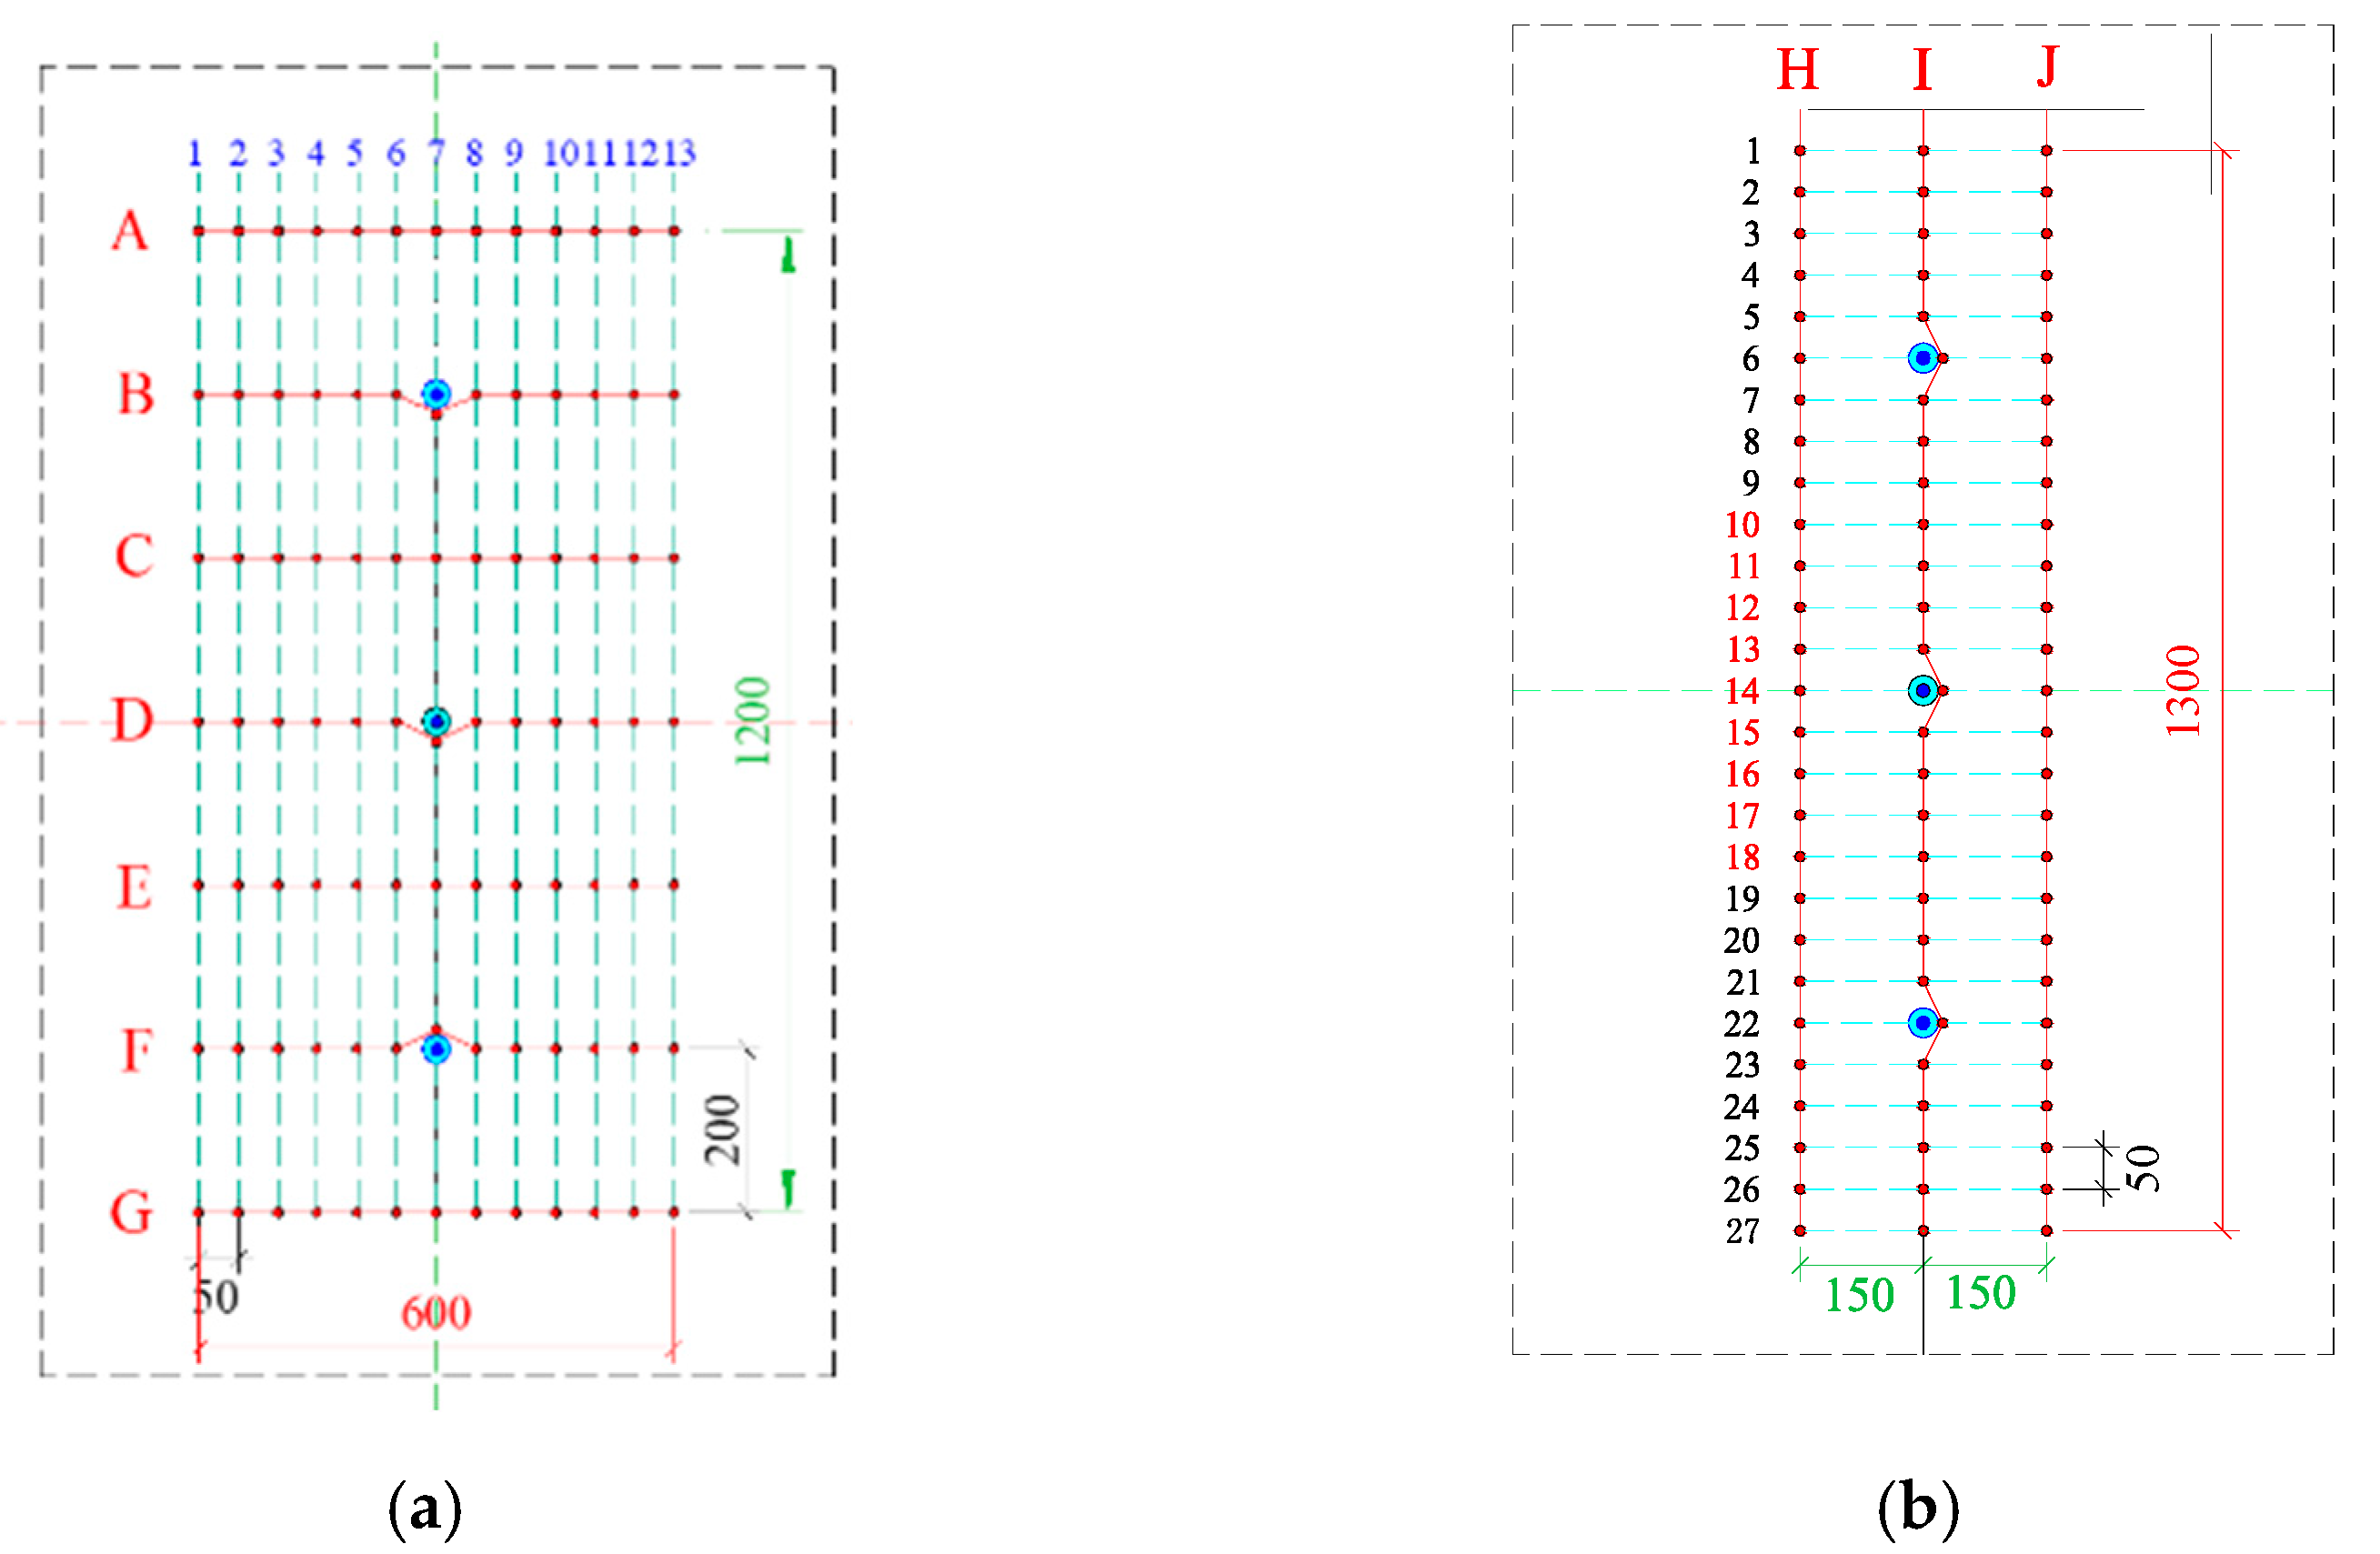
2.1. Model Test Design

The whole test system consisted of a porous medium test zone, freezing system, seepage field simulation system, and data acquisition system. The design of the test system is shown in Figure 1.
(1)
Porous media test area
The dimensions of the container were 2500 mm × 2000 mm ×1000 mm. Eight steel pipes with a size of 40 mm × 2 mm were installed at each end of the container as inflow and outflow pipes, respectively. The box was divided into 3 parts by two 100-mesh filters along the length direction. The middle part was the main laboratory with a length of 2000 mm, which was used to accommodate porous media, so as to ensure that the water flow along the box section evenly into the middle of the main test area. Three freezing pipes with an external diameter of 42 mm were arranged in a straight line at the central axis of the box, and the pipe spacing was 400 mm. The direction of flow was designed to be perpendicular to the straight line where the freezing pipes were located [18].
Homogeneous round sand with a particle size of 1 ± 0.15 mm was selected as the porous medium simulation material [18]. The particle size of sand was uniform and there were no impurities. During the filling process, it was compacted every 5 cm, so the porous medium could be approximately considered as homogeneous material.
(2)
Seepage simulation system
A constant pressure variable frequency pump was used to control the water flow to ensure that the water flow remained unchanged during each test. A thermostatic water tank was used to store water, which could keep the temperature of the water flow constant throughout the cycle. In engineering, the temperature of the stratum and groundwater was generally 15 °C, so the test water temperature was set at 15 °C in this experiment. If a conventional single-row pipe freezing scheme was adopted, the limit intersection flow rate of the frozen wall was lower than 10 m/d [38]. In order to reflect the influence of flow velocity gradient on the freezing temperature field, 4 groups of tests with flow velocity of 0, 3, 6 and 9 m/d were planned. In the test process, it was difficult to measure the flow velocity of groundwater directly, so the flow meter was used to monitor the water flow into and out of the box, and the average groundwater velocity was obtained from the ratio of water flow to the box sectional area. According to the calculated relationship between flow rate and speed, the flow rate of each group of tests is shown in Table 2.
(3)
Freezing system
In the actual engineering, CaCl2 solution was used as a refrigerant, whereas alcohol was used as refrigerant in the test. The thermal physical parameters of the two kinds of refrigerants are shown in Table 3. The refrigerant of the freezing pipe was generally controlled at −32 °C, and the flow rate of the refrigerant of a single freezing pipe was 4~10 m3/h. The similarity ratio of this model test was 3, according to the principle of similarity ratio and equal cooling capacity, the alcohol temperature of the refrigeration unit was set at −32 °C and the flow rate was 2.5 m3/h in the test through conversion, as shown in Table 4.
(4)
Data acquisition system
The temperature was tested by thermocouple, and the data were collected by a TDS-630 data acquisition instrument. The accuracy of the test system reached ± 0.1 °C. The main test plane of the test system was located at the 500 mm layer of the box, which was divided into 7 axes, and each axis was distributed with 13 measuring points with a spacing of 50 mm. The auxiliary test plane was located in the 400 mm layer of the box, which was divided into 3 axes, and each axis had 27 measuring points with a spacing of 50 mm. A total of 172 points were measured on the two test planes. The layout of measuring points is shown in Figure 2.

2.2. Analysis of Test Results

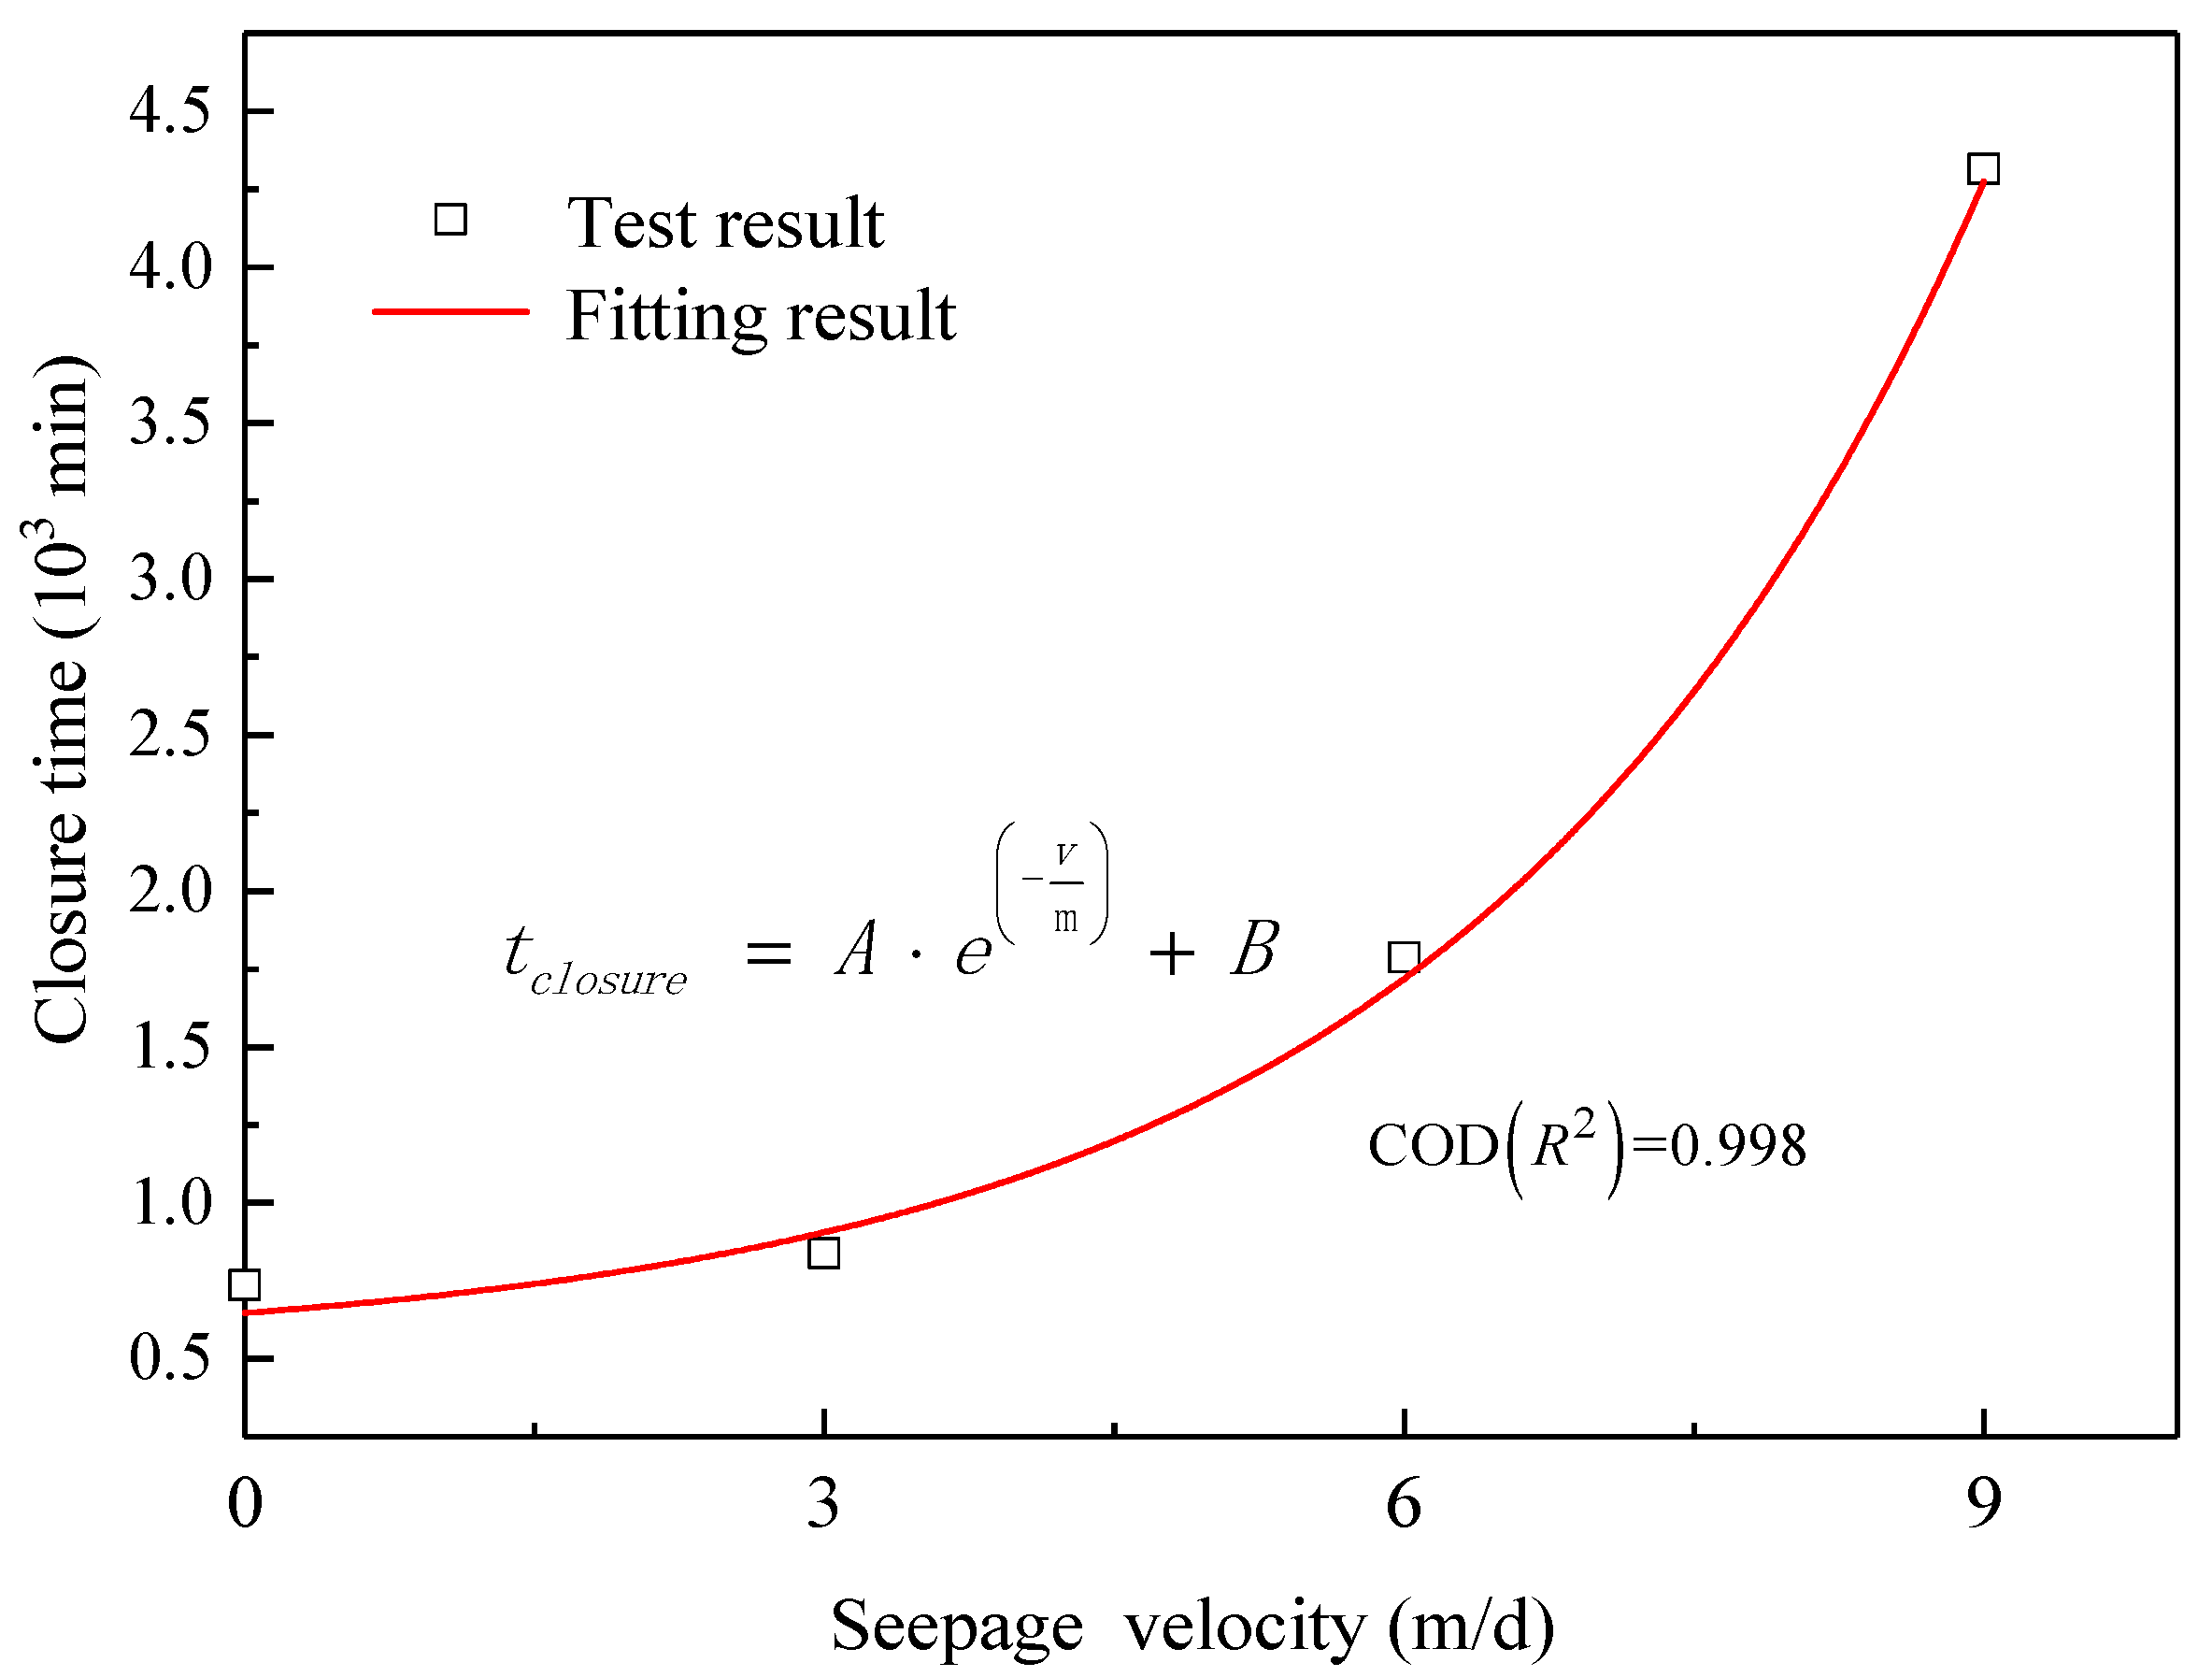
2.2.1. Influence of Groundwater Flow Rate on Closure Time of Frozen Walls

According to the low-field nuclear magnetic resonance (NMR) test results of low-temperature saturated porous media, the freezing temperature of the sand layer in the model test was −0.5 °C. In order to ensure the high security of the frozen wall, combined with the existing research results and engineering experience, the measurement point temperature of −1 °C was taken as the judgment basis of the frozen wall to be closed. The closure time of frozen wall obtained through the model test is shown in Table 5.
The analysis of the test data revealed that there was an approximate exponential relationship between the closure time of the frozen wall and the seepage velocity. An exponential function was used to fit the test results, and the fitting result is shown in Figure 3. Based on the fitting results, the following formula for predicting the closure time of the frozen wall under the action of the seepage field was proposed:
t closure = A e ( v m ) + B
where v was the seepage velocity, and A, B, and m were fitting parameters. In this experiment, their values were 120.46, 526.57, and −2.62, respectively.

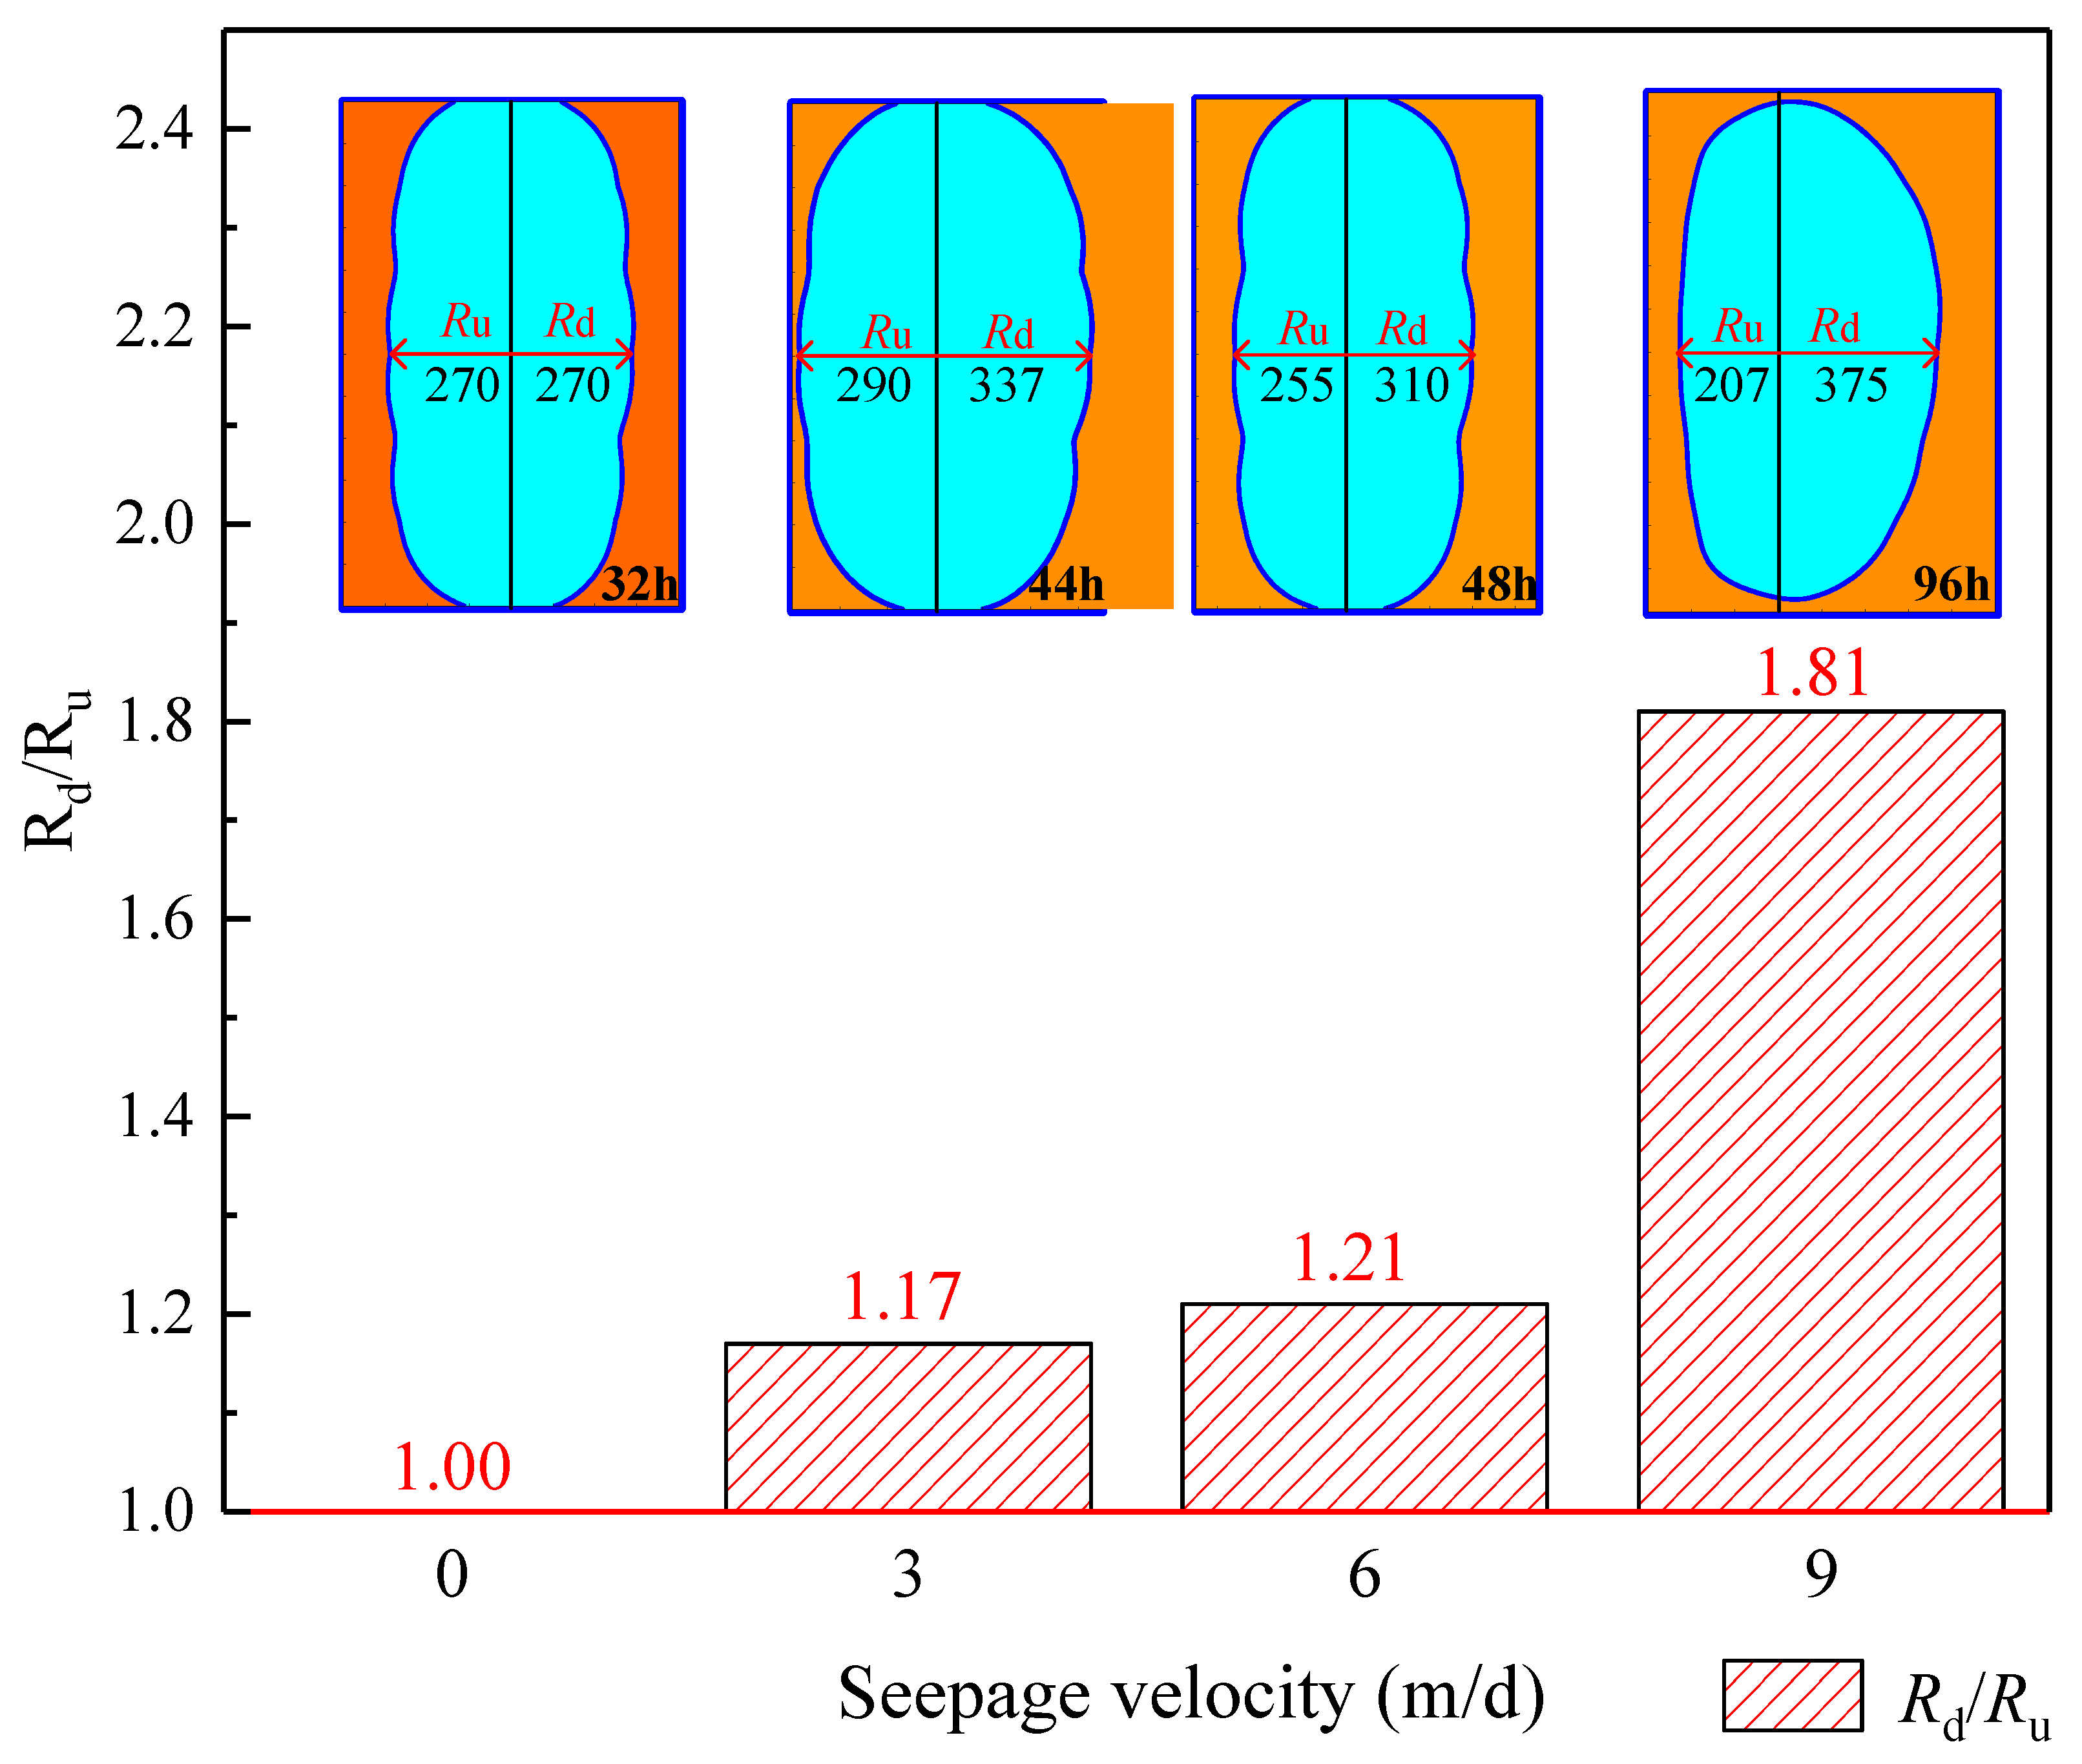
2.2.2. Influence of Flow Rate on Thickness of Frozen Wall

The ratio Rd/Ru of the maximum extension radius Rd downstream of the frozen wall and Ru upstream of the frozen curtain was defined as the asymmetric coefficient of the frozen wall, and the change rule of Rd/Ru with the seepage velocity is shown in Figure 4.
As can be seen from Figure 4, the asymmetry of the frozen wall gradually intensified with the increase in seepage velocity.

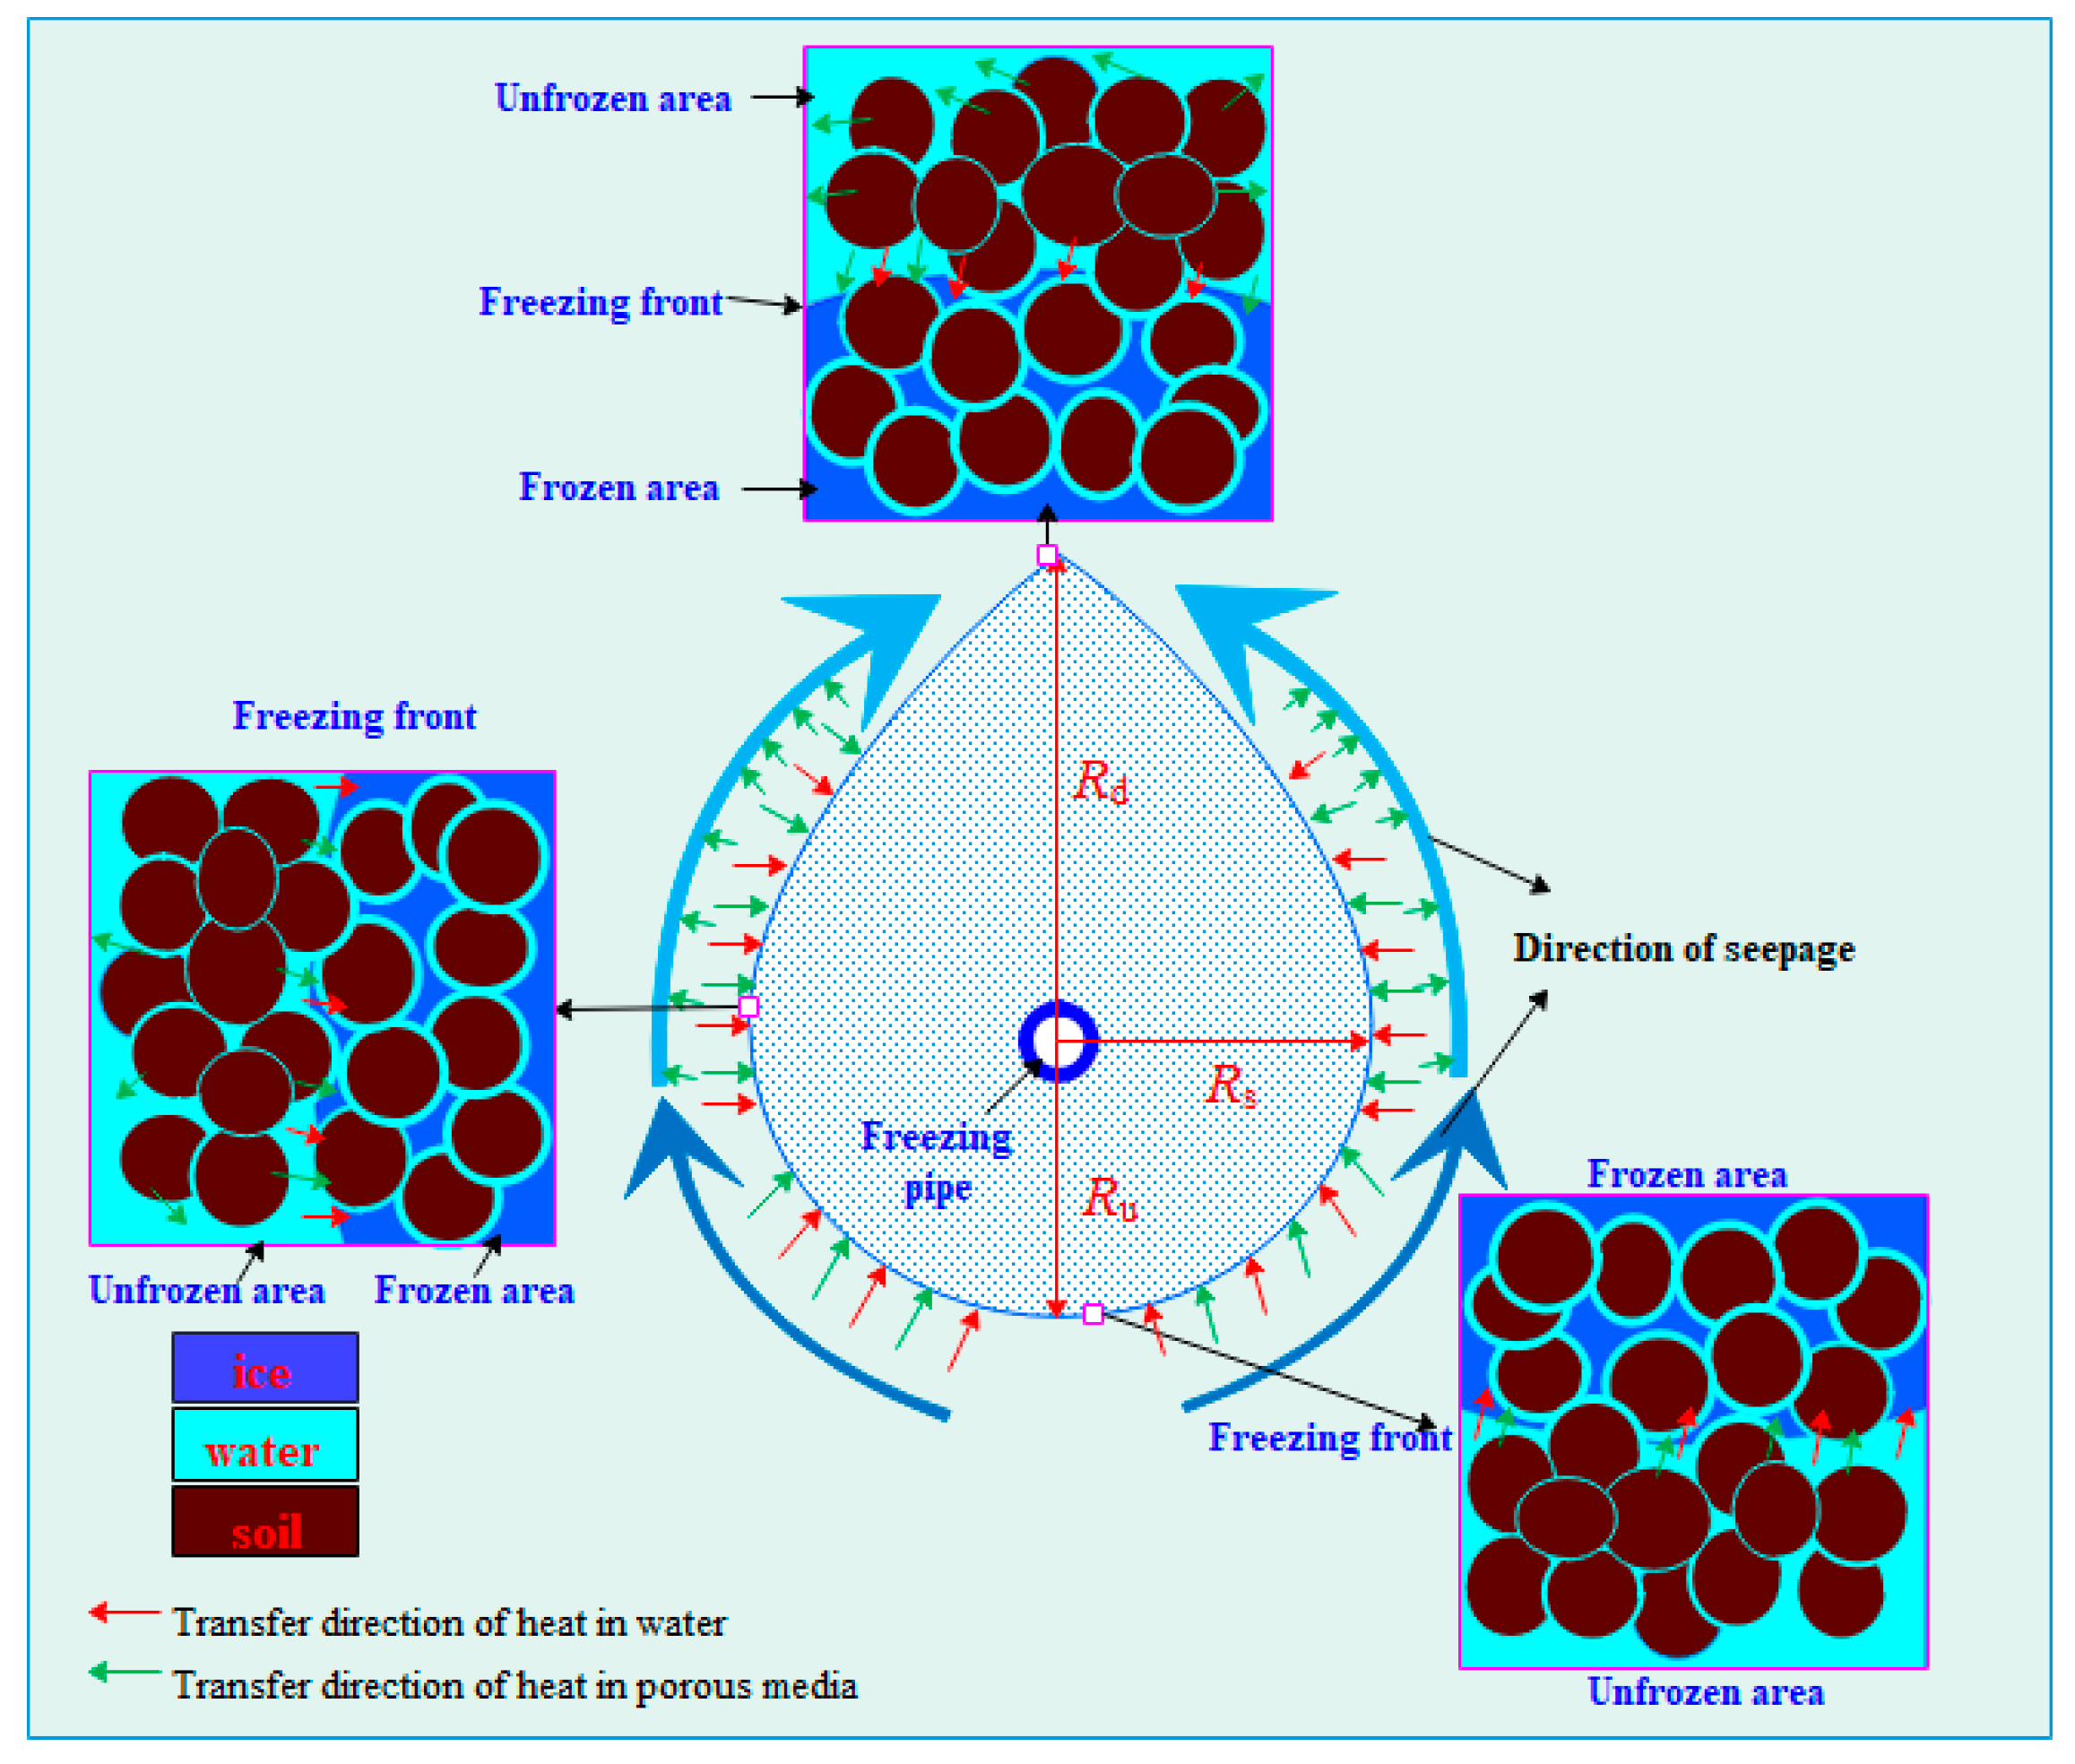
2.2.3. Mechanism of the Maldevelopment of Frozen Walls Induced by High-Flow-Rate Groundwater

The heat transfer mechanism of the ground freezing process under the action of groundwater is shown in Figure 5. Under the action of groundwater, the maldevelopment of frozen walls mainly showed that the closure time of frozen walls and the non-uniformity coefficient of frozen wall thickness increased with an increase of groundwater velocity. After analyzing the causes of this phenomenon, it was found that under the action of flowing groundwater, the freezing process of ground mainly included convection heat transfer between water flow and frozen soil, and heat conduction between freezing pipes and frozen soil. Water released heat as it flowed through the cold zone, which led to a decrease in freezing efficiency in this area. At the same time, the flow of groundwater led to the change of the spatial law of heat distribution in the frozen region. In the process of water flow from the upstream of the frozen region to the downstream, the temperature of the water flow decreased obviously, resulting in the freezing efficiency of the upstream region being lower than that of the downstream region. Therefore, the thickness of the downstream frozen wall was greater than that of the upstream.

3. The Establishment and Verification of the Numerical Calculation Model of Hydrothermal Coupling

3.1. Hydrothermal Coupled Mathematical Equations

The differential equation of heat conduction in porous media under the action of seepage field and temperature field [22,23,24,38] was as follows:
C e f + L θ l t + [ K e f T + C l V ( T ) ] = 0
where, T was the temperature; t was time; ρ was the density; subscripts s, i and l represented porous media skeleton, ice, and water, respectively. ϕ was porosity of porous media; w was the water content in the void; V was the velocity of water flow in porous media; L was latent heat of phase transition; θ l was the content of liquid water; C e f was equivalent specific heat; Kef was equivalent thermal conductivity.
Cef was represented by the following formula [22,23,24,38]:
C e f = K s θ s + K l θ l + K i θ i
Kef was expressed by the following formula [22,23,24,38]:
K e f = K s θ s + K l θ l + K i θ i
According to Darcy’s law, the seepage velocity was:
V = κ η ( p + ρ l g H )
where, κ was permeability; η was the viscosity coefficient of water; p was osmotic pressure; g was gravitational acceleration, H was gravity head height.
Permeability could be expressed as a function of w during the freezing of saturated porous media [34,38]:
κ r = w ( T ) [ 1 ( 1 w ( T ) 1 / m ) m ] 2
where, m was the material constant.

3.2. The Rationality Verification of the Hydrothermal Coupling Mathematical Model

3.2.1. The Calculation Model of the Test

In order to verify the rationality of the calculation model, a geometric model was constructed based on the parameters and boundary conditions of the model test, as shown in Figure 6.
In this model, the freezing pipe wall met the first boundary condition of the temperature field, namely:
T f i = T i ( t )
where i = 1, 2, and 3 represented different freezing pipes.
The inflow and outflow of the box body met the first boundary condition of the temperature field and the first boundary condition of the seepage field, namely:
T | inflow = T water - in ( t )
T | outflow = T water - out ( t )
P | inflow = V ρ g Δ l K
P | outflow = 0
The boundary on both sides of the box body satisfied the first boundary condition of the temperature field and the second boundary condition of the seepage field, namely:
T side = T 0
p n | C = 0

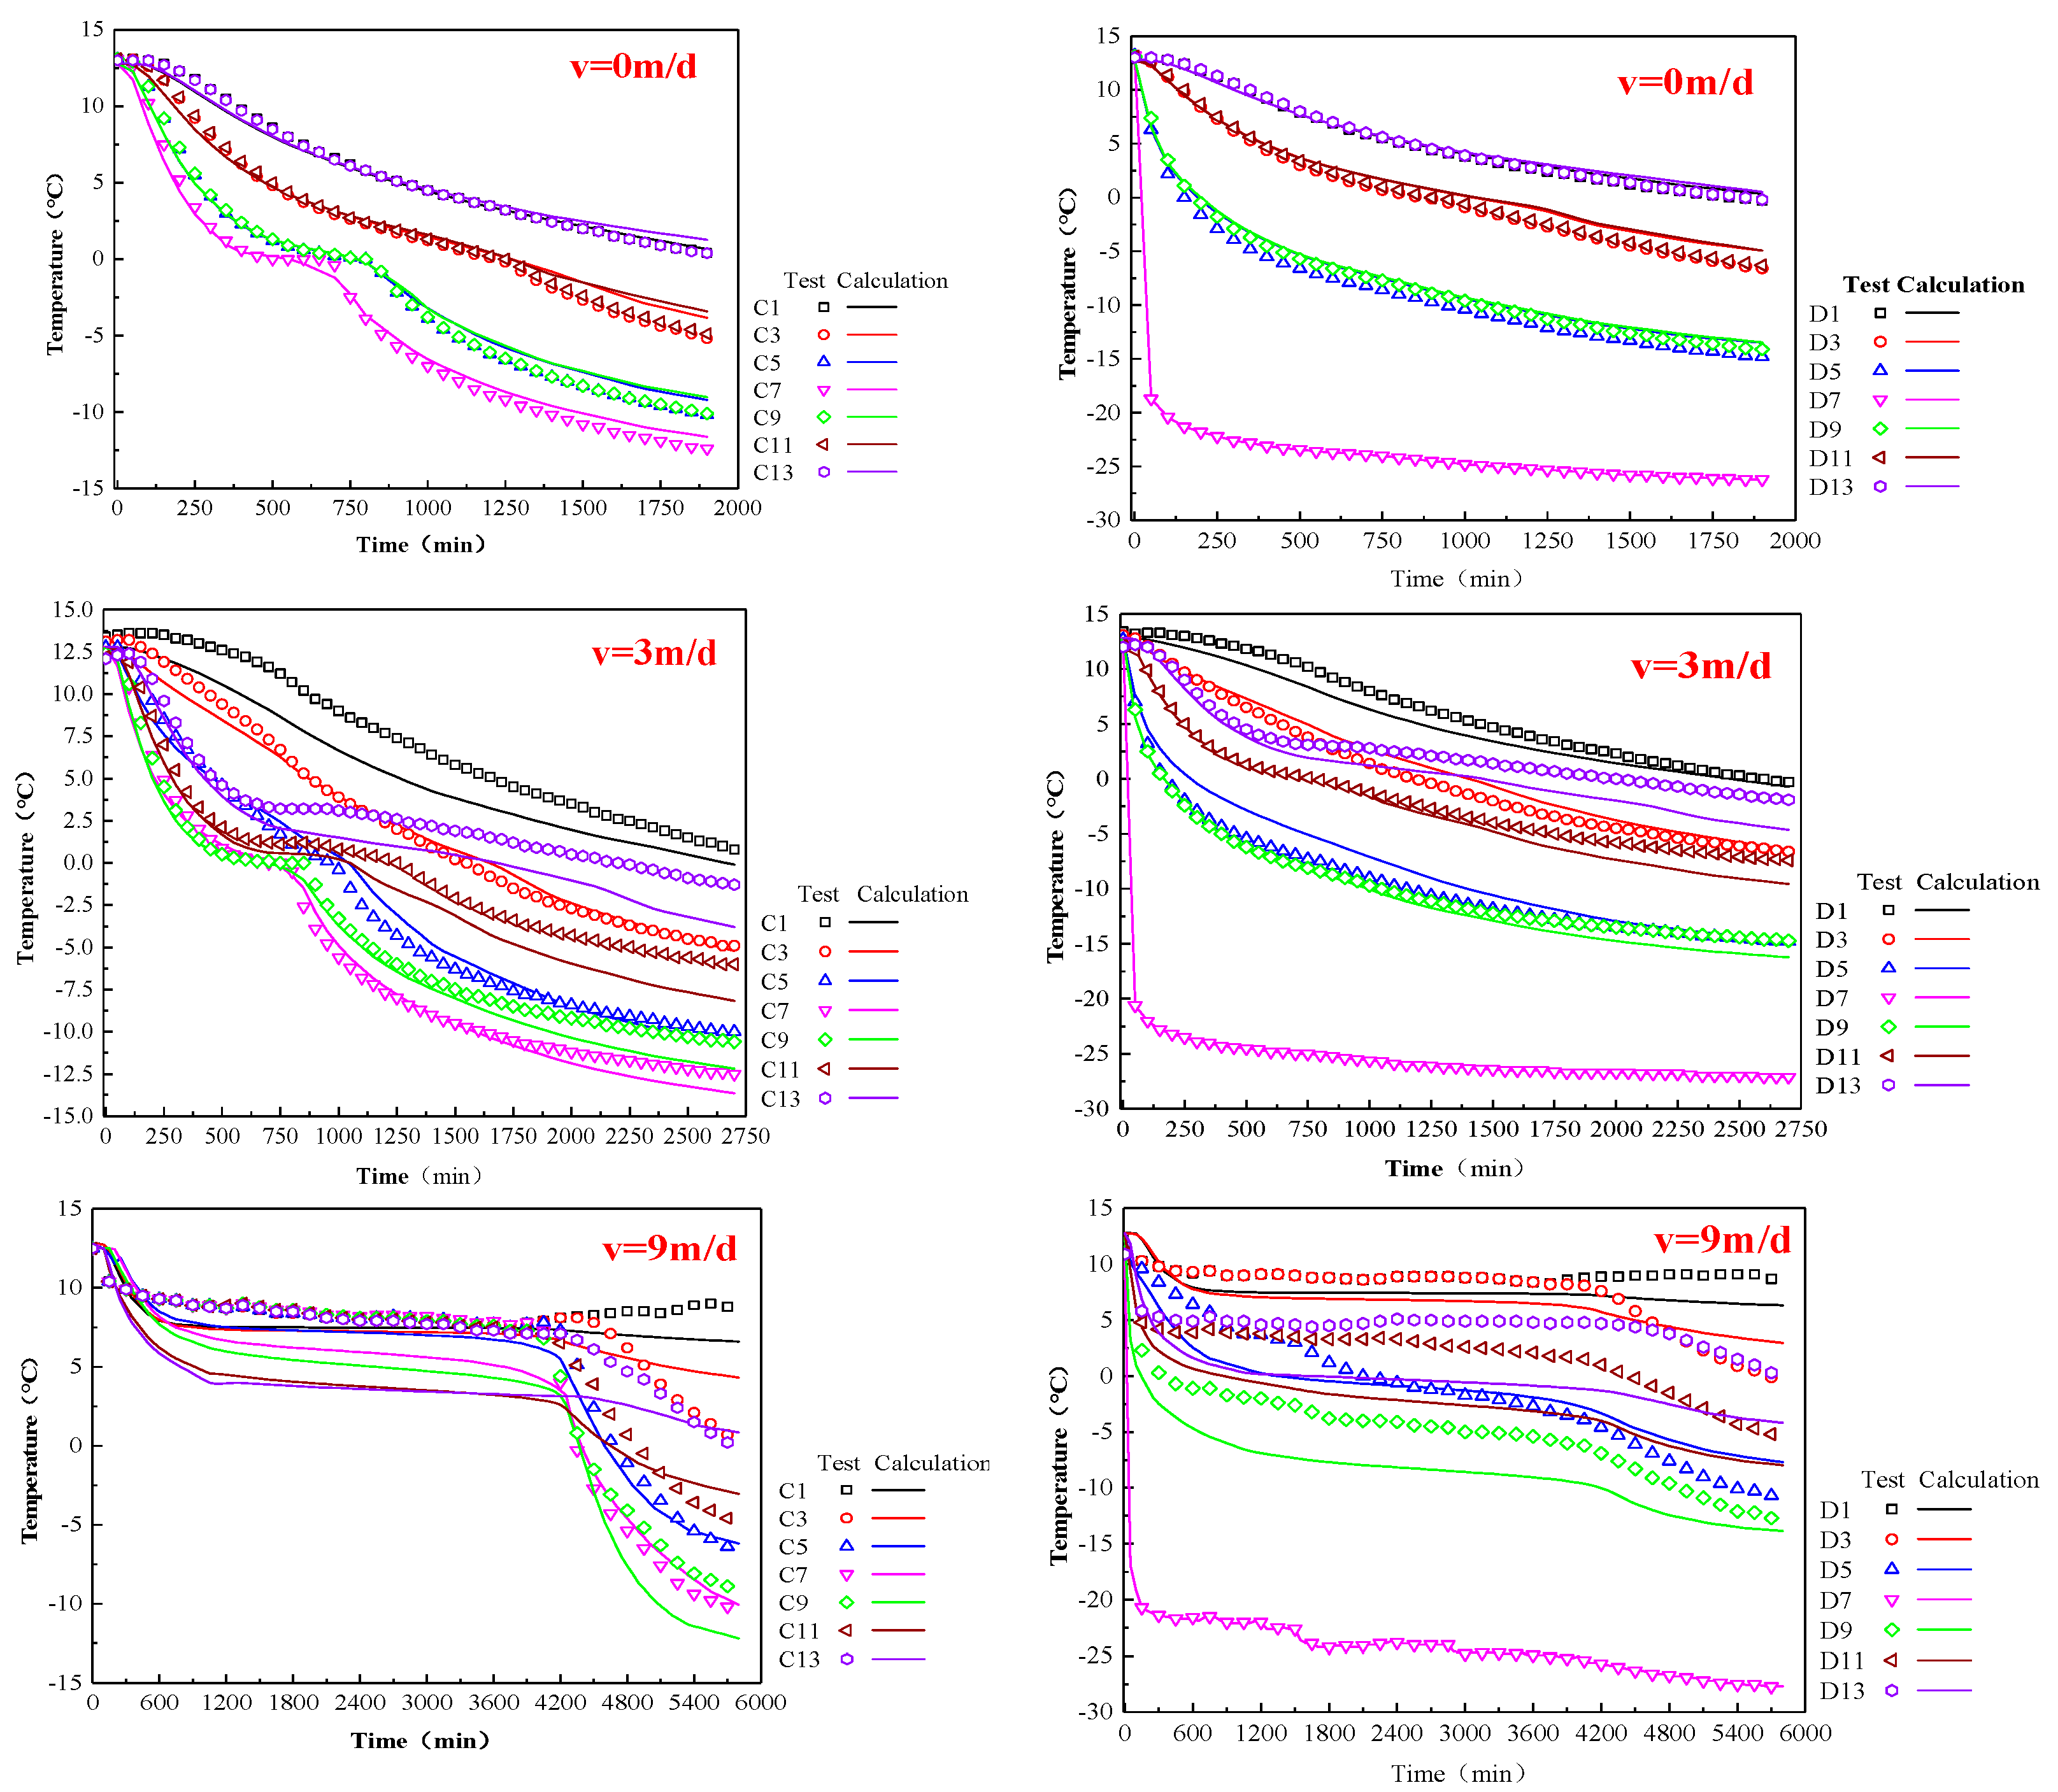
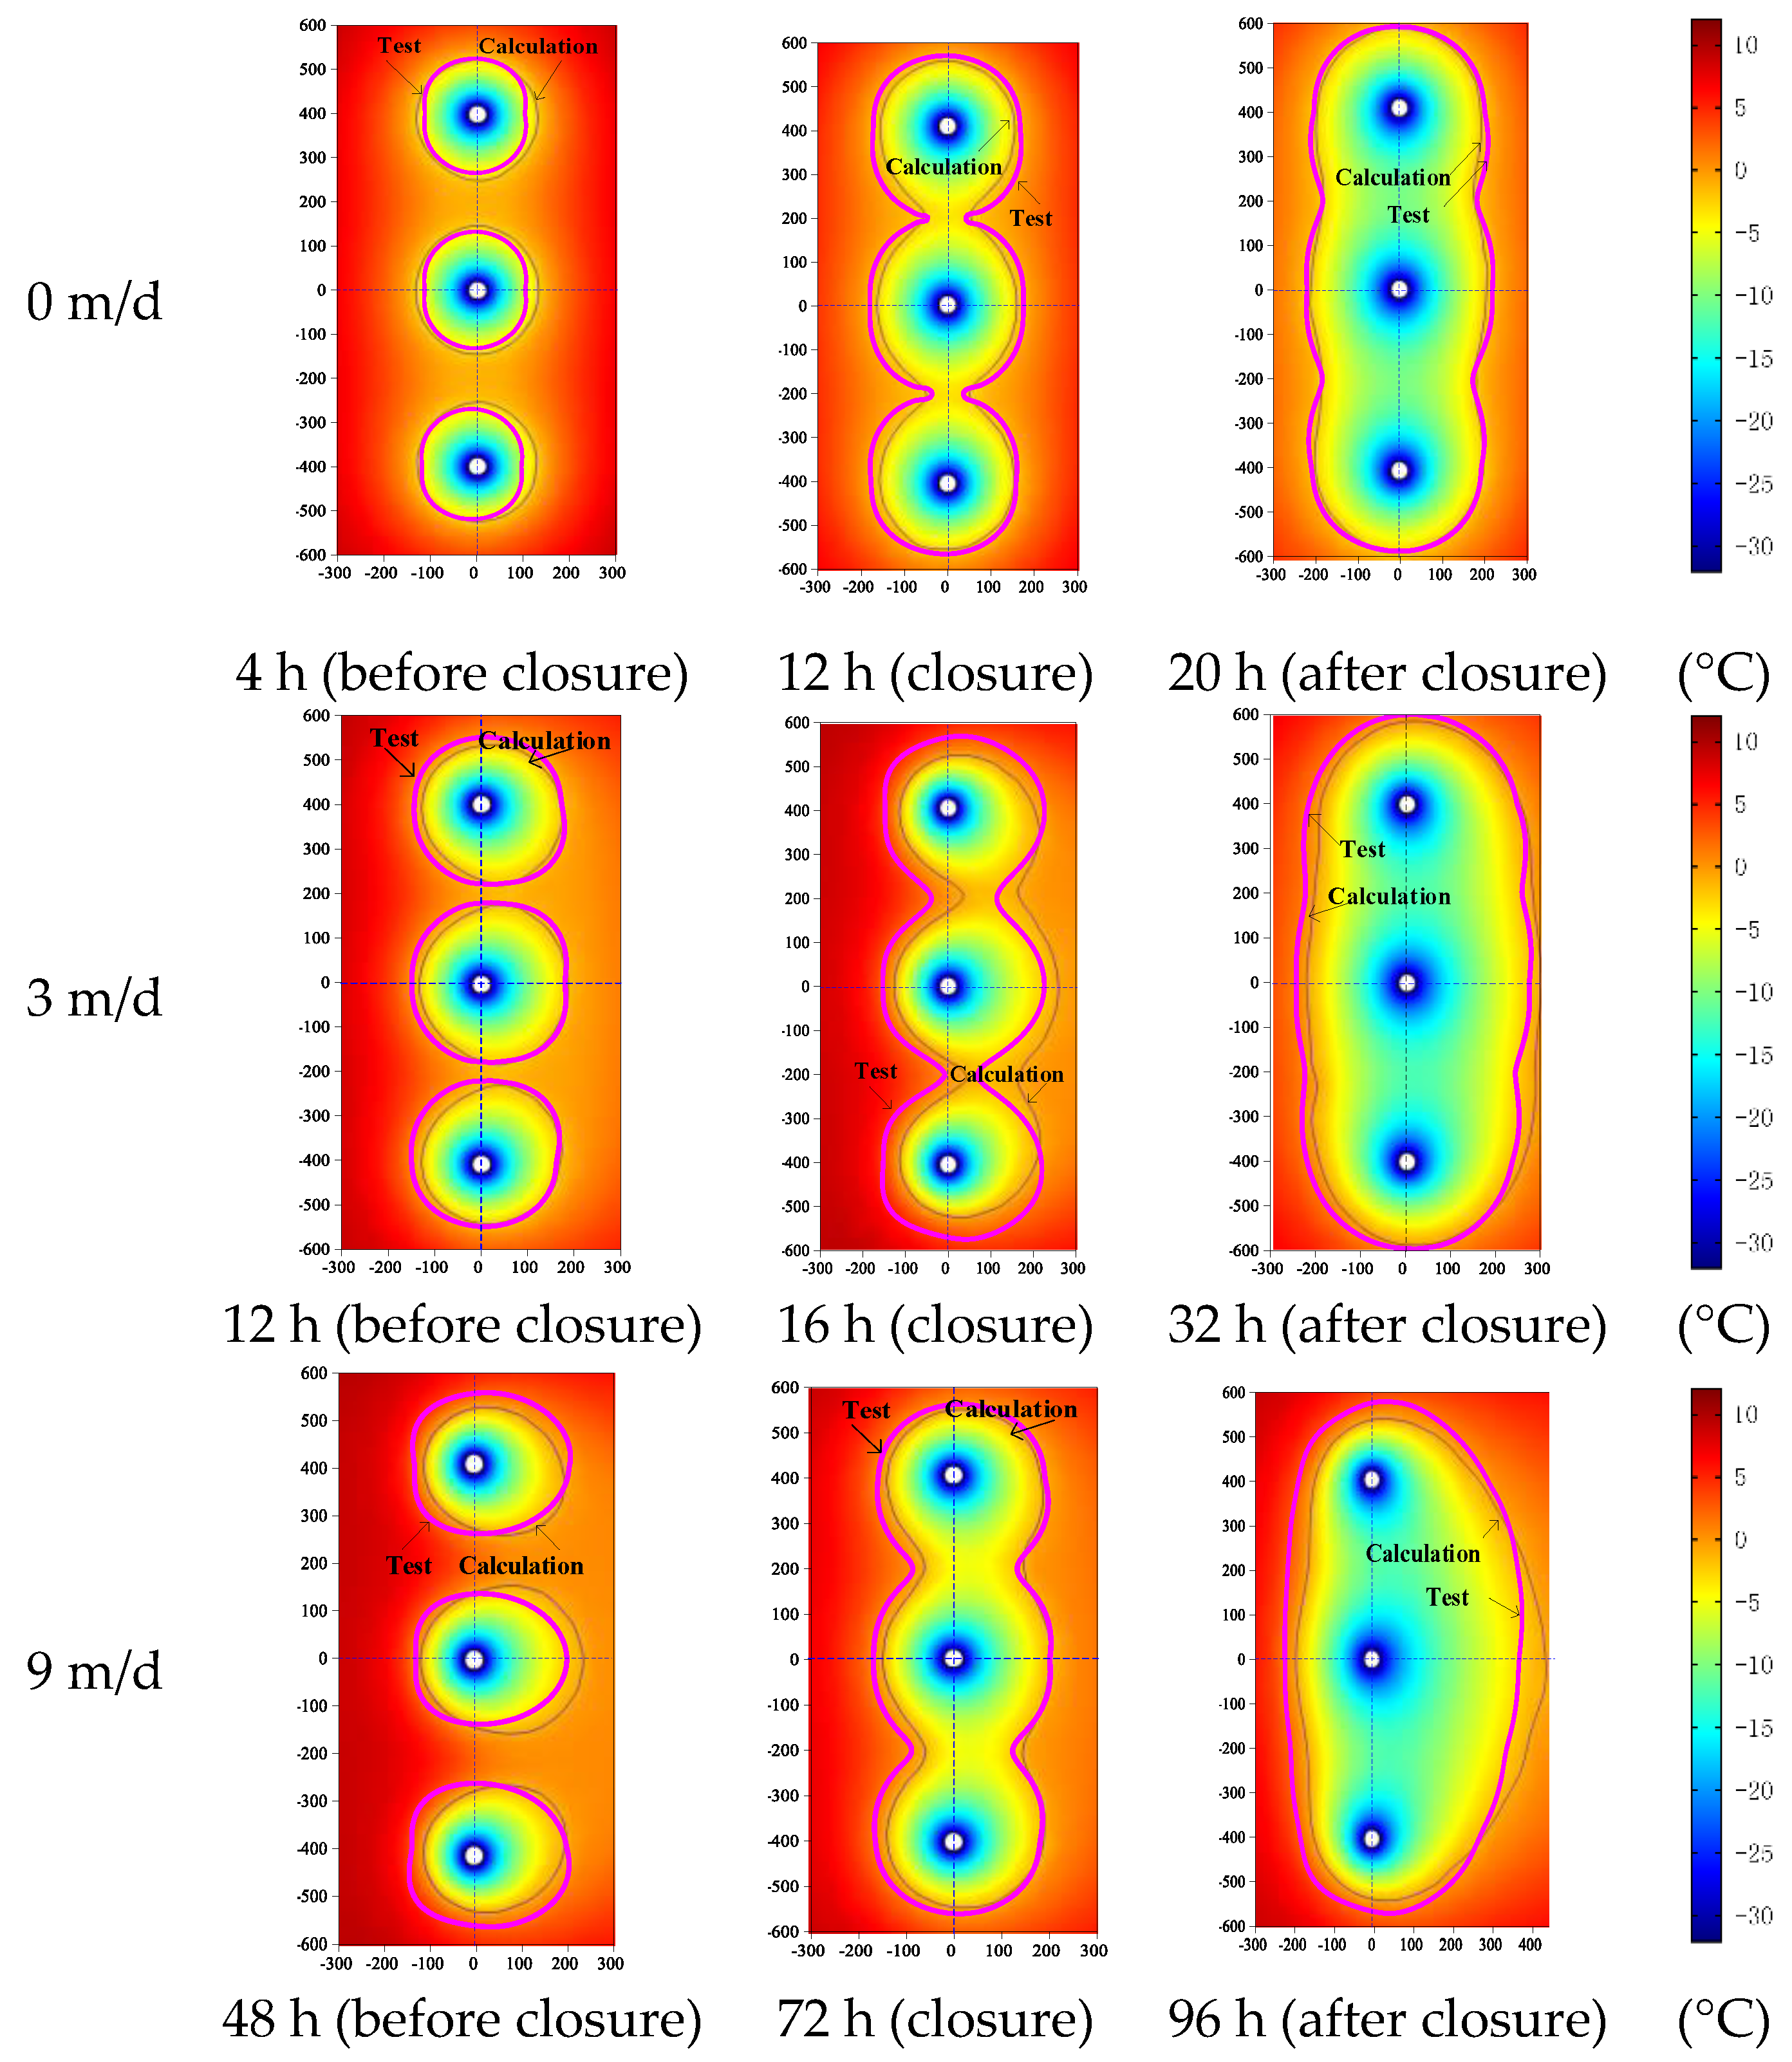
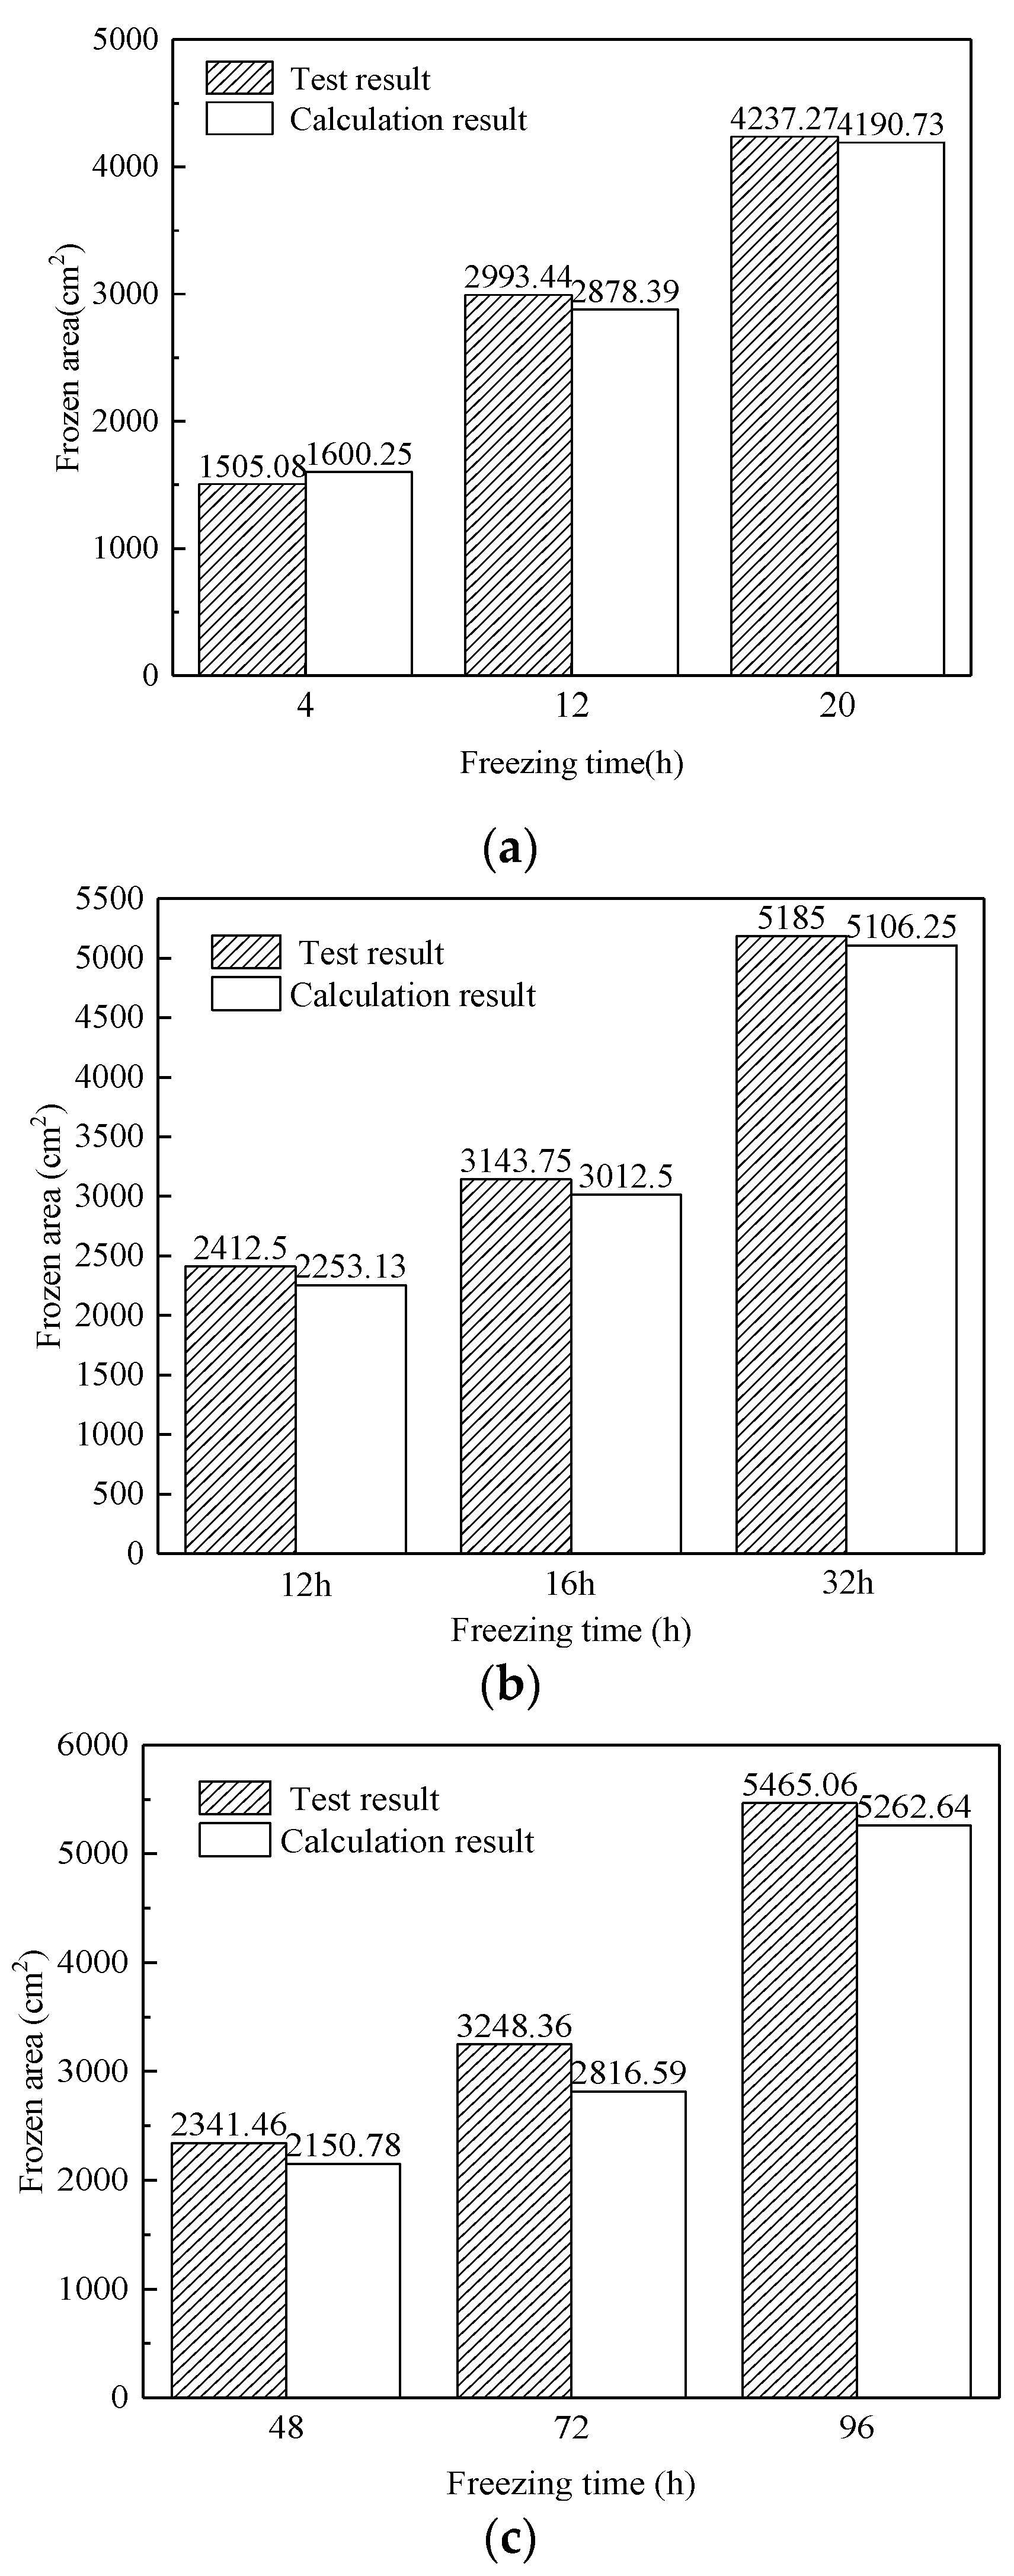
3.2.2. Comparison of Numerical Results with Model Tests

Combined with the test results of the thermal physical parameters of porous media materials [17], and based on the established calculation model, the development law of the freezing temperature field of three pipes under the action of different seepage velocities was calculated.
The temperature data at the same positions as the measured points in the experiment that were showed in Figure 2 were extracted from the numerical calculation result, and the comparison of the temperature curves of no flow rate, low flow rate (3 m/d), and high flow rate (9 m/d) between the test and numerical calculation is shown in Figure 7.
By comparison, it could be found that under the conditions of no flow rate and low flow rate (3 m/d), the numerical calculation results of temperature variation with time were basically consistent with the experimental results. Under the conditions of high flow rate (9 m/d), the temperature of the measured point on the axis where the freezing pipe was located (axis D) was in good agreement with the experimental results. Both the numerical calculation results and the experimental results of the temperature change curve of the measuring point located on the middle axis (axis C) of the adjacent freezing pipe include the rapid temperature drop stage (at this stage the temperature of the measuring point decreased rapidly to freezing temperature), the slow temperature drop stage (at this stage the cooling capacity transferred by the freezing pipe was offset by the latent heat release of phase change in water, and the temperature at the measuring point was maintained at the freezing temperature), and the second rapid temperature drop stage (at this stage the latent heat release of phase transformation was completed, and the temperature of the measuring point again dropped sharply). In addition, the time of entering the second temperature drop stage and the minimum temperature of each measuring point were basically consistent. In the process of model tests, the flow direction and porous medium cannot be guaranteed to remain unchanged under the conditions of high flow velocity, which had a certain impact on the accuracy of the test results. In numerical models, porous media was treated as homogeneous materials and the direction of water flow remained constant. Therefore, the numerical calculation results could clearly reflect the temperature difference of measuring points at different locations, compared with the model test.
The comparison between numerical calculation and experimental results of the freezing front under different flow velocity conditions is shown in Figure 8.
As shown in Figure 8 and Figure 9, the shape and area of the freezing front obtained by numerical calculation and model test were basically the same when there was no flow or the flow velocity was small (the error less than 8%). When the flow velocity was large (9 m/d), as the closure time approached there was an obvious difference (13%) between the frozen area obtained by numerical calculation and the experiment. The main reasons for the above phenomenon were as follows: under the conditions of large flow velocity, the shape-change process of the frozen front was complicated as the closure time approached. In the experiment, in order to avoid interference with the seepage field in porous media, temperature measuring points were only arranged in key positions, and the number of measuring points was limited. Therefore, there were some errors in the isotherm plots based on the temperature data of measuring points. However, after the frozen wall was closed, the interior of the frozen wall was no longer affected by water flow and the shape of the frozen front gradually tended to be stable; the difference between the frozen area calculated by numerical method and the shape of the freezing front obtained by experiment decreased gradually.
According to the comparison of temperature change curve and freezing front, it could be seen that the numerical calculation model constructed in this paper could realize the prediction and calculation of artificial freezing temperature fields under the action of groundwater.

4. Optimized Design of Freezing Holes under the Action of Groundwater with Different Flow Rates

According to the maldevelopment mechanism of frozen walls induced by groundwater, the layout method of freezing holes of permeable stratum with high groundwater velocity was optimized. The effect of the optimization scheme was predicted and analyzed by finite element numerical calculation.
In the construction process of the vertical-shaft freezing method, the layout of freezing holes was usually arranged in a concentric circle with the shaft at equal distance, and the control temperature of refrigerant on the freezing holes of the same layout circle was the same. In a construction environment without flowing groundwater, this arrangement can ensure the uniform strength of the frozen wall. In the case of groundwater with large flow rate, the original freezing scheme was often optimized by integral encryption, or overall lowering of the temperature of the cryomedium, or increasing the circle number of the freezing holes. The above optimization methods could achieve the purpose of making the frozen wall close smoothly, but in fact, water flow had different effects on the freezing effect at different positions in the circle in which the freezing holes were located. Research showed [38] that the closure time of frozen walls formed by freezing holes located upstream of water flow was later than that of downstream, and the closure time of freezing holes located downstream was later than that of both sides. If the method of overall encryption, or overall reduction of the temperature of refrigerant, or increasing the number of cycles of the freezing holes was adopted, it would cause the waste of cold quantity and the uneven development of frozen walls, which would increase the difficulty of the later excavation construction.

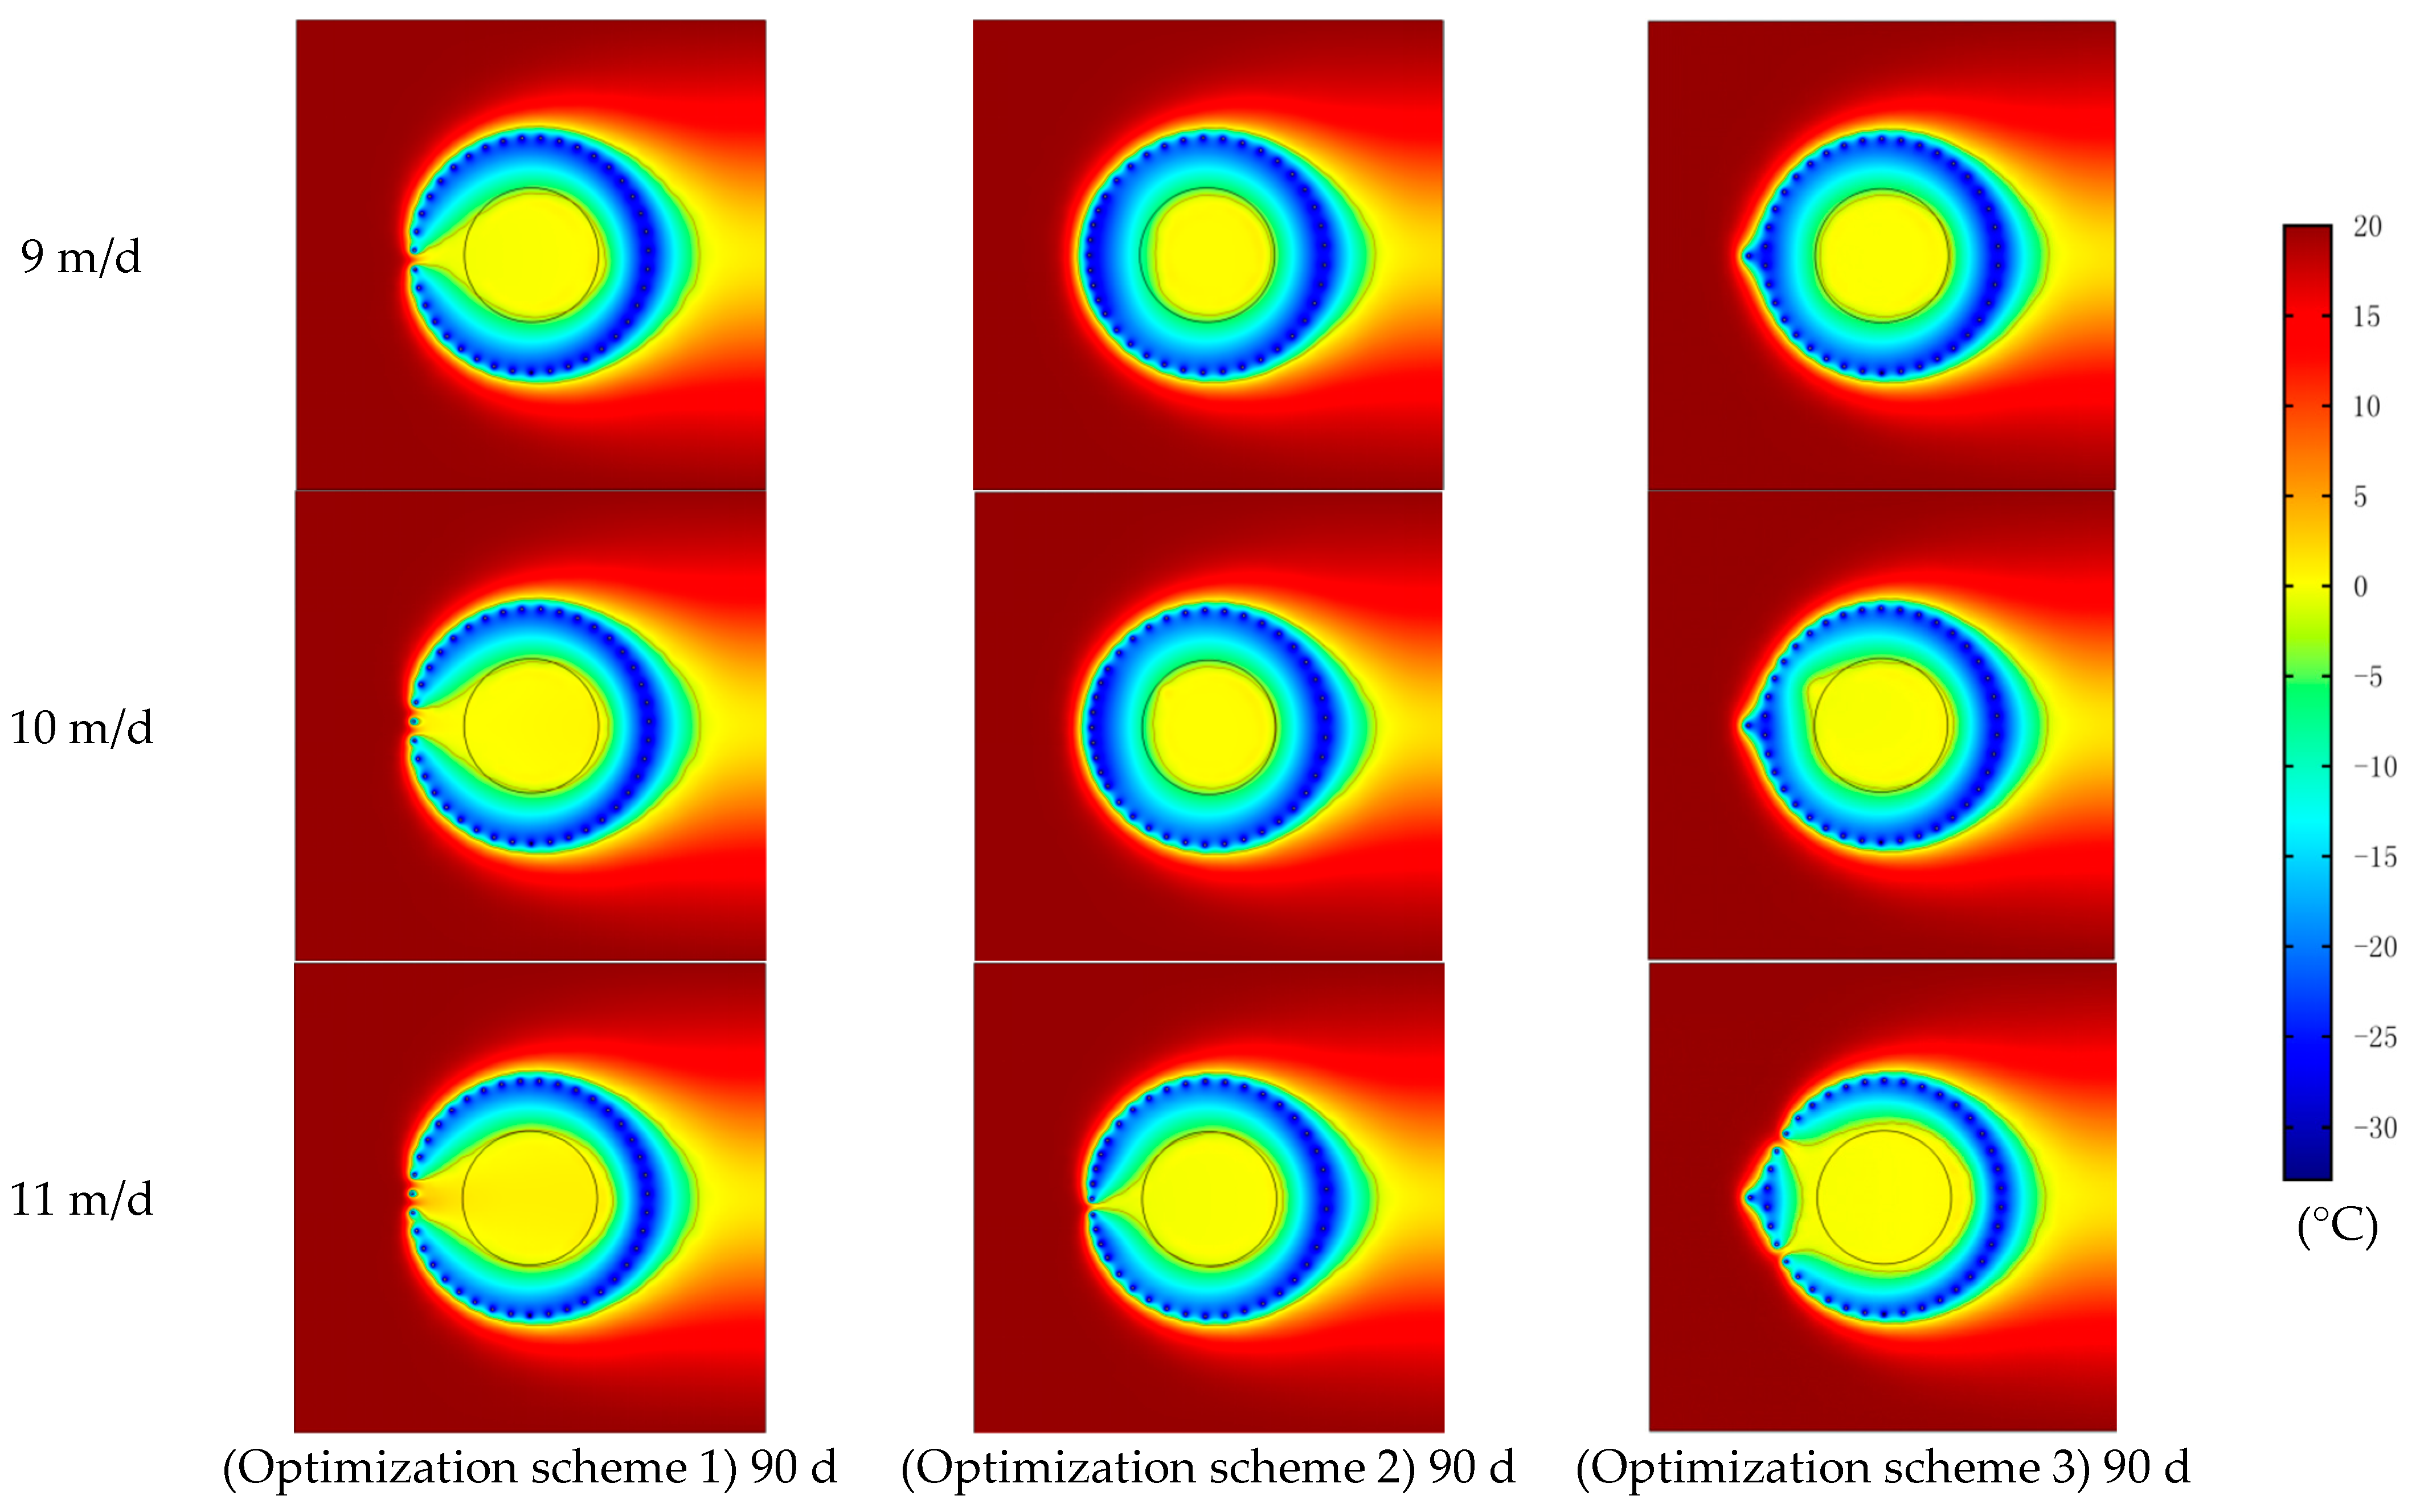
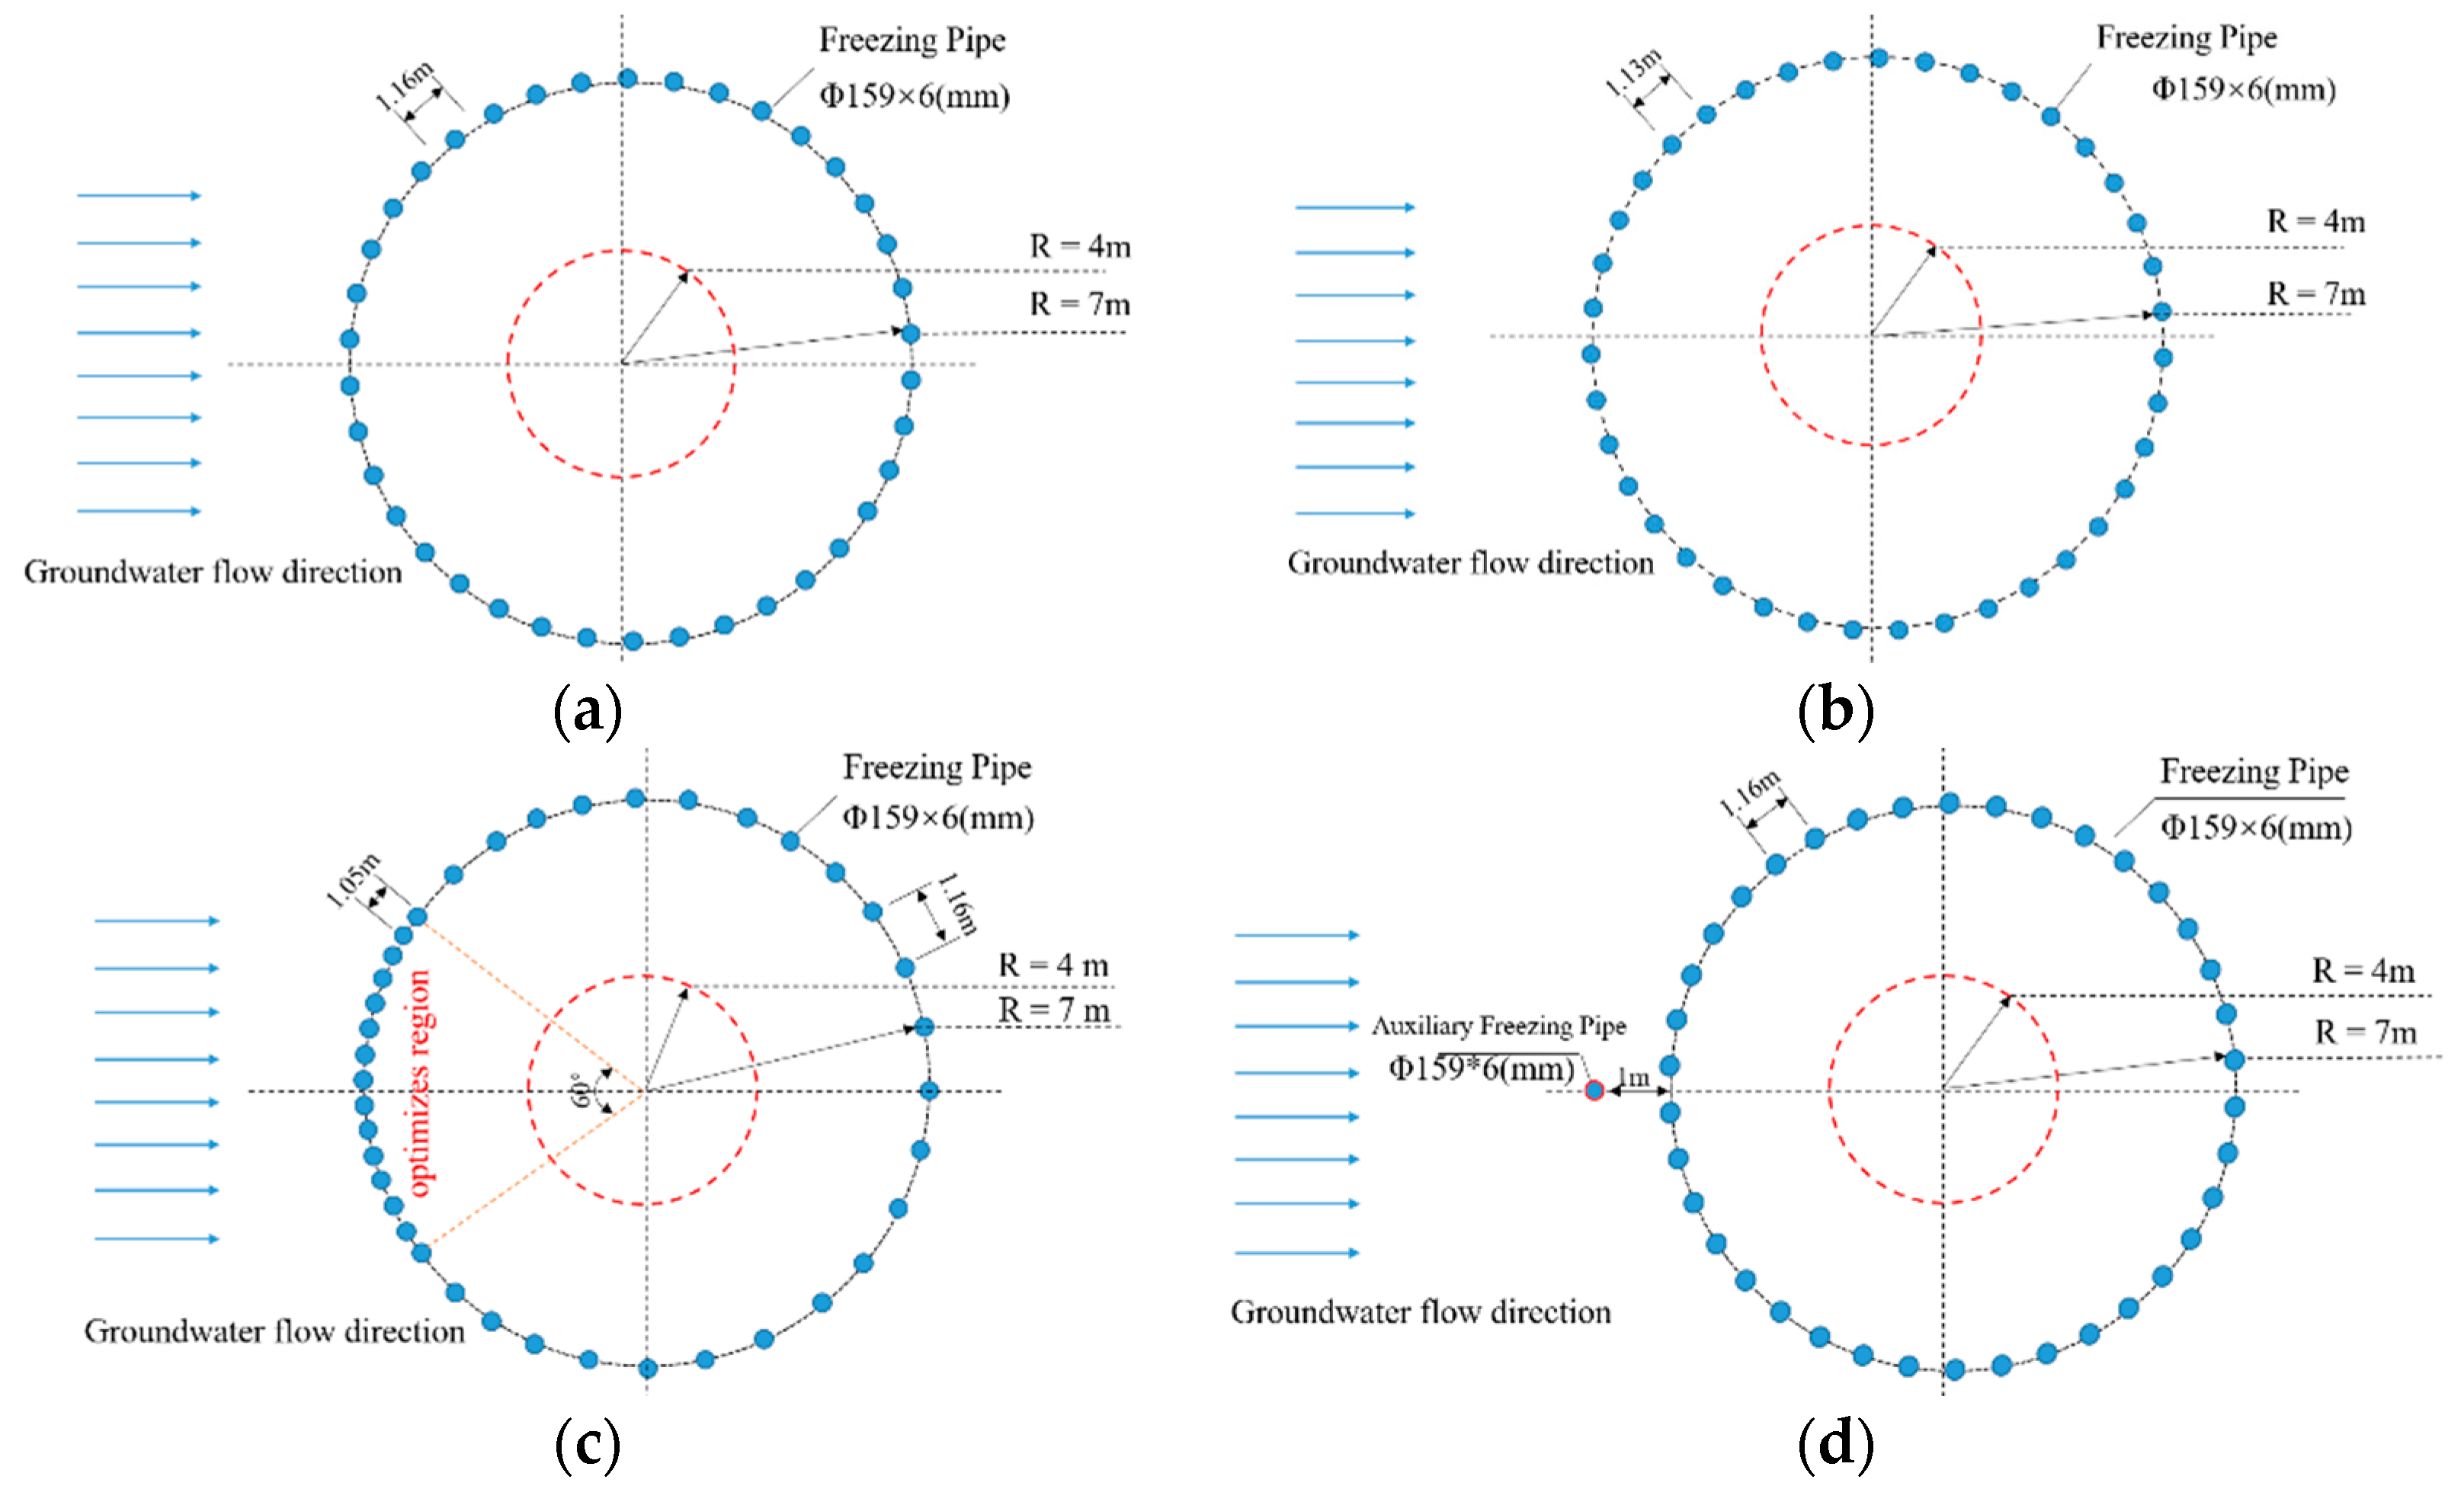
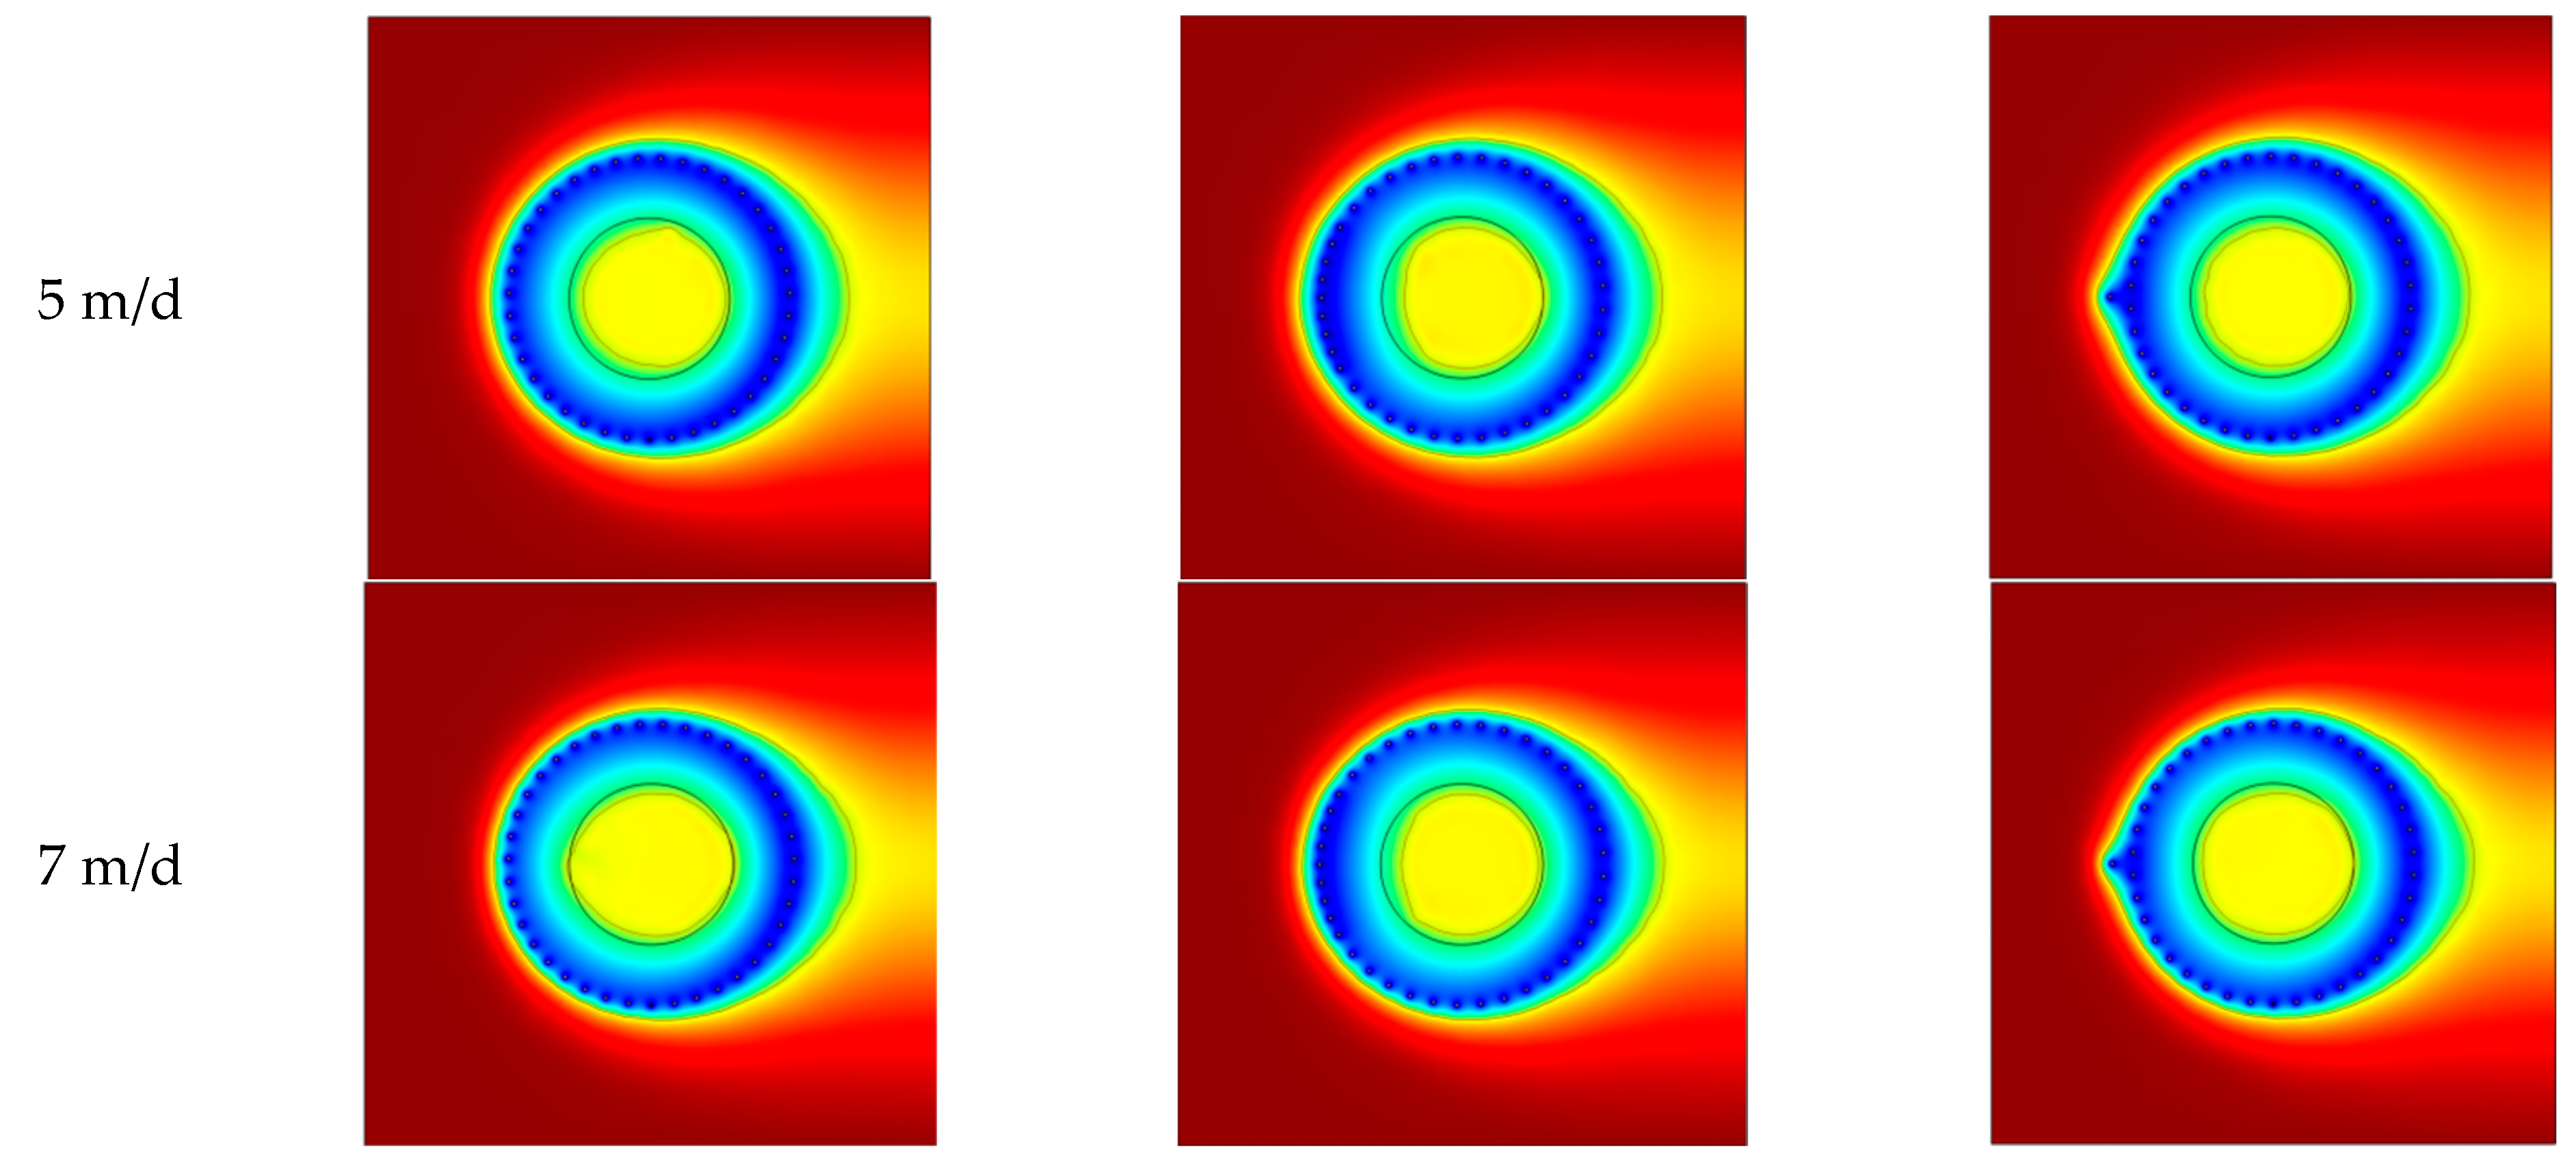
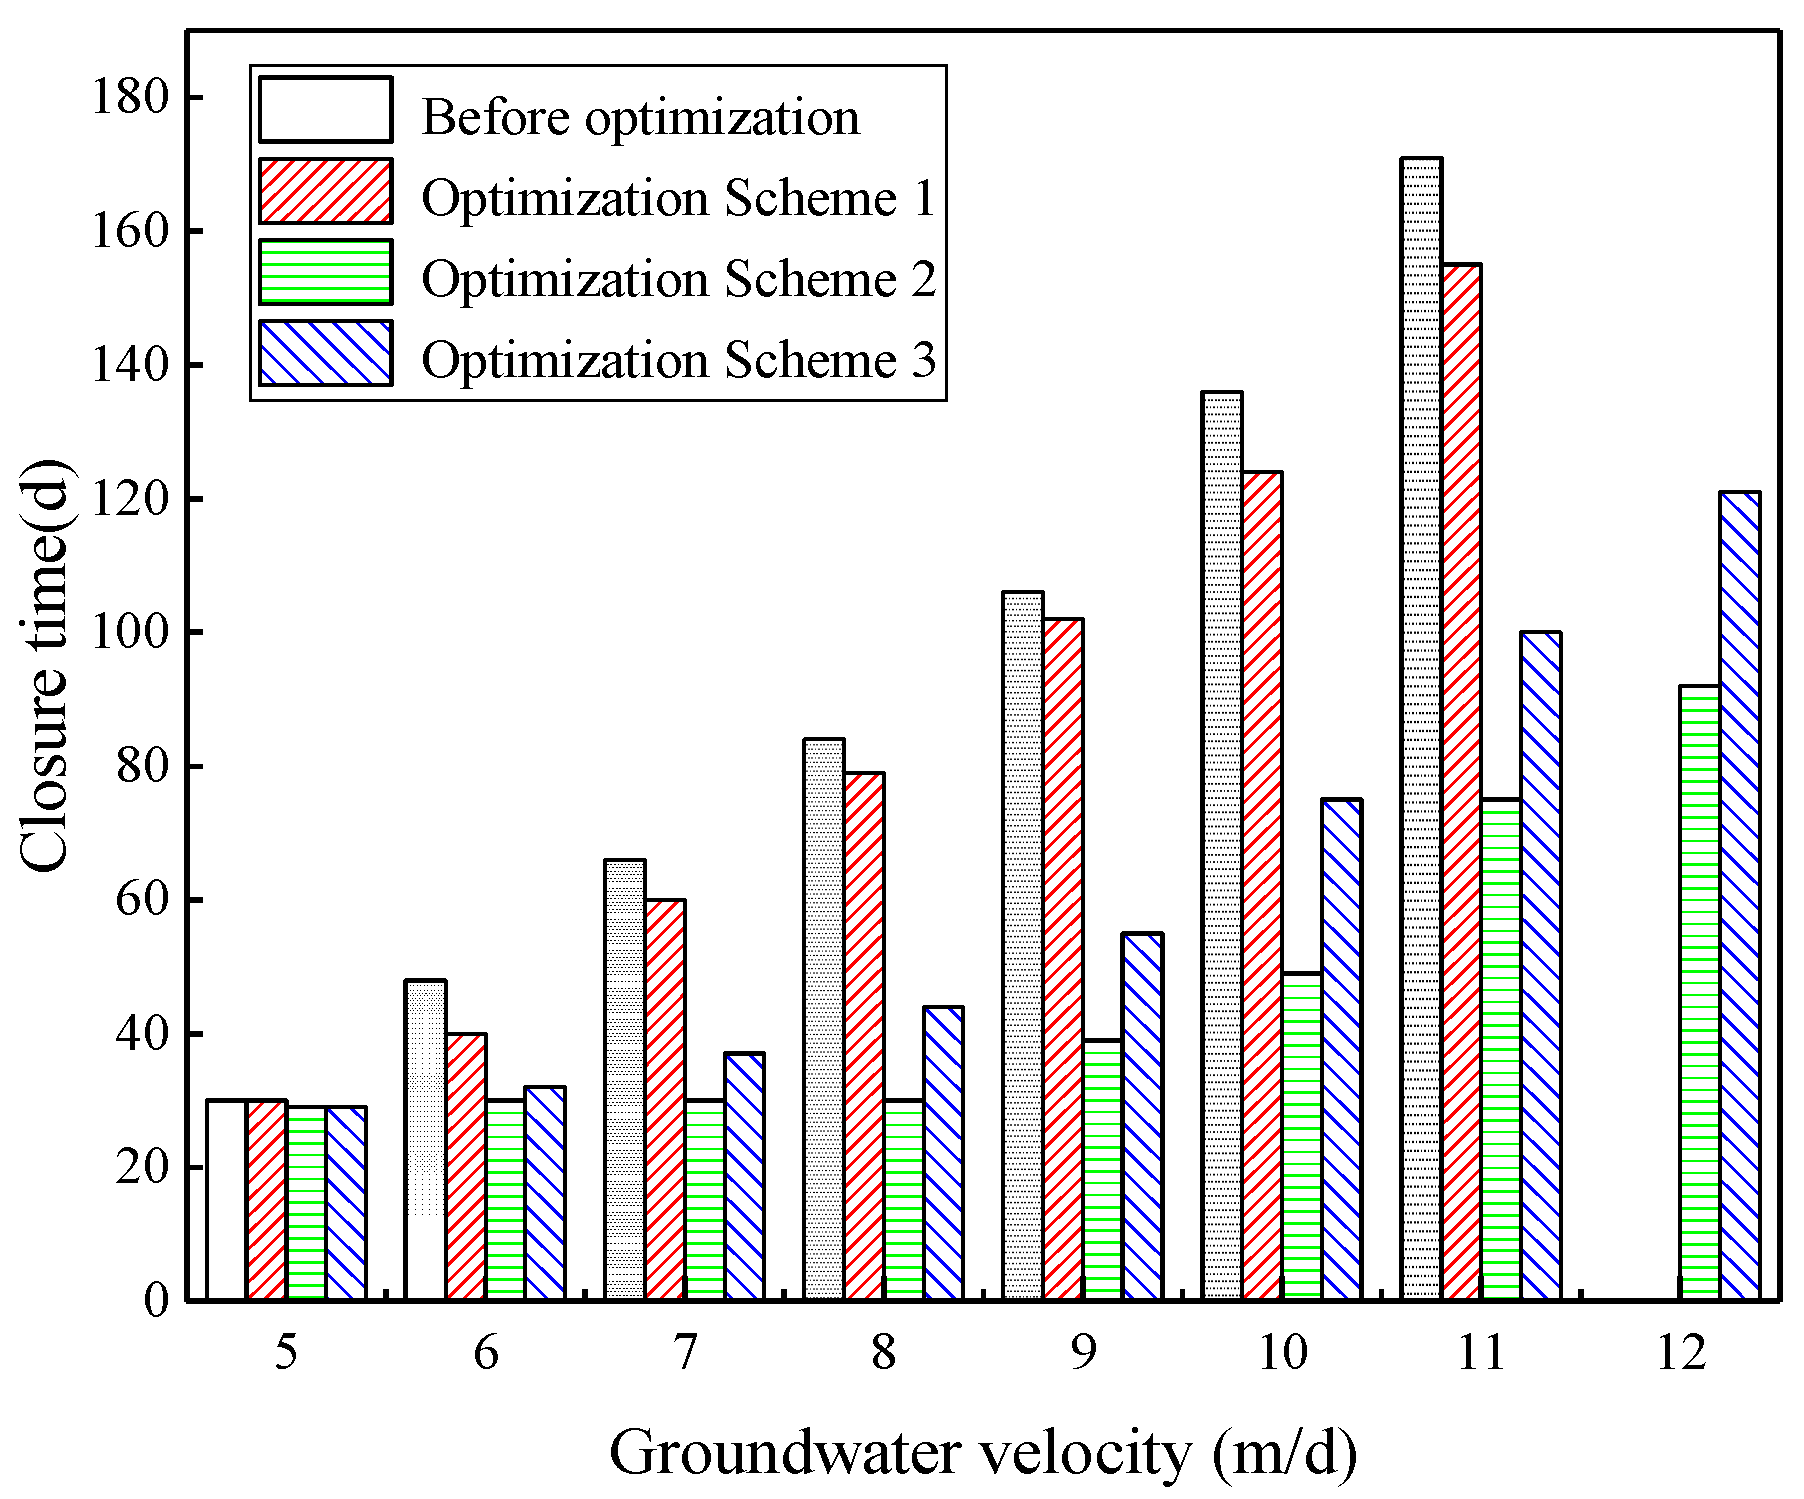
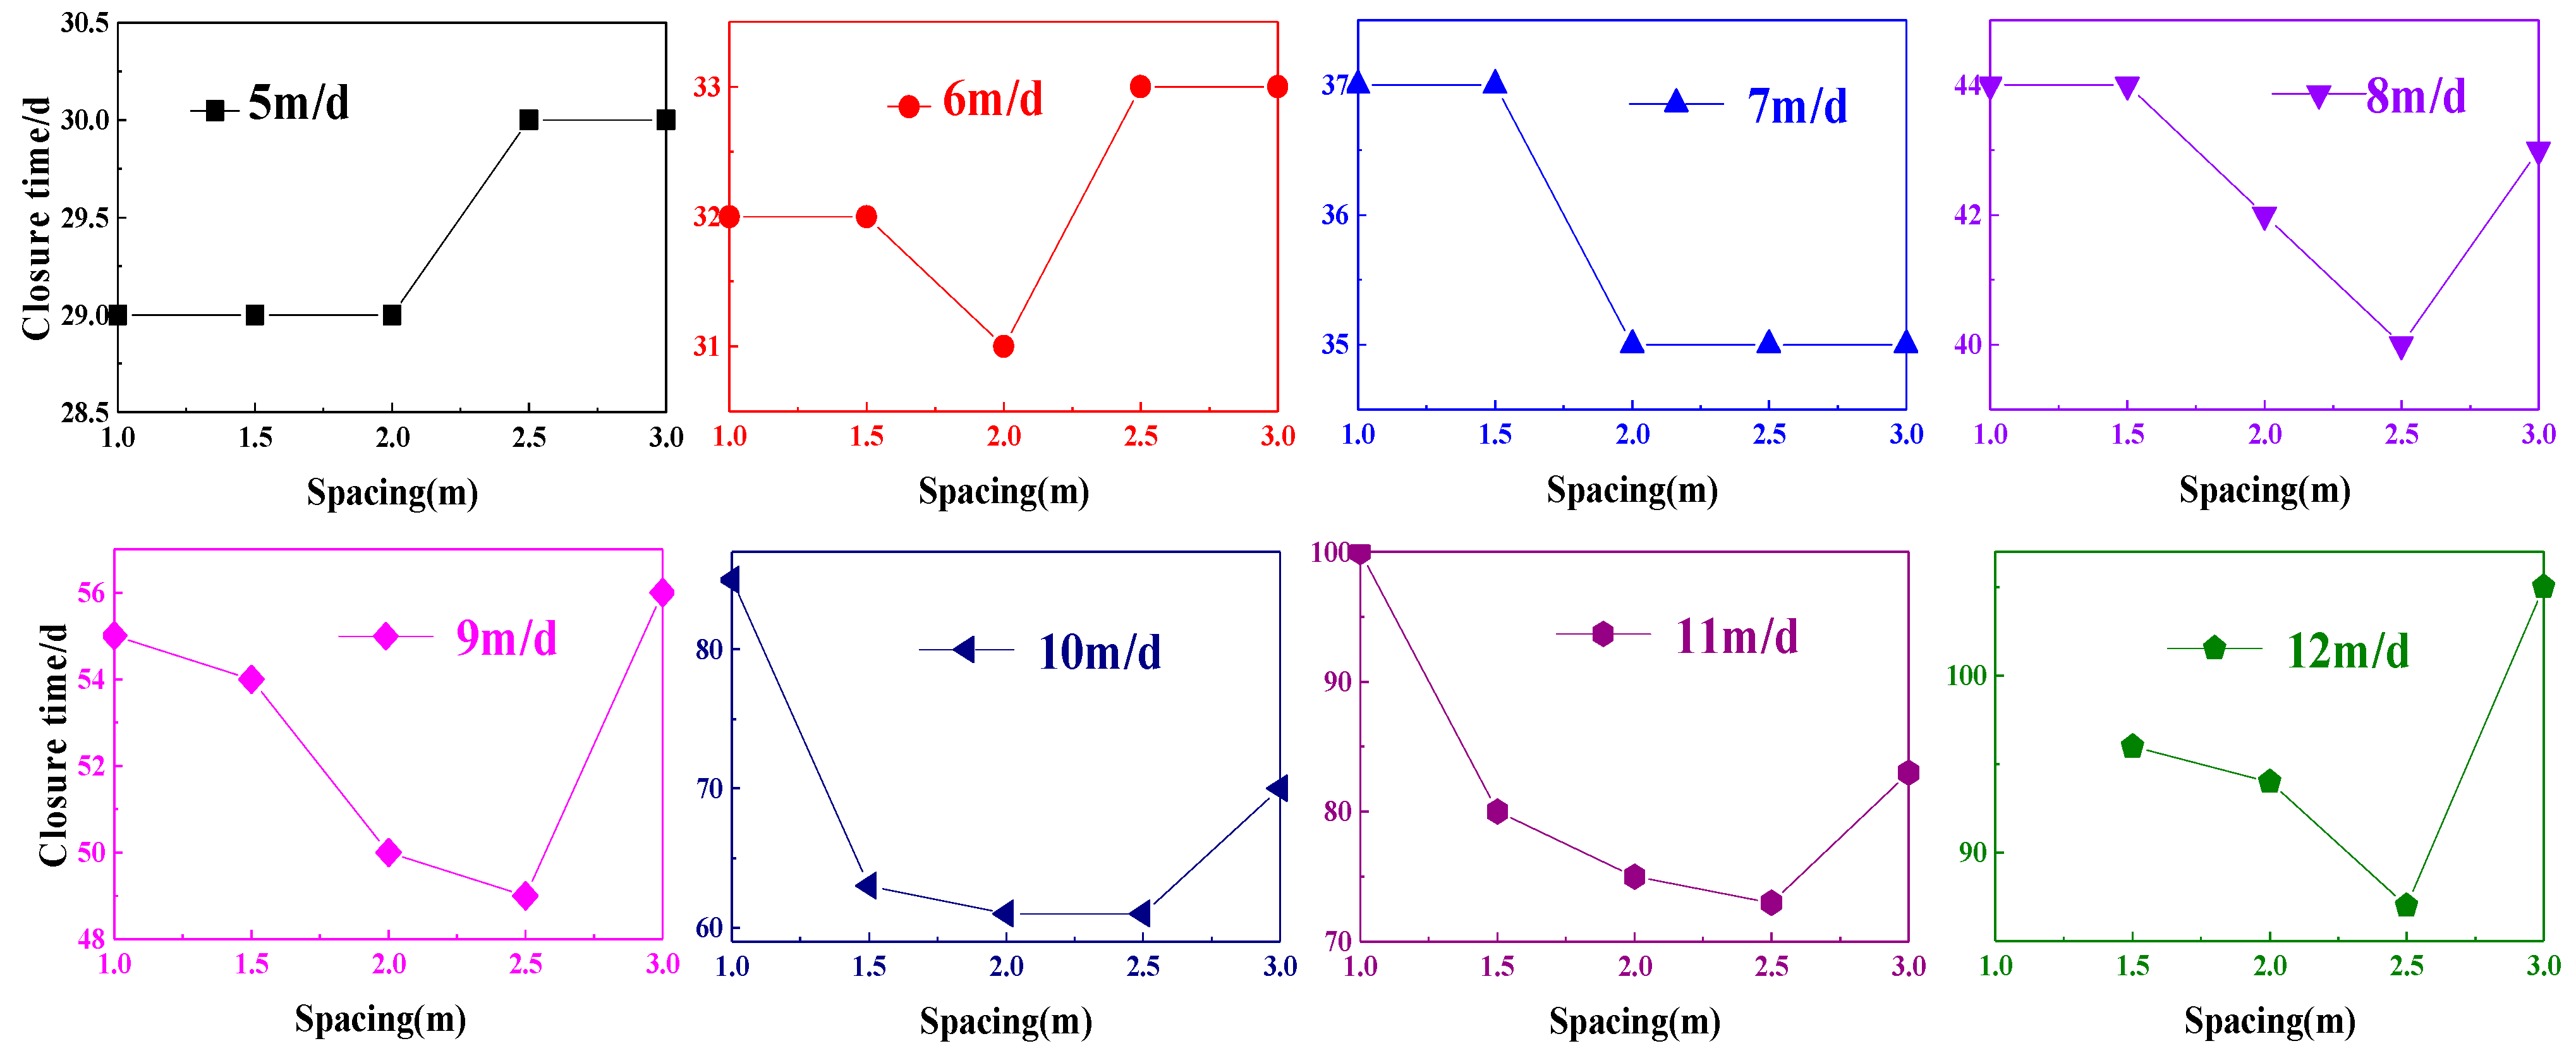
4.1. Optimization Design of Single-Circle Freezing Holes

The layout plan of freezing holes in the central wind shaft of the Panyi Mine in Huainan mining is shown in Table 6.
According to the characteristics of the effect of groundwater on the artificial freezing temperature field [38], the following three schemes were used to optimize the layout of the single-circle freezing holes under the action of groundwater, as shown in Figure 10.
Optimization scheme 1: the spacing of freezing holes was reduced from 1.16 m to 1.13 m, and the total number of freezing holes increased by one.
Optimization scheme 2: the distance between freezing holes in the upper 60° range of the freezing hole layout circle was reduced from 1.16 m to 1.05 m, that is, only one freezing hole was added in the upper 60° range.
Optimization scheme 3: on the basis of the original freezing scheme, one auxiliary freezing hole was added 1 m upstream of the freezing hole layout circle.
The comparison of the development law of freezing temperature fields with different optimization schemes is shown in Figure 11 and Figure 12. By comparison, it could be found that the change law of the closure time of the frozen walls with groundwater velocity after overall encryption (optimization scheme 1) was basically the same as that before optimization. Under the conditions of the same groundwater flow rate, the closure time of the frozen wall after optimization was slightly reduced, and the limit flow rate that the frozen wall could be closed was still 11 m/d. After the method of using local encryption (optimization scheme 2) and adding an auxiliary freezing pipe upstream of water flow (optimization scheme 3), the change law of the closure time of frozen walls with groundwater velocity was quite different from that before optimization. When the groundwater velocity was less than 7 m/d, the closure time of the frozen wall changed slightly with the increase of groundwater velocity after adopting the above two optimization methods. When the water flow rate was greater than 8 m/d, the closure time of the frozen wall increased rapidly with the increase of groundwater flow rate, but the closure time still decreased significantly compared with that before optimization.
In the optimization scheme 3, the distance between the auxiliary freezing hole and the freezing hole layout circle was the key factor affecting the closure time of the frozen wall. The influence of this factor on the closure time of frozen walls is shown in Figure 13. It can be seen from Figure 13 that the optimal setting distance of the auxiliary freezing pipe is 2 m when the groundwater velocity is 5 m/d~7 m/d and the optimal setting distance of the auxiliary freezing pipe is 2.5 m when the groundwater velocity is greater than or equal to 8 m/d.

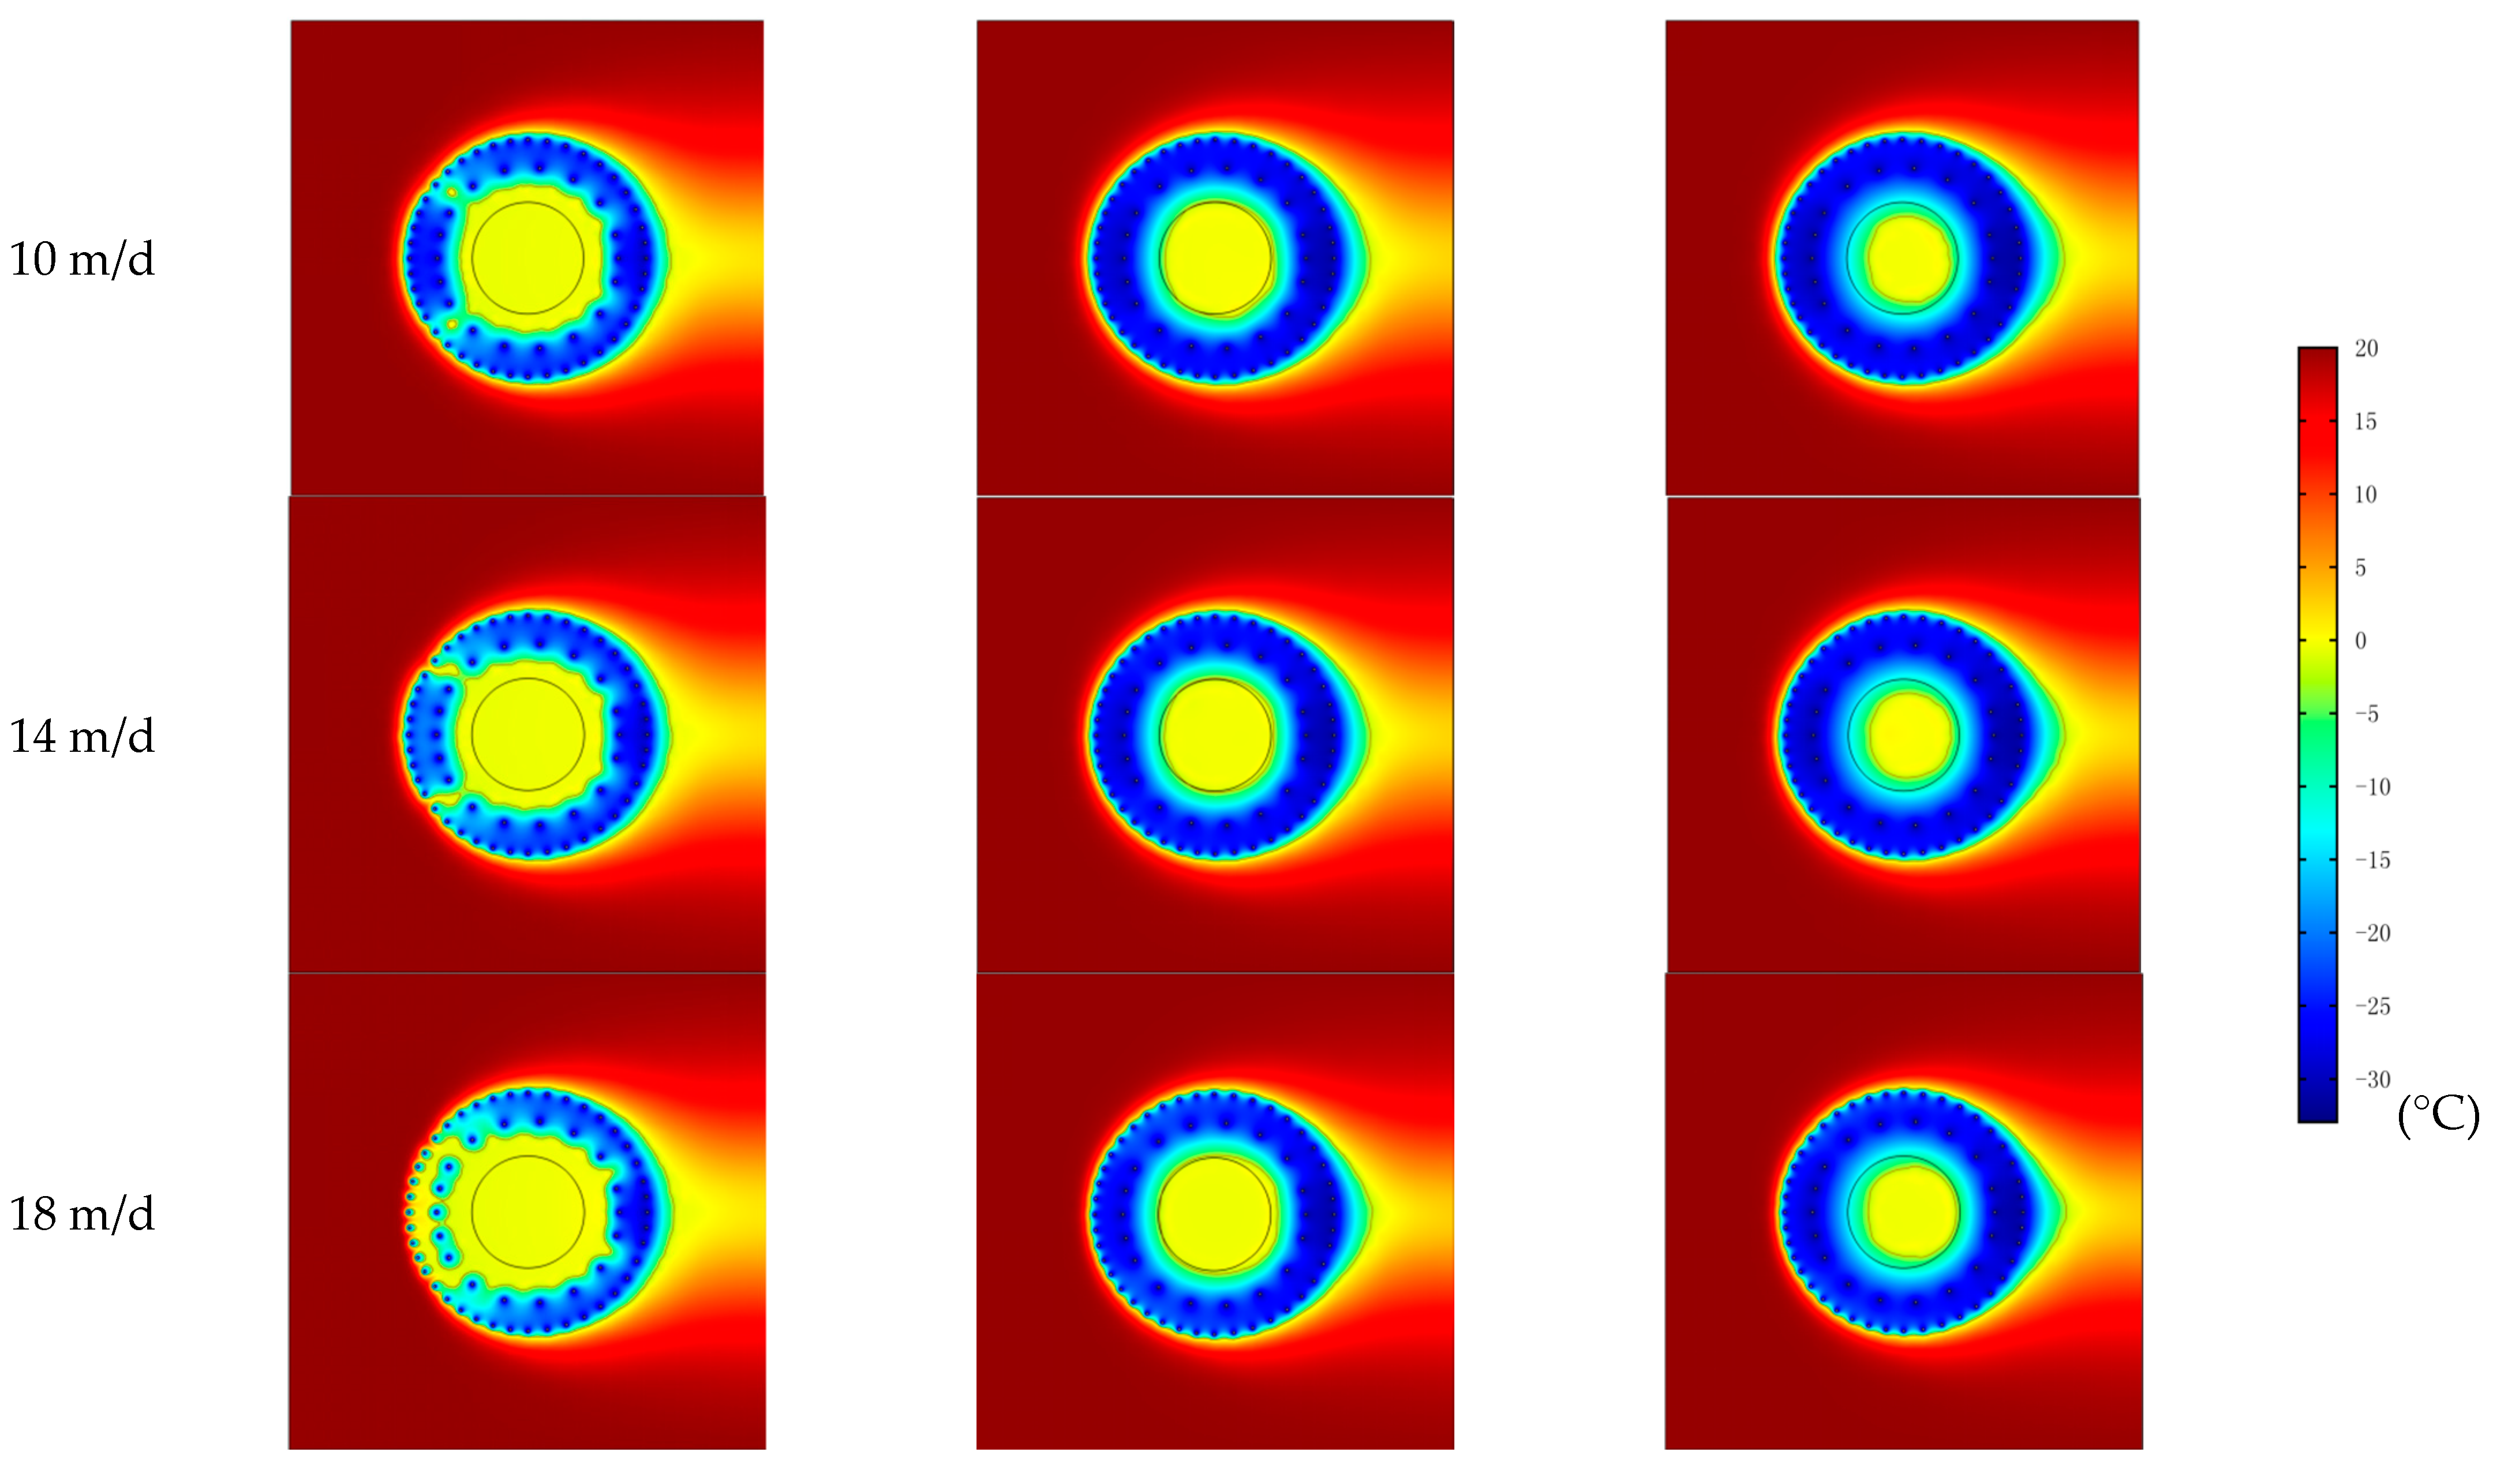
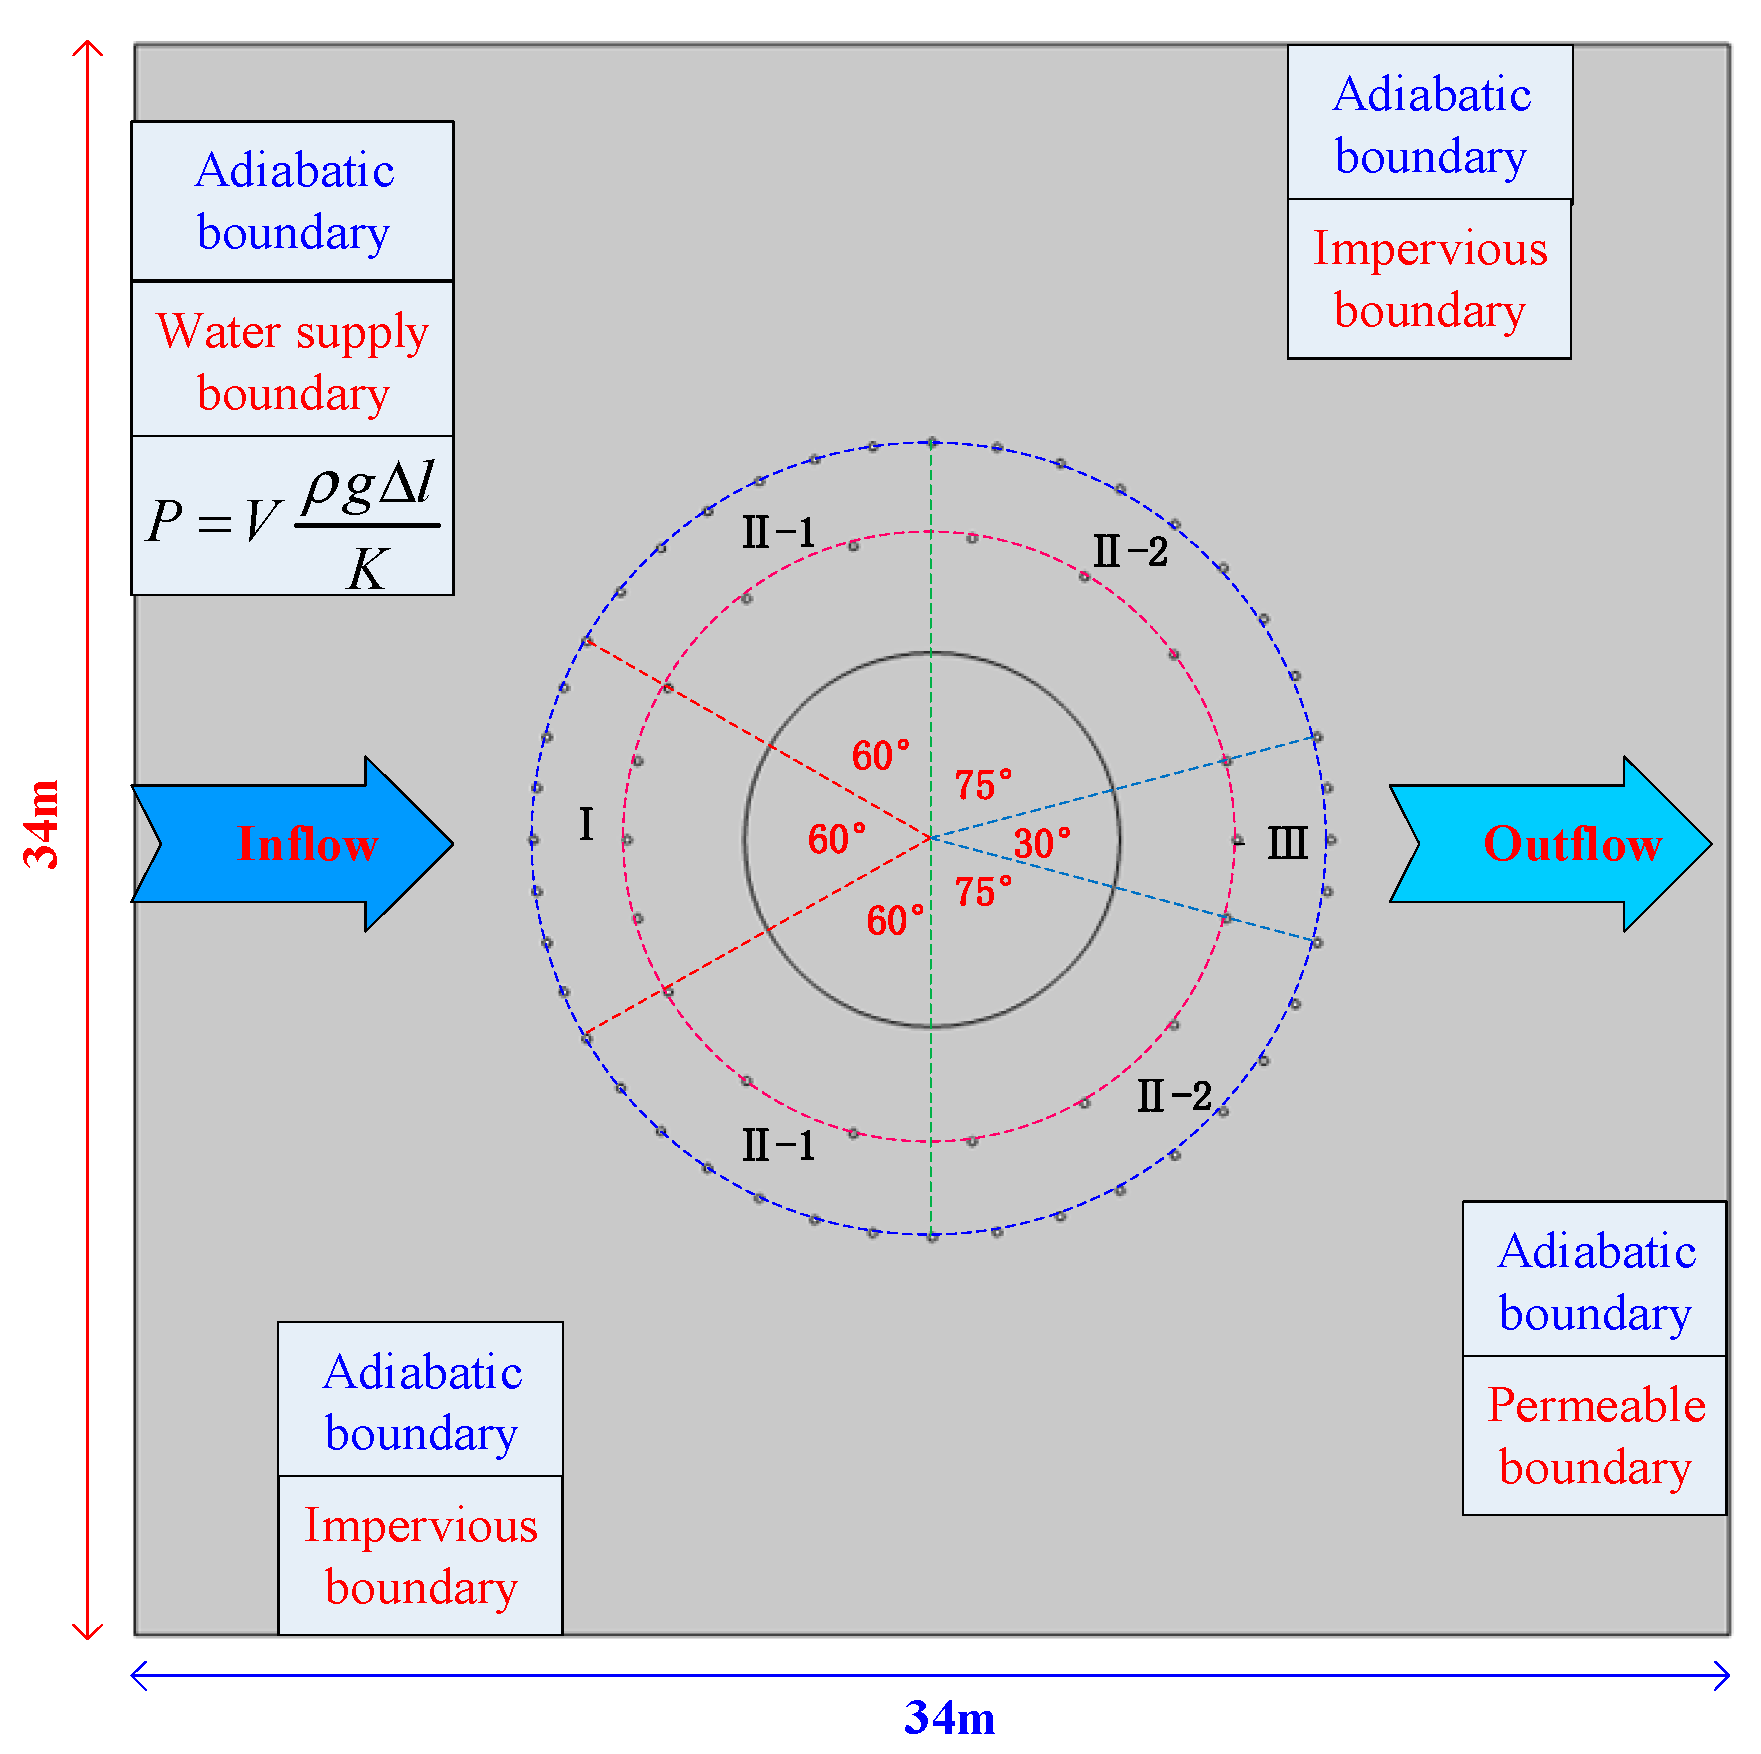
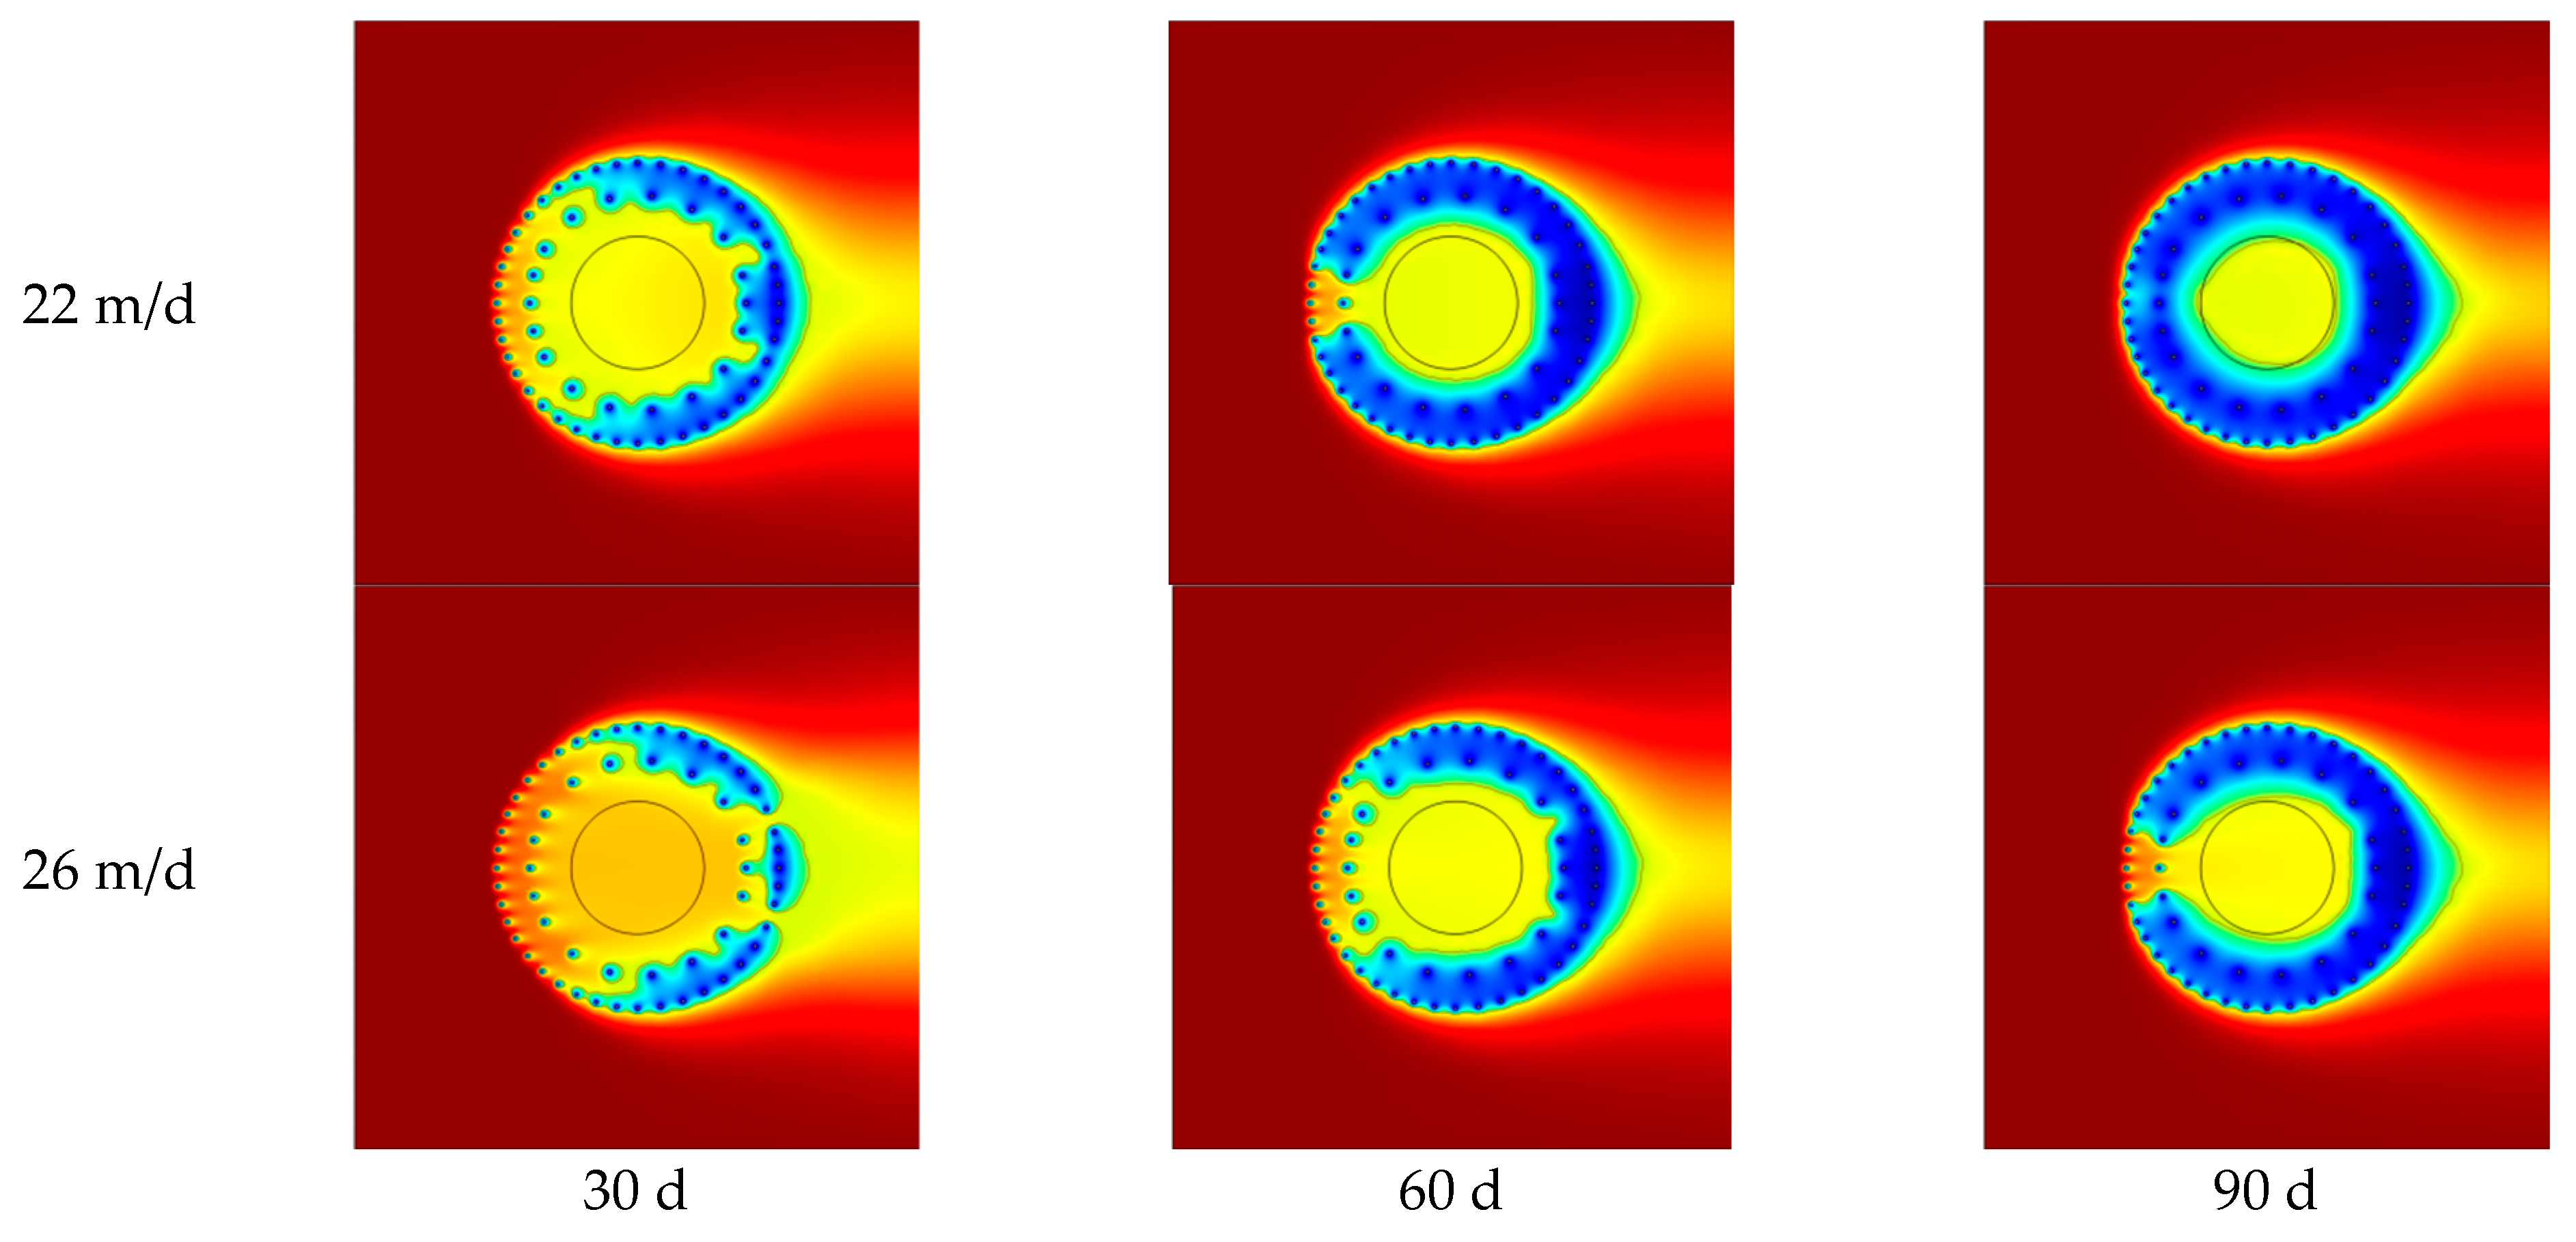
4.2. Optimization Design of Double-Circle Freezing Holes

The layout scheme of the freezing holes of the wind shaft in the Zhangji mine is shown in Table 7. Under the action of groundwater, the convection heat transfer of water flow was most significant upstream of the layout circle of freezing holes, so the freezing efficiency was the lowest at this position. In the process of flowing to the downstream area, the water constantly exchanged heat with the surrounding freezing holes through convection heat transfer. When the water flowed through the downstream area of the freezing hole layout circle, the temperature of the water flow was slightly lower than the initial temperature, so the freezing efficiency in this area was higher than that in the upstream area. The area on both sides of the layout circle of freezing holes was affected by the superposition of the cold quantity of several freezing holes, so the freezing efficiency was higher than other areas [38].
According to the influence of groundwater on the artificial freezing temperature field in different regions, the outer layout circle of freezing holes was divided into zones I, II-1, II-2, and III, and the inner layout circle of freezing holes was divided into zones I, II and, III, as shown in Figure 14.
The spacing of freezing holes in zone I and zone III of the outer ring, which were most severely impacted by water flow, was reduced from 1.27 m to 1.11 m. The spacing of freezing holes in zone I and zone III in the inner ring was reduced from 2.27 m to 1.70 m. The spacing of freezing holes in zone II-1 of the outer ring was kept unchanged at 1.27 m, and the spacing of freezing holes in zone II-2 of the outer ring, which was least affected by water flow and had superposition of cooling capacity, was increased from 1.27 m to 1.39 m. The spacing of freezing holes in zone II of the inner ring was increased from 2.27 m to 2.55 m. The parameters of the optimization scheme are shown in Table 8.
After adopting the optimization scheme, the number of freezing holes in the outer ring was 42, and the number of freezing holes in the inner ring was 18, which was consistent with the conventional freezing scheme.
The change rule of the closure time of the frozen wall before and after optimization is shown in Figure 15. By comparison, it was found that if the conventional layout scheme of freezing holes was used, when the groundwater velocity was greater than 13 m/d, the closure time of the frozen wall increased sharply with the increase of groundwater velocity, and the limit velocity of frozen wall closure was only 20 m/d. After the optimized scheme was adopted, the closure time of the frozen wall varied slightly with groundwater velocity when the flow rate was small. When the groundwater velocity reached 20 m/d, the closure time of the frozen wall was only 50 d and when the groundwater velocity was greater than 20 m/d, the closure time of the frozen wall increased rapidly with the increase of groundwater flow rate; the limit flow rate of frozen wall closure reached 26 m/d after adopting the optimization scheme.
After the optimization scheme was adopted, the distribution law of freezing temperature fields is shown in Figure 16. By comparing it with the situation before optimization [38], it was found that with the same groundwater flow velocity, the growth rate of the frozen area in zone I and zone III, which are seriously affected by water flow, was significantly increased; the frozen region on either side did not change significantly. This shows that the optimal scheme could realize the reasonable distribution of heat in the artificial ground freezing process under the action of groundwater and improve the freezing efficiency.

5. Conclusions and Discussion

(1)
The formation mechanism of artificial frozen walls under the action of high-flow-rate groundwater was studied by similar physical model tests. The results show that the flowing groundwater reduced the heat transfer efficiency of the freezing holes and changed the spatial distribution of the frozen area. The closure time and non-uniformity coefficient of the frozen wall increased with the increase of the groundwater velocity.
(2)
Considering the effect of migration and heat change, as well as the influence of absolute porosity reduction on seepage during the freezing process, a numerical model of hydrothermal coupling was constructed using laws of conservation of energy and mass. According to the action characteristics of groundwater on freezing temperature fields, optimization schemes were proposed for freezing holes of single and double circles, respectively, and the effect of optimization schemes was calculated and analyzed by numerical calculation.
(3)
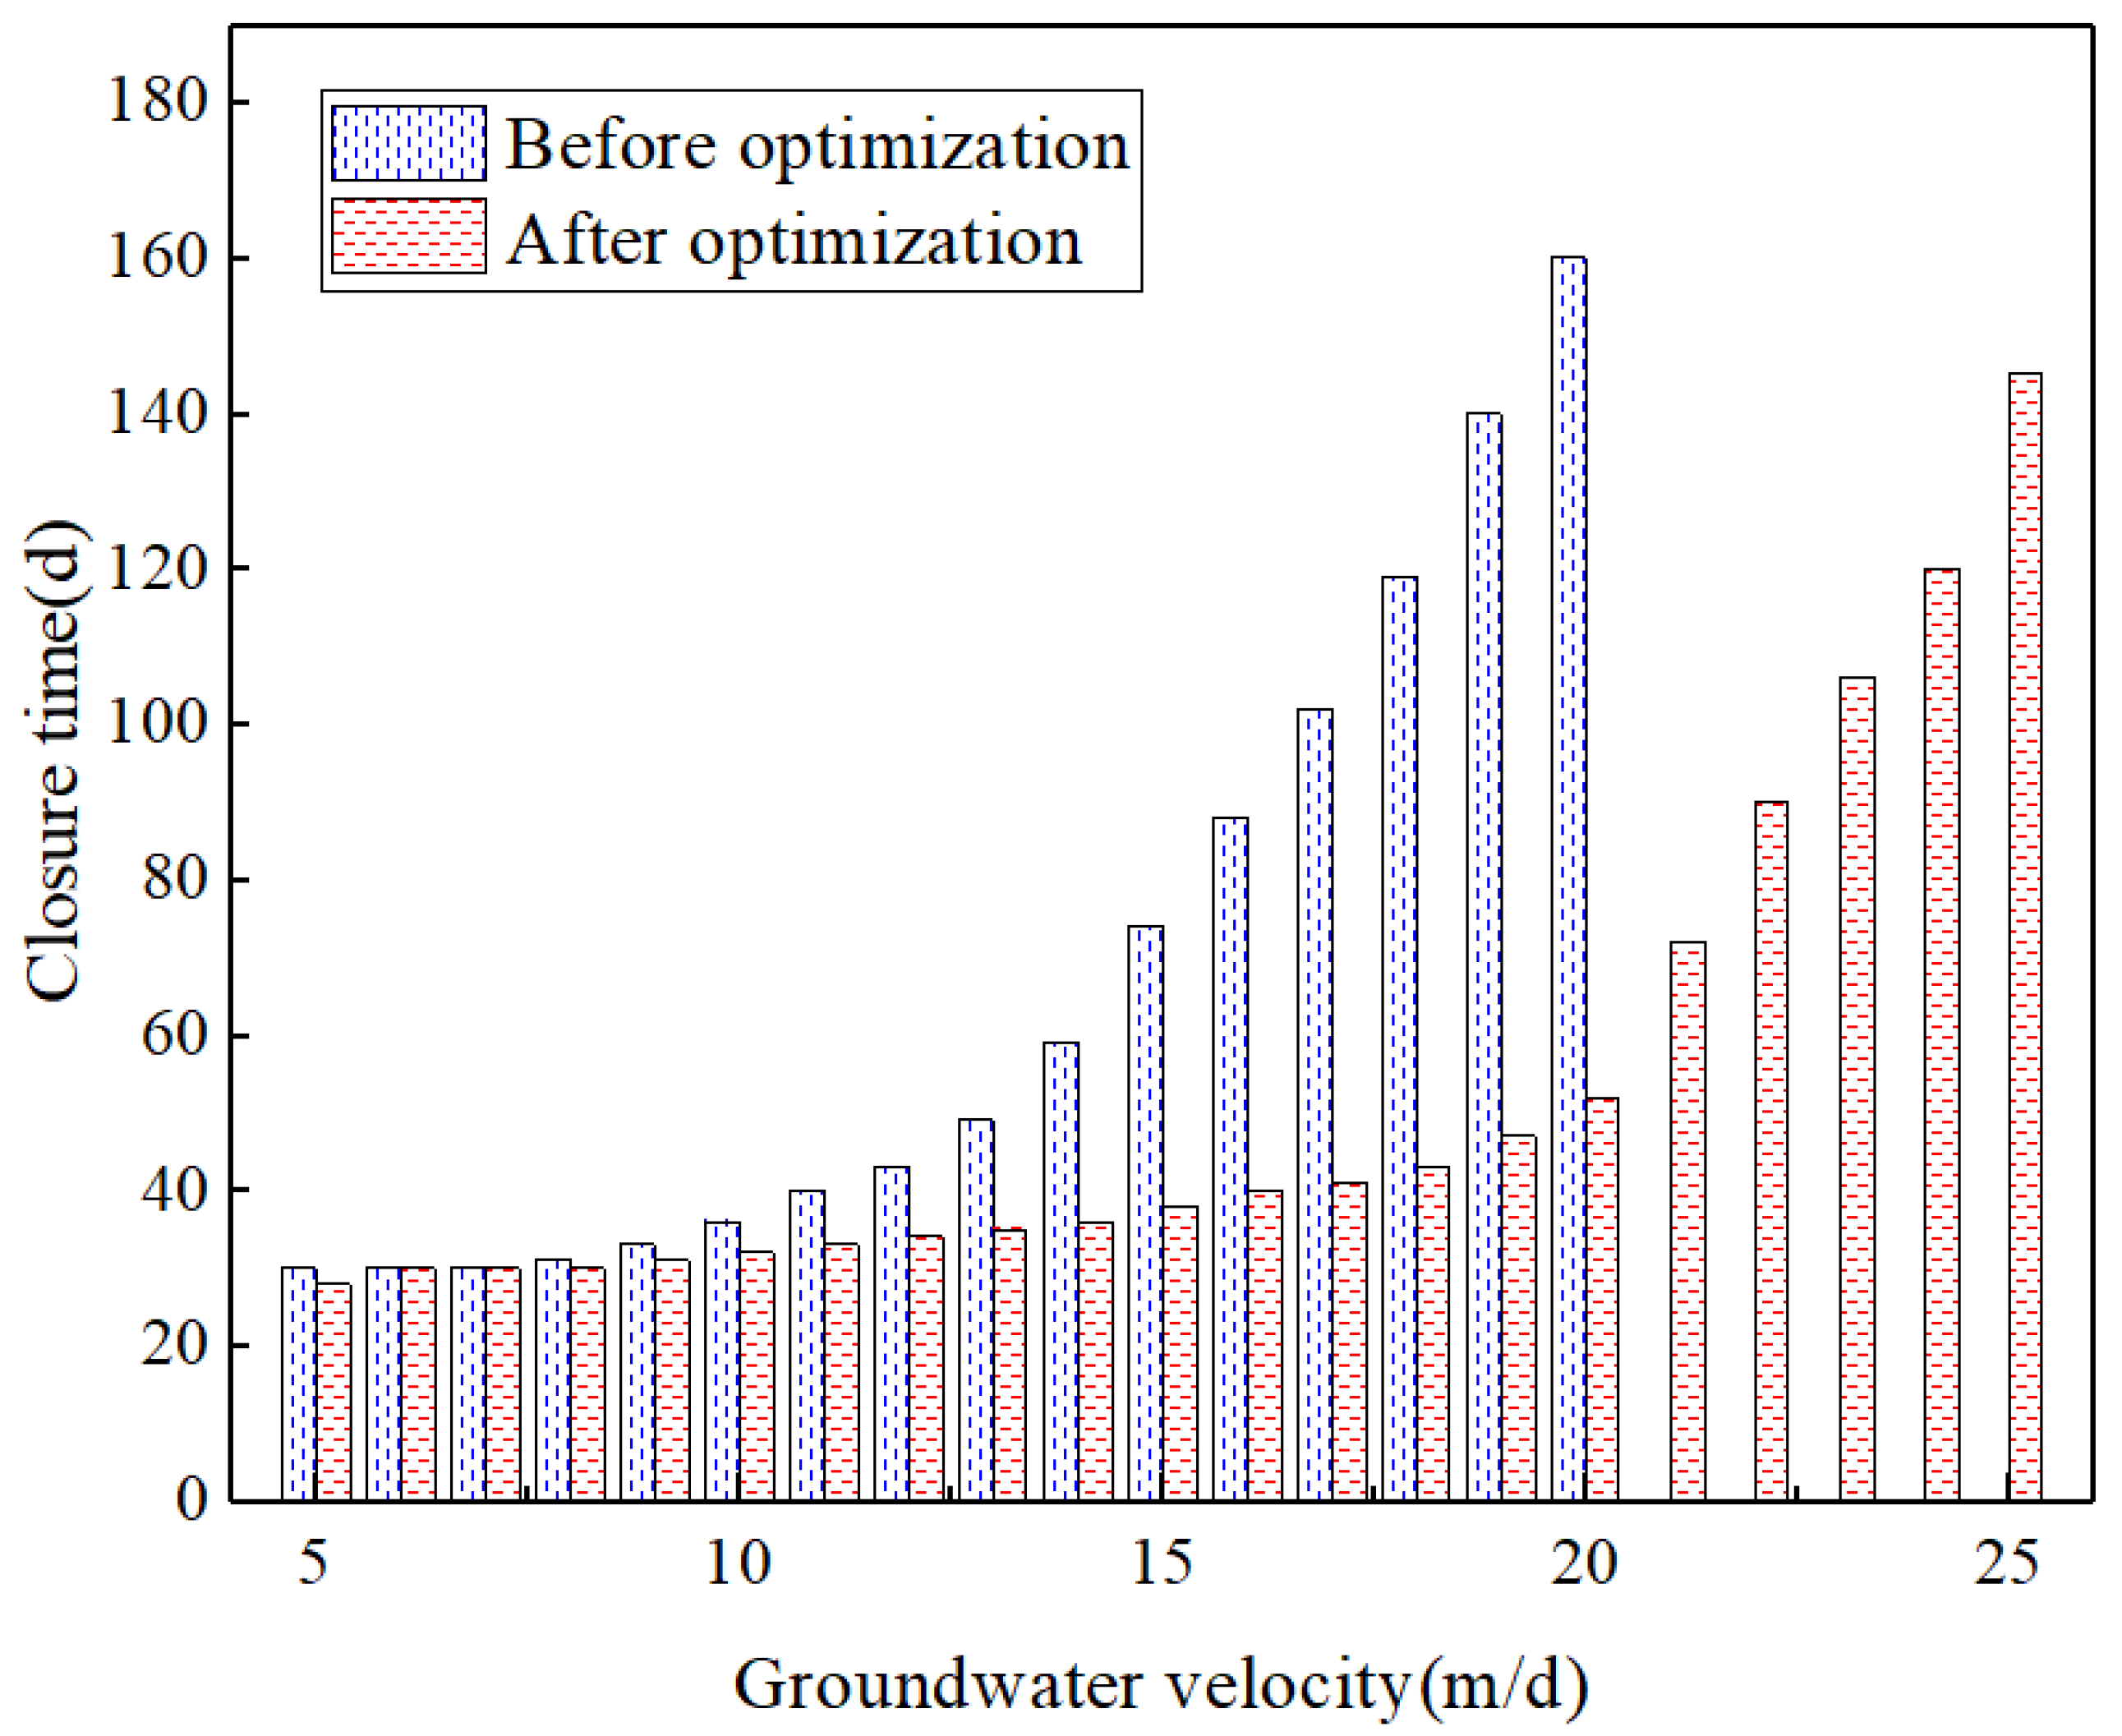
In the optimized design scheme of single-circle freezing holes, both methods of local compaction and adding auxiliary freezing holes upstream can effectively shorten the closure time of the frozen wall, and increase the limit flow velocity at which the frozen wall can be closed. The optimum spacing of an auxiliary freezing pipe under different groundwater velocities was obtained by calculation.
(4)
In the optimized design scheme of double-circle freezing holes, the spacing of freezing holes in different regions was optimized and adjusted according to the influence degree of water flow on the freezing temperature field under the condition that the number of freezing holes was kept constant. After adopting this optimization scheme, the limit flow velocity of frozen wall closure increased significantly.
(5)
This experiment only studied the formation rules of the frozen walls of typical sand layers affected by the seepage field, and the sand layers selected in the experiment was close to uniform, aiming to get the general rule of the artificial frozen wall formation of the stratum permeated with high velocity through this study. When comparing the simulation results with the numerical results, it was found that although the overall agreement between the two results was high, there was still some difference between the simulated temperature curve and the measured temperature curve under the conditions of high flow rate. The reasons for the above phenomenon were as follows: under the conditions of high flow velocity, the flow direction and porous medium cannot be guaranteed to remain unchanged, which was different from the case of uniform medium and uniform flow velocity assumed in the theoretical model. Therefore, there was a certain gap between the simulation results and the experimental results. In future research, considering the randomness of stratum distribution and groundwater distribution, we would build a prediction model for the freezing temperature fields of stratum permeated with high velocity, and carry out further research on this problem through numerical calculation. Additionally, we would further improve the hydrothermal coupling calculation theory in the subsequent research, so as to improve the calculation accuracy of numerical simulation.
(6)
It should be noted that the optimization scheme of freezing holes proposed in this study only aimed at the situation of constant groundwater flow direction, the randomness of flow velocity and flow direction was not considered, which was a simplified treatment of the actual conditions. In the follow-up study, we will consider the flow velocity and randomness of flow direction to build a more accurate 3D numerical calculation model, and then propose an optimal layout method of freezing holes suitable for more complex conditions.

Author Contributions

Conceptualization, B.W. and C.R.; methodology, B.W.; software, B.W.; validation, B.W. and Y.C.; formal analysis, B.W.; investigation, B.W.; resources, H.C.; data curation, Y.C.; writing—original draft preparation, B.W.; writing—review and editing, Y.C.; visualization, B.W.; supervision, H.C.; project administration, B.W.; funding acquisition, B.W. and C.R. All authors have read and agreed to the published version of the manuscript.

Funding

This research was funded by Natural Science Research in Universities of Anhui Province (KJ2021A0425), China Postdoctoral Science Foundation (Grant No. 2021M703621), Natural Science Foundation of Anhui Province (Grant No. 2108085QE251), Natural Science Foundation of Anhui University of Science and Technology (xjzd2020-18), Talent Introduction Project of Anhui University of Science and Technology (13200403).

Institutional Review Board Statement

Not applicable.

Informed Consent Statement

Not applicable.

Data Availability Statement

The data used to support the findings of this study are available from the corresponding author upon request.

Conflicts of Interest

The authors declare that they have no known competing financial interest or personal relationship that could have appeared to influence the work reported in this paper.

References

  1. Cheng, H. Freezing Method and Technology of Deep Alluvium; Science and Technology of China Press: Beijing, China, 2016. [Google Scholar]
  2. Cai, H.; Liu, Z.; Li, S.; Zheng, T. Improved analytical prediction of ground frost heave during tunnel construction using artificial ground freezing technique. Tunn. Undergr. Space Technol. 2019, 92, 103050. [Google Scholar] [CrossRef]
  3. Wang, B.; Rong, C.; Cheng, H.; Yao, Z.; Cai, H. Research and Application of the Local Differential Freezing Technology in Deep Alluvium. Adv. Civ. Eng. 2020, 2020, 9381468. [Google Scholar] [CrossRef]
  4. Zhou, X.; Su, L.; He, C. Horizontal ground freezing method applied to tunneling of Beijing underground railway system. Chin. J. Geotech. Eng. 1999, 21, 319–322. [Google Scholar]
  5. Yue, F.-T.; Qiu, P.-Y.; Yang, G.-X.; Shi, R. Design and practice of freezing method applied to connected aisle in tunnel under complex conditions. Chin. J. Geotech. Eng. 2006, 28, 660–663. [Google Scholar]
  6. Li, D.Y.; Lu, A.Z.; Zhang, Q.H. Analysis of freezing method for construction of connected aisle in Nanjing metro tunnels. Chin. J. Rock Mech. Eng. 2004, 23, 334–338. [Google Scholar]
  7. Cai, H.; Cheng, H.; Peng, L.; Yao, Z.; Rong, C. Model test on displacement field of double-route metro constructed with horizontal freezing method. Chin. J. Rock Mech. Eng. 2009, 28, 2088–2095. [Google Scholar]
  8. Hu, X.; Ren, H.; Chen, J.; Cheng, Y.; Zhang, J. Model test study of the active freezing scheme for the combined pipe-roof and freezing method. Mod. Tunn. Technol. 2014, 51, 92–98. [Google Scholar]
  9. Zhou, X.; Wang, M.; Zhang, X. Model test research on the formation of freezing wall in seepage ground. J. China Coal Soc. 2005, 30, 196–201. [Google Scholar]
  10. Huang, R.; Chang, M.; Tsai, Y.; Lu, S.; Wu, P. Influence of seepage flow on temperature field around an artificial frozen soil through model testing and numerical simulations. In Proceedings of the 18th Southeast Asian Geotechnical Conference (18SEAGC) & Inaugural AGSSEA Conference (1AGSSEA), Singapore, 29–31 May 2013; pp. 973–978. [Google Scholar]
  11. Pimentel, E.; Sres, A.; Anagnostou, G. Large-scale laboratory tests on artificial ground freezing under seepage-flow conditions. Géotechnique 2012, 62, 227–241. [Google Scholar] [CrossRef]
  12. Sudisman, R.A.; Osada, M.; Yamabe, T. Experimental Investigation on Effects of Water Flow to Freezing Sand around Vertically Buried Freezing Pipe. J. Cold Reg. Eng. 2019, 33, 04019004. [Google Scholar] [CrossRef] [Green Version]
  13. Li, F.; Ding, H.; Zhang, X. Model test research of formation law of double-row-pipe freezing wall in water rich sand layer under seepage. Chin. J. Rock Mech. Eng. 2019, 38, 386–395. [Google Scholar]
  14. Song, L.; Wang, G.; Yang, C.; Han, L.; Li, H.; Yang, W. Model test study on freezing temperature field of seepage fissure rock mass. J. Min. Saf. Eng. 2019, 36, 1256–1263. [Google Scholar]
  15. Liu, W.; Zhang, J.; Shan, R. Experiments on temperature field of multi-row-pipe partial horizontal freezing body in Beijing sand-gravel stratum under seepage. Rock Soil Mech. 2019, 44, 3425–3434. [Google Scholar]
  16. Shan, R.; Liu, J.; Chai, G. Experimental study on the expansion law of local horizontal frozen body under seepage. J. China Coal Soc. 2019, 44, 526–534. [Google Scholar]
  17. Wang, B.; Rong, C.; Cheng, H.; Cai, H.; Dong, Y.; Yang, F. Temporal and spatial evolution of temperature field of single freezing pipe in large velocity infiltration configuration. Cold Reg. Sci. Technol. 2020, 175, 103080. [Google Scholar] [CrossRef]
  18. Wang, B.; Rong, C.; Cheng, H.; Cai, H. Experimental investigation on heat transfer law of multiple freezing pipes in permeable stratum with high seepage velocity. Int. J. Heat Mass Transf. 2022, 182, 121868. [Google Scholar] [CrossRef]
  19. Zhang, J.-X.; Qi, Y.; Yang, H.; Song, Y.-W. Temperature field expansion of basin-shaped freezing technology in sandy pebble stratum of Beijing. Rock Soil Mech. 2020, 41, 2796–2807. [Google Scholar]
  20. Zhang, S.; Yue, Z.; Sun, T. Evolution of ground freezing temperature field under sudden seepage with stable flow rate and discriminate method of seepage. J. China Coal Soc. 2020, 45, 4017–4027. [Google Scholar]
  21. Harlan, R.L. Analysis of coupled heat-fluid transport in partially frozen soil. Water Resour. Res. 1973, 9, 1314–1323. [Google Scholar] [CrossRef] [Green Version]
  22. Xu, G. Study on mechanical charateristics and multiphysical coupling problems of rock at low temperatures. Chin. J. Rock Mech. Eng. 2007, 26, 1075. [Google Scholar]
  23. Gao, J.; Feng, M.; Yang, W. Research on distribution law of frozen temperature field of fractured rock mass with groundwater seepage. J. Min. Saf. Eng. 2013, 30, 68–73. [Google Scholar]
  24. Liu, J.; Liu, Q.; Zhou, D.; Zhu, X. Influence of groundwater transverse horizontal flow velocity on the formation of artificial horizontal freezing wall. J. Basic Sci. Eng. 2017, 25, 258–265. [Google Scholar]
  25. Vitel, M.; Rouabhi, A.; Tijani, M.; Guérin, F. Modeling heat transfer between a freeze pipe and the surrounding ground during artificial ground freezing activities. Comput. Geotech. 2015, 63, 99–111. [Google Scholar] [CrossRef]
  26. Vitel, M.; Rouabhi, A.; Tijani, M.; Guérin, F. Modeling heat and mass transfer during ground freezing subjected to high seepage velocities. Comput. Geotech. 2016, 73, 1–15. [Google Scholar] [CrossRef]
  27. Vitel, M.; Rouabhi, A.; Tijani, M.; Guérin, F. Thermo-hydraulic modeling of artificial ground freezing: Application to an underground mine in fractured sandstone. Comput. Geotech. 2016, 75, 80–92. [Google Scholar] [CrossRef]
  28. Marwan, A.; Zhou, M.-M.; Zaki Abdelrehim, M.; Meschke, G. Optimization of artificial ground freezing in tunneling in the presence of seepage flow. Comput. Geotech. 2016, 75, 112–125. [Google Scholar] [CrossRef]
  29. Zhou, M.-M.; Meschke, G. A multiscale homogenization model for strength predictions of fully and partially frozen soils. Acta Geotech. 2017, 13, 175–193. [Google Scholar] [CrossRef]
  30. Zhou, M.M.; Meschke, G. Numerical Modeling of Artificial Ground Freezing: Multiphase Modeling and Strength Upscaling. In Proceedings of the Ground Improvement and Geosynthetics, Reston, VA, USA, 5 May 2014. [Google Scholar]
  31. Alzoubi, M.A.; Madiseh, A.; Hassani, F.P.; Sasmito, A.P. Heat transfer analysis in artificial ground freezing under high seepage: Validation and heatlines visualization. Int. J. Therm. Sci. 2019, 139, 232–245. [Google Scholar] [CrossRef]
  32. Alzoubi, M.A.; Nie-Rouquette, A.; Sasmito, A.P. Conjugate heat transfer in artificial ground freezing using enthalpy-porosity method: Experiments and model validation. Int. J. Heat Mass Transf. 2018, 126, 740–752. [Google Scholar] [CrossRef]
  33. Hu, R.; Liu, Q.; Xing, Y. Case Study of Heat Transfer during Artificial Ground Freezing with Groundwater Flow. Water 2018, 10, 1322. [Google Scholar] [CrossRef] [Green Version]
  34. Huang, S.; Guo, Y.; Liu, Y.; Ke, L.; Liu, G.; Chen, C. Study on the influence of water flow on temperature around freeze pipes and its distribution optimization during artificial ground freezing. Appl. Therm. Eng. 2018, 135, 435–445. [Google Scholar] [CrossRef]
  35. Huang, S.-B.; Liu, Q.-S.; Cheng, A.-P.; Liu, Y.-Z. A coupled hydro-thermal model of fractured rock mass under low temperature and its numerical analysis. Rock Soil Mech. 2018, 39, 735–744. [Google Scholar]
  36. Huang, S.; Liu, Q.; Cheng, A.; Liu, Y.; Liu, G. A fully coupled thermo-hydro-mechanical model including the determination of coupling parameters for freezing rock. Int. J. Rock Mech. Min. Sci. 2018, 103, 205–214. [Google Scholar] [CrossRef]
  37. Zhang, J.; Qi, Y.; Yang, H. Formation rules of horizontal frozen plate with multiple rows in Beijing sandy gravel stratum under seepage condition. Chin. J. Rock Mech. Eng. 2020, 39, 3188–3196. [Google Scholar]
  38. Wang, B.; Rong, C.-X.; Lin, J.; Cheng, H.; Cai, H.-B. Study on the Formation Law of the Freezing Temperature Field of Freezing Shaft Sinking under the Action of Large-Flow-Rate Groundwater. Adv. Mater. Sci. Eng. 2019, 2019, 1670820. [Google Scholar] [CrossRef] [Green Version]
Figure 1. Test system diagram.
Water 14 02077 g001
Figure 2. Schematic diagram of temperature measuring point layout. (a). Main test plane measuring point (mm); (b). Auxiliary test plane measuring points (mm).
Water 14 02077 g002
Figure 3. Fitted curve of the closure time of the frozen wall.
Water 14 02077 g003
Figure 4. Variation of Rd/Ru ratio with seepage velocity.
Water 14 02077 g004
Figure 5. Heat transfer mechanism of ground freezing process under the action of groundwater.
Water 14 02077 g005
Figure 6. Geometric model and boundary conditions of numerical calculation.
Water 14 02077 g006
Figure 7. Comparison of temperature simulation results and measured results.
Water 14 02077 g007
Figure 8. Comparison between simulated and measured results of freezing front under different seepage velocities.
Water 14 02077 g008
Figure 9. Comparison between simulated and measured results of frozen area under different seepage velocities. (a) 0 m/d; (b) 3 m/d; (c) 9 m/d.
Water 14 02077 g009
Figure 10. Schematic diagram of optimal layout scheme of freezing holes. (a) Original scheme; (b) Optimization scheme 1; (c) Optimization scheme 2; (d) Optimization scheme 3.
Water 14 02077 g010
Figure 11. Development law of the freezing temperature field of the single-circle holes after opti-mization.
Water 14 02077 g011aWater 14 02077 g011b
Figure 12. Comparative analysis of closure time of frozen walls formed by different optimization schemes.
Water 14 02077 g012
Figure 13. Influence law of auxiliary freezing holes spacing L on closure time under different groundwater velocities.
Water 14 02077 g013
Figure 14. Numerical calculation model of double-circle freezing holes.
Water 14 02077 g014
Figure 15. Comparison of frozen wall closure time before and after optimization.
Water 14 02077 g015
Figure 16. Development law of the freezing temperature field of the double-circle holes after optimization.
Water 14 02077 g016aWater 14 02077 g016b
Table 1. Cases of freezing projects affected by groundwater.
ProjectDateGeological ConditionsEngineering Problems
Shenzhen Metro 4A Section2003The subway tunnel located at the intersection of Heping Road and Jiefang Road in Shenzhen city, where the stratum structure is loose, the groundwater flow rate reaches 15 m/d.In the construction process of artificial ground freezing method, the temperature drop was slow, the temperature drop was only 0.1 °C every day, and sometimes the temperature even rose, which seriously affected the construction progress.
Tianjin Metro Line 2 South Building to Tucheng Section of the Contact Channel2006The stratum where the project was located was mainly quaternary floodplain sedimentary layer, which had a large pore ratio and rich water content. Moreover, there was transgression phenomenon in this area, and the groundwater flow rate was high.The development rate of frozen wall in this region was relatively slow.
Shanghai Yangtze River Tunnel Project Middle Section Tunnel Connection Channel Project2007The geological condition of the strata was complex, the strata had strong permeability and the groundwater velocity was large.In the freezing construction process, the temperature drop rate of freezing curtain was slow, and the temperature rose during the maintenance freezing period.
Contact Channel No. 10 between Wuyuanwan Station and LiuWudian Station of Mud-Water Shield Tunnel from Xiamen Island to Xiang’an2012The stratum where the connection channel was located was rich in water, had hydraulic connection with seawater, and the groundwater velocity was high.The development rate of frozen wall was slow.
Libi Mine Auxiliary Shaft Freezing Project2019The shaft passed through the sandy cobblestone layer with a thickness of 4.33~13.56 m. A large amount of water was pumped from the adjacent water source well below the underground flow of the frozen auxiliary shaft, which increased the groundwater flow velocity of the strata.In the sand and pebble layer (about 21 m deep), the temperature of 30#, 31#, 32#, and 33# freezing holes of the frozen wall was high, and there were abnormal “gaps”.
Nantong Urban Rail Transit Line 22020The formation was supersaturated silty soil, and the groundwater flow rate reached 7.5 m/d.The frozen wall developed slowly.
Table 2. Setting values of water flow parameters in the model test.
TestThe Seepage VelocityWater FlowThe Water Temperature
100/
23 m/d0.25 m3/h15 °C
36 m/d0.50 m3/h15 °C
49 m/d0.75 m3/h15 °C
Table 3. Comparison of physical parameters between CaCl2 and alcohol.
RefrigerantDensity (kg/m3)Specific Heat (J/(kg·°C))
CaCl2 (28.5%)12702.7 × 103
Alcohol7892.4 × 103
Table 4. Flow rate conversion of low temperature refrigerant of engineering and test.
ParameterCaCl2 (In the Engineering)Alcohol (In the Test)
Flow rate4~10 m3/h2.34~5.94 m3/h
Temperature−32 °C−32 °C
Table 5. The closure time of the frozen wall under different seepage velocity.
The Seepage Velocity (m/d)Closure Time (min)Delayed Time (min)
0720-
380585
61760955
943002540
Table 6. Freezing parameters of central wind shaft in Panyi Mine.
ParameterValueUnit
The inner diameter of the wellbore6m
Diameter of excavation8m
Freezing holeDiameter of layout circle14m
Quantity381
Spacing1.16m
Temperature−32°C
Size159mm
159 × 6
Table 7. Freezing parameters of the wind well in the Zhangji Mine.
ParameterValueUnit
The inner diameter of the shaft7m
Diameter of excavation9m
The auxiliary freezing holesThe diameter of the layout ring13m
Quantity181
Hole spacing2.27m
Temperature−32°C
Size159 × 6mm
The main freezing holesThe diameter of the layout ring17m
Quantity421
Hole spacing1.27m
Temperature−32°C
Size159 × 6mm
Row spacing2m
Table 8. Design parameters of double-circle freezing optimization scheme.
Original SchemeOptimization Scheme
LocationQuantitySpacing/mLocationQuantityAngle/°Spacing/m
Inner circle182.27Inner circleI518601.7
II (×2)51352.55
III3301.7
Outer circle 421.27Outer circleI942601.11
II-1 (×2)7601.27
II-2 (×2)7751.39
III5301.11
Publisher’s Note: MDPI stays neutral with regard to jurisdictional claims in published maps and institutional affiliations.

