Article

Tsunami-like Flow-Induced Forces on the Landward Structure behind a Vertical Seawall with and without Recurve Using OpenFOAM

1
Department of Ocean Engineering, IIT Madras, Chennai 600036, India
2
Institute of Hydraulic Engineering and Water Resources Management, RWTH Aachen University, 52074 Aachen, Germany
*
Author to whom correspondence should be addressed.
Water 2022, 14(13), 1986; https://doi.org/10.3390/w14131986
Submission received: 30 April 2022 / Revised: 2 June 2022 / Accepted: 14 June 2022 / Published: 21 June 2022
(This article belongs to the Section Oceans and Coastal Zones)

Abstract

:
It is more common to introduce the parapet/recurve/wave return wall over the existing structure, such as a vertical seawall or composite structure, to reduce the overtopping efficiently. The advantage of a recurve wall on top of the sea wall has been studied in the past in regards to wave interaction and overtopping. However, their efficiency in protecting the inland structure during extreme events such as flooding during a tsunami is unexplored. The present study addresses the effect of a vertical seawall with recurve in reducing the dam break surge simulating tsunami-induced forces on an inland structure. The study compares the momentum transferred on the landward structure behind a Vertical seaWall (VW) and a vertical wall with the Large ReCurve on the top (LRC) during overtopped conditions. The outcome from the numerical simulation shows an insignificant contribution due to the LRC in reducing the force on the inland structure compared to the VW, albeit delaying the impact time. However, the LRC performed slightly better in the case of a low-rise wall located near the inland structure than the VW. Furthermore, a low-rise VW increases the force and overturning moment on the inland structure compared to no-wall conditions. Both the LRC and the VW reduced the horizontal force on the structure linearly with the increase in height. An exponential decrease in the overturning moment was observed on the landward structure with the increase in the height of the VW or the LRC. Design equations are proposed for the forces and overturning moment reduction based on the height of the VW or the LRC.

Graphical Abstract

1. Introduction

The use of a parapet/bullnose/wave return walls/recurve over an existing structure has been familiar from early ages [1,2]. Early research on the overhangs over the existing wall focused on understanding the overtopping characteristics of different parapet/bullnose/wave return walls/recurve—e.g., [3,4,5,6,7,8,9,10,11,12] and the impact pressure on the overhang—e.g., [1,13,14,15,16,17,18]. The primary purpose of the overhang is to deflect the uprushing waves back to the seaside. Due to the deflection of the wave, the water recirculates in front of the structure, thereby transferring the overtopping discharge directly to the sea. Compared to the parapet, the recurve is preferred since it smoothly transfers the discharge back into the sea, thereby reducing the local pressure accumulation at the intersection between the parapet and the vertical wall [13,14]. Furthermore, introducing these overhangs with the existing structure could reduce the freeboard depth [19]. In addition, the benefits of altering the seaward shape of the seawall for efficient reduction of overtopping along with the reduction of impact force experienced by the coastal structure due to the wave loads have been investigated by many—c.f., [20,21,22].
Despite numerous studies on the performance of different seawalls in different wave conditions, the mitigation effect of seawalls during extreme events such as a tsunami has attracted the least. In the 2011 Tohoku tsunami and the 2004 Indian Ocean tsunami, the vertical sea wall played a significant role in protecting the inland structures by reducing the tsunami inundation. During the 2011 Tohoku tsunami, in many locations along the coasts, the tsunami surge overtopped the sea wall, where inundation depth was over 10 m and hit the structures behind the seawall [23,24,25,26]. Even in overtopped conditions, seawalls reduced the building damage during the 2004 Indian Ocean Tsunami in Thailand [27,28]. Thus, using SPH simulations, Crespo et al. [29] investigated the force and overturning moment on the inland structure behind the finite width Vertical seaWalls (VW). The study observed the effect of distance between the inland structure and the VW (L) on the maximum forces (F) and the overturning moment (M) on the inland structure. As L increased, the F and M increased. Oshnack et al. [30] carried out experiments with vertical sea walls of different heights and found that the force on the inland structure decreases with the increase in the height of the sea wall, albeit with some discrepancies. Furthermore, the presence of the seawall delayed the time of surge interaction (tim) with the inland structure, and it was found to be proportional to the height of the seawall. Following Oshnack et al. [30], Thomas and Cox [31] carried out extensive experiments with sea walls of different heights ranging from 0.31 ≤ hs/hm ≤ 3.1 (hs = height of the seawall; hm = maximum surge height measured at the seawall location in its absence). The study proposed an empirical force reduction factor as a function of hs/hm and L by comparing without the seawall condition. The distance between the seawall and the inland structure (L) was found to play a significant role in the force on the inland structure. As L decreases, the force decreases, especially in larger hs/hm, similar to the observation by Crespo et al. [29]. However, low hs/hm located at L→0 has been found to offset the advantage of the seawall by increasing the force on the landward structure due to the “ramping effect” (i.e., uprushing water from the seawall is directly projected over the building at a higher elevation). A similar observation was reported by Rahman et al. [32] in experiments with a dam break. However, both Crespo et al. [29] and Thomas and Cox [31] carried out their study with a finite width seawall, which enables reconstruction of the deflected bore after a certain distance. Furthermore, Al-Faesly et al. [33] attempted to investigate the effect of different types of seawall (VW, 45° inclined seawall and curved wall) and their height in reducing the forces on the inland structure by keeping the seawall at two locations (L = 1b and 3b; where b is the width of the structure). For the VW and 45° inclined seawall, the force on the inland structure was more in 3b conditions compared to 1b condition, in line with Crespo et al. [29] and Thomas and Cox [31] for high rise walls. However, contrary observations were reported for the curved seawall due to this “ramping effect”. During such ramping process, much aeration occurs during the interaction with the building [31]. Capturing the force or the impulsive pressure accurately during such a process is difficult due to aeration [34,35,36]. Triatmadja and Nurhasanah [37] observed an insignificant variation in the force reduction percentage for the VW after L/Frbhb > 2 from the dam break experiments, where Frb is the Froude number evaluated using bore front celerity, and hb is the height of the bore at which force on the inland structure is maximum in the absence of a seawall (measured from the experiments without the structure and the seawall).
Arimitsu and Kawasaki [38] varied the seawall height and location of the inland structure to understand the flow and pressure characteristics at the structure front. With the increase in the hs, the overtopped inundation depth decreased, whereas the Froude number (Fr) of the overtopped flow increased. The same has been observed in Esteban et al.’s [39,40] experiments. Due to the increase in the Froude number of the overtopped bore, the non-dimensionalized pressure (obtained by dividing the pressure and overtopped bore depth) showed higher values at the structure’s bottom level, similar to the pressure profile suggested by Asakura et al. [41] for waves with fission. Thus, the pressure distribution also depends on the Fr of the overtopping surge [42]. Prabu et al. [43] attempted to understand the influence of the sea dike height on the force reduction and the effective L for maximum force reduction. The study concluded that depending on the strength of the surge, the effective L for maximum force reduction changes. More recently, Xu et al. [44] carried out extensive experiments considering the hs/E (E is the summation of velocity (surge front celerity) head and the static head) on the force reduction in the inland vertical wall. The study did not focus on the L since L/Frbhm was maintained above 2.83. It was found that the maximum force and the maximum moment would be amplified compared to the no-seawall case when hs/E < 0.35, thus suggesting the minimum height of the seawall required to avoid the negative consequence.
From the above discussion, it is clear that the force reduction depends on the height of the seawall (hs), the shape of the seawall, the distance between the seawall and the inland structure (L) and the Fr of the incoming flow. Most of the previous research focused on understanding the effect of the VW (seawall) on tsunami force reduction. The effect of parapet/bullnose/wave return walls/recurve in the existing seawall in tsunami force estimation received less attention, despite being commonly adopted in many coastal regions. The dependence of L on the forces and the overturning moment on the inland structure still needs further understanding, even for the VW. Furthermore, the force and moment variation with the hs still needs clarity, even for the VW, although a recent study by Xu et al. [44] concluded an exponential decrease with the increase in the hs/E.
As described above in detail and to the best knowledge of the authors, most studies investigating the effect of sea walls on reducing tsunami surge forces on inland structures conducted physical experiments. Nevertheless, many studies have applied numerical models to address such tsunami flow structure interaction problems in the past. Regularly applied methods that have been used in the tsunami interaction studies are the Finite Volume method [45,46,47], the Arbitrary Lagrangian-Eulerian method [48], the Finite Element method [49], the coupled FEM and meshless method [50,51], the coupled FEM and FVM methods [52] and particle-based methods, such as the Smoothed Particle Hydrodynamics [53], the Moving Semi-Implicit method and the Meshless Local Petrov Galerkin method [50,54]. With increasing computational resources in recent decades, numerical simulations can provide a more in-depth understanding of flow interaction processes [55,56]. From the range of available methods, the open-source FVM solver OpenFOAM is applied in the present study to investigate the interaction processes between tsunamis and inland structures in the presence of seawalls.
Thus, the present study will focus on understanding the effect of with and without recurve at the top of a vertical wall (LRC and VW) in the forces and overturning moment reduction on the inland buildings during tsunamis by carrying out numerical simulations using OpenFOAM. The simulations are carried out on a geometric scale of 1:15. The study reveals the difference in the force and the overturning moment observed between the plain vertical wall (VW) and vertical wall with the recurve at the top (LRC), thereby addressing the significance of recurve in the force and moment reduction during extreme scenarios. The study varied hs and L for both the LRC and the VW to understand the force and moment reduction. The dam break surge is used to replicate the extreme scenarios in the coastal region [57,58,59].
The paper is organized as follows: Initially, a brief introduction to the OpenFOAM and the adopted solver are made. The numerical model validation against the experimental results of Al-Faesly et al. [33] is then presented. After validation, the numerical tank representing a newly planned dam break setup at IIT Madras is described, followed by results and discussions. The results obtained from the simulations carried out 1) without an inland structure and mitigation wall (free-flow hydrodynamics evaluation), 2) without the LRC (or VW) and with the inland structure and 3) with the LRC (or VW) and the inland structure is detailed. Empirical equations are provided for force and moment acting on the inland structure in the presence of an LRC (or VW).

2. Numerical Simulation

The numerical simulation was carried out using the open-source CFD solver OpenFOAM, which was used for similar studies in the past [46,47,60,61]. OpenFOAM (OF) consists of numerous utilities, solvers and libraries applicable for an extensive range of physical problems. This study used the “interFoam” solver to simulate the free surface two-phase flow. The incompressible three-dimensional RANS conservation equations were solved using the Finite Volume Method (FVM) discretization. A PIMPLE algorithm was used for pressure velocity coupling. The Courant number was kept at 0.5 for all simulations, and variable time stepping was adopted during solving. The free surface was tracked by the volume of fluid (VOF) method. Turbulence modeling is essential since the flow is turbulent during the extreme wave interaction. Asadollahi et al. [46] reported that the realizable k-ε turbulent model reproduced the experimental results of Al-Faesly et al. [33] very well. Hence, the realizable k-ε turbulence model has been used as a closure model for RANS.

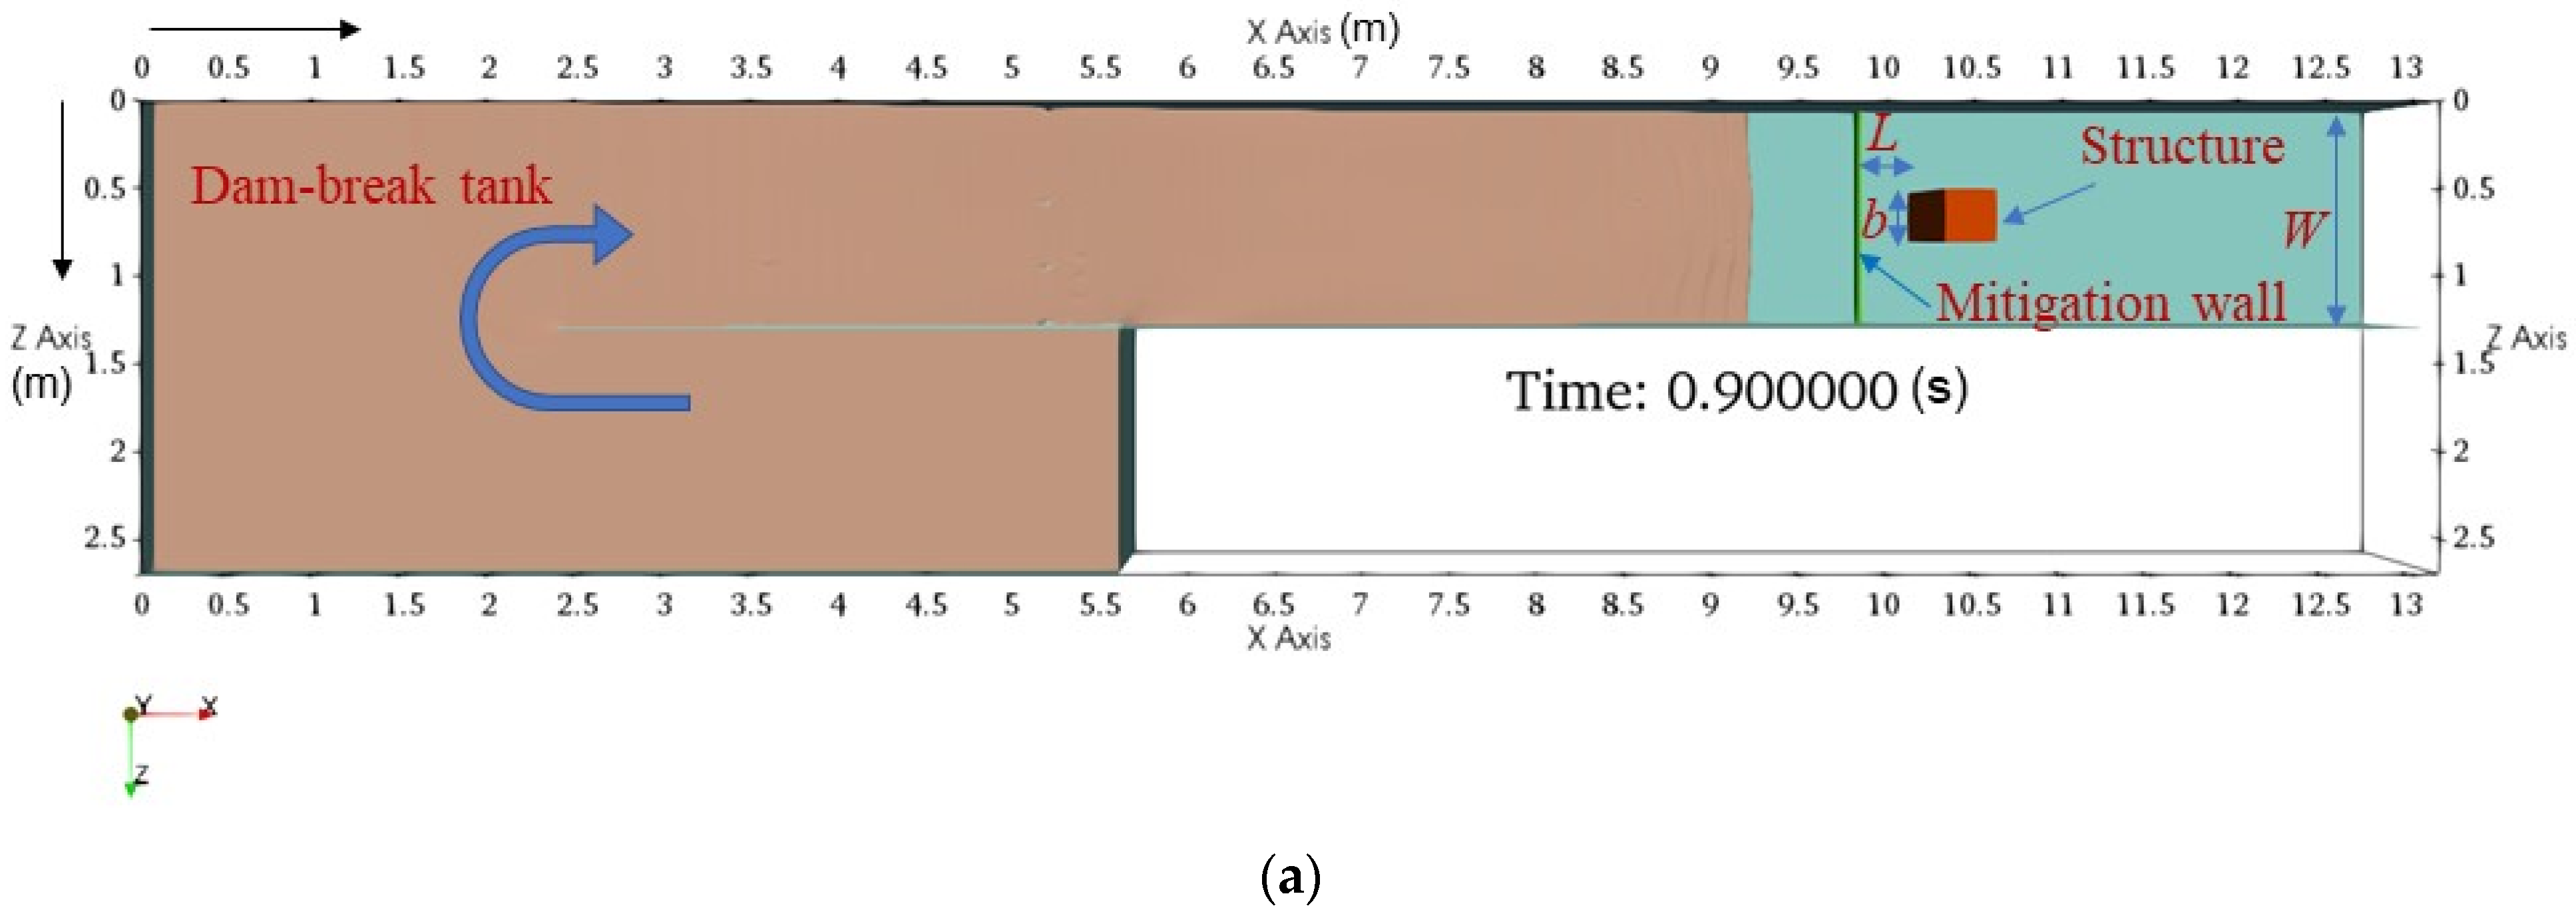
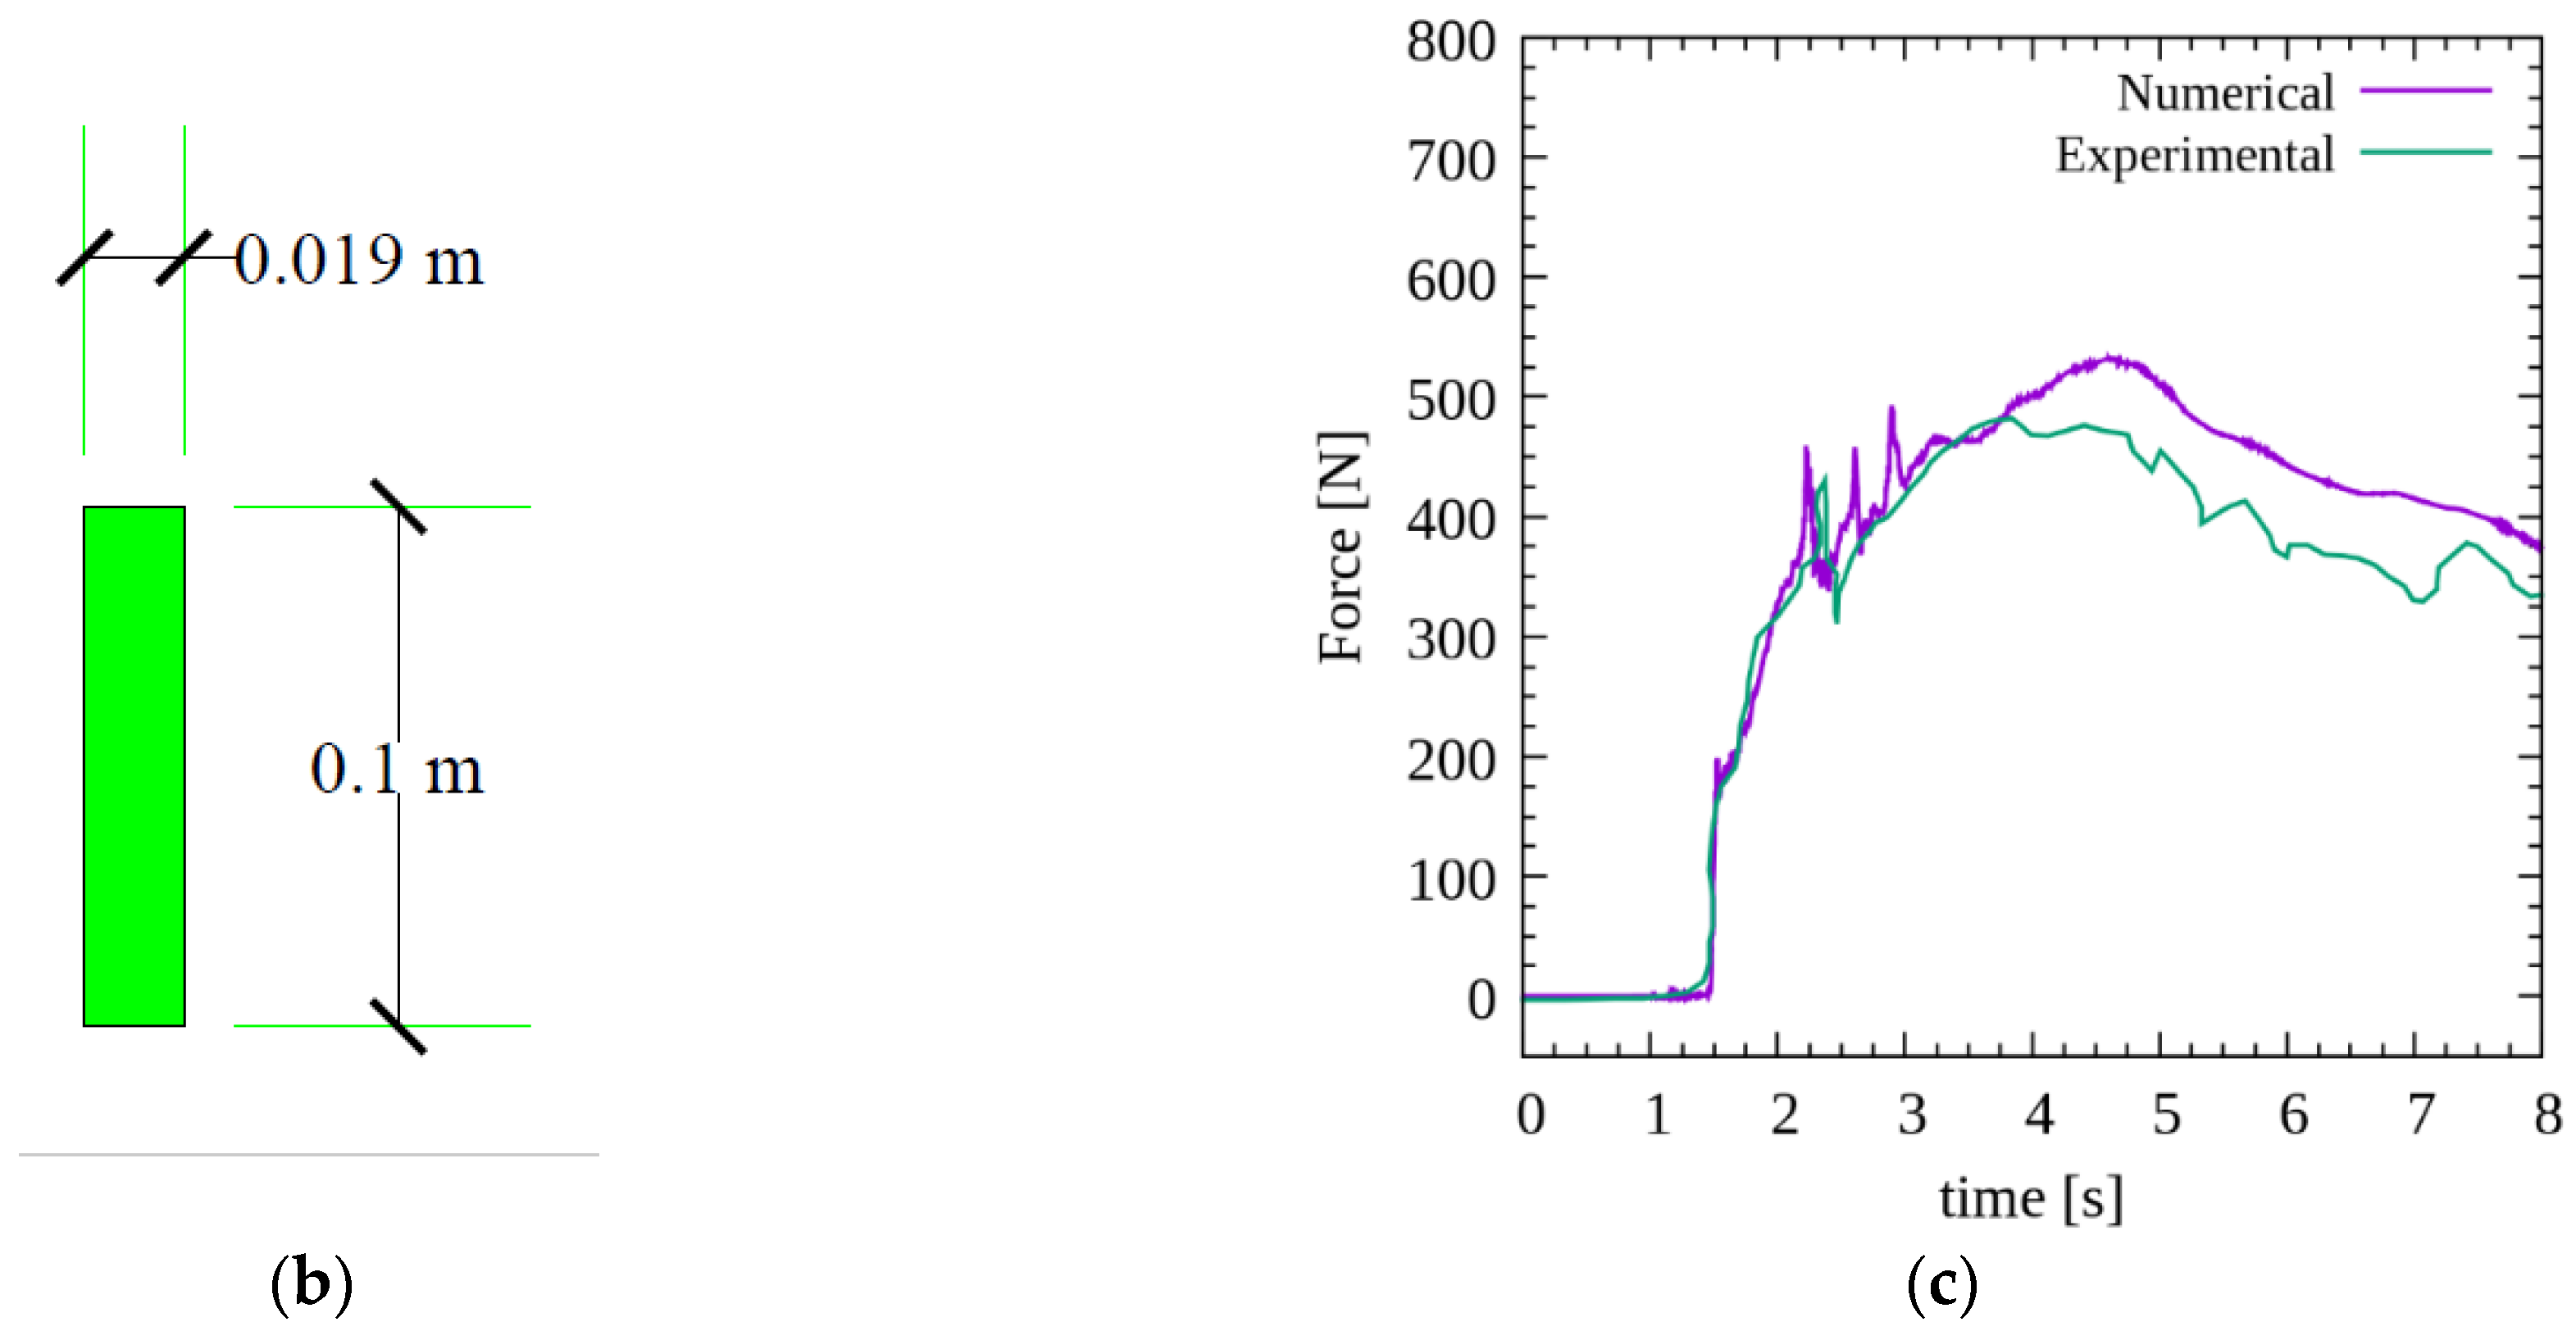
2.1. Validation Domain

For validating the numerical model, the experimental domain of Al-Faesly et al. [33] was used. Figure 1a shows the experimental domain of Al-Faesly et al. [33]. The mitigation wall was kept at L = 0.305 m from the structure. We hereafter refer to the “structure” for the inland structure, such as buildings and “mitigation wall” for the VW and the LRC. The water depth inside the dam break tank was 0.85 m. The structure was 0.305 m × 0.305 m in the cross-section. The height of the structure was kept at 0.9 m so that no overtopping occurred. The domain was discretized into hexahedron cells using blockMesh and snappyHexMesh utility in OpenFOAM. To reduce the computational cost, a high resolution was chosen near the column to capture the complexities of the hydrodynamic conditions during surge interaction and to ensure accurate results in these regions. Along the flume length (x-axis), the mesh size starts from 1 cm near the structure and changes to 4 cm toward the opening of the dam break tank. The cell length along the x-axis inside the dam break tank was maintained at 4 cm. The cell length along the x-axis in the structure location region was kept constant at 1 cm. From the structure backside, the cell length was once again increased from 1 cm to 4 cm towards the end of the numerical tank. The cell size in the z-direction was 1 cm at the flume center and gradually increased to 3 cm near the wall. The mesh size in the y (vertical; direction of gravity) direction was kept at 1.5 cm. A similar mesh setup was adopted by Asadollahi et al. [46]. Slip boundary conditions were provided for the rest of the surface since the grid was not refined to viscous sub-layers. Atmospheric boundary conditions were implemented on the flume topside and at the exit.
Figure 1c shows the force comparison between the experimental measurements and the numerical simulation. It can be observed that the numerical simulations are able to reproduce the experimental force. The time ‘t = 0 s’ indicates the starting time of the tank opening. The surge interaction with the structure at the impact phase, initial reflection phase and quasi-steady phase have been portrayed in Figure 2. The surge is highly turbulent at the initial reflection phase with a completely aerated flow (Figure 2b). Ravindar et al. [34] reported that the aeration makes the force capturing complicated both in experiments and numerical simulations. Even in the experimental results of Al-Feasly et al. [33], the force–time history had high-frequency oscillation during such process. Despite this, it is clear that both impact and quasi-steady phases are replicable in the numerical simulations, and hence with the same solver setting, numerical simulations were carried out.

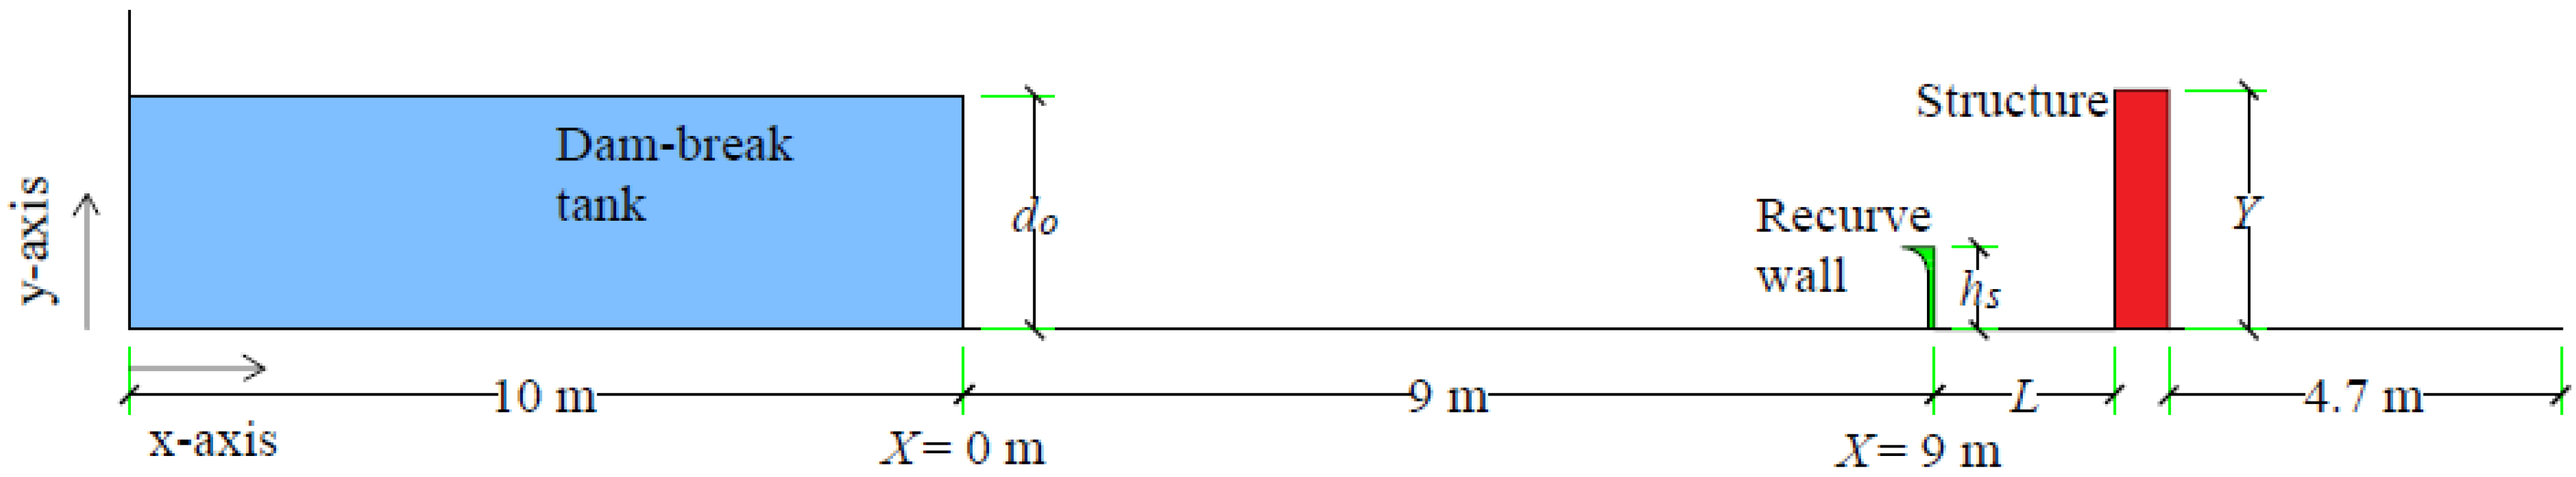
2.2. Computational Domain

The numerical simulation was carried out with the dimensions of the newly planned dam break set up at the Department of Ocean Engineering, IIT Madras (Figure 3). The boundary conditions remained the same, as explained in Section 2.1. The mesh parameters remained the same as adopted for the validation domain. In the x-direction, the mesh size starts from 1 cm near the structure and changes to 4 cm toward the opening of the dam break tank. The cell length along the x-axis inside the dam break tank was kept at 4 cm. The cell length along the x-axis in the structure location region was kept constant at 1 cm to resolve the flow features accurately. From the structure backside, the cell length was once again increased from 1 cm to 4 cm towards the end of the numerical tank (4.7 m from the structure’s backside). Mesh cell size in the z-direction was 1 cm at the flume center and gradually increased toward the walls, reaching a maximum of 3 cm near the wall. The mesh size in the y (vertical) direction was kept constant at 1.5 cm. Near the LRC or the VW, each cell was further refined to eight subcells to precisely capture the surge interaction process. A mesh sensitivity analysis has been carried out and is reported in Appendix A. All simulations were carried out in the computational cluster available at the RWTH Aachen University. Simulations were carried out with 48 cores in parallel, with each simulation requiring computational time on an average of 100 h per simulation with the vertical wall or the recurve wall.

2.3. Parametric Study
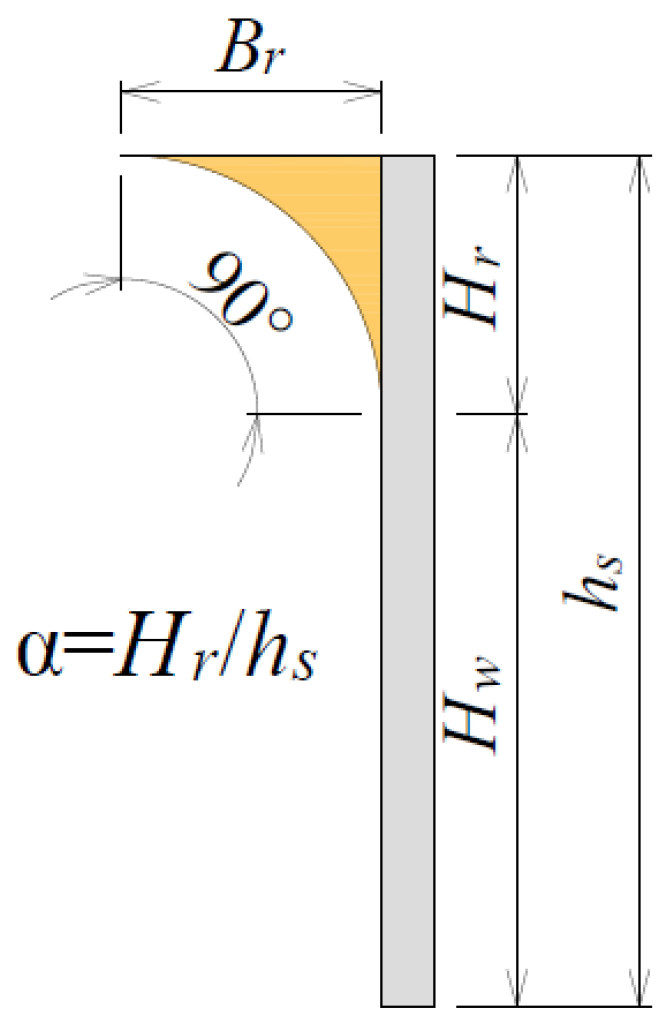
The width of the tank (W) was kept as 1 m. The length of the dam break tank was kept at 10 m. The schematics of the numerical tank are shown in Figure 3. The simulations were carried out with two impoundment depths (do = 0.6 m and 0.9 m). The present study focused mainly on understanding the effect of the recurve on the forces acting on the structure. Hence, the numerical simulations were carried out with seven different heights for the LRC and the VW, which are more common along different coasts worldwide. We also varied the distance (L) between the structure and the mitigation wall to understand the effect of L since earlier literature reported that L also influences the forces on the inland structure [31,33,37,43]. The overall height of the VW and the LRC was kept the same to understand the potential influence of the recurve. The simulations were carried out on the 1:15 model scale. The structure had a square cross section of 0.3 m × 0.3 m, representing a b/W = 0.3, where b is the frontal width, and W is the flow channel width. The height of the inland structure was kept in such a way that no overtopping occurred. Table 1 summarizes the numerical simulation carried out in this study, where hm denotes the maximum bore depth measured in the absence of the mitigation wall at that location, and hf,wall represents the maximum bore depth in front of the VW under non-overtopping conditions. Both hm and hf,wall are described separately in Section 3.1 and Section 3.4.2, respectively.

Recurve Wall

An LRC consists of a vertical wall with a recurve at the top. Figure 4 shows the typical recurve wall tested in this study. A recurve of height Hr contributes to a specific portion of LRC depth, which can be defined as αhs. In this specific study, we chose α = 0.305, following the recent large-scale experiments on recurve walls by Stagnos et al. [14] and the small-scale experiments of Ravindar and Sriram [13]. In an LRC, Hr is equivalent to Br due to the 90° recurve. The effect of the recurve size on the forces on the inland structure is discussed separately in Appendix B, wherein no significant influence of recurve size (α) on the transition and quasi-steady phase was observed.

3. Results and Discussions

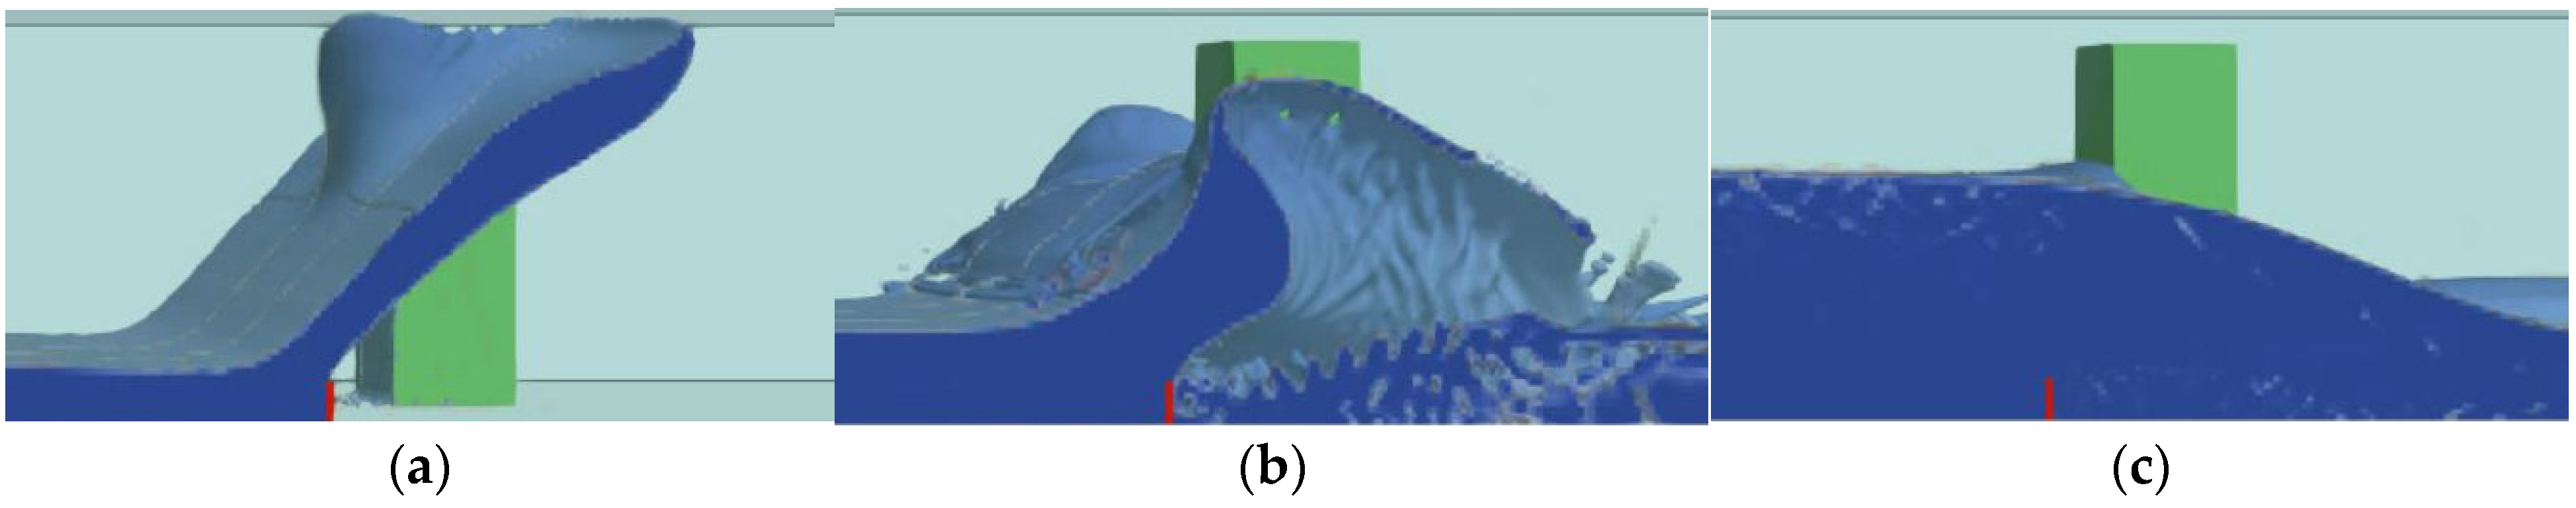
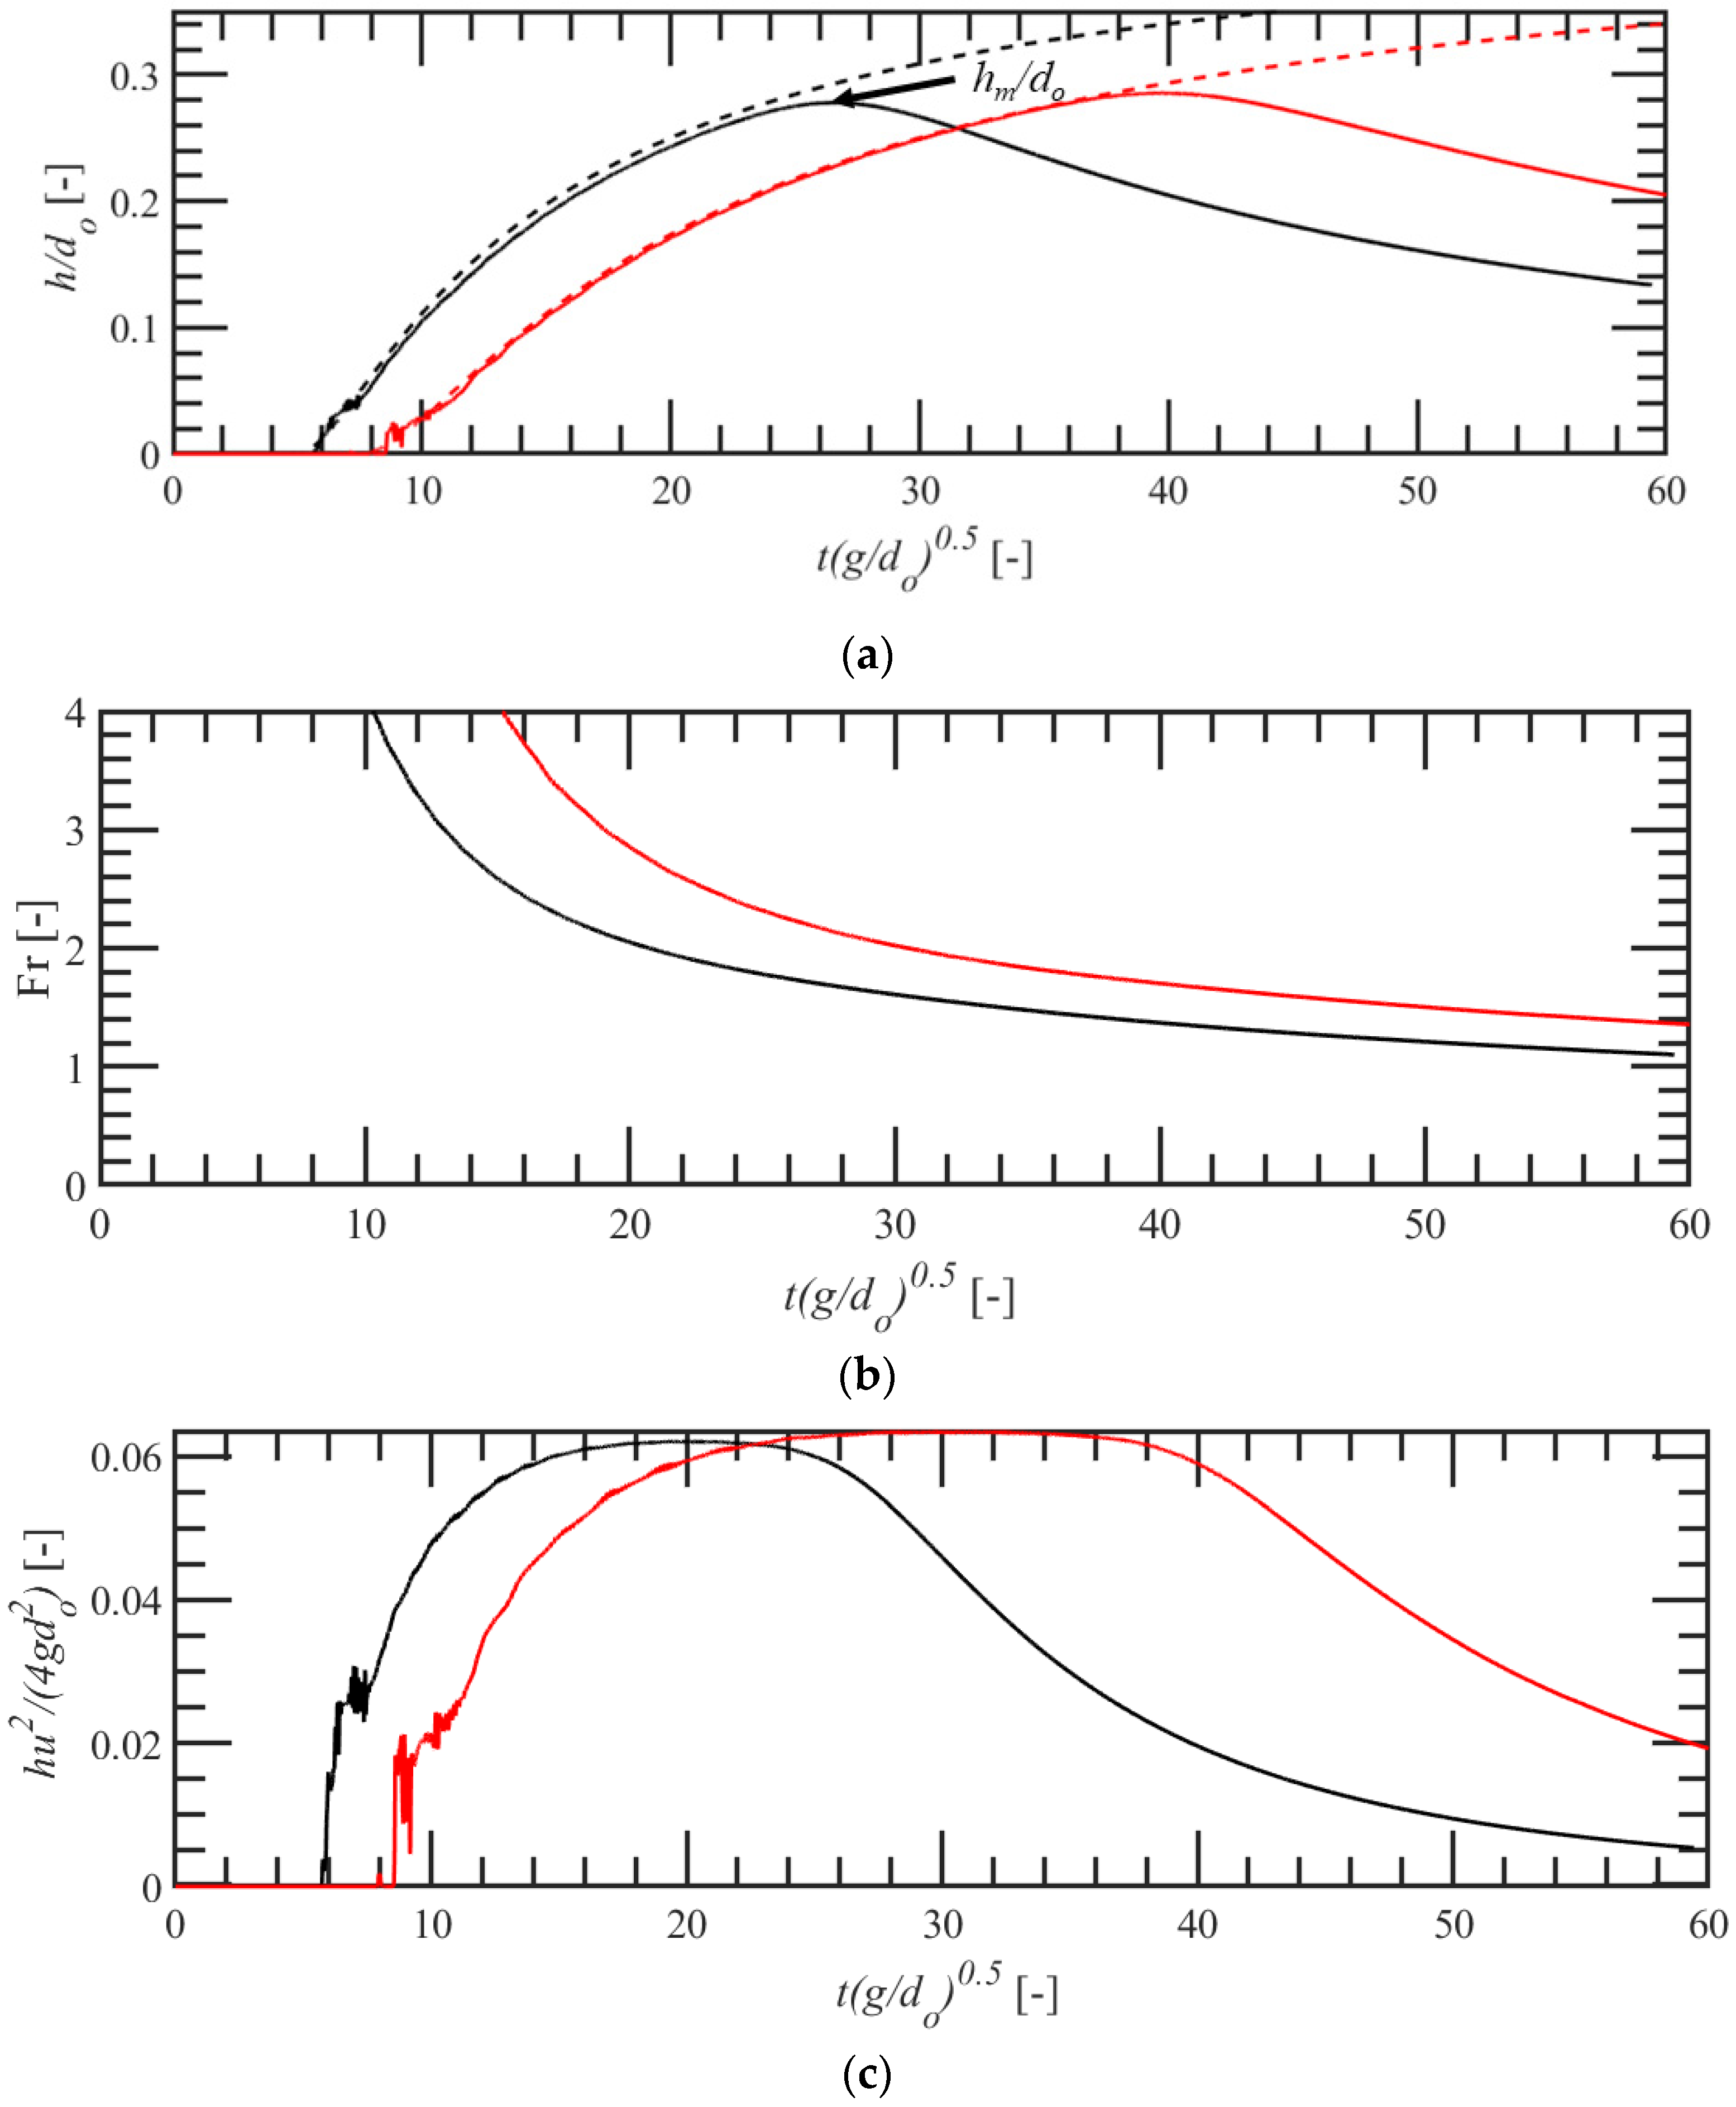
3.1. Free Flow Hydrodynamics

For simulating the tsunami interaction with the structure, the surge generated from the dam break was used. Figure 5a shows the non-dimensionalized surge front elevation at the seawall location. The simulated results are compared against the theoretical surge front profile for an infinite length reservoir [62]. The theoretical solution from Ritter [62] is given as
X t g d o = 2 3 h d o   for 1 X t g d o + 2
Here, X represents the local axis with origin at the starting of the tank; h is the surge depth at any instant of time at X; t = 0 s represents the starting time of simulation; g is the acceleration due to gravity. Despite a slight discrepancy at the surge tip, the simulated surge front profile matched well with the theoretical solution. The maximum non-dimensionalized surge depth (hm/do) registered at the mitigation wall location for both impoundment depths was approximately 0.28. Figure 5b presents the Fr variation over time. The Froude number is estimated as u/(gh)0.5, where u is the depth-averaged velocity. Fr exponentially decreases from high supercritical to near supercritical flow over time. The simulated Fr are in the range of previously observed tsunamis [63,64,65,66,67], and hence this study finds direct application to the field. At the time of hm, Fr for the two impoundment depths was approximately 1.7 for both cases. Figure 5c presents the non-dimensionalized momentum flux with 4gdo2 plotted against non-dimensional time. Since the chosen tank length is sufficiently long, the non-dimensionalized momentum flux remained roughly constant over a specific time region. Interestingly, the non-dimensionalized maximum momentum flux remained approximately the same for both impoundment depths, although the non-dimensionalized time of maximum momentum flux was different. In addition, the time of maximum momentum flux occurred prior to the time of maximum surge depth, agreeing with ASCE-07 [68] and Wüthrich et al. [69]. Finally, it should be noted that the free flow hydrodynamics discussed herein corresponds to the seawall location, not the inland structure location.

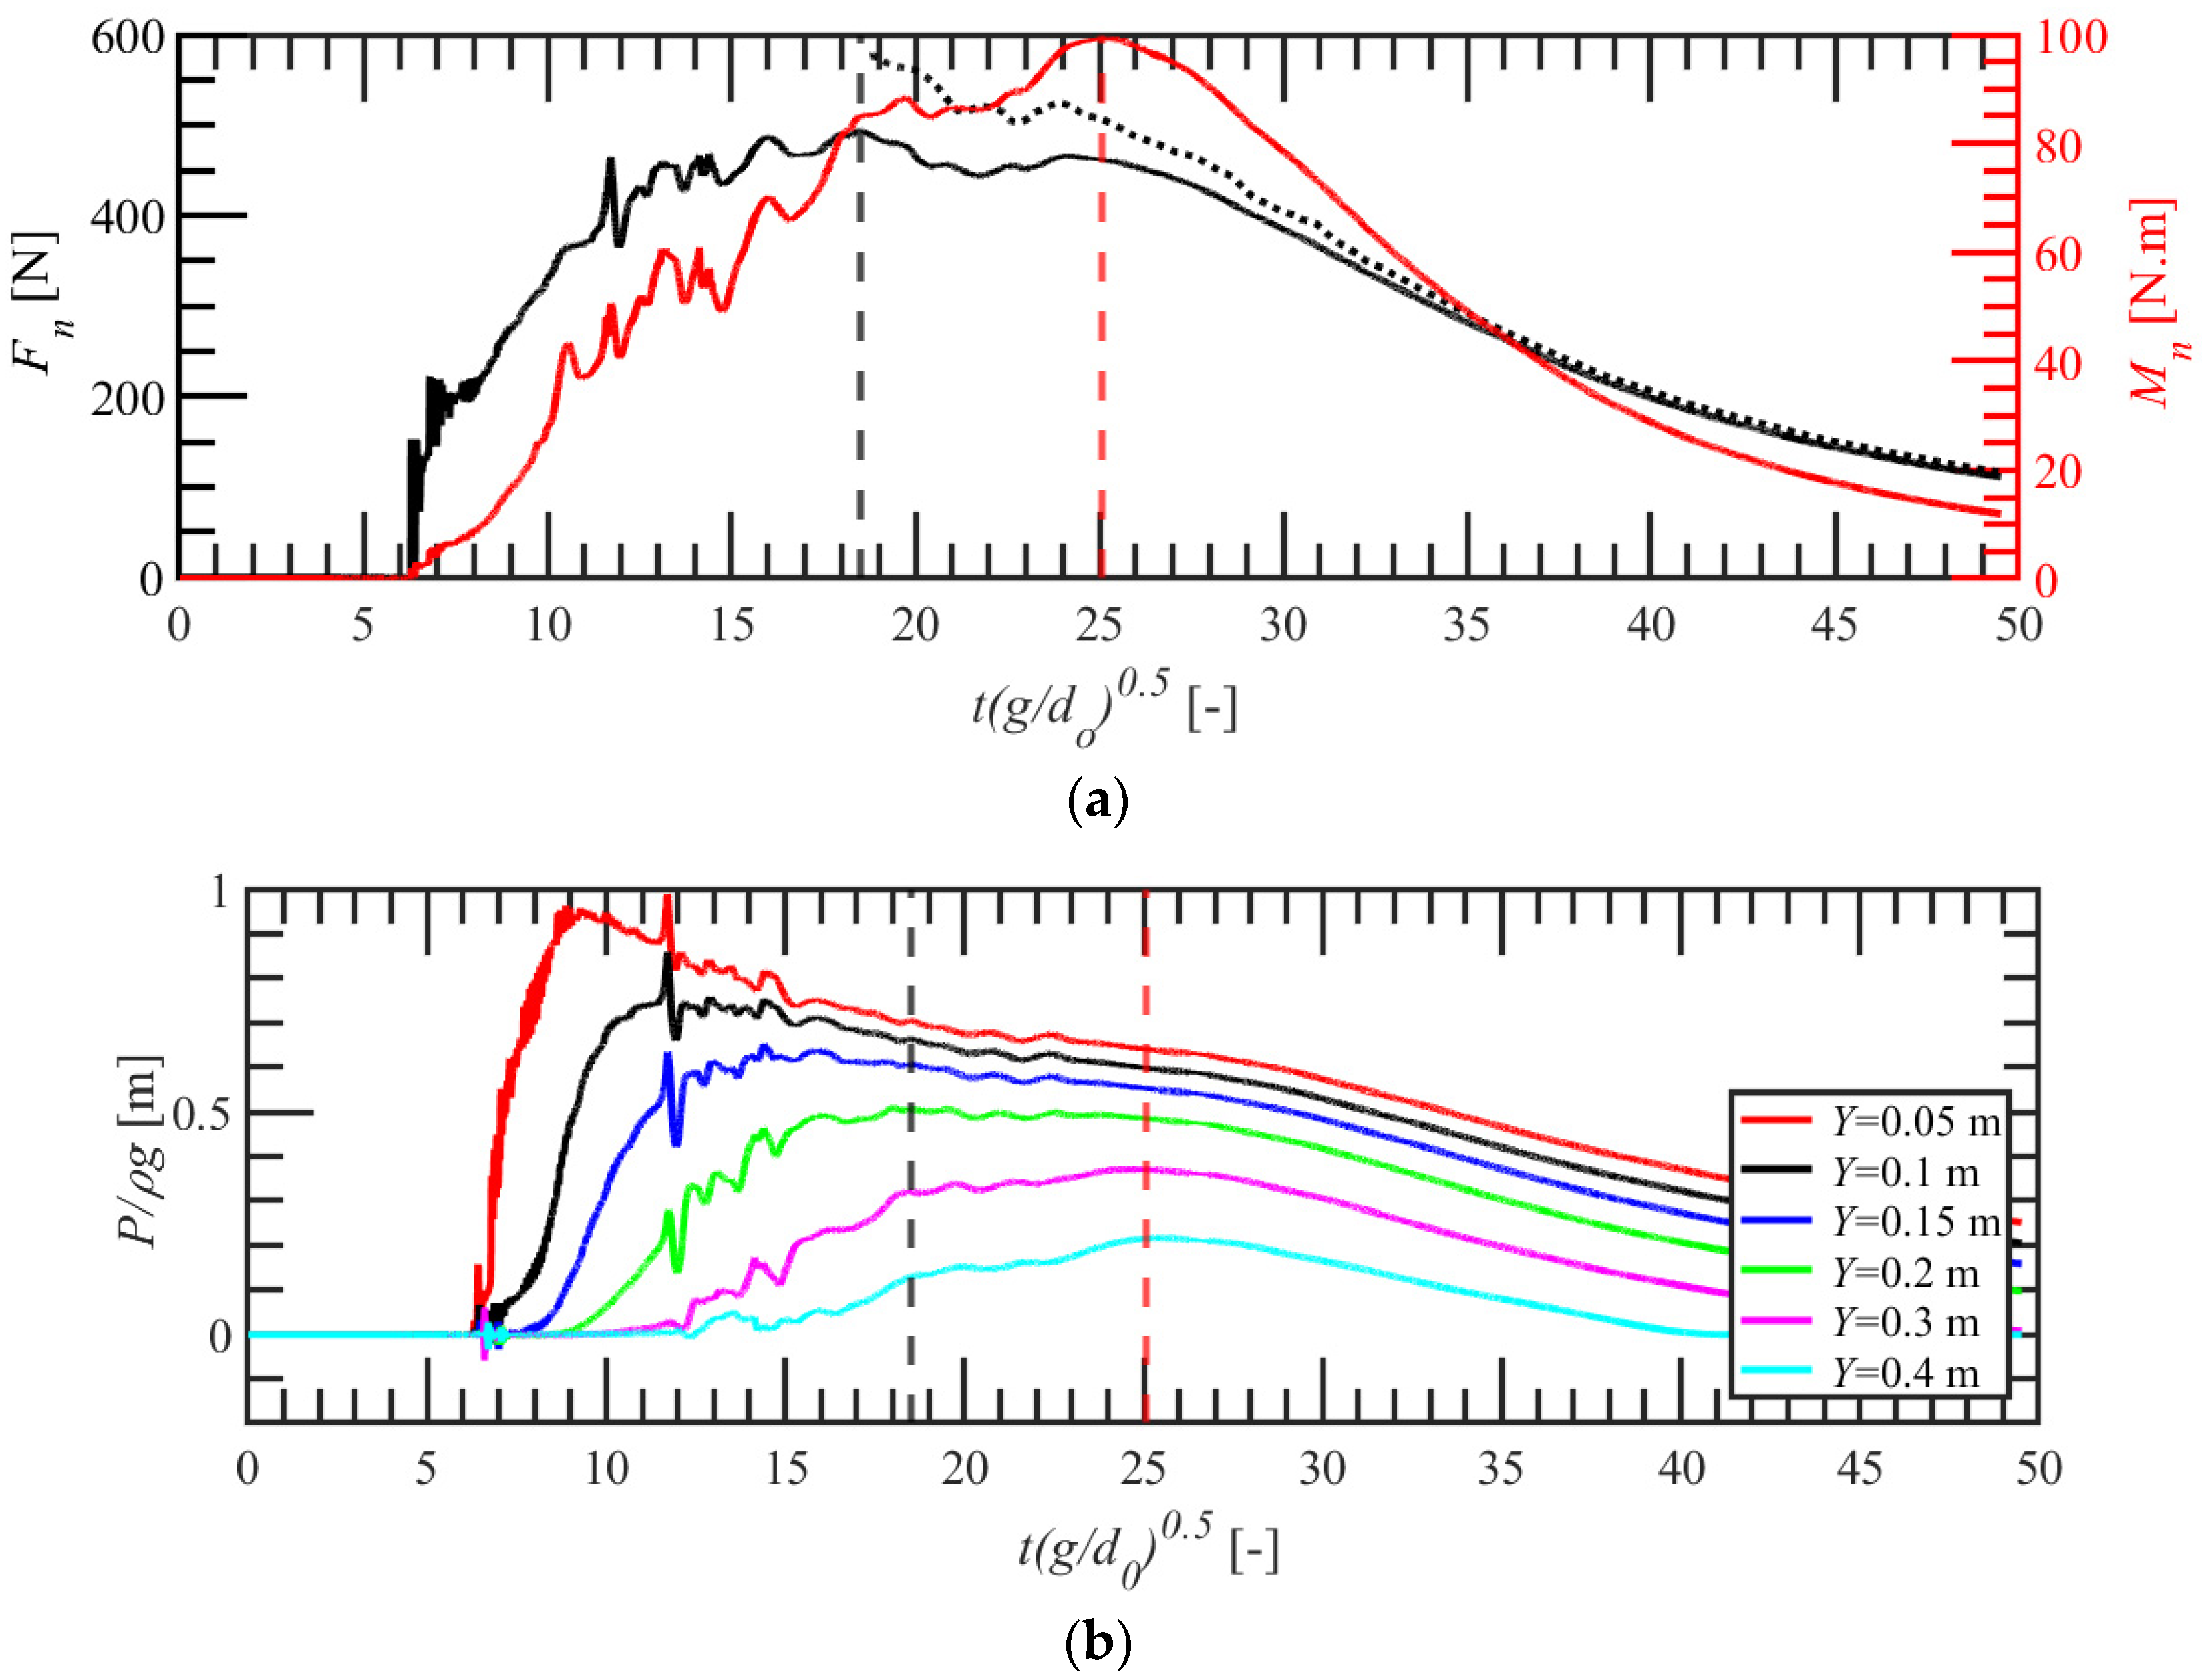
3.2. Without Mitigation Wall (hs = 0 m)

The force exerted on the structure in the absence of the mitigation wall is discussed. There have been many studies that investigated the surge interaction with the structure [33,58,69,70,71,72,73,74,75]. The surge interaction with the structure had resulted in an initial impact (during splash-up), a surge runup or transition phase, and a quasi-steady flow phase [74,76]. Figure 6a provides the force–time history of the surge interacting with the structure for do = 0.9 m and L = 1 m. In addition, the overturning moment–time history is also plotted. The corresponding pressure time history at the structure front is provided in Figure 6b. The pressure distribution over the depth at different time steps is provided in Figure 6c. Depending on the impoundment depth and the structure location, the surge tip reaches the structure at a different non-dimensional time. Figure 7 provides the typical surge interaction process.
When an incoming surge is obstructed by the presence of a macro roughness element (e.g., a building; here referred to as a structure), the flow is deflected vertically by the element (Figure 7a), which is described as the splash-up phase [75]. The initial impact pressure distribution took a parabolic form, similar to the observations from earlier studies [70,74,77]. The initial impact force is not so appreciable since the surge tip has a negligible front slope, as the impact force depends on the surge front slope [70,74,77,78,79] (Figure 6a). Once the splashed-up bore starts feeling the effect of gravity, the splashed-up surge falls back on the incoming flow (Figure 7b). This phase is referred to as the initial reflection phase in the literature [73,74], which occurs during the beginning of the run-down phase. After this phase, the reflected water conglomerates with the incoming surge in front of the structure in the so-called transition phase (Figure 7c,d). During this stage, the pressure distribution transforms from the parabolic form to the near hydrostatic state (Figure 6c). During the quasi-steady flow phase, the pressure distribution tends to be linear, with the maximum non-dimensionalized pressure (P/ρghf) at the structure bottom being approximately equal to unity [74,80,81]. In Figure 6a, the hydrostatic force (black dotted line) is computed as 0.5 ρ g b h f 2 h r 2 . Herein, hf and hr refer to the bore depth at the front and backside of the structure. The measurements of hf and hr are obtained at a 4 cm distance from the structure front and back face in the tank center. During this stage, the computed hydrostatic force matches the numerically simulated force–time history in accordance with Ikeya et al. [82] and Harish et al. [81]. The length of the tank is sufficient enough to reach this stage. For this specific case, the maximum force (Fn,max) was observed during the transition phase (t(g/do)0.5 = 18.5). However, it depends on the characteristics of the incoming surge and the three dimensionalities of the structure. For example, Robertson et al. [73] and Xu et al. [44] observed maximum force during the initial reflection stage for vertical walls. A gradually increasing water depth over a more extended period might shift the location of maximum force to the quasi-steady flow phase. Overall, the above-described process coincides with most existing literature investigating tsunami surge or bore interaction with rectangular structures. However, a clear distinction between the different phases is not yet available [58,69,72].
Interestingly, the time of maximum moment (t(g/do)0.5 = 25.08) is different from the time of maximum force. The maximum moment (Mn,max) was observed toward the near-hydrostatic regime (Figure 7d). Wüthrich et al. [69] and Istrati et al. [83] also observed minor deviations in the maximum moment and force occurrence time. Figure 8 presents the time lag between the occurrence of the maximum moment and the maximum force. It is observed that for do = 0.6 m, the time lag is negligible despite some scattering. However, for do = 0.9 m, the maximum force occurred prior to the maximum moment. Since roughly a constant momentum flux exists over a certain time range (Figure 5c and Figure 6a), the force variation is insignificant for the increase of the overturning moment. The variation in the time can be related to the change in the centroid location of the force from the bottom (Lever arm, Ln,A; the subscript n denotes “no-mitigation wall condition”, and the same has been followed throughout the paper), which arose from the change in the pressure profile (Figure 6c). This needs further studies in the future.
Fujima et al. [84] observed that the force is also dependent on the distance of the structure location from the seashore, and hence, we simulated interaction studies at all three locations without a mitigation wall for do = 0.6 m and 0.9 m, as listed in Table 1. Figure 9 provides the force–time history for do = 0.9 m at three locations (X = 10 m, 11 m and 12 m). It can be observed that the variation of maximum force with respect to the location is not so significant for the range of distance investigated in the present test conditions. Depending on the distance of the location, tn,im varies. Herein, tn,im refers to the time instant when the surge front reached the structure location in the absence of mitigation wall. We observed insignificant variation in the force and the overturning moment for the distances investigated in the tests without the mitigation wall.

Fn,max and Mn,max Theoretical Estimation

For theoretical estimation of Fn,max and Mn,max, earlier literature proposed and investigated different design equations using free flow hydrodynamics (h and u) at the location of the structure. Hydrodynamic drag force equations are widely suggested (Equation (2)) [33,69,72,85,86,87].
F n , m a x = 1 2 C d ρ b h u 2 m a x
where Cd is the drag coefficient, and h and u are the free flow surge depth and velocity at the structure location. Cd is still the research topic for unsteady surge interactions since it depends on b/W (structure width/flow channel width) and Fr [82,85,88,89,90]. Cd = 2 is commonly adopted in many design guidelines [68,91]. The numerical simulations showed Fn,max occurred approximately at the same time as the maximum momentum flux ((hu2)max) with minor discrepancies, agreeing with Wüthrich et al. [69]. Thus, Cd is obtained by dividing Fn,max with (hu2)max. The values are summarized in Table 2. The Froude number obtained at the structure location at the time of Fn,max is also provided in Table 3 for comparison. Cd is merely unaffected for the range of L tested, although a moderate increase in Fr was observed with the increase in L. However, Cd for do = 0.6 m is slightly higher than that for do = 0.9 m, as Fr was less, agreeing with Xie and Chu [85] and Arnason et al. [72]. Asadollahi et al. [46] also observed the influence of Cd on the impoundment depth in the tank with the dam break surge. Hence, Cd also varies with impoundment depth (do).
The maximum overturning moment (Mn,max) can be determined using the Fn,max by multiplying with the lever arm (Ln,A) [69]. The numerical simulation has shown a minor discrepancy for the time of occurrence of Fn,max and Mn,max (Figure 8). Observing Figure 6a and Figure 9, one can notice a minimal force variation for the period of constant momentum flux. Since design engineers need a concise equation for Mn,max, the following equation is suggested in the literature [69,86].
M n , m a x = F n , m a x L n , A
The simulated Ln,A ranged from 0.8 to 0.95 times of hm1 at the structure location, as shown in Table 4, where hm1 represents the maximum surge depth measured at the structure location. The values are less than the recommendations from Wüthrich et al. [69], who suggested Ln,A/hm1 = 1.15. However, one should also recognize that the lever arm also depends on the Fr of the incoming flow. A high Fr surge results in higher water depth at the structure front than a low Fr surge of the same inundation depth [81,82,92]. This process might change the lever arm distance, and hence careful identification of the Cd and lever arm are essential for accurate Mn,max. Thus, in this paper, Fn,max and Mn,max obtained at different locations from numerical simulations are further used for non-dimensionalizing the force acting on the structure at different L in the presence of the mitigation wall, as the focus of this paper is primarily on understanding the force and moment reduction and the corresponding physics.

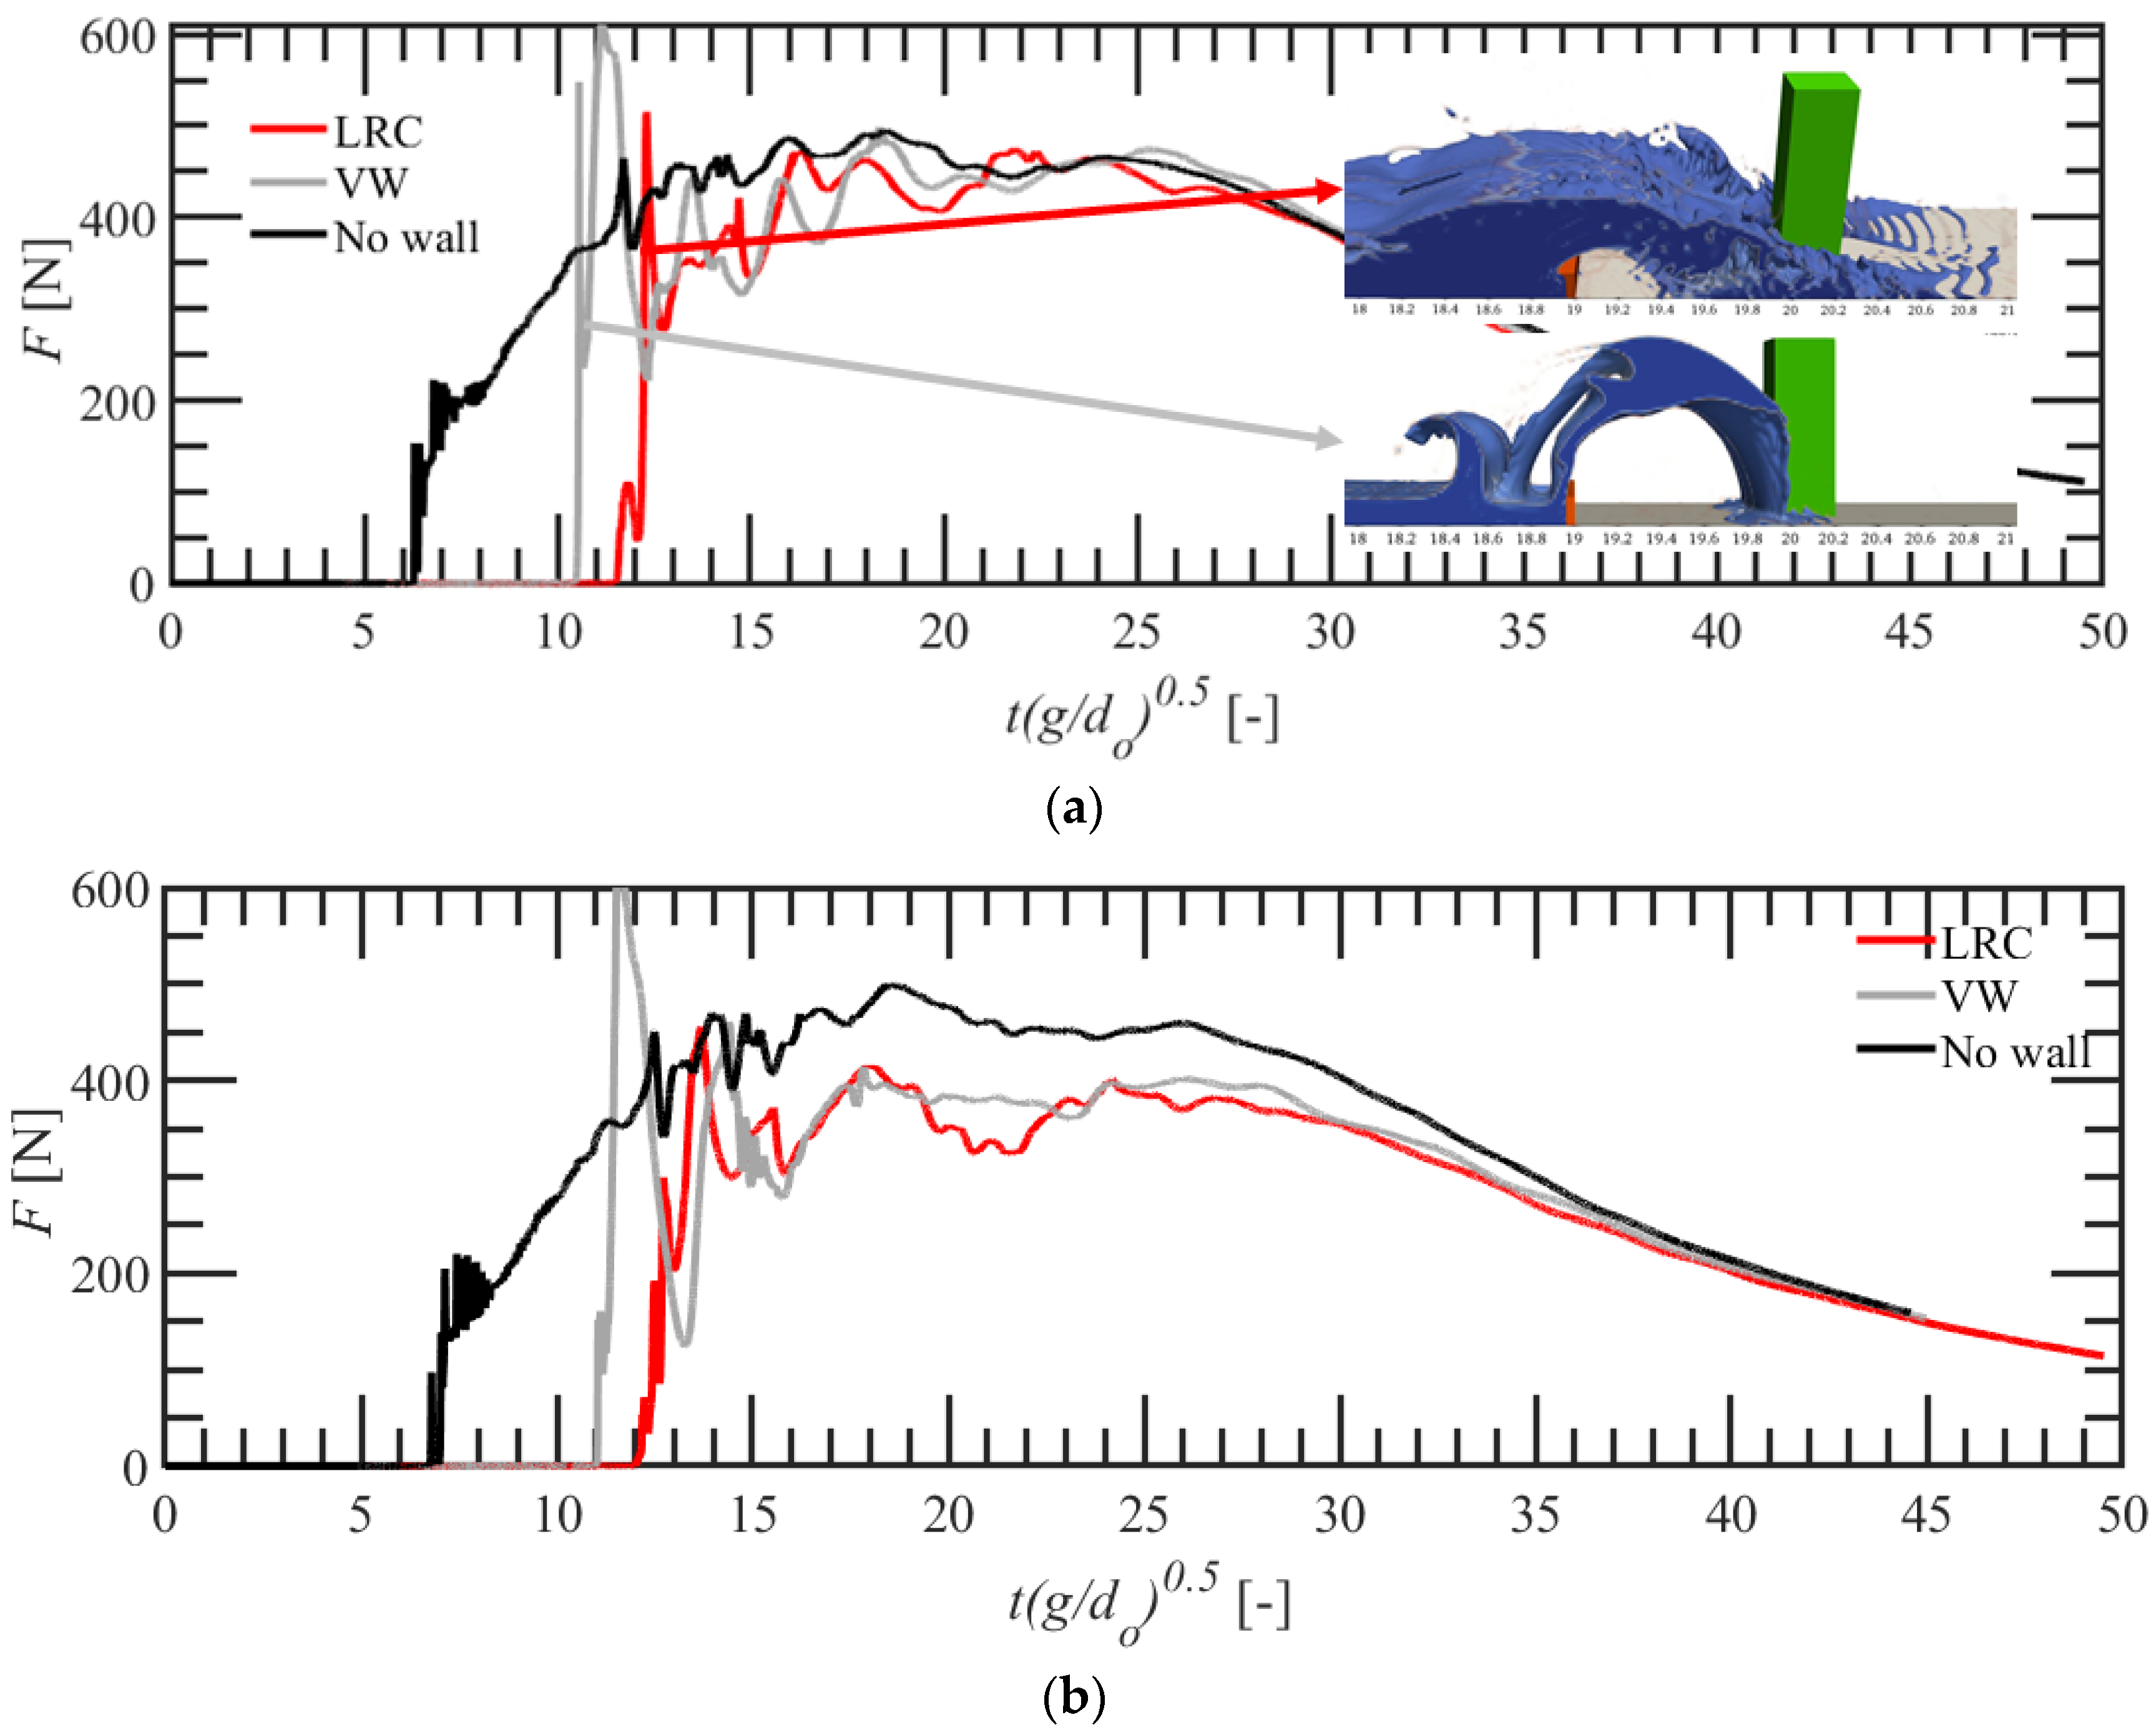
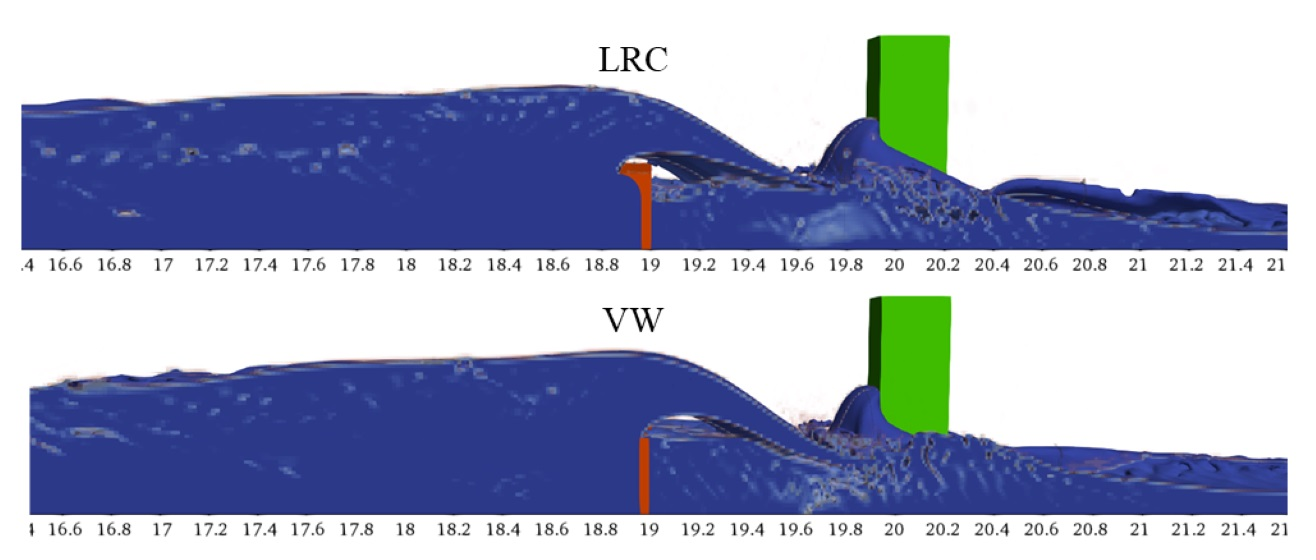
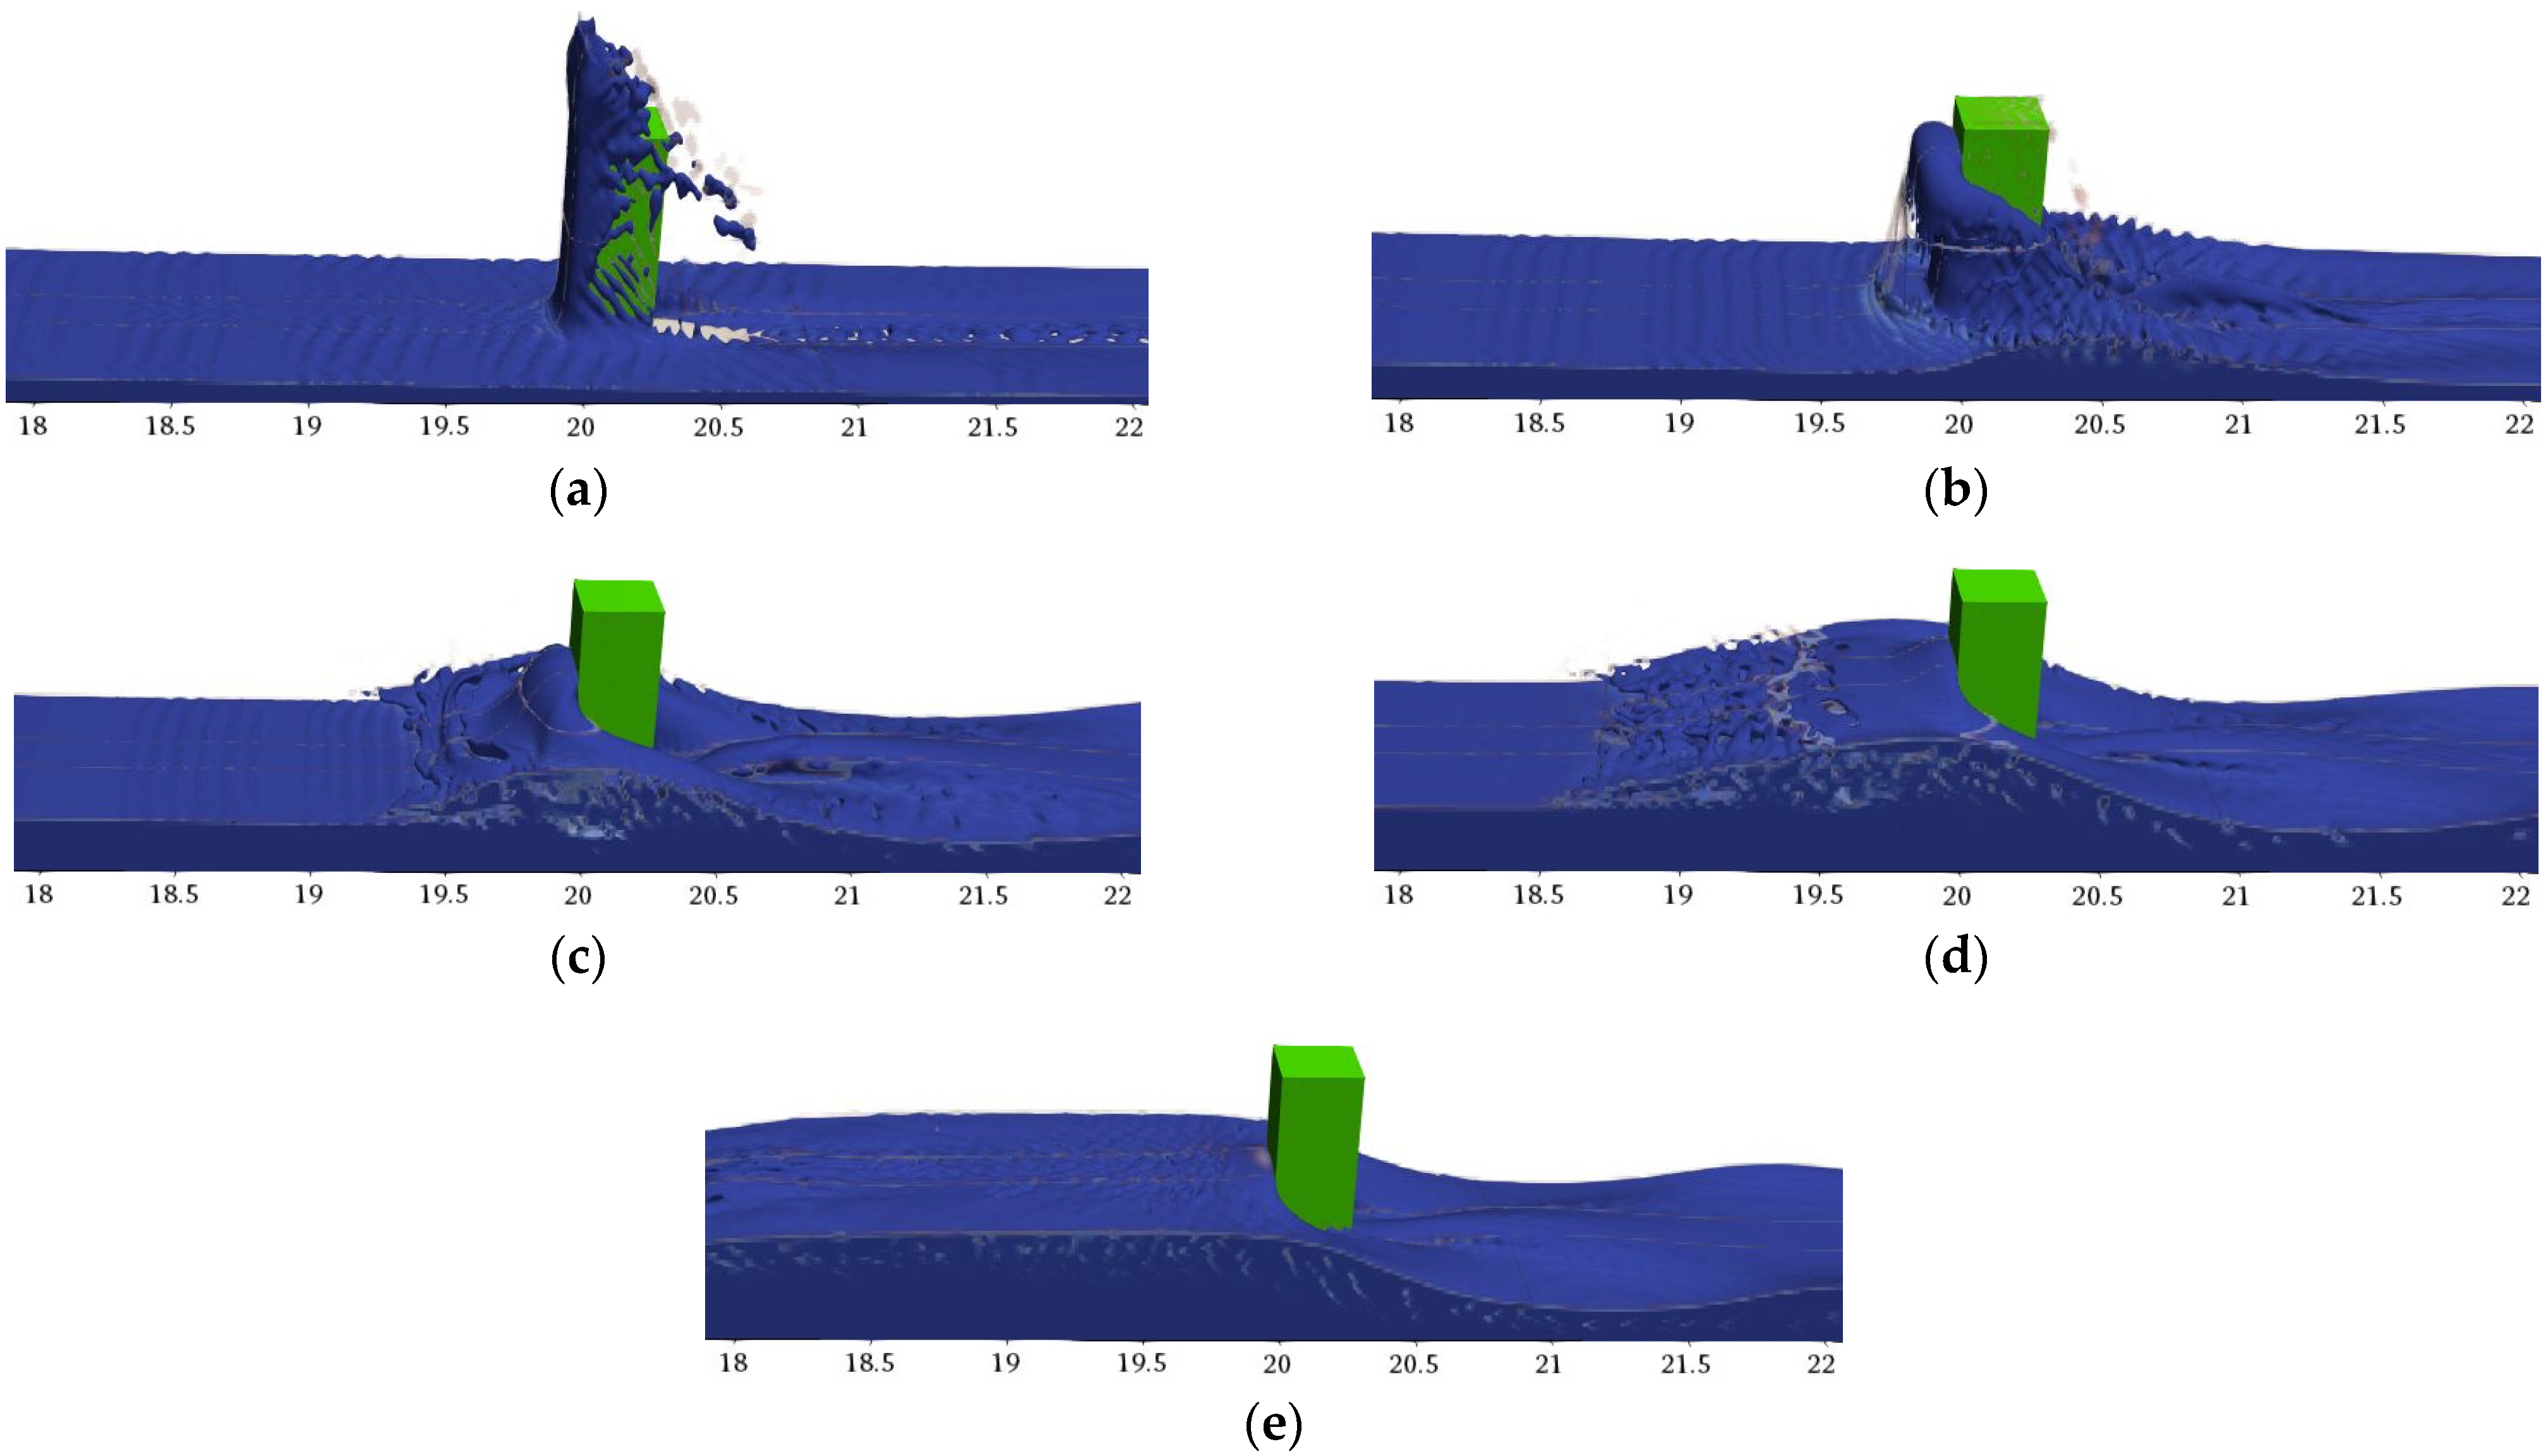
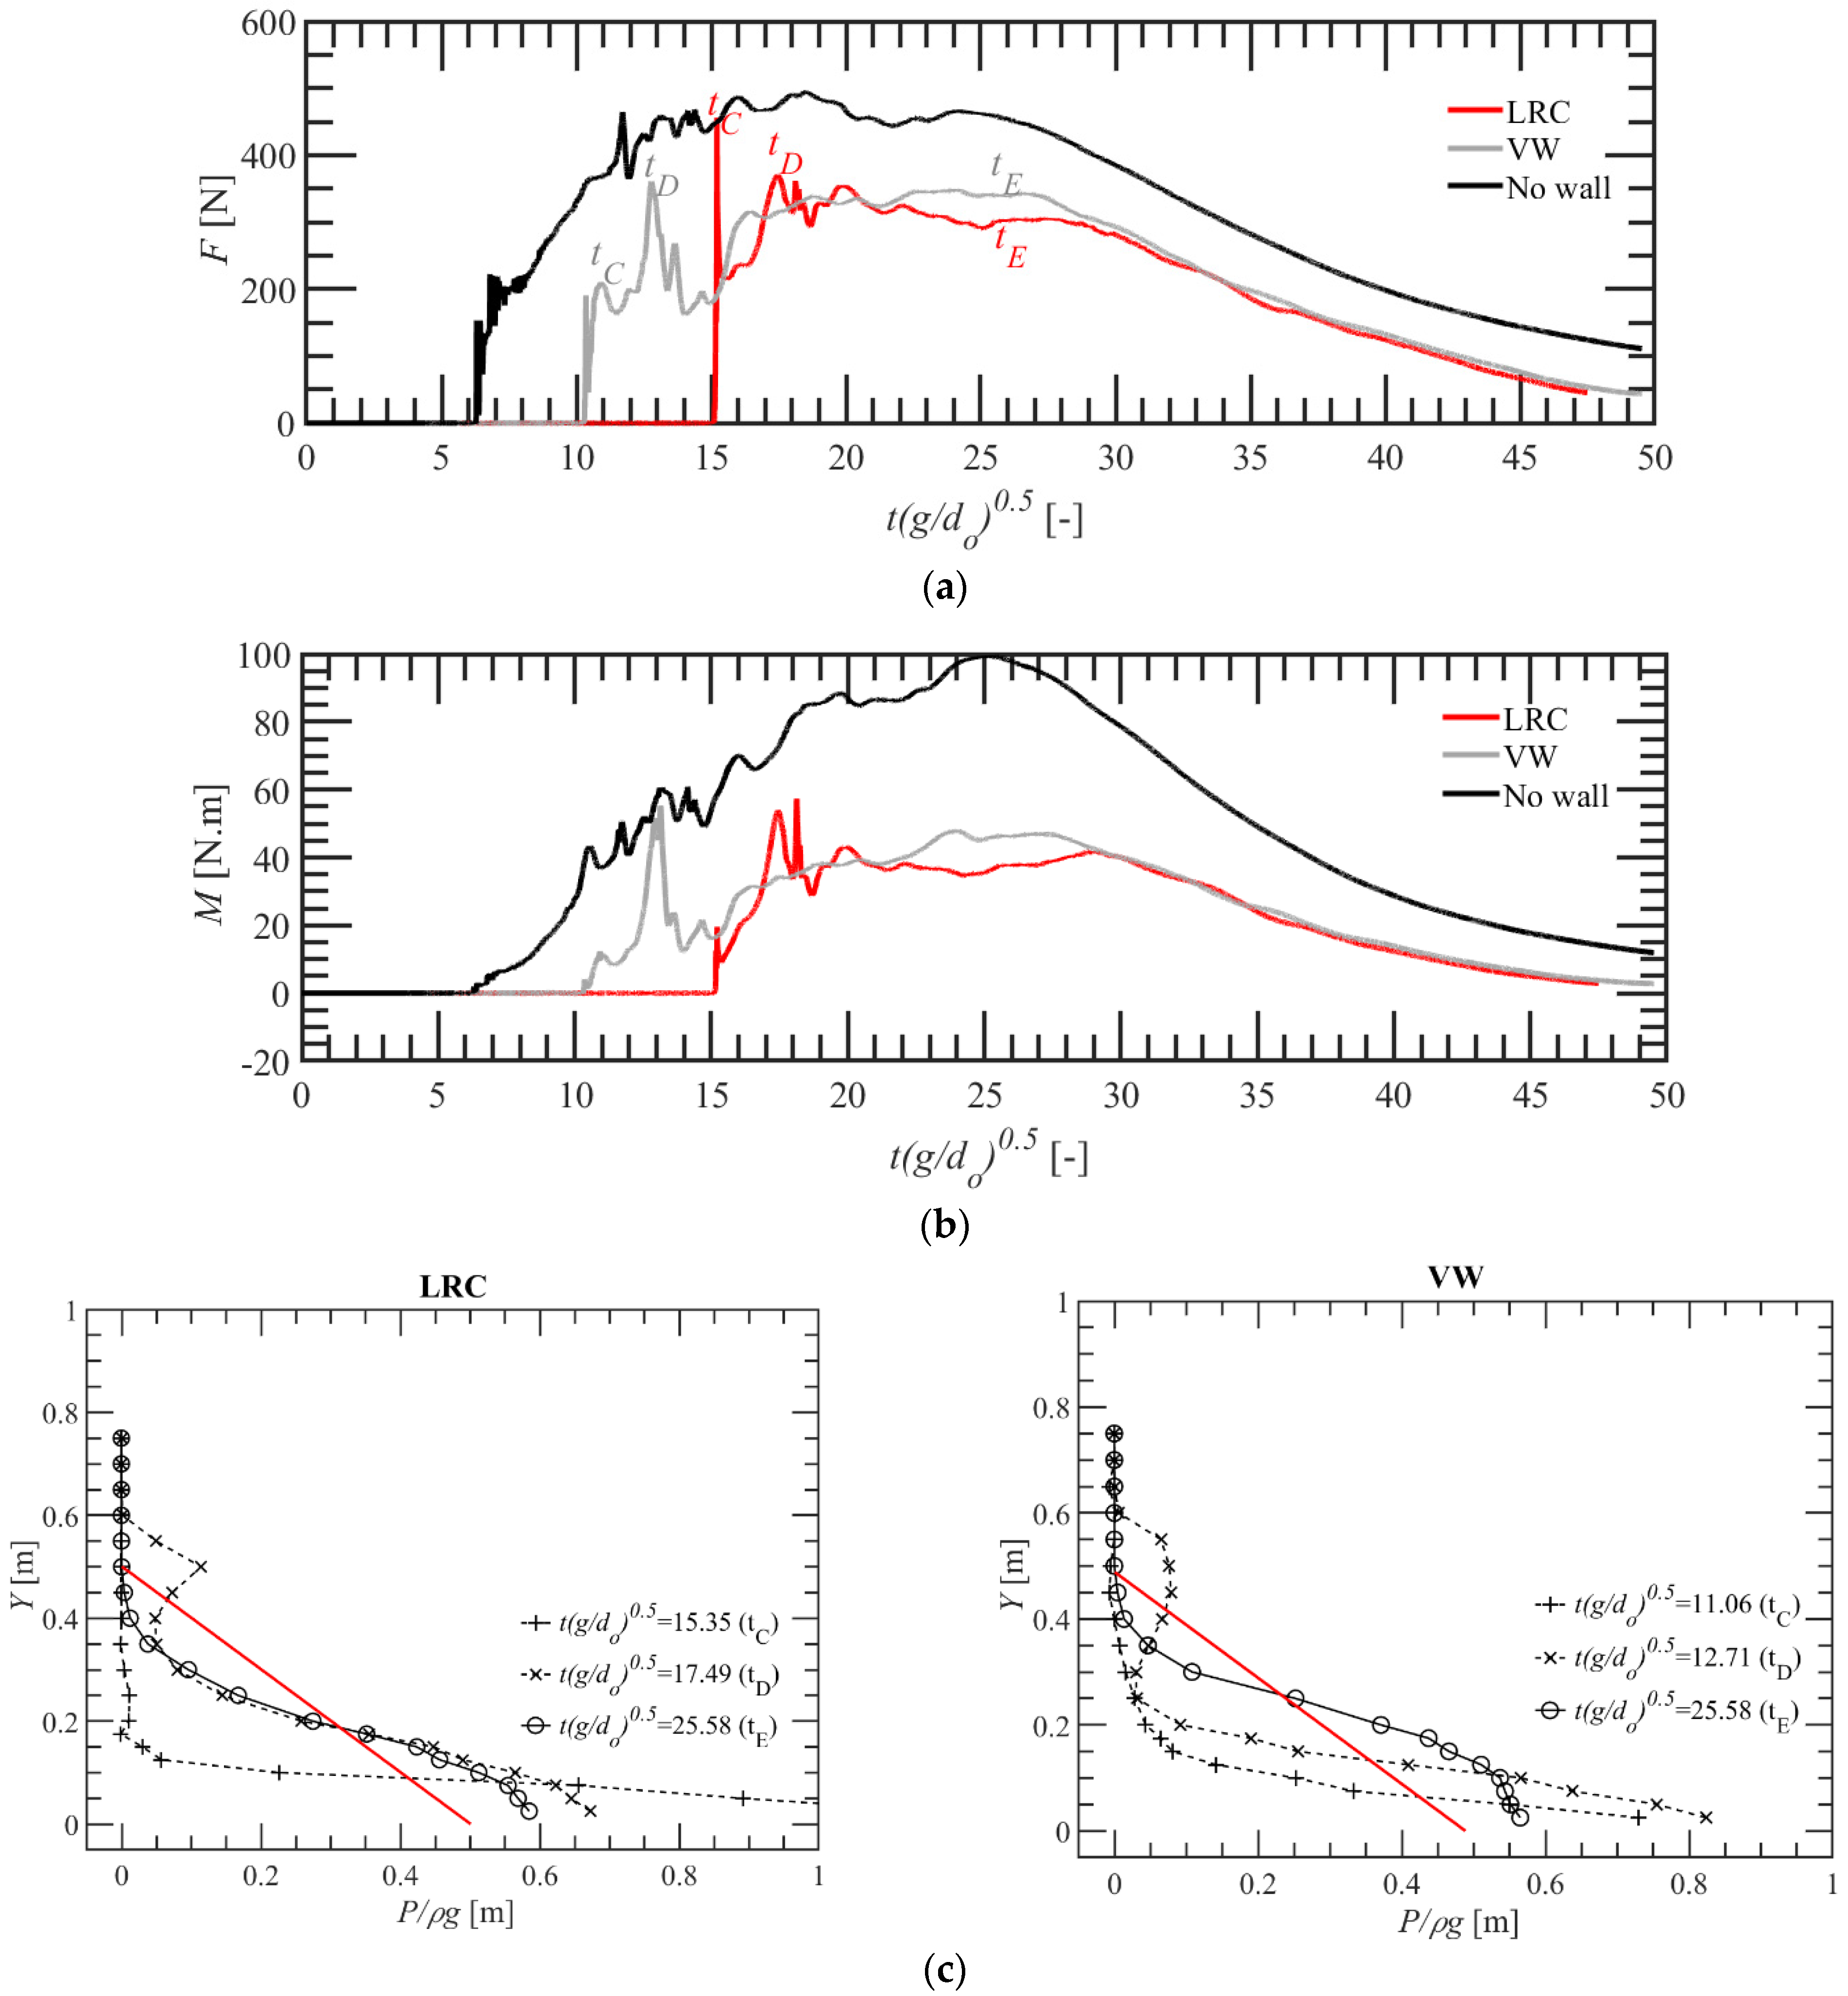
3.3. Flow Overtopping and Force Characteristics

During the wave or surge interaction with the mitigation wall, the overtopping flow behavior depends on the frontal shape of the wall [13,14,39]. Understanding the flow overtopping characteristics is necessary to understand the forces on the inland structure. Figure 10 and Figure 11 show the flow interaction and overtopping process at different instants of time with the LRC and the VW for Wall 4 and do = 0.9 m (Table 1). The water splashes up during surge tip interaction with the LRC (or VW). The presence of the recurve in the LRC redirects the splashed-up surge to the incoming surge. As observed in Ravindar and Sriram [13], the exit angle of the reflected surge is approximately 90°. The exit angle depends on the type of recurve used. In the presence of the LRC, the redirected surge interacts with the incoming surge, thereby largely disturbing the incoming flow field (Figure 10a). Flow circulation happens at the upstream side of the LRC. Despite significant flow disturbance, due to the continuous incoming flow of high strength, a part of the incoming surge overtopped the LRC (Figure 10b). As seen in Figure 10b, a large volume of water accumulated at the LRC upstream due to the flow recirculation process overtops, subsequently hitting the structure. In the presence of a VW, the vertically splashed-up surge falls back by taking a form similar to an Umbrella (Figure 11b), wherein a part of the splashed-up surge falls back on the incoming flow, and the rest falls on the land side of the VW. We defined this phenomenon as an umbrella effect occurring in the VW. The shape of the splashed surge also depends on the location of the seawall and the height of the seawall. For example, Crespo et al. [29] and Thomas and Cox [31] observed the jet type projection of the splashed surge with low-height seawalls. Depending on the height of the LRC (or VW), a part of the incoming surge is reflected offshore, and the rest overtops [40,44] (Figure 10e and Figure 11e).
Figure 12a,b present the force and the overturning moment acting on the inland structure behind the LRC and the VW for Wall 4 and do = 0.9 m. The corresponding pressure distributions are marked in Figure 12c. The force and the overturning moment acting on the inland structure without the mitigation wall are also presented to appreciate the load reduction. Both the LRC and the VW significantly reduced the forces and the overturning moment on the inland structure, ignoring the initial impulsive load phase. The presence of recurve primarily delayed the surge interaction with the inland structure compared to the VW, as seen in Figure 10 and Figure 11. The overtopped surge interaction with the inland structure induces an impact force. Compared to the VW, the LRC induces a more prominent impact load. Observing Figure 10c, the accumulated water behind the LRC overtops like a plunging breaker and hits the structure. In the case of a VW, the initial overtopped volume undergoes more considerable energy dissipation due to the surge collapsing on the offshore and the inland side (Figure 11c). After the initial impact (tC) and the initial reflective stage (tD), the variation in the force profile induced by the LRC and the VW is not so considerable. The flow and the force-time history in the tail-end closely resemble the same (Figure 10e, Figure 11e and Figure 12a). Similar observations are noted in the overturning moment time histories (Figure 12b). Herein, the impact moment is not appreciable as an impact force, indicating the high-pressure impact at the structure bottom level as observed in Figure 12c for the LRC (i.e., the lever arm, LA is very small). Furthermore, the pressure distribution indicates that the pressure is no longer hydrostatic at the structure front (Figure 12c) due to the high Fr of the overtopped bore [38].
We attempted to verify the same for low height mitigation walls (Wall 1). Figure 13 presents the force–time history for wall 1 with do = 0.9 m and L = 1 and 2 m. It can be observed that for the low height VW, the inland structure experiences a higher impact load compared to the LRC for L = 1 m Moreover, the initial short-duration impact load is higher compared to the case without the mitigation wall. This is due to the flow-ramping effect, which occurs when the inland structure is located in closer vicinity to the vertical wall (Figure 13a) [29,31]. As observed in Wall 4 for the LRC, the overtopped surge behind Wall 1 for the LRC resembled more closely the same, inducing an initial impact on the structure (Figure 13a). The magnitude of the impact depends on the overtopping volume, aeration, angle of impact and overtopped surge characteristics. The overtopping volume at different time instances would differ since the dam break surge is highly time-variant. In the case of a VW, one can also notice two impacts compared to single impacts for the LRC (Figure 13a,b). Thus, the LRC reduces the failure probability of the inland structure compared to a VW at low heights. Neglecting the impact and the forces during the initial reflection phase, it is interesting to note that although the low-rise mitigation walls delay the period of surge interaction, the force reduction is not so appreciable when the structure is located near the mitigation wall, despite a slightly better performance by the LRC (Figure 13a). However, the structure away from the mitigation wall experiences comparatively lesser force, neglecting the initial impact (Figure 13b). Similar observations occurred in the moment–time history and are hence not presented here for the sake of brevity. The effect of L on force reduction is discussed in Section 3.4.1.
From Figure 12 and Figure 13, it is clear that the LRC delays the period of bore interaction compared to the VW. Figure 14 presents the overtopped surge interaction time (tim) at three different structure locations for the LRC and the VW. Here, tim is non-dimensionalized with tn,im (no mitigation wall condition). It can be observed that with the increase in hs, the LRC delays the time of bore interaction more than the VW. The VW also delayed the interaction time; however, it is found to be independent of the height of the mitigation wall. This is not in agreement with the observations from Oshnack et al. [30]. The difference in the observation can be attributed to the characteristics of the bore (steep bore front and broken bore in Oshnack et al.) [30]. Nevertheless, it can be safely said that the LRC could offer sufficient time for vacating people compared to the VW during an event.

3.4. Force Reduction Due to Mitigation Wall
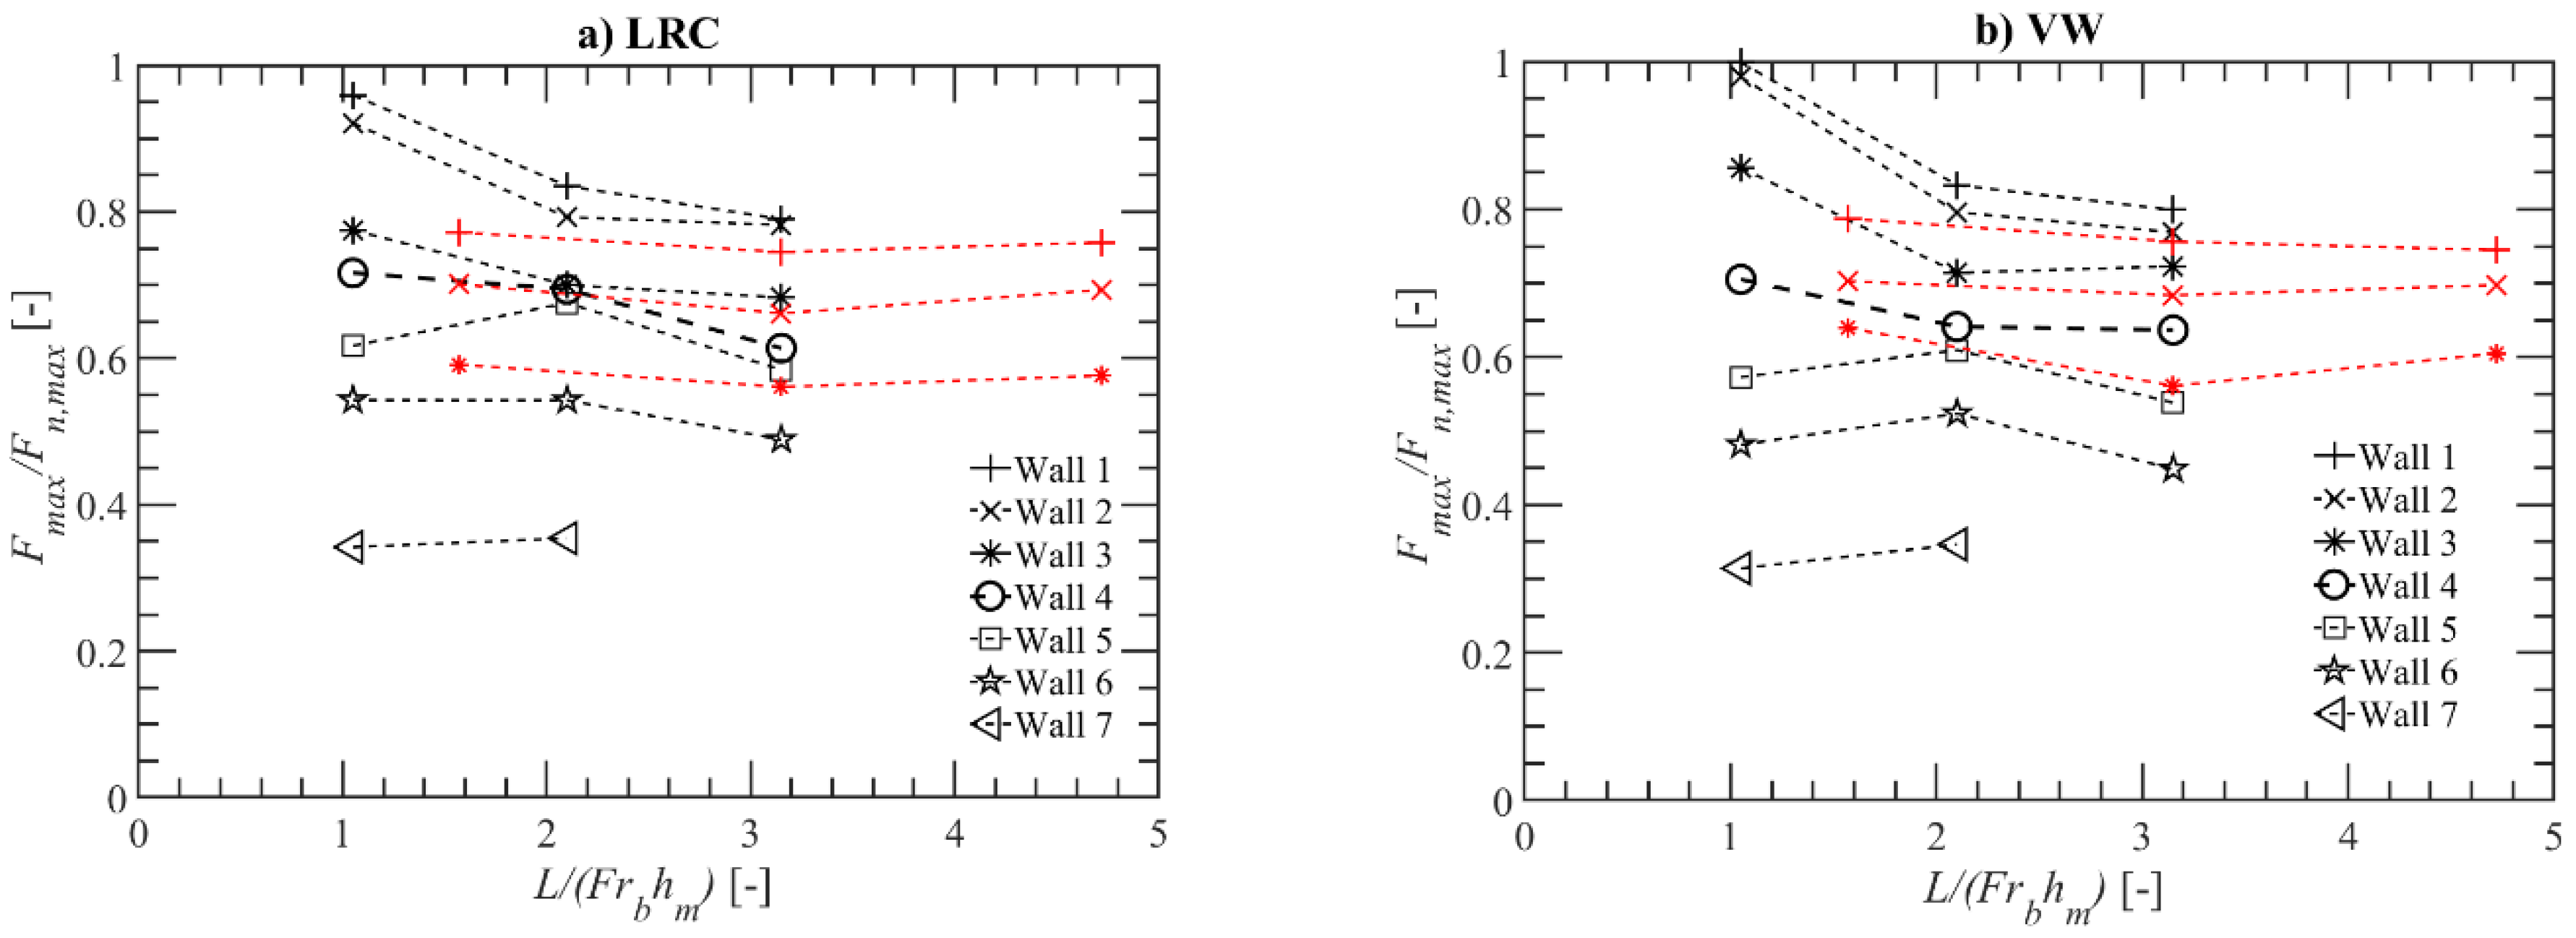
The forces and moment are the topics of interest to design engineers and researchers. The maximum force and moment were obtained from the numerical simulations after the time instant (tD) (mentioned in Figure 12a) to evaluate the load reduction due to the mitigation wall promisingly. Since the impact depends on several factors, as discussed in Section 3.3, the load until the initial reflection stage (tD) is not considered for further discussions (until instant, tD). For example, in Figure 12a, the maximum load is chosen at t(g/d0)0.5 ≈ 20 for the LRC. It should be remembered that the time instant (tD) differs depending on hs/hm and L. The moment reduction is discussed separately in Section 3.5.

3.4.1. Effect of L

The distance between the mitigation wall and the landward structure plays a significant role in the force acting on the structure [31,37,43]. The effect of L can be discussed in terms of L/Frbhb, where the surge Froude number, F r b = C g h b , is defined using surge front celerity (C) and the surge depth (hb). The non-dimensional term was introduced by Triatmadja and Nurhasanah [37]. It should be noted that Frb mentioned in Triatmadja and Nurhasanah [37] is different from Fr mentioned in Section 3.1; the latter uses local flow velocity ‘u’ at the location of the seawall. Triatmadja and Nurhasanah [37] used hb as the surge height at the time of maximum force without the mitigation wall, where hb is measured in the absence of the mitigation wall and at the structure location (free-flow simulation). ASCE-07 [68] suggested that maximum force occurs at two-thirds of maximum surge depth (hm1; defined in Section 3.2). Recently, Wüthrich et al. [69] observed scattering in the data between 0.6 and 0.8 times of hm1 for dry bed surges. Since it is highly dependent on the incoming surge characteristics, the maximum surge depth measured at the mitigation wall location (hm; defined in Section 3.1) is chosen in this study to reduce uncertainty. Since the theoretical solution of Ritter [62] compares well with the bore front profile, the bore front celerity (C) is calculated as 2 g d o . Thus, Frb is re-calculated as F r b = C g h m , and the same has been used further for discussion. Here, L/Frbhm tested in the present study ranged from 1.05 to 4.72. Earlier studies also indicated that the effect of L is also closely correlated with the height of the mound [31].
Figure 15a,b provide the force ratio (Fmax/Fn,max) plotted against L/Frbhm for LRC and VW. Fmax and Fn,max represent the maximum force experienced by the structure with and without the mitigation wall. The pattern of force reduction remained the same for both type of mitigation wall. It can be observed that L/Frbhm plays a significant role between 0 and 2 for hs/hm < 1.0. A slight decrease in the F/Fn,max is observed with a further increase in L/Frbhm between 2 and 3. For L/Frbhm > 3, negligible differences were observed due to L. This specific effect arises for low-rise mitigation walls. Our results indicate that the difference in the force reduction between L = 1 m and 3 m (for Wall 1 tested with do = 0.9 m) can be up to 16.9% and 19.9% for the LRC and the VW, respectively. A further increase in hs/hm reduced the effect of L. Since the effect of L is co-related with hs/hm, the discussions are continued in Section 3.4.2.
The result from previous studies on a VW as a mitigation wall is discussed further to enlighten understanding. The trend of variation contradicts the observation from Triatmadja and Nurhasanah [37], who observed a linear decrease in the force with the decrease in L for L/Frbhb < 2 (Figure 15b). Since the tested range of hs/hm is approximately greater than 2.1 in all the cases for Triatmadja and Nurhasanah [37], the force result in the present study might have deviated from their experimental observation. The mitigation wall is also of finite width. Moreover, the inland structure might have been overtopped in their study since the height of the structure used in their experiment was small. The pattern aligns with the experimental observations from Thomas and Cox [31] for the low-rise mitigation wall located near the inland structure (Walls 1 and 2 tested in do = 0.9 m for L = 1 m). Nevertheless, after L/Frbhm > 2, we did not observe a considerable force increase compared to Thomas and Cox [31]. For high vertical walls, Thomas and Cox [31] observed maximum force reduction F n ,   m a x F m a x F n , m a x × 100 % due to L up to 90% when the seawall was closer to the building (L = 0.6 m, in Thomas and Cox [31]). The hs/hm corresponding to the observation was approximately 1.533, closely representing Wall 5. The hs/hm provided here for Thomas and Cox [31] was reworked from the figures in their study. The force reduction due to the seawall at L = 1.2 m and L = 1.8 m was 80% and 70%, indicating increased force with the increase in L. However, our numerical simulation indicated force reduction of 43% and 39% for L = 1 m and 2 m, respectively. For L = 3 m (a common position in both the studies), we observed force reduction up to 46%, approximately equivalent to Thomas and Cox [31]. In our observation, the force variation is not significant with L for the high-rise mitigation wall (hs/hm > 1.0), contradicting the observation from Thomas and Cox [31]. In fact, the same is reflected in Wall 6 and Wall 7 in Figure 15b. The deviation in the observations might be related to the finite width of the mitigation wall tested in their study. The finite width mitigation wall allows the reconstruction of a deflected bore from the mitigation wall after a certain distance onshore, thereby inducing an additional force on the structure, as observed in Crespo et al. [29]. Thus, the increased force on the inland structure in their study. Furthermore, it depends on the site-specific Fr of the incoming surge, overtopping volume and the generated surge characteristics. Harish et al. [81] and Ikeya et al. [92] discussed the effect of Fr on the water depth at the structure front. A surge of higher Fr would have a higher water depth in front of the seawall than the lesser Fr. In addition, the generated bore in Thomas and Cox [31] was steeper compared to our dam break surge, which might have shifted the location of maximum force to the impact phase, even in the absence of a mitigation wall in their study. Thus, the Froude number of the incoming flow also plays a significant role in the forces on the landward structure since the flow accumulation at the mitigation wall front depends on Fr [81,85,93].

3.4.2. Effect of hs

As discussed above, Fr also plays a significant role in flow overtopping. Hence, the seawall must be non-dimensionalized using Fr and h rather than directly using hm. The water level rises at the upstream side of the mitigation wall based on flow characteristics and overtops when the freeboard level is less than the minimum height required for overtopping. To estimate the minimum depth for non-overtopping for 2D walls, the conservation of mass and momentum equations (CMC) can be used [42,81,82,85]. Harish et al. [81], Sakakiyama [42] and Ikeya et al. [82] showed that CMC predicts the water depth at the upstream side of the wall more reasonably than the energy equation for a 2D wall. The water depth at the upstream side of the 2D wall (hf,wall) in the non-overtopping conditions can be estimated as
h f , w a l l = h 1.3   Fr + 1
The above equation provides the same result as CMC [41,42,81,92]. A 2D simulation was carried out with a high VW such that no-overtopping occurred to verify the applicability of the above equation. Figure 16a shows the typical bore interaction process with a VW in non-overtopping conditions, and Figure 16b shows the predicted and simulated hf,wall. Due to the initial splash-up phase, the water depth at the structure front was higher. The splashed-up surge falls back and creates a quasi-steady condition at the wall front [73,74]. Neglecting the initial splash-up and run-down phase, the observation shows that the predicted hf,wall using CMC reproduces the simulated hf,wall closely compared to the energy equation. Hence, the CMC equation is used to obtain the minimum depth required for non-overtopping. The mitigation wall depth (hs) was thus non-dimensionalized with maximum hf,wall estimated from Equation (4) (hs/hf,wall) to better understand the force reduction, and the same has been adopted further. It should be noted that Equation (4) applies only to a VW. Since there are no formulas available in the literature for an LRC, hf, wall estimated from Equation (4) for a VW is used for the LRC in the present investigation.
Figure 17 presents the variation of the force ratio (Fmax/Fn,max) with respect to hs/hf,wall for different L/Frbhm on an LRC and a VW. As one would expect, increasing the height of the mitigation wall reduces the forces on the inland structure. It also portrays the apparent independence of impoundment depth in the tank (do) in the force reduction due to appropriate non-dimensionalization. From Figure 15 and Figure 17, for hs/hf,wall < 0.29, it can be observed that the LRC performed slightly better in the force reduction when L/Frbhm < 2. Specifically, for L/Frbhm = 1.05, the LRC induced 4.1% and 8% force reduction, whereas the VW induced 0.0% and 2.22% force reduction for Wall 1 and Wall 2 in do = 0.9 m, respectively. Xu et al. [44] observed that a low-rise VW could increase the horizontal force on the inland structure up to 20% compared to the absence of a mitigation wall (negative effect). The same was observed in Thomas and Cox [31]. For hs/hf,wall > 0.4, the LRC induced a slightly higher force on the inland structure than the VW. This can be related to considerable flow accumulation in front of the LRC than the VW until the overtopping starts, as shown in Figure 10. The accumulated water, upon overtopping, induced a slightly higher force on the inland structure. Hence, it can be safely said that for hs/hf,wall < 0.29, the LRC performs better when L/Frbhm < 2. Independent of L/Frbhm, the VW performs comparatively better when hs/hf,wall > 0.4, despite the difference in the force ratio (Fmax/Fn,max) between the VW and the LRC being approximately less than 0.065 in any case from our results.
With a VW, Xu et al. [44] showed exponential decay in the force with increased hs. Moreover, Xu et al. [44] observed significant scattering in the data points. However, the present results indicate a linear variation in the force. The discrepancy in the observation can be related to the representation of the inland structure with a vertical wall in their experiments, where the maximum force was usually at the initial reflective stage (tD) [70,73,75]. Moreover, the variation could have also resulted from the non-dimensionalization of the seawall height with the energy equation in their study. As observed in Figure 17b, Oshnack et al. [30] also observed a gradual decrease in force with an increase in hs.
Neglecting the effect of L for low-rise walls (i.e., 0.15 < hs/hf,wall < 0.29; L/Frbhm < 2), the force reduces linearly. Hence, Fmax can be estimated as
F m a x F n , m a x = 1 h s h f , w a l l
The above equation can be used directly for 0.15 < hs/hf,wall < 0.29; L/Frbhm > 2 and hs/hf,wall > 0.29 for all L/Frbhm for both an LRC and a VW. The upper bound ratio can be chosen by adding 0.1 to Equation (5) for the conservative force estimate. For including the effect of L (i.e., 0.15 < hs/hf,wall < 0.29 for L/Frbhm < 2), the data from Figure 17 can be used. A better F max prediction demands a proper adoption of Cd for Fn,max. Since our numerical simulations were carried out with only two impoundment depths, it would be dubious to suggest Cd from our study. Hence, Cd can be chosen from the previous studies without the mitigation wall—c.f., [33,46,47,69,72].

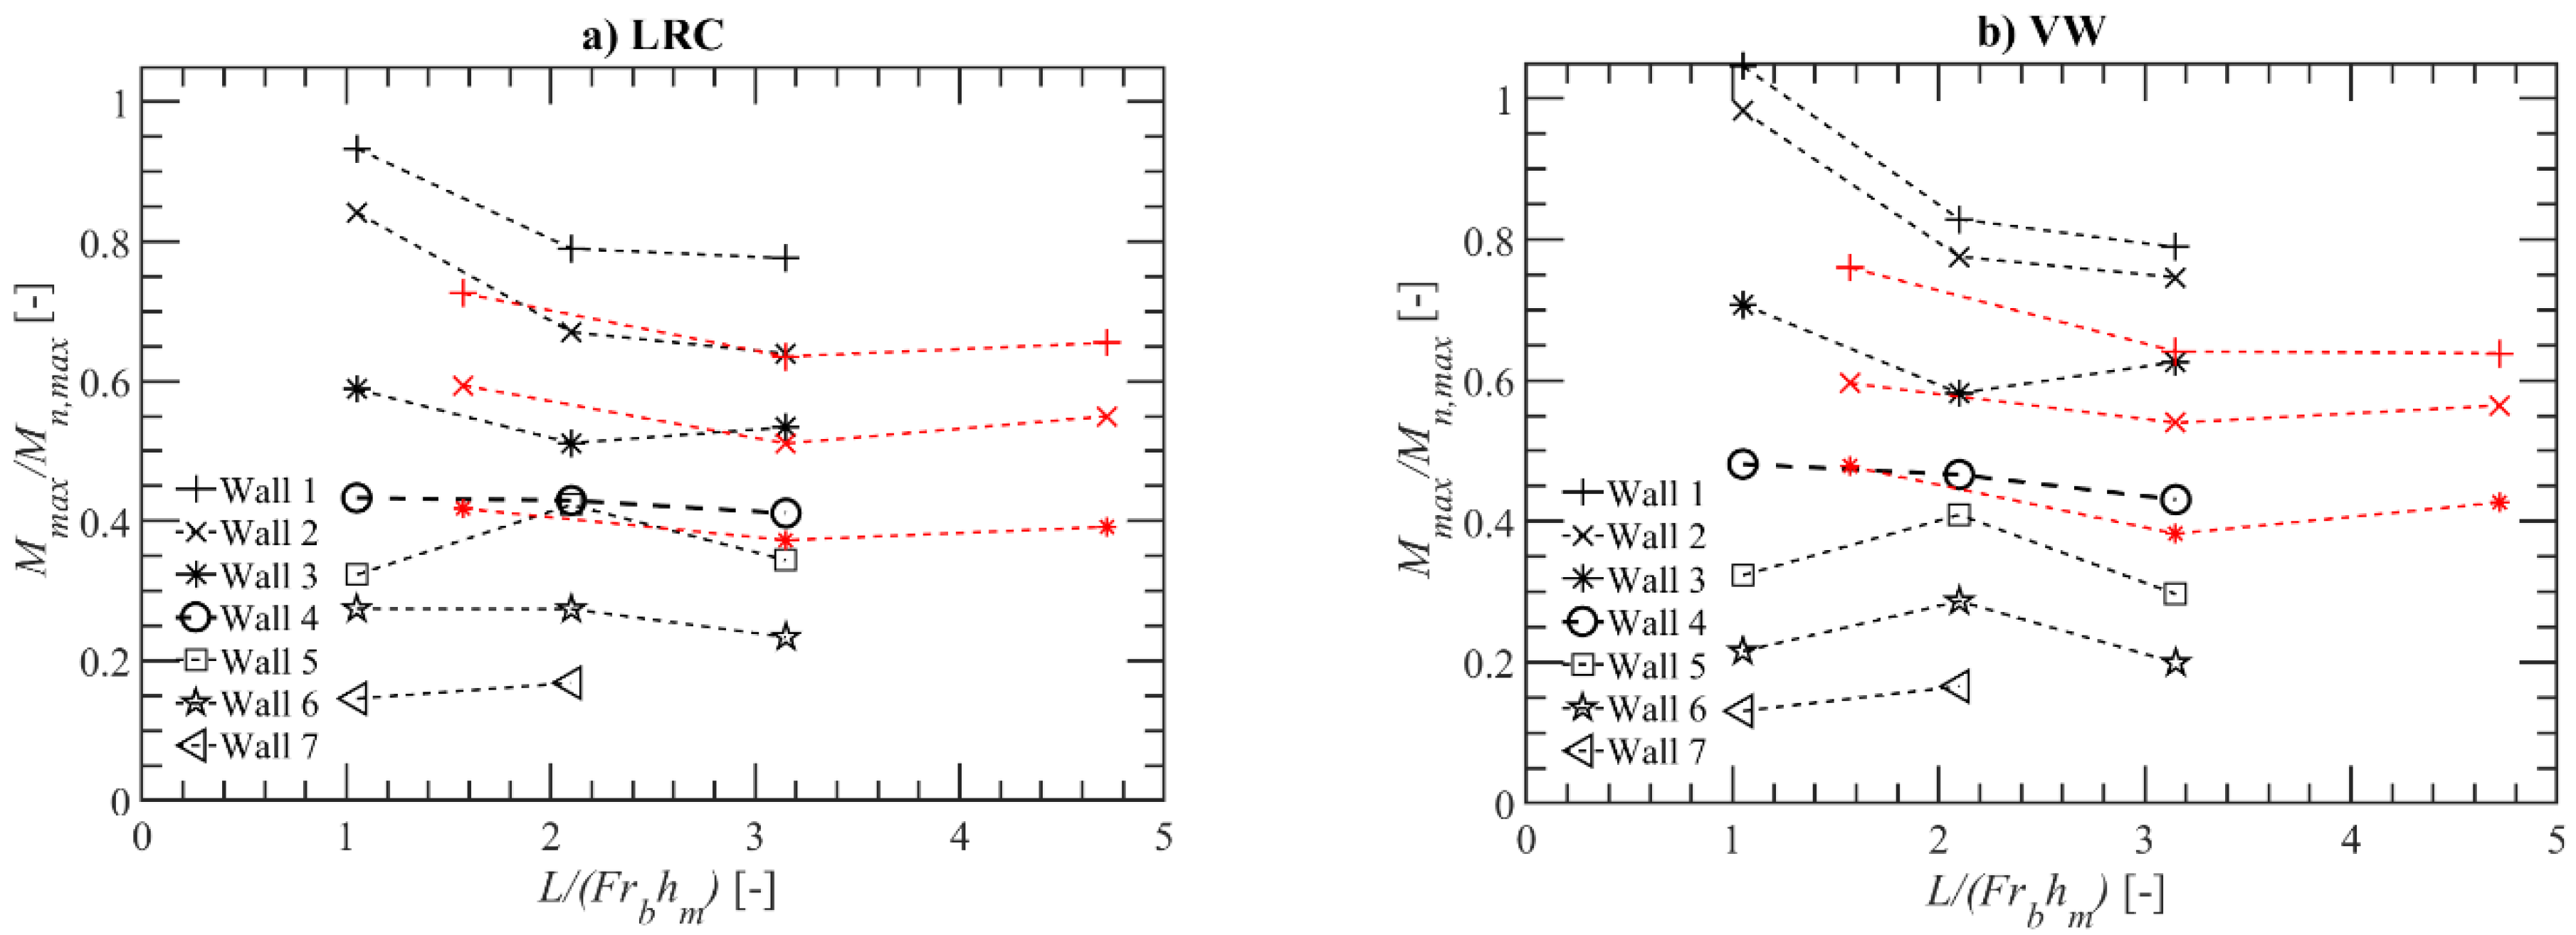
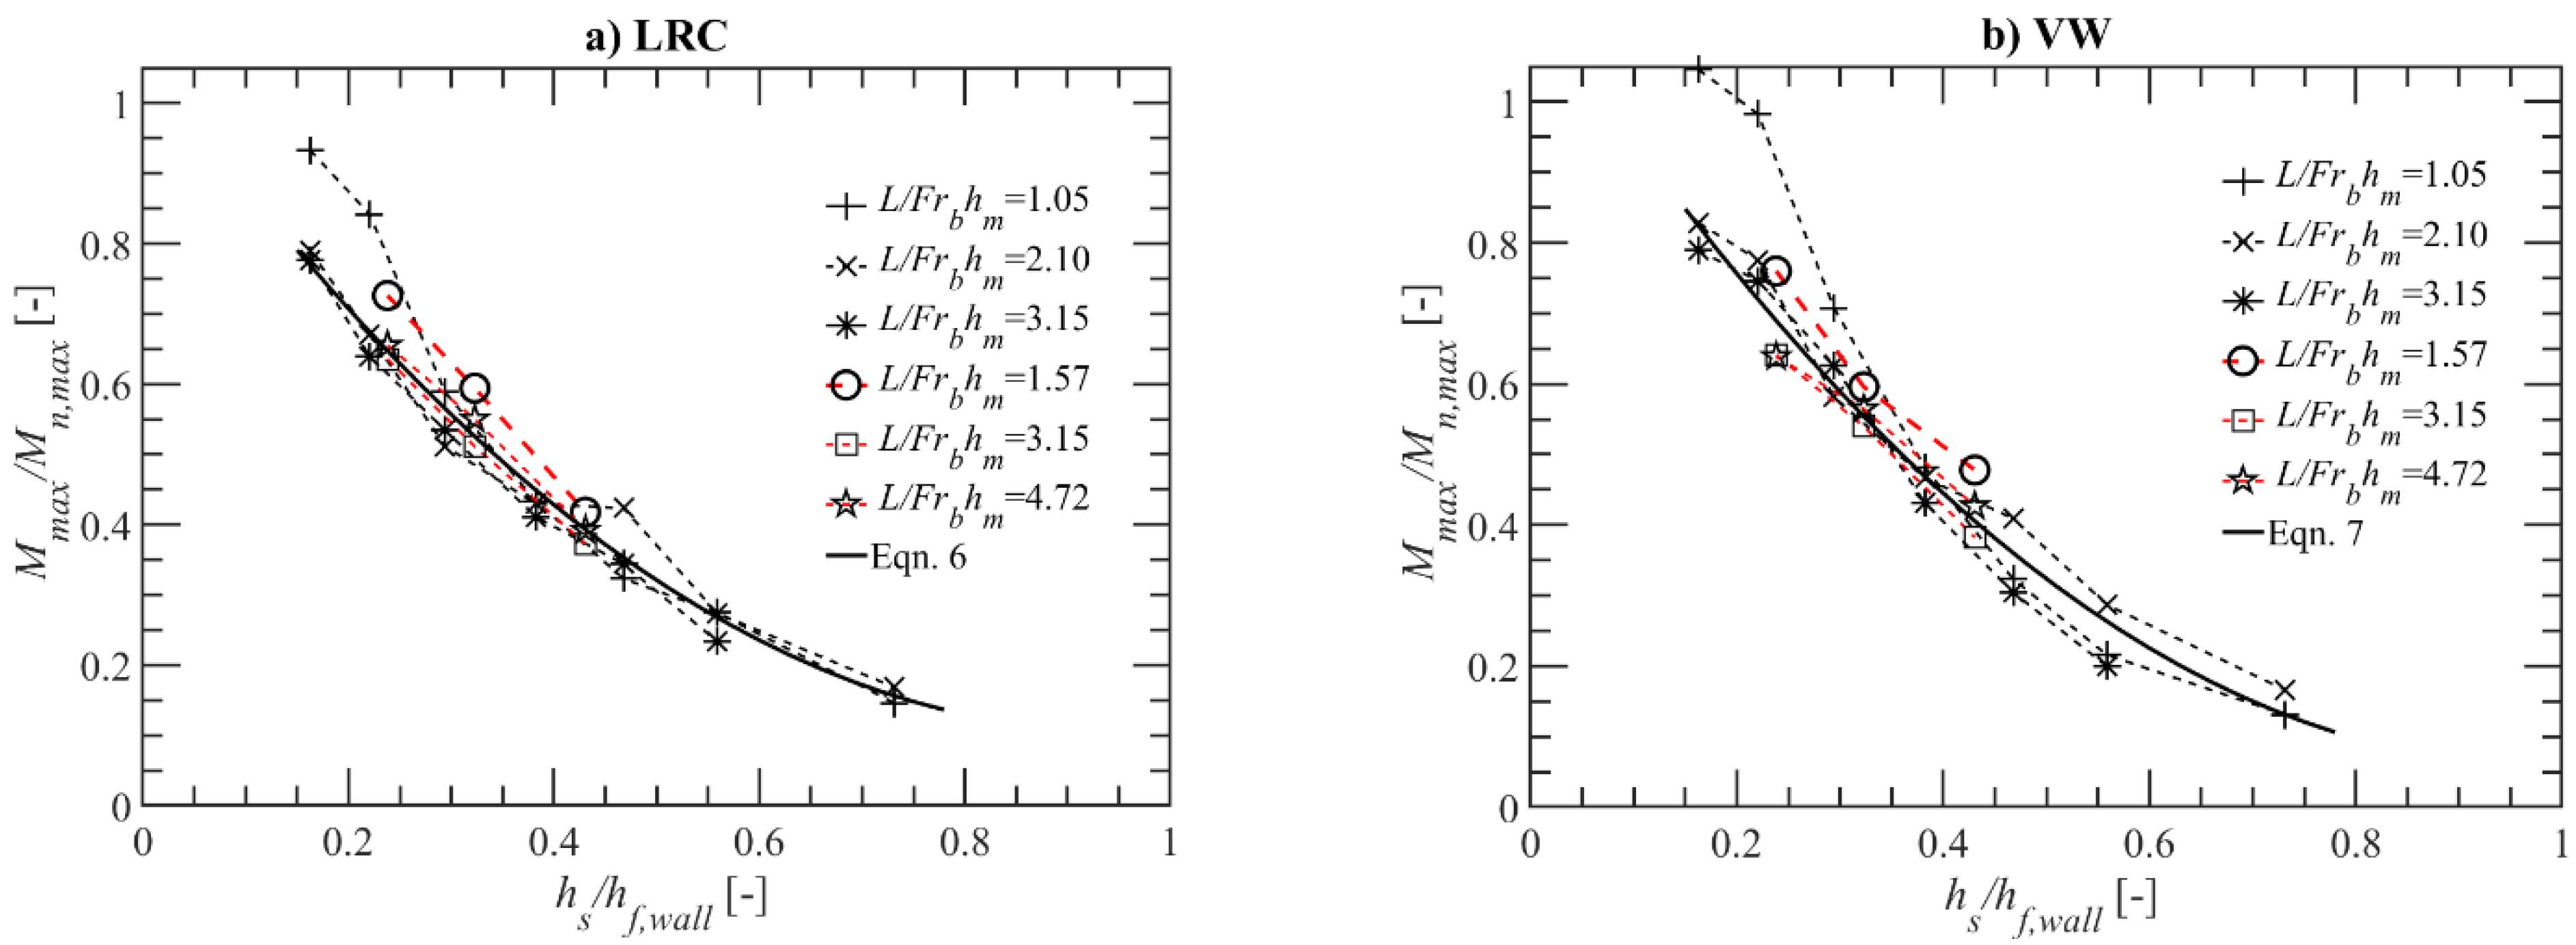
3.5. Moment on the Structure (M)

In addition to the horizontal force, the overturning moment also plays an essential role in the failure of the structure during a tsunami event. Since discrepancies are involved in the time of occurrence of maximum moment and force (Figure 8 and Figure 18), a separate discussion is required. The overturning moment at the founding level depends on the variation in the water depth between the structure frontside and the rear side as well as the corresponding pressure distribution. Like the force, the maximum moment is chosen after the time instant, tD (Figure 12a). Figure 19 presents the effect of L and Figure 20 presents the effect of hs/hf,wall on the moment (M) for LRC and VW. Similar to the force observation, for a low-rise vertical wall until hs/hf, wall < 0.29 and L/Frbhm < 2, the effect of L influences even in the moment reduction. The reason can be attributed to the increased flow velocity during overtopping and flow accumulation at the structure front due to the closeness of the structure to the low-rise mitigation wall (double reflection between the structure and the backside of the mitigation wall) [44]. It is also interesting to observe that for low-rise vertical wall (VW) (Wall 1) at L/Frbhm = 1.05, the moment on the structure was higher than the case without a mitigation wall (4.59% higher, negative effect). A similar observation was reported by Xu et al. [44], where the authors observed up to a 20% higher overturning moment than in no-mitigation wall cases. However, with the increase in L, the moment reduction with a low-rise wall is still appreciable. The numerical simulation results indicate that the difference in the moment reduction between L = 1 m and 3 m can be up to 15.73% for an LRC and 25.6% for a VW for Wall 1 tested with do = 0.9 m. Nevertheless, the LRC performed better until hs/hf,wall < 0.29. Similar to the observation for force, for hs/hf,wall > 0.4 (Wall 4), the moment reduction with a VW is slightly better than with a LRC.
Interestingly, the overturning moment on the inland structure decreases exponentially with the increase in hs/hf,wall. The variation in the trend between force and moment can be related to the reduction in overtopping depth and the increase in the Fr with the increases in hs, which result in localized high pressure at the structure bottom level, as pointed out by Arimitsu and Kawasaki [38]. This phenomenon brings down the lever arm (LA) and hence the reduced moment. This can also be justified using the pressure profile at the structure front surface. Figure 21 presents the pressure profile at the time of maximum moment for all the test cases for do = 0.9 m and L = 2 m. It should be remembered that the time of maximum moment is different for different cases; however, it is always chosen after the time instant, tD. As one could observe, with the increase in the height of the wall, the pressure profile changes from near-linear variation to parabolic shape, similar to the theoretical pressure profile shape of Cumberbatch [77] and Kihara et al. [74]. For Wall 7, one could observe a localized high pressure at the bottom level of the structure, which results in a reduced moment on the structure, similar to observations by Arimitsu and Kawasaki [38]. The change in the pressure profile shape also brings down the location of the lever arm.
The regression analysis was carried out, omitting the data in the range of hs/hf,wall < 0.29 for L/Frbhm < 2, thereby omitting the effect of L, which also means that hs/hf,wall < 0.29 for L/Frbhm > 2 are still included. An empirical moment reduction ratio (Mmax/Mn.max) obtained from regression analysis for the LRC and the VW is given as,
M m a x M n , m a x L R C = 1.0853 h s h f , w a l l 2 2.0479 h s h f , w a l l + 1.0734   ;   R 2 = 0.97
M m a x M n , m a x V W = 1.1445 h s h f , w a l l 2 2.2421 h s h f , w a l l + 1.1586   ;   R 2 = 0.96
The equations are valid in the range of 0.15 < hs/hf,wall < 0.29 for L/Frbhm > 2 and 0.29 < hs/hf,wall < 0.73 for any L/Frbhm. In the case of 0.15 < hs/hf,wall < 0.29 for L/Frbhm < 2, we recommend further investigation for accurate moment estimation. Nevertheless, Figure 20 data can be used for immediate field application in this range. The Mn,max in Equations (6) and (7) can be estimated using Equation (3). A better prediction of Mmax from Equations (6) and (7) depends on a good choice of Cd and Ln,A.

4. Conclusions and Outlook

This study performed a comprehensive set of numerical simulations to understand the forces on the inland structures behind a mitigation wall such as a large recurve wall (LRC) or a vertical wall (VW) on a 1:15 scale. The study potentially tried to understand the difference in the mitigation characteristics of the LRC and the VW by analyzing the force and the moment induced on the structure behind it. The same has been addressed by varying the distance between the mitigation wall and the inland structure (L) and the height of the mitigation wall (hs), which were found to be critical in force reduction on the inland structure. The post-impact maximum force was chosen in this study to distinguish the potential performance of LRC and VW. The present study focused mainly on the force in the transition and the quasi-steady phases. Hence, the results can be considered free of scale effects within the ranges of tested flow conditions and geometrical parameters [94,95]. The extensive set of numerical simulations yielded the following conclusion.
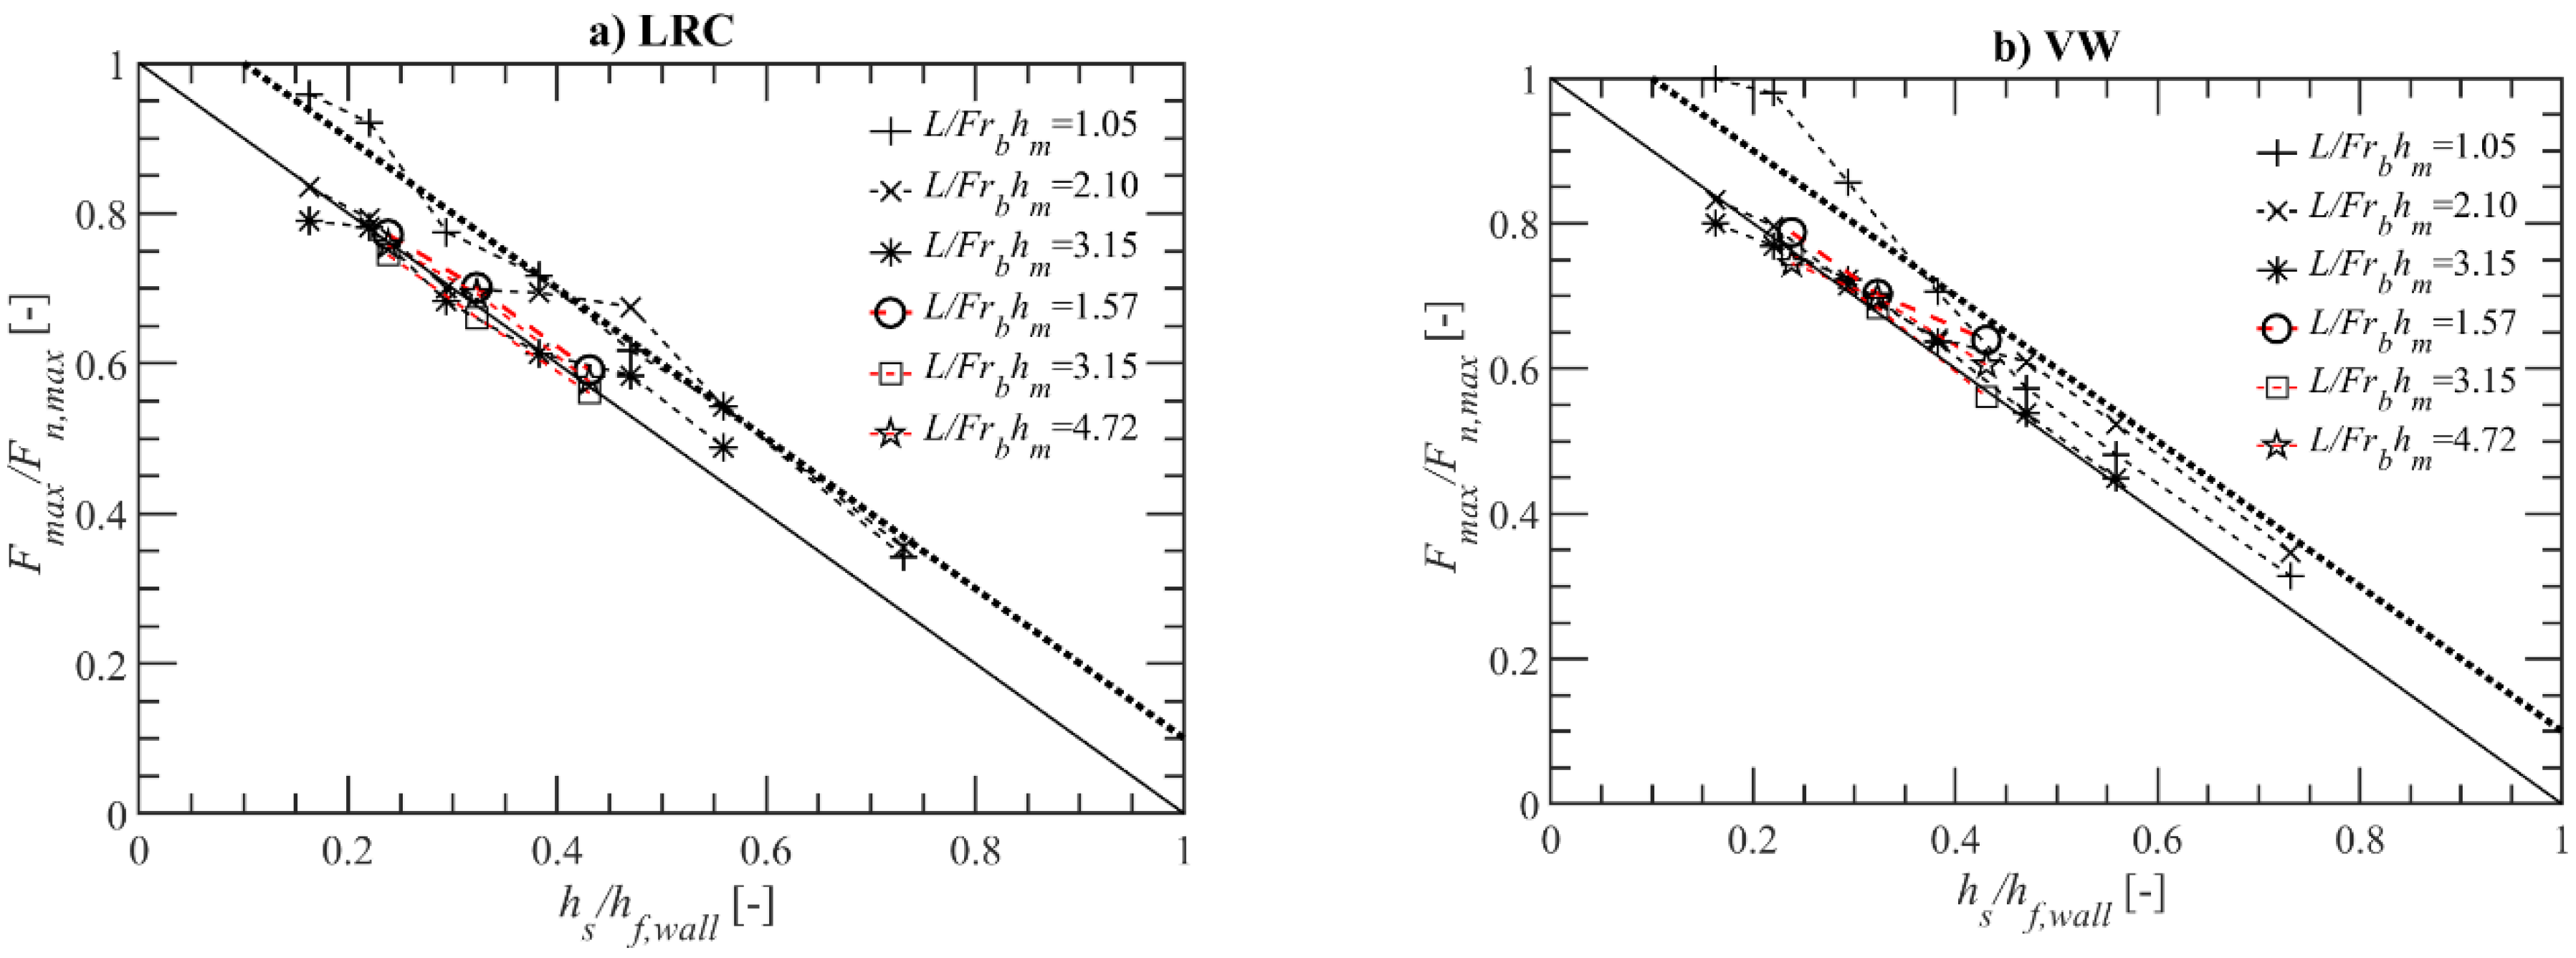
  • The LRC performs slightly better in force reduction in the case of a low-rise mitigation wall located near the structure (hs/hf, wall ≤ 0.29; L/Frbhm ≤ 2). For L/Frbhm > 2 and hs/hf,wall ≤ 0.29 and between 0.29 ≤ hs/hf, wall ≤ 0.4, the LRC and the VW perform closely. In terms of moment reduction, a slightly better performance by the LRC until hs/hf, wall ≤ 0.29, was observed. However, for high-rise mitigation walls (i.e., hs/hf,wall > 0.4), irrespective of L, the VW performs slightly better in force and moment reduction, although the difference in the force ratio (Fmax/Fn,max) and moment ratio (Mmax/Mn,max) between the VW and the LRC does not exceed more than 0.065 and 0.058, respectively, in any case. For practical purposes, it can be safely said that the LRC and the VW perform relatively the same when hs/hf, wall > 0.3.
  • The LRC delays the period of surge interaction due to the flow recirculation at the structure front, compared to the VW. Furthermore, the time of impact (tim) increases gradually with the increase in hs for the LRC, whereas no significant difference in tim is observed with the increase in hs for the VW.
  • Independent of the LRC and the VW, the force reduces linearly with the increase in hs/hf,wall. The overturning moment reduces exponentially. An empirical moment ratio (Mmax/Mn,max) is introduced in this study for practical application. One should also include the effect of L by adding suitable safety factors or including the results from this study when considering a low-rise mitigation wall.
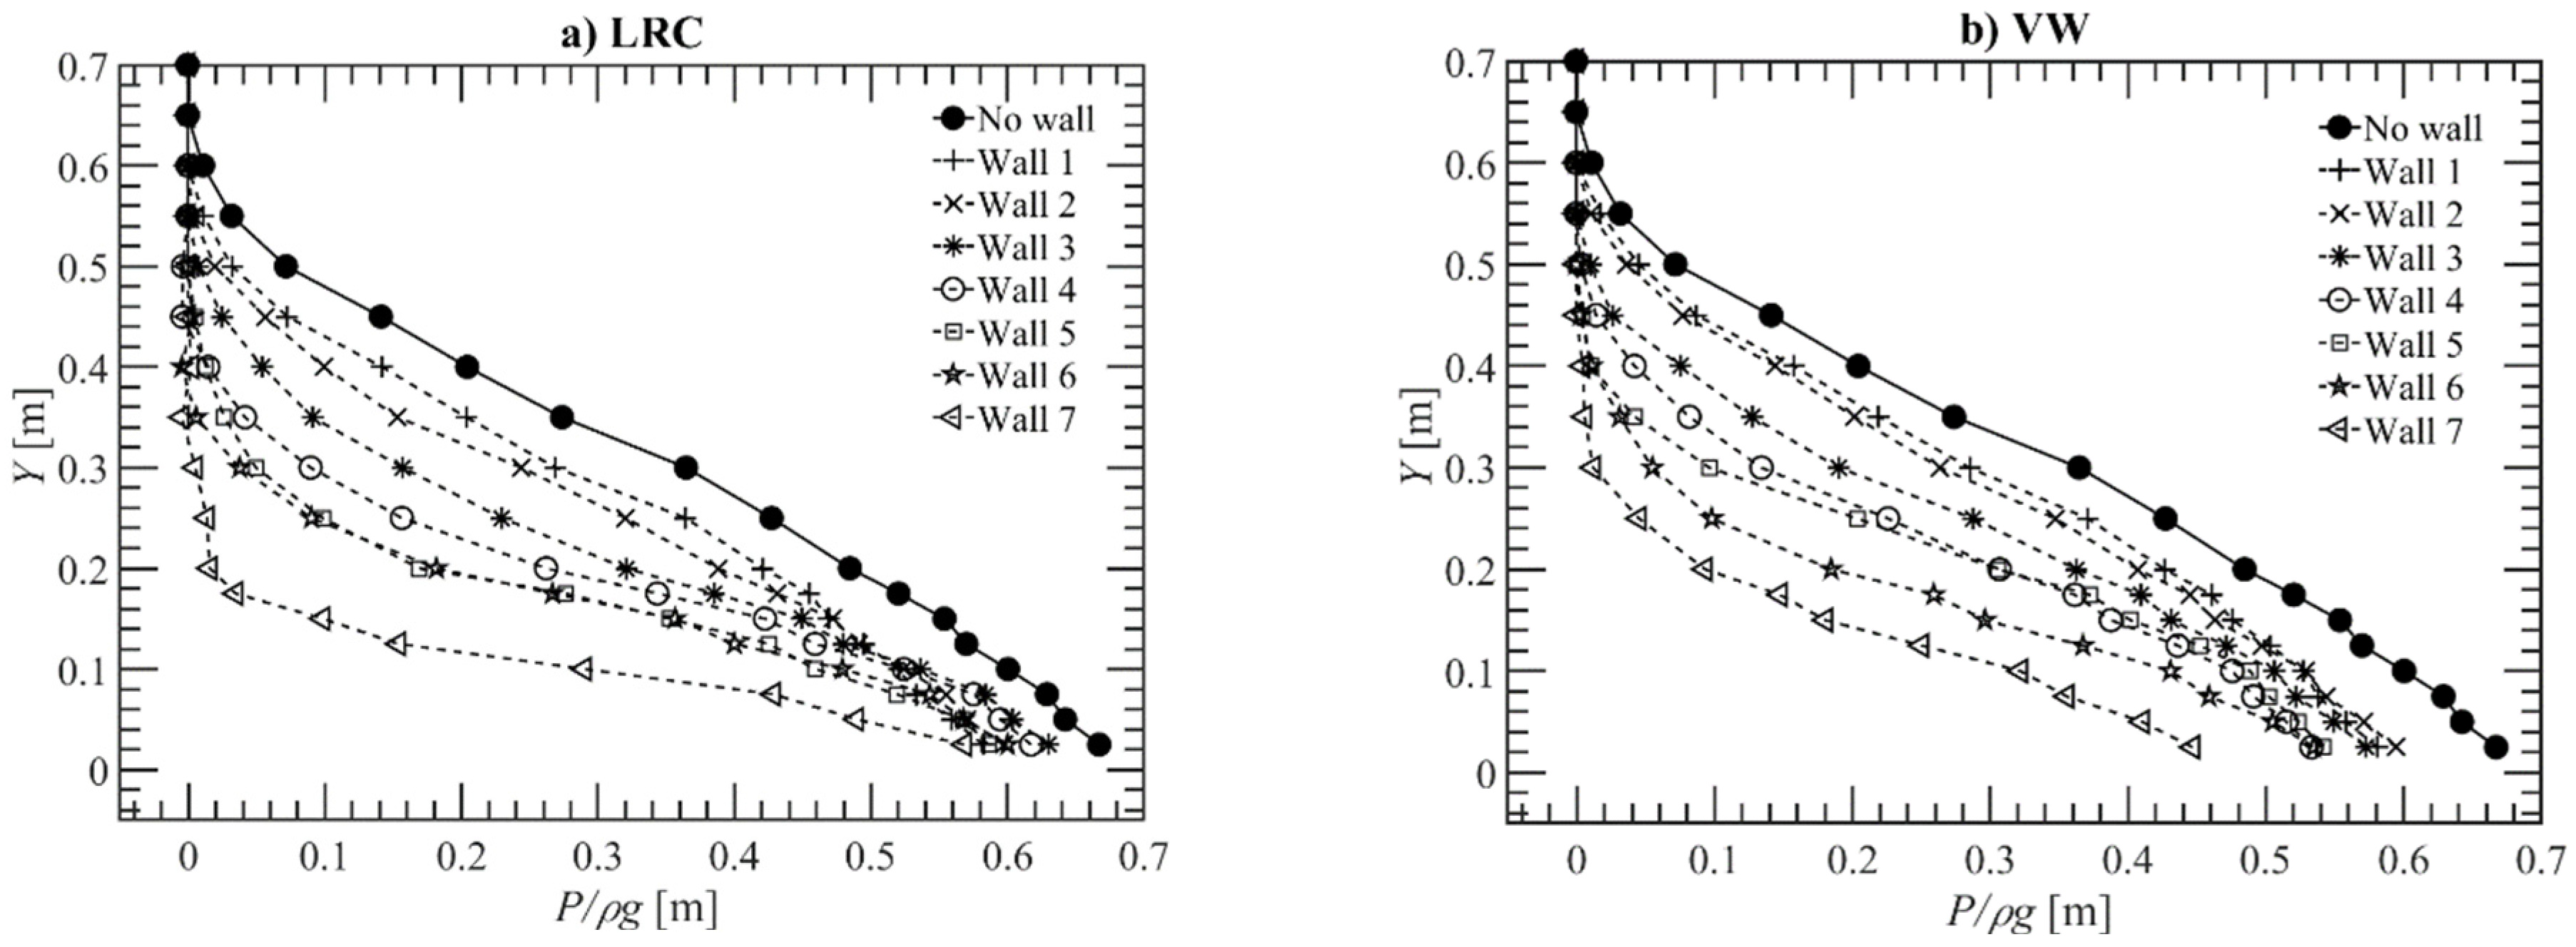
  • The change in the behaviour between the force reduction and the moment reduction can be related to the variation in the pressure profile and the decrease in the bore depth at the structure front. A high-rise mitigation wall induces local high pressure at the structure bottom, thereby reducing the lever arm and hence the moment. This is closely related to the reduced overtopped surge depth and increased Fr of the overtopping surge [38].
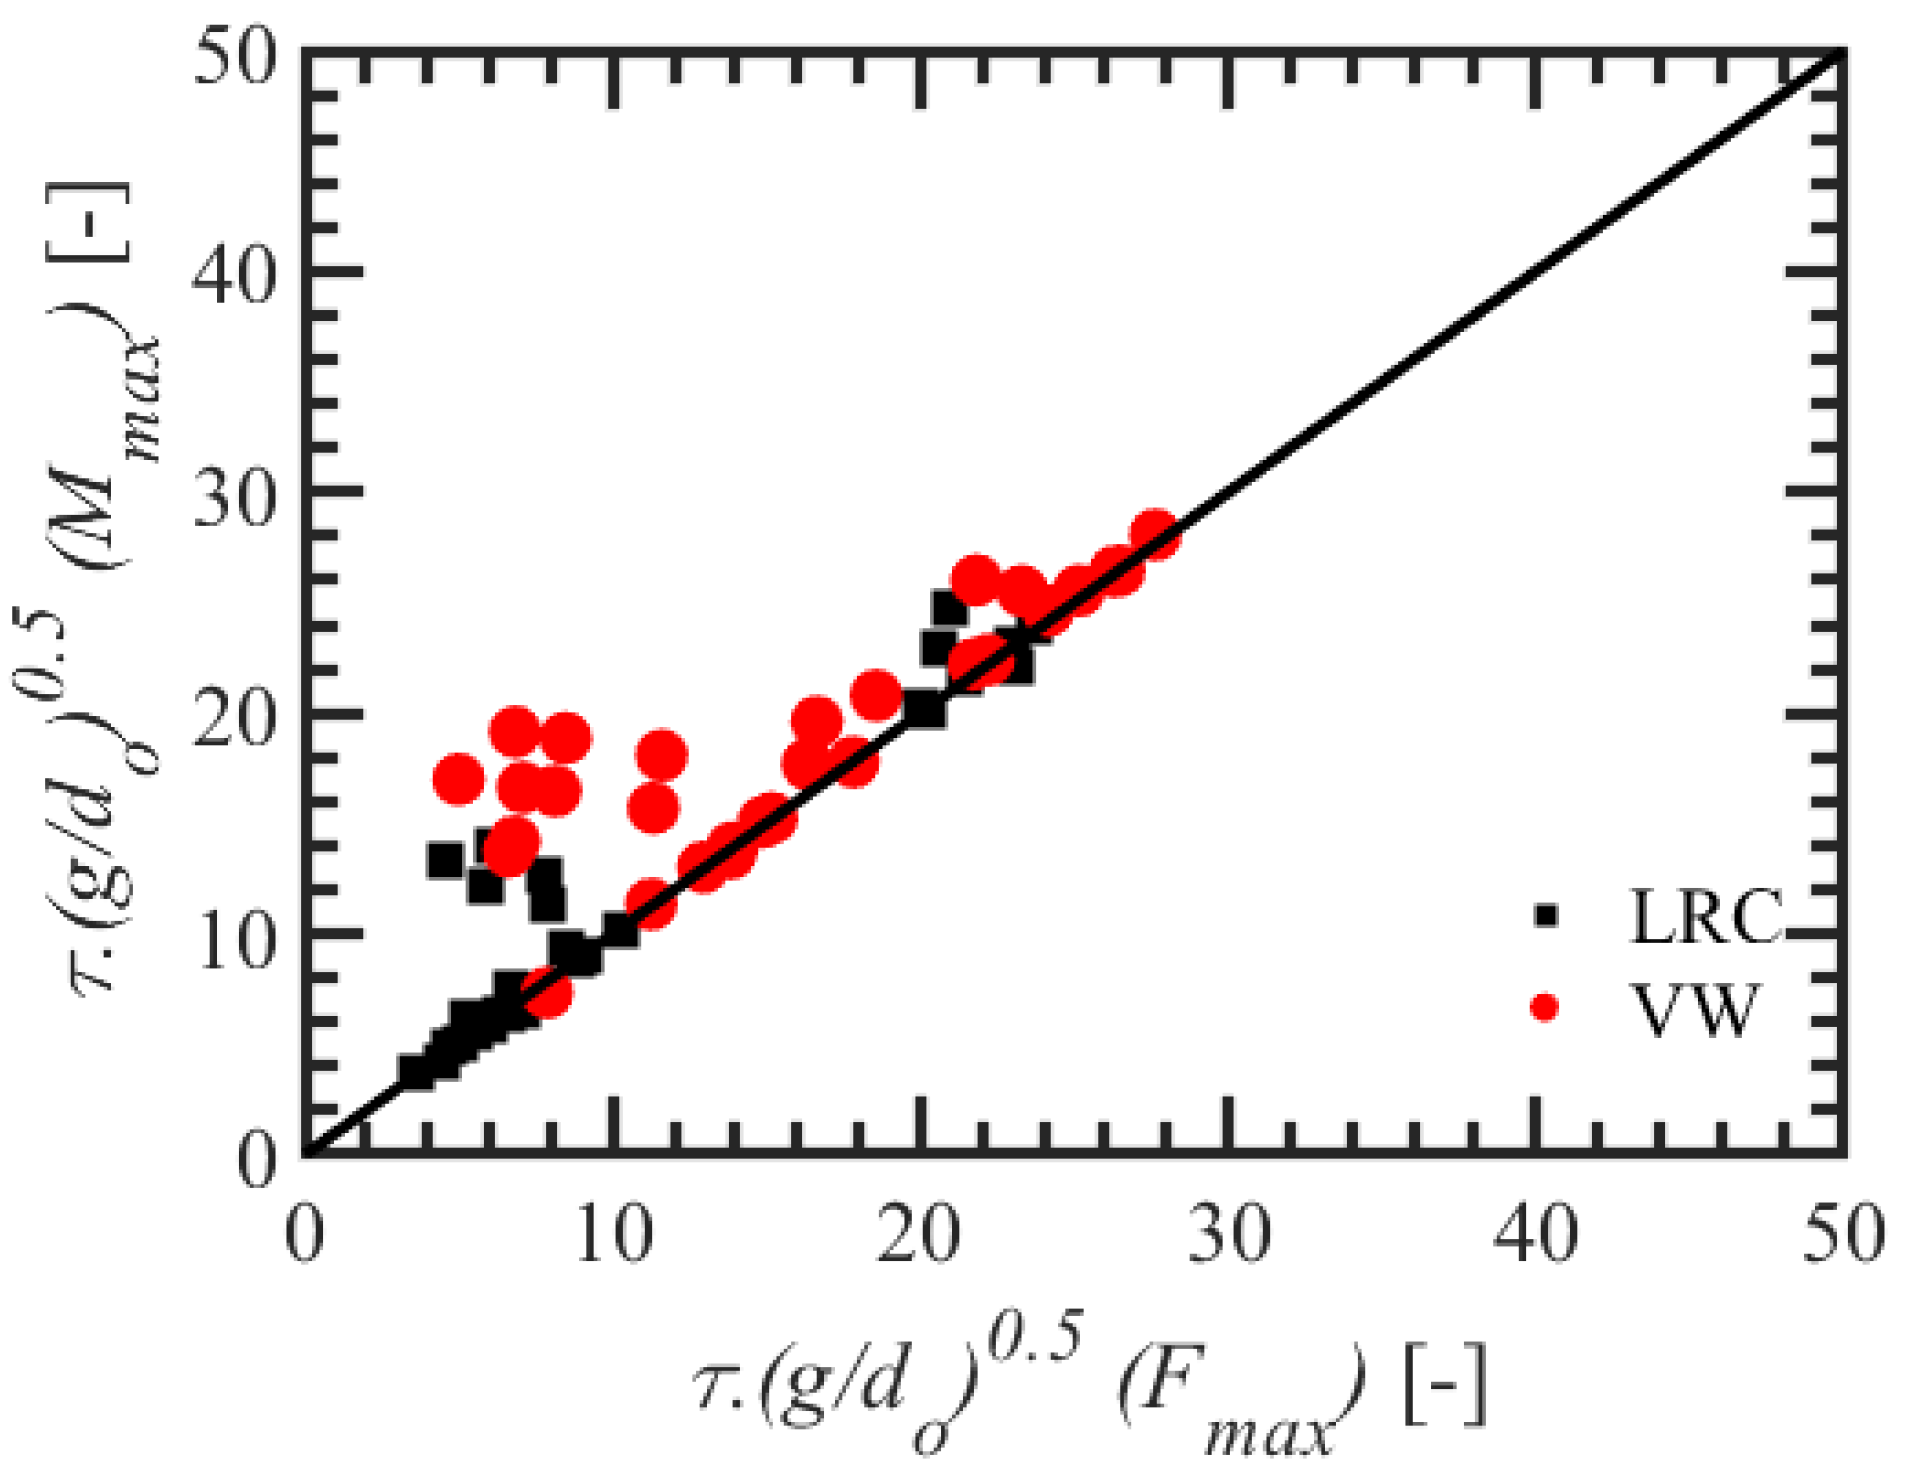
  • The time of maximum moment may not occur at the time of maximum force. Accurate estimation of the moment (Mn,max) is essential for applying Equations (6) and (7). For immediate application, Equations (6) and (7) are suggested with careful selection of Cd and Ln,A.
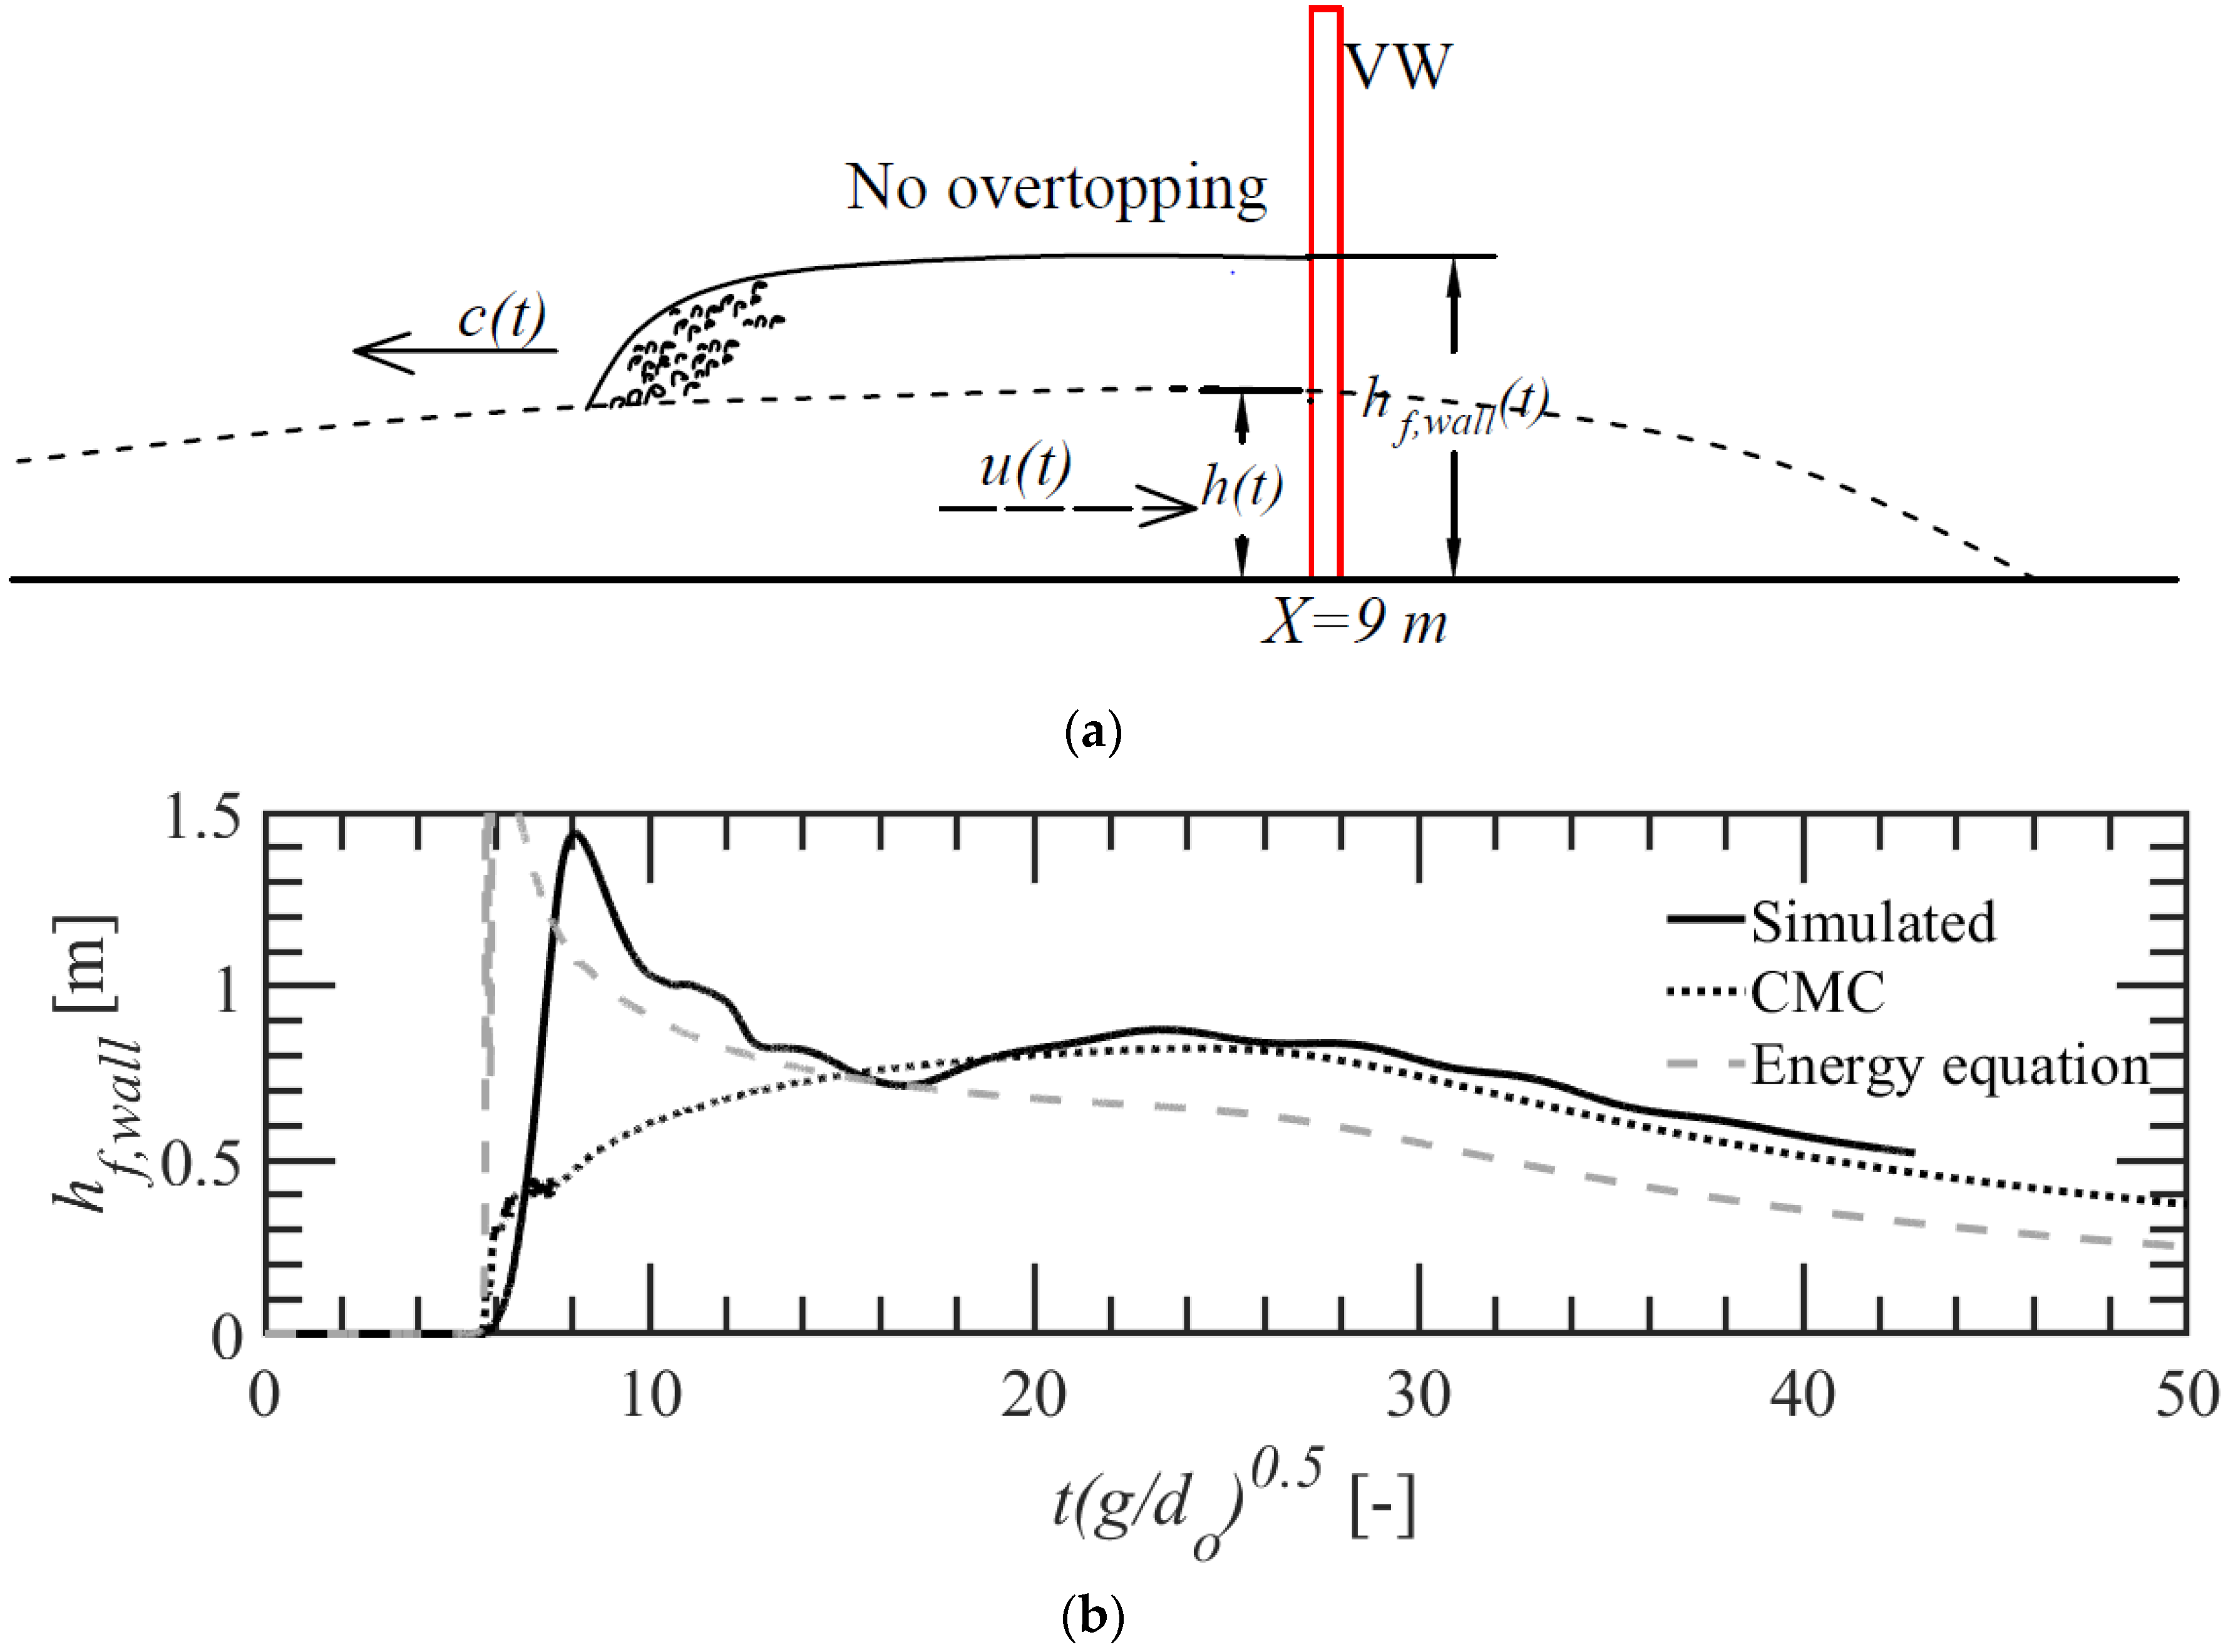
  • Finally, hf,wall prediction using conservation of mass and momentum equations (Equation (4)) helped in a clear understanding of the force and moment variation for both the LRC and the VW. Hence, we suggest that future research shall consider non-dimensionalizing the mitigation wall depth using Equation (4) for a better understanding of the physical process.
The above conclusions are derived based on a parametric study with dam break generated flows in a non-inclined flume for resembling tsunami inundation. To the best of the authors’ knowledge, there is still ongoing research on simulating a realistic tsunami bore in the laboratory (c.f., [96]) since the tsunami approaching the shore can be a non-breaking wave, a breaking bore, a hydraulic jump or an undular bore—c.f., [96,97,98]. Thus, there is randomness involved even in replicating a tsunami event in the laboratory or in the numerical simulations. The dam break approach used in the present study is commonly used in experimental tsunami studies since Chanson [57] proved that the bore front of a dam break profile resembles the inundation by a coastal tsunami sufficiently. Subsequently, many studies which focused on understanding the tsunami force reduction due to mitigation walls adopted the dam break setup in dry bed conditions without considering any bottom slopes- c.f., [44] [partial dam break] [29,32,33,37]. Thus, we followed a similar approach, thereby simulating a broken tsunami surge using dam-break. In the end, the force-depending parameters are the bore depth (h), the bore Froude number (Fr) and the momentum flux [81]. Hence, we non-dimensionalized the seawall height with respect to incoming bore depth ‘h’ and bore Froude number (Fr) in the form of hf,wall (i.e., hs/hf,wall), which enables us to estimate the force reduction if h and Fr are known for any incoming bore condition for a seawall height (hs). Exact modelling of tsunami bore might not be necessary for such a case. Numerically or theoretically, if researchers could predict the h and Fr (in the absence of a seawall and the structure) at the seawall location, our results can determine the force and momentum reduction on the inland building if a flat profile exists between the seawall and the buildings. Since Esteban et al. [40] did not observe variations in the overtopped surge depth due to variations in the bed roughness, our results can be used for any coastal region.
Overall, it can be safely argued that the seawall shape did not influence the forces on the inland structure during extreme events, despite the delay in the surge interaction time. Furthermore, it would be interesting to focus on trapezoidal dykes to understand force reduction in extreme conditions since the slope of the dykes helps in quicker overtopping than a VW, although Esteban et al. [39] did not observe much variation in the overtopped bore depth. In addition, although the impact was not the main concern for the present paper, the force–time history indicated that the LRC induces a plunging impact on the inland structure due to the surge recirculation and accumulation in front of the LRC. In contrast, in the case of a VW, during flow interaction, the splashed-up bore falls back offshore and landward by taking the shape of an Umbrella, thereby dissipating incident flow energy. This deteriorates the significance of recurve on a wall, although it offers significant protection against wave overtopping. A similar effect was observed in low-rise VW walls in the form of the “ramping effect” when the structure is located just behind the mitigation wall, agreeing with Crespo et al. [29] and Thomas and Cox [31], in which case the LRC performed comparatively better. In addition, significant aeration is expected during such a flow interaction process. In both experiments and numerical simulations, this aeration can introduce stochastic behavior to the impulsive force. Subsequently, additional uncertainties are generated with regard to the impulsive force and pressure assessment [34,35,99]. Furthermore, in such bore impact conditions, one could expect the scaling effect where the aeration effect cannot be neglected [36]. In such a case, the recent scaling strategy suggested by Ravindar et al. [34] (Cuomo-Froude method) might be a solution. On top of that, there are always some obstructions in the actual field between the structure and the mitigation wall, such as trees, debris, breakaway walls or bed roughness, which would also alter the flow physics in the initial impact stage. Hence, the necessity for impact load (or the impulsive load) discussion has not been considered. However, it would be interesting to understand the effect of the aforementioned hurdles in the surge impact load by conducting experiments or numerical simulations for practical field application. Finally, the simulations were carried out with the dam break surge for b/W = 0.3. Future research shall focus on varied b/W and different bore generation techniques over a wider range of Fr for verifying the momentum reduction ratio and the force reduction suggested in this study.
The present study highlighted the force and moment reduction due to the LRC and the VW. As a next step, we will focus on the flow characteristics of the overtopped surge and the forces on the mitigation wall in the overtopped condition. The force on the mitigation wall under different overtopping conditions will be a topic of interest for the LRC since field observation showed the failure of the mitigation wall due to considerable uplift at the overhang [100].

Author Contributions

Conceptualization, S.H., V.S., H.S. and S.A.S.; methodology, S.H. and V.S.; software, S.H.; validation, S.H.; formal analysis, S.H.; investigation, S.H.; resources, H.S.; data curation, S.H.; writing—original draft preparation, S.H.; writing—review and editing, V.S., H.S. and S.A.S.; supervision, V.S., H.S. and S.A.S.; project administration, V.S. and H.S.; funding acquisition, V.S. and H.S. All authors have read and agreed to the published version of the manuscript.

Funding

This work was carried out under partial funding from the DST-SERB project “Improved Design Perspective for Violent Wave Impacts during Extreme Natural Disaster Events (IDWavImp)”. This contribution also received partial funding by the German Research Foundation (Deutsche Forschungsgemeinschaft, DFG) for the project “Buffer blocks as wave energy dissipators (BB-WEnDis)” (SCHU 1054/21-1).

Institutional Review Board Statement

Not applicable.

Informed Consent Statement

Not applicable.

Data Availability Statement

The data presented in this study are available from the corresponding author upon reasonable request.

Acknowledgments

The first author is thankful to RWTH-IIT Madras Junior Research Fellowship and ABCD Future Environmental Leaders Scholarships awarded by the DAAD-funded “Global Water and Climate Adaptation Centre- Aachen, Bangkok, Chennai, Dresden (ABCD-Centre)” for the financial support to stay in IWW, RWTH Aachen University. The first author also thanks Jan Oetjen (IWW, RWTH Aachen) for the help in arranging the computational resources during the initial days. This work is contributed from the Center For Large scale Ocean Research (CFLOR), IITMadras. Simulations were performed with computing resources granted by RWTH Aachen University under project rwth0692.

Conflicts of Interest

The authors declare no conflict of interest.

Abbreviations

List of Symbols
bStructure width
b/WStructure width/flow channel width
BrOverhanging length of the recurve
CSurge front celerity
doImpoundment depth in the tank
ESummation of bore front velocity head and static head (i.e., Energy head)
FForces on the inland structure in the presence of the mitigation wall
FnForces on the inland structure in the absence of the mitigation wall
FmaxMaximum force on the inland structure in the presence of the mitigation wall
Fn,maxMaximum force on the inland structure in the absence of the mitigation wall
FrFroude number of the flow
FrbFroude number evaluated using the bore front celerity
gAcceleration due to gravity
hLocal time-varying inundation depth at any X
hbBore height at which the force on the inland structure is maximum
hfWater depth at the inland structure front
hf,wallBore height at the VW front in the non-overtopping condition
hmMaximum inundation depth at the mitigation wall location
hm1Maximum inundation depth at the inland structure location
HrHeight of the recurve
hrBore depth at the inland structure backside
hsHeight of the mitigation wall
LDistance between the inland structure and the mitigation wall
LALever arm obtained by dividing Mmax and Fmax
Ln,ALever arm obtained by dividing Mn,max and Fn,max
MThe overturning moment on the inland structure in the presence of the mitigation wall
MnThe overturning moment on the inland structure in the absence of the mitigation wall
MmaxThe maximum overturning moment on the inland structure in the presence of the mitigation wall
Mn,maxThe maximum overturning moment on the inland structure in the absence of the mitigation wall
PPressure at the structure front
tTime referenced with the tank opening
tDTime instant at the initial turbulent reflection phase
timTime of interaction of surge with the inland structure in the presence of the mitigation wall
tn,imTime of interaction of surge with the inland structure in the absence of the mitigation wall
uLocal time-varying velocity
WFlow channel width
xAxis along the length with origin at the origin of the tank
XLocal axis starting at the tank opening
yAxis in the vertical direction, along the height, with the origin at the bottom of the tank
YThe vertical height of the structure with origin at the bottom of the structure
zAxis in the horizontal direction along the width with the origin at the origin of the tank
αThe ratio of the height of the recurve and the height of the mitigation wall
ρThe density of the liquid
Definition of terms
2D wallVertical wall in the non-overtopping condition
CMCConservation of mass and momentum
FVMFinite Volume Method
LRCLarge ReCurve wall
OFOpenFOAM
RANSReynold’s Averaged Navier-Stokes Equations
StructureInland building model
VOFVolume of Fluid
VWVertical Wall

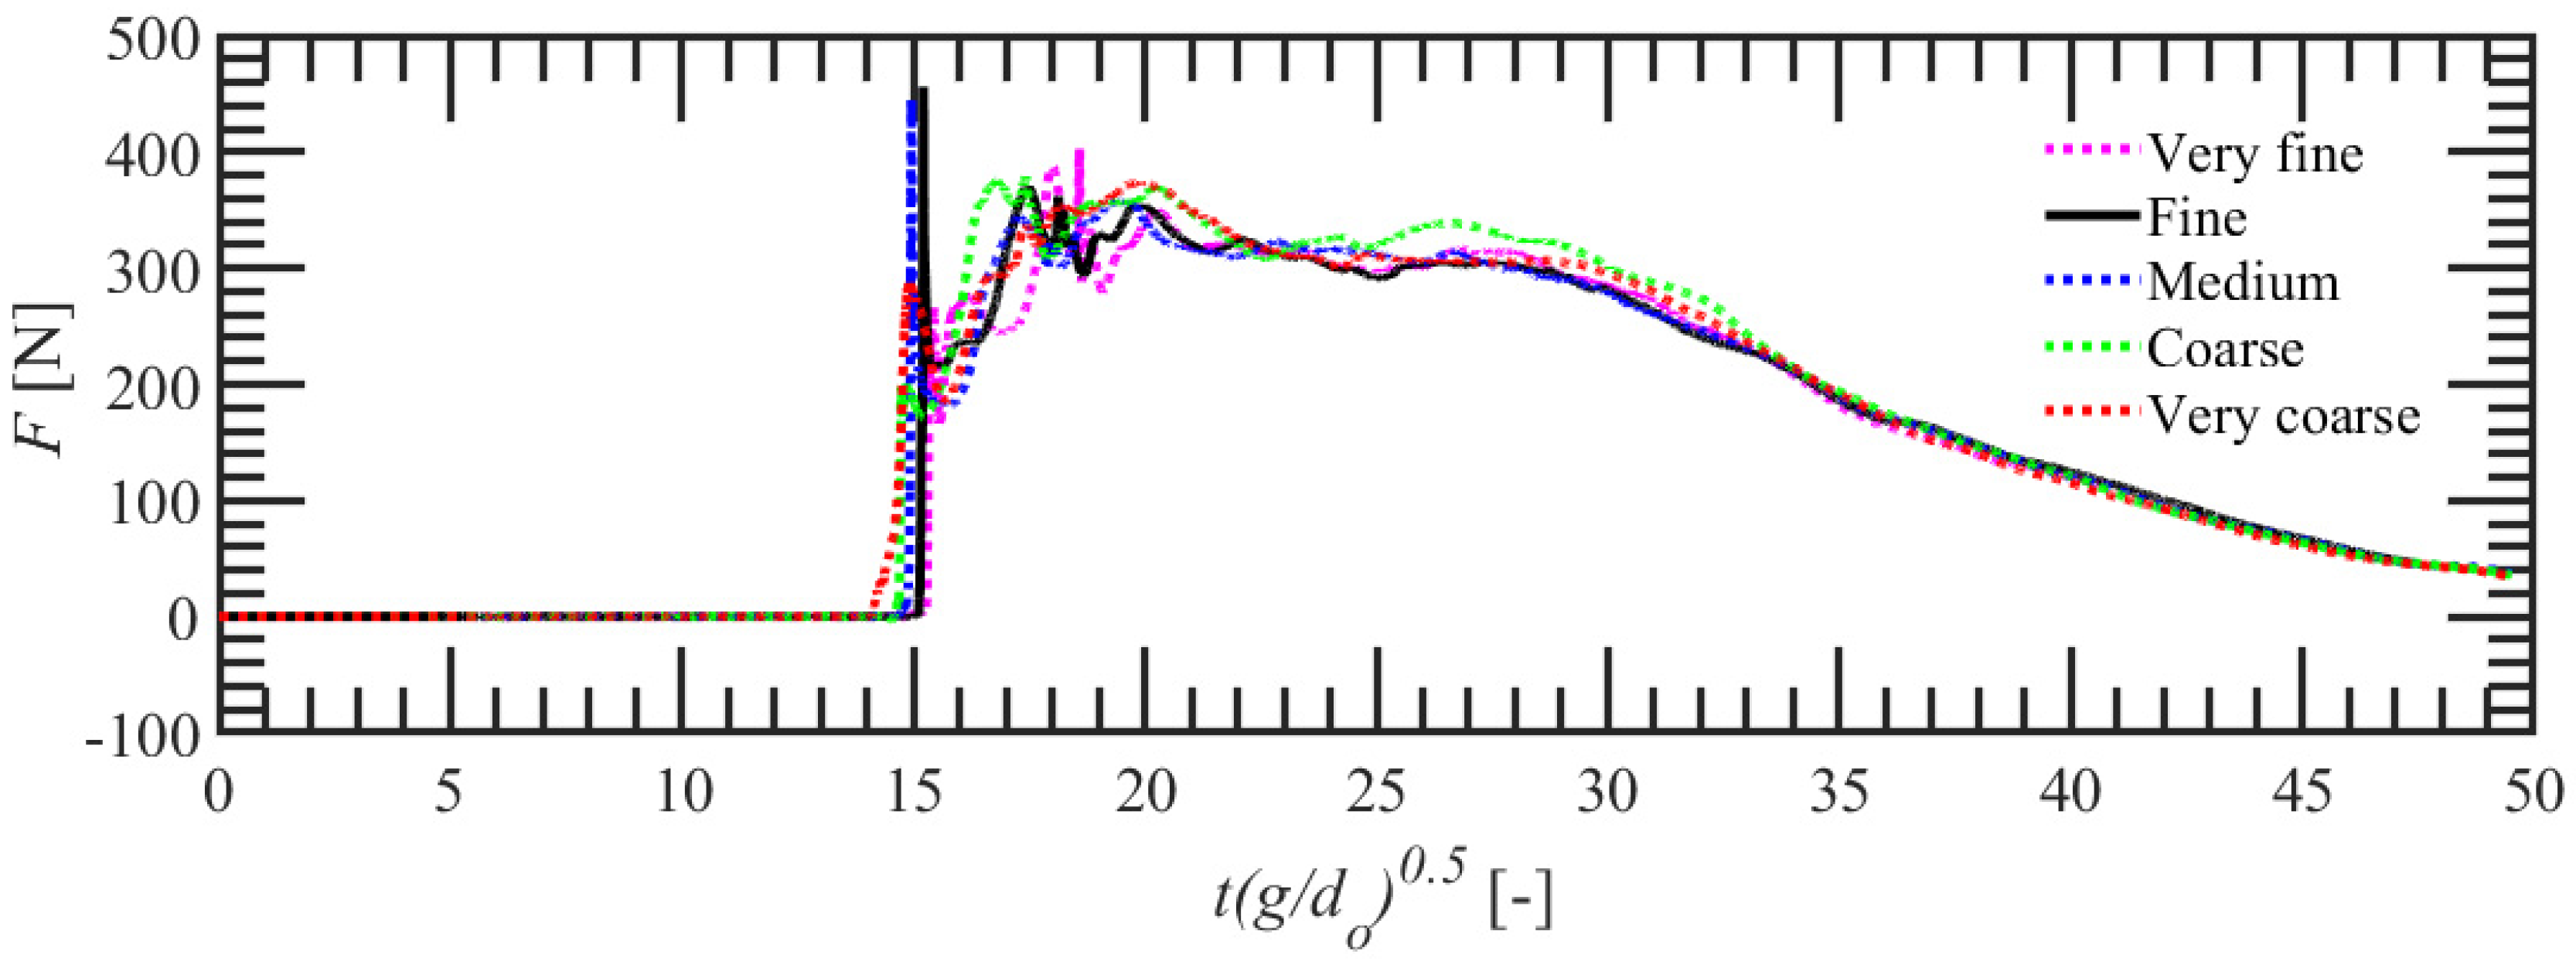
Appendix A. Sensitivity of the Mesh Density on the Forces on the Structure in the Presence of the Recurve

Since the numerical flume adopted for the parametric simulation is different from the validation domain, we attempted to ensure sufficient accuracy of the obtained results independently of the mesh density. Therefore, a mesh-sensitivity analysis has been carried out considering the complexity of the flow interaction with hs = 0.3136 (Wall 4) for an impoundment depth (do) in the dam break tank equal to 0.9 m. The numerical results for the force on the structure for different mesh densities are presented in Figure A1. Hereafter, “Fine” mesh refers to the mesh sizes explained in Section 2.2. The cell length along each direction is then further increased by 12.5% (medium setup), 25% (coarse setup), and 50% (very coarse setup), compared to the “Fine” mesh. For “Very fine” mesh setup, the cell length is reduced by 12.5% compared to the “Fine” mesh. Comparing the five mesh resolutions shows that the numerical simulation yields nearly the same results for “Medium” and “Fine” mesh resolutions during all force phases (see Section 3.2). Furthermore, the measured forces after the initial reflection phase remain approximately the same for all investigated mesh resolutions. However, the impulsive force did not follow any specific trend. The reason can be attributed to the turbulent aeration mix during the impact process. Nevertheless, our study mainly focuses on the maximum force after time instant “tD (i.e., after the initial reflection stage) for which the results portray independence of mesh density. Subsequently, further mesh refinements of the computational domain are unnecessary, and the chosen resolution (fine; see Section 2.2) proves to be suitable.
Figure A1. Effect of mesh density on the forces on the structure in the presence of the recurve wall (Wall 4) for do = 0.9 m at L = 1 m.
Water 14 01986 g0a1

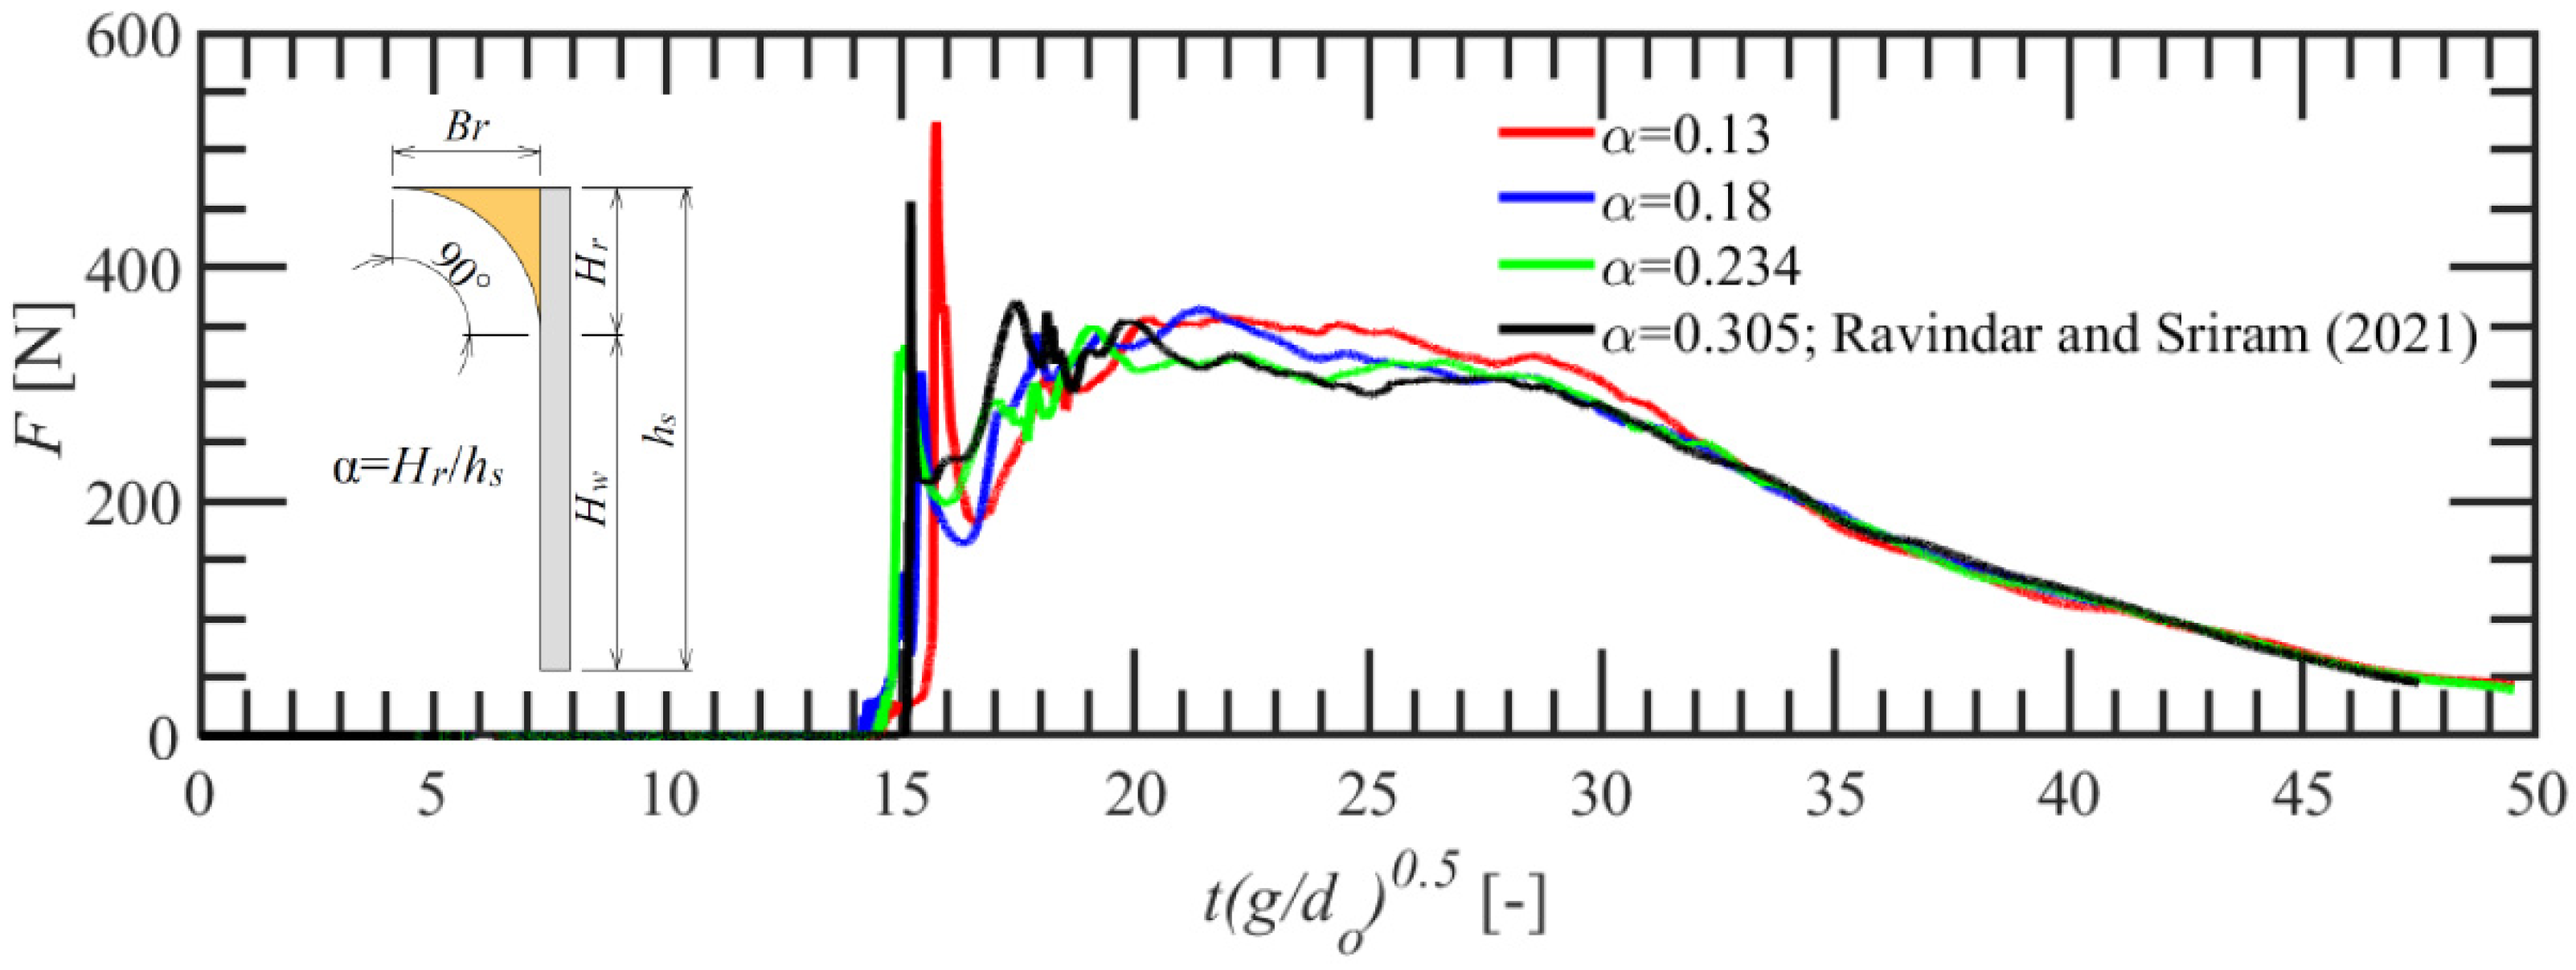
Appendix B. Effect of Recurve Size for an LRC on the Forces on the Land Structure

We attempted to investigate the influence of recurve size in the vertical wall on the forces on the structure. For this specific investigation, the numerical simulations were carried out with hs = 0.3136 (Wall 4) with an impoundment depth in the dam break tank equal to 0.9 m. The land structure was kept at 1 m behind the LRC. Figure A2 shows the force–time history for different α. The force profile shows that the structure initially experiences a very short duration impact force followed by the transition to quasi-static force. Ignoring the initial short duration impulsive force, the force profile looks similar for different recurve sizes in the transition and quasi-steady region. As observed, the impulsive force did not follow any specific trend in variation with α. The possible reason could be described in terms of turbulent aeration mix during the overtopping surge interaction with the inland structure [36], overtopping volume and the corresponding overtopped momentum flux [43,44]. In addition, as explained in our study, the LRC induces flow circulation at the structure front, inducing a significant disturbance in the overtopping surge. Furthermore, the impact load is also sensitive to the location of the land structure and the height of the recurve wall. Wüthrich et al. [86] also pointed out that the bed condition and roughness might play a significant role in impact force. Ignoring the impact phase, we observed that α played a minor role in the transition and quasi-static force conditions for these extreme overtopping conditions. Nevertheless, our discussions focused mainly on the transitions and the quasi-static force conditions; the influence of the impact phase requires separate investigation. Furthermore, designing a recurve wall with specific α is not clearly well-established; hence we carried out our simulation following the wave impact study from Stagnos et al. [14] and Ravindar and Sriram [13].
Figure A2. Effect of recurve size (α) on the forces acting on the leeward structure.
Water 14 01986 g0a2

References

  1. Castellino, M.; Sammarco, P.; Romano, A.; Martinelli, L.; Ruol, P.; Franco, L.; De Girolamo, P. Large impulsive forces on recurved parapets under non-breaking waves. A numerical study. Coast. Eng. 2018, 136, 1–15. [Google Scholar] [CrossRef]
  2. Goda, Y. Random Seas and Design of Maritime Structures, 3rd ed.; World Scientific: Hackensack, NJ, USA, 2010; ISBN 9789814282390. [Google Scholar]
  3. Veale, W.; Suzuki, T.; Verwaest, T.; Trouw, K.; Mertens, T. Integrated design of coastal protection works for Wenduine, Belgium. Coast. Eng. Proc. 2012, 1, 70. [Google Scholar] [CrossRef]
  4. Van Doorslaer, K.; De Rouck, J. Reduction on wave overtopping on a smooth dike by means of a parapet. Coast. Eng. Proc. 2011, 1, 6. [Google Scholar] [CrossRef] [Green Version]
  5. Allsop, W.; Alderson, J.; Chapman, A. Defending buildings and people against wave overtopping. Coast. Struct. 2007, 2, 1253–1262. [Google Scholar]
  6. Kortenhaus, A.; Haupt, R.; Oumeraci, H. Design aspects of vertical walls with steep foreland slopes. In Breakwaters. Coastal Structures and Coastlines: Proceedings of the International Conference Organized by the Institution of Civil Engineers and Held in London, UK on 26–28 September 2001; Thomas Telford: Overdale, UK, 2001; pp. 26–28. [Google Scholar]
  7. Cornett, A.; Li, Y.; Budvietas, A. Wave overtopping at chamfered and overhanging vertical structures. In Proceedings of the Workshop on Natural Disasters by Storm Waves and Their Reproduction in Experimental Basins, Kyoto, Japan, 14 December 1999. [Google Scholar]
  8. Murakami, K.; Irie, I.; Kamikubo, Y. Experiments on a Non-Wave Overtopping Type Seawall. Coast. Eng. Proc. 1996, 1, 25. [Google Scholar]
  9. Banyard, L.; Herbert, D.M. The Effect of Wave Angle on the Overtopping of Seawalls; Report SR396; HR Wallingford: Wallingford, UK, 1995. [Google Scholar]
  10. Owen, M.; Steele, A. Effectiveness of Recurved Wave Return Walls; HR Wallingford: Wallingford, UK, 1993. [Google Scholar]
  11. Heimbaugh, M.S.; Grace, P.J.; Ahrens, J.P.; Davidson, D.D. Coastal Engineering Studies in Support of Virginia Beach, Virginia, Beach Erosion Control and Hurricane Protection Project. Report 1. Physical Model Tests of Irregular Wave Overtopping and Pressure Measurements; US Army Corps of Engineers, WES: Vicksburg, MT, USA, 1988. [Google Scholar]
  12. Thorn, R.B.; Roberts, A.G. Sea Defense and Coast Protection Works; Thomas Telford Ltd.: London, UK, 1981; pp. 115–121, 179–183. [Google Scholar]
  13. Ravindar, R.; Sriram, V. Impact pressure and forces on a vertical wall with different types of parapet. J. Mar. Sci. Eng. 2021, 147, 04021007. [Google Scholar] [CrossRef]
  14. Stagonas, D.; Ravindar, R.; Sriram, V.; Schimmels, S. Experimental Evidence of the Influence of Recurves on Wave Loads at Vertical Seawalls; Gottfried Wilhelm Leibniz Universität Hannover; Technische Informationsbibliothek (TIB): Hannover, Germany, 2020. [Google Scholar]
  15. Martinelli, L.; Ruol, P.; Volpato, M.; Favaretto, C.; Castellino, M.; De Girolamo, P.; Franco, L.; Romano, A.; Sammarco, P. Experimental investigation on non-breaking wave forces and overtopping at the recurved parapets of vertical breakwaters. Coast. Eng. 2018, 141, 52–67. [Google Scholar] [CrossRef]
  16. Ravindar, R.; Sriram, V.; Schimmels, S.; Stagonas, D. Characterization of breaking wave impact on vertical wall with recurve. ISH J. Hydraul. Eng. 2019, 25, 153–161. [Google Scholar] [CrossRef]
  17. Frandsen, J.B.; Tremblay, O.G.; Xhardé, R. Preliminary investigations of wave impact on vertical walls with/without parapets and toe protection on deformable beach. In Proceedings of the 6th International Conference on the Application of Physical Modelling in Coastal and Port Engineering and Science (Coastlab16), Ottawa, ON, Canada, 10–13 May 2016. [Google Scholar]
  18. Blackmore, P.A.; Hewson, P.J. Experiments on full-scale wave impact pressures. Coast. Eng. 1984, 8, 331–346. [Google Scholar] [CrossRef]
  19. Manual, E. EurOtop-Wave Overtopping of Sea Defenses and Related Structures. An Overtopping Manual Largely Based on European Research, but for Worldwide Application, 320; EurOtop: Glendale, CA, USA, 2018. [Google Scholar]
  20. De Chowdhury, S.; Anand, K.V.; Sannasiraj, S.A.; Sundar, V. Nonlinear wave interaction with curved front seawalls. Ocean. Eng. 2017, 140, 84–96. [Google Scholar] [CrossRef]
  21. Anand, K.V.; Sundar, V.; Sannasiraj, S.A. Dynamic pressures on curved front seawall models under random waves. J. Hydrodyn. Ser. B 2010, 22, 538–544. [Google Scholar] [CrossRef]
  22. Anand, K.V.; Sundar, V. Comparison of Pressures Due to Random Waves on Vertical and Curved Seawalls. ISH J. Hydraul. Eng. 2010, 16 (Suppl. S1), 26–34. [Google Scholar] [CrossRef]
  23. Kanda, J. Consideration for effective height of sea walls against tsunami. Struct. Infrastruct. Eng. 2016, 12, 484–489. [Google Scholar] [CrossRef]
  24. Tsuji, Y.; Satake, K.; Ishibe, T.; Harada, T.; Nishiyama, A.; Kusumoto, S. Tsunami heights along the pacific coast of northern Honshu recorded from the 2011 Tohoku and previous great earthquakes. Pure Appl. Geophys. 2011, 171, 3183–3215. [Google Scholar] [CrossRef] [Green Version]
  25. Chock, G.; Carden, L.; Robertson, I.; Olsen, M.; Yu, G. Tohoku tsunami-induced building failure analysis with implications for U.S. tsunami and seismic design codes. Earthq. Spectra 2013, 29 (Suppl. S1), 99–126. [Google Scholar] [CrossRef]
  26. Oetjen, J.; Sundar, V.; Venkatachalam, S.; Reicherter, K.; Engel, M.; Schüttrumpf, H.; Sannasiraj, S.A. A comprehensive review on structural tsunami countermeasures. Nat. Hazards 2022, 1–31. [Google Scholar] [CrossRef]
  27. Lukkunaprasit, P.; Ruangrassamee, A. Building damage in Thailand in the 2004 Indian Ocean tsunami and clues for tsunami-resistant design. IES J. Part A Civ. Struct. Eng. 2008, 1, 17–30. [Google Scholar] [CrossRef]
  28. Dalrymple, R.A.; Kriebel, D.L. Lessons in engineering from the tsunami in Thailand. Bridge-Wash.-Natl. Acad. Eng. 2005, 35, 4–13. [Google Scholar]
  29. Crespo, A.J.C.; Gómez-Gesteira, M.; Dalrymple, R.A. 3D SPH simulation of large waves mitigation with a dike. J. Hydraul. Res. 2007, 45, 631–642. [Google Scholar] [CrossRef]
  30. Oshnack, M.E.; van de Lindt, J.; Gupta, R.; Cox, D.; Aguíñiga, F. Effectiveness of small onshore seawall in reducing forces induced by Tsunami bore: Large scale experimental study. J. Disaster Res. 2009, 4, 382–390. [Google Scholar] [CrossRef]
  31. Thomas, S.; Cox, D. Influence of finite-length seawalls for tsunami loading on coastal structures. J. Water Port. Coast. Ocean Eng. 2012, 138, 203–214. [Google Scholar] [CrossRef]
  32. Rahman, S.; Akib, S.; Khan, M.T.R.; Shirazi, S.M. Experimental study on tsunami risk reduction on coastal building fronted by sea wall. Struct. Infrastruct. Eng. 2014, 2014, 729357. [Google Scholar] [CrossRef] [PubMed]
  33. Al-Faesly, T.; Palermo, D.; Nistor, I.; Cornett, A. Experimental modeling of extreme hydrodynamic forces on structural models. Int. J. Prot. Struct. 2012, 3, 477–505. [Google Scholar] [CrossRef]
  34. Ravindar, R.; Sriram, V.; Schimmels, S.; Stagonas, D. Approaches in Scaling Small-Scale Experiments on the Breaking Wave Interactions with a Vertical Wall Attached with Recurved Parapets. J. Water Port. Coast. Ocean Eng. 2021, 147, 04021034. [Google Scholar] [CrossRef]
  35. Istrati, D. Large-Scale Experiments of Tsunami Inundation of Bridges Including Fluid-Structure-Interaction. Ph.D. Thesis, University of Nevada, Reno, NV, USA, 2017. [Google Scholar]
  36. Bullock, G.N.; Obhrai, C.; Peregrine, D.H.; Bredmose, H. Violent breaking wave impacts. Part 1: Results from large-scale regular wave tests on vertical and sloping walls. Coast. Eng. 2007, 54, 602–617. [Google Scholar] [CrossRef]
  37. Triatmadja, R.; Nurhasanah, A. Tsunami force on buildings with openings and protection. J. Earthq. Tsunami 2012, 6, 1250024. [Google Scholar] [CrossRef] [Green Version]
  38. Arimitsu, T.; Kawasaki, K. Development of estimation method of tsunami wave pressure exerting on land structure using depth-integrated flow model. Coast. Eng. J. 2016, 58, 1640021. [Google Scholar] [CrossRef] [Green Version]
  39. Esteban, M.; Glasbergen, T.; Takabatake, T.; Hofland, B.; Nishizaki, S.; Nishida, Y.; Stolle, J.; Nistor, I.; Bricker, J.; Takagi, H.; et al. Overtopping of coastal structures by tsunami waves. Geosciences 2017, 7, 121. [Google Scholar] [CrossRef] [Green Version]
  40. Esteban, M.; Roubos, J.J.; Iimura, K.; Salet, J.T.; Hofland, B.; Bricker, J.; Ishii, H.; Hamano, G.; Takabatake, T.; Shibayama, T. Effect of bed roughness on tsunami bore propagation and overtopping. Coast. Eng. 2020, 157, 103539. [Google Scholar] [CrossRef]
  41. Asakura, R.; Iwase, K.; Ikeya, T.; Takao, M.; Kaneto, T.; Fujii, N.; Ohmori, M. The tsunami wave force acting on land structures. In Coastal Engineering 2002: Solving Coastal Conundrums; World Scientific: Singapore, 2002; pp. 1191–1202. [Google Scholar]
  42. Sakakiyama, T. Tsunami pressure on structures due to tsunami inundation flow. Coast. Eng. Proc. 2014, 1, 42. [Google Scholar] [CrossRef] [Green Version]
  43. Prabu, P.; Bhallamudi, S.M.; Chaudhuri, A.; Sannasiraj, S.A. Numerical investigations for mitigation of tsunami wave impact on onshore buildings using sea dikes. Ocean Eng. 2019, 187, 106159. [Google Scholar] [CrossRef]
  44. Xu, Z.; Melville, B.; Whittaker, C.; Nandasena, N.A.K.; Shamseldin, A. Mitigation of tsunami bore impact on a vertical wall behind a barrier. Coast. Eng. 2021, 164, 103833. [Google Scholar] [CrossRef]
  45. Harish, S.; Saincher, S.; Sriram, V.; Schüttrumpf, H.; Sannasiraj, S.A. Numerical investigation of tsunami-like bore induced forces on overtopped buildings. In Proceedings of the OCEANS 2022-Chennai 2022, Chennai, India, 21–24 February 2022; pp. 1–7. [Google Scholar] [CrossRef]
  46. Asadollahi, N.; Nistor, I.; Mohammadian, A. Numerical investigation of tsunami bore effects on structures, part I: Drag coefficients. Nat. Hazards 2019, 96, 285–309. [Google Scholar] [CrossRef]
  47. Sarjamee, S. Numerical investigation of the influence of extreme hydrodynamic forces on the geometry of structures using OpenFOAM. Natural Hazards 2017, 87, 217–235. [Google Scholar] [CrossRef]
  48. Xiang, T.; Istrati, D.; Yim, S.C.; Buckle, I.G.; Lomonaco, P. Tsunami loads on a representative coastal bridge deck: Experimental study and validation of design equations. J. Water Port. Coast. Ocean Eng. 2020, 146, 04020022. [Google Scholar] [CrossRef]
  49. Istrati, D.; Hasanpour, A.; Buckle, I. Numerical Investigation of Tsunami-Borne Debris Damming Loads on a Coastal Bridge. In Proceedings of the 17 World Conference on Earthquake Engineering, Sendai, Japan, 13–18 September 2020; Volume 27. [Google Scholar]
  50. Sriram, V.; Ma, Q.W. Review on the local weak form-based meshless method (MLPG): Developments and Applications in Ocean Engineering. Appl. Ocean Res. 2021, 116, 102883. [Google Scholar] [CrossRef]
  51. Sriram, V.; Ma, Q.W. Improved MLPG_R method for simulating 2D interaction between violent waves and elastic structures. J. Comput. Phys. 2012, 231, 7650–7670. [Google Scholar] [CrossRef]
  52. Saincher, S.; Sriram, V. An efficient operator-split CICSAM scheme for three-dimensional multiphase-flow problems on Cartesian grids. Comput. Fluids 2022, 240, 105440. [Google Scholar] [CrossRef]
  53. Hasanpour, A.; Istrati, D.; Buckle, I. Coupled SPH–FEM Modeling of Tsunami-Borne Large Debris Flow and Impact on Coastal Structures. J. Mar. Sci. Eng. 2021, 9, 1068. [Google Scholar] [CrossRef]
  54. Luo, M.; Khayyer, A.; Lin, P. Particle methods in ocean and coastal engineering. Appl. Ocean Res. 2021, 114, 102734. [Google Scholar] [CrossRef]
  55. Pringgana, G.; Cunningham, L.S.; Rogers, B.D. Influence of orientation and arrangement of structures on Tsunami impact forces: Numerical investigation with smoothed particle hydrodynamics. J. Water Port. Coast. Ocean Eng. 2021, 147, 04021006. [Google Scholar] [CrossRef]
  56. Ishii, H.; Takabatake, T.; Esteban, M.; Stolle, J.; Shibayama, T. Experimental and numerical investigation on tsunami run-up flow around coastal buildings. Coast. Eng. J. 2021, 63, 485–503. [Google Scholar] [CrossRef]
  57. Chanson, H. Tsunami surges on dry coastal plains: Application of dam break wave equations. Coast. Eng. J. 2006, 48, 355–370. [Google Scholar] [CrossRef] [Green Version]
  58. Nouri, Y.; Nistor, I.; Palermo, D.; Cornett, A. Experimental investigation of tsunami impact on free standing structures. Coast. Eng. J. 2010, 52, 43–70. [Google Scholar] [CrossRef]
  59. Harish, S.; Sriram, V.; Sundar, V.; Sannasiraj, S.A.; Didenkulova, I. Impact of Flow-Driven Debris on Coastal Structure During Tsunami Bore. In Proceedings of the Fourth International Conference in Ocean Engineering; Springer: Singapore, 2018; pp. 315–326. [Google Scholar]
  60. Molines, J.; Bayón, A.; Gómez-Martín, M.E.; Medina, J.R. Numerical Study of Wave Forces on Crown Walls of Mound Breakwaters with Parapets. J. Mar. Sci. and Eng. 2020, 8, 276. [Google Scholar] [CrossRef]
  61. Bricker, J.D.; Nakayama, A. Contribution of trapped air, deck superelevation, and nearby structures to bridge deck failure during a tsunami. J. Hydraul. Eng. 2014, 140, 05014002. [Google Scholar] [CrossRef]
  62. Ritter, A. Die fortpflanzung der wasserwellen. Z. Des Ver. Dtsch. Ing. 1892, 36, 947–954. [Google Scholar]
  63. Fritz, H.M.; Phillips, D.A.; Okayasu, A.; Shimozono, T.; Liu, H.; Mohammed, F.; Skanavis, V.; Synolakis, C.E.; Takahashi, T. The 2011 Japan tsunami current velocity measurements from survivor videos at Kesennuma Bay using LiDAR. Geophys. Res. Lett. 2012, 39, L00G23. [Google Scholar] [CrossRef]
  64. Matsutomi, H.; Shuto, N.; Imamura, F.; Takahashi, T. Field survey of the 1996 Irian Jaya earthquake tsunami in Biak Island. Nat. Hazards 2001, 24, 199–212. [Google Scholar] [CrossRef]
  65. Fritz, H.M.; Borrero, J.C.; Synolakis, C.E.; Yoo, J. 2004 Indian Ocean tsunami flow velocity measurements from survivor videos. Geophys. Res. Lett. 2006, 33, L24605. [Google Scholar] [CrossRef]
  66. Matsutomi, H.; Okamoto, K. Inundation flow velocity of tsunami on land. Island Arc 2010, 19, 443–457. [Google Scholar] [CrossRef]
  67. Jaffe, B.E.; Goto, K.; Sugawara, D.; Richmond, B.M.; Fujino, S.; Nishimura, Y. Flow speed estimated by inverse modeling of sandy tsunami deposits: Results from the 11 March 2011 tsunami on the coastal plain near the Sendai Airport, Honshu, Japan. Sediment. Geol. 2011, 282, 90–109. [Google Scholar] [CrossRef]
  68. ASCE7-16 (Structural Engineering Institute). Minimum Design Loads for Buildings and Other Structures; ASCE/SEI 7-16; Structural Engineering Institute: Reston, VA, USA, 2016; Volume A, pp. 7–16. [Google Scholar]
  69. Wüthrich, D.; Pfister, M.; Nistor, I.; Schleiss, A.J. Experimental study on the hydrodynamic impact of tsunami-like waves against impervious free-standing buildings. Coast. Eng. J. 2018, 60, 180–199. [Google Scholar] [CrossRef]
  70. Cross, R.H., III. Tsunami surge forces. J. Waterw. Harb. Div. 1967, 93, 201–231. [Google Scholar] [CrossRef]
  71. Ramsden, J.D.; Raichlen, F. Forces on vertical wall caused by incident bores. J. Water Port. Coast. Ocean Eng. 1990, 116, 592–613. [Google Scholar] [CrossRef]
  72. Arnason, H.; Petroff, C.; Yeh, H. Tsunami bore impingement onto a vertical column. J. Disaster Res. 2009, 4, 391–403. [Google Scholar] [CrossRef]
  73. Robertson, I.N.; Paczkowski, K.; Riggs, H.R.; Mohamed, A. Experimental investigation of tsunami bore forces on vertical walls. J. Offsh. Mech. Arct. Eng. 2013, 135, 021601. [Google Scholar] [CrossRef]
  74. Kihara, N.; Niida, Y.; Takabatake, D.; Kaida, H.; Shibayama, A.; Miyagawa, Y. Large-scale experiments on tsunami-induced pressure on a vertical tide wall. Coast. Eng. 2015, 99, 46–63. [Google Scholar] [CrossRef]
  75. Ko, H.T.S.; Yeh, H. On the splash-up of tsunami bore impact. Coast. Eng. 2018, 131, 1–11. [Google Scholar] [CrossRef]
  76. Kihara, N.; Arikawa, T.; Asai, T.; Hasebe, M.; Ikeya, T.; Inoue, S.; Kaida, H.; Matsutomi, H.; Nakano, Y.; Okuda, Y.; et al. A physical model of tsunami inundation and wave pressures for an idealized coastal industrial site. Coast. Eng. 2021, 169, 103970. [Google Scholar] [CrossRef]
  77. Cumberbatch, E. The impact of a water wedge on a wall. J. Fluid Mech. 1960, 7, 353–374. [Google Scholar] [CrossRef]
  78. Nakamura, S.; Tsuchiya, Y. On the Shock Pressure of Surge on a Wall; Bulletin of the Disaster Prevention Research Institute: Kyoto, Japan, 1973; pp. 3–4. [Google Scholar]
  79. Shen, J.; Wei, L.; Wu, D.; Liu, H.; Huangfu, J. pressure on a vertical wall. Coast. Eng. J. 2020, 62, 566–581. [Google Scholar] [CrossRef]
  80. Shafiei, S.; Melville, B.W.; Shamseldin, A.Y. Experimental investigation of tsunami bore impact force and pressure on a square prism. Coast. Eng. 2016, 110, 1–16. [Google Scholar] [CrossRef]
  81. Harish, S.; Sriram, V.; Schüttrumpf, H.; Sannasiraj, S.A. Tsunami-like flow induced force on the structure: Prediction formulae for the horizontal force in quasi-steady flow phase. Coast. Eng. 2021, 168, 103938. [Google Scholar] [CrossRef]
  82. Ikeya, T.; Suenaga, S.; Fukuyama, T.; Akiyama, Y.; Suzuki, N.; Tateno, T. Evaluation method of tsunami wave force acting on land structures considering reflection properties. J. JSCE Ser. B2 2015, 72, 985–990. [Google Scholar]
  83. Istrati, D.; Buckle, I.; Lomonaco, P.; Yim, S. Deciphering the tsunami wave impact and associated connection forces in open-girder coastal bridges. J. Mar. Sci. Eng. 2018, 6, 148. [Google Scholar] [CrossRef] [Green Version]
  84. Fujima, K.; Achmad, F.; Shigihara, Y.; Mizutani, N. Estimation of tsunami force acting on rectangular structures. J. Disaster Res. 2009, 4, 404–409. [Google Scholar] [CrossRef]
  85. Xie, P.; Chu, V.H. The forces of tsunami waves on a vertical wall and on a structure of finite width. Coast. Eng. 2019, 149, 65–80. [Google Scholar] [CrossRef]
  86. Wüthrich, D.; Pfister, M.; Schleiss, A.J. Effect of bed roughness on tsunami-like waves and induced loads on buildings. Coast. Eng. 2019, 152, 103508. [Google Scholar] [CrossRef]
  87. Ikeya, T.; Iwamae, N.; Suenaga, S.; Akiyama, Y.; Tateno, T.; Suzuki, N. The evaluation model of tsunami wave force acting on columnar body considering pressure distribution. J. Jpn. Soc. Civ. Eng. Ser. B3 2014, 70, I_396–I_401. (In Japanese) [Google Scholar]
  88. Harish, S.; Sriram, V.; Schüttrumpf, H.; Sannasiraj, S.A. Tsunami-like flow induced forces on the structure: Dependence of the hydrodynamic force coefficients on Froude number and flow channel width in quasi-steady flow phase. Coast. Eng. 2022, 172, 104078. [Google Scholar] [CrossRef]
  89. Foster, A.S.J.; Rossetto, T.; Allsop, W. An experimentally validated approach for evaluating tsunami inundation forces on rectangular buildings. Coast. Eng. 2017, 128, 44–57. [Google Scholar] [CrossRef]
  90. Qi, Z.X.; Eames, I.; Johnson, E.R. Force acting on a square cylinder fixed in a free-surface channel flow. J. Fluid Mech. 2014, 756, 716–727. [Google Scholar] [CrossRef] [Green Version]
  91. Applied Technology Council, National Earthquake Hazards Reduction Program (US); National Tsunami Hazard Mitigation Program (US). Guidelines for Design of Structures for Vertical Evacuation from Tsunamis; US Department of Homeland Security, FEMA: Washington, DC, USA, 2012.
  92. Ikeya, T.; Akiyama, Y.; Iwamae, N. On the hydraulic mechanism of sustained tsunami wave pressure acting on land structures. J. JSCE B 2 2013, 69, I_816–I_820. (In Japanese) [Google Scholar]
  93. Kihara, N.; Kaida, H. An application of semi-empirical physical model of tsunami-bore pressure on buildings. Front. Built Environ. 2019, 5, 3. [Google Scholar] [CrossRef]
  94. Rivière, N.; Vouaillat, G.; Launay, G.; Mignot, E. Emerging obstacles in supercritical open-channel flows: Detached hydraulic jump versus wall-jet-like bow wave. J. Hydraul. Eng. 2017, 143, 04017011. [Google Scholar] [CrossRef] [Green Version]
  95. Heller, V. Scale effects in physical hydraulic engineering models. J. Hydraul. Res. 2011, 49, 293–306. [Google Scholar] [CrossRef]
  96. Chandler, I.; Allsop, W.; Robinson, D.; Rossetto, T. Evolution of pneumatic Tsunami Simulators–from concept to proven experimental technique. Front. Built Environ. 2021, 7, 86. [Google Scholar] [CrossRef]
  97. Sriram, V.; Didenkulova, I.; Sergeeva, A.; Schimmels, S. Tsunami evolution and run-up in a large scale experimental facility. Coast. Eng. 2016, 111, 1–12. [Google Scholar] [CrossRef]
  98. Shuto, N. The Nihonkai-Chubu earthquake tsunami on the North Akita coast. Coast. Eng. Jpn. 1985, 28, 255–264. [Google Scholar] [CrossRef]
  99. Peregrine, D.H.; Bredmose, H.; Bullock, G.; Obrhai, C.; Müller, G.; Wolters, G. Water wave impact on walls and the role of air. Coast. Eng. 2004, 4, 4005–4017. [Google Scholar] [CrossRef]
  100. Jayaratne, M.P.; Premaratne, B.; Adewale, A.; Mikami, T.; Matsuba, S.; Shibayama, T.; Esteban, M.; Nistor, I. Failure mechanisms and local scour at coastal structures induced by tsunami. Coast. Eng. J. 2016, 58, 1640017. [Google Scholar] [CrossRef] [Green Version]
Figure 1. (a) Numerical wave tank showing the plan view of the mitigation wall and the structure; (b) sectional view of the mitigation wall (VW); (c) comparison of experimental and numerically estimated force.
Water 14 01986 g001aWater 14 01986 g001b
Figure 2. Snapshots of the surge interaction with the structure obtained from OF for Al-Faesly et al. (2012) domain: (a) time = 1.8 s (Impact phase); (b) time = 2.8 s (run-up phase); (c) time = 6.0 s (quasi-steady phase).
Water 14 01986 g002
Figure 3. Schematics of the computational domain (Not to scale).
Water 14 01986 g003
Figure 4. Schematics of a Large ReCurve wall (LRC).
Water 14 01986 g004
Figure 5. (a) Comparison of simulated non-dimensional surge front profile with the theoretical solution of Ritter (1892) at the location of mitigation wall (X = 9 m) in its absence; (b) Froude number of the simulated surge at X = 9 m; (c) Non-dimensionalized momentum flux of the simulated surge at X = 9 m. Red indicates do = 0.6 m and black indicates do = 0.9 m. Solid lines indicate simulation results, and the dashed line indicates Ritter’s [62] solution.
Water 14 01986 g005
Figure 6. Force, overturning moment and pressure characteristics in the absence of a mitigation wall for do = 0.9 at X = 10 m: (a) force and moment–time history (black solid line, force; black dotted line, calculated hydrostatic force; red solid line, overturning moment; dashed lines indicate the time at peak); (b) pressure time history at different levels from the structure bottom at the structure center; (c) pressure distribution at different time steps (solid line-at Fn,max (black) and Mn,max (red)).
Water 14 01986 g006aWater 14 01986 g006b
Figure 7. Surge interaction process in the absence of a mitigation wall. The numbers in the images represent the distance in the x-direction from the tank origin in meters: (a) impact phase (t(g/do)0.5 = 9.57); (b) initial reflection phase (t(g/do)0.5 = 12.05); (c) transition phase (t(g/do)0.5 = 18.48); time of Fn,max; (d) near-hydrostatic transition phase (t(g/do)0.5 = 25.08); time of Mn,max; (e) choked quasi-steady phase (t(g/do)0.5 = 35.0).
Water 14 01986 g007
Figure 8. Comparison of time of maximum force and time of maximum moment. (Black represents do = 0.9 m, and red represents do = 0.6 m). τ = (t− tn, im), where t n,im refers to the time of interaction of surge with the structure.
Water 14 01986 g008
Figure 9. Force time history for do = 0.9 m at three locations.
Water 14 01986 g009
Figure 10. Flow interaction with the inland structure at different time instances in the presence of an LRC for do = 0.9 m, L = 1 m and Wall 4. (Ux-Surge velocity in the x-direction in m/s; P- pressure in N/m2). Vectors are colored with pressure, and the free surface is colored with Ux. The numbers in the images represent the distance in the x-direction from the tank origin in meters: (a) t(g/do)0.5 = 7.92; (b) t(g/do)0.5 = 14.19; (c) t(g/do)0.5 = 15.35 (tC); (d) t(g/do)0.5 = 17.49 (tD); (e) t(g/do)0.5 = 25.58 (tE).
Water 14 01986 g010aWater 14 01986 g010b
Figure 11. Flow interaction with the inland structure at different time instances in the presence of a VW do = 0.9 m, L = 1 m and Wall 4. (Ux-Surge velocity in the x-direction in m/s; P- pressure in N/m2). Vectors are colored with pressure, and the free surface is colored with Ux. The numbers in the images represent the distance in the x-direction from the tank origin in meters: (a) t(g/do)0.5 = 7.92; (b) t(g/do)0.5 = 9.57; (c) t(g/do)0.5 = 11.06 (tC); (d) t(g/do)0.5 = 12.71 (tD); (e) t(g/do)0.5 = 25.58 (tE).
Water 14 01986 g011aWater 14 01986 g011b
Figure 12. (a) Force acting on the inland structure in the presence of a mitigation wall (Wall 4; L = 1 m and do = 0.9 m); (b) moment–time history; (c) pressure distribution over structure depth. The flow interaction presented in Figure 10 and Figure 11 at different time steps is also marked. The solid red line in Figure 12c represents the hydrostatic pressure calculated with bore depth at the structure front at time instant ‘tE’ mentioned in Figure 12a.
Water 14 01986 g012
Figure 13. The combined effect of hs/hm and L on the forces on the inland structure for Wall 1: (do = 0.9 m); (a) L = 1 m; and (b) L = 2 m.
Water 14 01986 g013
Figure 14. Time of impact in LRC and VW (black—do = 0.9 m and red—do = 0.6 m).
Water 14 01986 g014
Figure 15. Effect of L in the horizontal force variation (black—do = 0.9 m and red—do = 0.6 m).
Water 14 01986 g015
Figure 16. (a) Typical bore interaction process with a VW in non-overtopping conditions. The dashed line indicates flow representation in the absence of a VW; (b) comparison of water depth at the mitigation wall (VW) upstream; simulated and predicted with CMC (Equation (4)) and Energy equation (h + u2/2g); test case presented: do = 0.9 m at X = 9 m.
Water 14 01986 g016
Figure 17. Effect of the height of the mitigation wall in force on the inland structure (black—do = 0.9 m and red—do = 0.6 m). The solid line portrays a linear reduction, while the dotted line portrays a 10% force increment from the linear reduction (upper bound).
Water 14 01986 g017
Figure 18. Comparison of time of maximum force and time of maximum moment in the presence of a mitigation wall. (Black squares represents the LRC, and red circles represents the VW). τ = (t − tim).
Water 14 01986 g018
Figure 19. Effect of L in the overturning moment variation.
Water 14 01986 g019
Figure 20. Effect of the height of the mitigation wall in the overturning moment variation on the inland structure.
Water 14 01986 g020
Figure 21. Pressure distribution at the structure front at the time of maximum moment for the LRC and the VW for do = 0.9 m and L = 2 m.
Water 14 01986 g021
Table 1. Simulation protocol.
LRCVW
do (m)Nomenclaturehs (m)
(Model)
hs/hm (-)hs/hf,wall (-)L = 1 mL = 2 mL = 3 mL = 1 mL = 2 mL = 3 m
With building0.9 000---
0.9Wall 10.13330.530.16
0.9Wall 20.18090.720.22
0.9Wall 30.24120.960.29
0.9Wall 40.31361.240.38
0.9Wall 50.38361.520.47
0.9Wall 60.45831.820.56
0.9Wall 70.62.380.73--
0.6 000---
0.6Wall 10.13330.790.24
0.6Wall 20.18091.080.32
0.6Wall 30.24121.440.43
Without building
(free flow simulation)
0.9
0.6
Table 2. The drag coefficient for the building model in the absence of the mitigation wall.
L1 m2 m3 m
do
0.9 m1.671.681.68
0.6 m1.831.811.80
Table 3. Froude number in the absence of the mitigation wall and building at the time of Fn,max.
L1 m2 m3 m
do
0.9 m2.3932.522.58
0.6 m2.112.02.03
Table 4. Lever arm (Ln,A/hm1) for experiments without mitigation wall.
L1 m2 m3 m
do
0.9 m0.830.840.85
0.6 m0.860.920.94
Publisher’s Note: MDPI stays neutral with regard to jurisdictional claims in published maps and institutional affiliations.

