3.1. Dimensionless Characterization of Ozone and β-CD Dynamics
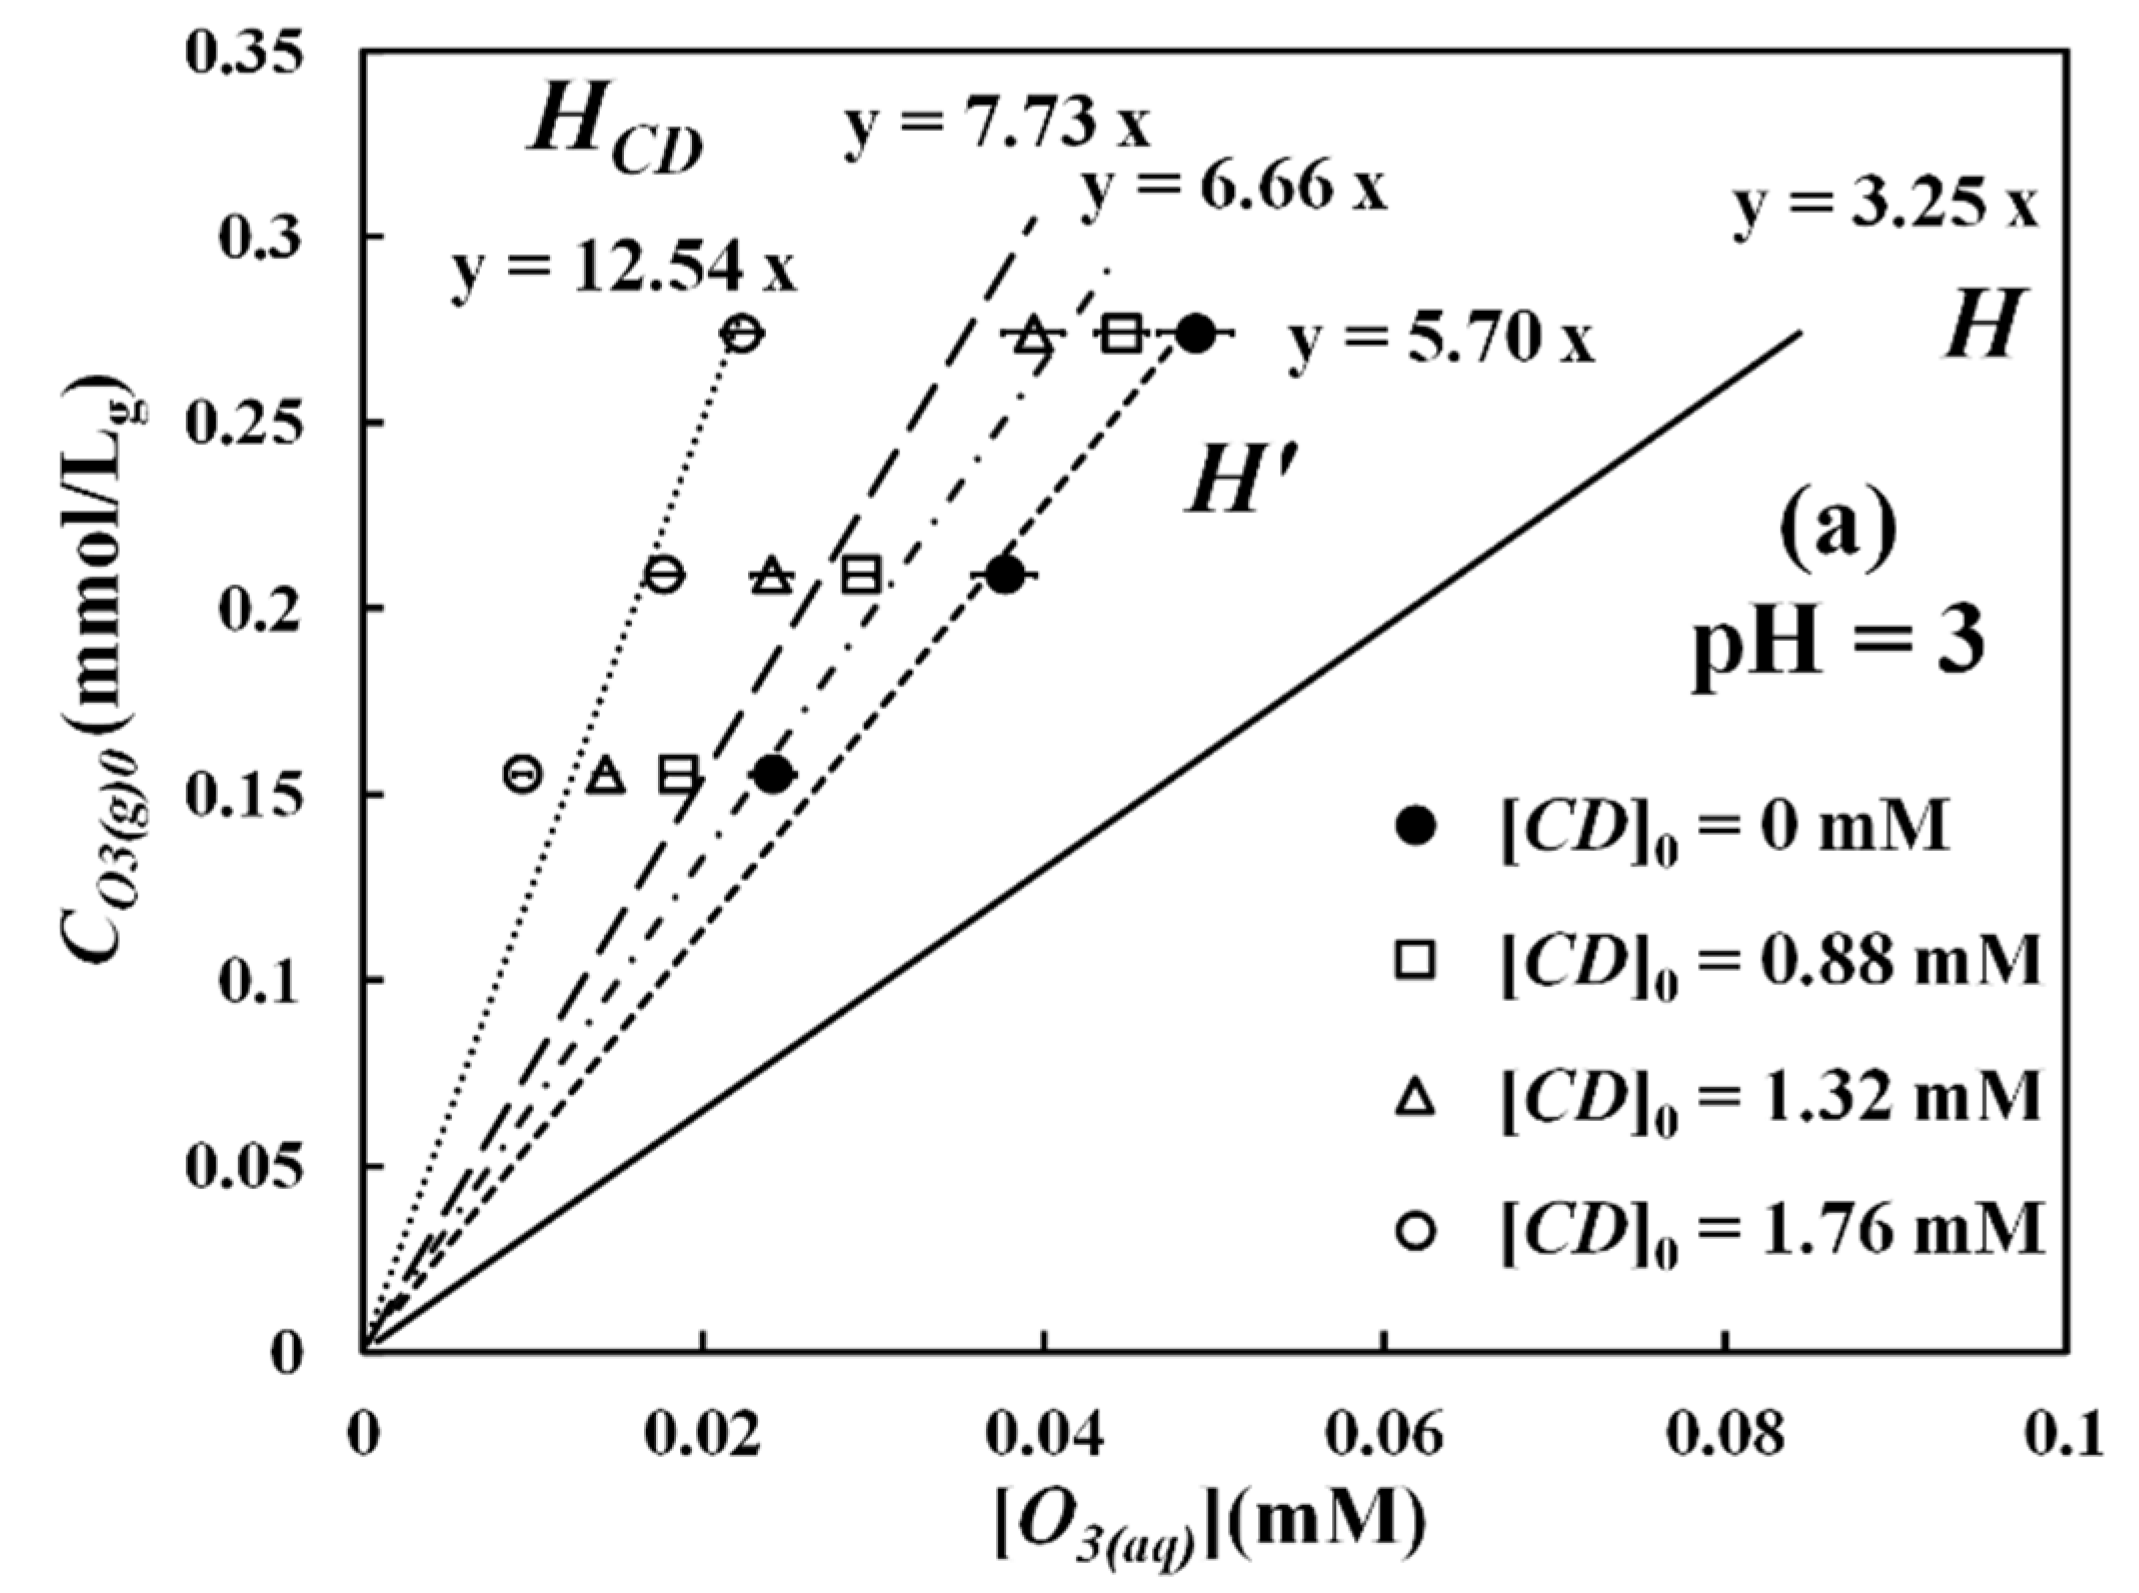
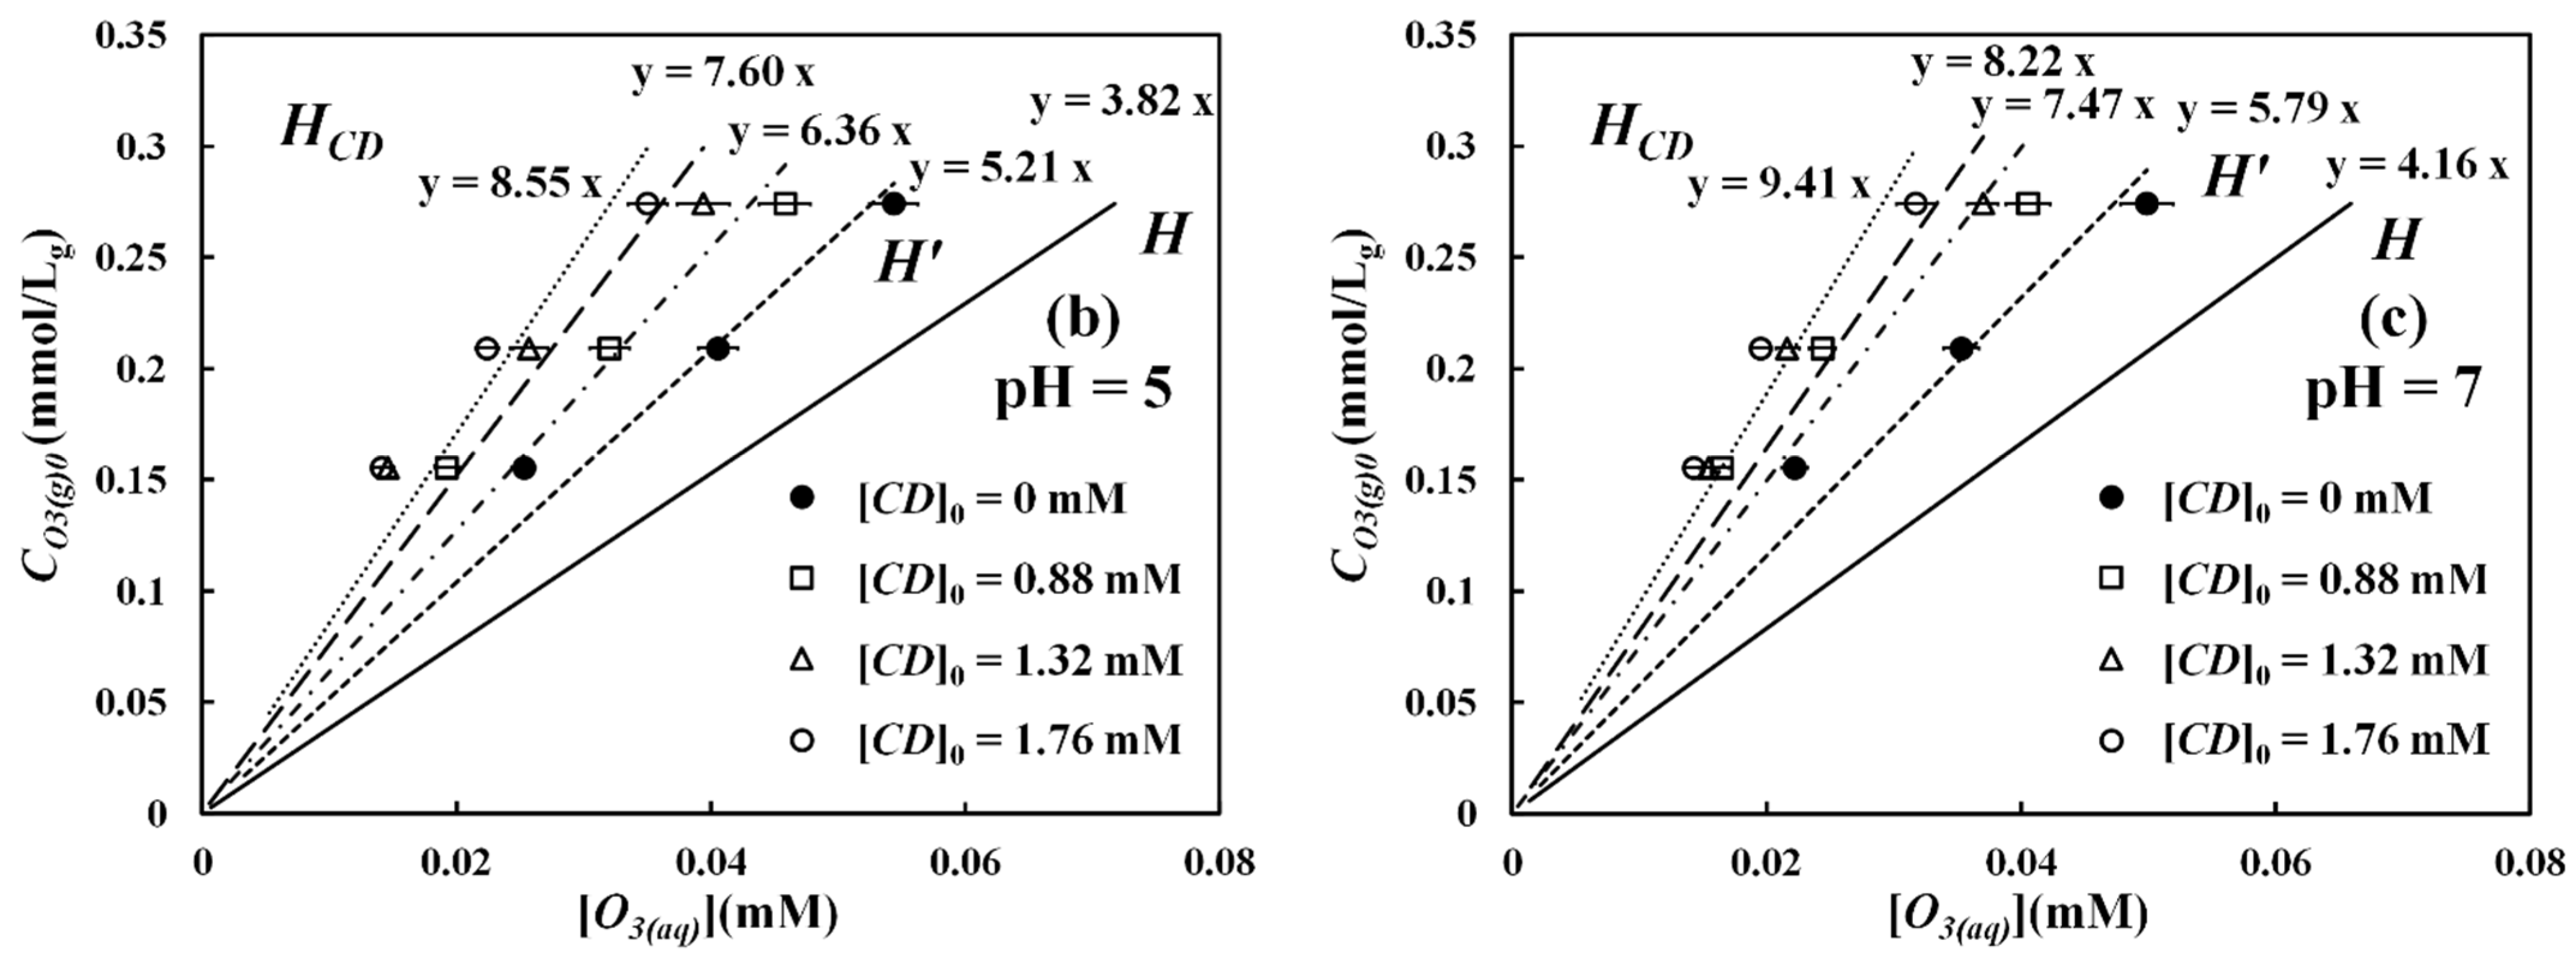
Figure 1 shows the experimental relationships between gaseous ozone (
) (0.155, 0.209, and 0.274 mmol/L
g) and aqueous ozone
concentrations in dynamic equilibrium in the gas-absorption batch reactor under various CD dosages (
) (0.88 mM, 1.36 mM, and 1.76 mM) at pH 3, 5, and 7. The solid lines in the figure represent the theoretical equilibrium relationship, estimated from the dimensionless Henry’s constant (H) [
36], defined as
where
stands for the solubility of the aqueous ozone at a specific pH value. As can be seen in
Figure 1, from the data of pure water ([CD]
0 = 0 mM), the equilibrium aqueous concentration (
) is between 57–73% of the aqueous ozone solubility. This degree of ozone saturation in the solution is defined as
With this definition, the slope of the regression line in
Figure 1 with respect to pure water can be represented by
as
When β-CD is present in the system, from
Figure 1, it can be seen that the linear relationship between the gaseous (
) and aqueous ozone (
) also exists. Their slopes become steeper as the β-CD concentrations increase. Here, we further define another parameter
as
Here,
β is called the relative degree of saturation and represents the ratio of equilibrium ozone concentration in the O
3-βCD solution to the ozone concentration in pure water. According to
Figure 1a, the
values in pH 3 roughly range between 0.45 and 0.85 in our reactor system. The slope of the line in
Figure 1 when β-CD is present is actually an empirical parameter since chemical reactions are involved. Analogously, this slope can be defined as
Since both
α and
β values are less than unity, the values of
are thus greater than the values of
and
mathematically. A steeper slope or a larger
value at a higher β-CD dosage implies that when there is more β-CD in the solution, the equilibrium dissolved ozone concentration (
) becomes lower. In fact, ozone is known to degrade and mineralize CDs to various degrees [
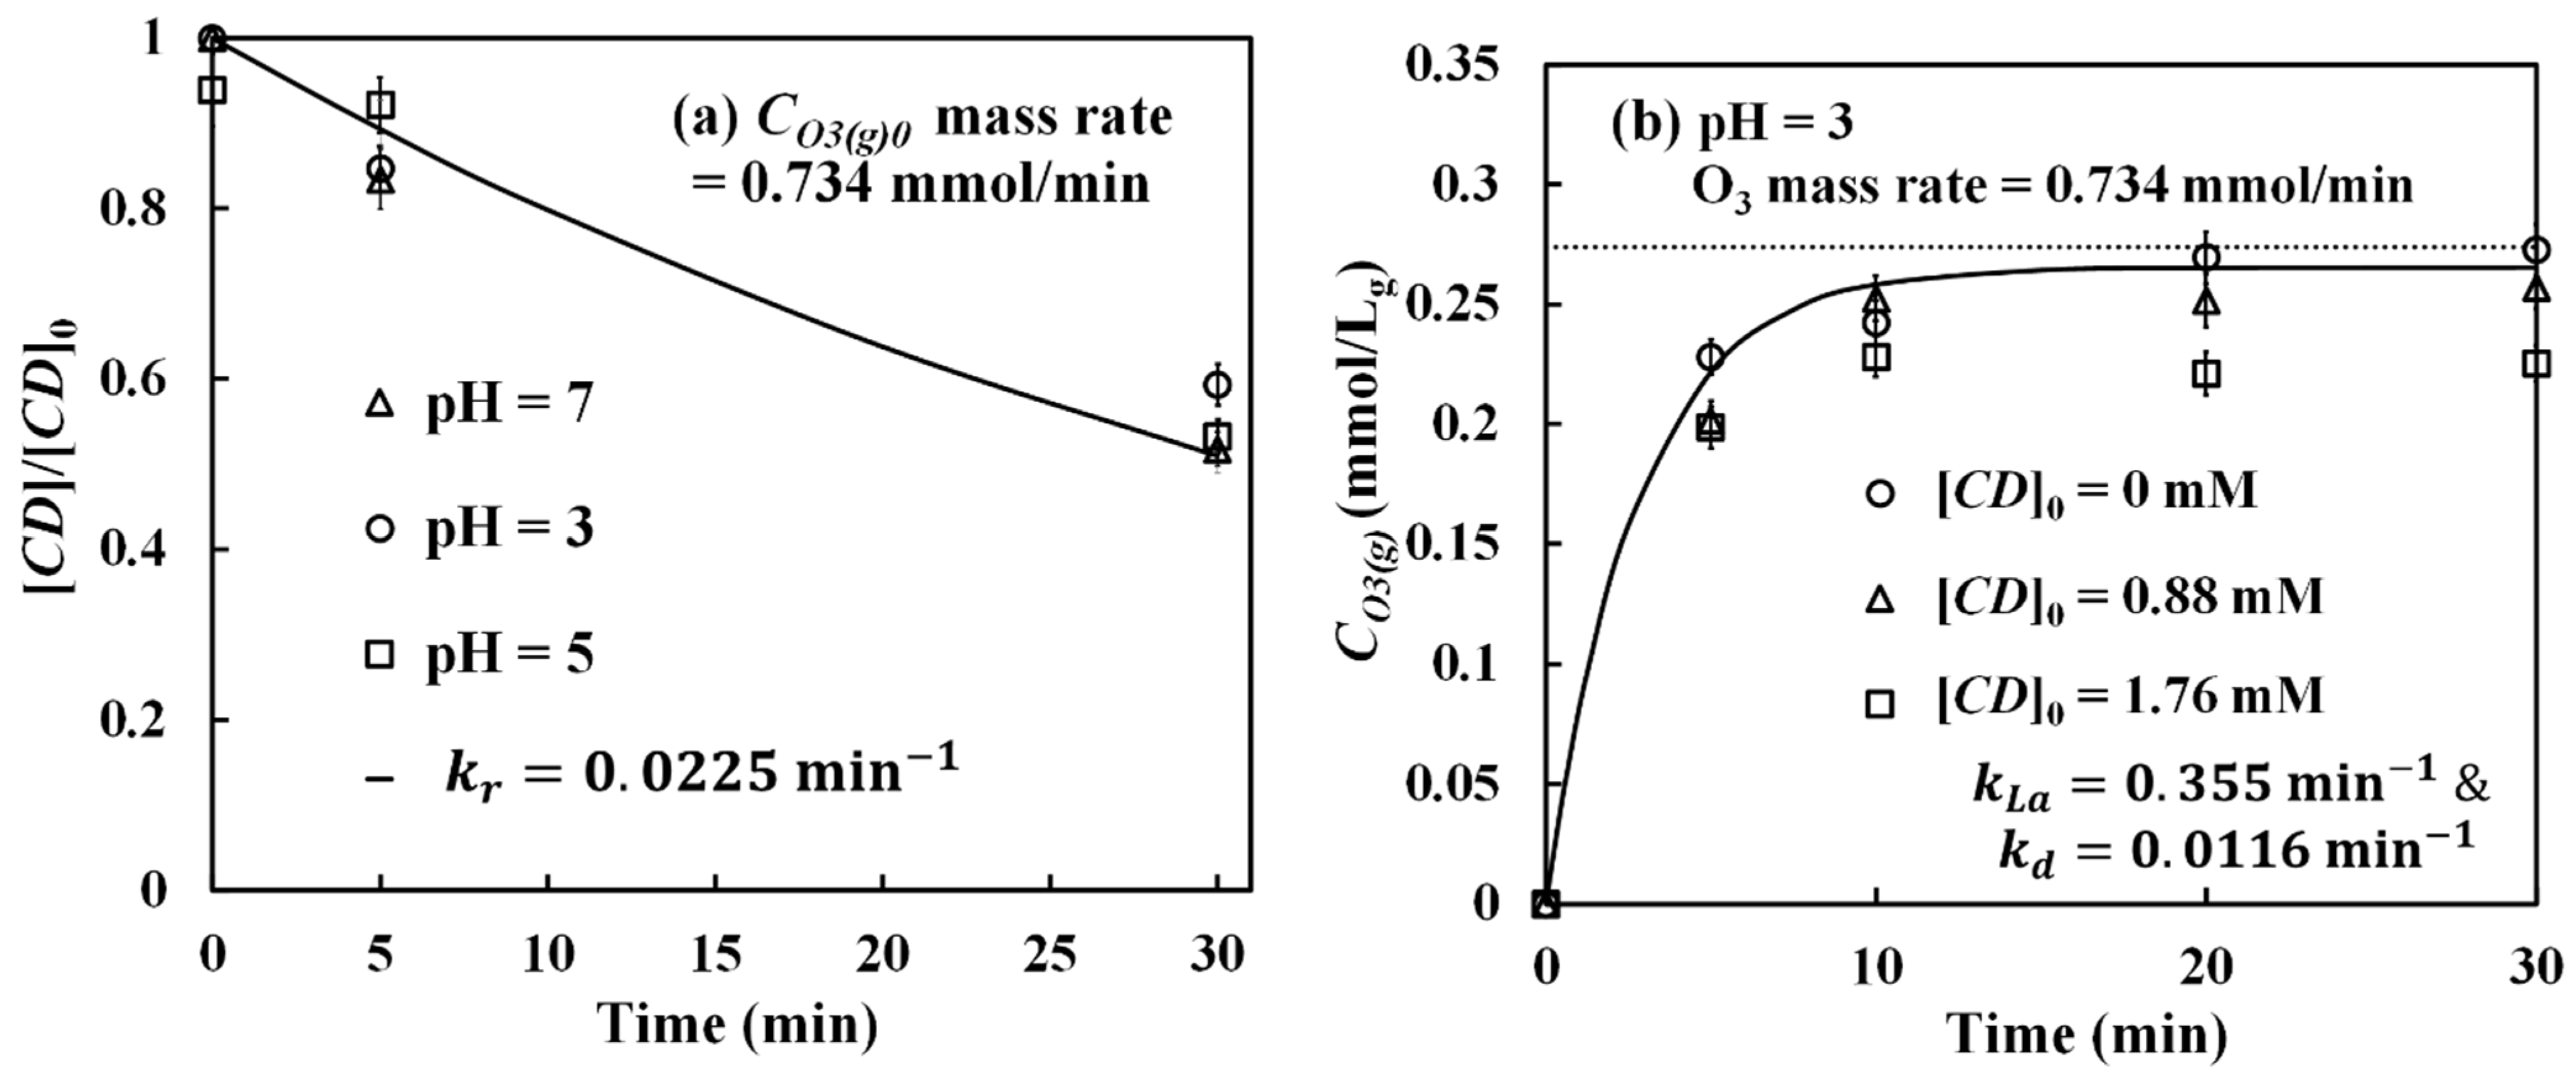
14]. The degrees of β-CD degradation in our system during ozonation are demonstrated in
Figure 2a, together with the data of gaseous ozone BTCs, as shown in
Figure 2b. From
Figure 2a, it is seen that about 50% of β-CD was degraded by ozone (0.734 mmol/min) after 30 min, regardless of pH. According to differential equations of gas–liquid mass transfer with chemical reactions, we can solve for these fundamental equations and subsequently optimize pertinent mass transfer and kinetic parameters in the system. These parameters are shown in
Figure 2, including the overall gas–liquid mass transfer coefficient (
) of 0.355 min
−1, the pseudo-first-order rate constant (
) for β-CD degradation of 0.0225 min
−1, and the ozone self-decomposition rate constant of 0.0116 min
−1. These parameters will be employed later in the mathematical modeling of ozone concentration on the CD interface. It should be emphasized that these parameters are system specific and cannot be applied to other systems. In spite of the degradation, the residual β-CD, i.e., the β-CD not degraded, in the solution can form a stable inclusion complex with ozone. Such inclusion is able to shield the complex from further degradation by ozone [
14] and, more importantly, to carry dissolved ozone molecules inside the cavity for long-term release. Therefore, in each O
3-βCD interaction in the reactor system, ozone is consumed to degrade β-CD, form the inclusion complex, and finally saturate the aqueous solution. Consequently, steeper slopes or larger
values at higher β-CD concentrations mainly result from higher ozone consumption due to reaction with β-CD and formation of O
3-βCD inclusion complex. Notably, the
values represent an overall dynamic equilibrium of ozone in the system, involving chemical reactions. It is different from standard Henry’s constant (
H) in Equation (6), which describes pure physical equilibrium between gaseous and aqueous ozone. In terms of pH effect, the
values are slightly affected by pH, as shown in
Figure 1b,c for the data of pH 5 and pH 7. The main reason for these phenomena is that at these pH values, what we have measured using the indigo method is actually the total oxidant concentrations, including both ozone and hydroxyl radical, but not just ozone alone as in pH 3. Although hydroxyl radical is a stronger oxidant than molecular ozone, it is short-lived, unstable, and cannot be included in the cavity of β-CD.
In
Figure 1, it is observed that the parameter
has a strong dependence on the initial β-CD concentration. It should be noted that
is also dependent on mass transfer characteristics of the reactor system, such as gas flow rate, bubble size, gas–water interfacial area, mixing intensity, etc. Ideally, a correlation in dimensionless form is preferred for the description of the O
3-βCD dynamic equilibrium. In practice, the molar ratio of CD to aqueous ozone has been utilized as a principal dimensionless parameter to characterize the O
3-CD systems [
14,
16]. In order to recast the data of
Figure 1 in a dimensionless fashion, we plot the values of β, obtained via Equation (4), as a function of the molar ratio of β-CD to aqueous ozone, defined by
Figure 3 shows the dimensionless relationships of
β vs.
R under various α values at pH 3, 5, and 7. In
Figure 3a, the data ranging between
and
demonstrate a good linear relationship, that the β values are inversely proportional to the CD/O
3 molar ratios. This implies that under a constant gaseous ozone concentration (i.e., a constant α value), the steady-state aqueous ozone concentration ([
]) (i.e., the β value) would decrease linearly when the β-CD concentration in the solution increases (i.e., at a higher CD/O
3 molar ratio). Essentially, this is what we have found previously in
Figure 1. Yet, it is now presented in dimensionless form and thus can be applied universally to conditions of any gaseous ozone input concentrations under various CD dosages. Evidently, the relative degree of aqueous ozone saturation, β, does not only depend on the CD/O
3 molar ratio but also depends on the gaseous ozone feed concentration, the α term. According to the definition of α in Equation (2), its value becomes 1.0 when the gas-absorption reactor is able to attain an aqueous concentration equaling ozone solubility in pure water. In our reactor system, the degree of ozone saturation attained is between 50% to 60%, i.e., between
and
. In the future, if other reactor systems with different mass transfer efficiencies are used for O
3-CD inclusion complex formation, linear lines with more α values can be added to the plot. Moreover, one of the limitations of the current plot (
Figure 3a) is that it is applicable to the O
3-CD system with respect to β-CD only. If other CDs such as α-CD, γ-CD, or HPβ-CD are of interest, their dimensionless plots have to be constructed through independent experiments since their degradation kinetics may differ from that of β-CD. Another limitation is the pH value.
Figure 3a is the plot of
β vs. CD/O
3 molar ratio specifically for pH 3. Analogous plots for pH 5 and pH 7 are shown in
Figure 3b,c, respectively. As the pH value increases, the slopes become flatter in
Figure 3b,c, meaning dissolved ozone concentration becomes higher under the same β-CD to ozone molar ratio. This is mainly due to a higher β-CD degradation so that less ozone is taken by β-CD.
3.2. Ozone Release Rate from O3-βCD Inclusion Complex
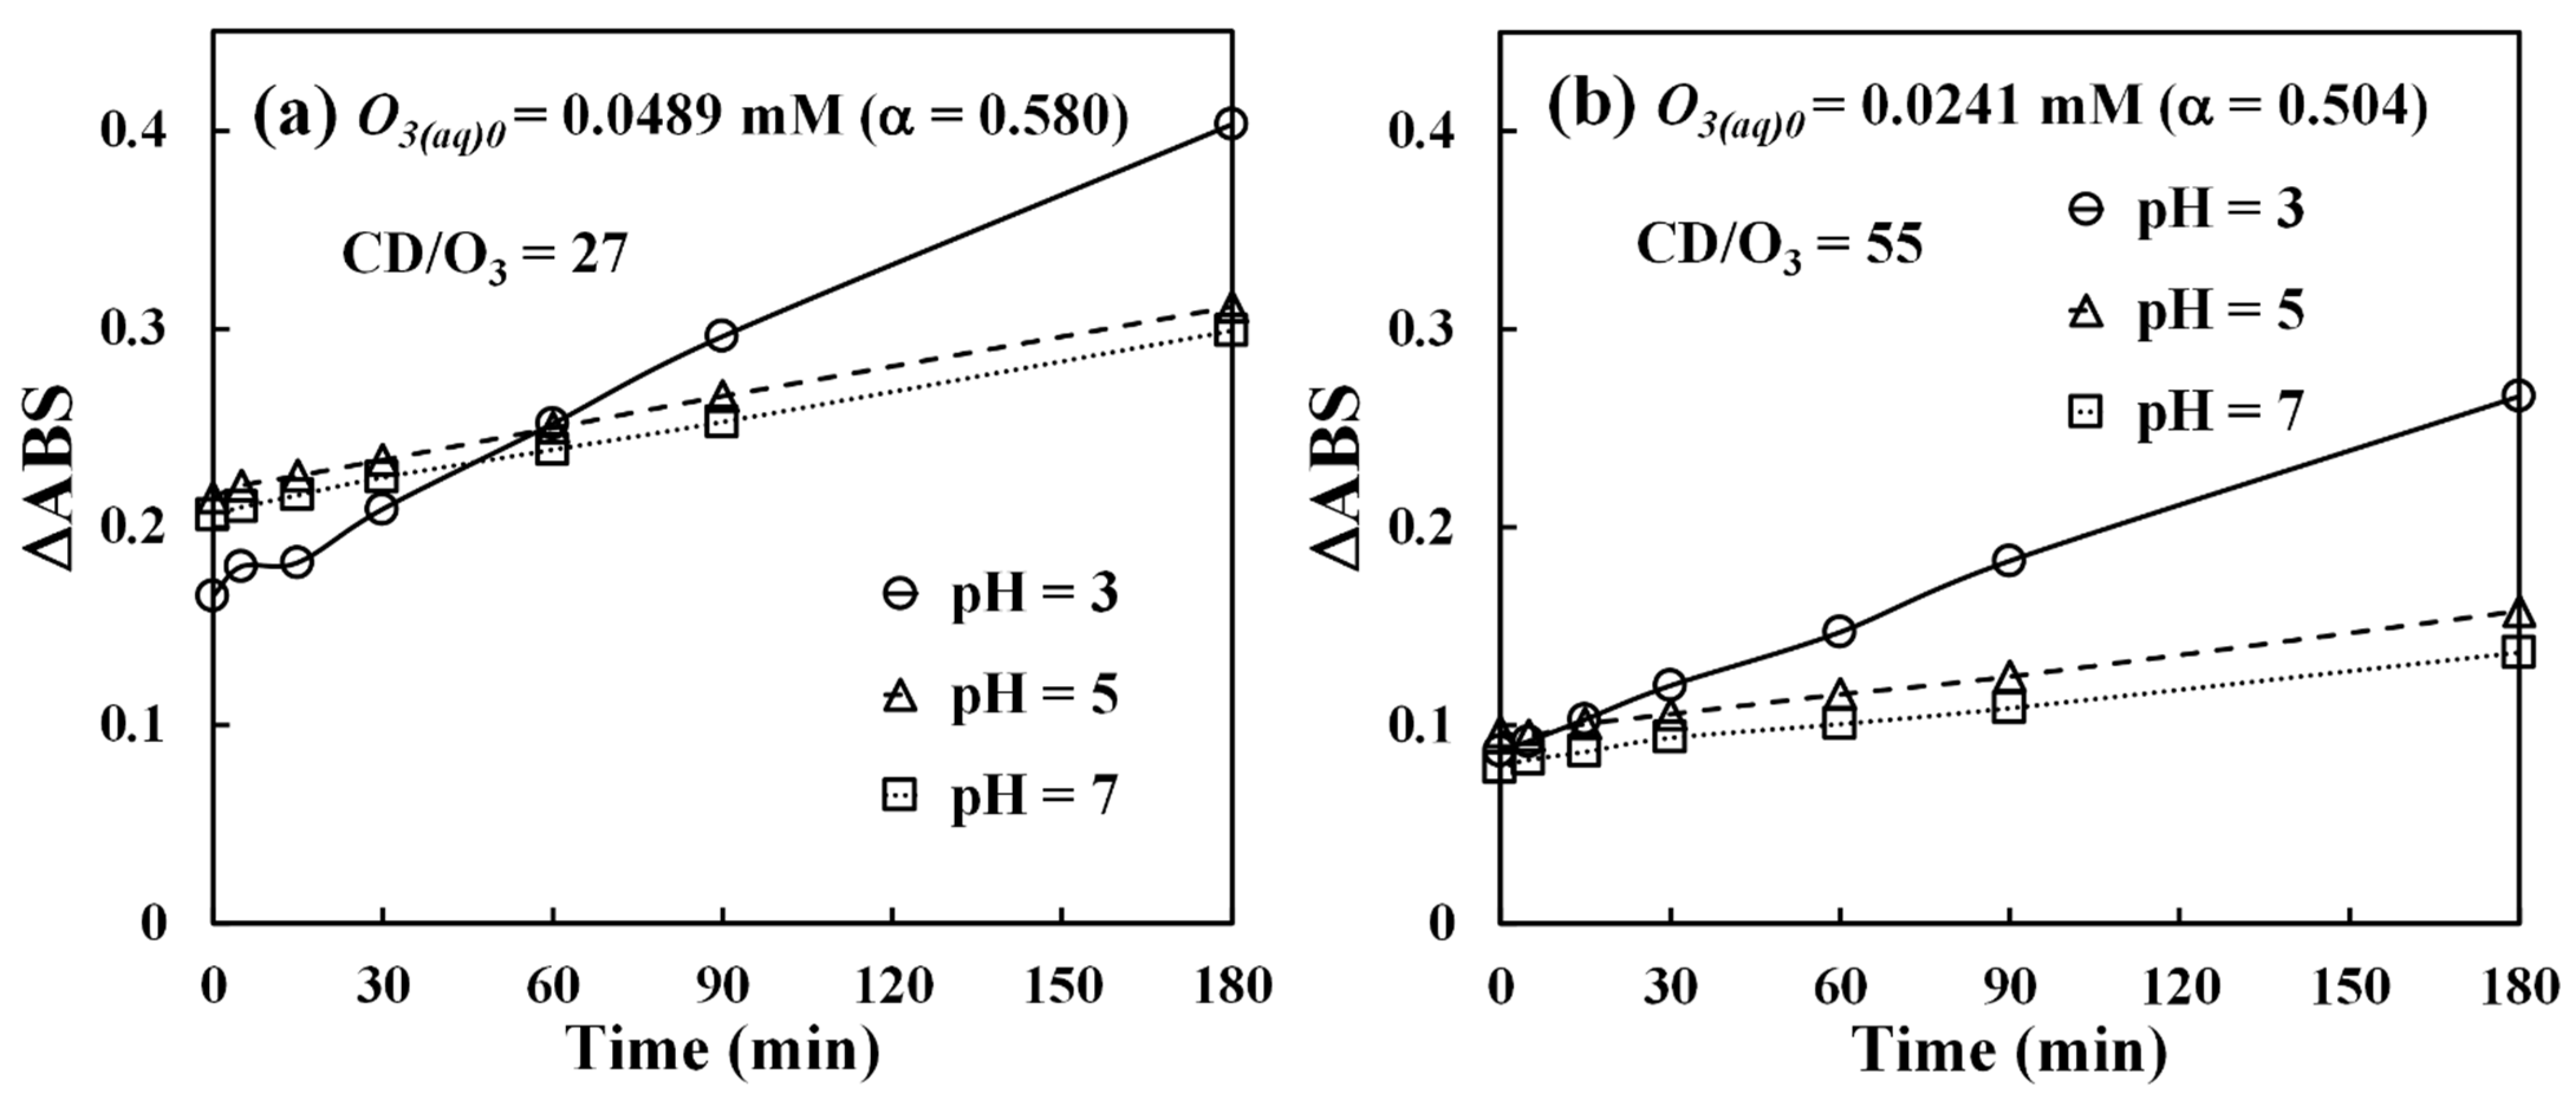
Figure 4 shows the experimental data of dissolved ozone release at pH 3. In
Figure 4, the y-axis is expressed in terms of the difference (ΔABS) of indigo absorbance in pure water (ABS
blank) and in the O
3-βCD system (ABS
O3-CD), i.e., ΔABS = ABS
blank − ABS
O3-CD. The ΔABS value is proportional to the dissolved ozone concentration in the solution, which can be calculated by applying Beer’s law with a molar absorptivity of 20,000 M
−1 cm
−1 for indigo [
37] and a path length of 1 cm in our instrument.
Figure 4 shows the results conducted under two different initial dissolved ozone (O
3(aq)0) concentrations of 0.0489 mM and 0.0241 mM, corresponding to the α values of 0.580 and 0.504, respectively. To quantify the β-CD dosage in dimensionless form, the CD/O
3 molar ratio (Equation (6)) was used. As seen in
Figure 4, a total of five different molar ratios was tested. From data in
Figure 4, the ΔABS values for solutions without β-CD (CD/O
3 = 0) level off rapidly, meaning dissolved ozone only appears for a few minutes in these solutions in the presence of indigo. On the other hand, when β-CD is present, their ΔABS values increase gradually, indicating a slow release of dissolved ozone from the O
3-βCD inclusion complex. We can further estimate the ozone release rates from the slopes of these curves. Since the release generally becomes more stable after 30 min as observed in
Figure 4, the release rates were calculated by taking the slopes measured from 30 to 180 min, and the results are summarized in
Figure 5, presented as a function of the CD/O
3 molar ratio. From
Figure 5, it was found that the release rates are in the range of 3.5 × 10
−5 to 6.8 × 10
−5 mM/min. When α = 0.580, the maximum release rate occurs at the CD/O
3 molar ratio of 27.4 but not at the higher ratio of 36. Similar release rate behavior was observed when the α value was 0.504; the maximum rate occurs at the ratio of 55 instead of a larger ratio of 73. Thus, a higher β-CD concentration or a larger molar ratio does not necessarily lead to a higher ozone release rate. Our interpretation is that when there is too much β-CD in the solution, most dissolved ozone is consumed for β-CD degradation, resulting in a low aqueous ozone concentration and causing low efficiency in the formation of the O
3-βCD inclusion complex. On the other hand, when the β-CD concentration is at the lower end, it could be too low to form enough O
3-βCD inclusion complex for efficient ozone release. Consequently, the optimal release rate should exist at an intermediary β-CD dosage, such as at the molar ratio of 27.4, which we found in our system when α = 0.580. Additionally, experiments were repeated under the above two maximum release rate conditions but at pH 5 and pH 7: (1) α = 0.580 and CD/O
3 = 27, and (2) α= 0.504 and CD/O
3 = 55. The results are presented in
Figure 6. As seen in
Figure 6, the release rates at pH 5 and 7 are very close and are both smaller than the release rates at pH 3. The release rates are around 2.5 × 10
−5 mM/min and 1.6 × 10
−5 mM/min for pH 5 and pH 7, respectively. On average, their release rates are about half of that at pH 3 due to faster decomposition rates of ozone at these pH values.
3.3. Mathematical Modeling of Optimal Ozone Concentration at the Interface
The following differential equation (Equation (7)) describes the mass balance of the aqueous ozone (
) in the gas-absorption reactor during the process of O
3-βCD complex formation. In the β-CD solution, aqueous ozone is continuously replenished from gaseous ozone (
) and is also consumed through reactions with β-CD (
), self-decomposition, and mass transfer into the β-CD cavity.
In Equation (7), is the overall gas–liquid interfacial mass transfer coefficient for ozone (min−1), is the input gaseous ozone concentration (mmol/Lg), H is the dimensionless Henry’s constant of ozone (mmol/Lg/mM), is the pseudo-first-order degradation rate constant of β-CD (min−1), is the first-order self-decomposition rate constant of aqueous ozone (min−1), is the overall mass transfer coefficient for ozone from the bulk solution to the O3-βCD inclusion complex (min−1), and stands for the dissolved ozone concentration at the water-CD interface (mM).
The concentration of dissolved ozone at the water-CD interface (
) in Equation (7) plays a critical role in governing the release of ozone from the O
3-βCD inclusion complex. This term cannot be measured experimentally but can be predicted by solving Equation (7). From the BTCs data in
Figure 2b, it should be reasonable to assume that after 30 min of purging, the O
3-βCD system has reached a pseudo-steady-state condition, where the inclusion complex becomes stable, and its concentration variation is unnoticeable. Under such a steady-state condition, Equation (7) can be solved to obtain the interface concentration
:
In Equation (8), the gaseous ozone (
) concentration is essentially constant at steady state. For the aqueous ozone (
) and CD concentration ([
CD]), they both can be measured experimentally, as already shown above in
Figure 1 and
Figure 2. In addition, the mass transfer coefficient
, and the rate constants
and
for the system can all be optimized with respect to ozone BTC as described above in
Figure 2a,b. Given these available terms, the overall mass transfer coefficient
becomes the only unknown parameter on the right-hand side of Equation (8). By definition,
is the product of
, the mass transfer coefficient (cm/s), and
, the specific water–CD interfacial area (cm
2/cm
3). In fact, the
term can further be defined as
where
is the BET surface area (m
2/g), and
is the molecular weight of β-CD (1135 g/mole). For a typical stirred tank, the liquid–solid mass transfer coefficient can range from 10
−7 to 10
−2 cm/s. Generally, values smaller than 10
−3 cm/s are considered incomplete mixing [
38]. Although macromolecules such as β-CD are not solids, we are assuming that their interfacial mass transfer coefficients are within the same order of magnitude. In our system under moderate mixing, the mass transfer coefficient was assumed to range between 1 × 10
−4 to 1 × 10
−3 cm/s. Furthermore, from past investigations, the BET surface areas of β-CD and β-CD polymers were found to be in the range of 3 to 6 m
2/g [
39,
40]. To be more conservative, in our calculations, we assume a value of 1.25 m
2/g. With these given parameters, the dissolved ozone concentration at the water–CD interface (
) can be calculated according to Equation (8).
Table 1 lists a set of the calculated results (pH 3) with a
value of 7.0 × 10
−4 cm/s. The calculated
concentrations in
Table 1 were all slightly less than their corresponding aqueous bulk concentrations (
), indicating there is a net diffusive flux of ozone entering from the bulk into the β-CD cavity.
Equation (8) can be further transformed by employing
, substituting
with Equation (9), substituting
with
, replacing
with
, and substituting
with
, where
is the percentage of β-CD degradation at steady state. Then, Equation (8) becomes
Next, by substituting
R as
as defined in Equation (6), Equation (10) can be rewritten as
With fixed kinetic rate constants (
&
) and mass transfer coefficients (
,
, and
) plus constant values of
α,
β, and
γ in the system at steady state, Equation (11) becomes dependent on the
R value (
) only, i.e., the CD/O
3 molar ratio. In
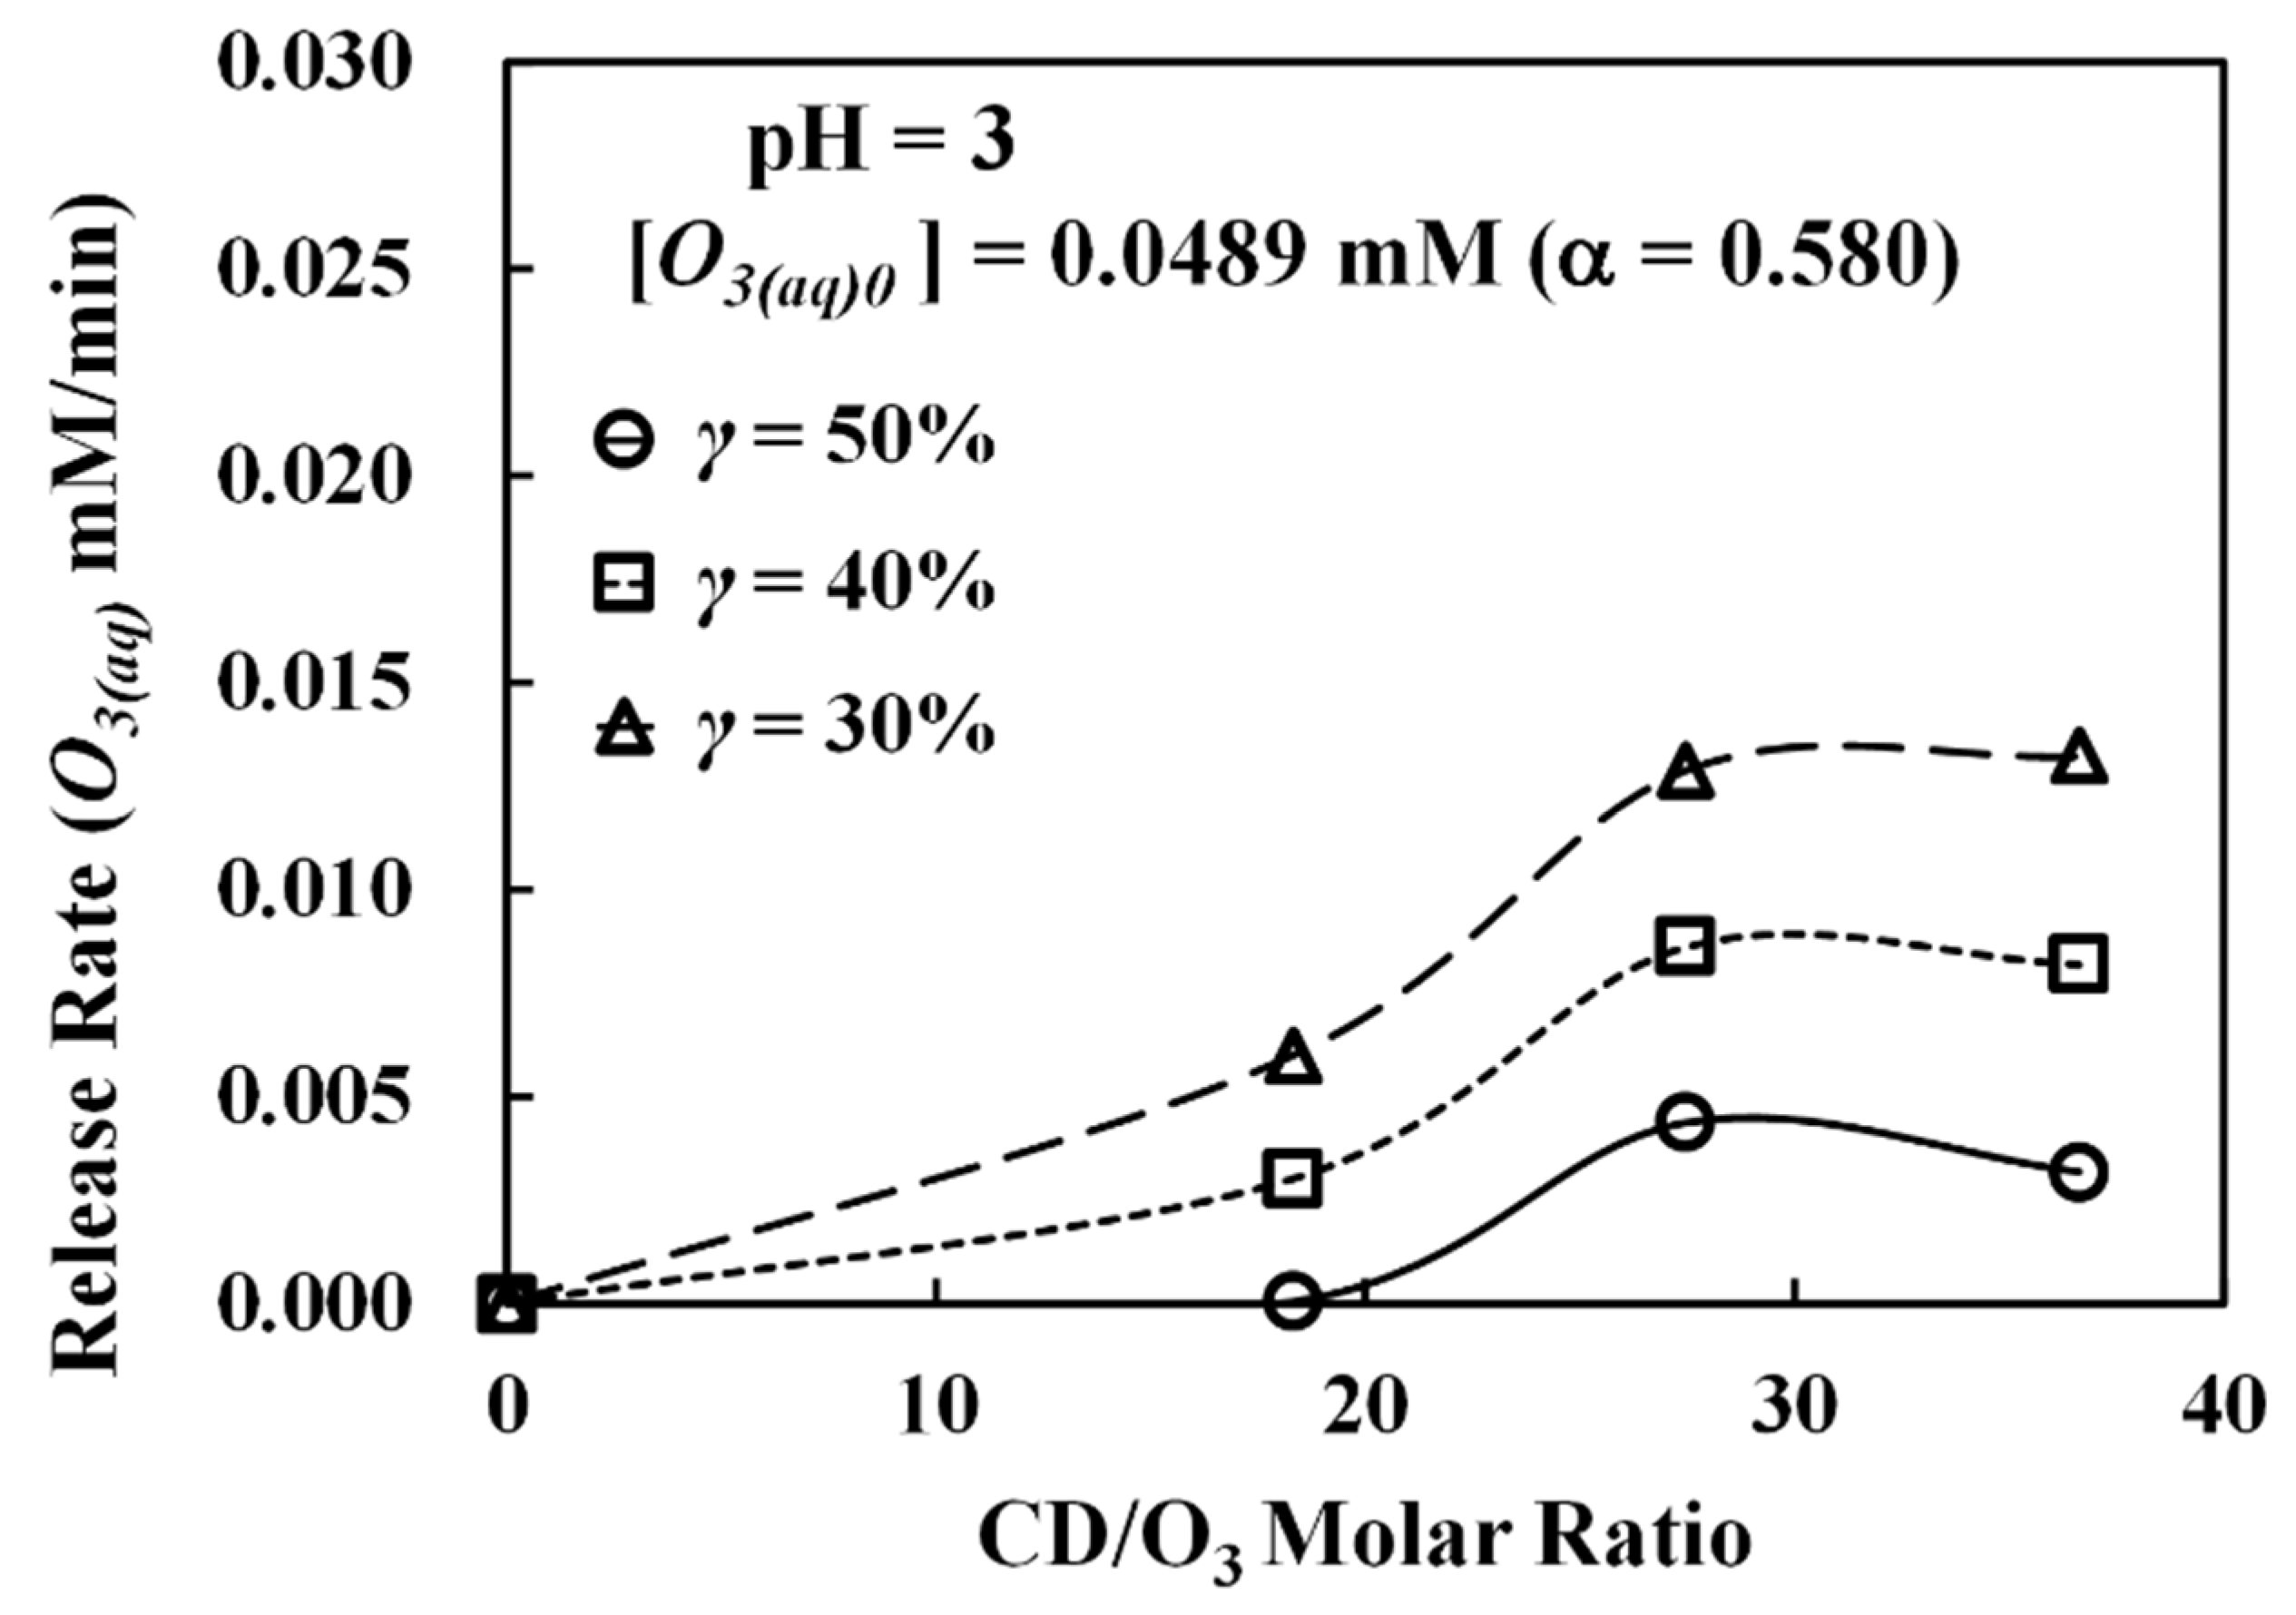
Figure 7, the calculated values of
are plotted as a function of the molar ratio under three different
values of 6.0 × 10
−4, 7.0 × 10
−4, and 8.0 × 10
−4 cm/s. From
Figure 7, it is evident that the functional relationship between
and the CD/O
3 molar ratio is parabolic, and a maximum value of
exists at an intermediate molar ratio but not at the highest ratio. This is in agreement with what we have observed above regarding ozone release from the O
3-βCD inclusion complex. When there is a very high concentration of β-CD in the solution, ozone is consumed more to react with β-CD and is left with a less dissolved concentration in the solution for the formation of the O
3-βCD complex. Despite a relatively large overall mass transfer coefficient (
under a high β-CD concentration, ozone transferred to the β-CD interface is still limited due to low dissolved ozone concentration in the bulk solution. On the other hand, when the β-CD concentration is very low, the available dissolved ozone concentration becomes high in the solution since ozone is not consumed significantly. However, this causes the ozone gas–water mass transfer to become less efficient due to a smaller gradient across the gas–water interface as well as a smaller
due to a lower β-CD concentration. This also results in a relatively low mass transfer of dissolved ozone to the β-CD interface. Consequently, a maximum mass transfer condition would exist in-between these two extremes as shown in
Figure 7 by Equation (11).
3.4. Ozone Release Rate Calculations and Comparisons
With the calculated ozone concentration at the interface (
), we can further estimate the experimental ozone release rate as presented in
Figure 5. Here, two assumptions are made. First, given the value of
, the resulting ozone release rate (
) can be calculated by the following equation:
The
term in Equation (12) represents the bulk concentration of ozone adjacent to the β-CD interface during the release. In our calculations, we are assuming
equals zero, a condition that ozone is essentially depleted during the release due to reaction. Under this condition, the prediction represents the maximum release rate. Second, it should be noted that in the prediction of
in
Figure 7, the same set of parameters were used, i.e., parameters listed in
Table 1 are employed for all three different molar ratios. However, in our calculations to estimate the experimental release rate, their
and
values are individually fitted while other parameters are kept constant as those in
Table 1. Since not every single experiment could possess identical mass transfer coefficients, as long as these coefficients are within a reasonable range, they should be considered reasonable. With these assumptions, the model-calculated ozone release rates under a gaseous concentration of 0.274 mmol/L
g (α = 0.580) can be estimated using Equation (12) and their results are shown in
Table 2 below. In the table, specific
and
values for each molar ratio are also listed. From the results in
Table 2, it is evident that the model-calculated values are very close to their experimental ones, with a maximum difference under 3%. The
and
values are all within a reasonable range as suggested in the literature with respect to mass transfer [
38] and β-CD properties [
39,
40].
The above-calculated results were further compared with ozone release data from the study by Dettmer et al. [
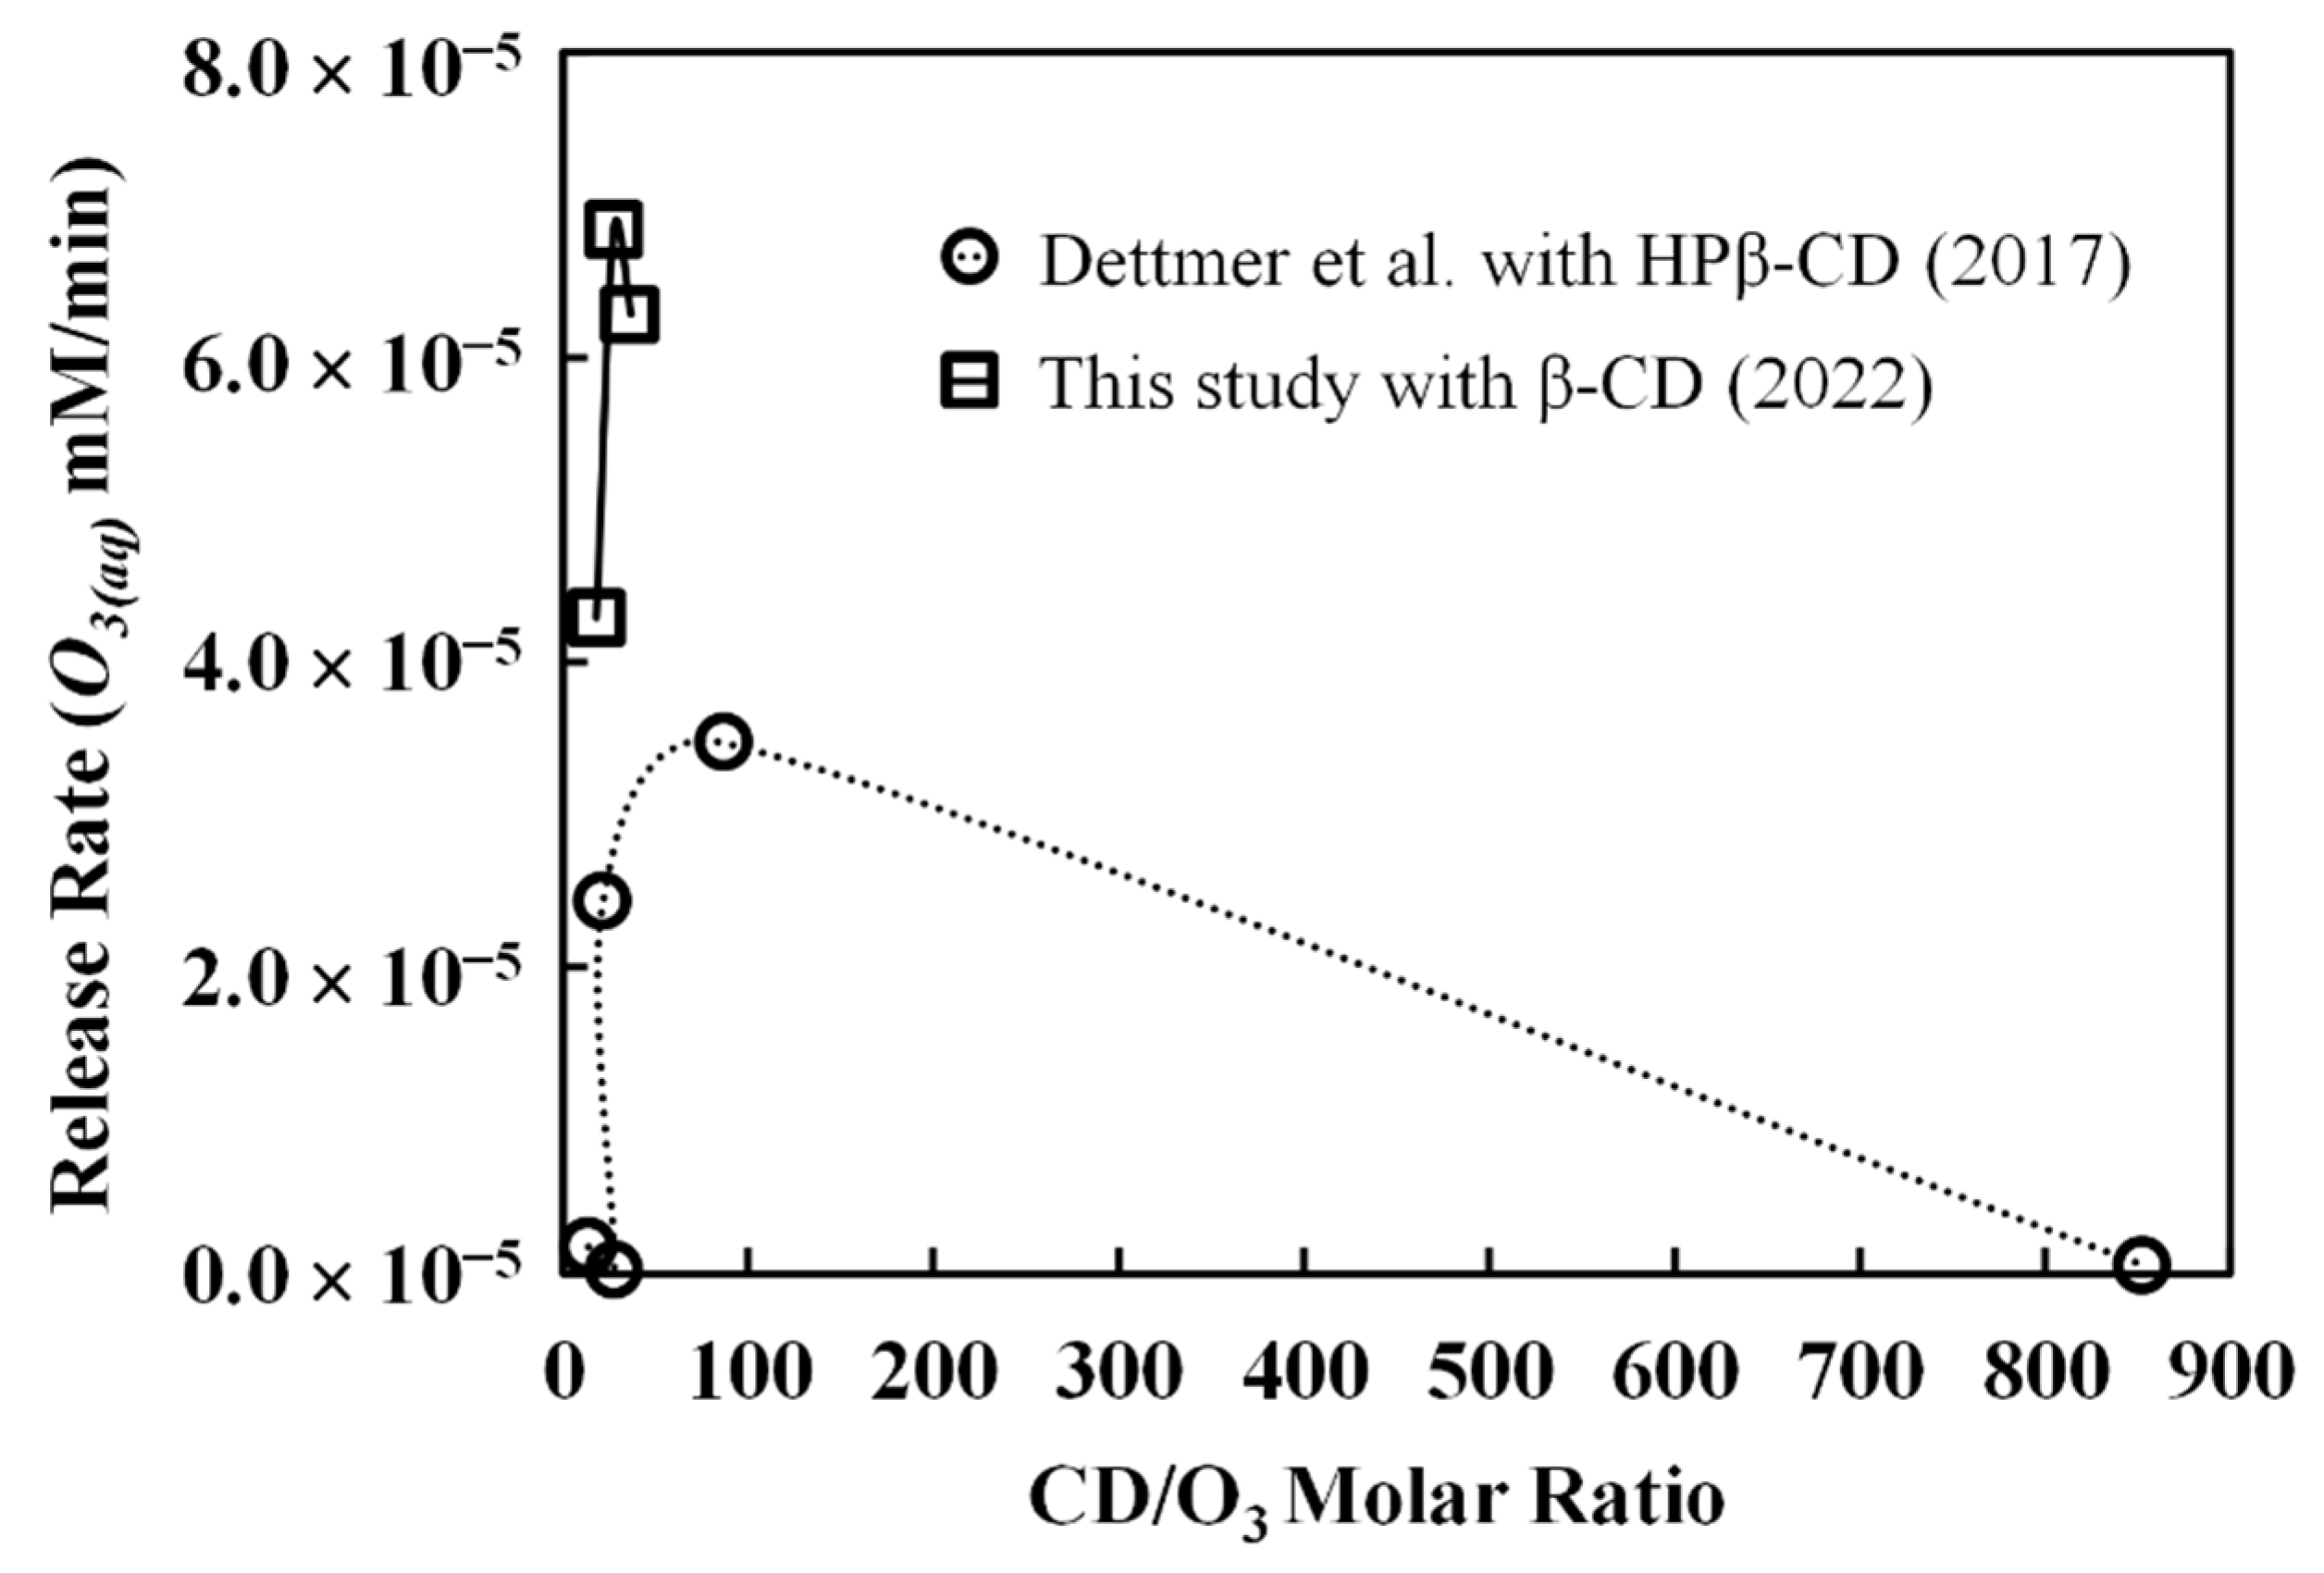
14]. Before the comparisons, experimental material and design differences between Dettmer’s investigation and this study must be addressed. First of all, the CD they used was HPβ-CD but not β-CD. Second, as mentioned earlier, the range of CD to ozone molar ratios they studied is from less than 20 to more than 800, which is very different from our range of molar ratios. Third, in their study, the release rate was not presented directly; instead, the data of cumulative ozone mass release (in mg/L) was plotted as a function of time (hour). From these original data, we calculated the slopes and then converted the units to mM/min in order to compare them with our data. Finally, the time span of their study was from 20 h to as high as 80 h, whereas in this study, the release rate we examined is 3 h. Despite the differences, it is still essential to compare these data to gain insights into the accuracy of our empirical model. In
Figure 8, ozone release rates in
Table 2 and the release rates from Dettmer’s study are plotted as a function of the CD-to-ozone molar ratio. In Dettmer’s study, the lowest release rate of 1.7 × 10
−7 mM/min occurs at the molar ratio of 28, while the highest release rate of 3.5 × 10
−5 mM/min occurs at the molar ratio of 87. When the molar ratio goes to 850, the release rate is 5.2 × 10
−7 mM/min. These data do show parabolic behaviors, as have been observed in this study, except at a wider range of molar ratios. Our calculated release rates are on the higher ends of their data (>4.0 × 10
−5 mM/min). This is mainly because our prediction represents the initial stage of the ozone release process (<3 h) where the O
3-CD complex’s concentration is high. As the release processes continue to 20 or 40 h, the release rate should decrease due to a lower O
3-CD complex concentration. In addition to the time scale, the differences between HPβ-CD and β-CD could affect the variations in
Figure 8. From this comparison, it is seen that the empirical model developed in this study is capable of roughly estimating the early-stage ozone release rate from another independent study. The fact that the model can not only interpret our experimental data of ozone release rate, but can also estimate the release rate of an analogous system does justify its validity.
3.6. TPH Removal by O3-βCD Inclusion Complex
In the final phase of the experiments, the O
3-βCD inclusion complex was used to test its potential for the removal of TPH in solution. To exclude the effects of the hydroxyl radical, the experiments were conducted at pH 3 only. Two different reaction schemes were adopted under various conditions. In scheme I, gaseous ozone was first purged in a pH 3 solution containing β-CD for 30 min to form the O
3-βCD complex. Then, the ozone purging was stopped, and the solution was subsequently added to the TPH-containing solution (50 mg/L) to react for 30 min (t
r = 0.5 h). Scheme II had the same ozone purging time as scheme I, but the reaction time was extended to 24 h (t
r = 24 h).
Figure 10 shows the comparative results of the overall TPH removal under a wide range of CD/O
3 molar ratios from 9 to 91 and under two different gaseous ozone loading dosages of α = 0.580 and α = 0.504.
From
Figure 10, when schemes I and II are compared, it was found that a reaction time of 24 h is important in controlling the TPH removal efficiency. At best, an increase of nearly 30% was observed when the reaction time was increased from t
r = 0.5 h to t
r = 24 h under a CD/O
3 molar ratio of 27.4. It should be emphasized that in scheme I, during the short period of reaction (t
r = 0.5 h), most of the TPH removal is due to direct reactions with residual aqueous ozone in solution, but not reactions with ozone released from the O
3-βCD inclusion complex. The removal due to residual aqueous ozone should be insignificant after 30 min. This implies that the 30% increase in TPH removal is mostly due to degradation by the O
3-βCD inclusion complex. Additionally, it is evident that for the two different gaseous ozone dosages of α = 0.580 and α = 0.504, the best removal efficiencies occur at the CD/O
3 molar ratios of 27.4 and 48.5, respectively. In fact, these removal efficiencies do demonstrate a somewhat parabolic functional dependence on the molar ratio. This behavior is analogous to what we have found regarding the maximum interfacial ozone concentrations, as shown in
Figure 7. Recall from the above ozone release data that the maximum release rate equals 6.88 × 10
−5 mM min
−1 (α = 0.580) when the CD/O
3 molar ratio is 27.4, as seen in
Figure 5 and
Table 2. For 24 h, the accumulated mass of dissolved ozone released into the solution should be 0.09907 mM (i.e., 6.88 × 10
−5 mM/min × 24 h/d × 60 min/h). To estimate the average molar concentration of TPH, we use the molecular weight of
n-tetradecane (C
14H
30) as the representative molar mass, and 50 mg/L of TPH would be equivalent to 0.252 mM. Thus, the aforesaid 30% of removal efficiency increase is the removal of 0.0756 mM of TPH (i.e., 0.252 mM × 30% = 0.0756 mM). Thus, the molar ratio between ozone and TPH is 0.09907:0.0756, which is roughly 1.3:1, a reasonable stoichiometry during the chemical degradation of TPH by released ozone. Finally, it should be noted that adding β-CD to the treatment process for a short reaction time (e.g., t
r = 0.5 h) does not necessarily enhance the removal efficiency. For example, as seen in
Figure 10, when α = 0.580, the removal efficiency essentially decreases as the molar ratio increases. This is because under the circumstances residual ozone is responsible for the degradation of TPH. More residual ozone is present in the solution when the molar ratio CD/O
3 = 0. Given enough reaction time (e.g., t
r = 24 h), a higher removal efficiency can be achieved through reactions with dissolved ozone released from the O
3-βCD inclusion complex.
