
Diagnosis of Basin Eco-Hydrological Variation Based on Index Sensitivity of Similar Years: A Case Study in the Hanjiang River Basin


Abstract
:1. Introduction
2. Materials and Methods
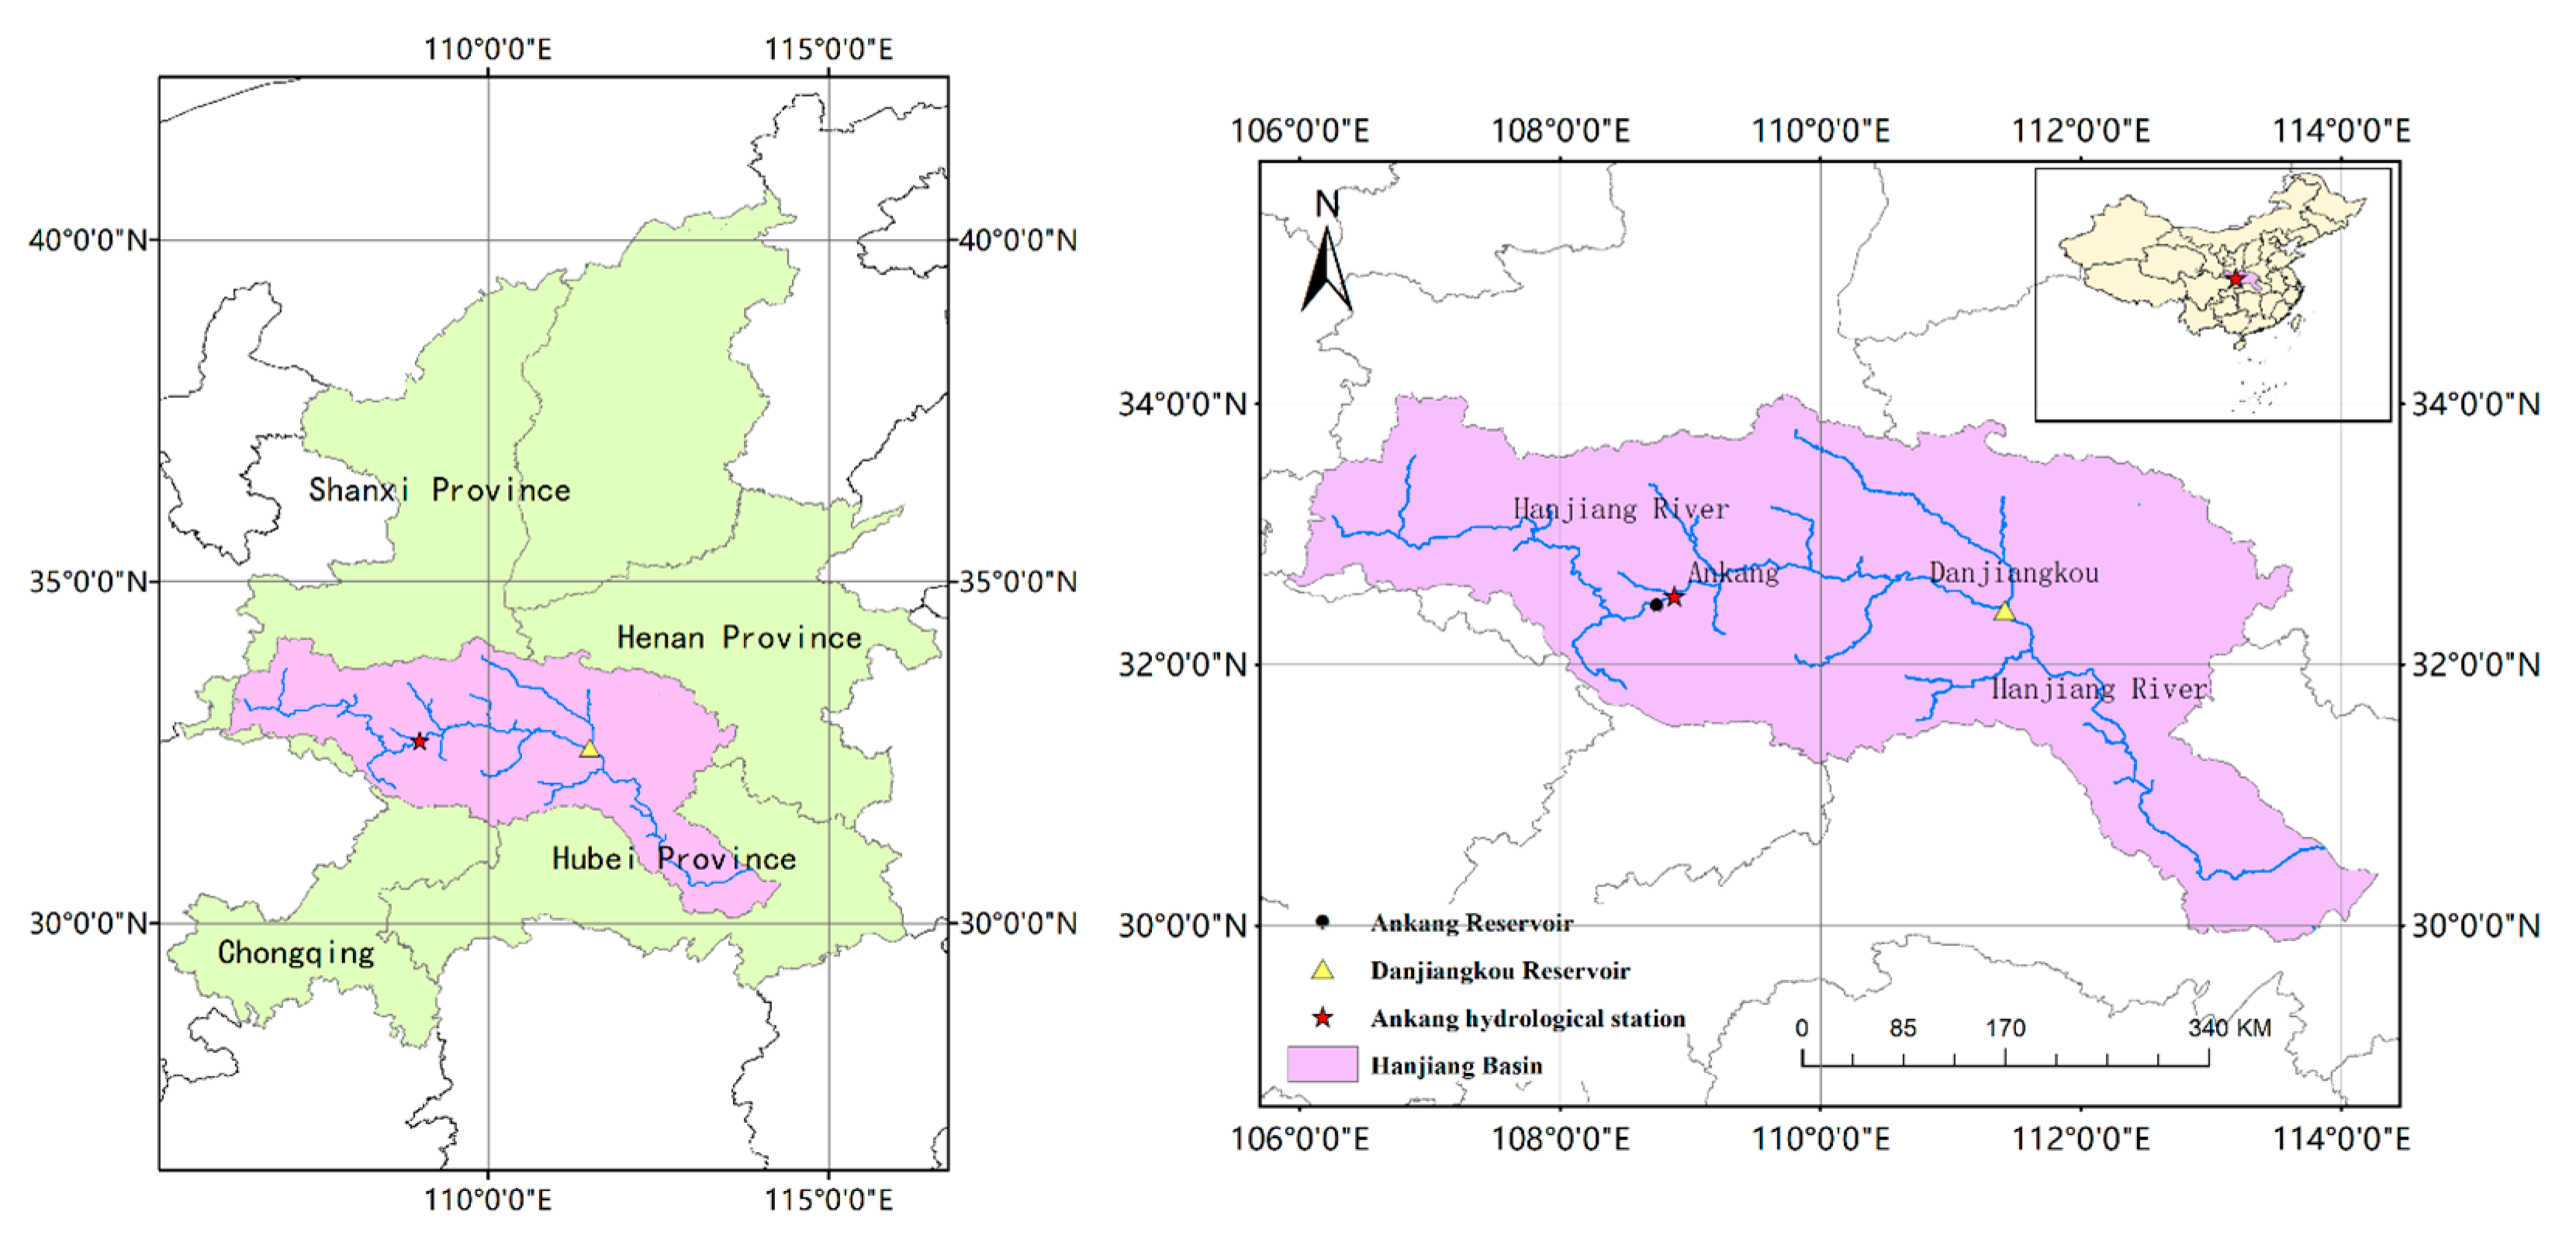
2.1. Study Area
2.2. Data Collection
2.3. Method
2.3.1. Refine IHA Index System
2.3.2. ERHIs Selection
- Calculation method of coefficient of variation [22].
- Euclidean distance [23].
2.3.3. Variation Diagnosis
- 1.
- Primary diagnosis.
- 2.
- Detailed diagnosis.
- (a)
- If the strong variation index is one index: (I) When the years diagnosed by these methods are concentrated in a certain year, that year is the final variation year of the basin; (II) when the number of variation years is k and these variation years appear more frequently in the diagnostic results, the longest period between the years is taken as the final variation time period of the basin (i.e., k > 1).
- (b)
- If the strong variation index is two or more indicators: (I) When the variation year corresponding to the same index is concentrated in a certain year: (i) if the corresponding variation year among the indicators is the same, then the year is the final variation year, (ii) if the corresponding variation year among the indicators are different, then the time period between the maximum year and the minimum year is taken as the final variation time period; (II) when the variation year corresponding to the same index is distributed over many years: method II in case (a) was used to find out the variation period of each index. Several possibilities existing between the variation time periods of each index were assessed: (i) if the variation time periods of all indices overlap, the final watershed variation time period is the variation time period obtained by any index, (ii) if the variation time periods of some two or more indicators do not coincide, then the union of all variation time periods is taken as the final variation time period of the basin.
3. Results
3.1. Refine IHA Index System
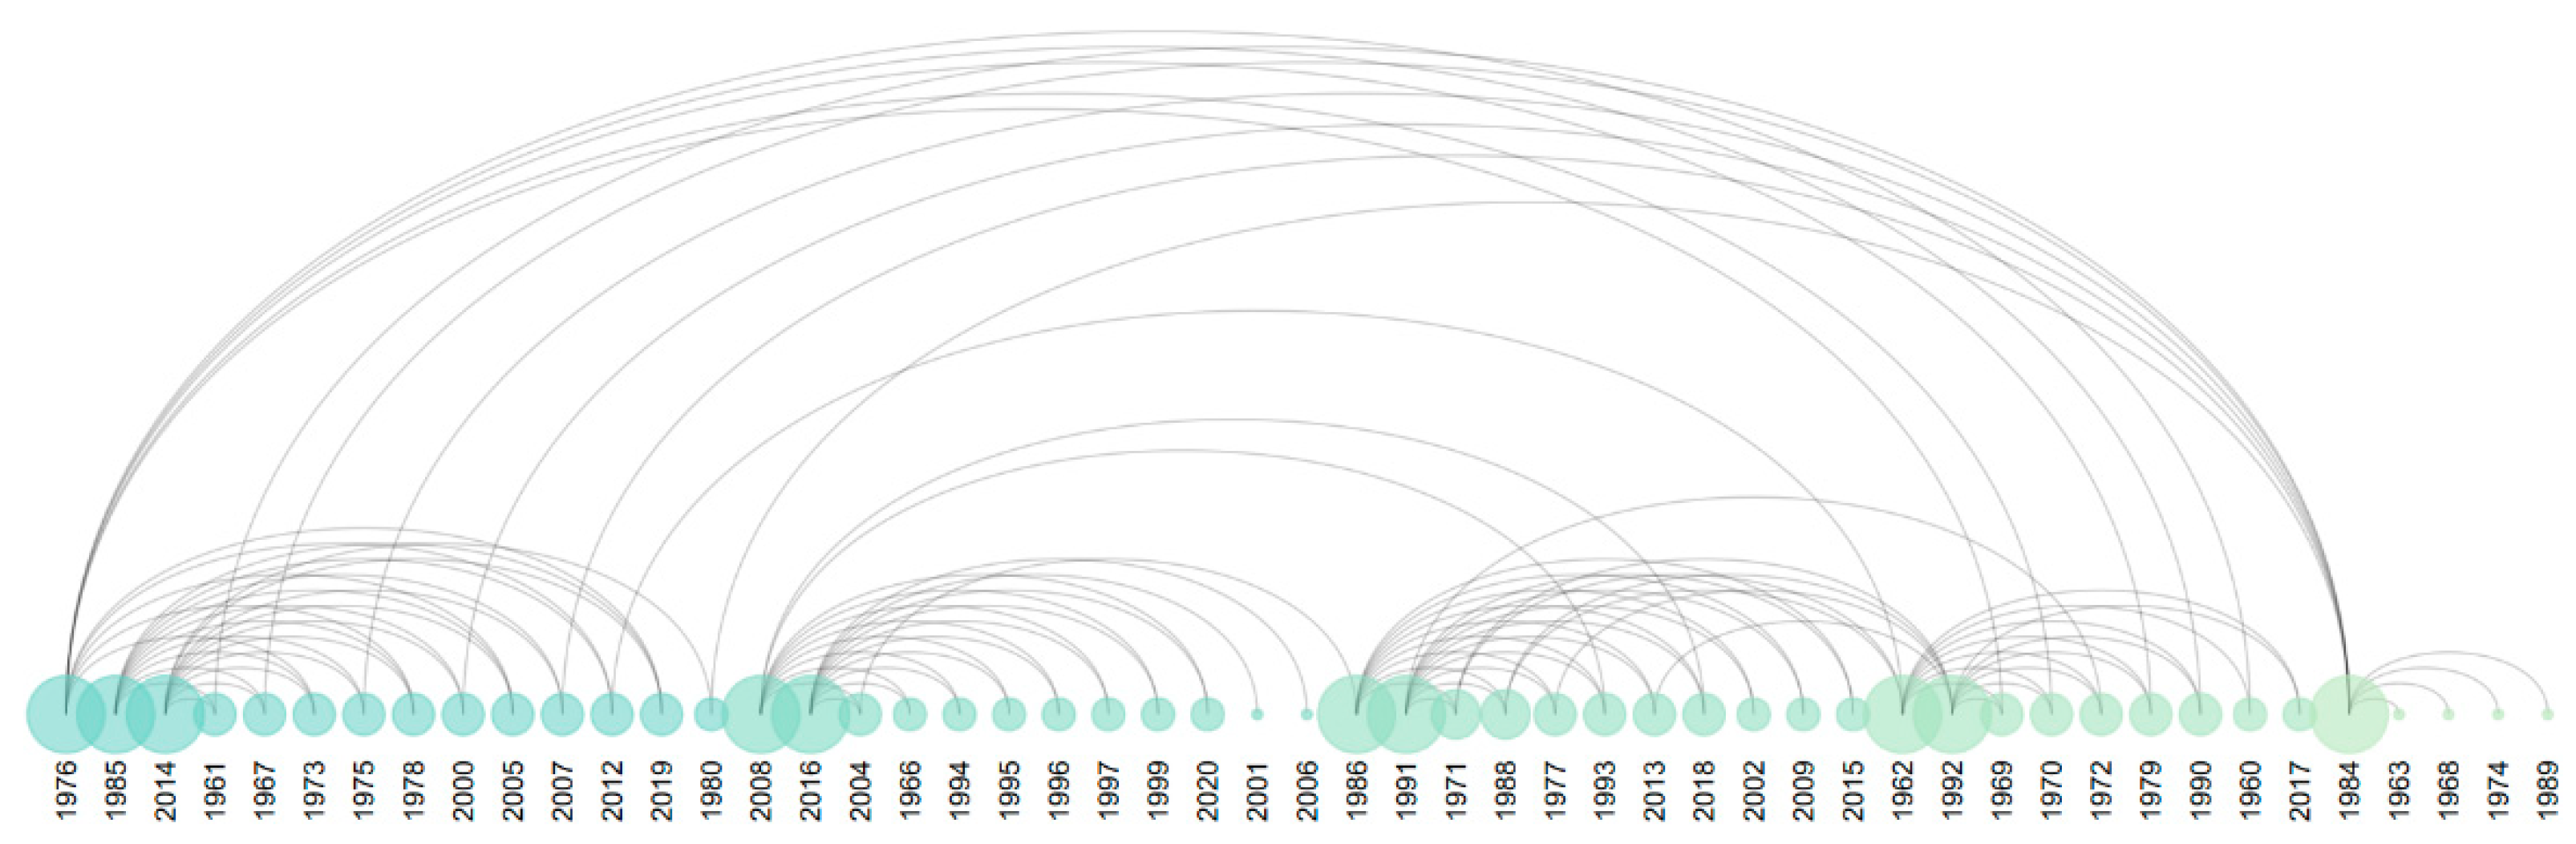
3.2. Determination of Similar Years
3.3. Determination of ERHIs
3.4. Rationality Analysis of ERHIs
3.4.1. Coverage Analysis
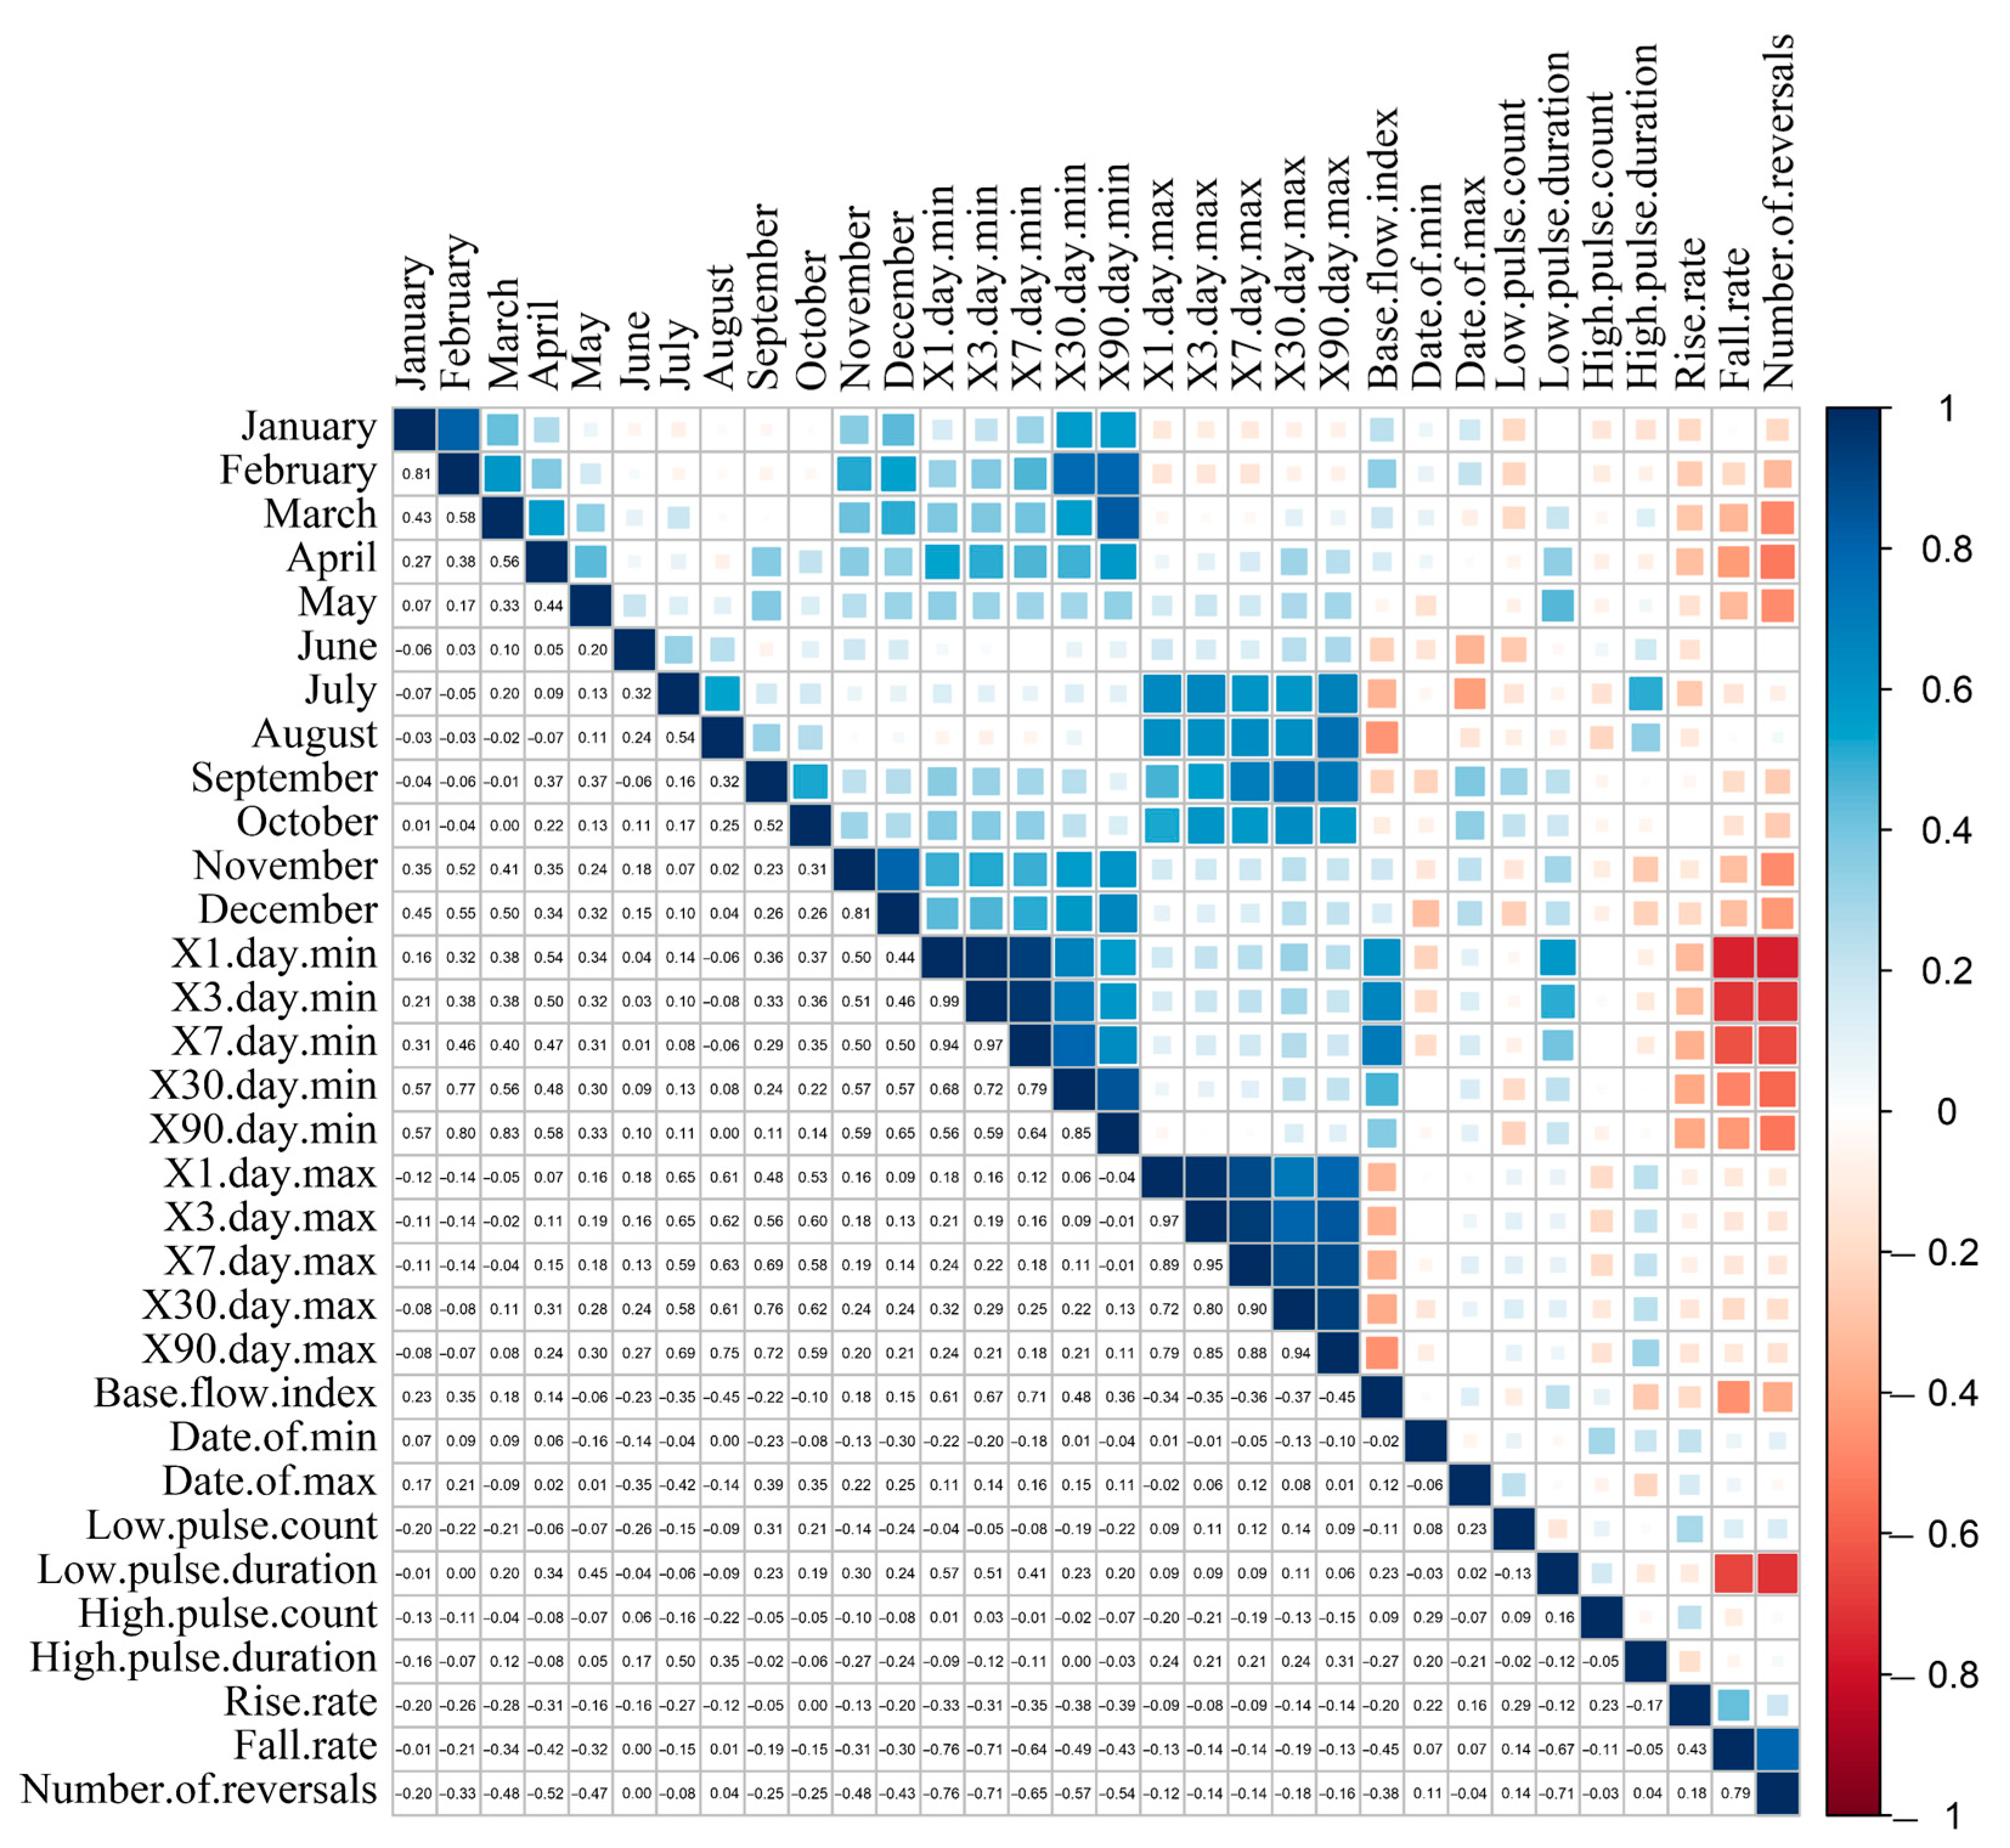
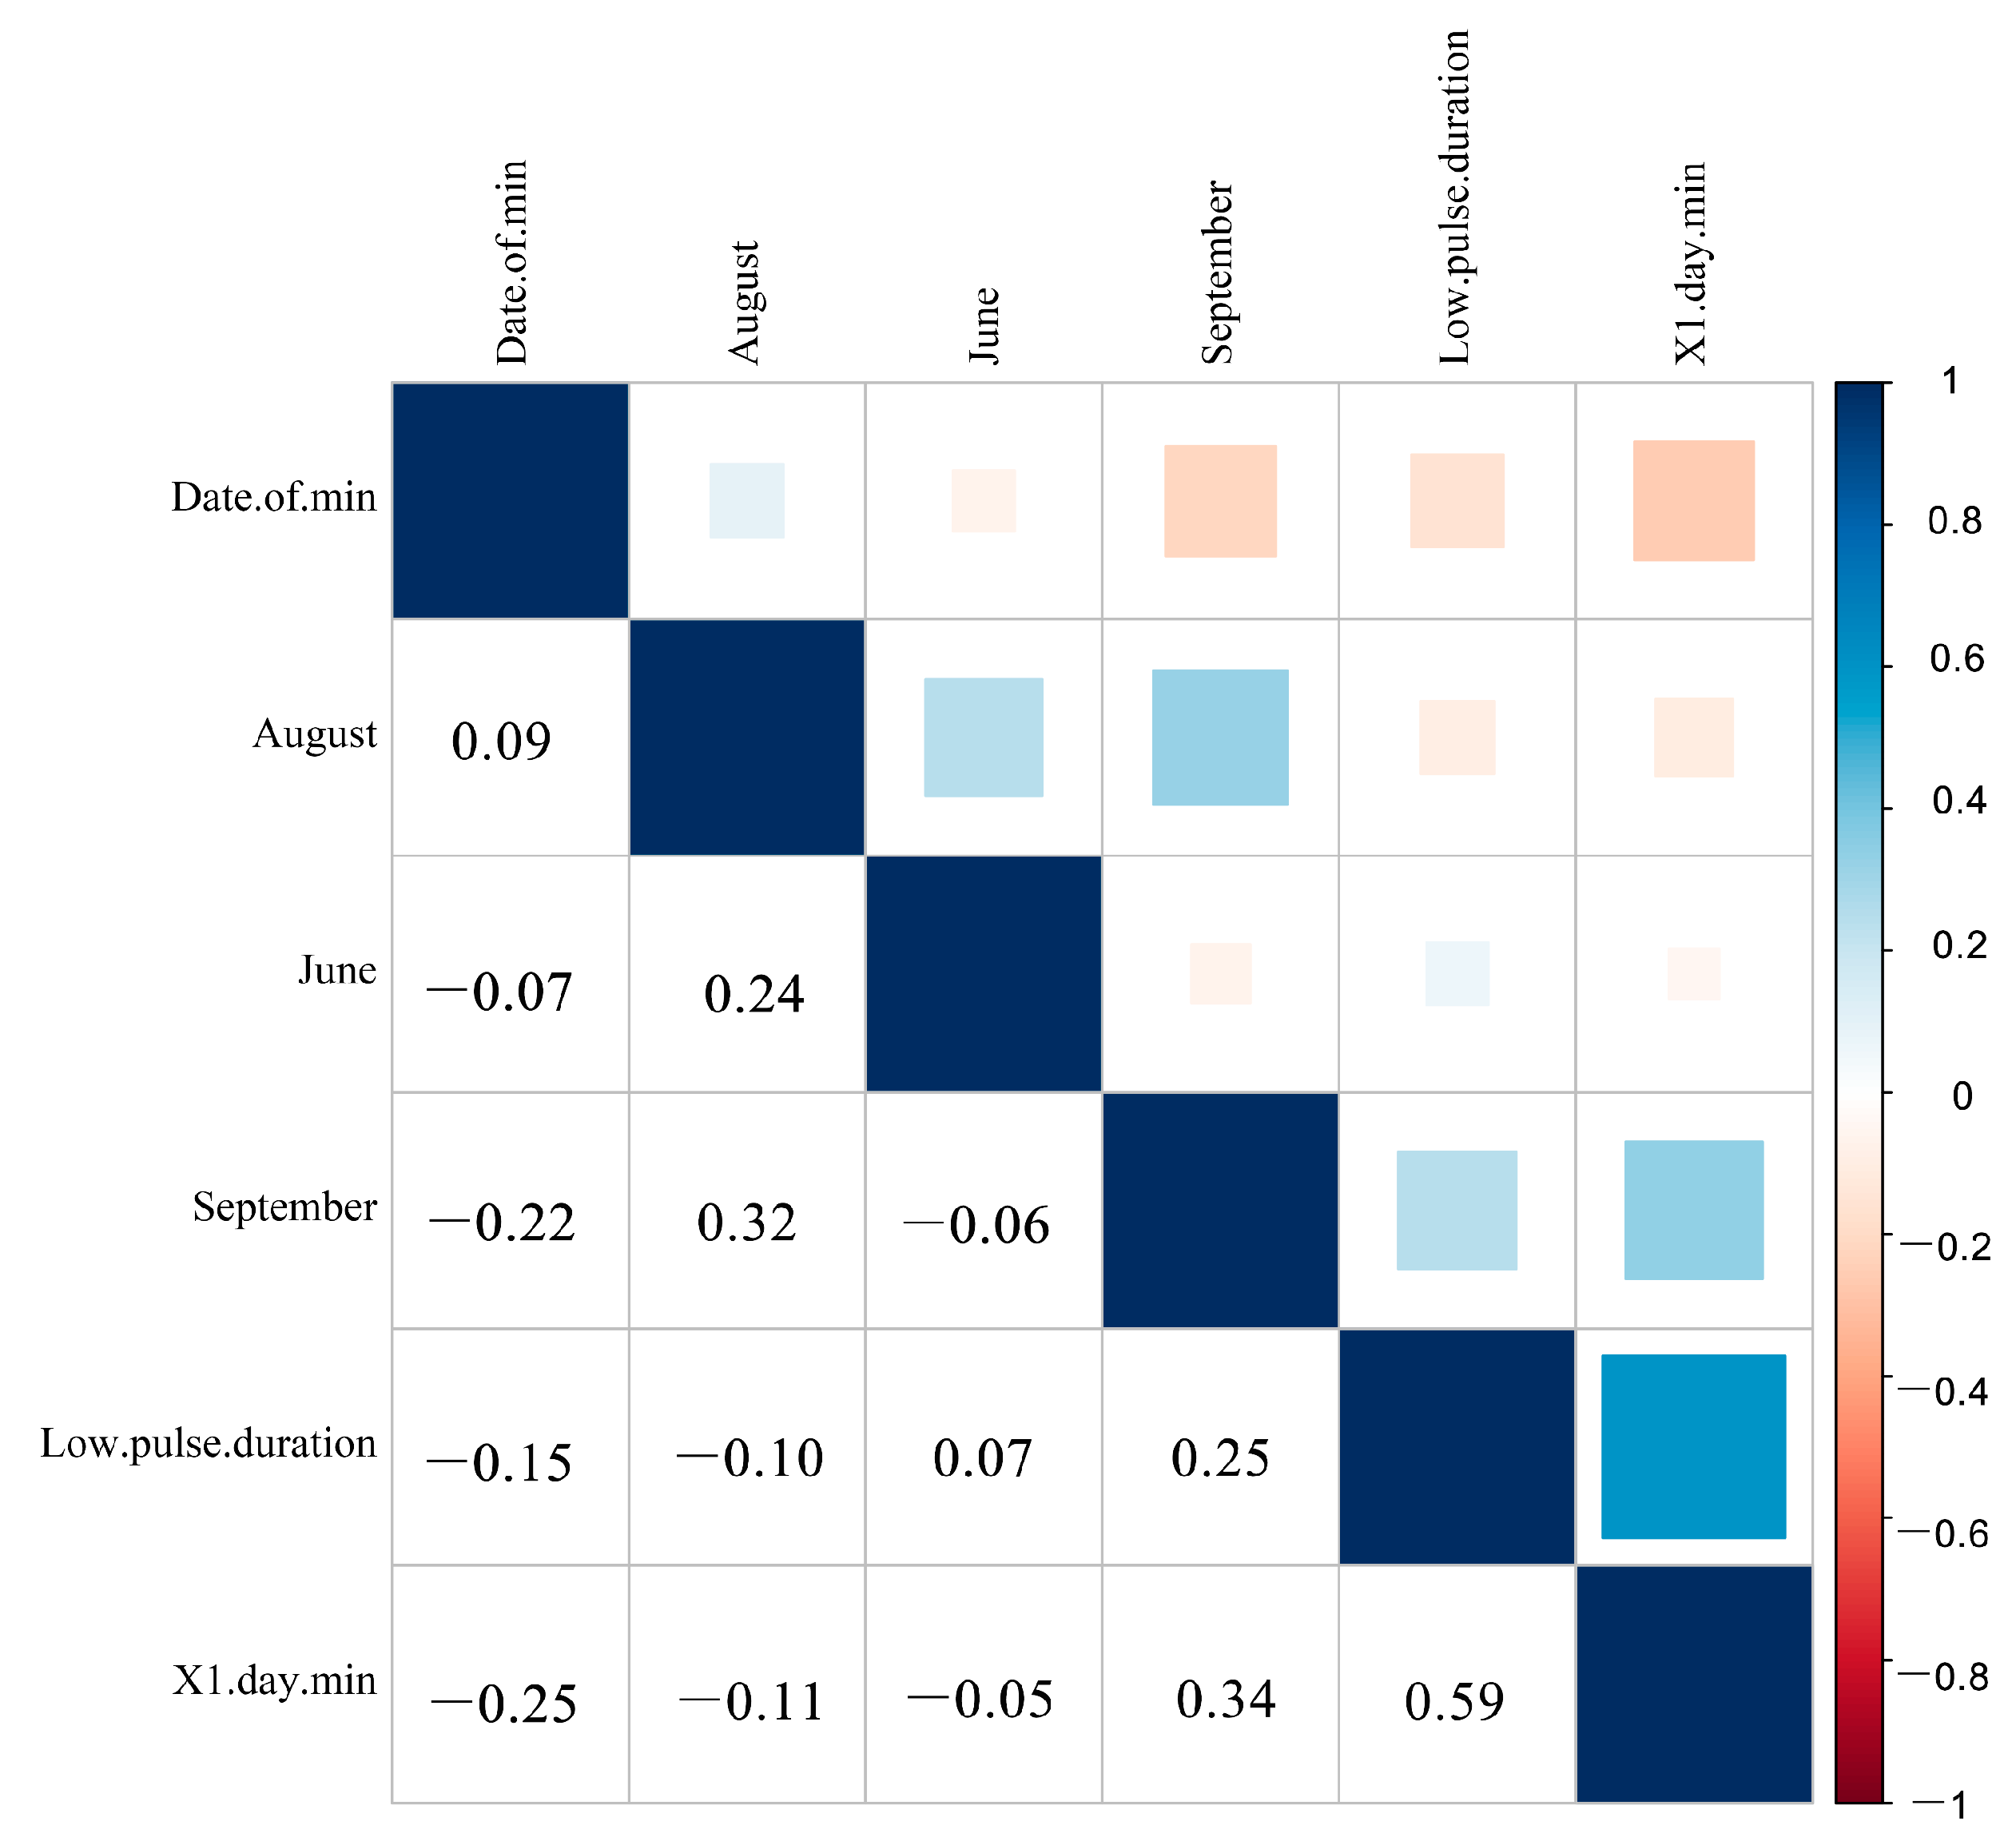
3.4.2. Redundancy Analysis
3.5. Variation Diagnosis
3.5.1. Primary Diagnosis
3.5.2. Detailed Diagnosis
4. Discussion
4.1. The Rationality of ERHIs
4.2. Rationality of Variation Period
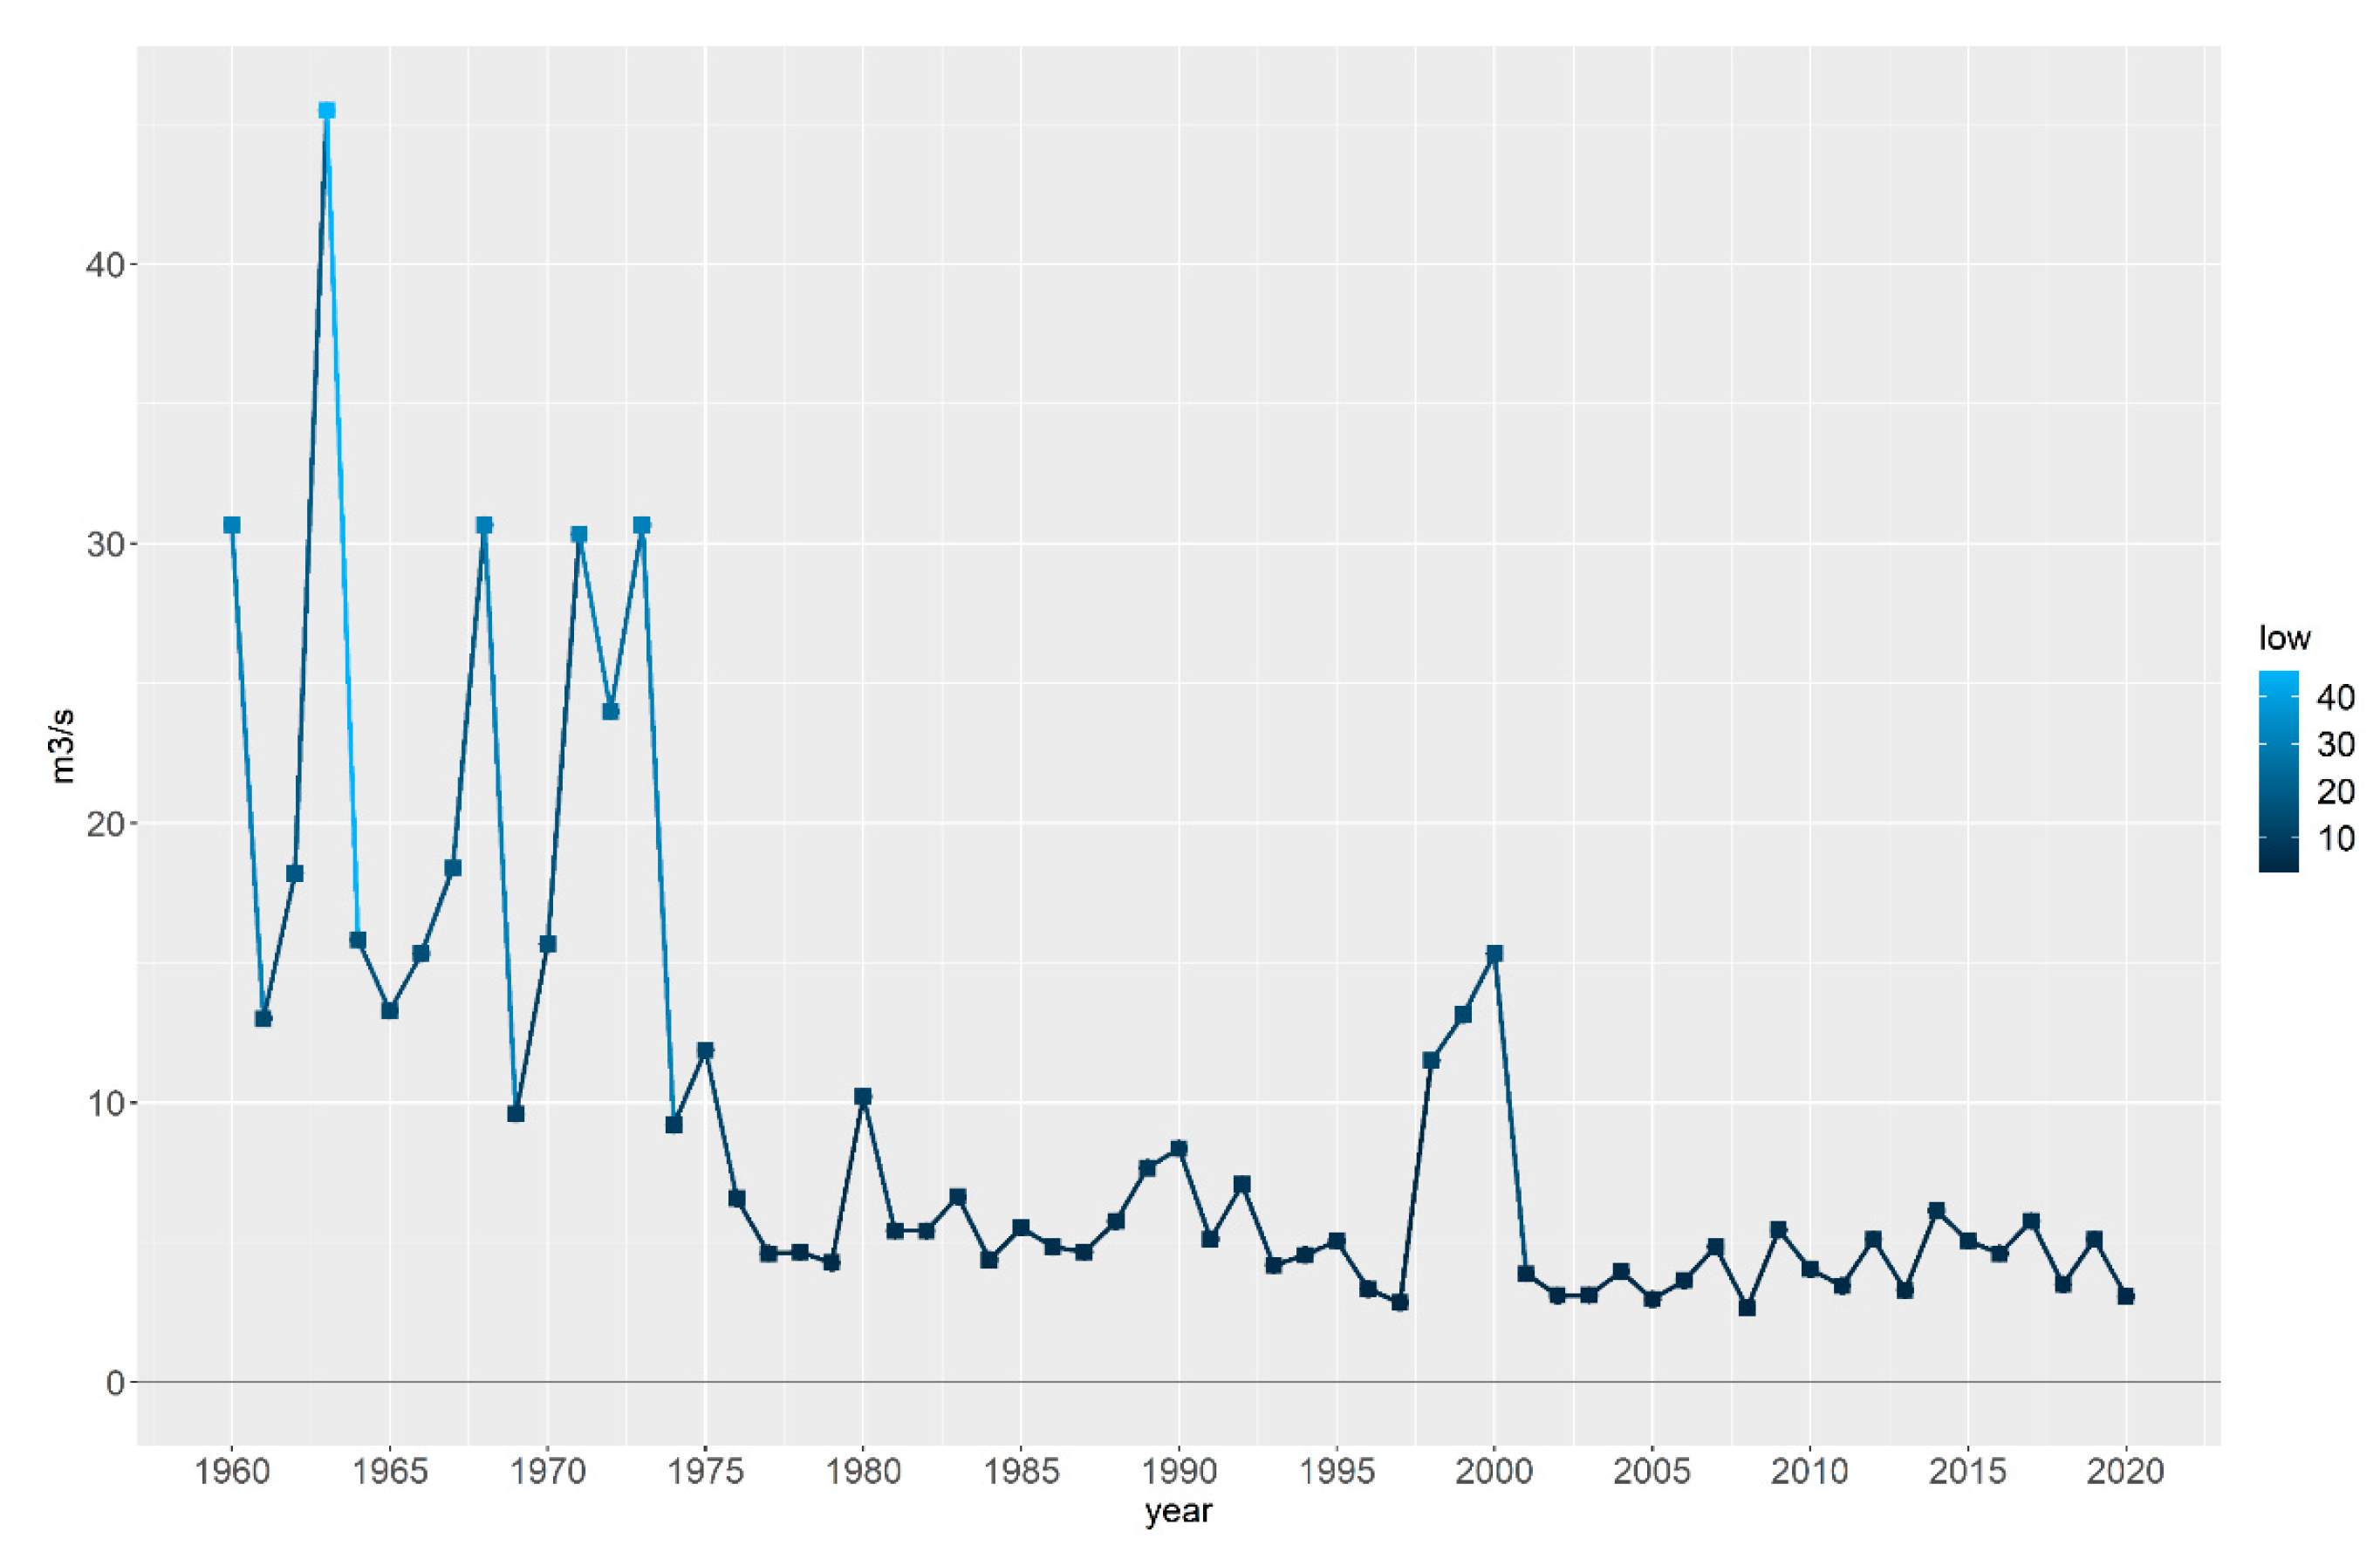
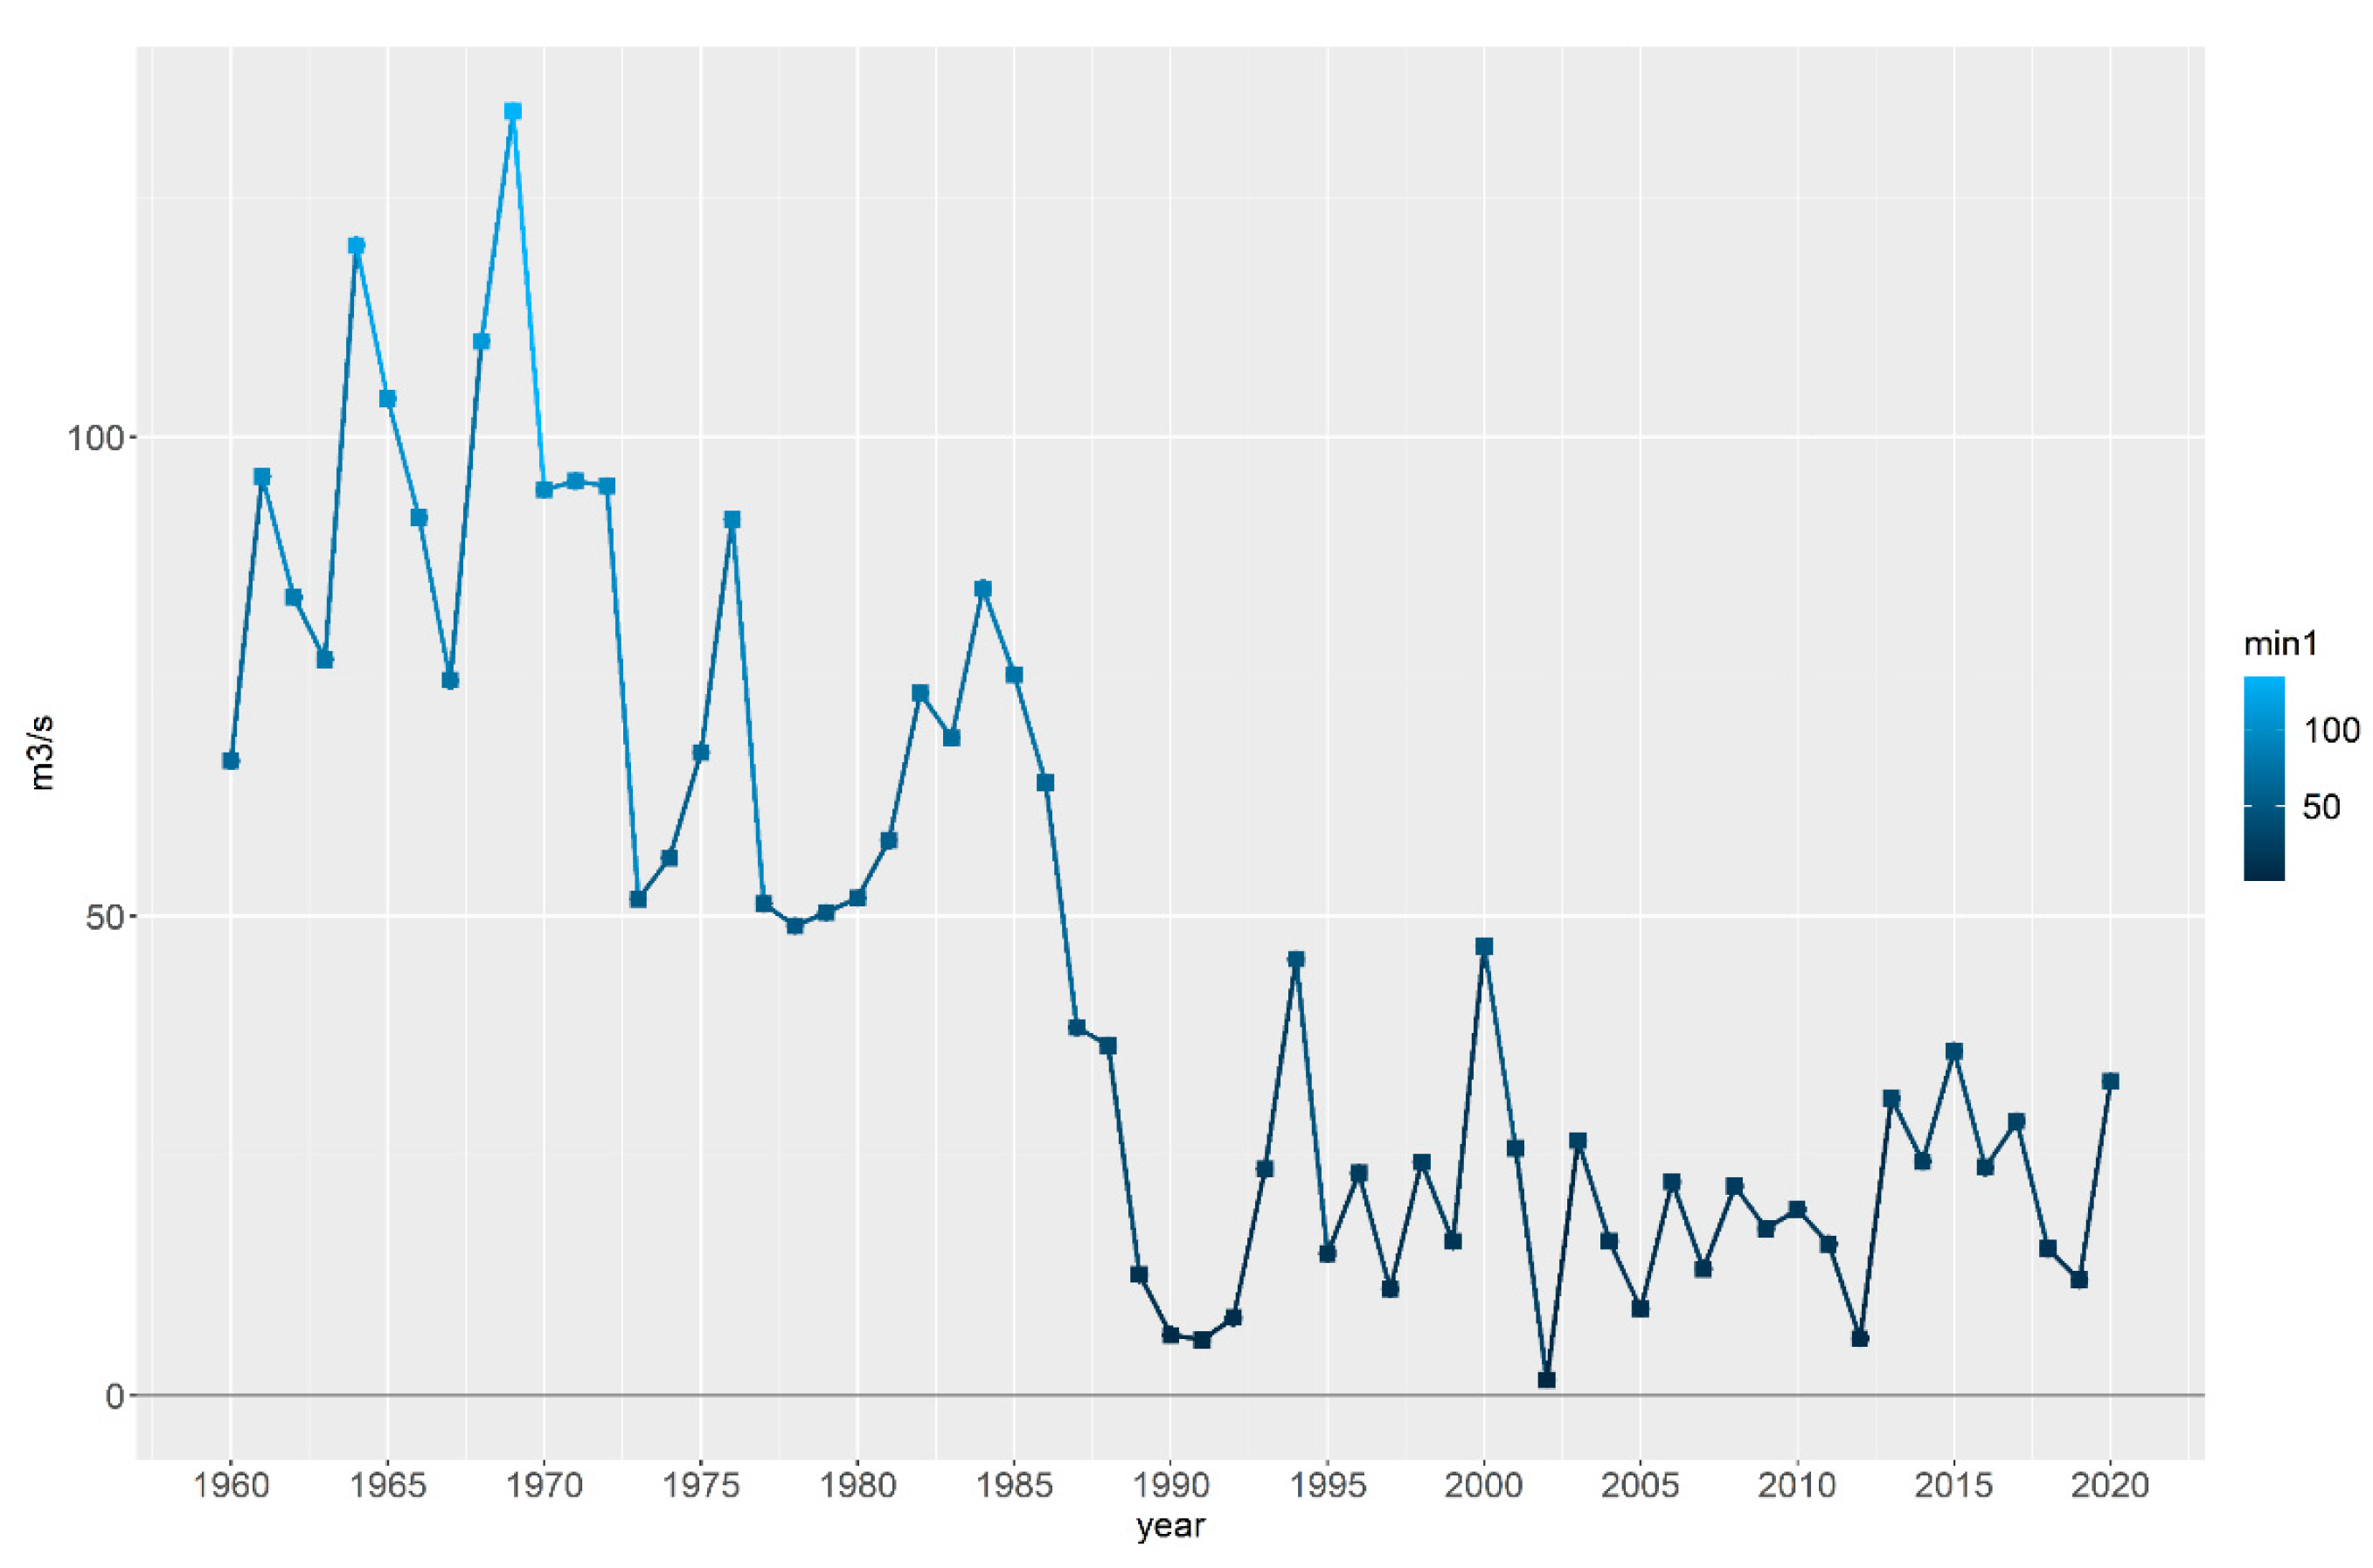
4.2.1. Runoff Perspective
4.2.2. Climate Perspective
4.2.3. Human Factor Perspective
4.3. The limitations of the Methodology
5. Conclusions
- (1)
- The variation point of total runoff in the watershed cannot be regarded as the variation point of watershed ecology, and the ecological variation points of the watershed are accumulated and formed in a certain period of time. That is, watershed ecological demand is the requirement for the hydrological situation process, and the correct determination of ecological requirements needs a stable runoff series based on the hydrological situation process without variation. Therefore, the project used the analytical relationship and sensitivity analysis of ecology and hydrology. The set of ecological–hydrological sensitive indicators with high sensitivity in the basin was obtained by the similar year method, and the variation diagnosis of sensitive indicators was carried out.
- In existing studies, most of the indicators were screened by principal component analysis (PCA) for correlation analysis, without considering the sensitivity of ecological indicators to hydrological changes. The stable runoff series was determined by the variation point of the total annual runoff, which does not conform to the characteristics of ecological flow process control. Therefore, it was difficult to reflect the correct ecological requirements of the basin.
- (2)
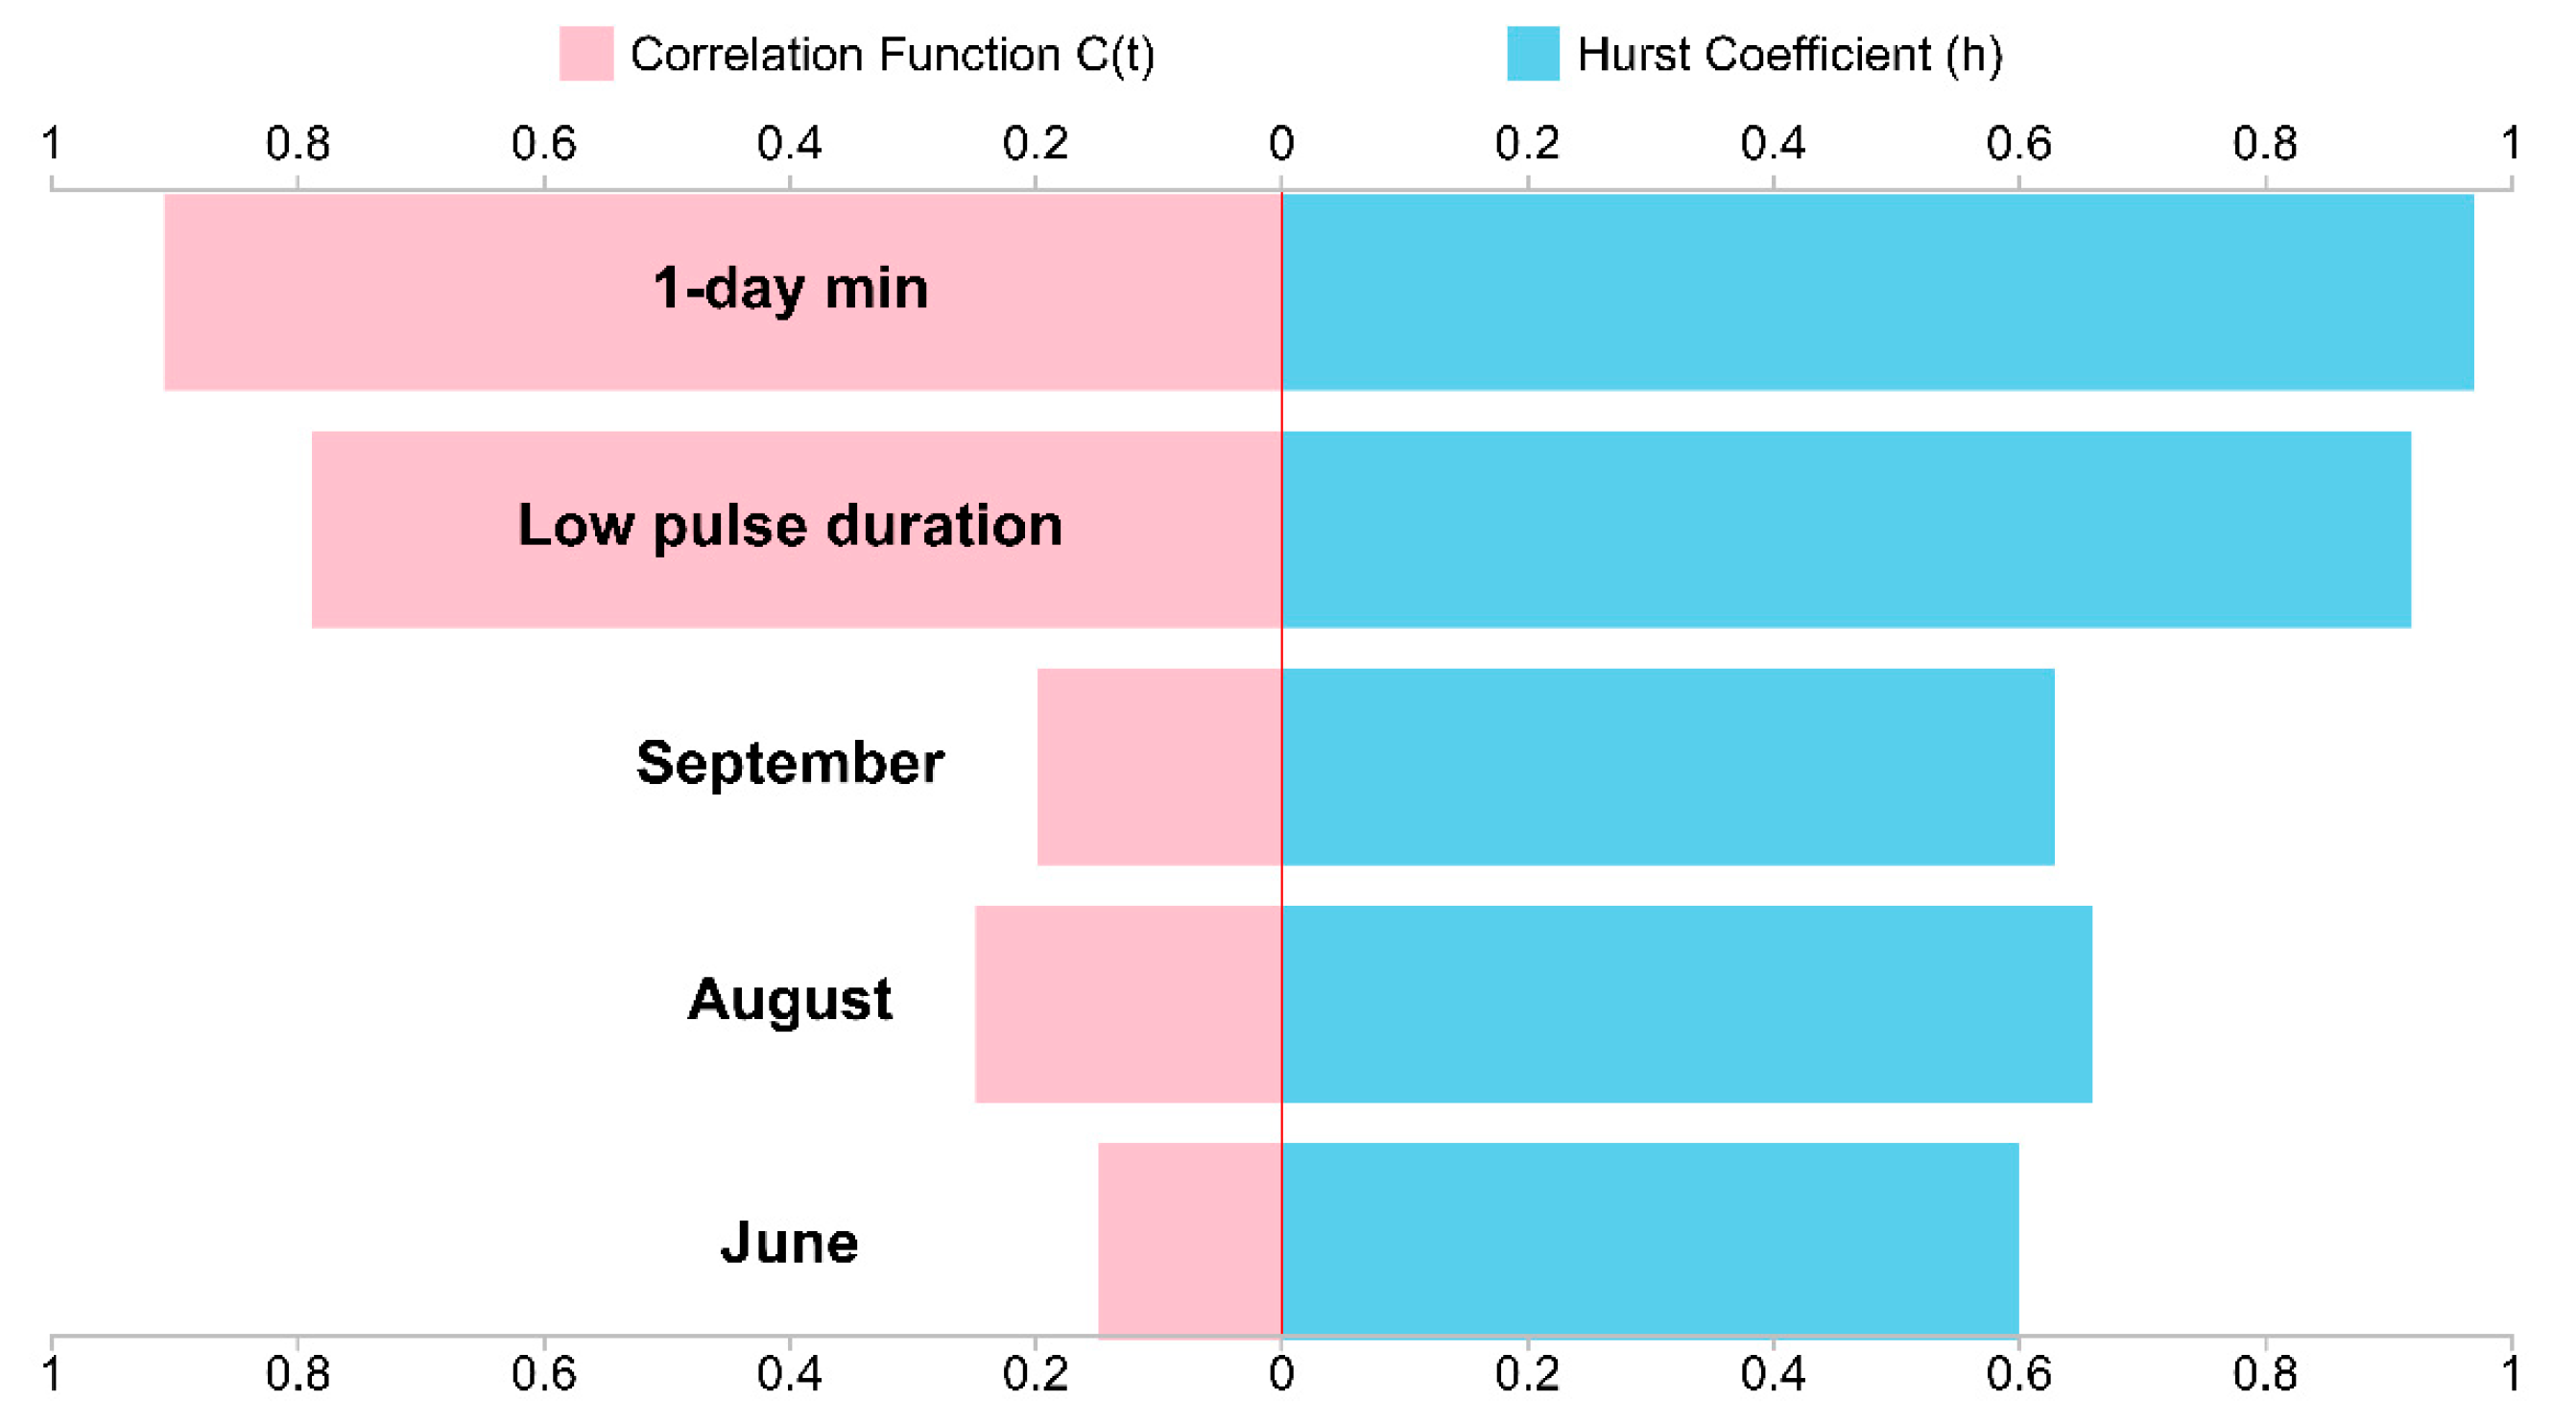
- In this study, the IHA index was used to diagnose the hydrological changes in the watershed from the perspective of eco-hydrology. We proposed an extraction method of the most relevant eco-hydrological indicators based on similar year sensitive indices and the diagnostic method of variation period. By using the sensitivity of indicators in different similar years, the problem of outstanding redundancy among IHA indicators was solved. Among the 32 IHA indexes, six indexes were selected as the most relevant hydrological indexes, which were the June flow, August flow, September flow, low pulse duration, date of min, and 1-day min. The period of eco-hydrological variation in the basin was from 1973 to 1986.
- (3)
- The study found that the periods of extreme climate change and human activities, especially the time of construction of hydraulic structures, were consistent with the variation periods determined by the high variation indicators. It also confirmed that climate change and human activities seriously impacted the hydrological variation within the studied basin. Furthermore, it verified the feasibility of an extraction method for the most relevant eco-hydrological indices based on similar year sensitive indices and the diagnosis method of variation period to diagnose the hydrological variation of river basins.
Author Contributions
Funding
Institutional Review Board Statement
Informed Consent Statement
Data Availability Statement
Conflicts of Interest
References
- Zhang, S.; Ban, X.; Hang, Q.; Liu, D.F. Analysis of hydrological regime changes in the midstream Han River using range of variability approach. J. Hydroelectr. Eng. 2016, 35, 34–43. [Google Scholar] [CrossRef]
- Guo, W.X.; Jin, Y.G.; Li, Y.; Shi, M.Y.; Wang, H.X. Quantitaive Assessment of the Impact of Climate Change and Human Activities on the Hydrological Regime in the Middle and Lower Reaches of the Yangtze River During the Past 60 Years. Resour. Environ. Yangtze Basin 2021, 30, 2464–2470. [Google Scholar] [CrossRef]
- Huang, Q.; Kong, B.; Fan, J.J. Hydrological Elements Comprehensive Detecting Variation. Yellow River 2016, 38, 18–23. [Google Scholar] [CrossRef]
- Yang, Z.F.; Cui, B.S.; Sun, T. The Mechanism, Model and Allocation for Wetland Ecological Water Requirement; Science Press: Beijing, China, 2012; pp. 7–22. [Google Scholar]
- Wang, H.X.; Zhu, Y.W.; Zha, H.F.; Guo, W.X. Environmental Flows in Four Watersheds of Dongting Lake Under Different Hydrological Conditions. J. Hydroecol. 2021, 42, 10–17. [Google Scholar] [CrossRef]
- Zhang, S.Y.; Zhao, G.J.; Mu, X.M.; Tian, P.; Gao, P.; Sun, Y.W. Hydrologic Regime Change and Its Attribution Analysis of River Runoff in Typical Watershed on Loess Plateau. Bull. Soil Water Conserv. 2021, 41, 1–8. [Google Scholar] [CrossRef]
- Zhang, W.H.; Qu, S.M.; Xu, Y.; Shi, P. Influence of Pohe Reservoir on runoff process and hydrological regime of Huanghe River. Water Resour. Prot. 2021, 37, 61–65. [Google Scholar] [CrossRef]
- Zeng, J.F.; Liu, Z.W.; Liu, Y.C.; Zou, J.P.; Tong, X.Q.; Liu, X.G.; Xie, S.S. Eco-hydrological Regime of Source Area of Dongjiang River Based on IHA-RVA. Bull. Soil Water Conserv. 2021, 41, 157–164. [Google Scholar] [CrossRef]
- Tang, Y.; Chen, L.; She, Z. Evaluation of instream ecological flow with consideration of ecological responses to hydrological variations in the downstream Hongshui River Basin, China. Ecol. Indic. 2021, 130, 108104. [Google Scholar] [CrossRef]
- Richter, B.D.; Baumgartner, J.V.; Braun, P.D.P. A Method for Assessing Hydrologic Alteration within Ecosystems. Conserv. Biol. 1996, 10, 1163–1174. [Google Scholar] [CrossRef] [Green Version]
- Mathews, R.; Richter, B.D. Application of the Indicators of Hydrologic Alteration Software in Environmental Flow Setting1. J. Am. Water Resour. Assoc. 2007, 4, 1400–1413. [Google Scholar] [CrossRef]
- Olden, J.D.; Poff, N.L. Redundancy and the choice of hydrologic indices for characterizing streamflow regimes. River Res. Appl. 2003, 19, 101–121. [Google Scholar] [CrossRef]
- Smakhtin, V.U.; Shilpakar, R.L.; Hughes, D.A. Hydrology-based assessment of environmental flows: An example from Nepal. J. Sci. Hydrol. 2006, 51, 207–222. [Google Scholar] [CrossRef] [Green Version]
- Yang, Y.; Cai, X.; Herricks, E.E. Identification of hydrologic indicators related to fish diversity and abundance: A data mining approach for fish community analysis. Water Resour. Res. 2008, 44, 472–479. [Google Scholar] [CrossRef]
- Gao, Y.; Vogel, R.M.; Kroll, C.N.; Poff, N.L.; Olden, J.D. Development of representative indicators of hydrologic alteration. J. Hydrol. 2009, 374, 136–147. [Google Scholar] [CrossRef]
- Cheng, J.X.; Xu, L.G.; Jiang, J.H. Optimal selection of the most ecologically relevant hydrologic indicators and its application for environmental flow calculation in Lake Dongting. J. Lake Sci. 2018, 30, 1235–1245. [Google Scholar] [CrossRef] [Green Version]
- Zhou, Z.H. Machine Learning; Tsinghua University Press: Beijing, China, 2016; p. 229. [Google Scholar]
- Bai, M.C.; Ban, X.; Diplas, P.; Xiao, F. Quantifying the spatio-temporal variation of flow and its ecological impacts in the middle-section of Hanjiang river following the Danjiangkou reservoir impoundment. Resour. Environ. Yangtze Basin 2017, 26, 1476–1487. [Google Scholar] [CrossRef]
- Wang, L.; Shu, Z.K.; Wang, G.Q.; Peng, T.; Lin, Q.X.; Zhou, J. Spatial and Temporal Evolution of Multi-Scale Meteorological Drought in Hanjiang River Basin from 1961 to 2018. Resour. Environ. Yangtze Basin 2021, 30, 1649–1658. [Google Scholar] [CrossRef]
- Deng, P.; Zhang, M.; Guo, H.; Xu, C. Error analysis and correction of the daily GSMaP products over Hanjiang River Basin of China. Atmos. Res. 2018, 214, 121–134. [Google Scholar] [CrossRef]
- Zhao, Z.Y.; Wang, H.R.; Zhao, Y.; Hu, L.T.; Liu, H.J. Analysis of Monthly Precipitation Characteristics of Ankang Station in Upper Hanjiang River from 1950 to 2014 Based on Chaos Theory. J. Yangtze River Sci. Res. Inst. 2021, 38, 137–142. [Google Scholar] [CrossRef]
- Shi, B.F.; Chi, G.T. Green industry evaluation indicators screening model basedon the maximum information content and its application. Syst. Eng. Theory Pract. 2014, 34, 1799–1810. [Google Scholar] [CrossRef]
- Su, L.; Gao, C.C.; Cao, S.S.; Yan, L.Y.; Meng, Z.Q.; Tian, H.M.; Liu, M. Spatial representative evaluation of ambient air quality monitoring stations in the Yangtze River Delta: Taking PM2.5 as an example. Acta Sci. Circum. 2021, 41, 4377–4387. [Google Scholar] [CrossRef]
- Mandelbrot, B.B.; Wallis, J.R. Computer Experiments with Fractional Gaussian Noises: Part 1, Averages and Variances. Water Resour. Res. 1969, 5, 228–241. [Google Scholar] [CrossRef]
- Mandelbrot, B.B.; Wallis, J.R. Computer Experiments with Fractional Gaussian Noises: Part 2, Rescaled Ranges and Spectra. Water Resour. Res. 1969, 5, 242–259. [Google Scholar] [CrossRef]
- Li, H.Q.; Wang, F.Q. Fractional Theory and Its Applications in Molecular Science; Science Press: Beijng, China, 1993; pp. 41–59. [Google Scholar]
- Mann, H.B. Nonparametric Tests Against Trend. Econometrica 1945, 13, 245. [Google Scholar] [CrossRef]
- Beck, J.L.; Katafygiotis, L.S. Updating Models and Their Uncertainties. I: Bayesian Statistical Framework. J. Eng. Mech. 1998, 124, 455–461. [Google Scholar] [CrossRef]
- Katafygiotis, L.S.; Beck, J.L. Updating Models and Their Uncertainties. II: Model Identifiability. J. Eng. Mech. 1998, 124, 463–467. [Google Scholar] [CrossRef]
- Guo, Y.; Hou, S.Z.; Lin, X.Z. Variation characteristics of runoff and sediment in Xiliugou River basin for recent 51 years. J. Arid. Land Resour. Environ. 2014, 28, 176–183. [Google Scholar] [CrossRef]
- Wang, Q.; Wang, S.W.; Hu, Q.F.; Wang, Y.T.; Liu, Y.; Li, L.J. Calculation of instream ecological water requirements under runoff variation conditions: Taking Xitiao River in Taihu Lake Basin as an example. J. Geogr. Sci. 2021, 31, 1140–1158. [Google Scholar] [CrossRef]
- Yonetani, T. Discontinuous Changes of Precipitation in Japan after 1900 Detected by the Lepage Test. J. Meteorol. Soc. Jpn. 1992, 70, 95–104. [Google Scholar] [CrossRef] [Green Version]
- Leveson, N. A new accident model for engineering safer systems. Saf. Sci. 2004, 42, 237–270. [Google Scholar] [CrossRef] [Green Version]
- Xiao, W.W.; An, B.; Jia, D. Temporal Variation Characteristics of Extreme Weather Events in Ankang from 1955 to 2017. J. Soil Water Conserv. 2021, 28, 212–221. [Google Scholar] [CrossRef]


| C(t) | h | Variation Degree | C(t) | h | Variation Degree |
|---|---|---|---|---|---|
| 0 ≤ C(t) < rα | 0.5 ≤ h < hα | No | 0.6 ≤ C(t) < 0.8 | 0.839 ≤ h < 0.924 | Strong |
| rα ≤ C(t) < rβ | hα ≤ h < hβ | Weak | 0.8 ≤ C(t) < 1.0 | 0.924 ≤ h < 1.0 | Extremely strong |
| rβ ≤ C(t) < 0.6 | hβ ≤ h < 0.839 | Medium |
| Diagnostic Methods | References |
|---|---|
| Mann-Kendall method | Mann H.B. [27] |
| Bayesian Analysis | Beck J.L. et al. [28,29] |
| MTT | Guo et al. [30] |
| Sequential Clustering method | Wang [31] |
| Le Page method | Yonetani T. et al. [32] |
| BG segmentation algorithm | N.G. Leveson [33] |
| Different Season | Group | Redistribution of Hydrological Change Indicators |
|---|---|---|
| Dry season | Group 1: Monthly flow | January–May and October–December flows |
| Group 2: Magnitude and duration of annual extreme water conditions | Minimum 1, 3, 7, 30, and 90-day flows, Base flow index | |
| Group 3: Timing of annual extreme water conditions | Date of min | |
| Group 4: Frequency and duration of low pulses | Low pulse count | |
| Low pulse duration | ||
| Group 5: Rate and frequency of water condition changes | Rise rate, Fall rate | |
| Number of reversals | ||
| Wet season | Group 1: Monthly flow | June–September flows |
| Group 2: Magnitude and duration of annual extreme water conditions | Maximum 1, 3, 7, 30, and 90-day flows | |
| Group 3: Timing of annual extreme water conditions | Date of max | |
| Group 4: Frequency and duration of high pulses | High pulse count | |
| High pulse duration | ||
| Group 5: Rate and frequency of water condition changes | Rise rate, Fall rate | |
| Number of reversals |
| Sample Year | Season | Similar Year | |||||||||
|---|---|---|---|---|---|---|---|---|---|---|---|
| 1962 | wet | 1960 | 1969 | 1970 | 1971 | 1972 | 1979 | 1988 | 1990 | 2012 | 2017 |
| dry | 1965 | 1971 | 1972 | 1980 | 1990 | 1994 | 1996 | 2009 | 2015 | 2019 | |
| 1976 | wet | 1960 | 1969 | 1970 | 1973 | 1978 | 1979 | 1990 | 2005 | 2012 | 2019 |
| dry | 1965 | 1970 | 1981 | 1982 | 1990 | 1994 | 1996 | 2009 | 2015 | 2019 | |
| 1984 | wet | 1961 | 1963 | 1967 | 1968 | 1974 | 1975 | 1980 | 1989 | 2000 | 2007 |
| dry | 1965 | 1967 | 1968 | 1969 | 1971 | 1972 | 1980 | 1990 | 1994 | 1996 | |
| 1985 | wet | 1961 | 1967 | 1973 | 1975 | 1978 | 2000 | 2005 | 2007 | 2012 | 2019 |
| dry | 1967 | 1968 | 1969 | 1971 | 1972 | 1975 | 1980 | 1990 | 2000 | 2003 | |
| 1986 | wet | 1971 | 1977 | 1988 | 1993 | 2002 | 2004 | 2009 | 2013 | 2015 | 2018 |
| dry | 1960 | 1966 | 1977 | 1987 | 1988 | 1993 | 1998 | 2006 | 2012 | 2018 | |
| 1991 | wet | 1971 | 1972 | 1977 | 1988 | 1993 | 2002 | 2009 | 2013 | 2015 | 2018 |
| dry | 1978 | 1979 | 1993 | 1995 | 1997 | 2001 | 2007 | 2010 | 2013 | 2020 | |
| 1992 | wet | 1969 | 1970 | 1971 | 1972 | 1977 | 1979 | 1988 | 1990 | 2013 | 2017 |
| dry | 1969 | 1970 | 1971 | 1972 | 1977 | 1979 | 1988 | 1990 | 2013 | 2017 | |
| 2008 | wet | 1966 | 1993 | 1994 | 1995 | 1996 | 1997 | 1999 | 2004 | 2018 | 2020 |
| dry | 1970 | 1981 | 1982 | 1987 | 1988 | 1989 | 2004 | 2006 | 2011 | 2018 | |
| 2014 | wet | 1961 | 1967 | 1973 | 1975 | 1978 | 1980 | 2000 | 2005 | 2007 | 2019 |
| dry | 1960 | 1966 | 1977 | 1987 | 1988 | 1989 | 1998 | 2006 | 2011 | 2018 | |
| 2016 | wet | 1966 | 1994 | 1995 | 1996 | 1997 | 1999 | 2001 | 2004 | 2006 | 2020 |
| dry | 1960 | 1966 | 1977 | 1987 | 1988 | 1993 | 1998 | 2006 | 2012 | 2018 | |
| Group | ERHIs | Seasons |
|---|---|---|
| Group 3: Timing of annual extreme water conditions | Date of min | Dry |
| Group 1: Monthly flow | August flow | Wet |
| Group 1: Monthly flow | June flow | Wet |
| Group 1: Monthly flow | September flow | Wet |
| Group 4: Frequency and duration of high and low pulses | Low pulse duration | Dry |
| Group 2: Magnitude and duration of annual extreme water conditions | 1-day min | Dry |
| Diagnostic Methods | Low Pulse Duration | 1-Day Min |
|---|---|---|
| Mann-Kendall method | 1977 | —— |
| Bayesian Analysis | 1960 | 1973 |
| MTT | 1973,1974,1977 | 1973,1986 |
| Sequential Clustering method | 1973 | 1986 |
| Le Page method | 1973,1974 | 1973,1986 |
| BG segmentation algorithm | 1974 | 1986 |
Publisher’s Note: MDPI stays neutral with regard to jurisdictional claims in published maps and institutional affiliations. |
© 2022 by the authors. Licensee MDPI, Basel, Switzerland. This article is an open access article distributed under the terms and conditions of the Creative Commons Attribution (CC BY) license (https://creativecommons.org/licenses/by/4.0/).
Share and Cite
Li, Z.; Cai, S.; Lei, X.; Wang, L. Diagnosis of Basin Eco-Hydrological Variation Based on Index Sensitivity of Similar Years: A Case Study in the Hanjiang River Basin. Water 2022, 14, 1931. https://doi.org/10.3390/w14121931
Li Z, Cai S, Lei X, Wang L. Diagnosis of Basin Eco-Hydrological Variation Based on Index Sensitivity of Similar Years: A Case Study in the Hanjiang River Basin. Water. 2022; 14(12):1931. https://doi.org/10.3390/w14121931
Chicago/Turabian StyleLi, Zhe, Siyu Cai, Xiaohui Lei, and Lingmin Wang. 2022. "Diagnosis of Basin Eco-Hydrological Variation Based on Index Sensitivity of Similar Years: A Case Study in the Hanjiang River Basin" Water 14, no. 12: 1931. https://doi.org/10.3390/w14121931
APA StyleLi, Z., Cai, S., Lei, X., & Wang, L. (2022). Diagnosis of Basin Eco-Hydrological Variation Based on Index Sensitivity of Similar Years: A Case Study in the Hanjiang River Basin. Water, 14(12), 1931. https://doi.org/10.3390/w14121931