
Comparison of Projections of Precipitation over Yangtze River Basin of China by Different Climate Models


1
Research Institute of Historical and Cultural Maps, Sanjiang University, Nanjing 210012, China
2
School of Geography, Nanjing Normal University, Nanjing 210023, China
3
Nanjing Research Institute of Hydrology and Water Conservation Automation, Ministry of Water Resources, Nanjing 210012, China
4
School of Applied Meteorology, Nanjing University of Information Science and Technology, Nanjing 210044, China
*
Author to whom correspondence should be addressed.
Water 2022, 14(12), 1888; https://doi.org/10.3390/w14121888
Submission received: 27 April 2022
/
Revised: 9 June 2022
/
Accepted: 10 June 2022
/
Published: 12 June 2022
(This article belongs to the Special Issue Soil Moisture Content and Crop Production Research)
Abstract
:Based on the observational dataset CN05.1 and the Coupled Model Intercomparison Project (CMIP), this study assesses the performance of CMIP5 and CMIP6 projects in projecting mean precipitation at annual and seasonal timescales in the Yangtze River Basin of China over the period 2015–2020 under medium emission scenarios (RCP4.5/SSP2-4.5). Results indicate that the multi-model ensemble (MME) of CMIP6 overall has lower relative bias and root-mean square error of both annual and seasonal mean than that of CMIP5, except for winter, but both of the two ensembles show the best projected accuracy in winter. Generally, CMIP6 outperformed CMIP5 in capturing spatial and temporal pattern over the YRB, especially in the midstream and downstream areas, which have high precipitation. Further analyses suggest that the CMIP6 GCMs have lower median normalized root-mean square error than CMIP5 GCMs. Based on the Taylor skill (TS) score, both CMIP6 and CMIP5 GCMs are ranked to evaluate relative model performance. CMIP6 GCMs have higher ranks than CMIP5 GCMs, with an average TS score of 0.68 (0.55) for CMIP6 (CMIP5), and three out of the five highest scored GCMs are CMIP6 GCMs. However, the CMIP6 precipitation projections are still quite uncertain, thus requiring further assessment and correction.
1. Introduction
The Sixth Assessment Report of the Intergovernmental Panel on Climate Change (IPCC) indicates that human activities have been affecting the climate with increasing intensity, resulting in large changes in regional climate and more frequent extreme weather events [1]. Global Climate Models (GCMs) are the leading and most effective tool with which to study the historical and future climate. The World Climate Research Program (WCRP) has developed a standard experimental framework, the Coupled Model Intercomparison Project (CMIP), which is used to evaluate the results of GCMs developed by 30 international institutions, on the basis of idealized experiments, to study historical and future climate [2]. CMIP Phase 6 (CMIP6) is the latest CMIP version and has been available since 2016. Compared with the previous version (CMIP5), CMIP6 adopts a matrix framework based on shared socio-economic pathways (SSPs) and representative concentration pathways (RCPs). In addition to future socio-economic changes, the new scenarios include measures to slow, adapt to, and respond to climate change, and the models typically have higher resolutions [3,4]. These improvements in models raise some important issues, including whether the updated models have a stronger capability and whether the uncertainty can be narrowed.
In recent years, scientists from various countries have used GCMs to conduct considerable research on climate simulations and climate change projections. Most recent studies have focused on the CMIP5 GCMs to evaluate elements of the hydrological cycle, such as atmospheric precipitation [5,6,7,8,9] and surface hydrological processes [10,11] and only a few scholars have studied CMIP6 GCMs precipitation simulations; hence, studies comparing CMIP6 and CMIP5 precipitation simulations and climate change projections are rare. For example, Kim et al. [12] evaluated the performance of the CMIP6 GCMs in simulating extreme climate indices over Michigan and found that its abilities in modelling precipitation intensity and frequency indices were comparable to those of the CMIP5 models, whereas precipitation intensity simulations were improved in CMIP6 because of reduced dryland biases. Chen et al. [13] evaluated the CMIP6 model’s ability to simulate extreme climates in key global regions and found that CMIP6 can better reproduce the significant differences in extreme precipitation between China and North America in the southeastern and northwestern regions. Yasin et al. [14] compared the precipitation modelling performances of CMIP5 and CMIP6 with observational data over northeastern Iran and found that the CMIP6 CGMs’ensemble outperformed CMIP5 in most seasons and stations. Bağçaci et al. [15] compared the performances of models available in CMIP5 and CMIP6 for monthly precipitation and temperature over Turkey and found significant improvement in the CMIP6 models in interpreting the climate signal and indicated less intermodel variability than that in CMIP5. However, due to factors such as the complexity of the climate system and the limitations of model building conditions, there are many uncertainties in the simulation and projection of climate change by climate models [16,17,18,19]. Many scholars have studied the projection of future climate change, but there are relatively few studies have evaluated the uncertainty of CMIP5 and CMIP6 models for the projection of future climate change. Accordingly, more accurate projections of future climate are necessary for reference.
The Yangtze River Basin (YRB) crosses three major economic areas in the eastern, central, and western parts of China, thus playing a crucial role in influencing the national economy. The basin has a complex and variable landform and is highly sensitive to climate change especially in the Source Area and Mid-lower reaches of the YRB [20,21]. The frequent occurrences of drought and flood hazards in this area have impacted China’s long-term development strategy. Thus, it is essential to predict climate change in the YRB with high accuracy in the context of global warming. Previous studies of the YRB have focused mainly on assessing the models’ capability of simulating historical climate [22,23,24] and on the direct projection of future climate based on the scenario output data of the models [25,26,27,28,29]. However, these studies were conducted based on the previous version of CMIP (CMIP5), and there are no studies so far in detail investigated the performance difference between CMIP5 and CMIP6 models in the YRB, using CMIP5 and CMIP6 to see whether or not any improvement and/or change exist. At this point, it is essential to comparatively and comprehensively analyze the climate projections in the YRB. On the other hand, these studies have rarely considered the associated uncertainties in the projections. Some studies have considered only the deviation in climate projections between models, and very few studies have focused on the model projection error. Specifically, the uncertainty of model projections will greatly affect the accuracy of future climate change, especially precipitation change projections, and may even be misleading to potential users. Therefore, while projecting future climate change, its uncertainty must be assessed. The future projected data of the CMIP5 models starts in 2006, and that of the CMIP6 models starts in 2015, it has been 7 years since both of them covered. Uncertainties can be assessed and compared with meteorological observation records.
We examine the YRB as the research subject in this study and utilized the precipitation grid dataset provided by the Chinese National Climate Center and the future scenario predictive model datasets of CMIP5 and CMIP6, and we compare and assess the errors in precipitation projection for the basin. The goal of this study is to provide more accurate information about climate change in the YRB and provide a reference for studying the ecological geography, such as surface processes, in this basin for scholars and decision-makers. The study is organized as follows: Section 2 introduces the study area, models, data, and methods; Section 3 performances of CMIP5-MME, CMIP6-MME, individual and homologous GCMs precipitation were compared based on spatial distribution, temporal distribution, and seasonal variations; Section 4 discusses the results; and the final section provides the concluding remarks.
2. Materials and Methods
2.1. Study Area
The YRB is the third largest river basin in the world and is one of the most important water resources in China. The YRB has a total area of approximately 1,800,000 km2 and is located at 90°33′ E-122°25′ E, 24°30′ N–35°45′ N [22]. The basin has a complex landform and appears as a three-level ladder, which, from upstream to downstream, reaches the Tibetan Plateau, Hengduan Mountains, Yunnan-Guizhou Plateau, Sichuan Basin, Jiangnan hills, and the plain of the middle and lower reaches of the Yangtze River. Thus, the basin has complex climate types, and most of the areas within the basin belong to a subtropical monsoon climate except for the Tibetan Plateau, which has an alpine climate [29]. Affected by the water vapor transport path and landform, the annual precipitation is heterogeneously distributed across the YRB with a decreasing trend from southeast to northwest. The annual precipitation in the source area of the Yangtze River is less than 400 mm, characterizing the area as an arid zone; most areas in the basin have an annual precipitation of 800–1600 mm, representing a humid zone. The special humid zone with annual precipitation greater than 1600 mm is located mainly in the western and eastern margins of the Sichuan Basin, Jiangxi, and parts of Hunan and Hubei. The semi-humid zone with an annual precipitation of 400–800 mm is located mainly in the western Sichuan Plateau, Qinghai, parts of Gansu, and the northern part of the middle reaches of the Han River. The rainy areas, with an annual precipitation of more than 2000 mm, are all distributed in small, mountainous areas [30]. Although the annual mean precipitation is approximately 1100 mm within the basin, due to the highly non-uniform distribution, 60–80% of the precipitation occurs from May–October [31]. The research area is shown in Figure 1.
2.2. Data Source
Twenty GCMs were selected for this study. Among these, 10 belong to CMIP5, whereas 10 homologous GCMs belong to CMIP6. Monthly precipitation data from future projections of both model groups under the future scenarios RCP4.5 and SSP2-4.5 were used in this study. Because the CMIP6 data start in the year 2015, the period 2015–2020 is chosen for evaluation of precipitation. The general information of the GCMs is summarized in Table 1, in which the model numbers 1–10 correspond to CMIP5 and numbers 11–20 correspond to CMIP6.
Precipitation data applied for assessment are obtained from the CN05.1 monthly dataset established by the Chinese National Climate Center through in situ data at 2416 stations over China, with a horizontal resolution of 0.25° × 0.25° [32,33,34]. Given that the horizontal resolution varies with GCMs, and to facilitate comparison of GCMs data with observed data, we remap all GCMs and CN05.1 data to the horizontal resolution of 0.5° × 0.5° with a bilinear interpolation algorithm. The arithmetic mean of GCMs is used to calculate the multi-model ensemble (MME). The spatial patterns of mean precipitation of winter (DJF), spring (MAM), summer (JJA), and autumn (SON), as well as annual mean precipitation, were analyzed for the YRB.
2.3. Data Analysis Methods
To access the performance of each GCM and their ensemble in projecting annual and seasonal precipitation in the study area was analyzed by 4 statistical indices: (1) relative bias (BIAS, ), (2) spatial correlation coefficient (CC, ), (3) root-mean square error (RMSE, ), and (4) standard deviation (STD, ). BIAS is used to describe the systematic deviation between projected and observed values. If there is no deviation, it is 0. A positive value indicates that the project is too large, and a negative value indicates that the project is too small. CC is used to evaluate the degree of linear correlation between projected and observed values. A positive value represents a positive correlation, and a negative value represents a negative correlation. A complete positive correlation is 1. RMSE was used to evaluate the overall level of error and the accuracy of CMIP6 and CMIP5 GCMs. The RMSE close to zero is indicative of high accuracy between observed and projected values. STD is the average amount of variability in your dataset and is calculated as the square root of the variance. A high standard deviation means that values are generally far from the mean, while a low standard deviation indicates that values are clustered close to the mean. These statistical indices are described as follows:
where P is the GCM pojections, O is the observations (here CN05.1 data), N is the number of spatial grid points contained over the YRB. and represent the value of an arbitrary dataset and its mean, respectively.
When comparing GCMs and homologous GCMs, the Taylor [35] diagram, which illustrates the spatial correlation coefficient (SCC), the standard deviation (STD), and the centered root-mean square error (CRMSE) of annual and seasonal precipitation over YRB between each GCMs and observation for the period 2015–2020. In addition, recent approach of model ranking, also known as Taylor skill (TS) score is used to assess model skill. TS was introduced to quantify the SCC and STD between GCMs and observed data to evaluate the projected accuracy [36]. The mathematical expression can be expressed as Equation (5).
where is the correlation coefficient between observed and GCM projected data, and represent the standard deviation (STD) of GCM-projected and observed data, and represents the maximum value of in the selected GCM.
3. Results
3.1. Comparison between CIMP5-MME and CMIP6-MME Project Precipitation
As illustrated in Figure 2, the maps compare the precipitation pattern over the YRB from 2015 to 2020. The precipitation spatial patterns of CMIP6-MME and CMIP5-MME were consistent with those of the observed data across seasons. The average annual precipitation in most areas of the YRB is greater than 1000 mm (Figure 2c). The high-value areas of regional average precipitation are mainly distributed in the midstream and downstream areas such as Hubei, Hunan and Jiangxi, and the low-value areas are mainly distributed in Qinghai, Tibet, and other upstream areas. As a whole, the spatial distribution of the average annual precipitation in the midstream and downstream areas is higher than that in the upstream areas, and the distribution trend of the southern region is higher than that of the northern region. However, as depicted in Figure 2a,b, the high-value areas of average annual precipitation both CMIP5-MME and CMIP6-MME occurred on the West Sichuan Plateau. The low-value areas of CMIP5-MME and CMIP6-MME are consistent with the observed data. In winter (Figure 2d–f), the precipitation decreases from southeast to northwest, and the low-value areas of CMIP5-MME and CMIP6-MME are mainly in Qinghai, and their spatial distribution is smaller than that of the observed data. The distribution of high-value areas, CMIP6-MME is closer to the observed data than CMIP5-MME. In spring (Figure 2g–i), the precipitation in the southeast area was the greatest. In summer (Figure 2j–l) and autumn (Figure 2m–o), CMIP5-MME and CMIP6-MME showed poor reproducibility of spatial patterns, and the areas with high precipitation values are distributed in the West Sichuan Plateau, but not in the central and upstream areas as shown by the observed data.
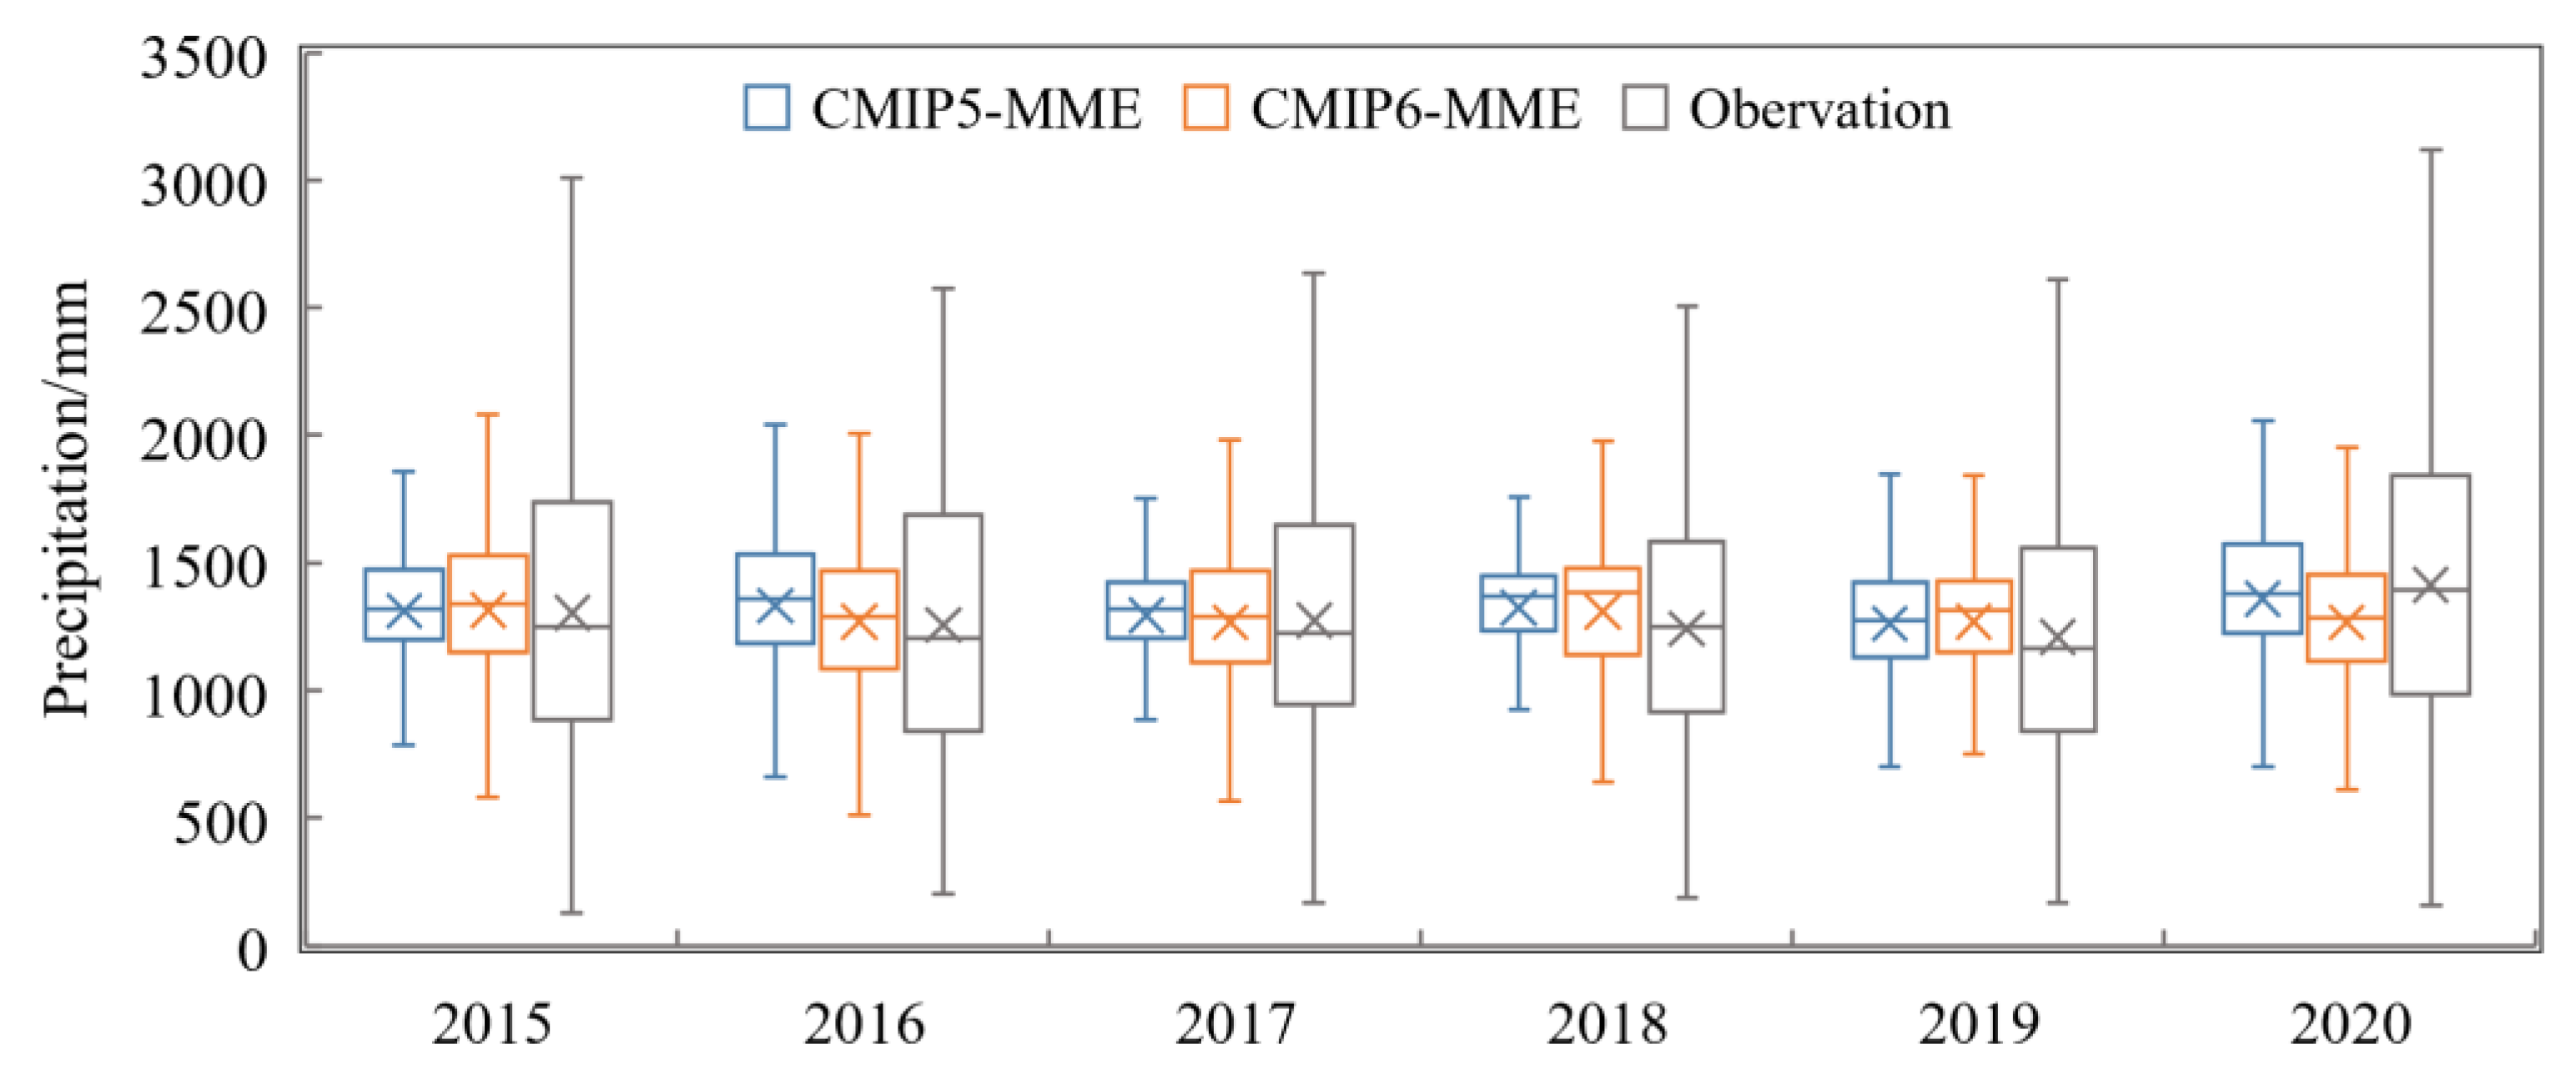
The average annual precipitation for each year from 2015 to 2020 was calculated and compared, as illustrated in Figure 3, through box plot of the CMIP5-MME, CMIP6-MME and observed data. The annual precipitation distributions of the CMIP5-MME and CMIP6-MME data are typically consistent with the observed data. The annual precipitation of the CMIP5-MME was slightly greater than that of the observed data except for 2020, whereas that of the CMIP6-MME was greater than that of the observed data except for 2017 and 2020. The mean annual precipitation ranges of the CMIP5-MME, CMIP6-MME and observed data from 2015 to 2020 were 597.90–2116.48, 476.77–2034.64, and 169.31–2710.05 mm, respectively. The average annual precipitation of CMIP6-MME is closer to the observed data in 2016, 2017, and 2018 than that of CMIP5-MME. In addition, the error between CMIP6-MME and observed data in 2020 is larger than that of CMIP5-MME, but in 2015 and 2019, it is close to the projected value of CMIP5.
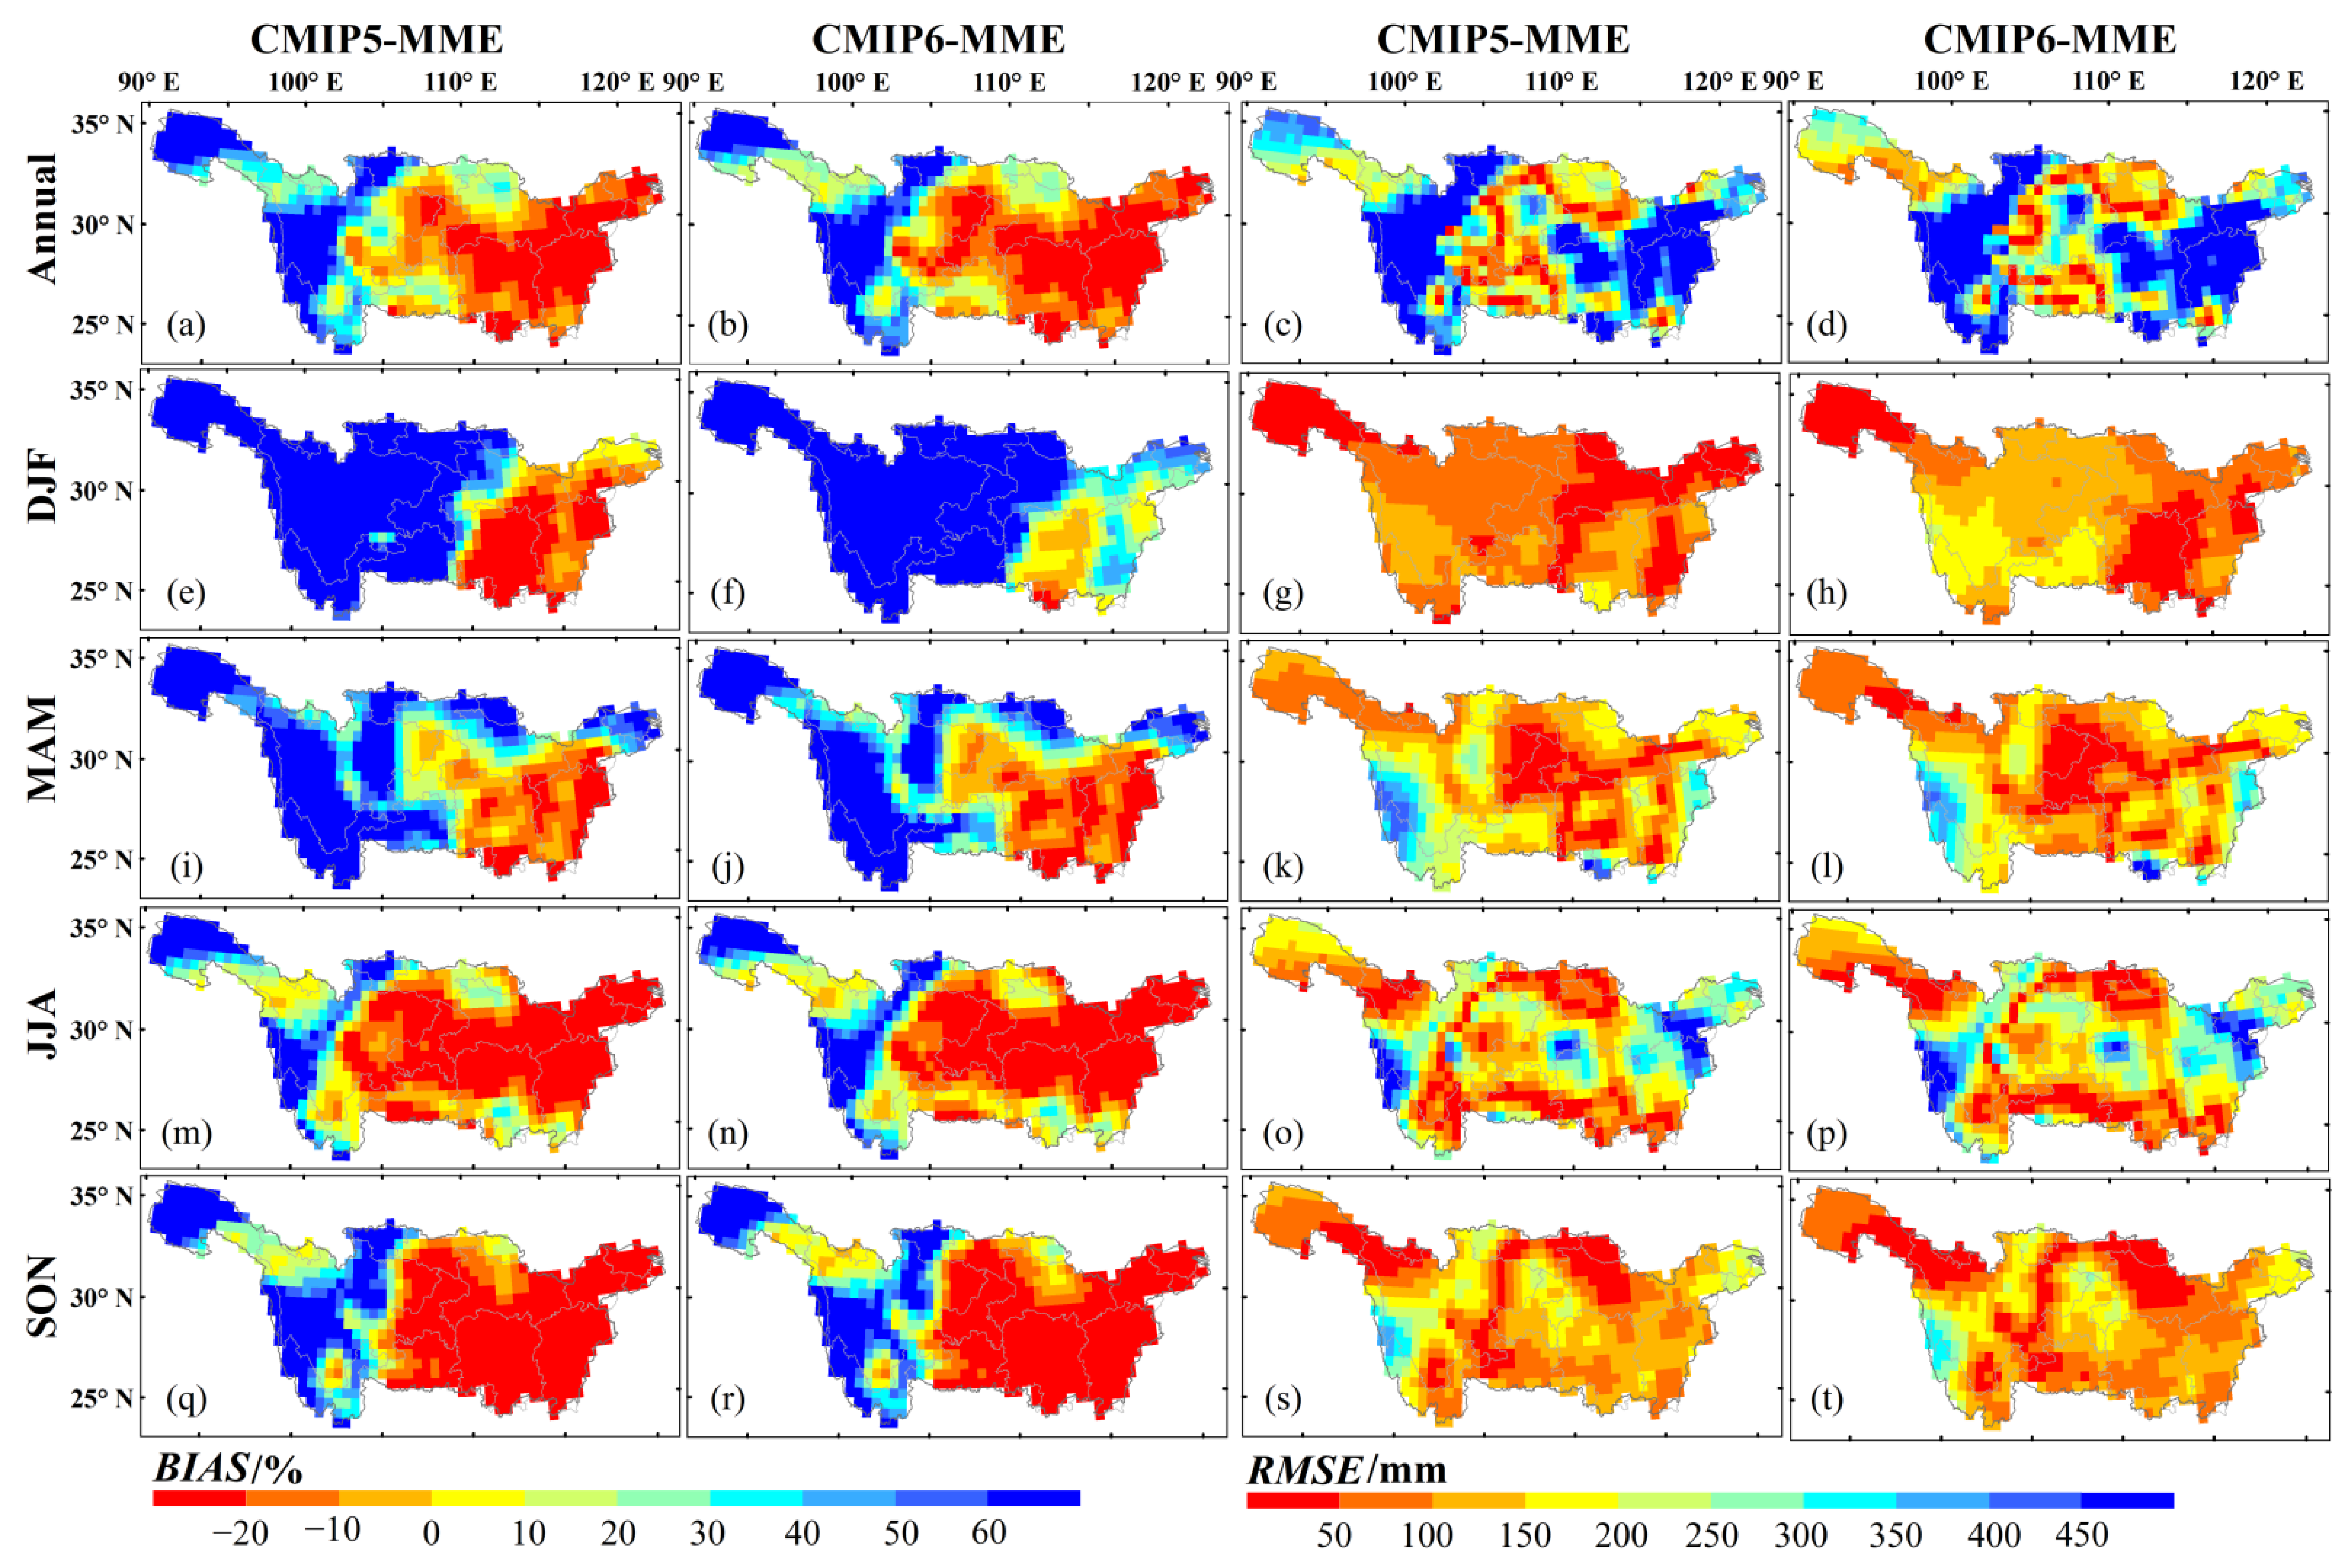
As depicted in Figure 4, the relative bias (BIAS) and root-mean square error (RMSE) are calculated between the CMIP5-MME, CMIP6-MME and the observational precipitation. The spatial distribution of the annual and seasonal precipitation relative bias and root-mean square error of CMIP5-MME and CMIP6-MME are typically consistent with each other except for winter (Figure 4). In winter (Figure 4e,f), both CMIP5-MME and CMIP6-MME greatly overestimated precipitation in the upstream area, while CMIP6-MME overestimated and CMIP5-MME underestimated precipitation in the midstream and downstream areas. Figure 4g,h show the projection accuracy of CMIP6-MME was higher than CMIP5-MME in the midstream and downstream areas, especially in Hunan, but CMIP5-MME performs better than CMIP6-MME in the upstream areas. Furthermore, at high altitudes, mainly in Qinghai, the precipitation BIAS and RMSE of CMIP6-MME are smaller than those of CMIP5-MME in spring (Figure 4i–l), summer (Figure 4m–p), and autumn (Figure 4q–t), as well as mean annual (Figure 4e,f) precipitation.
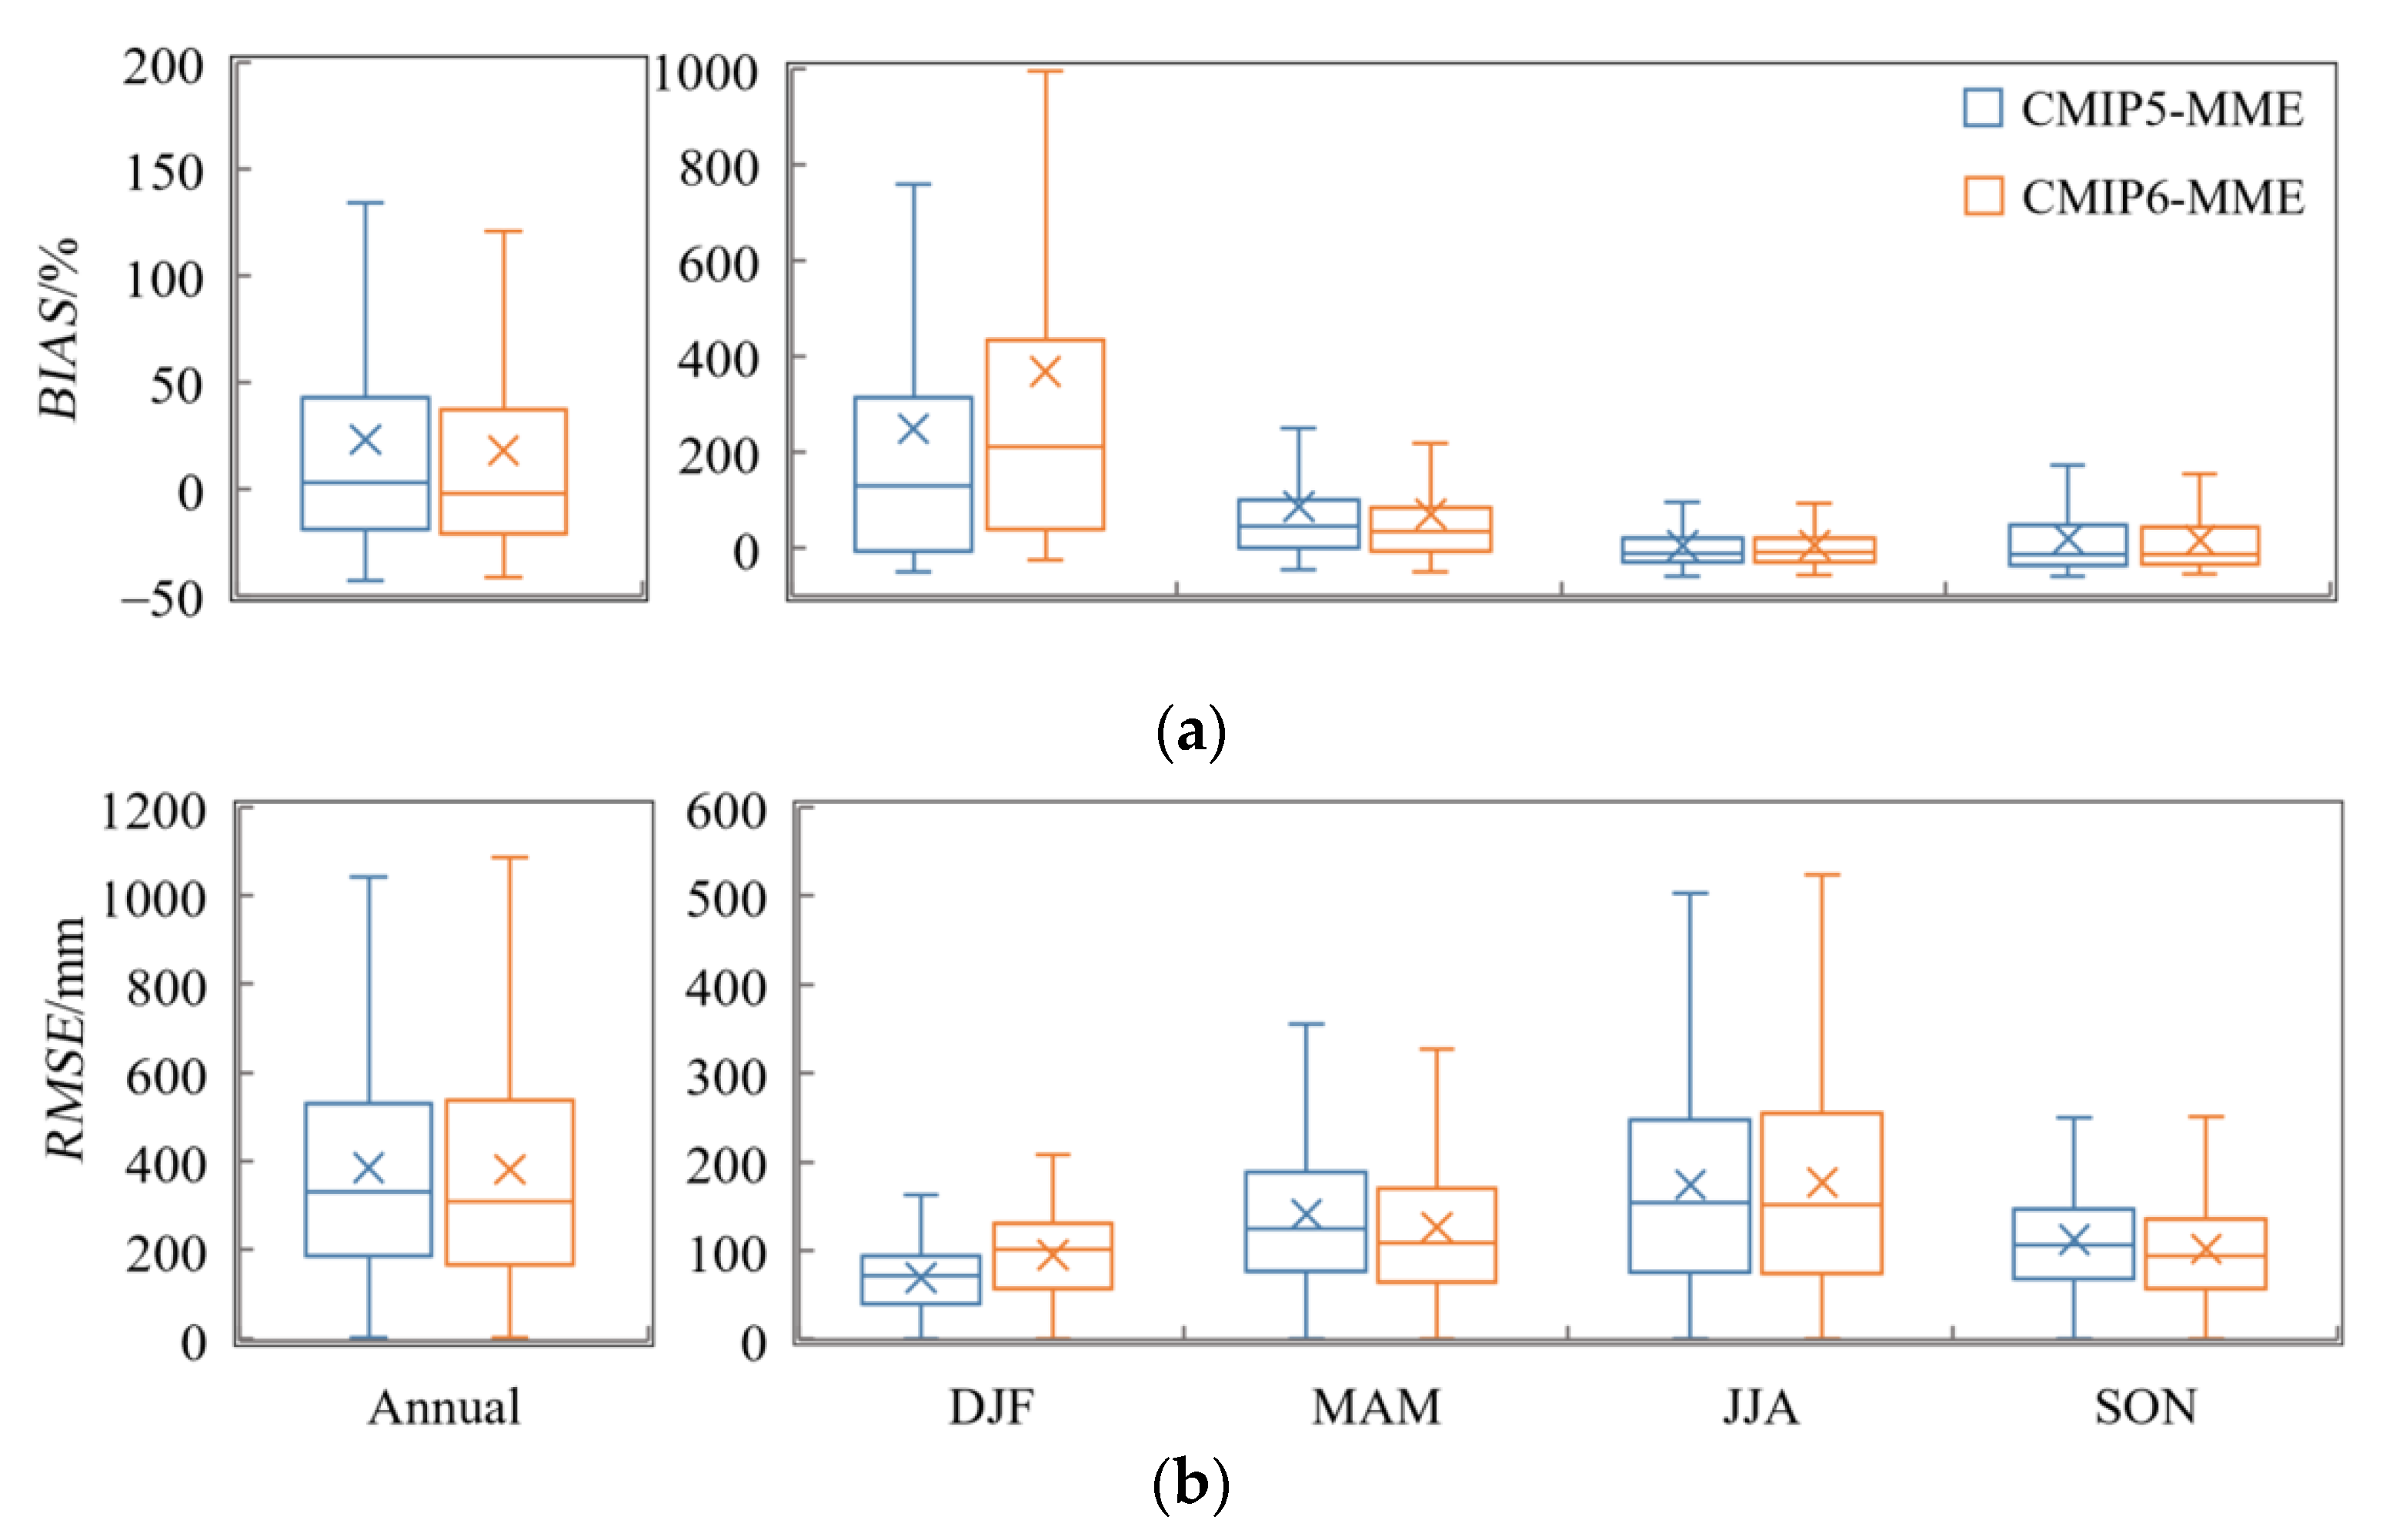
Figure 5 displays the average annual and seasonal precipitation relative biases and root-mean square errors through box plots between the MMEs’ data and the observed data. At an annual scale, the mean relative biases of the CMIP5-MME and CMIP6-MME were 23% and 18%, respectively. In winter, the mean relative biases of the CMIP5-MME and CMIP6-MME were 248% and 367%, respectively. In spring, the mean relative biases of the CMIP5-MME and CMIP6-MME were 86% and 70%, respectively. In summer, the mean relative biases of the CMIP5-MME and CMIP6-MME were 4% and 5%, respectively. In autumn, the mean relative biases of the CMIP5-MME and CMIP6-MME were 19% and 15%, respectively. The mean relative biases ranges of the CMIP5-MME, CMIP6-MME of annual and seasonal precipitation were −43–134%/−41–121% (annual), −51–759%/−26–994% (winter), −46–249%/−50–217% (spring), −59–94%/−56–93% (summer), and −59–171%/−56–155% (autumn).
Figure 5 also shows the root-mean square errors of projected precipitation. CMIP5-MME had a higher root-mean square error than CMIP6-MME for spring and autumn precipitation, whereas they showed almost equal root-mean square error for summer and annual precipitation. CMIP5-MME outperformed CMIP6-MME only for winter. Based on these results, the annual and seasonal precipitation projection capabilities of the CMIP6-MME were stronger compared to those of the CMIP5-MME in spring, autumn, and annual, and were weaker in winter, and in summer both MMEs had a similar relative bias and root-mean square error.
3.2. Comparison between CIMP5 and CMIP6 GCMs and Homologous GCMs
The projection capacity of CMIP6-MME and CMIP5-MME for annual and seasonal precipitation was analyzed in detail above, but there are also differences in the capacity of different GCMs to project precipitation. How “good” are different GCMs? What are the improvements of the same GCM in CMIP6 compared to CMIP5? Regional average can only represent partial features. Is there any improvement in spatial correlation projection? The Taylor diagram and TS scores of CMIP5 and CMIP6 GCMs were calculated to answer the above questions.
Figure 6 shows the performance of each GCM, and their ensemble means for both CMIP5 and CMIP6 sets in producing observational precipitation by the Taylor diagram for DJF (Figure 6b), MAM (Figure 6c), JJA (Figure 6d), SON (Figure 6e), and annual (Figure 6a). The high value of SCC indicates that the GCM has a reliable ability in projecting the spatial pattern of precipitation, and the standard deviation of the GCM is larger than the observed value, indicating that it overestimates the spatial variability of precipitation [37]. Based on 680 grid points across YRB, SCCs, normalized standard deviations (NSTDs), and normalized CRMSEs are 0.09–0.70, 0.46–0.97, and 0.15–0.31, respectively, for annual precipitation in the ten CMIP6 GCMs. Comparative analysis for seasons shows an excellent projection of all indices during winter relative to other seasons. Changes in the standard deviation will create extreme precipitation events in the future [38,39], and since the CMIP5-MME has a smaller standard deviation than that of CMIP6-MME except for SON, the likelihood of extreme precipitation events is higher in CMIP6 GCMs. It is noteworthy that the model FGOALS-g2 greatly underestimates the annual and seasonal spatial variabilities except for autumn with a very low normalized standard deviation of 0.18–0.53. In general, CMIP6 GCMs show the best performance in winter, owing to the best reproducibility of spatial variability, followed by spring and autumn, and the worst in summer due to the poorest reproducibility of both spatial pattern and variability. As a whole, concerning spring, summer, and autumn, the CMIP6 GCMs performed better, and concerning winter and annual, the CMIP5 GCMs exhibited better performance.
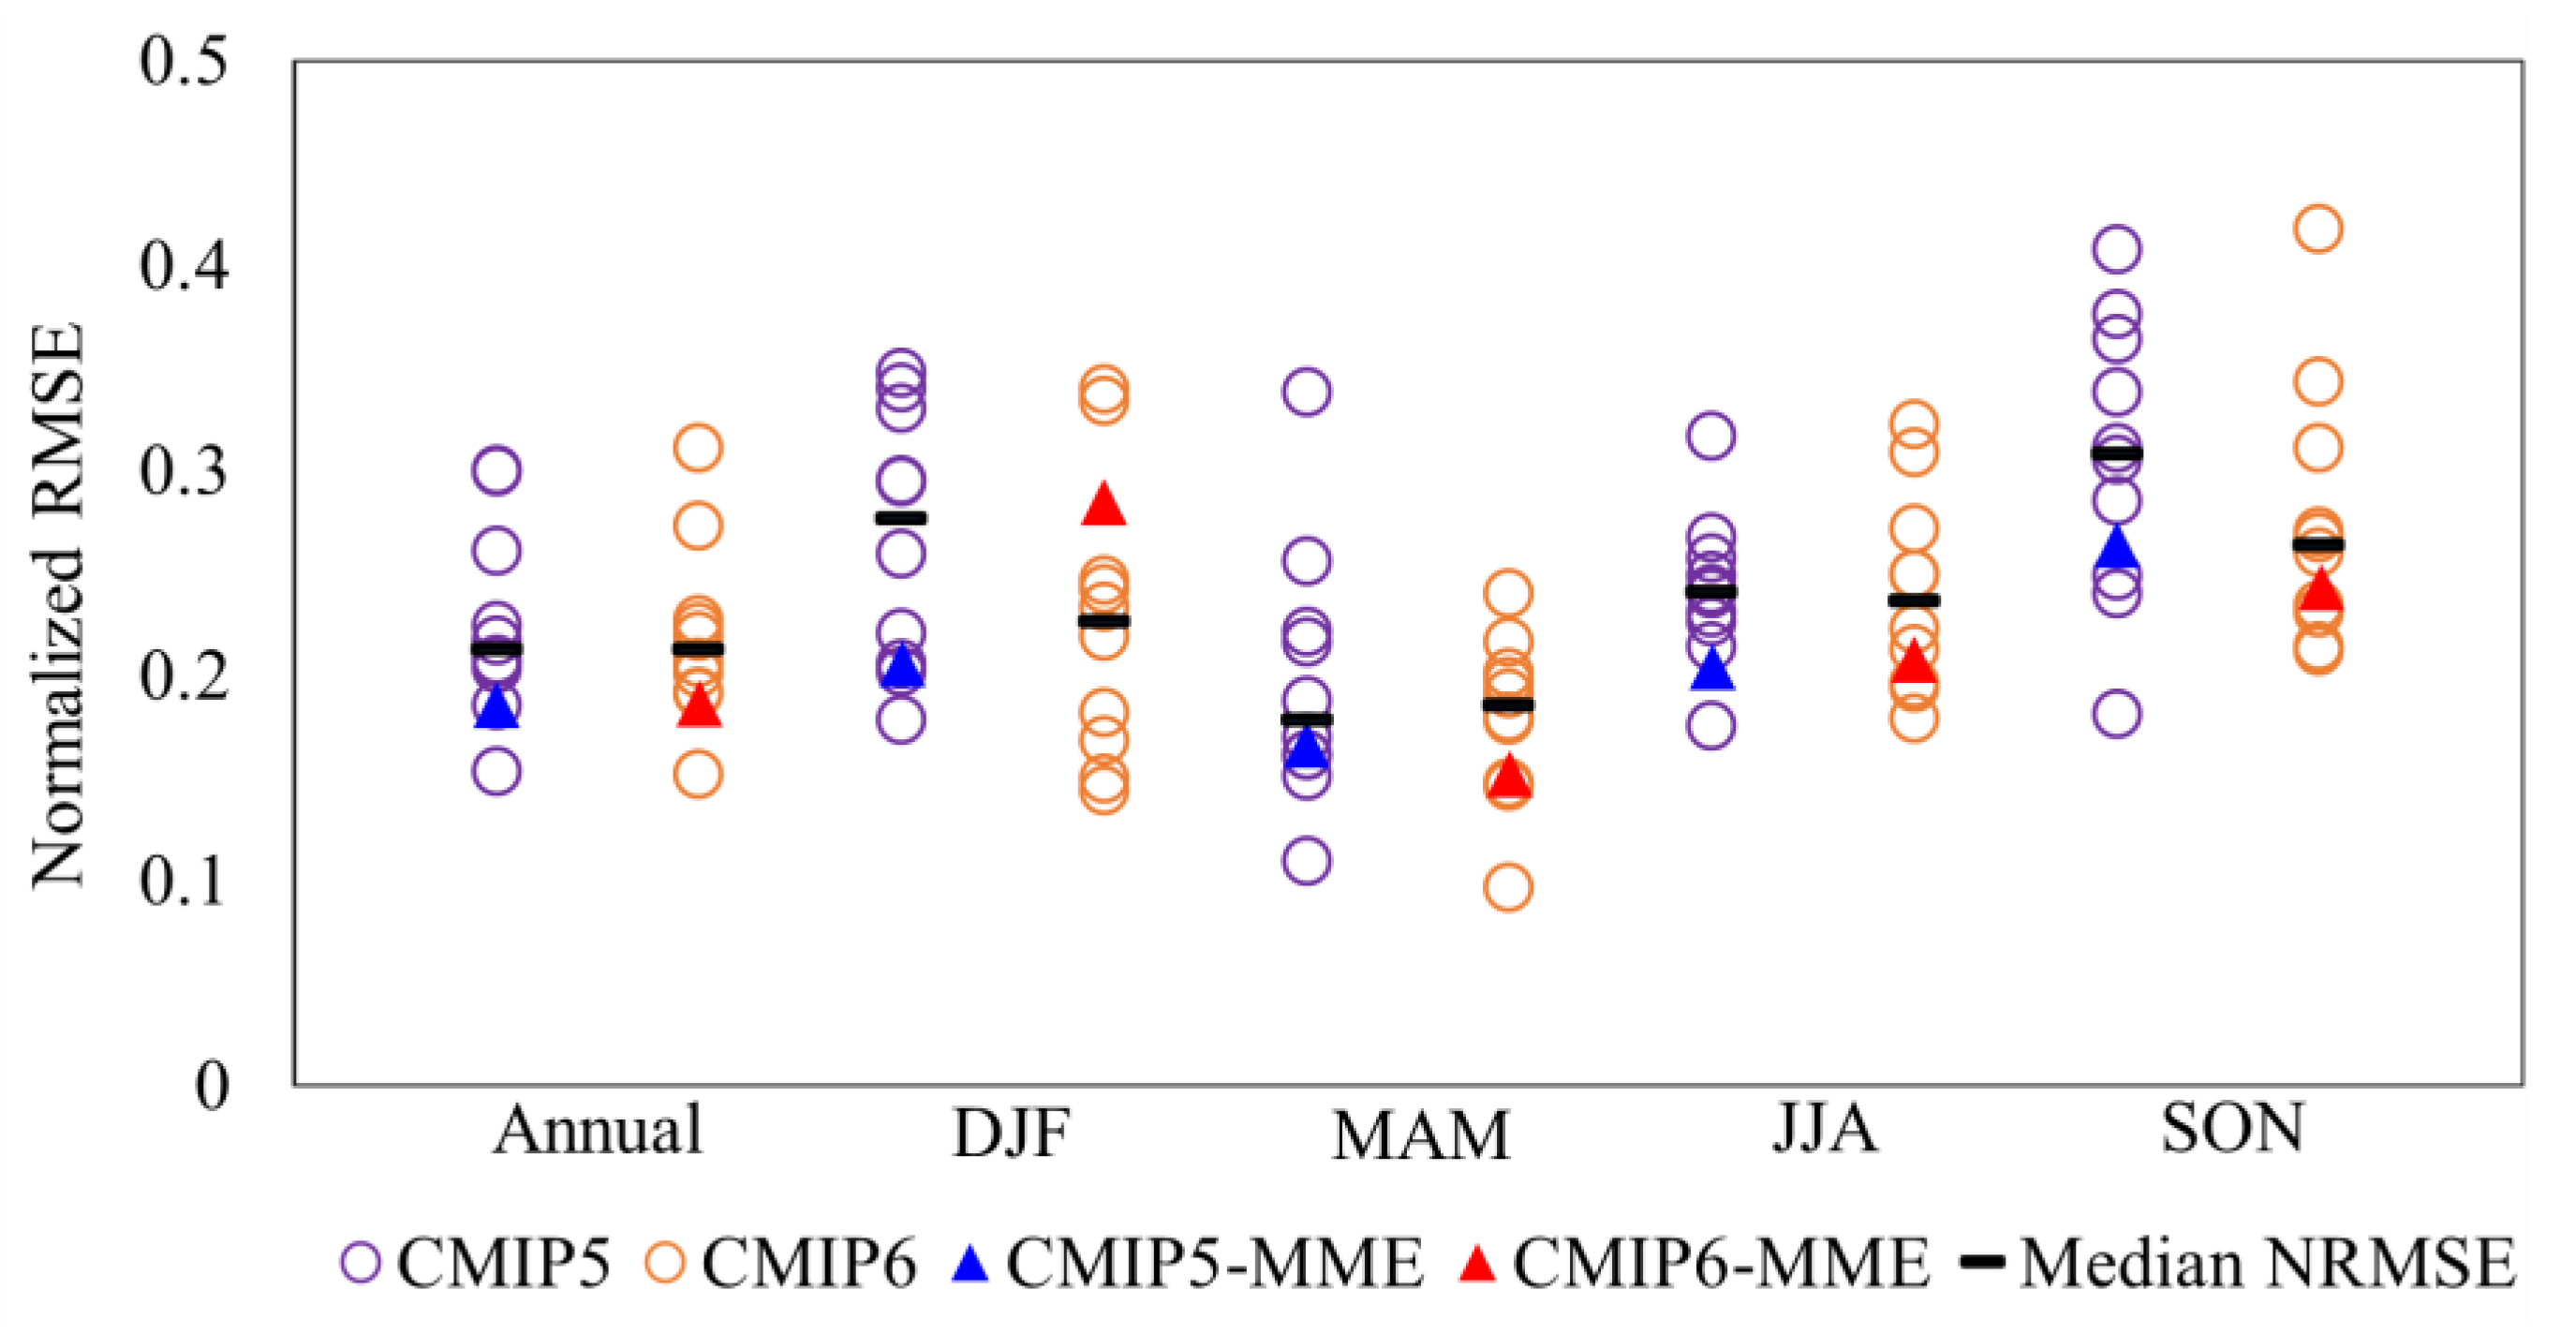
The capability of CMIP6 and CMIP5 GCMs and their ensembles in projecting annual and seasonal precipitation in the studied area was also measured by normalized root-mean square error (NRMSE). Figure 7 depicts NRMSE and the median of the errors. Normalizing was performed by using the range of observational data. The median NRMSEs calculated for CMIP6 models for spring mean were higher than those calculated for CMIP5 GCMs, but in winter, summer, and autumn, CMIP5 GCMs had a higher median NRMSE than CMIP6 GCMs, and for annual both GCMs had an equal NRMSE. However, CMIP6-MME had lower mean errors for spring and autumn, and annual. The two MMEs had an equal mean error in annual and summer, and just in winter, CMIP5 GCMs had a lower mean error than CMIP6 GCMs. According to Gleckler et al. [40], almost for all GCMs, the median and mean matched observational data to a greater extent.
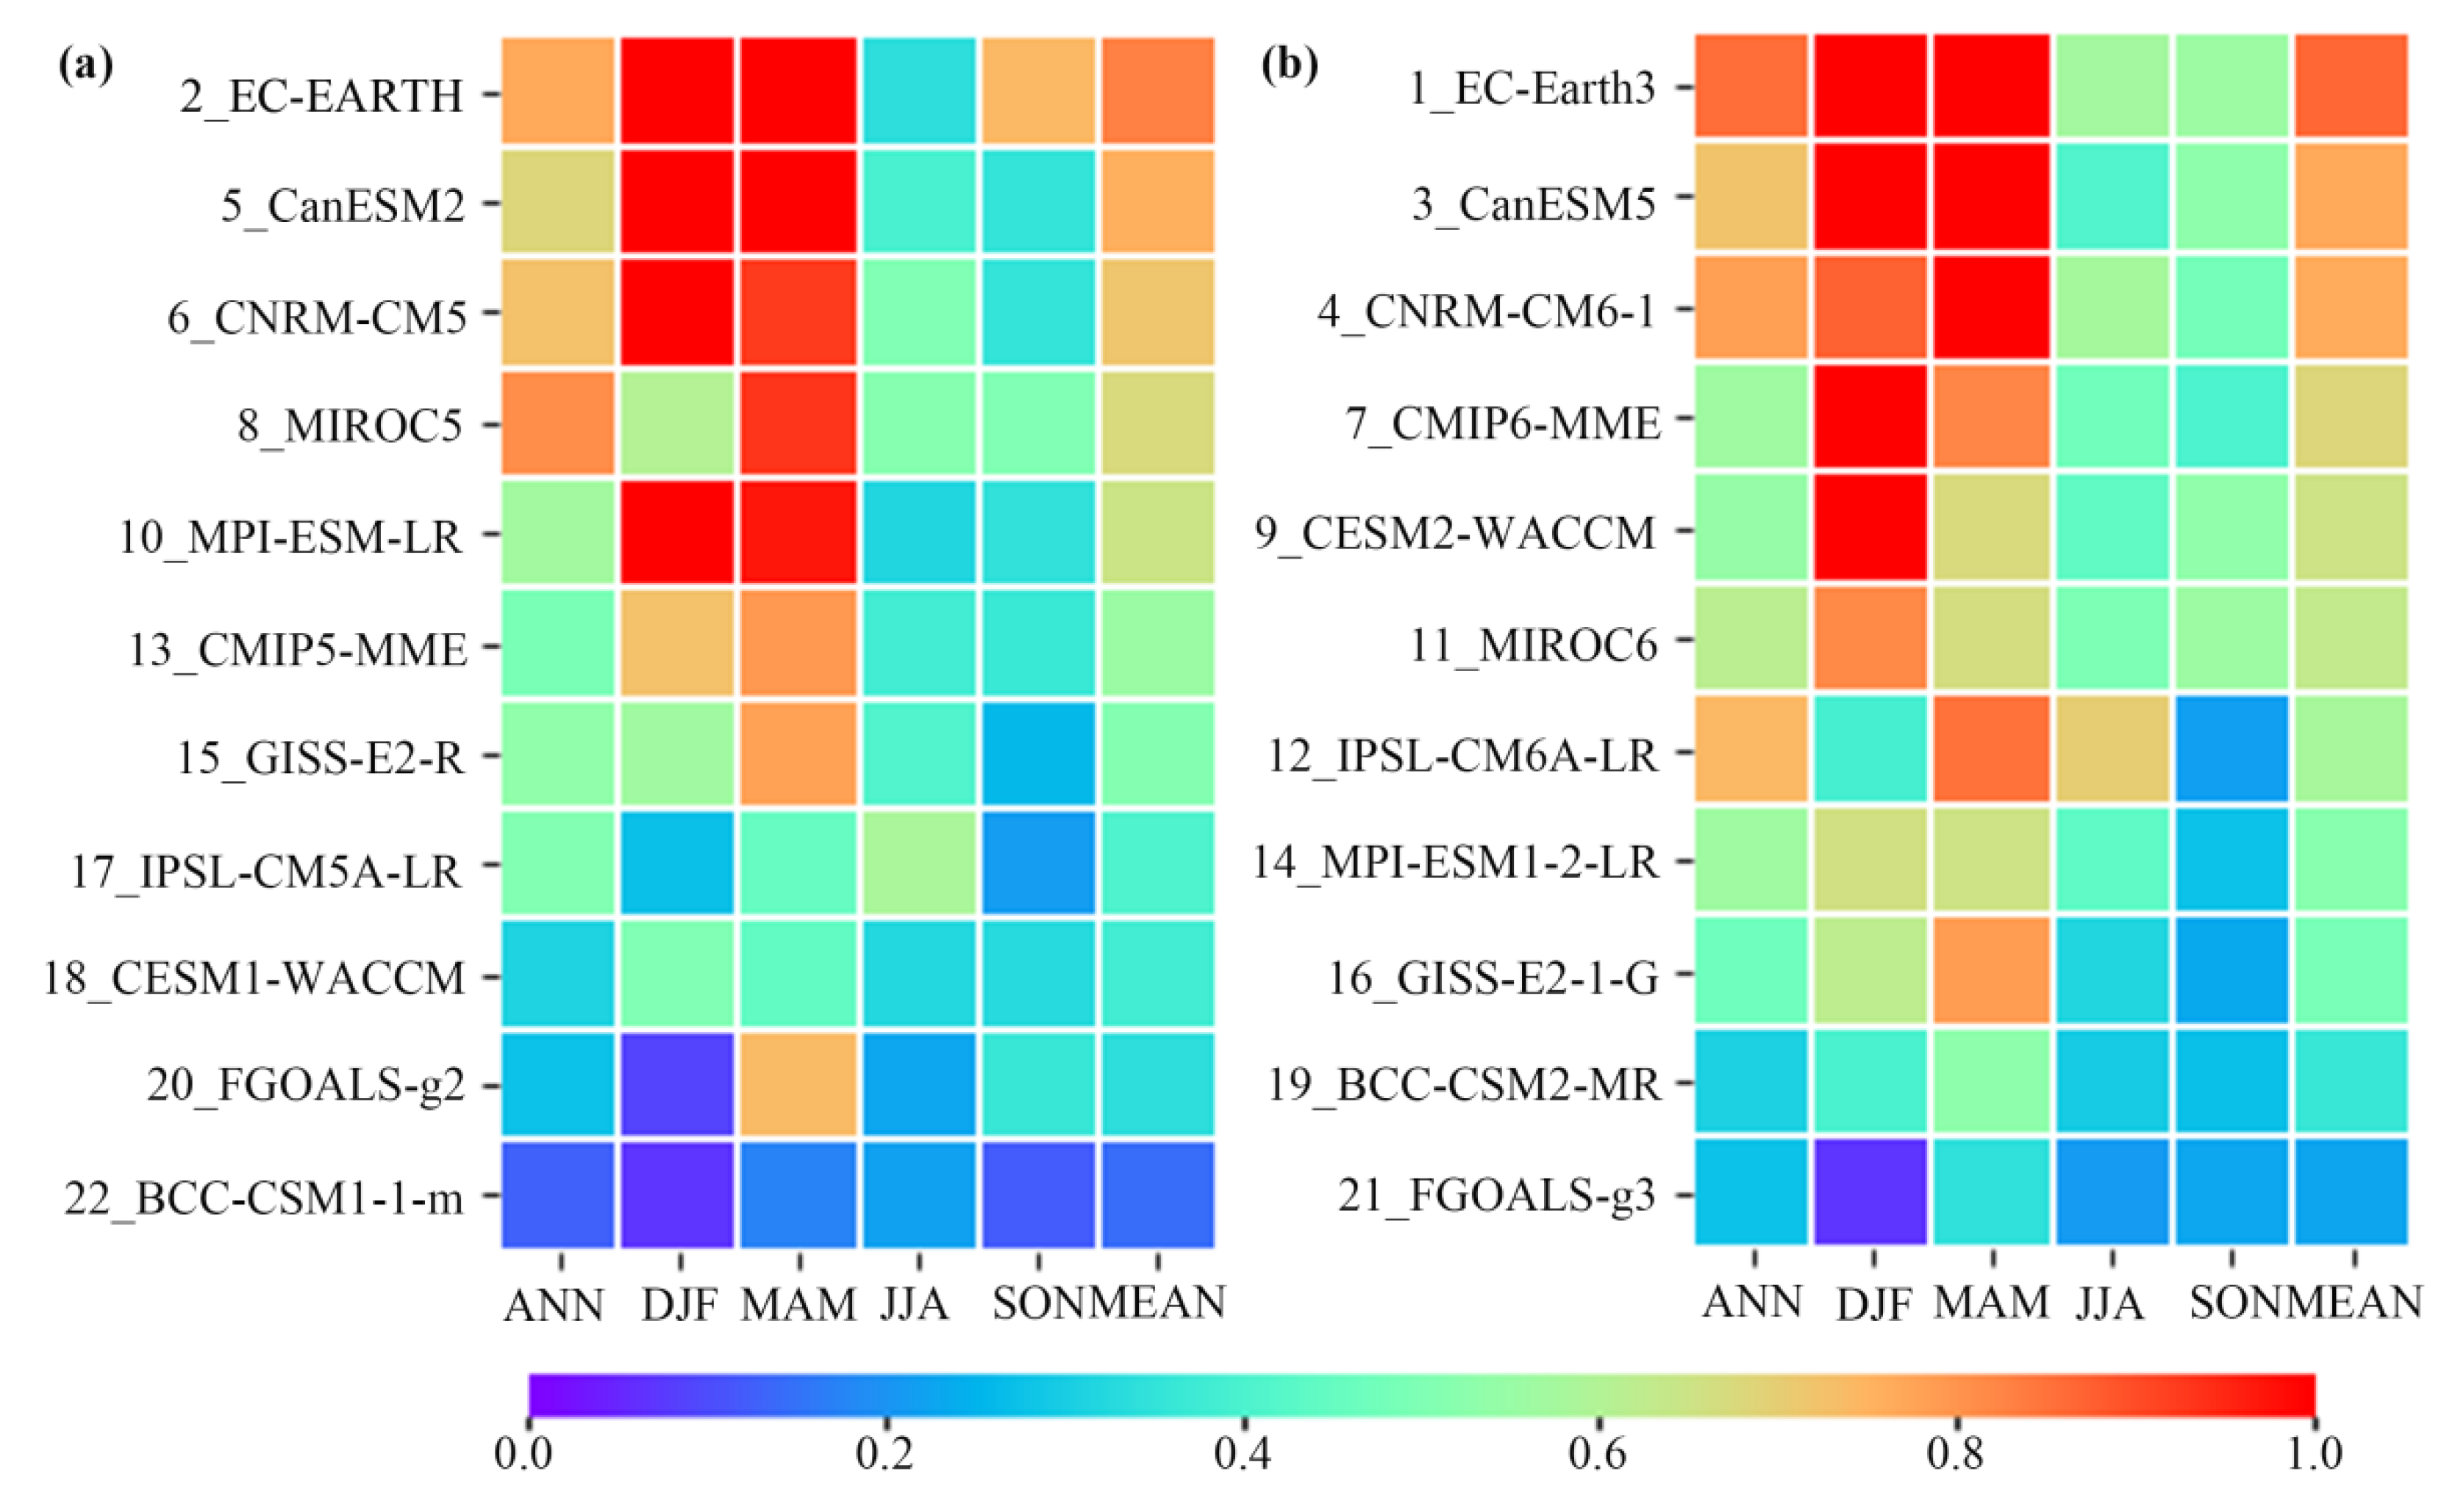
Figure 8 displays the annual and seasonal TS scores of each GCM and their ensemble means. CMIP6-MME have higher ranks than CMIP5-MME, with an average TS score of 0.68 (0.55) for CMIP6 (CMIP5), and three out of the five highest-scored GCMs are CMIP6 GCMs. TS score of CMIP6 EC-Earth3 ranks first (0.87), followed by CMIP5 EC-EARTH (0.83), CMIP6 CanESM5 (0.77), CMIP6 CNRM-CM6-1 (0.76), and CMIP5 CanESM2 (0.75), and the lowest is CMIP5 BCC-CSM1-1-m. Therefore, in terms of MME or single GCM performance, the capability of CMIP6 to project the spatial distribution of multi-year average precipitation in the YRB has been improved compared with CMIP5. Taken together, the performance of GCMs for precipitation over YRB has slightly enhanced from CMIP5 to CMIP6, based on a fair comparison of GCMs developed from the same modeling group, which is suggested to intrinsically relate to the improvement of the main physics schemes with a single model analysis.
4. Discussion
The results of this study show that the precipitation projection errors of CMIP6-MME were lower than those of CMIP5-MME at annual and seasonal scales, indicating that the CMIP6-MME reduced the precipitation projection bias. These findings are consistent with those of some previous studies based on historical simulations. Gusain et al. [41] compared the performance of models available in CMIP5 and CMIP6 consortium and their MME and find a significant improvement in CMIP6 models in capturing the spatiotemporal pattern of monsoon over Indian landmass, especially in the Western Ghats and northeast foothills of Himalayas. Srivastava et al. [42] assessed the CMIP6 historical precipitation extremes over seven contiguous US regions and found similar but smaller biases are in CMIP6-MME than CMIP5 models tested. Wang et al. [43] evaluated the ability of the downscaled CMIP5-MME and CMIP6-MME precipitation simulation historical runs to capture the complex spatial pattern, temporal pattern and seasonal variations observed over the Hanjiang River Basin, China, with the results demonstrating that the CMIP6-MME better simulated precipitation for most stations compared to the CMIP5-MME.
According to the error spatial distribution comparisons, the CMIP5-MME and CMIP6-MME projections overestimated precipitation in the western parts of the YRB, especially over the West Sichuan Plateau and Qinghai, and underestimated precipitation in the eastern part of the basin, especially in summer and autumn. These results may be related to elevation, geographical location and urbanization. The western parts belong to the source and upstream of the basin, which contain plateau and mountainous areas (Figure 1). According to the previous studies [44,45] precipitation typically increases with elevation but after reaching a certain height, precipitation begins to decrease. Because air rises because of the uplift of the terrain, it cools and condenses to form precipitation. However, as the elevation increases, the moisture content in the air decreases, and the precipitation decreases rather than increases. This shows that the current GCMs has systematically overestimated the precipitation in western YRB, which is closely related to the limited response of the GCMs to complex terrain [22,36,46,47]. Although the CMIP6 model compared with the CMIP5 model has been developed and become more complex [10], but these improvements still cannot significantly reduce the model’s overestimation of precipitation in the plateau region. The eastern part of the basin is midstream and downstream, which belongs to the plain area, and most cities are in this region. Because of urbanization, many cities experience the rain island effect, with increased precipitation in cities. Zhang et al. [48] assessed the impacts of urbanization process on rainfall in Beijing and concluded that the expansion of the urban area made the rainfall last longer and it also led to a bigger affected area by rainfall. Sahoo et al. [49] discussed the impact of urbanization on processes and mechanisms of rainfall using the Weather Research and Forecasting model, and the simulation results illustrated that the current urbanization scenario has shown a significant increase in rainfall by over 100–200%. Therefore, the urbanization rain island effect may have led to the underestimation of the GCM-projected precipitation in the eastern part of the YRB. In addition, our study region is in the east of Asia and belongs to a subtropical monsoon zone. The subtropical monsoon climate is mild and humid, and precipitation is abundant. Previous assessments [5,37,50] have shown that because the models cannot well simulate the variation characteristics of the East Asian Monsoon, and reflect some physical processes of land-sea differences are also limited, most GCMs systematically underestimate the precipitation in southeastern China. From the projections of the ten CMIP6 GCMs evaluated in our study, the new generation of GCMs has not significantly improved this bias in the Mid-Lower YRB, especially in summer.
The precipitation projection error characteristics of the different types of CMIP6 and CMIP5 GCMs and their differences mainly reflect problems in the GCMs themselves, e.g., problems in parameterizing physical processes, insufficient model resolution, or incomplete landform descriptions, and point to the effects of the emission scenario and seasonal context on the accuracy of the model precipitation predictions. Analysis of these error characteristics can provide clues to improve the models and their simulation accuracy; for example, the model overestimated predictions are mainly seen in high-altitude areas with large topographical changes in the YRB. In addition to the resolution and topographic conditions of the model itself, this result may also be related to the density of the observation data and whether the observation data consider elevation [22]. The models greatly underestimate precipitation mainly in summer in the midstream and downstream areas of the Yangtze River, indicating that the monsoon precipitation simulated by the model is weak, which may be related to the model’s cumulus convection scheme or air–sea interaction. The imperfect description of the process may also be caused by the inability to simulate the precipitation of typhoons or tropical cyclones [5,17,51]. The generally excessive precipitation in winter models may be due to large defects in the physical processes of modelling solid precipitation or snowfall. The existence of these model prediction errors illustrates that there are many uncertainties indirectly applying the CMIP6 or CMIP5 MME to project future precipitation variations. Prior to predicting future precipitation, it is necessary to assess the model uncertainties and consideration can be given to correcting topographic effects or improving the model resolution through downscaling, as well as improving the modelling process and parameters, which can lead to improved projection accuracy. Regardless, the reduction in CMIP6 precipitation projection error relative to CMIP5 demonstrates that CMIP6 GCMs better account for topography-induced precipitation (at least in comparison with CMIP5), improve model parameterization associated with cloud precipitation systems, and other factors acting on precipitation formation processes. Therefore, the projection capability of CMIP6 in areas with large topographic changes can be improved, and it can provide reference for the impact, adaptation and mitigation of climate change in the YRB.
Because of the limitations of the CMIP6 projected data, the period of time for this study is short which may have some impact on the evaluation results. Although with 6-year evaluation period covered in this study were able to display the spatiotemporal performance of projected precipitation of CMIP5 and CMIP6 GCMs over the YRB for the period 2015–2020. In the near future, we aim to analyze the trends and the respective significance (e.g., Sen’s slope and Mann–Kendall) of the monthly precipitation anomalies during the study period. Furthermore, with the passage of time, we could use a longer period to evaluate the accuracy of GCMs for future projected precipitation. In addition, the new model generation is still marred with uncertainty, thereby depicting substandard performance over the YRB. This calls for further investigation of attribution studies into the sources of persistent systematic biases and a prerequisite for identifying individual models with robust features that can accurately project observed patterns for future usage.
5. Conclusions
The present study aimed to assess the capability of GCMs in two ensembles in projecting seasonal and annual precipitation over the YRB of China for the period of 2015–2020. Monthly precipitation projections were analyzed for ten GCMs from the CMIP5 ensemble and an equal number of GCMs from the CMIP6 ensemble. The primary conclusions are as follows.
A spatial distribution map, relative bias, root-mean square error between the GCMs’ precipitation and the observed data, and box plots were used to evaluate the performances of the CMIP5-MME and CMIP6-MME precipitation projections compared with the observed data in the YRB from 2015 to 2020. The results illustrate that (1) the CMIP5-MME and CMIP6-MME can capture the spatial pattern, temporal pattern, and seasonal variations in the YRB but overestimate precipitation in the western YRB and underestimate precipitation in the eastern YRB; (2) except for winter, the precipitation projection relative bias and root-mean square error of CMIP6-MME are smaller than those of CMIP5-MME in spring, summer, and autumn, as well as mean annual precipitation, demonstrating improvement for CMIP6-MME in reducing precipitation bias and improving precipitation accuracy; (3) the capabilities of both the CMIP5-MME and CMIP6-MME in projecting precipitation on rainy days and in high-altitude areas are poor; (4) high relative biases at precipitation occurs in winter which can be ascribed to the small value of the observational precipitation data. Nevertheless, in winter, the root-mean square error of CMIP5-MME and CMIP6-MME was lower than that of other three seasons and annual, implying their higher accuracy for winter.
Taylor diagram and TS scores of CMIP5 and CMIP6 GCMs were calculated to check the performance of the individual and homologous GCMs. Except for winter, the NRMSE of CGMs’ ensemble was better for CMIP6 than for CMIP5 GCMs. Two CMIP5 GCMs including EC-EARTH and BCC-CSM1-1-m and three CMIP6 GCMs including EC-Earth3, CanESM5, and CNRM-CM6-1 had the highest TS scores for precipitation in both seasons and annual mean. Based on the results of TS scores for CMIP5 and CMIP6 GCMs, the EC-EARTH (0.83) and EC-Earth3 (0.87) GCMs had the best agreement with the observational data.
Author Contributions
Conceptualization, methodology, X.Z. and H.P.; software, H.P.; validation, Y.J. and X.Z.; formal analysis, H.P. and Y.J.; investigation, H.P.; resources, Y.J.; data curation, Y.J.; writing—original draft preparation, H.P.; writing—review and editing, H.P., Y.J. and X.Z.; visualization, H.P. and Y.J.; supervision, X.Z.; project administration, X.Z.; funding acquisition, X.Z. All authors have read and agreed to the published version of the manuscript.
Funding
This research was funded by the National Key R&D Program of China (2019YFB2102003) and the National Natural Science Foundation of China Project (41805049).
Institutional Review Board Statement
Not applicable
Informed Consent Statement
Not applicable
Data Availability Statement
All data included in this study are available upon request by contact with the corresponding author.
Conflicts of Interest
The authors declare no conflict of interest.
References
- IPCC. Summary for Policymakers. In Climate Change 2021: The Physical Science Basis. Contribution of Working Group I to the Sixth Assessment Report of the Intergovernmental Panel on Climate Change; Masson-Delmotte, V., Zhai, P., Pirani, A., Connors, S.L., Péan, C., Berger, S., Caud, N., Chen, Y., Goldfarb, L., Gomis, M.I., et al., Eds.; Cambridge University Press: Cambridge, UK, 2021. [Google Scholar]
- Nashwan, M.S.; Shahid, S. A novel framework for selecting general circulation models based on the spatial patterns of climate. Int. J. Climatol. 2020, 40, 4422–4443. [Google Scholar] [CrossRef]
- O’Neill, B.C.; Tebaldi, C.; Van Vuuren, D.P.; Eyring, V.; Friedlingstein, P.; Hurtt, G.; Knutti, R.; Kriegler, E.; Lamarque, J.F.; Lowe, J.; et al. The scenario model intercomparison project (Scenario MIP) for CMIP6. Geosci. Model Dev. 2016, 9, 3461–3482. [Google Scholar] [CrossRef] [Green Version]
- Zhang, L.X.; Chen, X.L.; Xin, X.G. Short commentary on CMIP6 Scenario Model Intercomparison Project (ScenarioMIP). Clim. Change Res. 2019, 15, 519–525. [Google Scholar] [CrossRef]
- Chen, X.C.; Xu, Y.; Xu, C.H.; Yao, Y. Assessment of precipitation simulations in China by CMIP5 multi-models. Clim. Change Res. 2014, 10, 217–225. [Google Scholar] [CrossRef]
- Ta, Z.; Yu, Y.; Sun, L.; Chen, X.; Mu, G.; Yu, R. Assessment of Precipitation Simulations in Central Asia by CMIP5 Climate Models. Water 2018, 10, 1516. [Google Scholar] [CrossRef] [Green Version]
- Huang, X.H.; Yue, Q.; Zhang, M. Future precipitation change in the Belt and Road Region under Representative Concentration Pathway Scenarios. J. Yangtze River Sci. Res. Inst. 2020, 37, 53–60. [Google Scholar] [CrossRef]
- Salman, S.A.; Nashwan, M.S.; Ismail, T.; Shahid, S. Selection of CMIP5 general circulation model outputs of precipitation for peninsular Malaysia. Hydrol. Res. 2020, 51, 781–798. [Google Scholar] [CrossRef]
- Zhang, Q.M.; Wang, R.; Jiang, T.; Chen, S.S. Projection of extreme precipitation in the Hanjiang River basin under different RCP scenarios. Clim. Change Res. 2020, 16, 276–286. [Google Scholar] [CrossRef]
- Huang, J.L.; Wang, Y.J.; Su, B.D.; Zhai, J.Q. Future climate change and its impact on runoff in the upper reaches of the Yangtze River under RCP4.5 scenario. Meteor Mon. 2016, 42, 614–620. [Google Scholar] [CrossRef]
- Montroull, N.B.; Saurral, R.I.; Camilloni, I.A. Hydrological impacts in La Plata basin under 1.5, 2 and 3 °C global warming above the pre-industrial level. Int. J. Climatol. 2018, 38, 3355–3368. [Google Scholar] [CrossRef]
- Kim, Y.H.; Min, S.K.; Zhang, X.; Sillmann, J.; Sandstad, M. Evaluation of the CMIP6 MME for climate extreme indices. Weather. Clim. Extrem. 2020, 29, 100269. [Google Scholar] [CrossRef]
- Chen, H.P.; Sun, J.Q.; Lin, W.Q.; Xu, H. Comparison of CMIP6 and CMIP5 models in simulating climate extremes. Sci. Bull. 2020, 65, 1415–1418. [Google Scholar] [CrossRef]
- Zamani, Y.; Monfared, S.A.H.; Moghaddam, M.A.; Hamidianpour, M. A comparison of CMIP6 and CMIP5 projections for precipitation to observational data: The case of Northeastern Iran. Theor. Appl. Climatol. 2020, 142, 1613–1623. [Google Scholar] [CrossRef]
- Bağçaci, S.Ç.; Yucel, I.; Duzenli, E.; Yilmaz, M.T. Intercomparison of the expected change in the temperature and the precipitationretrieved from CMIP6 and CMIP5 climate projections: A Mediterranean hot spot case, Turkey. Atmos. Res. 2021, 256, 105576. [Google Scholar] [CrossRef]
- Kim, J.; Ivanov, V.Y.; Fatichi, S. Climate change and uncertainty assessment over a hydroclimatic transect of Michigan. Stoch. Environ. Risk Assess. 2016, 30, 923–944. [Google Scholar] [CrossRef]
- Zhang, B.; Dai, X.G. Assessment of the deviation of China precipitation projected by CMIP5 models for 2006–2013. Chin. J. Atmos. Sci. 2016, 40, 981–994. [Google Scholar] [CrossRef]
- Monerie, P.A.; Wainwright, C.M.; Sidibe, M.; Akinsanola, A.A. Model uncertainties in climate change impacts on Sahel precipitation in ensembles of CMIP5 and CMIP6 simulations. Clim. Dyn. 2020, 55, 1385–1401. [Google Scholar] [CrossRef]
- Huang, F.; Gan, M.; Yu, Y.; Ta, Z.J.; Zhang, H.Y.; Pi, Y.Y.; Sun, L.X.; Yu, R.D. Error analysis concerning 2006-2017 Central Asia precipitation estimation based on CMIP5 model. J. Univ. Chin. Acad. Sci. 2021, 38, 333–340. [Google Scholar] [CrossRef]
- Han, L.; Song, K.C.; Zhang, W.J.; Liu, L.; Jiang, H.R. Temporal and Spatial Variations of Hydrological Factors in the Source Area of the Yangtze River and Its Responses to Climate Change. J. Mt. Sci. 2017, 35, 129–141. [Google Scholar] [CrossRef]
- Zeng, X.F.; Chen, H.; Zhang, X.Z. Research on Precipitation change sensitive to climate change over Yangtze River Basin. Sci. Technl. Innov. Herald 2009, 8, 237. [Google Scholar] [CrossRef]
- Chu, Q.; Xu, Z.X.; Liu, W.F.; Liu, L. Assessment on 24 global climate models in the CMIP5 over the Yangtze River. Resour. Environ. Yangtze Basin 2015, 24, 81–89. [Google Scholar] [CrossRef]
- Li, J.R.; Niu, Z.G.; Feng, L.; Feng, L.; Yao, R.; Chen, X.X. Simulation and projection of Extreme Temperature Indices in Yangtze and Yellow River Basins by CMIP5 Models. Earth Sci. 2020, 45, 1887–1904. [Google Scholar] [CrossRef]
- Liu, J.L.; Yuan, Z.; Xu, J.J.; Liu, Y.J.; Chen, W.S.; Tian, C.W.; Miao, H.L. Meteorological Drought Evolution Characteristics and Future Trends in the Yangtze River Basin. J. Yangtze River Sci. Res. Inst. 2020, 37, 28–36. [Google Scholar] [CrossRef]
- Han, L.Q.; Han, Z.; Li, S.L. Projection of heavy rainfall events in the middle and lower reaches of the Yangtze River valley in the 21st century under different representative concentration pathways. Trans. Atmos. Sci. 2014, 37, 529–540. [Google Scholar] [CrossRef]
- Liu, F.X.; Wang, Y.J.; Zhao, J.; Chen, X.; Jiang, T. Variations of the exterme precipitation under the global warming of 1.5℃ and 2.0 °C in the mid-lower reaches of the Yangtze River Basin. Resour. Environ. Yangtze Basin 2017, 26, 778–788. [Google Scholar] [CrossRef]
- Zhou, L.; Lan, M.C.; Cai, R.H.; Wen, P.; Yao, R.; Yang, Y.Y. Projection and uncertainties of extreme precipitation over the Yangtze River valley in the early 21st century. Acta Meteor. Sin. 2018, 76, 47–61. [Google Scholar] [CrossRef]
- Wang, Y.J.; Liu, F.X.; Zhai, J.Q.; Wang, Y.Y.; Jiang, T. Variation characteristics of extreme precipitation in the Yangtze River Basin under the global warming 1.5 °C and 2.0 °C. J. Meteor. Sci. 2019, 39, 540–547. [Google Scholar] [CrossRef]
- Zhan, M.Y.; Wang, G.J.; Lu, J.; Chen, L.Q.; Zhu, C.X.; Jiang, T.; Wang, Y.J. Projected evapotranspiration and the influencing factors in the Yangtze River Basin based on CMIP6 models. Trans. Atmos. Sci. 2020, 43, 1115–1126. [Google Scholar] [CrossRef]
- Zeng, X.F.; Zhai, J.Q.; Jiang, T.; Su, B.D. Spatial characteristics and evolutional trends of annual precipitation in the Yangtze River basin. J. Hohai Univ. 2008, 36, 727–732. [Google Scholar] [CrossRef]
- Stefan, B.; Marco, G.; Jiang, T. Observed and Interpolated Precipitation Trends and Variability in the Yangtze Catchment Area. J. Lake Sci. 2003, 15, 123–130. [Google Scholar] [CrossRef] [Green Version]
- Wu, J.; Gao, X.J. A gridded daily observation dataset over China region and comparison with the other datasets. Chin. J. Geophys. 2013, 56, 1102–1111. [Google Scholar] [CrossRef]
- Xu, Y.; Gao, X.J.; Shen, Y.; Xu, C.H.; Shi, Y.; Giorgi, F. A daily temperature dataset over China and its application in validating a RCM simulation. Adv. Atmos. Sci. 2009, 26, 763–772. [Google Scholar] [CrossRef]
- Wu, J.; Gao, X.J.; Giorgi, F.; Chen, D.L. Changes of effective temperature and cold/hot days in late decades over China based on a high resolution gridded observation dataset. Int. J. Climatol. 2017, 37, 788–800. [Google Scholar] [CrossRef]
- Taylor, K.E. Summarizing multiple aspects of model performance in a single diagram. J. Geophys. Res. 2001, 106, 7183–7192. [Google Scholar] [CrossRef]
- Wang, Y.; Li, H.X.; Wang, H.J.; Sun, B.; Chen, H.P. Evaluation of CMIP6 model simulations of extreme precipitation in China and comparison with CMIP5. Acta Meteor. Sin. 2021, 79, 369–386. [Google Scholar] [CrossRef]
- Jiang, D.B.; Hu, D.; Tian, Z.P.; Lang, X.M. Differences between CMIP6 and CMIP5 Models in Simulating Climate over China and the East Asian Monsoon. Adv. Atmos. Sci. 2020, 37, 1102–1118. [Google Scholar] [CrossRef]
- Mohsenipour, M.; Shahid, S.; Chung, E.S.; Wang, X.J. Changing pattern of droughts during cropping seasons of Bangladesh. Water Resour. Manag. 2018, 32, 1555–1568. [Google Scholar] [CrossRef]
- Attogouinon, A.; Lawin, A.E.; Deliège, J.F. Evaluation of general circulation models over the upper oueme river basin in the republic of Benin. Hydrology 2020, 7, 11. [Google Scholar] [CrossRef] [Green Version]
- Gleckler, P.J.; Taylor, K.E.; Doutriaux, C. Performance metrics for climate models. J. Geophys Res. Atmos. 2008, 113, D06104. [Google Scholar] [CrossRef]
- Gusain, A.; Ghosh, S.; Karmakar, S. Added value of CMIP6 over CMIP5 models in simulating Indian summer monsoon rainfall. Atmos. Res. 2020, 232, 104680. [Google Scholar] [CrossRef]
- Srivastava, A.; Grotjahn, R.; Ullrich, P.A. Evaluation of historical CMIP6 model simulations of extreme precipitation over contiguous US regions. Weather Clim. Extrems 2020, 29, 100268. [Google Scholar] [CrossRef]
- Wang, D.; Liu, J.; Shao, W.; Mei, C.; Su, X.; Wang, H. Comparison of CMIP5 and CMIP6 MME for Precipitation Downscaling Results and Observational Data: The Case of Hanjiang River Basin. Atmosphere 2021, 12, 867. [Google Scholar] [CrossRef]
- Ahmadi, M.; Kashki, A.; Dadashi Roudbari, A. Spatial modeling of seasonal precipitation-elevation in Iran based on aphrodite database. Model. Earth Syst. Environ. 2018, 4, 619–633. [Google Scholar] [CrossRef]
- Zhou, Q.X.; Kang, X.; Jiang, X.W.; Liu, Y. Relationship Between Heavy Rainfall and Altitude in Mountainous Areas of Sichuan Basin. Meteor Mon. 2019, 45, 811–819. [Google Scholar] [CrossRef]
- Wu, D.; Jiang, Z.H.; Ma, T.T. Projection of summer precipitation over the Yangtze-Huaihe River basin using multimodel statistical downscaling based on canonical correlation analysis. J. Meteor. Res. 2017, 30, 867–880. [Google Scholar] [CrossRef]
- Salunke, P.; Jain, S.; Mishra, S.K. Performance of the CMIP5 models in the simulation of the Himalaya-Tibetan Plateau monsoon. Theor. Appl. Climatol. 2019, 137, 909–928. [Google Scholar] [CrossRef]
- Zhang, J.; Shi, P.; Yang, J.; Gong, D.Y. The impact of the urbanization process on rainfall in Beijing: A case study of 7.21 rainstorm. Acta Geogr. Sin. 2020, 75, 113–125. [Google Scholar] [CrossRef]
- Sahoo, S.K.; Himesh, S.; Gouda, K.C. Impact of Urbanization on Heavy Rainfall Events: A Case Study over the Megacity of Bengaluru, India. Pure Appl. Geophys. 2020, 177, 6029–6049. [Google Scholar] [CrossRef]
- Chen, H. Validation of the CMIP5 climate models in simulating decadal variations of summer rainfall in eastern China. Clim. Environ. Res. 2014, 19, 773–786. [Google Scholar] [CrossRef]
- Lin, Z.H.; Yang, X.Y.; Cheng, C.L.; Wang, Y.; Chen, H. Capability assessment of CMIP5 models in reproducing observed climatology and decadal changes in summer rainfall with different intensities over Eastern China. Clim. Environ. Res. 2018, 23, 1–25. [Google Scholar] [CrossRef]
Figure 1.
Topology and selected grids (0.5° × 0.5°) of the YRB.
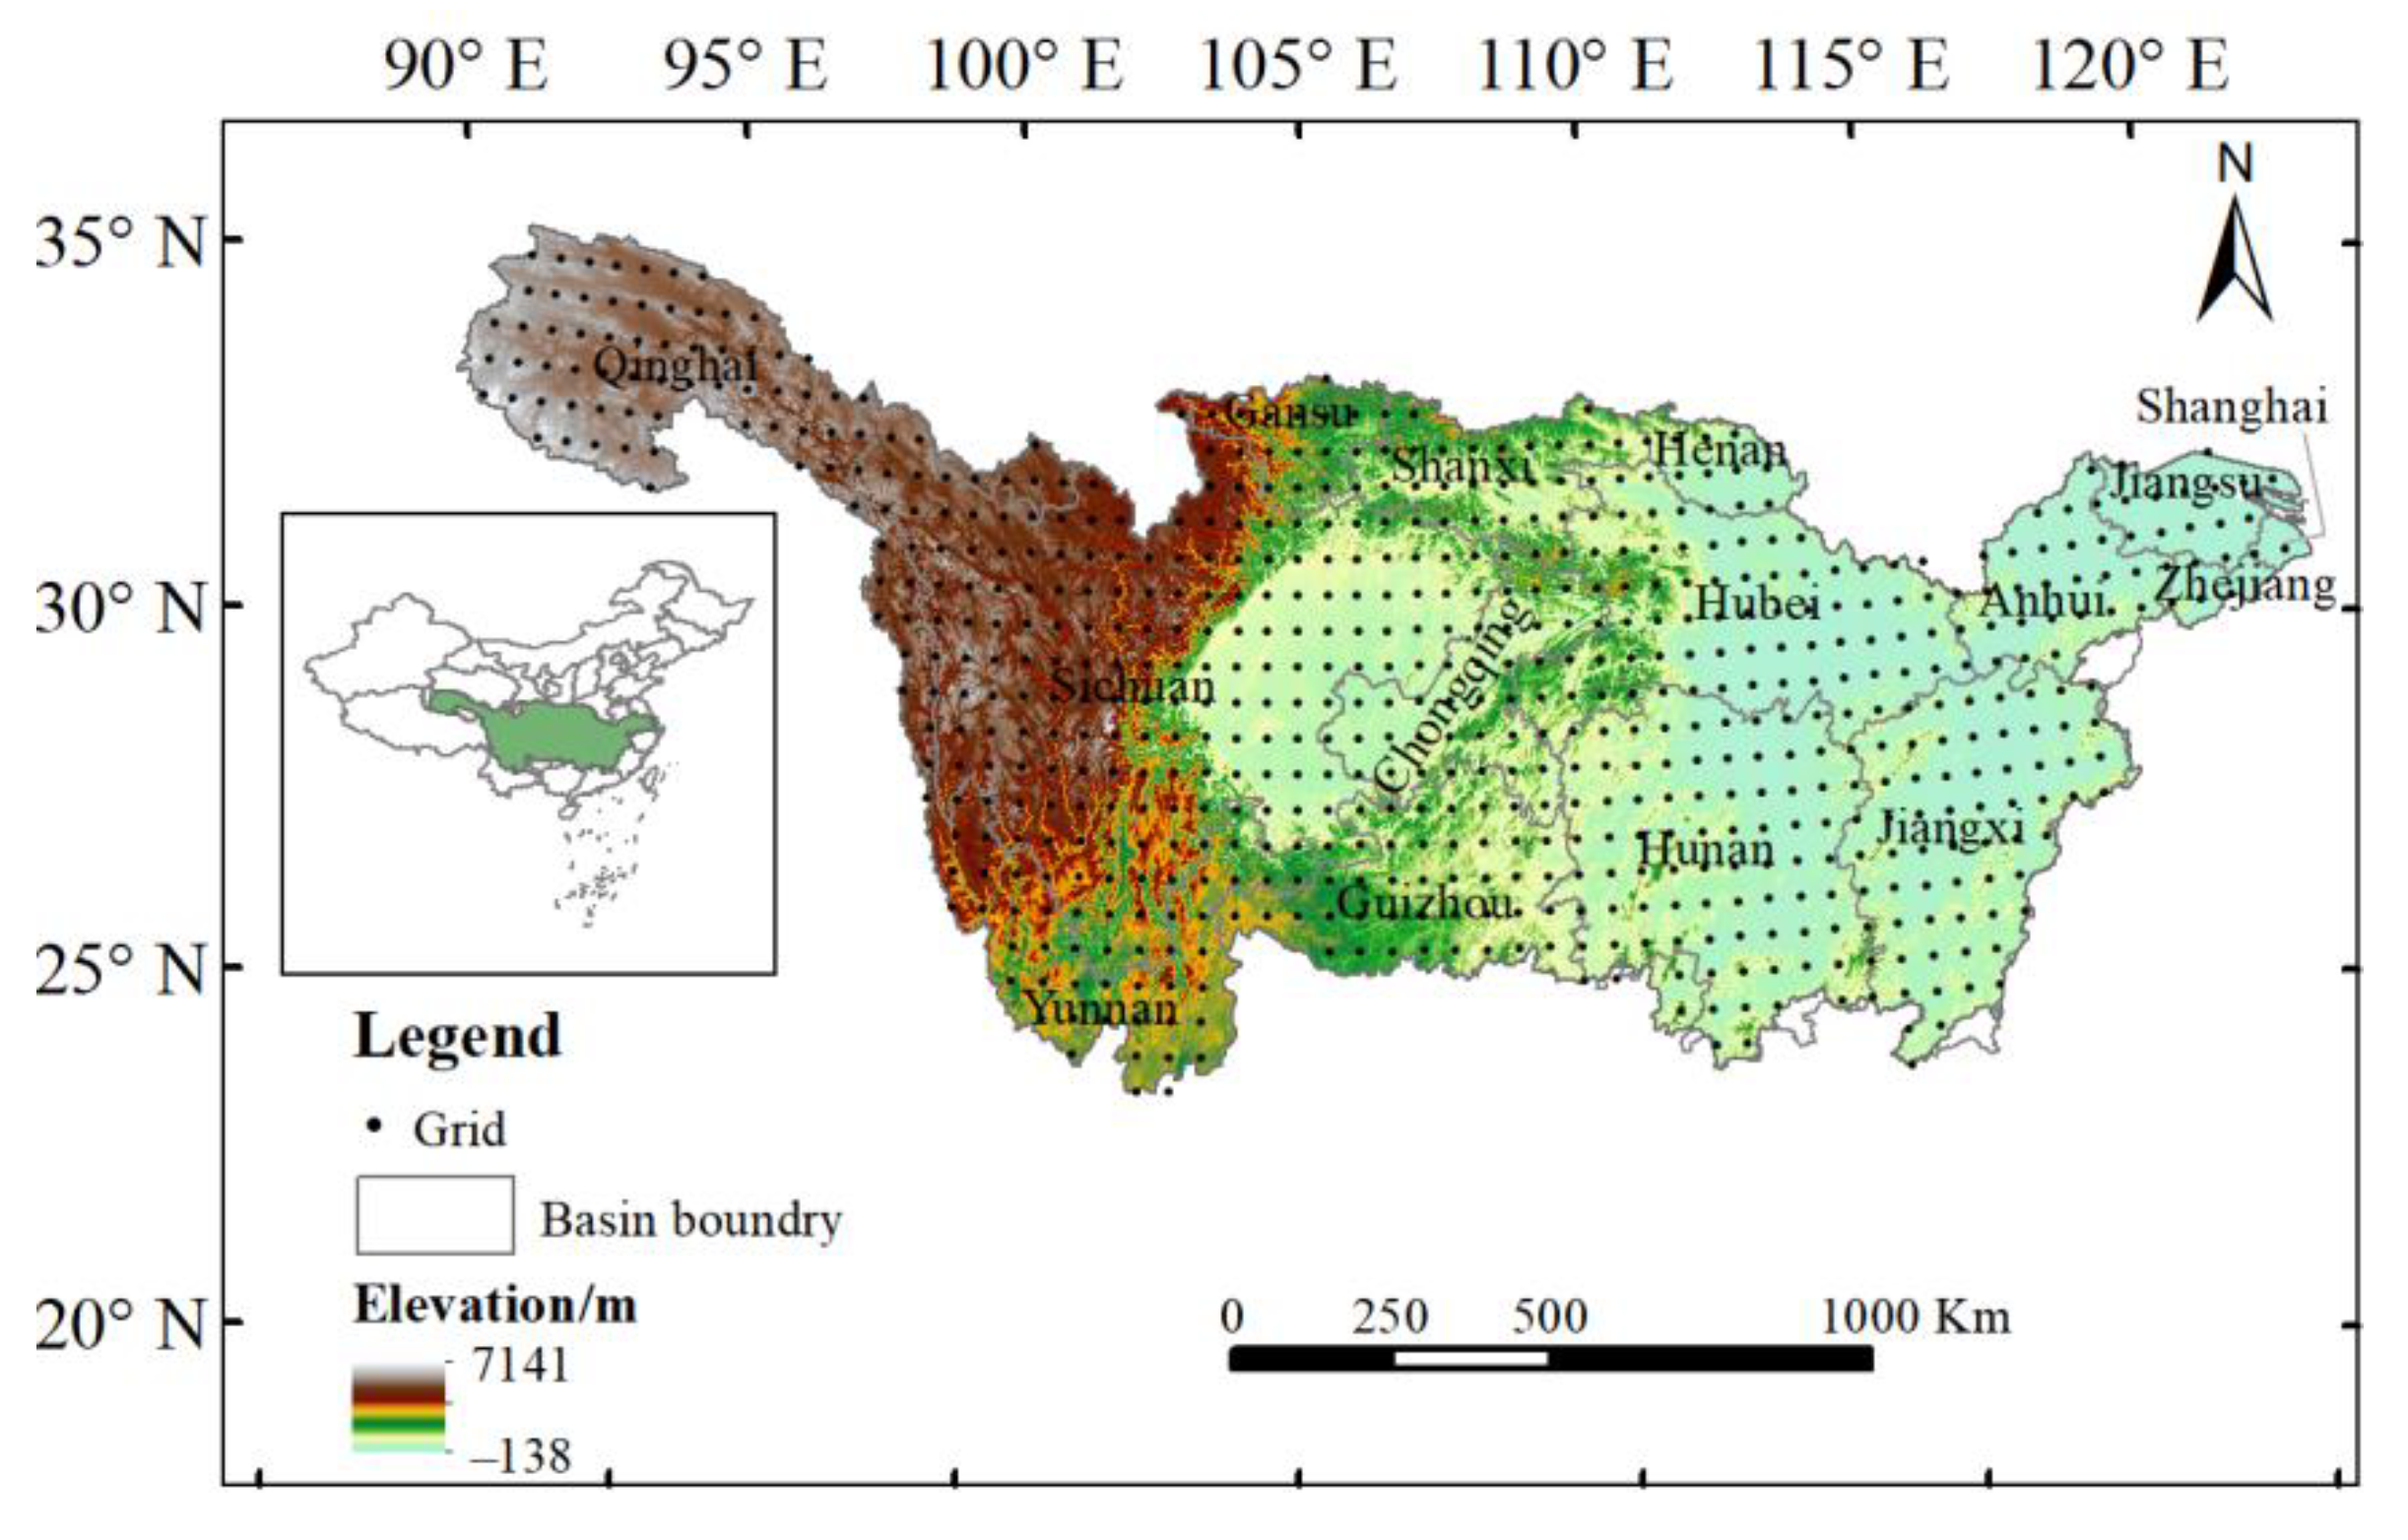
Figure 2.
Precipitation (mm) of the CMIP5-MME data, the CMIP6-MME data, and the observed data in annual (a–c), DJF (d–f), MAM (g–i), JJA (j–l), and SON (m–o) from 2015 to 2020.
Figure 2.
Precipitation (mm) of the CMIP5-MME data, the CMIP6-MME data, and the observed data in annual (a–c), DJF (d–f), MAM (g–i), JJA (j–l), and SON (m–o) from 2015 to 2020.
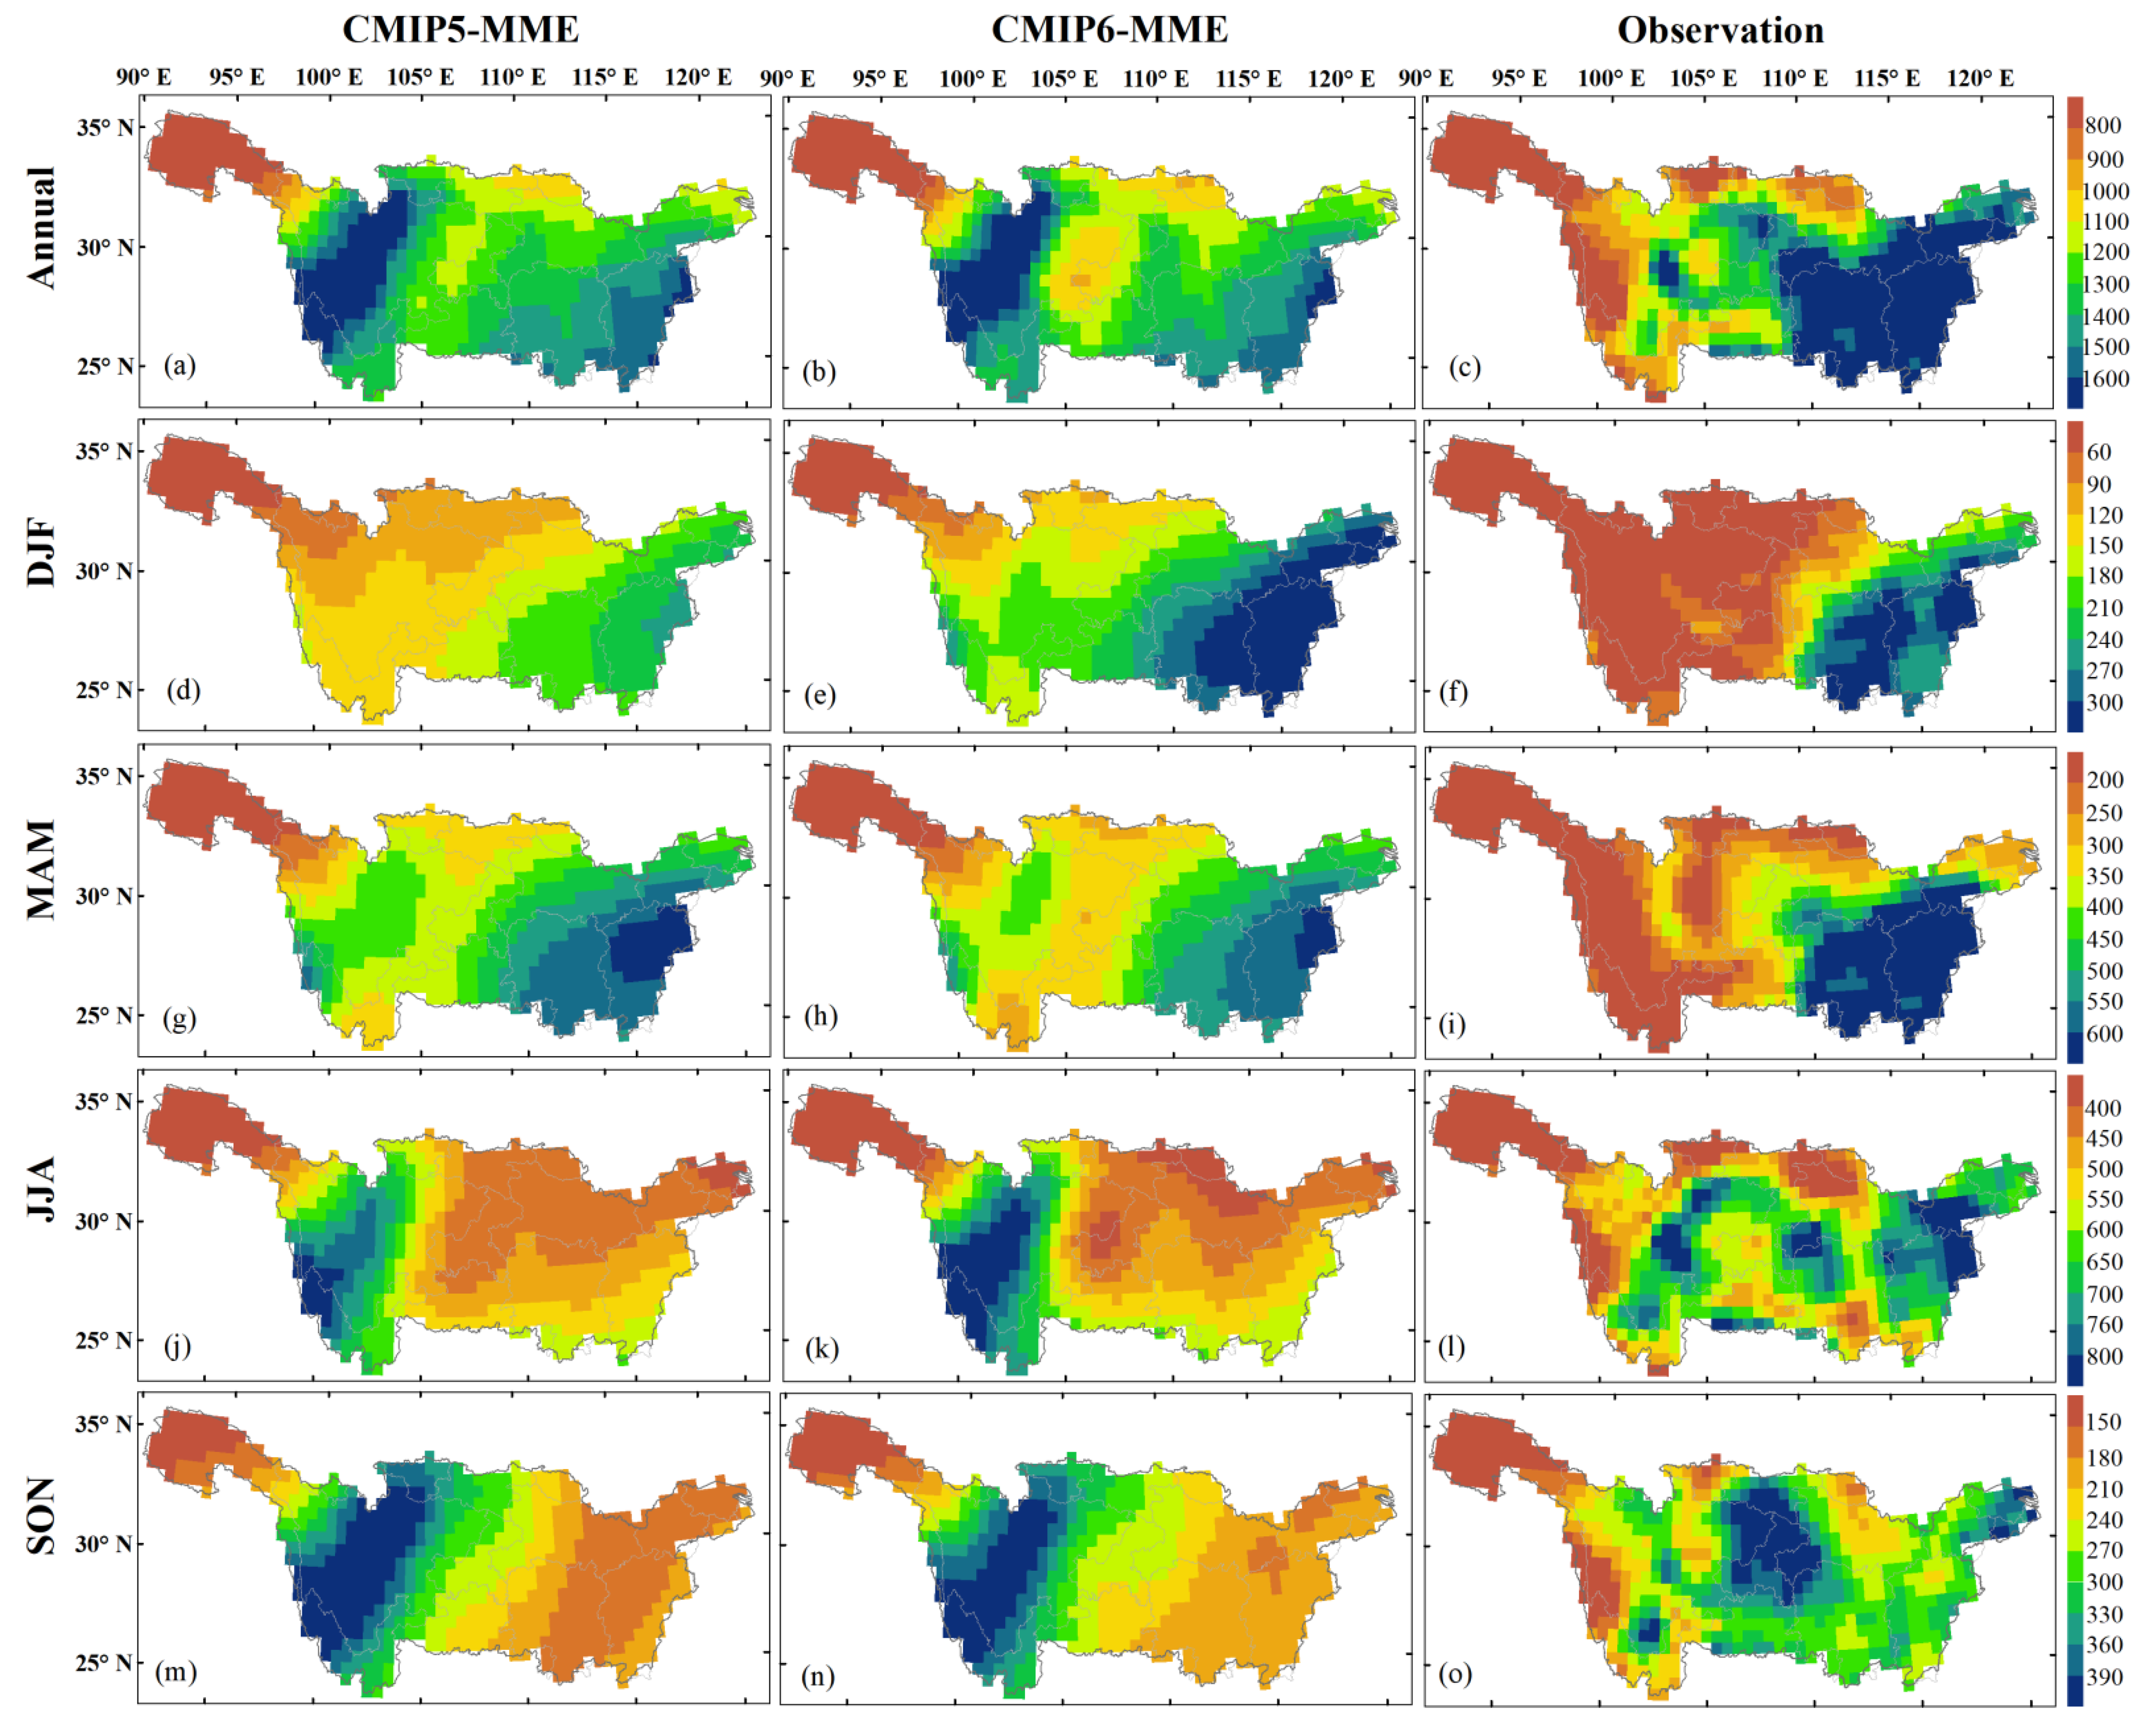
Figure 3.
Box plot of average annual precipitation of CMIP5-MME, CMIP6-MME and observed data for each year from 2015 to 2020.
Figure 3.
Box plot of average annual precipitation of CMIP5-MME, CMIP6-MME and observed data for each year from 2015 to 2020.

Figure 4.
The spatial pattern of relative bias (left two columns) and root-mean square error (right two columns) (projection minus observation) in CMIP5-MME and CMIP6-MME of annual (a–d), DJF (e–h), MAM (i–l), JJA (m–p), and SON (q–t) precipitation for the period 2015–2020. The first and third columns of each row belong to CMIP5-MME and the second and fourth columns belong to CMIP6-MME.

Figure 5.
Box plots of relative bias (a) and root-mean square error (b) (projection minus observation) in CMIP5-MME and CMIP6-MME of annual and seasonal precipitation for the period 2015–2020.
Figure 5.
Box plots of relative bias (a) and root-mean square error (b) (projection minus observation) in CMIP5-MME and CMIP6-MME of annual and seasonal precipitation for the period 2015–2020.

Figure 6.
Taylor diagrams displaying normalized pattern statistics of multi-year average (a) annual; (b) DJF; (c) MAM; (d) JJA; (e) SON precipitation over YRB between 20 GCMs and observations for the period 2015–2020. The normalized CRMSE between a GCM and observation (marked as REF) is their distance apart. The numbers indicate CMIP5 and CMIP6 GCMs listed in Table 1, respectively. Blue and red asterisks represent the median of the 10 CMIP5 and 10 CMIP6 GCMs, respectively.
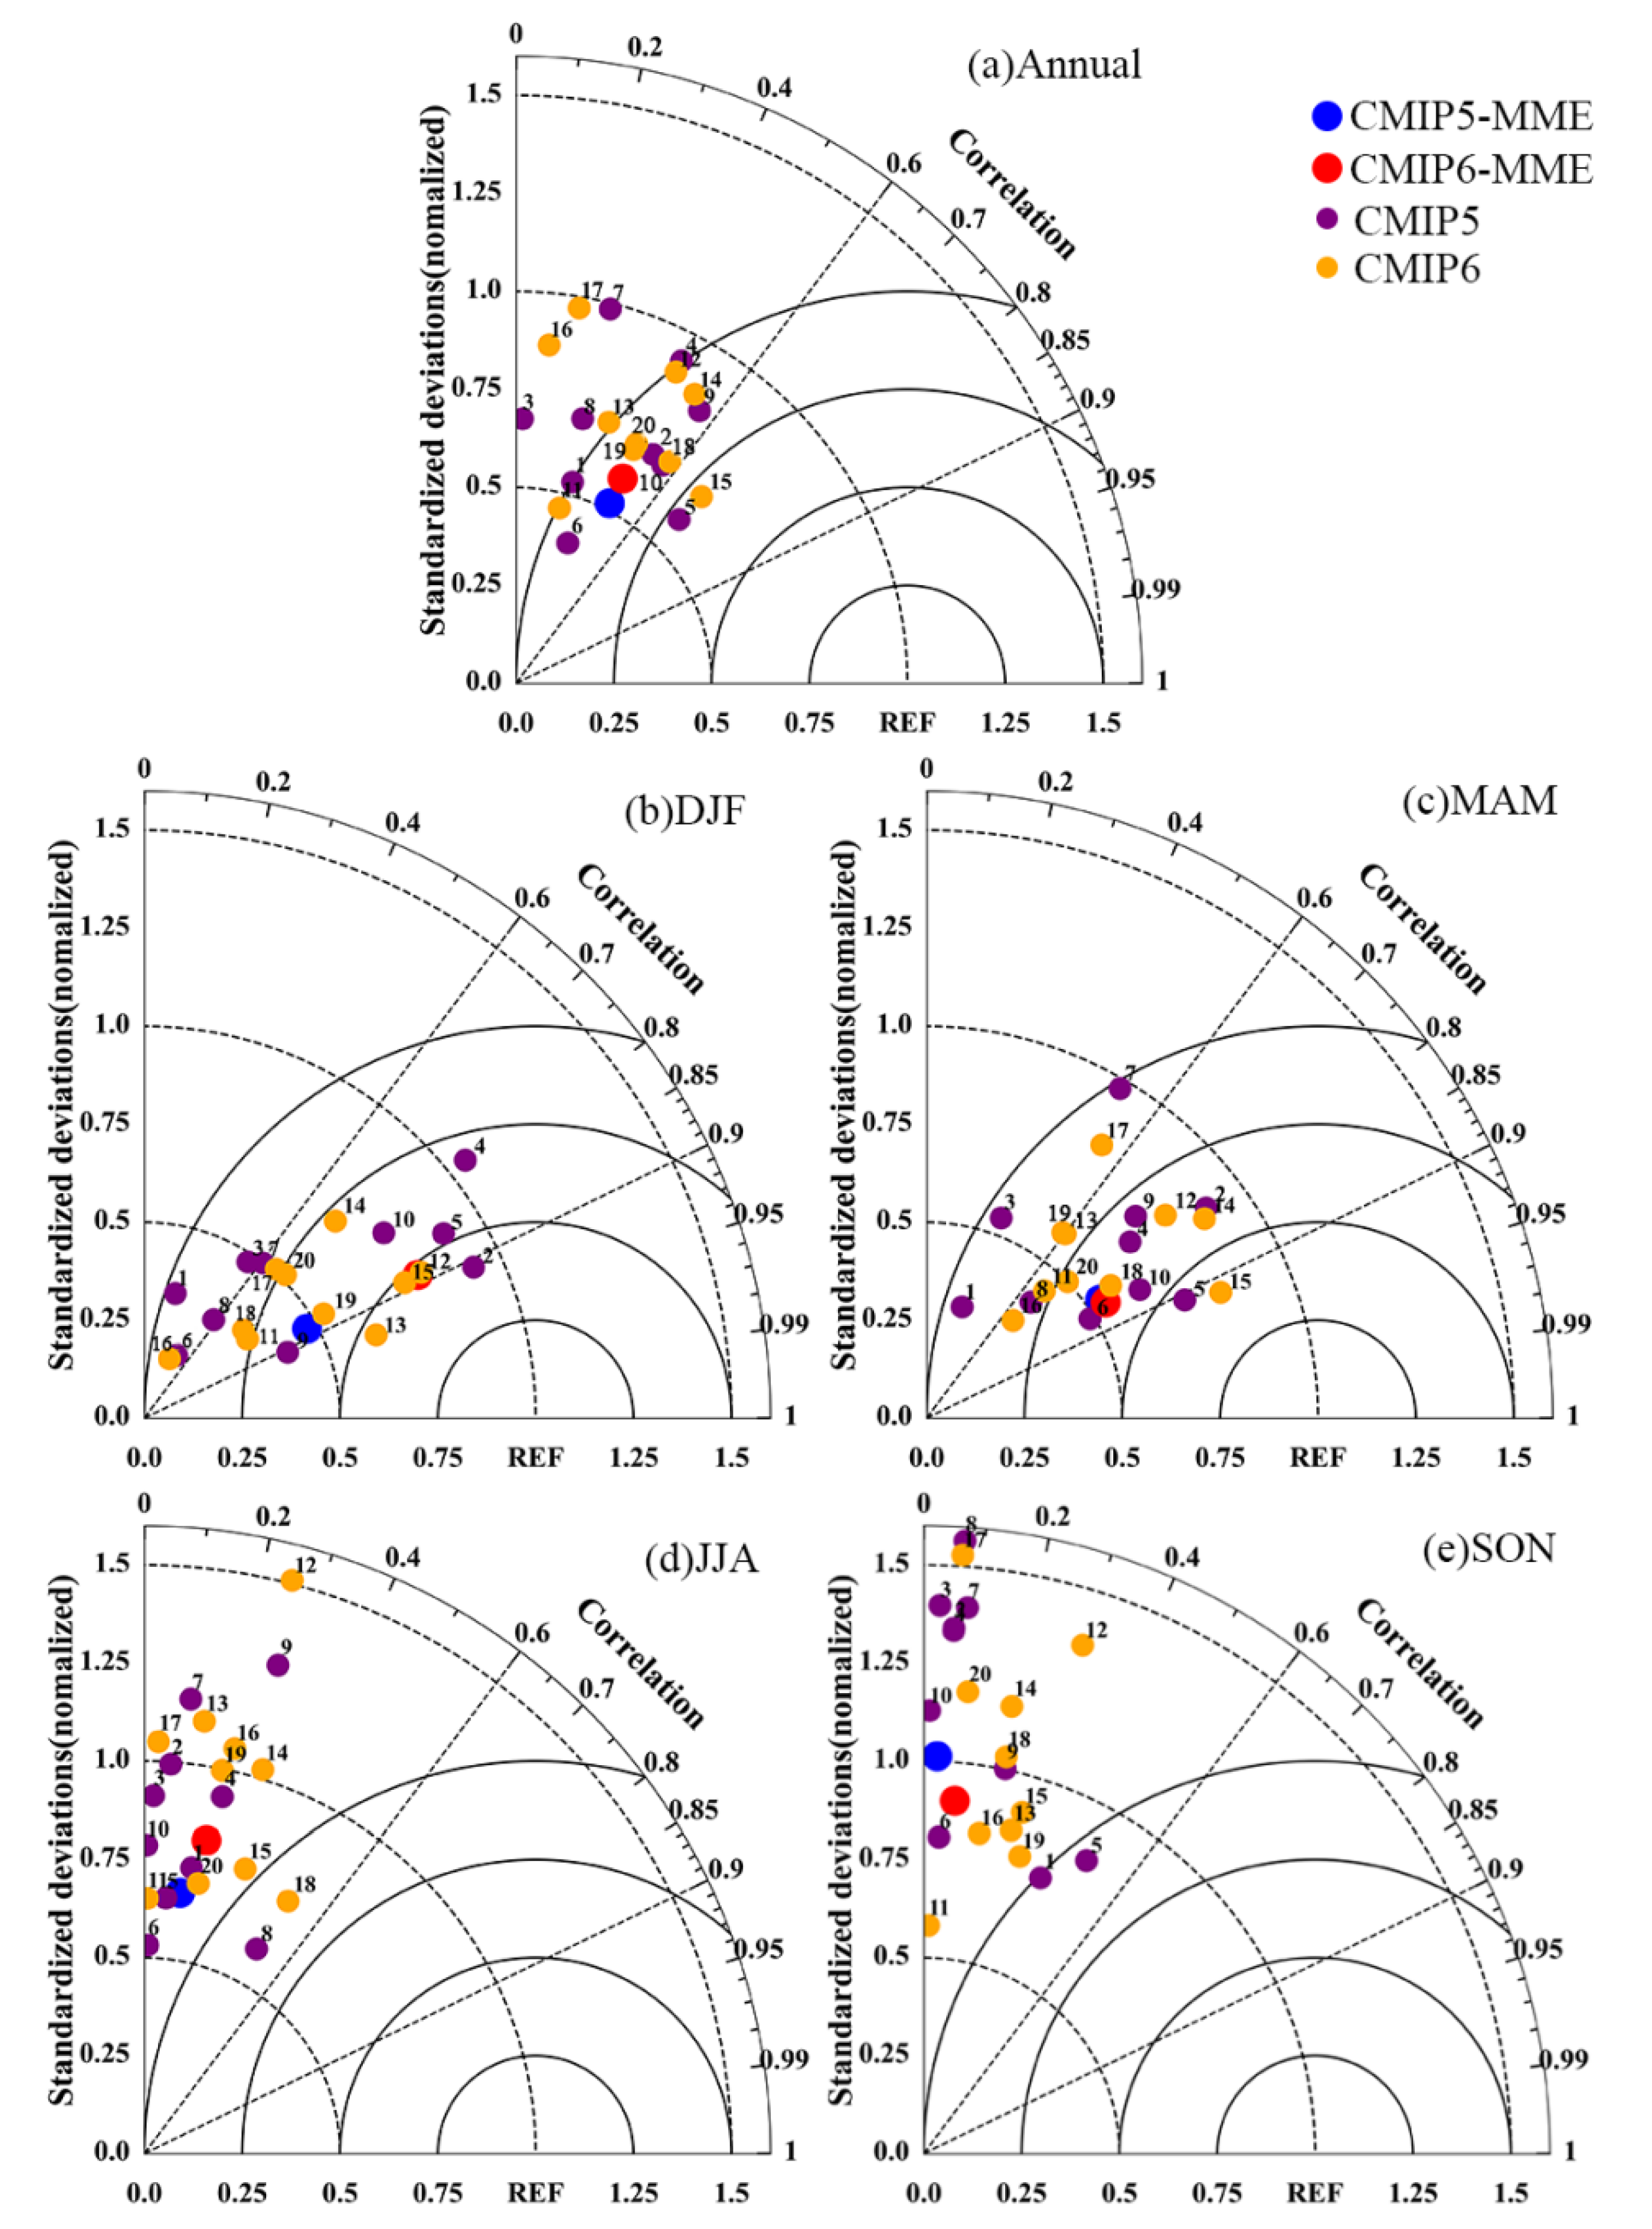
Figure 7.
Normalized root-mean square error (NRMSE) in precipitation projection by CMIP5 GCMs (purple empty circles), CMIP6 GCMs (orange empty circles), CMIP5-MME (blue filled triangles) and CMIP6-MME (red filled triangles), as well as median errors (solid line).
Figure 7.
Normalized root-mean square error (NRMSE) in precipitation projection by CMIP5 GCMs (purple empty circles), CMIP6 GCMs (orange empty circles), CMIP5-MME (blue filled triangles) and CMIP6-MME (red filled triangles), as well as median errors (solid line).

Figure 8.
Portrait diagrams for TS score of the (annual, seasonal) mean precipitation in 2015–2020 by the CMIP5 (a) and CMIP6 (b) GCMs. From left to right are ANN, DJF, MAN, JJA, SON, and average means. The GCMs’ names listed on the left follow their ranks; The number before the name is the rank of the model among all GCMs.

Table 1.
Basic information about the 20 GCMs. Model IDs 1–10 are from CMIP5, and IDs 11–20 are from CMIP6.
Table 1.
Basic information about the 20 GCMs. Model IDs 1–10 are from CMIP5, and IDs 11–20 are from CMIP6.
| Model ID | Country or Union | Atmospheric Resolution | |
|---|---|---|---|
| 1 | BCC-CSM1-1-m | China | 1.125° × ~1.1° |
| 2 | CanESM2 | Canada | ~2.8° × 2.8° |
| 3 | CESM1-WACCM | USA | 1.25° × ~0.9° |
| 4 | CNRM-CM5 | France | ~1.4° × 1.4° |
| 5 | EC-EARTH | Europe | 1.125°×~1.1° |
| 6 | FGOALS-g2 | China | ~2.8° × 3–6° |
| 7 | GISS-E2-R | USA | 2.5° × 2° |
| 8 | IPSL-CM5A-LR | France | 3.75° × ~1.9° |
| 9 | MIROC5 | Japan | ~1.4° × 1.4° |
| 10 | MPI-ESM-LR | Germany | 1.875° × ~1.9° |
| 11 | BCC-CSM2-MR | China | 1.125° × ~1.1° |
| 12 | CanESM5 | Canada | 2.8125° × ~2.8° |
| 13 | CESM2-WACCM | USA | 1.25° × ~0.9° |
| 14 | CNRM-CM6-1 | France | ~1.4° × 1.4° |
| 15 | EC-Earth3 | Europe | ~0.7° × 0.7° |
| 16 | FGOALS-g3 | China | 2° × ~2–5° |
| 17 | GISS-E2-1-G | France | 2.5° × 2° |
| 18 | IPSL-CM6A-LR | France | 2.5° × ~1.3° |
| 19 | MIROC6 | Japan | ~1.4° × 1.4° |
| 20 | MPI-ESM1-2-LR | Germany | 1.875° × ~2° |
Publisher’s Note: MDPI stays neutral with regard to jurisdictional claims in published maps and institutional affiliations. |
© 2022 by the authors. Licensee MDPI, Basel, Switzerland. This article is an open access article distributed under the terms and conditions of the Creative Commons Attribution (CC BY) license (https://creativecommons.org/licenses/by/4.0/).
Share and Cite
MDPI and ACS Style
Pan, H.; Jin, Y.; Zhu, X. Comparison of Projections of Precipitation over Yangtze River Basin of China by Different Climate Models. Water 2022, 14, 1888. https://doi.org/10.3390/w14121888
AMA Style
Pan H, Jin Y, Zhu X. Comparison of Projections of Precipitation over Yangtze River Basin of China by Different Climate Models. Water. 2022; 14(12):1888. https://doi.org/10.3390/w14121888
Chicago/Turabian StylePan, Hong, Youjie Jin, and Xiaochen Zhu. 2022. "Comparison of Projections of Precipitation over Yangtze River Basin of China by Different Climate Models" Water 14, no. 12: 1888. https://doi.org/10.3390/w14121888
Note that from the first issue of 2016, this journal uses article numbers instead of page numbers. See further details here.