Article

Nitrogen Removal of Water and Sediment in Grass Carp Aquaculture Ponds by Mixed Nitrifying and Denitrifying Bacteria and Its Effects on Bacterial Community

1
College of Fisheries, Huazhong Agricultural University, Wuhan 430070, China
2
Engineering Research Center of Green Development for Conventional Aquatic Biological Industry in the Yangtze River Economic Belt, Ministry of Education, Wuhan 430070, China
3
Hubei Provincial Engineering Laboratory for Pond Aquaculture, Wuhan 430070, China
4
Hubei Hongshan Laboratory, Wuhan 430070, China
*
Author to whom correspondence should be addressed.
Water 2022, 14(12), 1855; https://doi.org/10.3390/w14121855
Submission received: 6 May 2022 / Revised: 6 June 2022 / Accepted: 7 June 2022 / Published: 9 June 2022
(This article belongs to the Special Issue Effect of Aquatic Environment on Fish Ecology)

Abstract

:
Nitrification and denitrification are important for nitrogen (N) cycling in fish ponds culture, but the effects of nitrifying and denitrifying bacteria concentrations on pond water and sediments remain largely unknown. Here, we used 0, 0.15, 0.30, 0.60 mg/L different concentrations of mixed nitrifying and denitrifying bacteria to repair the pond substrate through an enclosure experiment lasting 15 days. The results showed that the purification effect of nitrifying and denitrifying bacteria was most obvious on pond nitrogen from day 4 to day 7. The optimal relative concentration was 0.60 mg/L for nitrifying and denitrifying bacteria; NH4+-N (ammonia nitrogen) decreased by 75.83%, NO2-N (nitrite) by 93.09%, NO3-N (nitrate) by 38.02%, and TN (total nitrogen) by 45.16% in this concentration group on pond water. In one cycle, C/N (carbon/nitrogen) ratio of both water body and bottom sediment significantly increased, but C/N ratio of water body increased more significantly than that of sediment. Water C/N ratio increased by 76.00%, and sediment C/N ratio increased by 51.96% in the 0.60 mg/L concentration group. Amplicon sequencing of pond sediment showed that the change in nitrifying and denitrifying bacterium diversity was consistent with that in water quality index. Dominant nitrifying bacteria had a relatively high percentage, with significant differences in dominant bacterium percentage across different bacterial addition groups, while dominant denitrifying bacterium percentage was not high without significant differences among different groups. The dominant species of nitrifying bacteria were, respectively, Nitrosomonas, Nitrosovibrio, Nitrosospira, and Aeromonas, and the dominant species of denitrifying bacteria were Thauera, Azoarcus, Magnetospirillum, Azospira, and Idiomarina. The correlation analyses showed an aerobic nitrification and facultative anaerobic denitrification in pond sediments. Research shows that the addition of exogenous nitrifying and denitrifying bacteria can effectively reduce the nitrogen load of pond water and sediment. At the concentration of 0.6 mg/L, the nitrogen load of pond water and sediment decreased most obviously, which had the best effect on pond purification.

1. Introduction

In intensive ponds, a large amount of feed is put into water and sediment, and thus, nitrogen is continuously accumulated in water and sediment. In pond culture, only 5–6% of total nitrogen is converted into fish biomass, and 29% of N is accumulated in sediment. The remaining fractions are lost through pond water discharges into adjacent canals [1]. Studies examining the mixed culture of shrimp and crab found that the main input of nitrogen was the feed, and the main output of N was sediment [2]. As the pond culture age increases, the unused feed nitrogen accumulates in the pond [3,4]. However, high nitrogen (N) concentration leads to eutrophication, thus resulting in physiologically toxic effects in aquaculture [5].
A large amount of nitrogen input will reduce the C/N ratio in the pond. Low-C/N ratio water bodies are dominated by autotrophic bacteria [6], which may enhance the mineralization of organic matter to release ammonia nitrogen and nitrite into water, thus affecting the health of fish [7]. Heterotrophic bacteria are dominant in water with high C/N ratio [8]. Heterotrophic bacteria contribute to bioremediation of nitrogen-containing waste [9], and they also contribute to the conversion of inorganic nitrogen into bacterial components as a food source for reuse [10]. The study of Nile tilapia in the biofloc culture system has indicated that with the increase in C/N ratio, the microorganisms in biofloc systems change from autotrophic bacteria to heterotrophic ones [11]. Currently, the main method to improve C/N ratio in ponds is to add carbon sources. The increasing chemical oxygen demand (COD) load is beneficial for the assimilation and absorption of nutrient substrates by microorganisms to raise the denitrification rate [12]. When the C/N value is greater than 7, an efficient denitrification process can be realized [13]. However, other studies have found that carbon source addition has no significant effect on aquaculture water quality and fish growth [14]. When the feed itself contained high protein, adding additional carbon source to improve pond C/N did not have a significant effect on water quality [14]. After nitrogen overload in the pond, the effect of carbon source addition on C/N ratio was not obvious. Therefore, nitrogen reduction in the pond is an alternative method to improve C/N ratio.
Current technologies for nitrogen reduction include biological manipulation, conventional dredging, aquatic phytoremediation, and microbial remediation. The biological treatment method is to use high-nutrient organisms to prey low-nutrient organisms or organic matter, thus indirectly reducing the nutrients in the water, eventually repairing the pond sediments [15]. Although the biological control method can improve the sediment purification effect and prevent the competition between organisms and aquaculture objects, it is not conducive to the growth of aquaculture objects [16]. The traditional dredging method is pond drainage or mechanical dredging, which can effectively relieve the nitrogen of sediment pollution [17], but it has a high demand on the time limit, and the excavated sediment is harmful to the environment [18]. Aquatic phytoremediation is one of the important remediation methods for water pollution. Aquatic plants can absorb N, P, and other nutrients in the water, reduce the toxic side effects on the aquaculture, and provide oxygen to the water through photosynthesis [19]. The application of bio-floating bed technology can significantly reduce nitrite and ammonia concentrations in water body and improve the growth performance and muscle quality of grass carp [20]. Microbial remediation is to purify the water environment of aquaculture pond via the absorption, transformation, and degradation by microorganisms. Microbial remediation of ponds is generally carried out by microecological agents, such as effective microorganisms (EM), bacillus, nitrifying bacteria, and denitrifying bacteria [21,22,23]. Microbial remediation is characterized by high efficiency and desirable purification effect, and it is one of the most important means of water pollution control at present.
Pond microorganisms, including bacteria, archaea, fungi, and protists, have a rich diversity and perform complex functions. Generally, bacterial populations account for more than 90% of the total microbial population in non-extreme aquatic ecosystems [24]. In pond culture, the dominant populations of bacteria are basically similar at the phylum level in different culture environments. β-Proteobacteria, α-Proteobacteria, and Actinobacteria are the dominant groups in the water environment of carp culture [25]. Bacteroidetes are the main species of bacteria in freshwater shrimp pond [26]. Proteobacteria, Cyanobacteria, Actinobacteria, and Bacteroidetes are the main types in the water. Proteobacteria, Cyanobacteria, Actinobacteria, and Bacteroidetes are the main types in the sediment [27]. Bacteroidetes, α-Proteobacteria, and γ-Proteobacteria were the dominant bacteria in the circulating culture system of flounder (Matos et al., 2011). The dominant bacteria in grass carp (Ctenopharyngodon idella) culture are Proteobacteria, Bacteroidetes, and Actinobacteria [27,28].
Dissimilatory nitrate reduction processes, including denitrification, anaerobic ammonium oxidation (ANAMMOX), and dissimilatory nitrate reduction to ammonium (DNRA), are crucial nitrogen (N) cycling pathways in freshwater ecosystems [8]. Nitrifying bacteria and denitrifying bacteria are the bacteria that have an obvious transformation effect on nitrogen [29]. Nitrification oxidizes ammonia nitrogen into nitrite nitrogen and eventually converts the latter into nitrate nitrogen, but nitrification does not directly affect the N stock in the system [30]. Denitrification is a gradual reduction of nitrate nitrogen into nitrite nitrogen, and eventually into gaseous nitrogen, thus reducing the N stock in the system [29]. The addition of nitrifying bacteria (living bacteria at 3.67 × 10⁷ Cfu/mL) to water can significantly reduce the ammonia nitrogen content in water body [31]. The application of denitrifying bacteria (105 Cfu/mL) exhibited a good removal effect on nitrogen [32]. However, nitrification and denitrification could not be enhanced under excessive addition of exogenous nitrifying and denitrifying bacteria [33].
Heterotrophic bacteria can improve water quality by increasing the C/N ratio, and in turn, low C/N ratio inhibits the growth of heterotrophic bacteria. Autotrophic nitrifying and denitrifying bacteria have sufficient advantages under these circumstances. There are many studies on the effects of nitrifying and denitrifying bacteria on water body. A large number of studies have shown that nitrifying and denitrifying bacteria can effectively purify ammonia and nitrite in water [31,32], but less research has been conducted on pond sediment purification. In this study, a stable closed small enclosure was formed by applying acrylic transparent tube with high light transmittance and high chemical resistance, and the abundance changes in nitrifying and denitrifying bacteria themselves in pond sediments were explored after different concentrations of nitrifying and denitrifying bacteria were introduced. The purification effect of these exogenous bacteria on pond water and sediment was also examined. Our study will supplement the purification effect of nitrifying and denitrifying bacteria on pond sediments and provide theoretical basis for pond healthy culture.

2. Materials and Methods

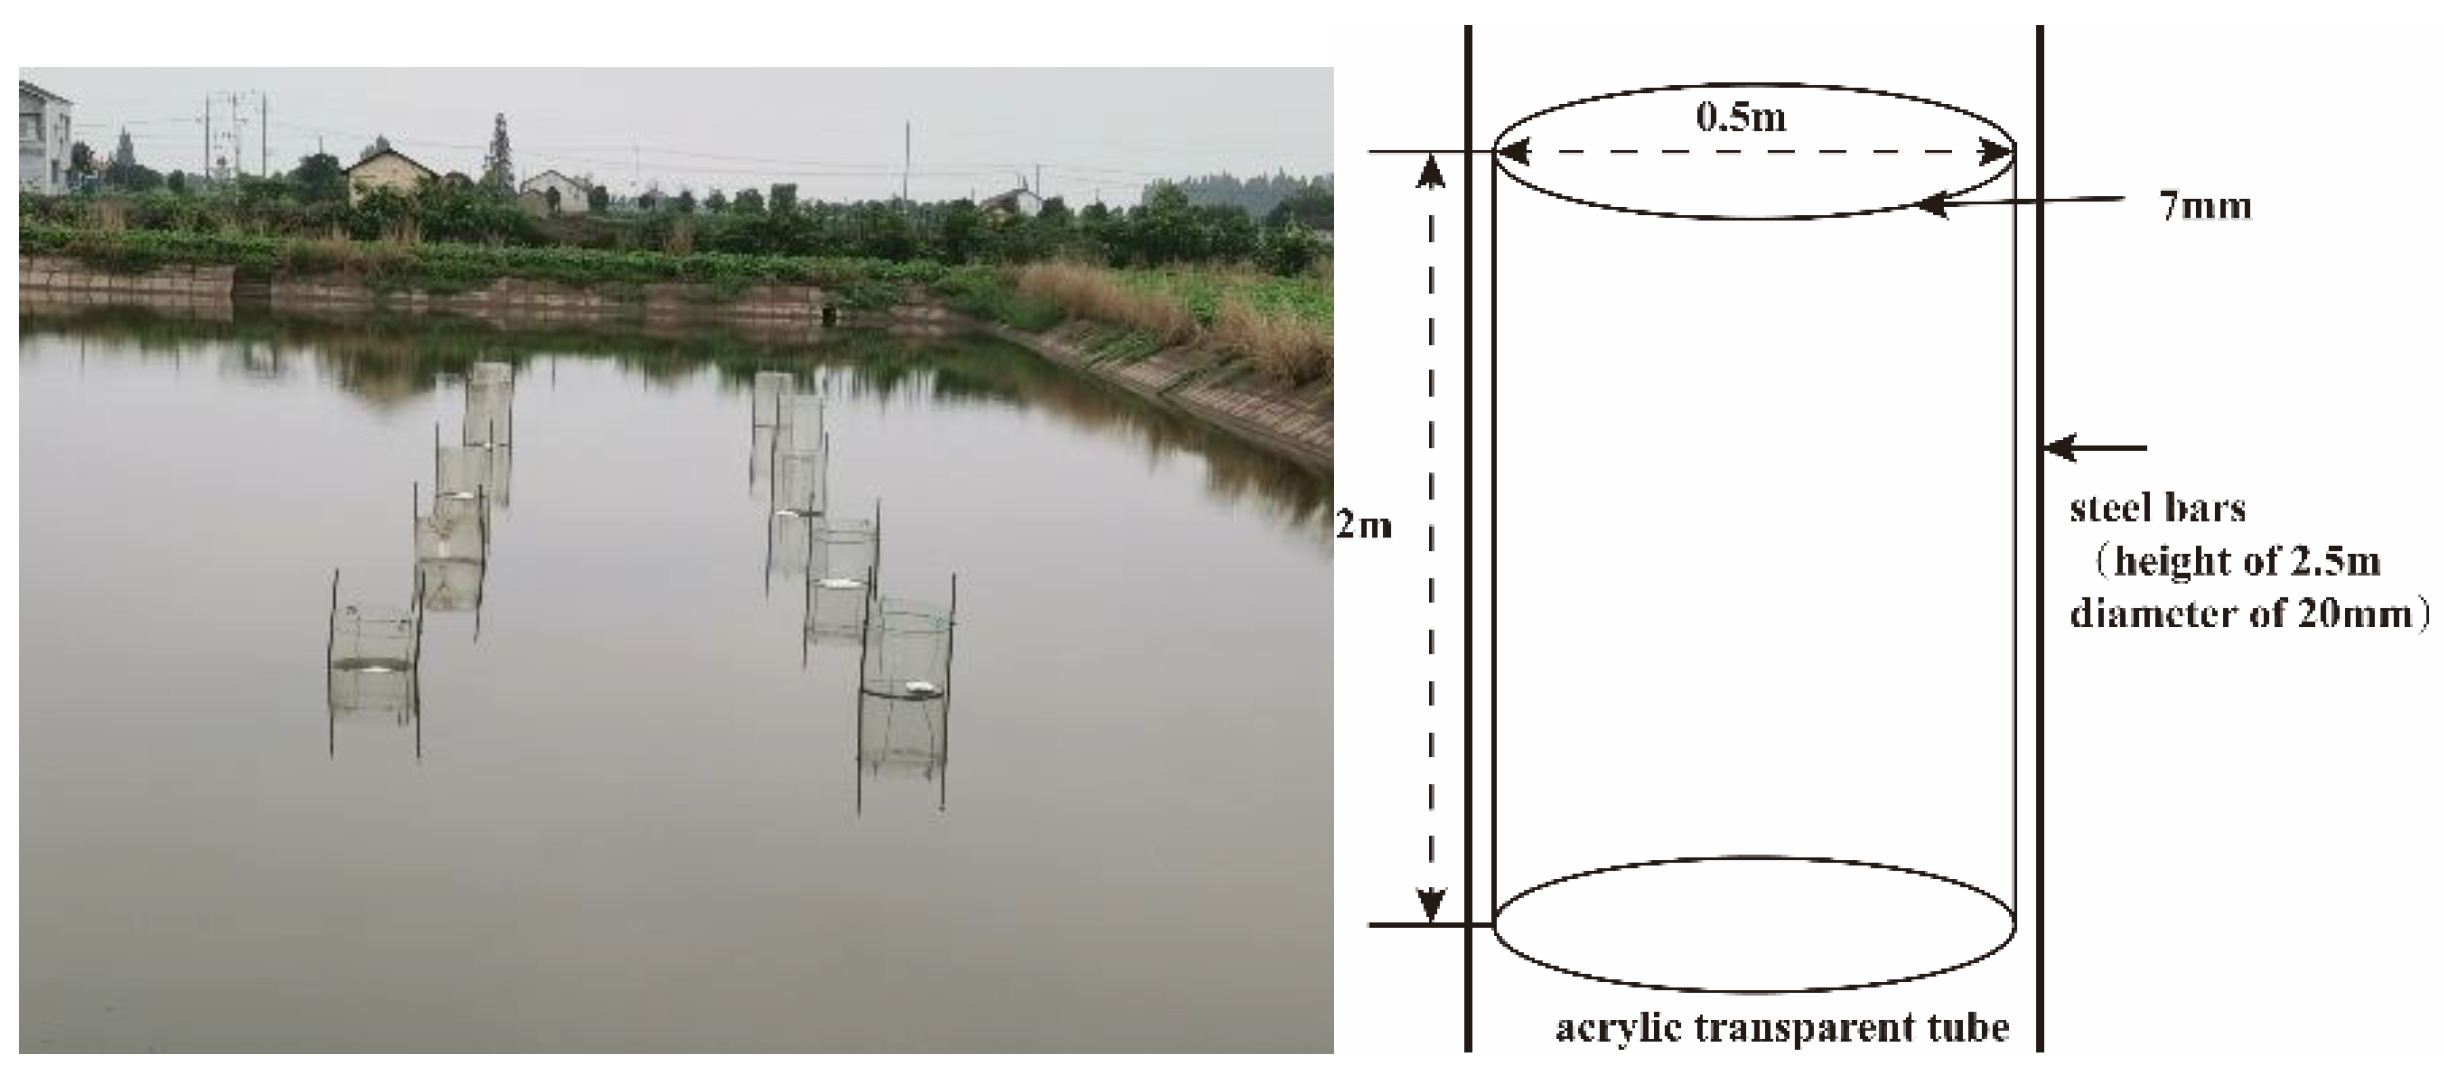
2.1. Pond Environment

The experiment was carried out at Chonghu Fishery, Gong’an County, Jingzhou City, Hubei Province, China (29°57′ N, 112°14′ E). The pond had an aquaculture history of more than 20 years with the sediment accumulation thickness of more than 40 cm. During this period, the main breeding object is grass carp. The breeding density is 1500–2000 kg/acre. Grass carp should be fed 3–5% feed daily of its body weight (25–32% nitrogen). Pond sediment thickness increases by 2–3 cm per year. Eight acrylic transparent tubes with a diameter of 0.5 m, a height of 2 m, and a thickness of 7 mm were vertically inserted into a 1.4 m deep pond with a sediment insertion depth of 0.4 m. The 8 acrylic transparent tubes formed 8 independent small enclosure spaces (Figure 1). Two steel bars (height of 2.5 m, diameter of 20 mm) were vertically inserted into the pond sediment with insertion depth of 0.5 m along each transparent cylinder, with the cylinder diameter (0.5 m) as distance between two steel bars. The two steel bars were, respectively, fixed onto acrylic transparent tubes with iron wire (Figure 1). The nitrifying and denitrifying bacteria used in the experiment were purchased from Nanjing Celt Biotechnology Co., Ltd., Jiangsu, China. The mixed bacteria were composed of nitrifying bacteria and denitrifying bacteria, of which the proportion of nitrifying bacteria was 50%, and the number of viable bacteria was more than 1010 cfu/g, and the proportion of denitrifying bacteria was 50%, and the number of viable bacteria was more than 1010 cfu/g. Nitrifying bacteria were composed of ammonia-oxidizing bacteria and nitrite-oxidizing bacteria, while denitrifying bacteria were composed of nitrite-reducing bacteria and nitrite-reducing bacteria. The 8 acrylic transparent tubes were divided into four groups, with nitrification and denitrification bacteria mixture concentrations of 0, 0.15, 0.30, and 0.60 mg/L (viable bacteria content > 1010 cfu/g). Before the addition of nitrifying and denitrifying bacteria, the samples were collected from each concentration group. After the addition of nitrifying and denitrifying bacteria, samples were collected on the 1st, 3rd, 7th, 10th, and 15th day. The samples included water samples, sediment samples, and sediment microbial samples. Three samples were extracted from each group of sediments for microbial amplification and sequencing. Total organic carbon and total nitrogen in sediment samples, and ammonia nitrogen, nitrite, nitrate, total nitrogen in water samples were repeated three times for data analysis.

2.2. Sample Collection

In the current study, water samples were collected with a 5 L water sample collector and stored in 1 L polycarbonate glass bottles. Sediment samples were collected with a steel Peterson dredger with an area of 1/16 m2 and stored in polycarbonate bags. A portion of sediment sample (1–2 g) was put into a sterilized centrifuge tube (2.0 mL) and stored in liquid nitrogen until DNA extraction.

2.3. Determination of Carbon and Nitrogen

Based on water samples, compound analyses of ammonium nitrogen (NH4+-N), nitrite nitrogen (NO2-N), nitrate nitrogen (NO3-N), and total nitrogen (TN) were performed using a Nanodrop 2800C UV-ultraviolet spectrophotometer (Thermo Scientific, Wilmington, DE, USA) by standard method [34]. Water chemical oxygen demand (COD) was determined using the acid potassium permanganate method. Total nitrogen (TN) in the sediment samples was measured using the Kjeldahl method, and total organic carbon (TOC) was detected using the hydration thermal potassium dichromate oxidation-colorimetric method.

2.4. DNA Extraction

The total genomic DNA of the sediment was extracted from 0.25 g sediment using the Power Soil® DNA Isolation kit (MoBio, Carlsbad, CA, USA) according to the manufacturer’s protocol. As recommended by the manufacturer, DNA extracts were purified using the Wizard DNA Clean Up System (Axygen Bio, Union City, NJ, USA) and stored at −80 °C until analysis.

2.5. High-Throughput Sequence Analysis

The amoA-AOB gene was amplified by using upstream primer amoA1F (GGGGTTTCTACTGGTGGT) and downstream primer amoA2R (CCCCTCKGSAAAGCCTTCTTC) with an amplicon size of 500 bp. NirS gene was amplified by using upstream primer cd3aF (GTSAACGTSAAGGARACSGG) and downstream primer R3cdR (GASTTCGGRTGSGTCTTGA) with the amplicon size of 400 bp. PCR amplification and high-throughput sequencing were performed using the Illumina Miseq platform by Personal Biotechnology Co., Ltd. (Shanghai, China). The PCR conditions using Amx368F/Amx820R were as follows: 94 °C for 4 min; 32 cycles of 94 °C for 30 s, 51 °C for 30 s, and 72 °C for 1 min; and 72 °C for 5 min. The products were then stored at 4 °C. The PCR conditions with the hzo5F/hzo5R primers consisted of 94 °C for 4 min; 32 cycles of 94 °C for 30 s, 50 °C for 30 s, and 72 °C for 1 min; and 72 °C for 5 min; and the products were then stored at 4 °C. The PCR conditions with the nirS gene primers were 94 °C for 5 min; 32 cycles of 94 °C for 30 s, 53 °C for 30 s, and 72 °C for 1 min; and 72 °C for 10 min. The products were then stored at 4 °C. The presence and size of the amplification products were determined by running 1.0% agarose gels in TAE buffer at 110 V and 200 mA for 25 min.
Quality filtering of the raw tags was performed under specific filtering conditions with QIIME (Version 1.9.0, http://qiime.org/index.html, accessed on 1 March 2021) in order to obtain high-quality clean tags. The tags were compared with the reference database (Gold database; http://drive5.com/uchime/uchime_download.html, accessed on 1 March 2021) using the UCHIME algorithm (UCHIME Algorithm; http://www.drive5.com/usearch/manual/uchime_algo.html, accessed on 1 March 2021) to detect chimeric sequences, which were then removed. The data were de-noised, and the sequences with more than 150 base pairs (bp), less than 8 bp, and ambiguous base pairs and chimeric sequences were eliminated to ensure the high quality of sequence reads. All similar high-quality reads with a similarity of ≥97% were aggregated into an operational classification unit (OTU) [35]. An “OTU table” showing the number of reads from each sample assigned to each OTU was created by using the usearch_global command. α and β diversity were calculated by QIIME based on processed pyrosequencing data (Version 5.1) software. Similarly, QIIME was used to analyze species composition by statistical analysis after the feature table after singleton was removed. The environmental data were combined with the statistics of the feature table after singleton was removed. Environmental and microbial redundancy analyses (RDA) were calculated by QIIME [36].

2.6. Statistical Analyses

The data of NH4+-N, NO2-N, NO3-N, TN, C/N of water, C/N of sediment, and α diversity were expressed as mean ± SD. Before data analysis, the Shapiro–Wilk method was used to test data normality. All the data were analyzed by IBM SPSS 21, following the normal distribution. If not specified, significant differences between groups were analyzed by ANOVA. p < 0.05 was considered statistically significant.

3. Results

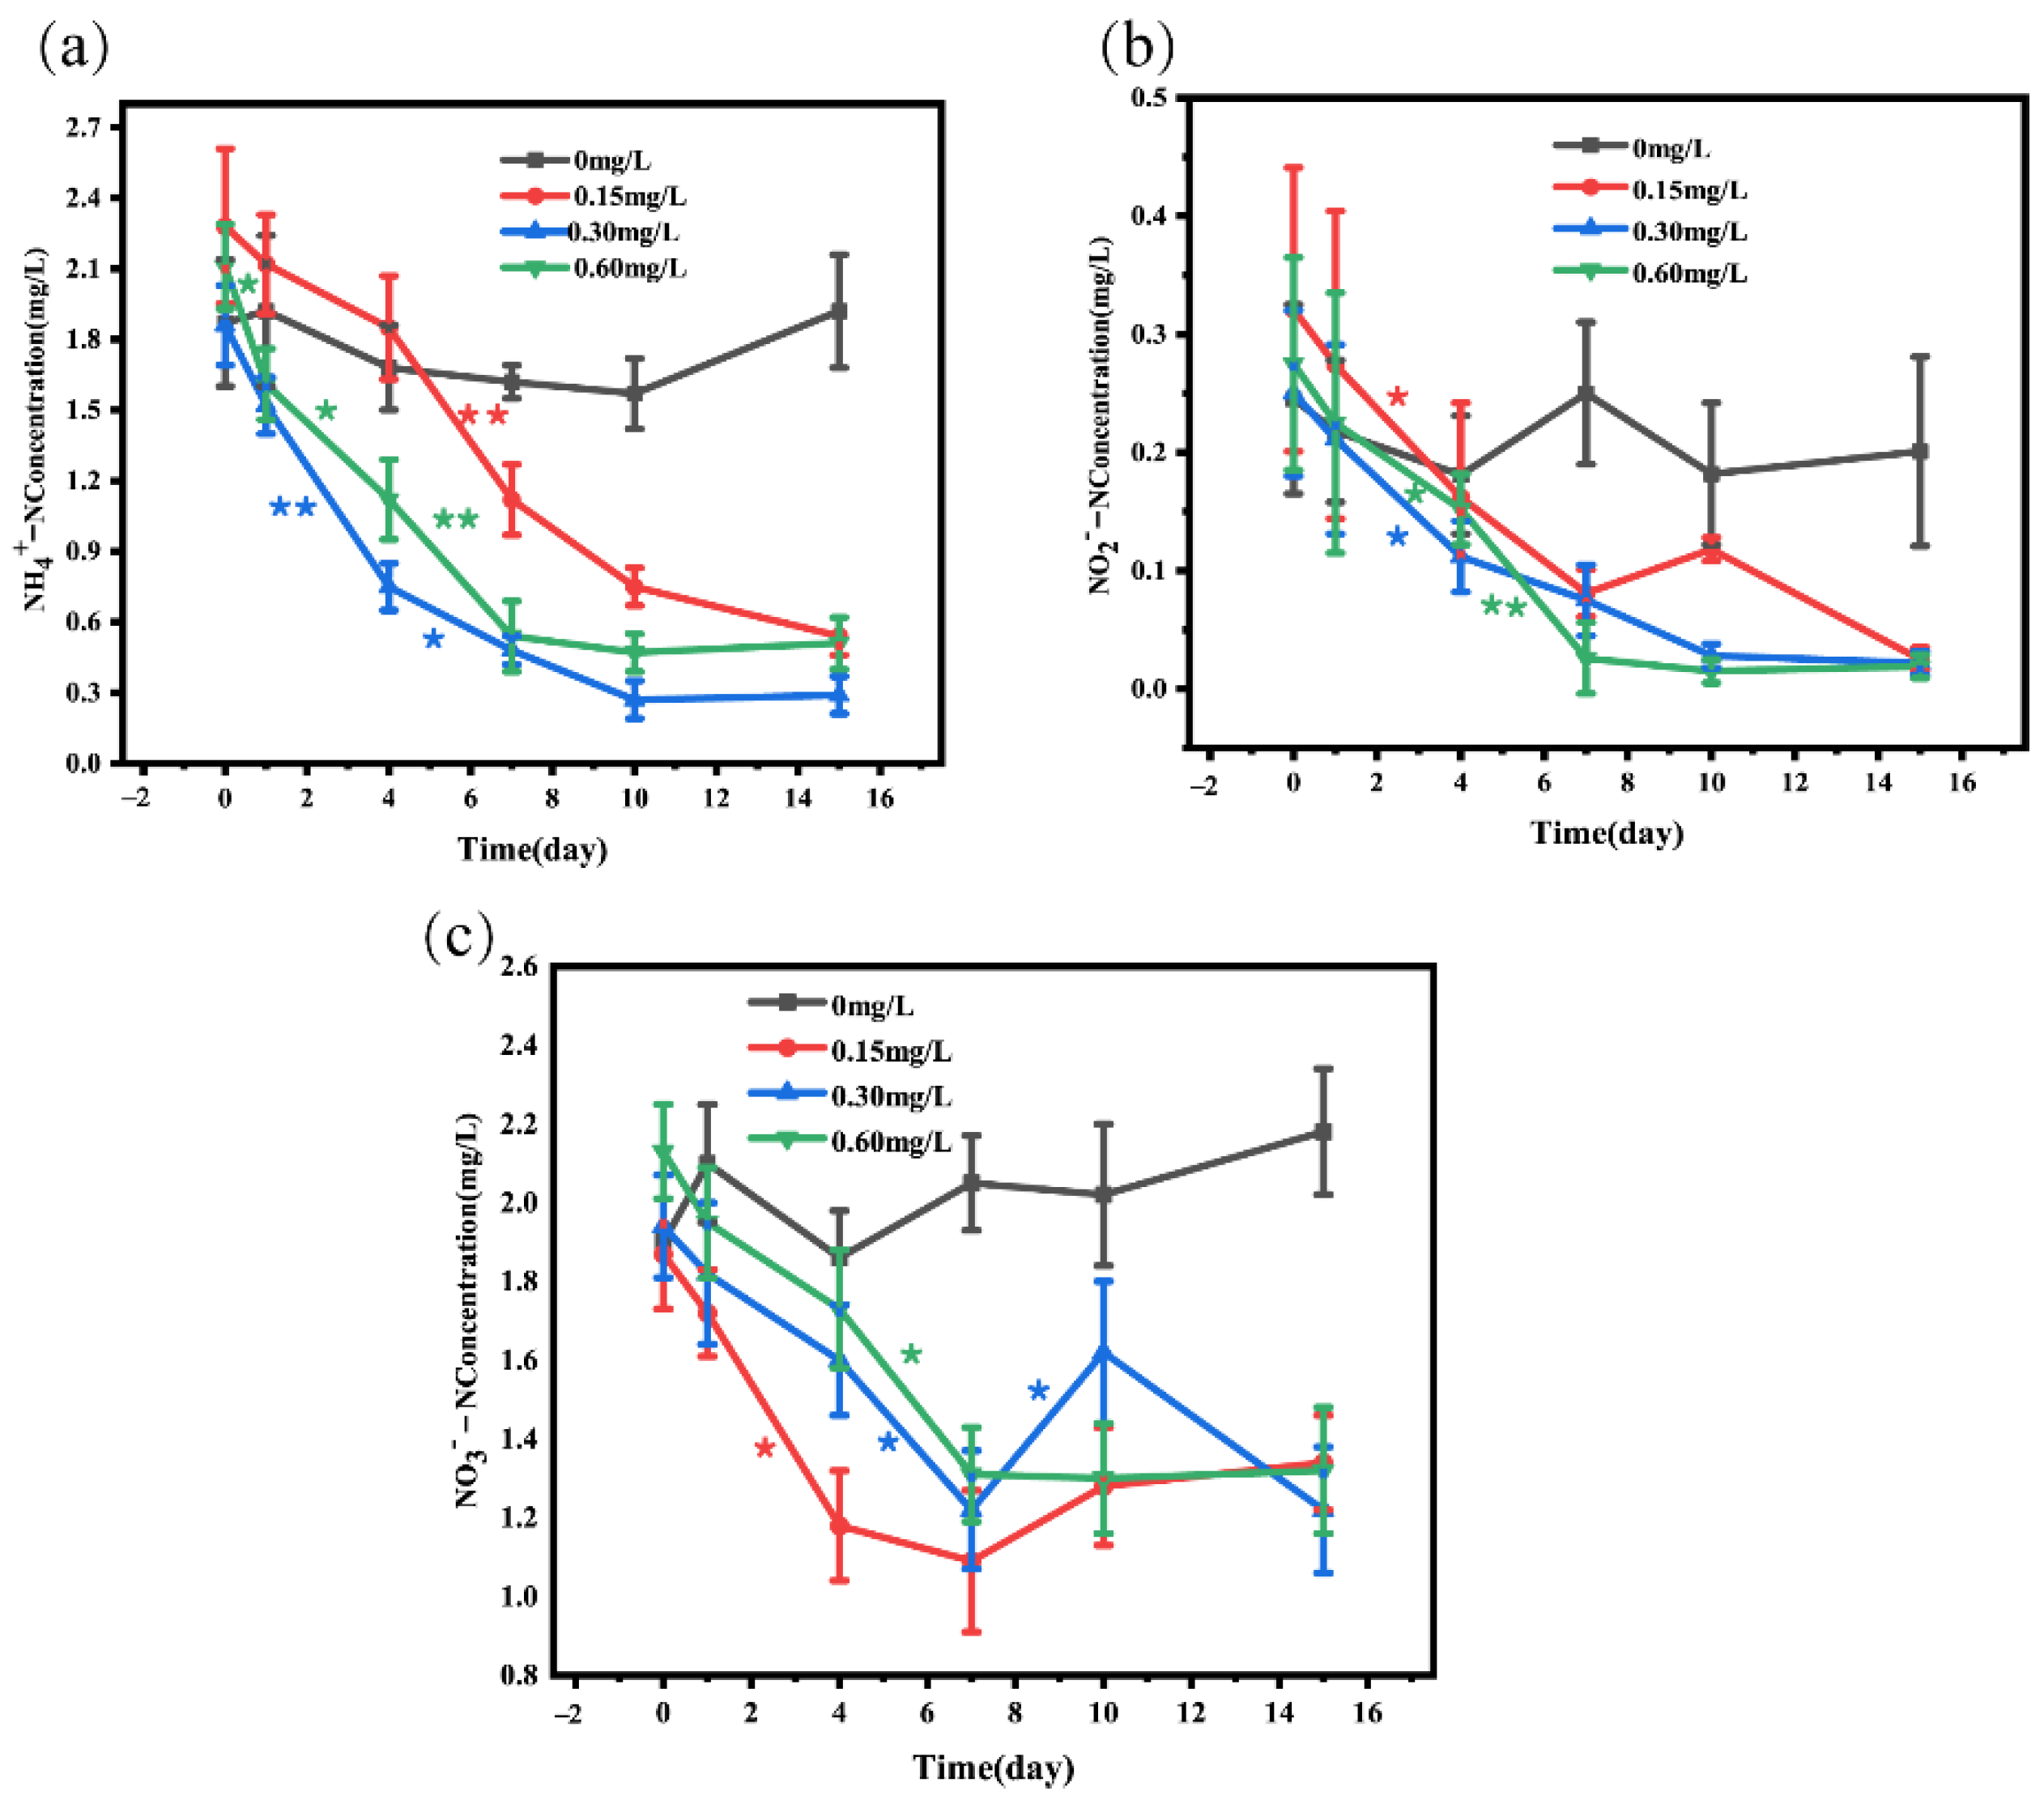
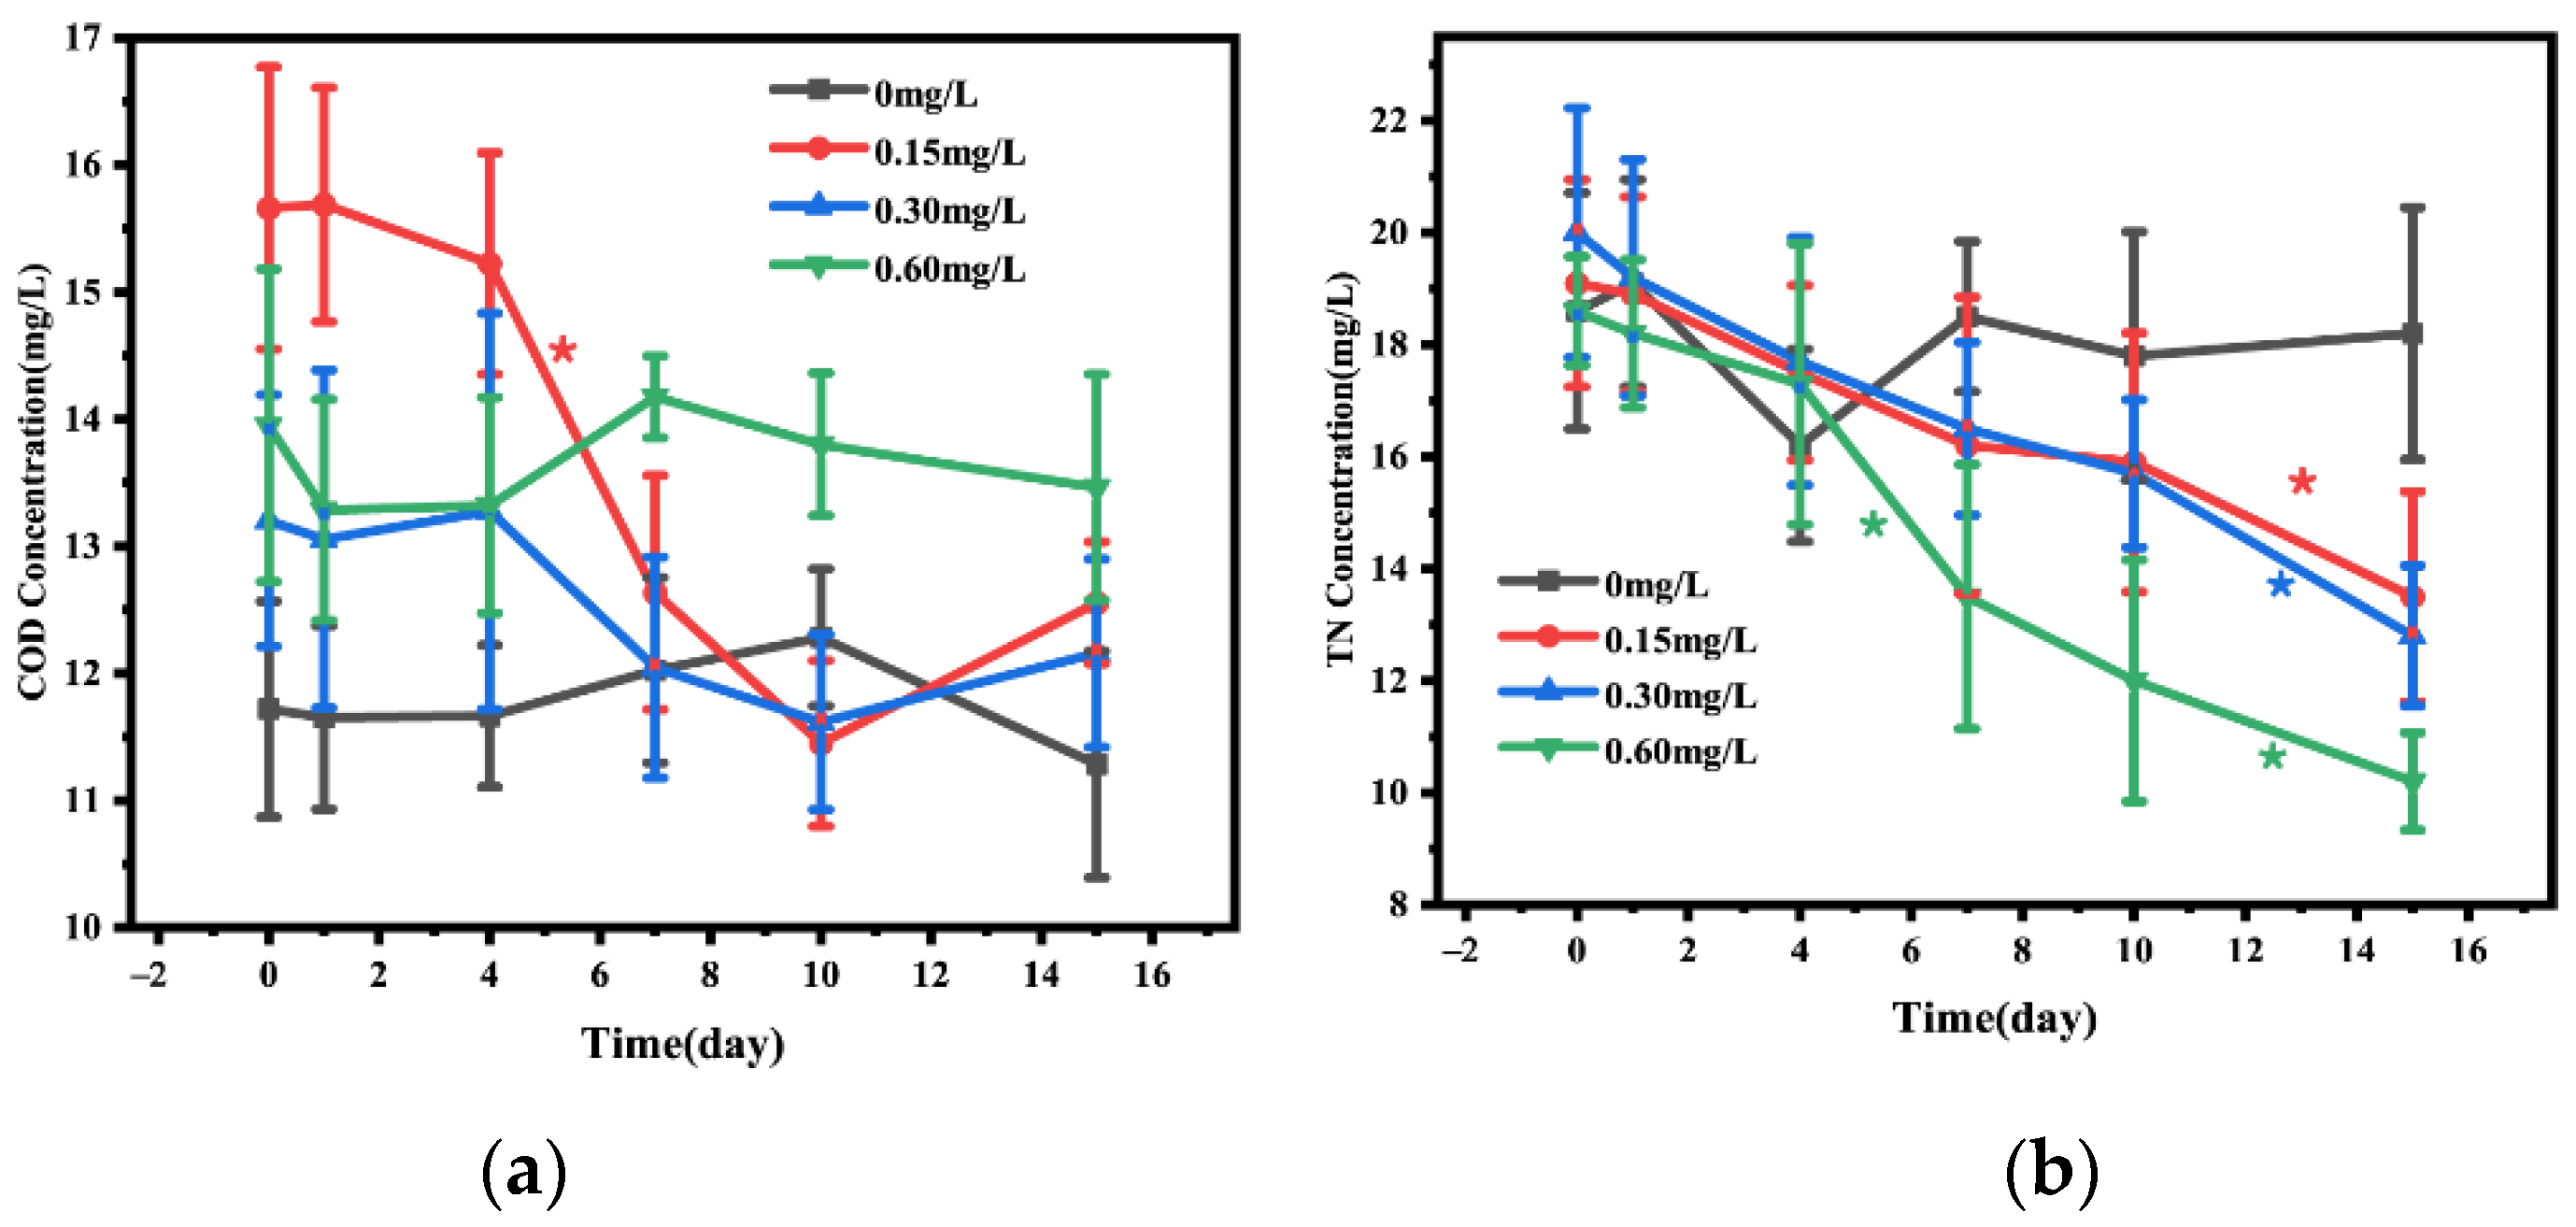
3.1. Changes in Water Quality Index

The data in Figure 2 and Table 1 showed the changes in ammonia nitrogen, nitrite, and nitrate in water before and after adding nitrification and denitrification bacteria. Analysis of NH4+-N showed that compared with the 0 mg/L concentration group, 0.15 (decrease by 76.31%), 0.3 (decrease by 84.40%), and 0.6 mg/L (decrease by 75.83%) bacterial addition groups exhibited a significant decrease in NH4+-N. The decrease in NH4+-N was most significant on day 4 to day 7, and the change in NH4+-N was not significant on day 10 to day 15 (Figure 2a). The analysis of NO2-N showed that 0.15 (decrease by 92.21%), 0.30 (decrease by 91.20%), and 0.60 mg/L (decrease by 93.09%) bacterial addition groups displayed a significant decrease in NO2-N after 15-day treatment, compared with the 0 mg/L concentration group. In addition, NO2-N in 0.15 mg/L concentration group showed an upward trend from day 7 to day 10 (Figure 2b). Our data showed that after 15-day treatment, NO3-N concentration was significantly lower in 0.15 (decrease by 28.34%), 0.3 (decrease by 37.11%), and 0.6 mg/L (decrease by 38.03%) bacterial addition groups than in the 0 mg/L group, and NO3-N concentration in the 0.15 mg/L bacterial addition group displayed an upward trend from day 7 to day 15. In the 0.30 mg/L concentration group, NO3-N had an upward trend from day 7 to day10 and a downward trend from day 10 to day 15 (Figure 2c).
The changes of COD and TN in water before and after adding nitrification and denitrification bacteria were shown in Figure 2. The change in COD in water was not obvious during the first 15 days post the addition of nitrification and denitrification bacteria (Figure 3a). The analysis of TN in water body showed that on day 15, TN was significantly lower in 0.15 (decrease by 36.00%), 0.30 (decrease by 45.16%), and 0.60 mg/L (decrease by 37.11%) concentration groups than in the 0 mg/L concentration group, with a continuous TN decrease during the first 15 days, and the decrease was most significant in the 0.60 mg/L bacterial addition group (Figure 3b).

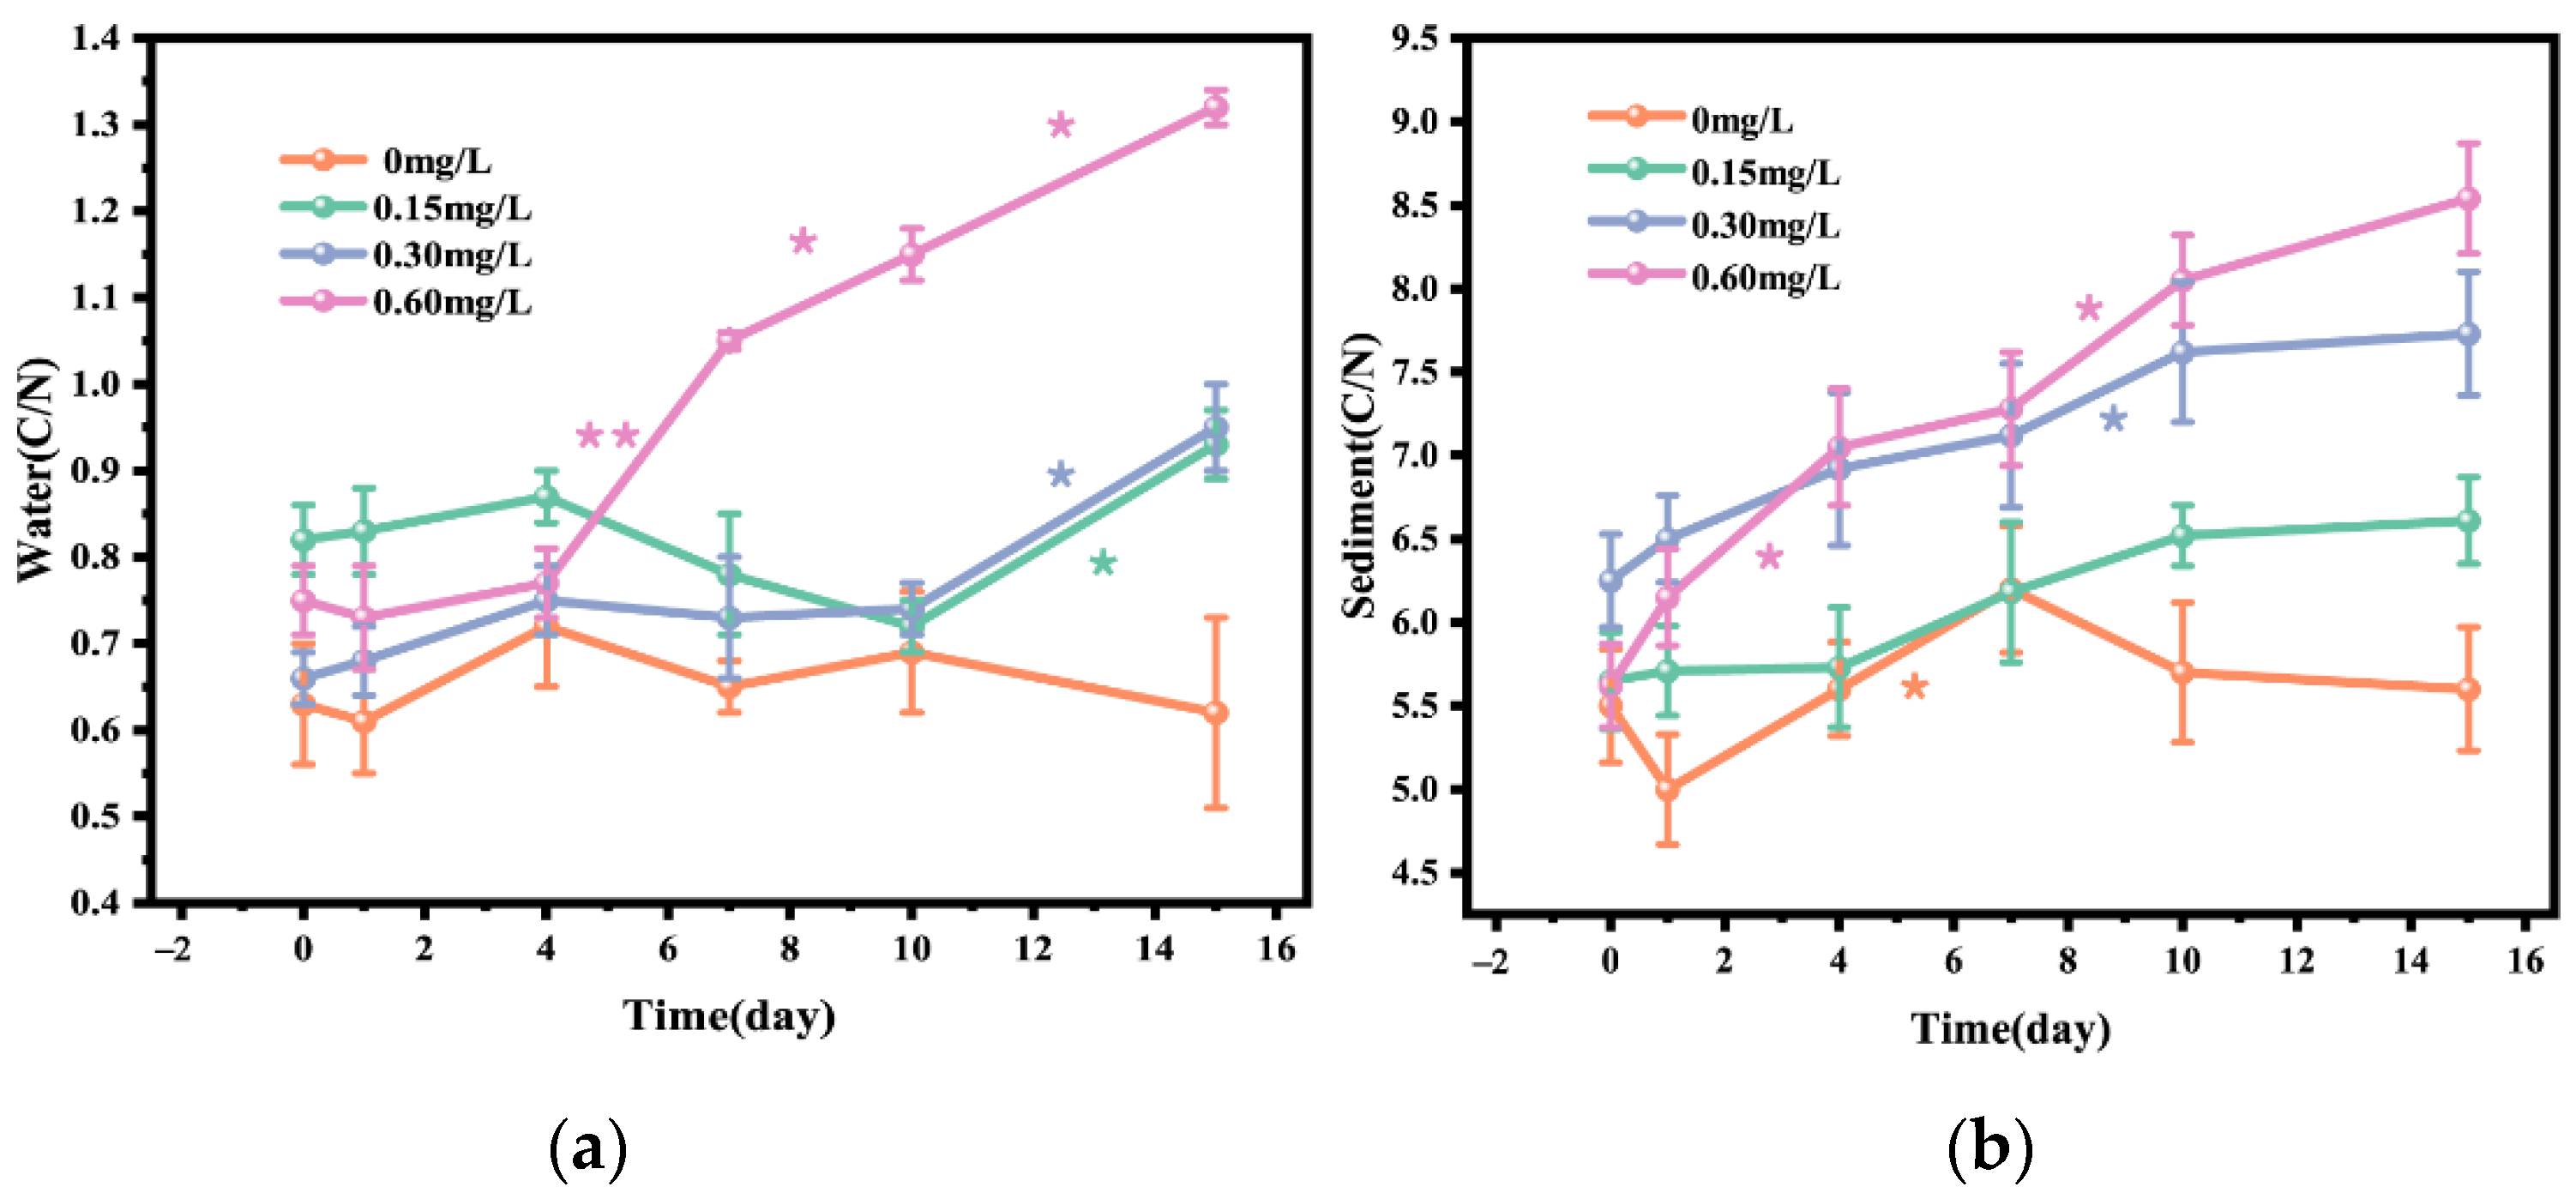
3.2. C/N Ratio in Water and Sediment

Figure 4 showed the changes in C/N ratio in water body and sediment before and after the addition of different concentrations of nitrifying and denitrifying bacteria. On day 15, the C/N ratio in 0.15, 0.30, and 0.60 mg/L concentration groups was significantly increased compared with that in the 0mg concentration group, and the C/N ratio in the 0.15 mg/L concentration group was increased by 13.41%, that in the 0.30 mg/L concentration group was increased by 43.94%, and that in the 0.60 mg/L concentration group was increased by 76.00%. The increase in C/N ratio in water body was most obvious from day 7 to day 15 (Figure 4a). In addition, after 15-day treatment, the sediment C/N ratio in 0.15, 0.30, and 0.60 mg/L bacterial addition groups was significantly increased compared with that in the 0 mg/L concentration group, which was similar to the change pattern of water C/N ratio. The sediment C/N ratio in 0.15, 1.30, and 0.60 mg/L concentration groups was increased by 16.99%, 23.68%, and 51.96%, respectively, and the increase in sediment C/N ratio was obvious from day 4 to day 10. Overall, the change in water C/N ratio was more dramatic than that in sediment C/N ratio (Figure 4b).

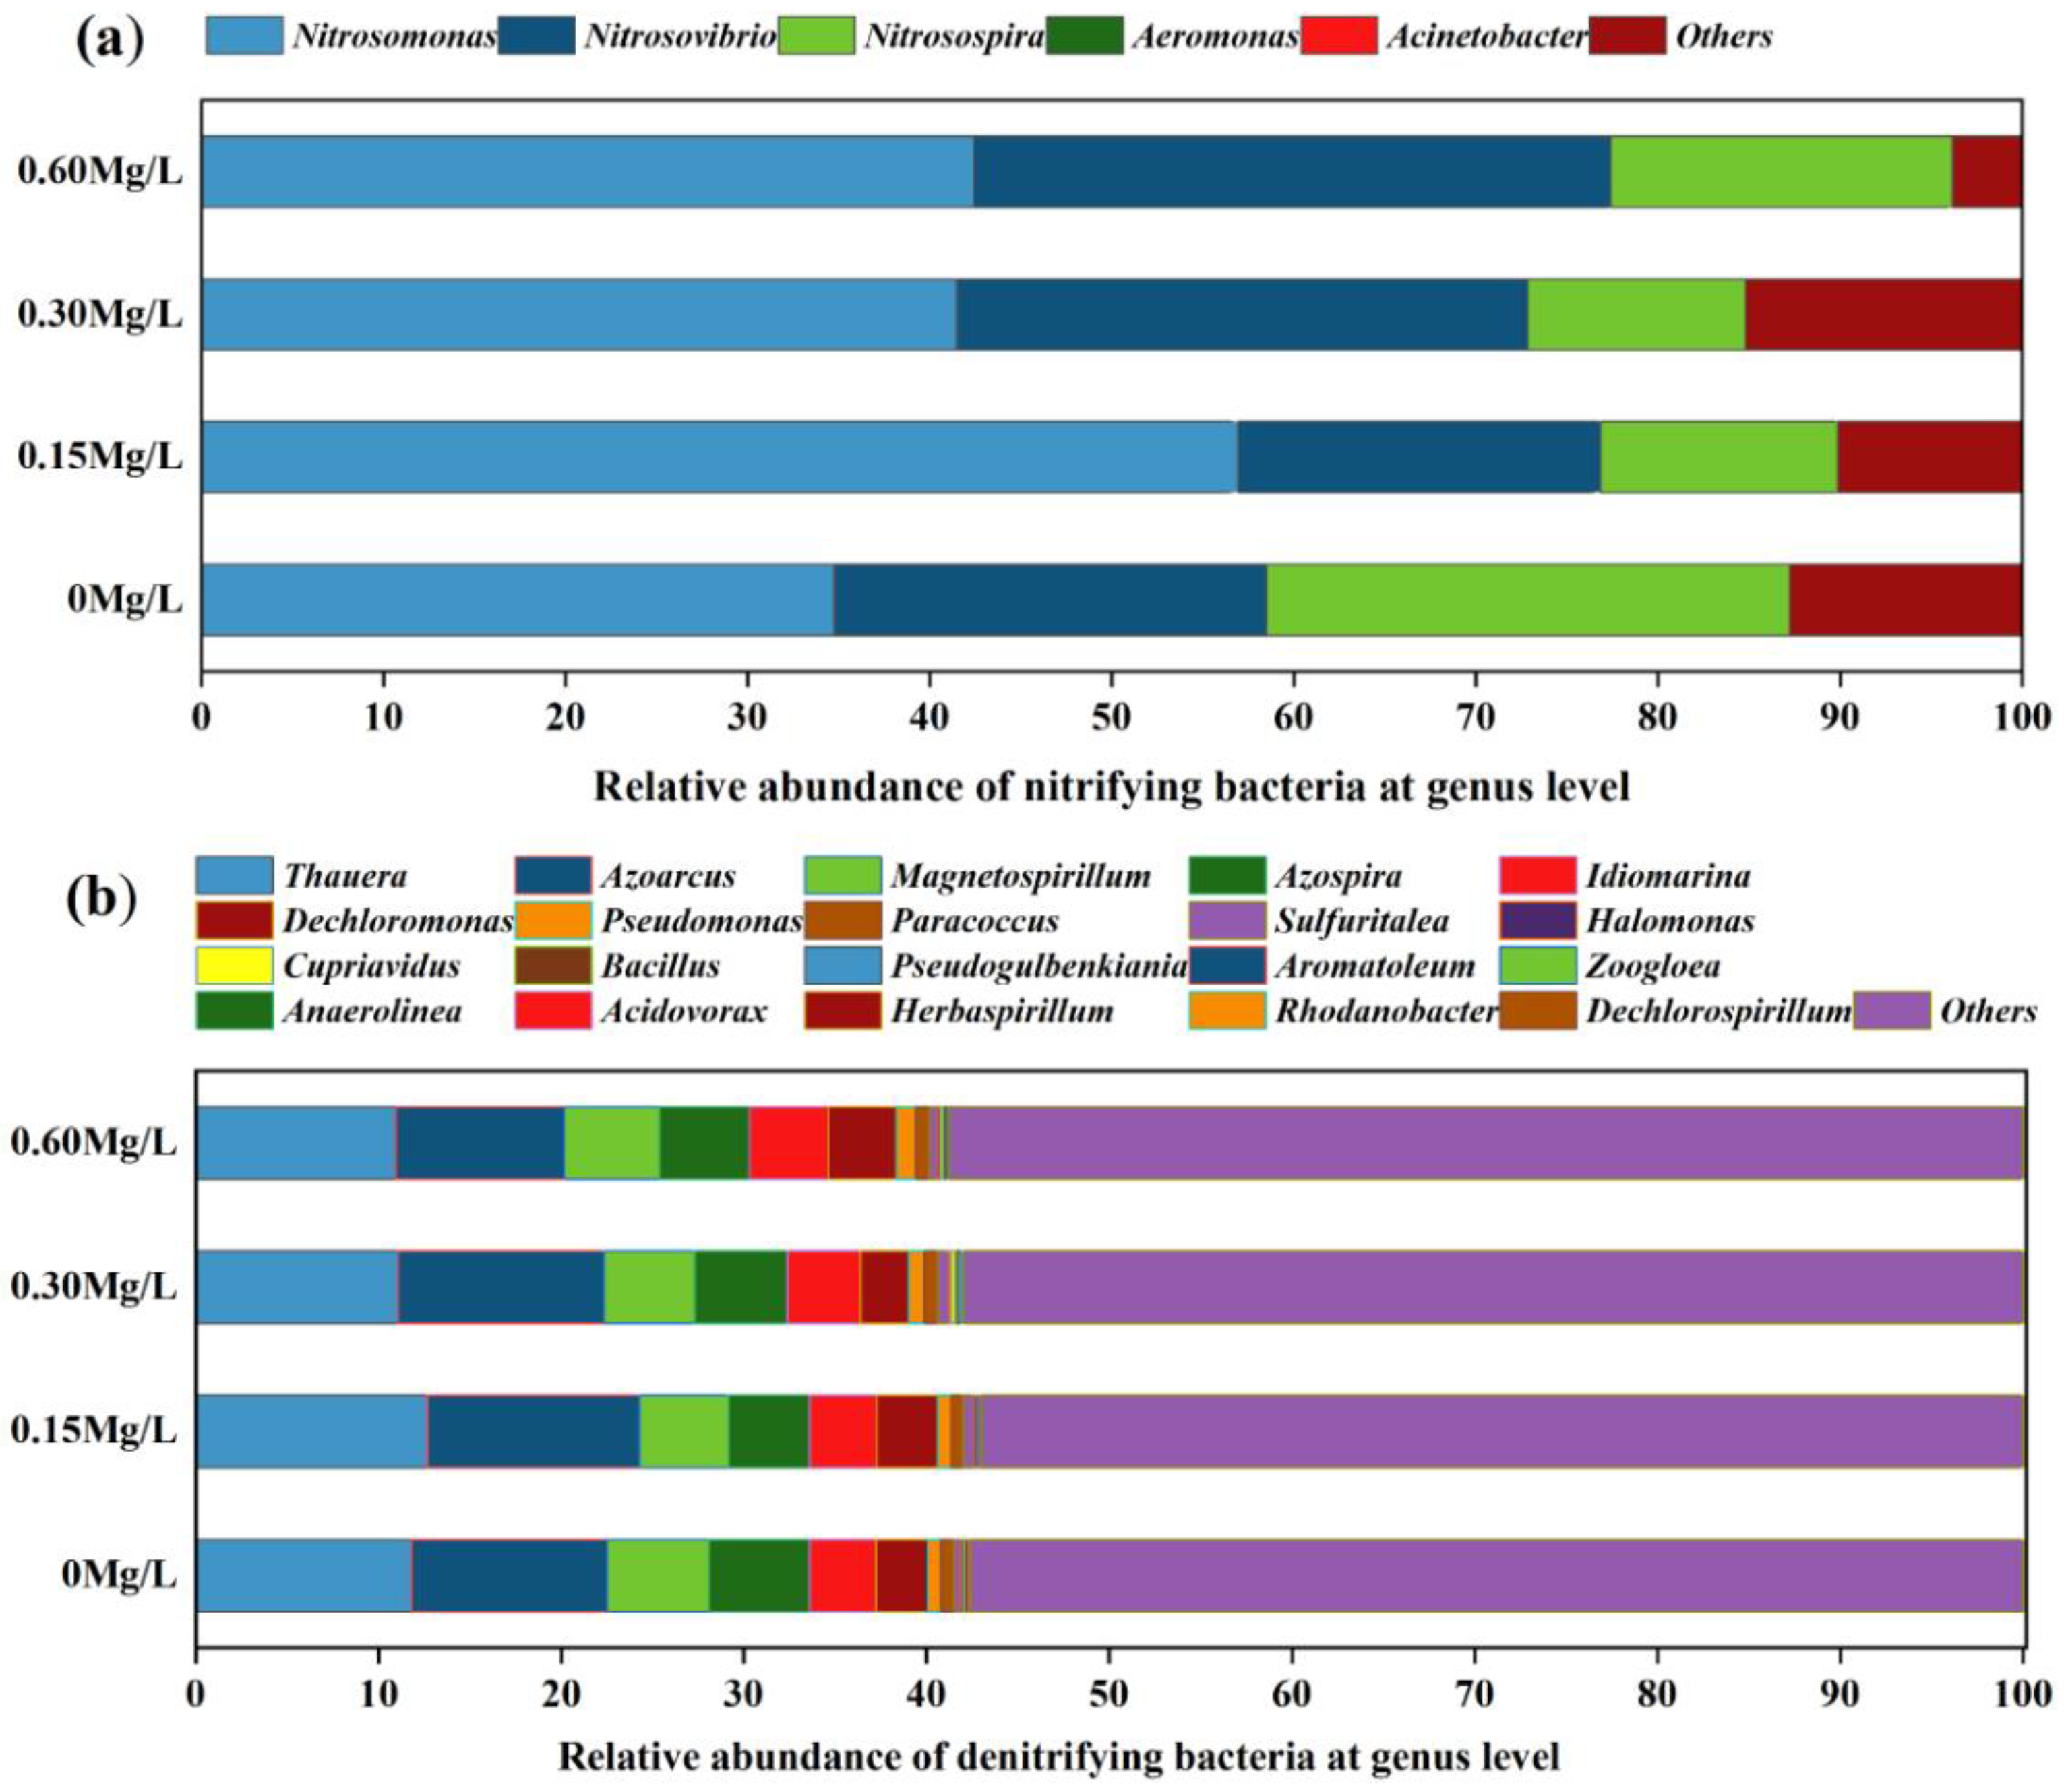
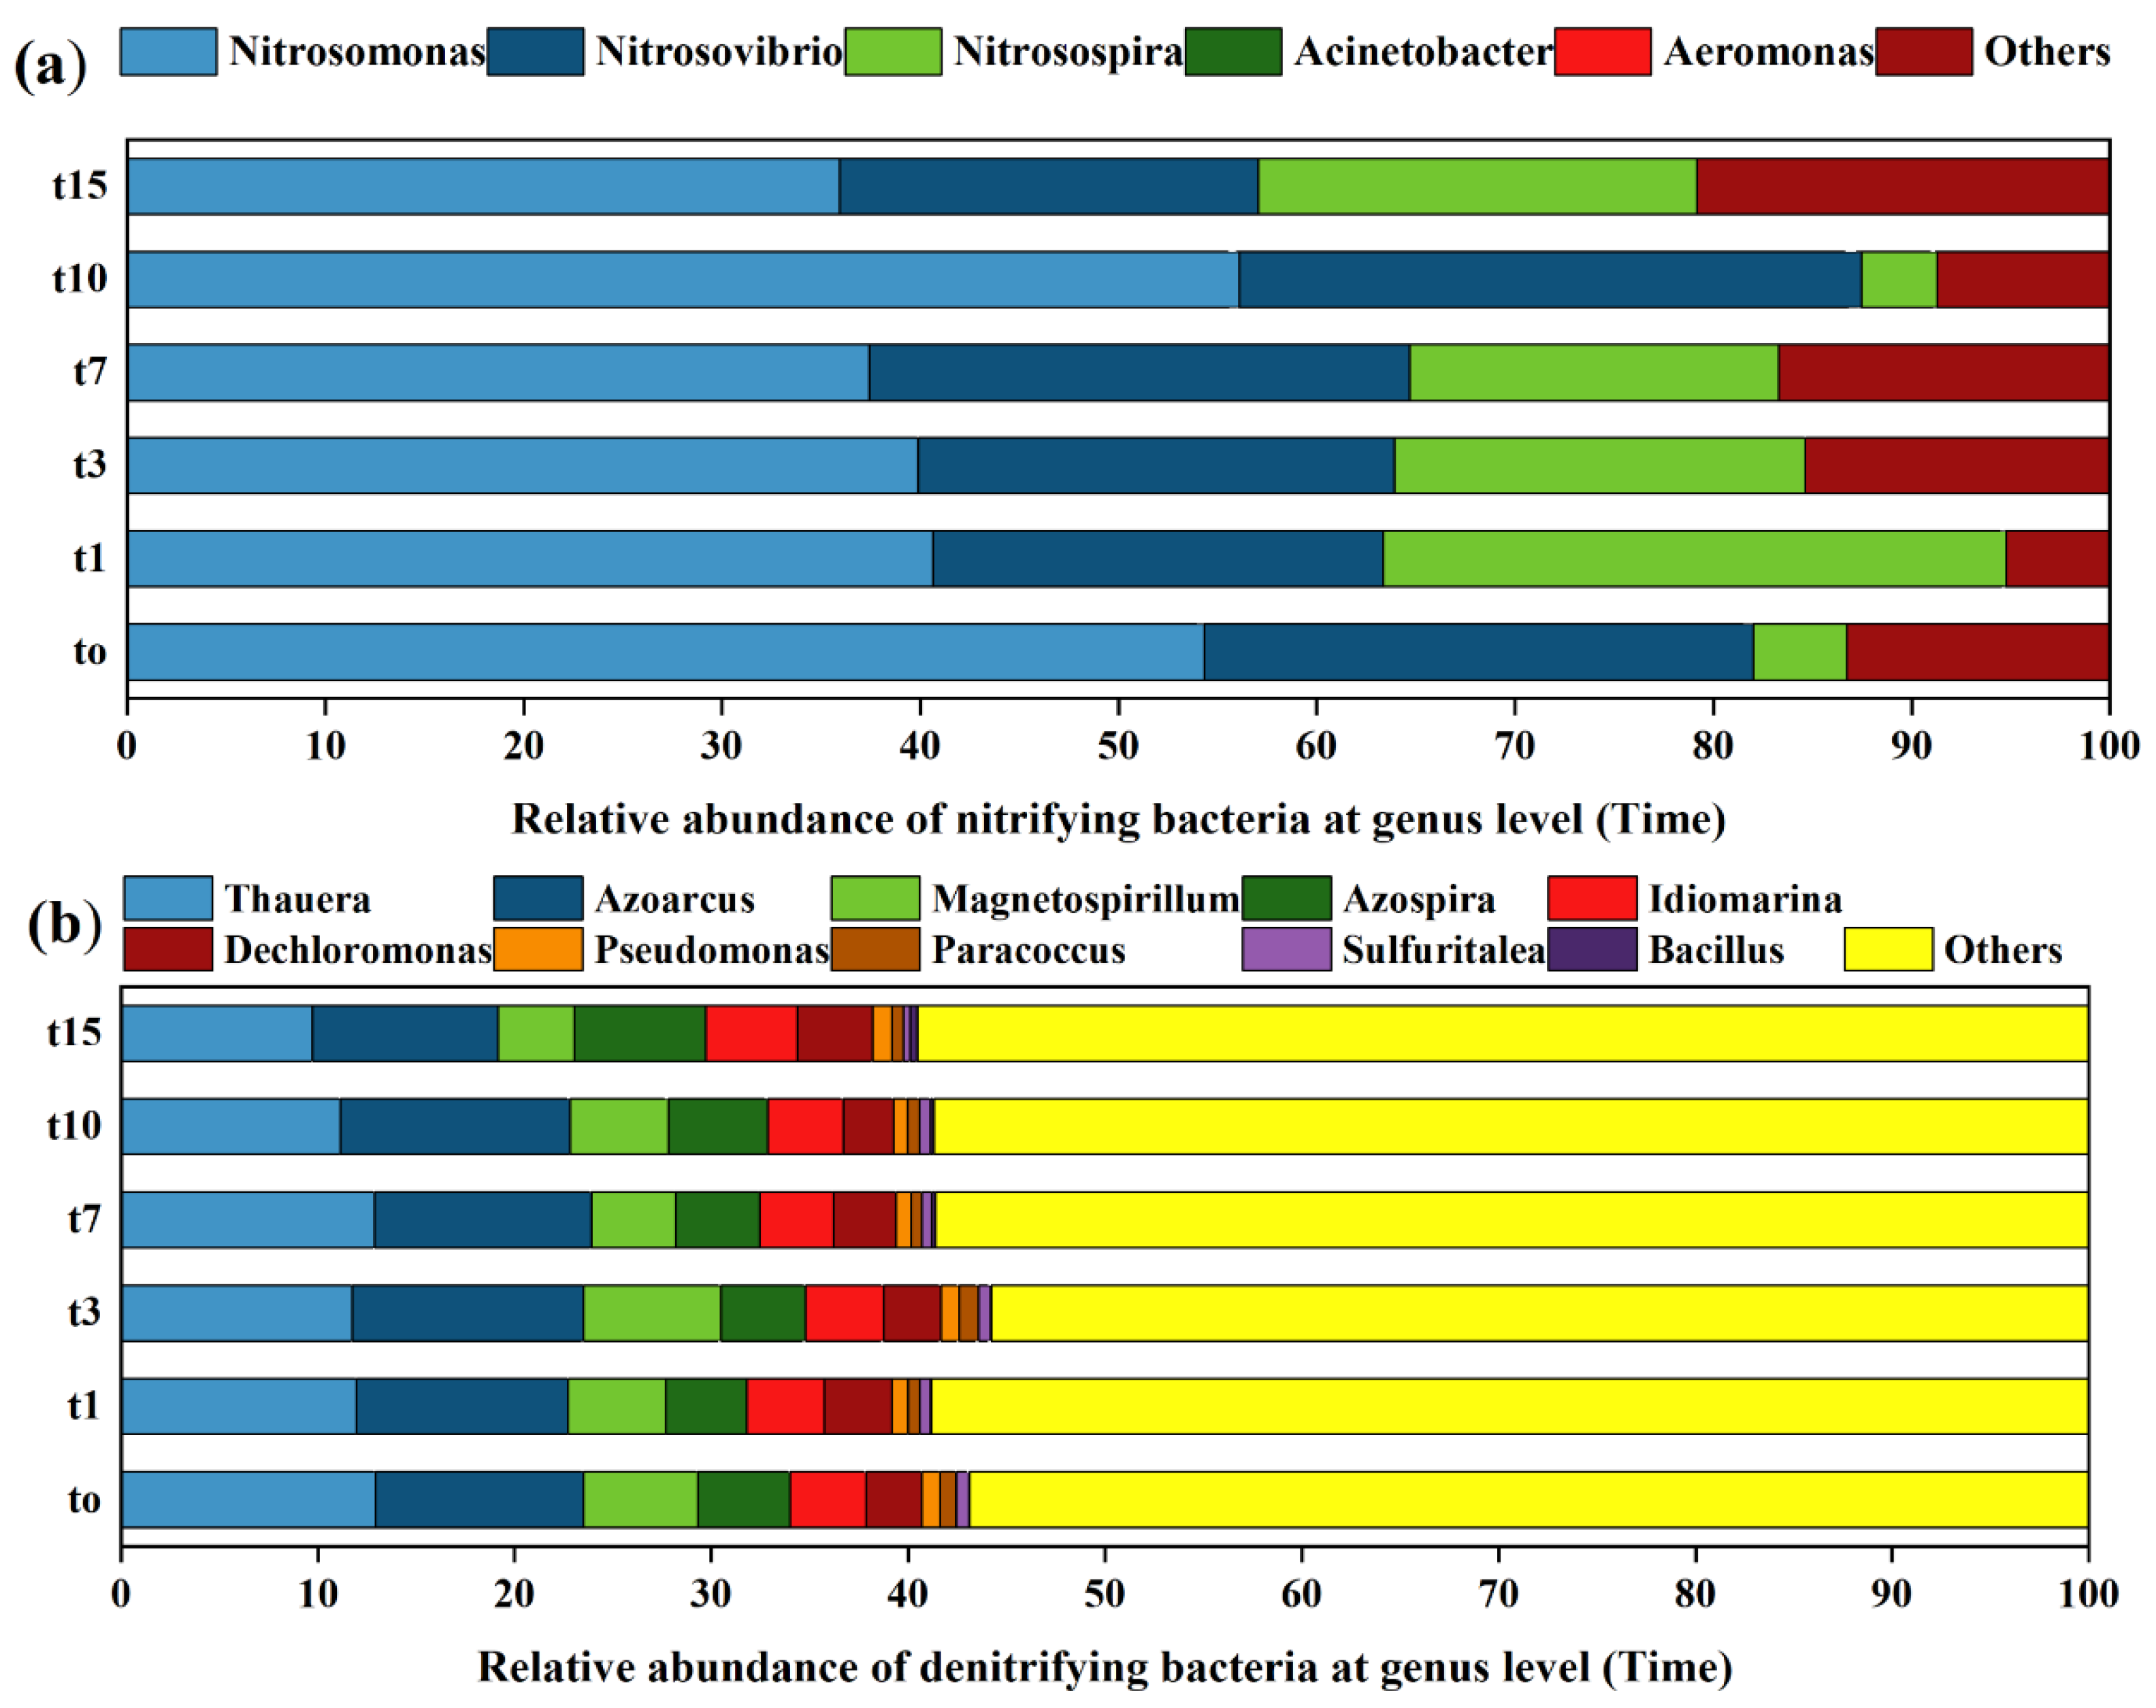
3.3. Species Composition Analysis of Nitrifying and Denitrifying Bacteria

The amplicon sequencing of AmoA-AOB gene and NirS gene in nitrifying and denitrifying bacteria in the sediment was performed. A total of 3,326,896 raw sequences were obtained from the amoA-AOB gene, from which a 43,461 average of high-quality sequences were obtained after denoising processing, with the sequence length ranging from 59 bp to 478 bp. In total, 6,307,519 raw sequences were obtained from the NirS gene by sequencing, from which a 93,769.52 average of high-quality sequences were obtained by denoising processing, with the sequence length ranging from 33 bp to 400 bp. For the amoA-AOB gene, at the phylum level, the dominant nitrifying bacterium in the sediment was Proteobacteria, accounting for 87.09% after the introduction of nitrifying and denitrifying bacteria, (Figure 5a); at the genus level, the dominant species of nitrifying bacteria accounted for a relatively high percentage, but there were differences in dominant species percentage among different bacterial addition concentration groups in spite of similar dominant species composition, and the dominant species were, respectively, Nitrosomonas, Nitrosovibrio, Nitrosospira, and Aeromonas. After the addition of nitrification and denitrification bacteria, the percentage of Nitrosospira was decreased, while the percentages of Nitrosomonas and Nitrosovibrio were increased.
For the nirS gene, at the phylum level, the dominant denitrifying bacterium in sediment was mainly Proteobacteria, accounting for 68.32% after nitrification and denitrifying bacteria were introduced (Figure 5b). At the genus level, the proportion of dominant species of denitrifying bacteria was not high, but the dominant species composition and percentage were similar among different concentration addition groups, and the dominant species were Thauera, Azoarcus, Magnetospirillum, Azospira, and Idiomarina.
According to the collected samples with the time division (Figure 6), the species composition of nitrifying bacteria did not change significantly (at the genus level) before and after the introduction of nitrifying bacteria, but the proportion of dominant species changed significantly (Figure 6a). After 1–7 days of nitrifying bacteria input, the proportion of dominant species Nitrosomonas decreased, while the proportion of dominant species Nitrosopira increased. Lasts for 15 days, the proportion of dominant species Nitrosomonas decreased significantly, while the proportion of dominant species Nitrosopira and Aeromonas increased significantly. The species composition of denitrifying bacteria did not change significantly, and the proportion of dominant species did not change significantly before and after the addition of denitrifying bacteria (Figure 6b).
At the species level, we conducted heat map analysis of the samples (Figure 7). The result found that the dominant signature species of nitrifying and denitrifying bacteria changed significantly after the addition of nitrifying and denitrifying bacteria compared with the 0 mg/L concentration group. In the 0 mg/L concentration group, the dominant landmark species of nitrifying bacteria were Nitrosovibrio sp. ry3c, Nitrosomonas sp., Nitrosospira sp. iii7, Nitrosospira sp. 40ki, Nitrosospira sp. Nsp17, Nitrosospira briensis, and Azospira sp. AR13, Thermus and Thermophilus were the dominant landmark species of denitrifying bacteria. In the 0.15 mg/L concentration group, the dominant landmark species of nitrifying bacteria was Nitrosospira sp. TCH711, and the dominant landmark species of denitrifying bacteria was Acidovorax sp. AR23. In the 0.30 mg/L group, the dominant landmark species of nitrifying bacteria were Nitrosospira sp. NP39-19, Nitrosomonas halophila, and Nitrosospira sp. nSP40; the dominant landmark species of denitrifying bacteria was Zoogloea sp.AR30. In the 0.60 mg/L concentration group, the dominant landmark species of nitrifying bacteria were Nitrosospira sp. pJA1, Nitrosomonas nitrosa, Nitrosospira sp. wyke2, Nitrosospira sp. nv6, Nitrosospira sp. Nsp12, Nitrosomonas oligotropha, Nitrosospira multiformis, and Nitrosospira sp. Nsp2; the dominant landmark species of denitrifying bacteria was Pseudomonas sp. JV525. Through species composition analysis and combined heat map analysis, we found that there was no significant change in species composition of nitrifying and denitrifying bacteria at the genus level, but a significant change between groups with different concentrations at the species level was noted. With the addition of nitrifying and denitrifying bacteria, the dominant signature species play a key role in sediment purification.

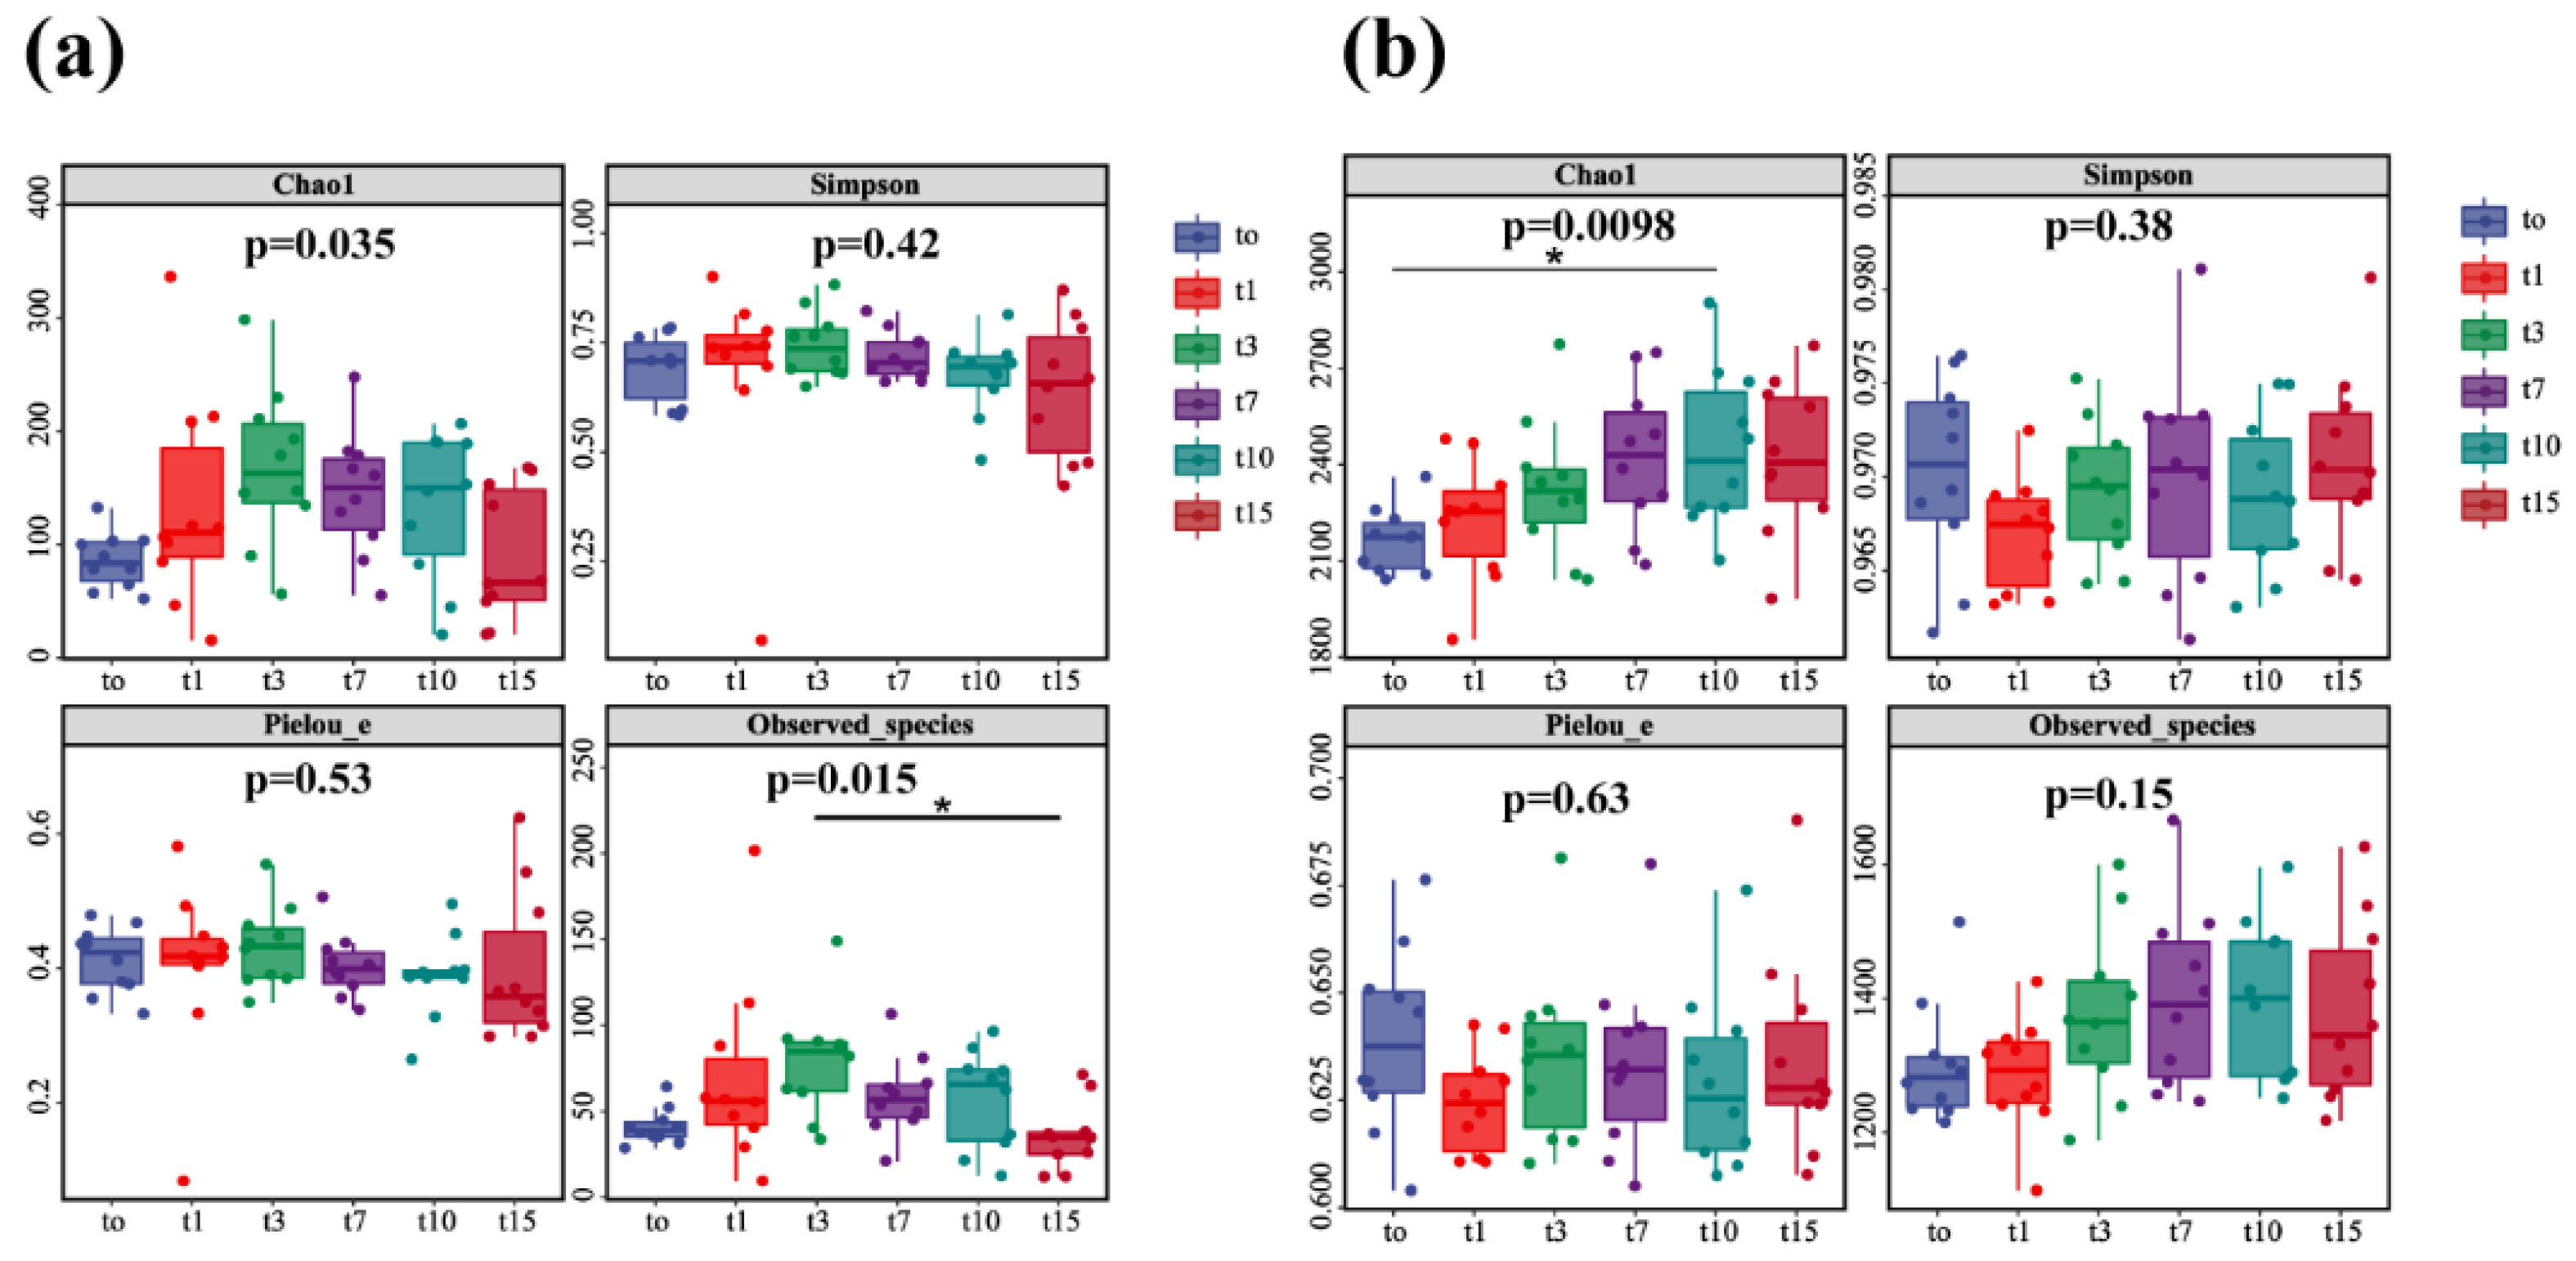
3.4. Diversity Analysis of Nitrifying and Denitrifying Bacteria

In this study, the observed species index and Chao1 index were used to analyze the diversity of nitrifying and denitrifying bacteria. The results showed that the diversity of nitrifying and denitrifying bacteria showed an obvious initial upward and then downward trend over the 15-day treatment (p < 0.05). The species diversity of nitrifying bacteria was increased (days 0–3), remained stable (days 7–10), and decreased (days 10–15) (Figure 8a). The species diversity of nitrifying bacteria on day 15 was similar to that on day 0. Consistently, the species diversity of denitrifying bacteria was increased (days 0–7), remained stable (days 7–10), and decreased (days 10–15) (Figure 8b). However, the species diversity of denitrifying bacteria on day 15 was higher than that at day 0. The analyses of Simpson index and Pielou_e index showed that the species evenness and relative abundance of nitrifying and denitrifying bacteria were not significantly changed over 15 days, indicating their species stability.

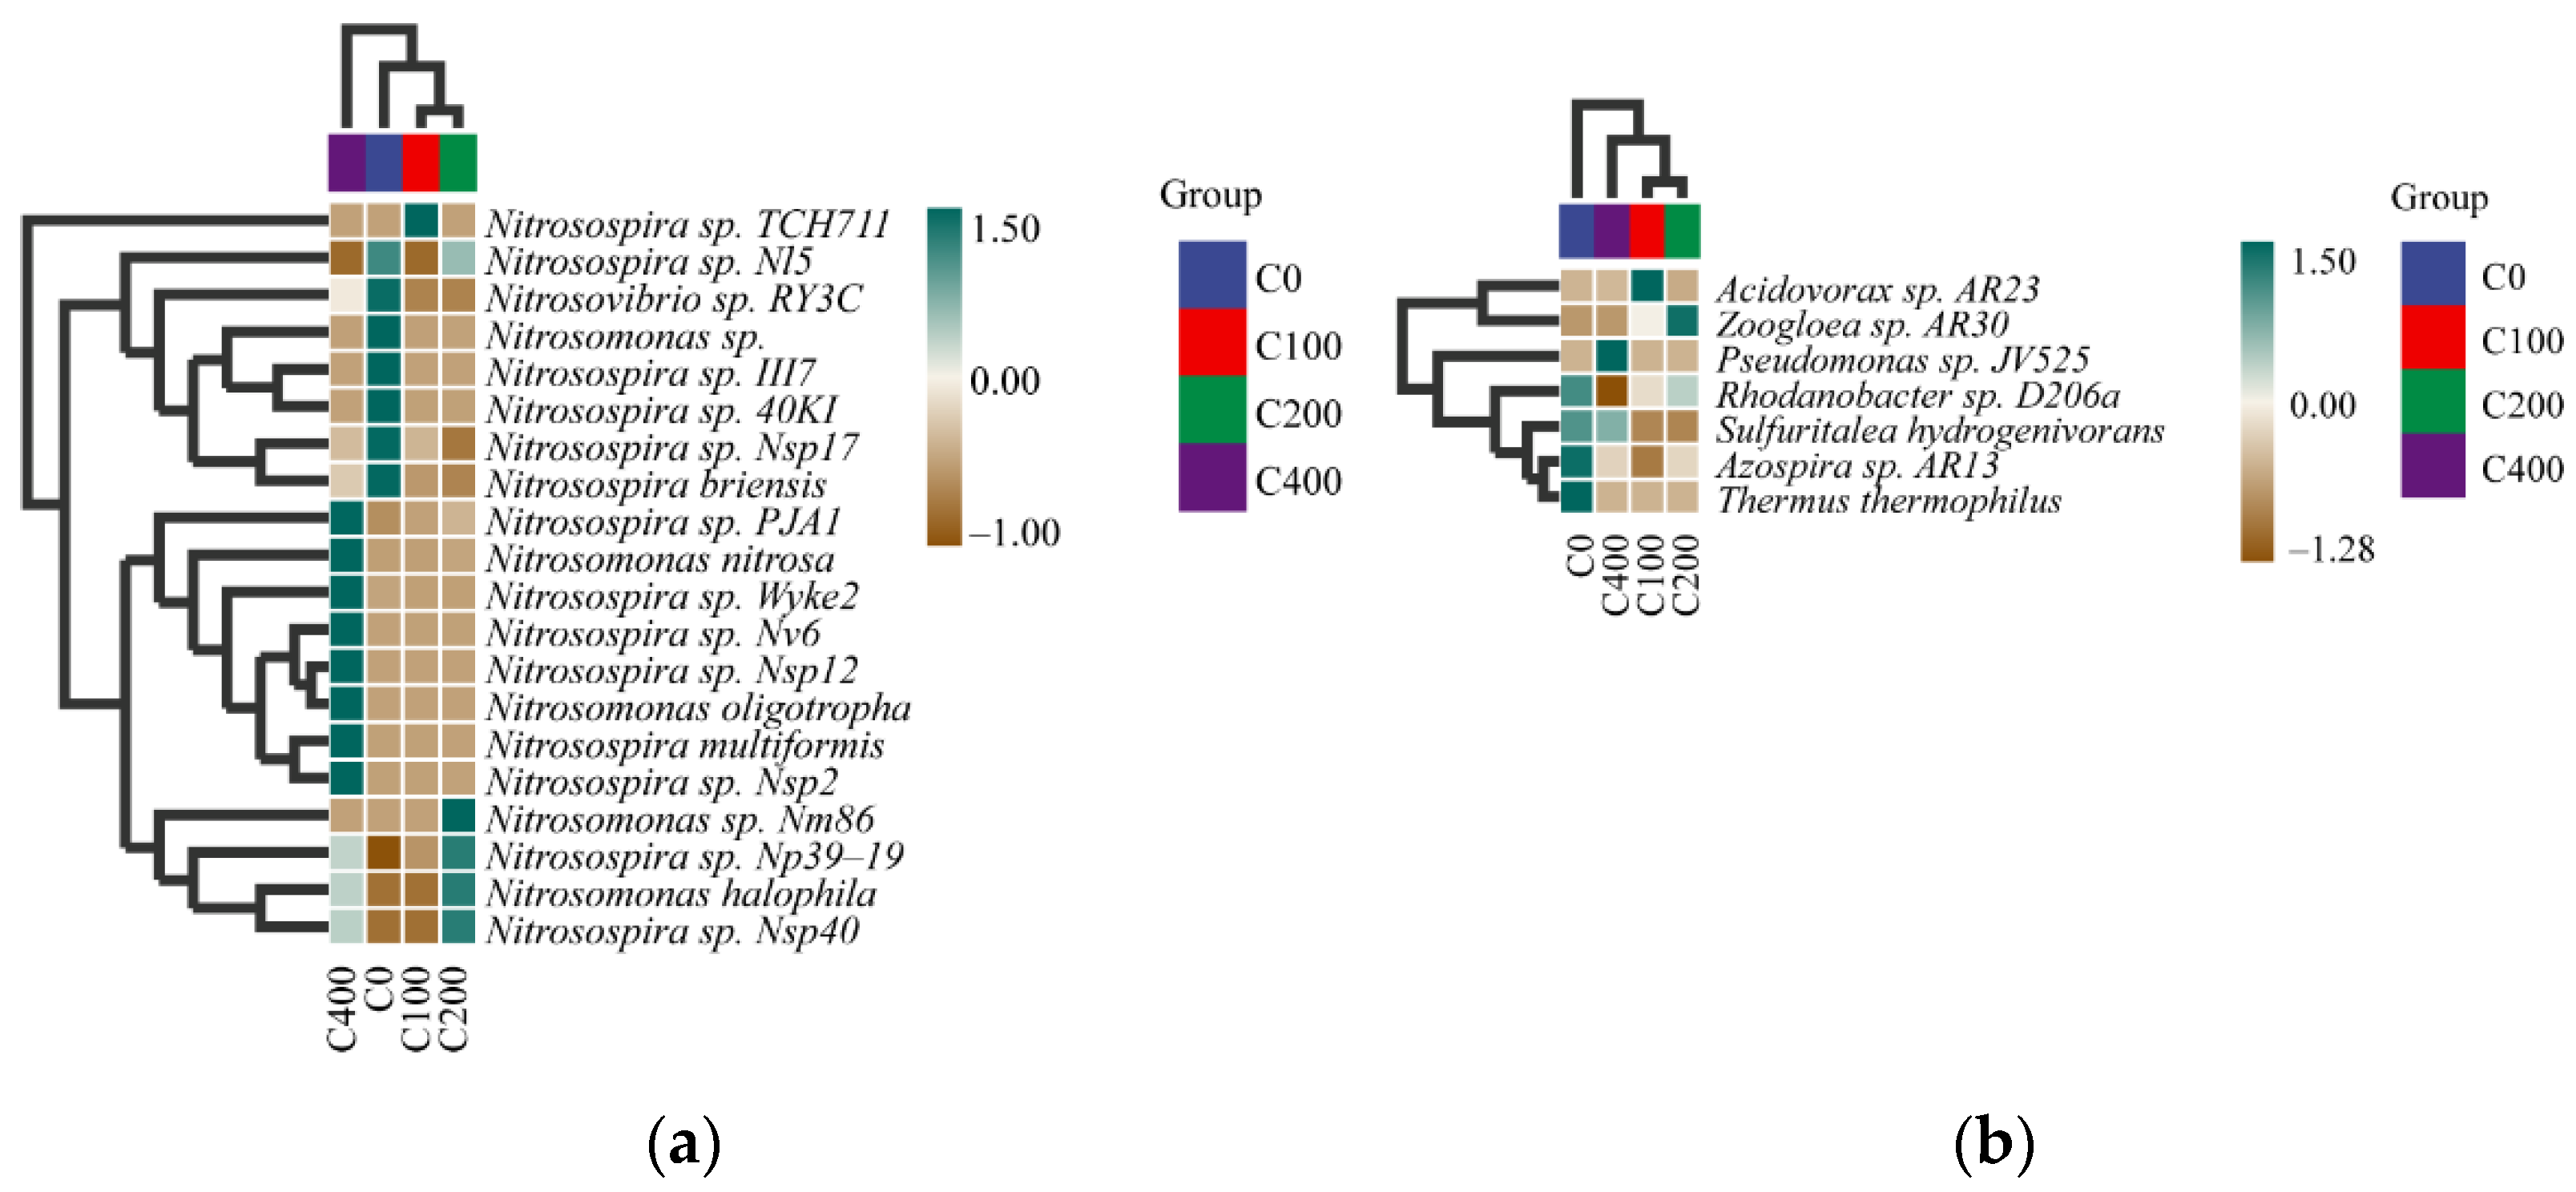
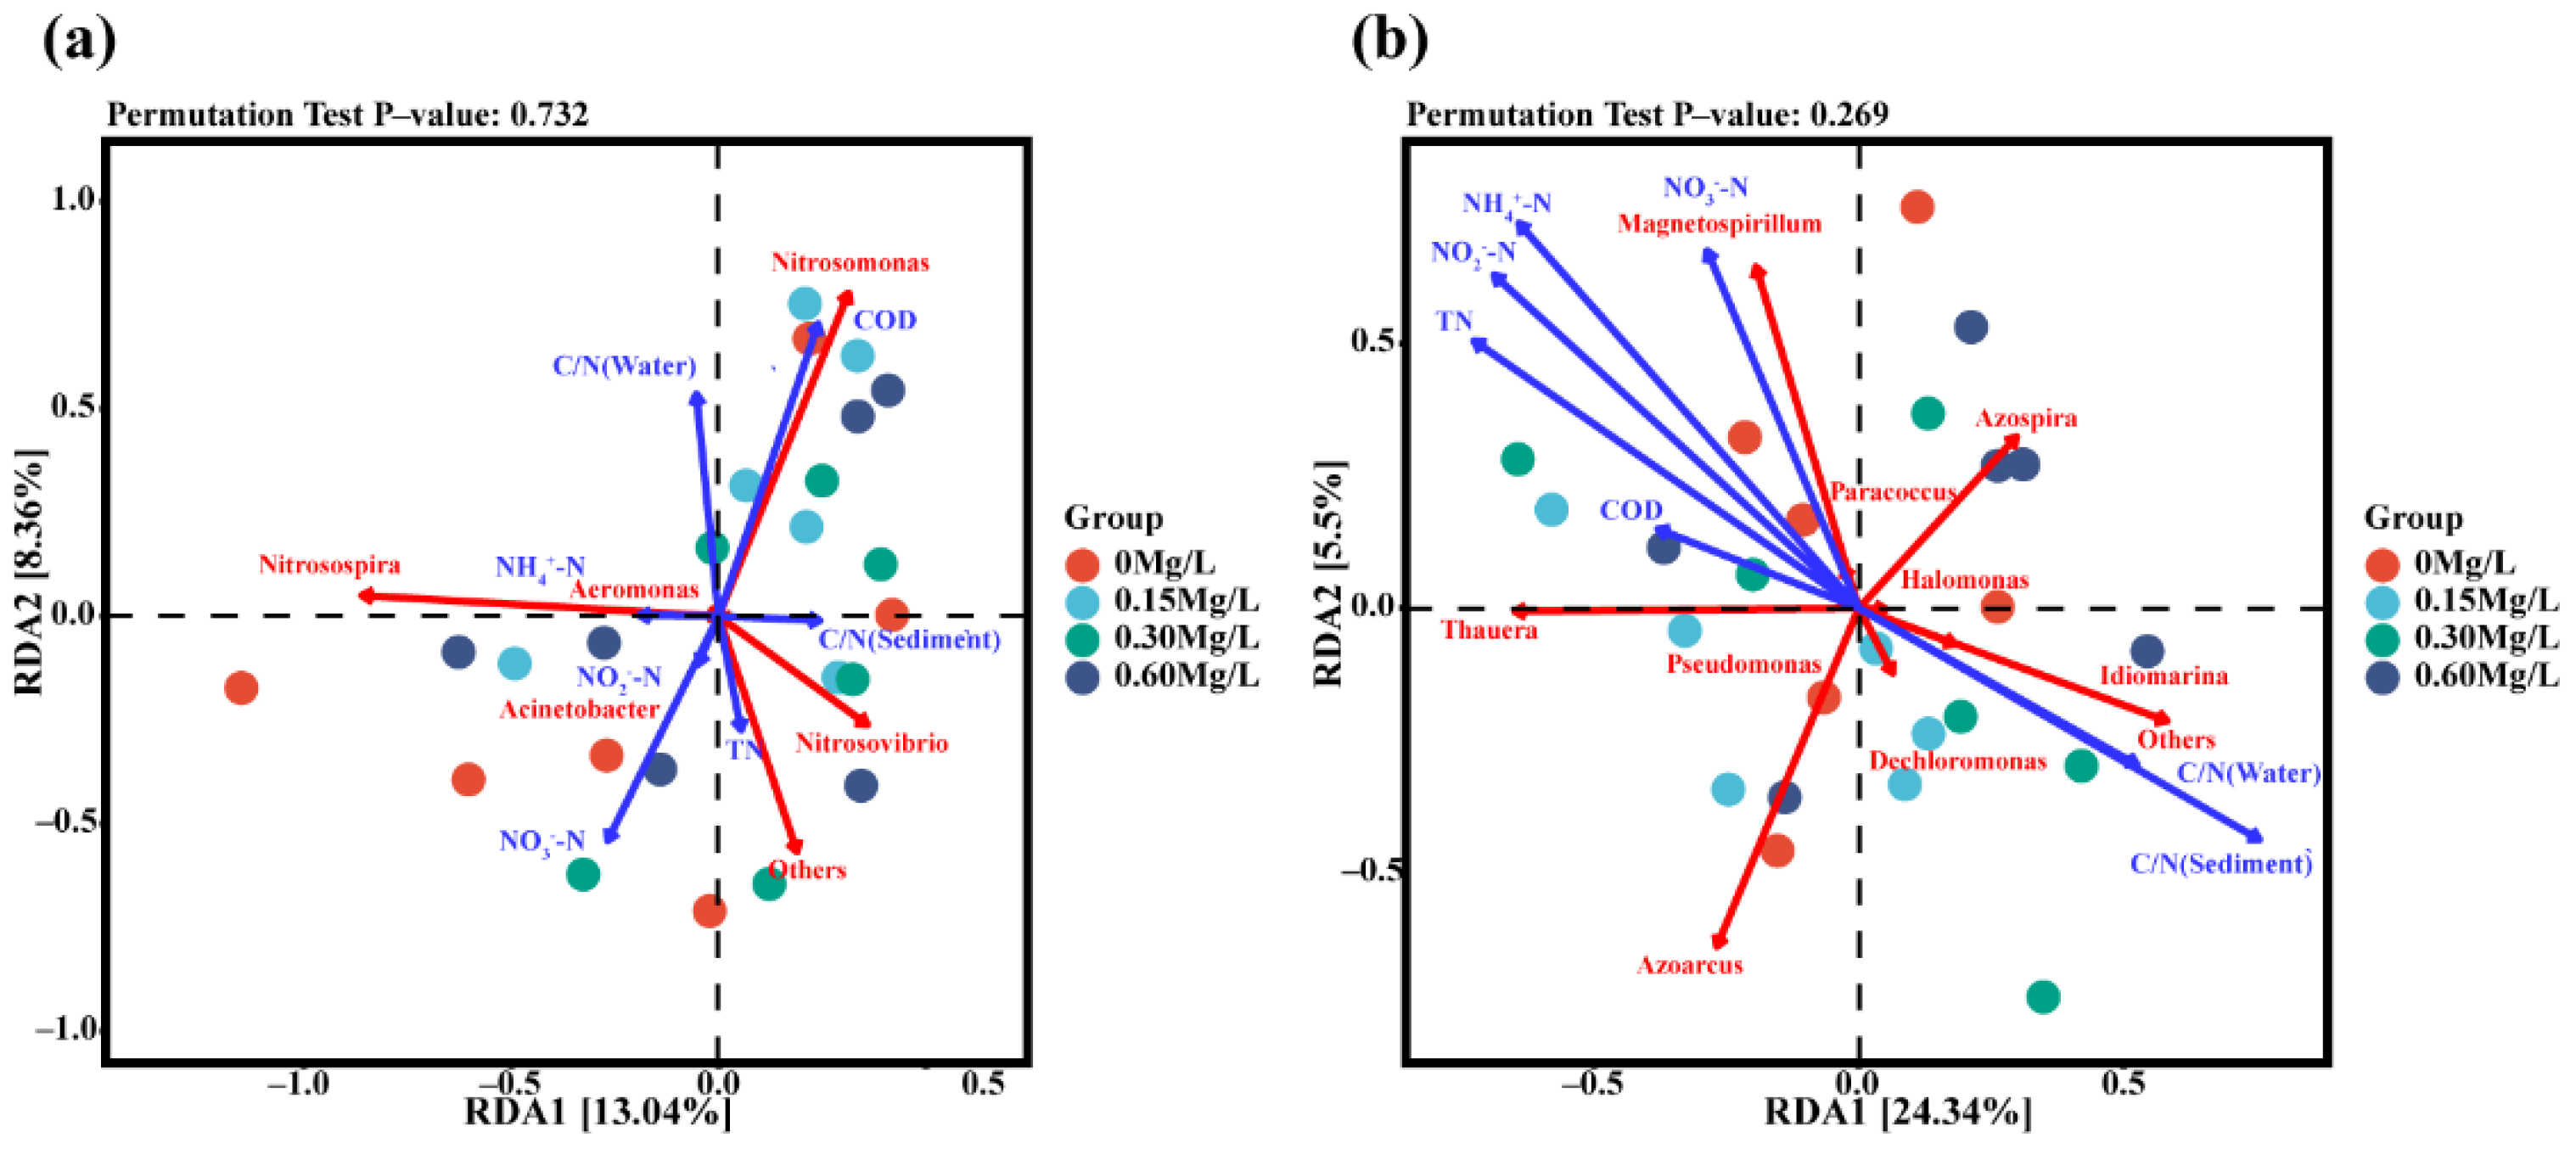
3.5. Environmental and Microbial Redundancy Analysis (RDA)

Redundancy analysis (RDA) of environmental factors, amoA-AOB gene, and NirS gene was performed (Figure 9). Correlation analysis was conducted among environmental factors (Figure 9a). The results showed that COD was positively correlated with water C/N ratio and that COD was negatively correlated with NH4+-N, NO3-N, NO2-N, and TN (Figure 9a). The combined analyses of environmental factors and microorganisms showed that there was a certain correlation between nitrifying bacteria and environmental factors. Strong correlation was observed between nitrifying bacteria and NO3-N, COD, or water C/N ratio, and the strongest correlation existed between nitrifying bacteria and NO3-N. At the genus level, Nitrosomonas, Nitrosospira, and Nitrosovibrio exhibited strong correlation with environmental factors, of which Nitrosomonas had significantly positive correlation with COD and water C/N ratio; Nitrosospira had significantly positive correlation with NH4+-N; and Nitrosovibrio was positively correlated with C/N ratio and TN in sediment.
The results showed that there was a strong positive correlation between water C/N ratio and sediment C/N ratio, and there was a strong positive correlation among NH4+-N, NO3-N, NO2-N, TN, and COD (Figure 9b). There was a significantly negative correlation between C/N ratio and NH4+-N, NO3-N, NO2-N, TN, or COD in sediment (Figure 9b). The combined analyses of environmental factors and microbes showed that there was a significant correlation between denitrifying bacteria and environmental factors. Denitrifying bacteria had a strong correlation with NH4+-N, NO3-N, NO2-N, TN, COD, water C/N, and sediment C/N. Thauera, Azoarcus, Magnetospirillum, and Azospirillum exhibited a strong correlation with environmental factors. Specifically, Thauera and Magnetospirillum were positively correlated with NH4+-N, NO3-N, NO2-N, TN, and COD. Azoarcus and Azospira were obviously negatively correlated with NH4+-N, NO3-N, NO2-N, TN, and COD.

4. Discussion

Pond nitrogen load is growing due to a large amount of feed input in aquaculture, and nitrification and denitrification can effectively control the form of nitrogen to reduce the harm caused by aquaculture. After different concentrations of nitrifying and denitrifying bacteria were added into pond water, the concentrations of ammonia nitrogen, nitrite, nitrate, and total nitrogen were significantly decreased on day 15 in pond water, but COD exhibited no obvious change. Nitrification is dominated by ammonia-oxidizing bacteria (AOB) in pond water and surface sediments, and ammonia-oxidizing archaea (AOA) generally grows in deep sediments [37,38,39]. Autotrophic nitrifying bacteria AOB can produce energy by oxidizing ammonia oxygen to nitrate. However, its nitrification requires energy that heterotrophic nitrifying bacteria oxidize ammonia oxygen to nitrate. [40]. Heterotrophic nitrifiers oxidize the organic substrates in a co-metabolism reaction, comprising the co-oxidation of either ammonia or reduced nitrogen from organic compounds, resulting in the formation of nitrite [41]. However, autotrophy AOB nitrification does not need to consume carbon sources [42], which might be the main reason why there was no significant change in COD after addition of nitrifying and denitrifying bacteria in our study.
Our analyses of purification effects of nitrifying and denitrifying bacteria on ammonia nitrogen, nitrite, and nitrate showed that NO2-N in the 0.15 mg/L group had an upward trend over days 7–10 (Figure 2b); NO3-N in the 0.15 mg/L group had an upward trend over days 7–15; NO3-N in the 0.30 mg/L group N exhibited an upward trend over days 7–10 (Figure 2c). Ammonia nitrogen was nitrified into nitrite, and then, nitrite was oxidized to nitrate nitrogen, but the first of these steps is the speed limiting step. After ammonia monooxygenase converts ammonia nitrogen into nitrite, nitrite will be rapidly converted into nitrate nitrogen [43]. It has long been assumed that the most important contributors to ammonia oxidation—the first and rate-limiting step in nitrification—are two groups of ammonia-oxidizing bacteria (AOB): the betaproteobacteria (β-AOB) from the genus Nitrosomonas and Nitrosospira [44,45], and gammaproteobacteria (γ-AOB) from the genus Nitrosococcus [46]. Our results show that the proportion of Nitrosomonas and Nitrosospira in the experimental group increased, and the nitrification rate was stronger compared with the blank group. In our 0.15 mg/L concentration group, nitrite and nitrate nitrogen were observed to be increased over days 7–10, and the nitrification rate was much higher than the denitrification rate. Nitrate nitrogen in the 0.30 mg/L concentration group showed an upward trend over days 7–10 and a downward trend over days 10–15, indicating that nitrification rate in the 0.30 mg/L concentration group was slightly higher than denitrification rate. The nitrite and nitrate nitrogen in the 0.60 mg/L concentration group remained stable over days 7–15, and the nitrification rate was the same as the denitrification rate. Therefore, 0.60 mg/L might be the optimal relative concentration for pond water purification.
Our data showed that after the addition of nitrifying and denitrifying bacteria, the diversity of nitrifying and denitrifying bacteria was significantly increased, followed by a decrease, and the bacterial diversity on day 15 returned to day 0 initial level. The cycle of nitrifying and denitrifying bacteria lasted about 15 days. Nitrifying and denitrifying bacteria were added once every 7 days for pond purification [47]. The change pattern of nitrifying bacterium abundance was consistent with that of ammonia nitrogen, with a significant change within 0–7 days followed by stable unchanged state within 7–15 days. The change of denitrifying bacteria abundance was in line with that of TN, which experienced a continuous decline throughout the entire cycle. The above results indicated that nitrifying and denitrifying bacteria had a specific transformation effect on nitrogen, which was in accordance with the previous report [48,49,50,51]. One of the major challenges in any sustainable aquaculture production systems is the accumulation of nitrogenous waste, such as ammonia, and its biological nitrification products, viz, nitrite and nitrate [52]. Many aquaculture operations rely on nitrification for the removal of toxic nitrogenous constituents, such as ammonia and nitrite, from the culture water [47]. Periodically adding nitrifying and denitrifying bacteria can effectively improve the aquaculture water body. Adding nitrification and anti-bacteria regularly in the process of factory farming can keep good water quality [53]. When adding nitrifying bacteria in a recirculating aquaculture system, all water quality indices except TP meet the standard [54]. When the nitrifying bacteria were put into the pond for 3–10 days, the purification effect of nitrifying bacteria was the best, and the ammonia nitrogen decreased by 67% after 18 days [55].
Our analyses of sediment microbial species showed that there was no significant difference in the species composition of denitrifying bacteria in the pond after the addition of nitrifying and denitrifying bacteria at the genus level, but there were obvious differences in the dominant landmark species of nitrifying and denitrifying bacteria at the species level. We believe that there may be specific signature species that have a huge advantage in water bodies and sediment purification with the addition of nitrifying and denitrifying bacteria. The dominant species can purify water and sediment more effectively after screening, separation, purification, and culture [56]. The nitrogen removal efficiency of heterotrophic nitrifying bacteria is up to 80% [57]. Bacterial enrichment of Comammox Nitrospira can improve the biological nitrogen removal efficiency of sewage treatment plant [58]. Nitrosomonas Nm143-like ammonia oxidizers and Nitrospira marine-like nitrite oxidizers dominate the nitrifier community in a marine aquaculture biofilm [59]. Strain qy37 possesses the accelerating removal characteristic of NH4+-N in a heterotrophic nitrification and aerobic denitrification system [60].
All our identified bacterial species at the genus level have been reported to be found in aquatic sediments [61,62,63,64,65]. Betaproteobacteria comprising autotrophic nitrifying bacteria (AOB, NOB, and denitrifying bacteria) in biological nitrogen removal systems were reported, especially under low DO concentration [66]. Thauera and Magnetospirillumn are facultative anaerobes, and they can transform nitrate nitrogen into N2 [67]. Thaurea and Pseudomonas were the most dominant bacteria capable of converting NH4+-N to N2 gas at low DO concentrations [66]. Members of the genus Thaurea belonging to the class Betaproteobacteria showed the ability to perform denitrification aerobically [68]. Therefore, aerobic nitrification and facultative anaerobic denitrification are performing in the pond sediments. The above-mentioned nitrifying and denitrifying bacteria have multiple advantages, such as strong applicability to the environment and no great environment change induced by their addition. However, some studies have found that the addition of exogenous carbon sources might increase bacterial diversity [69]. The addition of carbon source can transform the dominant bacteria into Bacillus and reduce the number of vibrio species [69]. Therefore, it is possible that the addition of nitrifying and denitrifying bacteria may affect other microorganisms, in turn changing the C/N ratio in the pond.

5. Conclusions

Our study showed that nitrifying bacteria and denitrifying bacteria had an obvious purification effect on the nitrogen in pond water and sediment. The optimal relative concentration was 0.60 mg/L for nitrifying and denitrifying bacteria. At this concentration, the nitrogen load of pond water and sediment decreased most obviously. After mixed bacteria were used, the dominant species of nitrifying and denitrifying bacteria kept stable. Aerobic nitrification and facultative anaerobic denitrification took place on the surface of pond sediments. Autotrophic nitrification and heterotrophic denitrification were perfect in pond sediments at low C/N, which provides an insight into the pond sediment purification mechanism.

Author Contributions

Conceptualization D.H., D.L. and R.T.; methodology, D.H.; software, D.H.; validation, D.H. and Z.H.; formal analysis, D.H.; investigation, D.H. and Z.H.; resources, R.T.; data curation, D.H.; writing—original draft preparation, D.H. and Z.H.; writing—review and editing, D.L. and R.T.; visualization, D.L. and R.T.; supervision, R.T.; project administration, R.T.; funding acquisition, R.T. All authors have read and agreed to the published version of the manuscript.

Funding

This research was supported by the National Key R&D Program of China (No. 2019YFD0900301) and China Agriculture Research System of MOF and MARA (CARS-45-24).

Institutional Review Board Statement

Not applicable.

Informed Consent Statement

Not applicable.

Data Availability Statement

The original contributions presented in the study are included in the article. Further inquiries can be directed to the corresponding author.

Acknowledgments

The authors extend their sincere thanks to the members of the Fish Environmental Physiology and Freshwater Healthy Aquaculture Laboratory at the College of Fisheries in Huazhong Agricultural University for stimulating discussions and suggestions.

Conflicts of Interest

The authors declare no conflict of interest.

References

  1. Nhan, D.K.; Verdegem, M.C.J.; Milstein, A.; Verreth, J.A.V. Water and nutrient budgets of ponds in integrated agriculture-aquaculture systems in the Mekong Delta, Vietnam. Aquac. Res. 2008, 39, 1216–1228. [Google Scholar] [CrossRef]
  2. Zhao, Y.F.; Zhang, S.P.; Wang, X.F.; Huang, L.G.; Liu, J.X.; Xiong, X.Y. Nitrogen and phosphorus budgets of polyculture system of mud crab scylla paramamosain, tiger shrimp penaeus monodon and razor clamsinonovacula constricta. Res. Appl. 2021, 40, 483–491. [Google Scholar]
  3. Kolath, A.S.; Pedersen, C.S.; Gangelhof, U.L.; Egemose, S. Biodiversity and Sediment Contamination in Wet Stormwater Ponds Depending on Design and Catchment Characteristics. Sustainability 2021, 13, 11809. [Google Scholar] [CrossRef]
  4. Tulsankar, S.S.; Cole, A.J.; Gagnon, M.M.; Fotedar, R. Effects of seasonal variations and pond age on trace elements and their correlations with plankton productivity in commercial freshwater crayfish (cherax cainii austin, 2002) earthen ponds. Aquac. Res. 2020, 51, 1913–1922. [Google Scholar] [CrossRef]
  5. Ke, X.; Bao, Q.H.; Qi, Y.F.; Huang, X.Y.; Zhang, H.J. Toxicity assessment of sediments from the Liaohe River Protected Area (China) under the influence of ammonia nitrogen, heavy metals and organic contaminants. Environ. Toxicol. Phar. 2018, 59, 34–42. [Google Scholar] [CrossRef]
  6. Liu, H.Y.; Hu, H.W.; Huang, X.; Ge, T.D.; Li, Y.F.; Zhu, Z.K.; Liu, X.M.; Tan, W.F.; Jia, Z.J.; Di, H.J.; et al. Canonical ammonia oxidizers, rather than comammox Nitrospira, dominated autotrophic nitrification during the mineralization of organic substances in two paddy soils. Soil Biol. Biochem. 2021, 156, 108192. [Google Scholar] [CrossRef]
  7. Wang, W.W.; Jiang, X.; Zheng, B.H.; Chen, J.Y.; Zhao, L.; Zhang, B.; Wang, S.H. Composition, mineralization potential and release risk of nitrogen in the sediments of Keluke Lake, a Tibetan Plateau freshwater lake in China. R. Soc. Open Sci. 2018, 5, 180612. [Google Scholar] [CrossRef] [Green Version]
  8. Zhu, J.; He, Y.; Zhu, Y.S.; Huang, M.S.; Zhang, Y.P. Biogeochemical sulfur cycling coupling with dissimilatory nitrate reduction processes in freshwater sediments. Environ. Rev. 2018, 26, 121–132. [Google Scholar] [CrossRef]
  9. Coyne, K.J.; Parker, A.E.; Lee, C.K.; Sohm, J.A.; Kalmbach, A.; Gunderson, T.; Leon-Zayas, R.; Capone, D.G.; Carpenter, E.J.; Cary, S.C. The distribution and relative ecological roles of autotrophic and heterotrophic diazotrophs in the McMurdo Dry Valleys, Antarctica. FEMS Microbiol. Ecol. 2020, 96, fiaa010. [Google Scholar] [CrossRef] [Green Version]
  10. Beveridge, M.C.M.; Begum, M.; Frerichs, G.N.; Millar, S. The Ingestion of Bacteria in Suspension by the Tilapia Oreochromis-Niloticus. Aquaculture 1989, 81, 373–378. [Google Scholar] [CrossRef]
  11. Dilmi, A.; Refes, W.; Meknachi, A. Effects of C/N Ratio on Water Quality, Growth Performance, Digestive Enzyme Activity and Antioxidant Status of Nile tilapia Oreochromis niloticus (Linnaeus, 1758) in Biofloc Based Culture System. Turk. J. Fish. Aquat. Sci. 2022, 22, 19754. [Google Scholar] [CrossRef]
  12. Gou, J.W.; Hong, C.U.; Deng, M.; Chen, J.Y.; Hou, J.; Li, D.P.; He, X.G. Effect of Carbon to Nitrogen Ratio on Water Quality and Community Structure Evolution in Suspended Growth Bioreactors through Biofloc Technology. Water 2019, 11, 1640. [Google Scholar] [CrossRef] [Green Version]
  13. Choi, C.; Lee, J.; Lee, K.; Kim, M. The effects on operation conditions of sludge retention time and carbon/nitrogen ratio in an intermittently aerated membrane bioreactor (IAMBR). Bioresour. Technol. 2008, 99, 5397–5401. [Google Scholar] [CrossRef] [PubMed]
  14. Samocha, T.M.; Patnaik, S.; Speed, M.; Ali, A.M.; Burger, J.M.; Almeida, R.V.; Ayub, Z.; Harisanto, M.; Horowitz, A.; Brock, D.L. Use of molasses as carbon source in limited discharge nursery and grow-out systems for Litopenaeus vannamei. Aquac. Eng. 2007, 36, 184–191. [Google Scholar] [CrossRef]
  15. Wang, L.; Ma, L.; Sun, J.; Zhang, Y.; Zhou, Q.H.; Wu, Z.B.; He, F. Effects of different aquaculture methods for introduced bivalves (Hyriopsis cumingii) on seston removal and phosphorus balance at the water-sediment interface. J. Freshwater Ecol. 2018, 33, 251–265. [Google Scholar] [CrossRef] [Green Version]
  16. Kibuye, F.A.; Zamyadi, A.; Wert, E.C. A critical review on operation and performance of source water control strategies for cyanobacterial blooms: Part II-mechanical and biological control methods. Harmful Algae 2021, 109, 102119. [Google Scholar] [CrossRef]
  17. Yin, H.B.; Yang, C.H.; Yang, P.; Kaksonen, A.H.; Douglas, G.B. Contrasting effects and mode of dredging and in situ adsorbent amendment for the control of sediment internal phosphorus loading in eutrophic lakes. Water Res. 2021, 189, 116644. [Google Scholar] [CrossRef]
  18. Sun, Q.; Ding, S.M.; Chen, M.S.; Gao, S.S.; Lu, G.H.; Wu, Y.X.; Gong, M.D.; Wang, D.; Wang, Y. Long-term effectiveness of sediment dredging on controlling the contamination of arsenic, selenium, and antimony. Environ. Pollut. 2019, 245, 725–734. [Google Scholar] [CrossRef]
  19. Yang, L.M.; Chen, F.F.; Xiao, Y.; Li, H.K.; Li, J.; Leng, L.J.; Liu, H.; Zhong, Y.M.; Li, K.; Lu, Q.; et al. Microbial community-assisted water quality control and nutrients recovery: Emerging technologies for the sustainable development of aquaponics. J. Chem. Technol. Biot. 2019, 94, 2405–2411. [Google Scholar] [CrossRef]
  20. Zhang, X.; Wang, J.W.; Tang, R.; He, X.G.; Li, L.; Takagi, Y.; Li, D.P. Improvement of Muscle Quality of Grass Carp (Ctenopharyngodon idellus) With a Bio-Floating Bed in Culture Ponds. Front. Physiol. 2019, 10, 683. [Google Scholar] [CrossRef]
  21. Costa, L.F.A.; Lima, J.S.; Siqueira, A.M.A.; da Silva, E.C.C.; Lima, V.C.F.; da Silva, L.A.; da Silva, S.R.; Santos, T.F.; Fugimura, M.M.S.; Vaz, L.J.; et al. Effect of multi-species probiotic administration in Colossoma macropomum juvenile rearing: Supplementation and bioremediation. Aquac. Nutr. 2021, 27, 1721–1729. [Google Scholar] [CrossRef]
  22. Nathanailides, C.; Kolygas, M.; Choremi, K.; Mavraganis, T.; Gouva, E.; Vidalis, K.; Athanassopoulou, F. Probiotics Have the Potential to Significantly Mitigate the Environmental Impact of Freshwater Fish Farms. Fishes 2021, 6, 76. [Google Scholar] [CrossRef]
  23. Nayak, S.K. Multifaceted applications of probioticBacillusspecies in aquaculture with special reference toBacillus subtilis. Rev. Aquac. 2021, 13, 862–906. [Google Scholar] [CrossRef]
  24. Hahn, M.W. The microbial diversity of inland waters. Curr. Opin. Biotech. 2006, 17, 256–261. [Google Scholar] [CrossRef] [PubMed]
  25. Huang, J.Q.; Liu, Z.; Li, Y.J.; Wang, J.F. Bacterial diversity in saline-alkali ponds rearing common carp (Cyprinus carpio) as revealed by 16S rRNA gene sequences. Biologia 2014, 69, 727–734. [Google Scholar] [CrossRef]
  26. Tang, X.M.; Li, L.L.; Shao, K.Q.; Wang, B.W.; Cai, X.L.; Zhang, L.; Chao, J.Y.; Gao, G. Pyrosequencing analysis of free-living and attached bacterial communities in Meiliang Bay, Lake Taihu, a large eutrophic shallow lake in China. Can. J. Microbiol. 2015, 61, 22–31. [Google Scholar] [CrossRef]
  27. Zhang, H.; Sun, Z.L.; Liu, B.; Xuan, Y.M.; Jiang, M.; Pan, Y.S.; Zhang, Y.M.; Gong, Y.P.; Lu, X.P.; Yu, D.S.; et al. Dynamic changes of microbial communities in Litopenaeus vannamei cultures and the effects of environmental factors. Aquaculture 2016, 455, 97–108. [Google Scholar] [CrossRef]
  28. Zhou, T.; Wang, Y.; Tang, J.Y.; Dai, Y.X. Bacterial communities in Chinese grass carp (Ctenopharyngodon idellus) farming ponds. Aquac. Res. 2013, 45, 138–149. [Google Scholar] [CrossRef]
  29. Xia, Z.G.; Wang, Q.; She, Z.L.; Gao, M.C.; Zhao, Y.G.; Guo, L.; Jin, C.J. Nitrogen removal pathway and dynamics of microbial community with the increase of salinity in simultaneous nitrification and denitrification process. Sci. Total Environ. 2019, 697, 134047. [Google Scholar] [CrossRef]
  30. Ebeling, J.M.; Timmons, M.B.; Bisogni, J.J. Engineering analysis of the stoichiometry of photoautotrophic, autotrophic, and heterotrophic removal of ammonia-nitrogen in aquaculture systems. Aquaculture 2006, 257, 346–358. [Google Scholar] [CrossRef] [Green Version]
  31. Liu, Y.K.L.Y.; Xu, A.L.; Song, Z.W. Effect of Microecological Preparation on the Establishment of Nitrification Function in Mariculture System. J. Microbiol. 2019, 39, 16–21. [Google Scholar]
  32. Jia, J.P.J.L.; Wang, Y.J.; Li, Y.; Li, X.H.; Wu, W.B.; Fu, S.S.; Yuan, Q.S. Study on nitrogen removal from low C/N wastewater by denitrification microbial fuel cell. Environ. Pollut. Control. 2021, 43, 937–941. [Google Scholar]
  33. Yang, K.W.L.Y.; Wu, Z.Y.; Tong, L.; Feng, L. Effects of denitrifying bacteria inoculation on bacterial communities in a lake. Safety Environ. Eng. 2020, 27, 81–87. [Google Scholar]
  34. Chinese, N.E.P.A. Water and Wastewater Monitoring Methods; Chinese Environmental Science Publishing House: Beijing, China, 2012. [Google Scholar]
  35. Edgar, R.C. UPARSE: Highly accurate OTU sequences from microbial amplicon reads. Nat. Methods 2013, 10, 996–998. [Google Scholar] [CrossRef]
  36. Tamura, K.; Peterson, D.; Peterson, N.; Stecher, G.; Nei, M.; Kumar, S. MEGA5: Molecular Evolutionary Genetics Analysis Using Maximum Likelihood, Evolutionary Distance, and Maximum Parsimony Methods. Mol. Biol. Evol. 2011, 28, 2731–2739. [Google Scholar] [CrossRef] [Green Version]
  37. Jiang, H.C.; Dong, H.L.; Yu, B.S.; Lv, G.; Deng, S.C.; Berzins, N.; Dai, M.H. Diversity and Abundance of Ammonia-Oxidizing Archaea and Bacteria in Qinghai Lake, Northwestern China. Geomicrobiol. J 2009, 26, 199–211. [Google Scholar] [CrossRef]
  38. Mosier, A.C.; Francis, C.A. Relative abundance and diversity of ammonia-oxidizing archaea and bacteria in the San Francisco Bay estuary. Environ. Microbiol. 2008, 10, 3002–3016. [Google Scholar] [CrossRef]
  39. Zheng, Y.L.; Hou, L.J.; Liu, M.; Lu, M.; Zhao, H.; Yin, G.Y.; Zhou, J.L. Diversity, abundance, and activity of ammonia-oxidizing bacteria and archaea in Chongming eastern intertidal sediments. Appl. Microbiol. Biot. 2013, 97, 8351–8363. [Google Scholar] [CrossRef]
  40. Bock, E.; Wagner, M. Oxidation of Inorganic Nitrogen Compounds as an Energy Source. In Prokaryotes: A Handbook on the Biology of Bacteria, 3rd ed.; 2006; Volume 2, pp. 457–495. [Google Scholar] [CrossRef]
  41. Castignetti, D.; Gunner, H.B. Sequential Nitrification by an Alcaligenes Sp and Nitrobacter-Agilis. Can. J. Microbiol. 1980, 26, 1114–1119. [Google Scholar] [CrossRef]
  42. Srithep, P.; Pornkulwat, P.; Limpiyakorn, T. Contribution of ammonia-oxidizing archaea and ammonia-oxidizing bacteria to ammonia oxidation in two nitrifying reactors. Environ. Sci. Pollut. R. 2018, 25, 8676–8687. [Google Scholar] [CrossRef]
  43. Wang, J.L.; Gong, B.Z.; Wang, Y.M.; Wen, Y.H.; Zhou, J.; He, Q. The potential multiple mechanisms and microbial communities in simultaneous nitrification and denitrification process treating high carbon and nitrogen concentration saline wastewater. Bioresour. Technol. 2017, 243, 708–715. [Google Scholar] [CrossRef] [PubMed]
  44. Head, I.M.; Hiorns, W.D.; Embley, T.M.; Mccarthy, A.J.; Saunders, J.R. The Phylogeny of Autotrophic Ammonia-Oxidizing Bacteria as Determined by Analysis of 16s Ribosomal-Rna Gene-Sequences. J. Gen. Microbiol. 1993, 139, 1147–1153. [Google Scholar] [CrossRef] [PubMed] [Green Version]
  45. Purkhold, U.; Wagner, M.; Timmermann, G.; Pommerening-Roser, A.; Koops, H.P. 16S rRNA and amoA-based phylogeny of 12 novel betaproteobacterial ammonia-oxidizing isolates: Extension of the dataset and proposal of a new lineage within the nitrosomonads. Int. J. Syst. Evol. Microbiol. 2003, 53, 1485–1494. [Google Scholar] [CrossRef] [PubMed]
  46. Ward, B.B.; O’Mullan, G.D. Worldwide distribution of Nitrosococcus oceani, a marine ammonia-oxidizing gamma-proteobacterium, detected by PCR and sequencing of 16S rRNA and amoA genes. Appl. Environ. Microbiol. 2002, 68, 4153–4157. [Google Scholar] [CrossRef] [PubMed] [Green Version]
  47. Kuhn, D.D.; Drahos, D.D.; Marsh, L.; Flick, G.J. Evaluation of nitrifying bacteria product to improve nitrification efficacy in recirculating aquaculture systems. Aquac. Eng. 2010, 43, 78–82. [Google Scholar] [CrossRef]
  48. Benakova, A.; Wanner, J. Application of fluorescence in situ hybridization for the study and characterization of nitrifying bacteria in nitrifying/denitrifying wastewater treatment plants. Environ. Technol. 2013, 34, 2415–2422. [Google Scholar] [CrossRef]
  49. Toor, U.A.; Han, D.W.; Kim, D.J. N2O emission during wastewater nitrification with enriched nitrifying bacteria. Desalin Water Treat. 2016, 57, 661–669. [Google Scholar] [CrossRef]
  50. Yuan, J.; Huang, S.; Yuan, H.; Fu, F.; Zhang, Y. Effects of chloramphenicol on the bacterial community structure and simultaneous nitrification and denitrification performance in a sequencing biofilm batch reactor. J. Water Process Eng. 2021, 42, 102095. [Google Scholar] [CrossRef]
  51. Zheng, H.Y.; Liu, Y.; Gao, X.Y.; Ai, G.M.; Miao, L.L.; Liu, Z.P. Characterization of a marine origin aerobic nitrifying-denitrifying bacterium. J. Biosci. Bioeng. 2012, 114, 33–37. [Google Scholar] [CrossRef]
  52. Preena, P.G.; Kumar, V.J.R.; Singh, I.S.B. Nitrification and denitrification in recirculating aquaculture systems: The processes and players. Rev. Aquac. 2021, 13, 2053–2075. [Google Scholar] [CrossRef]
  53. Li, X.M.; Xue, S.X.; Zhao, Y.C. Control and effect of nitrifying bacteria in factory culture. Tianjin Aquat. 2004, 2, 15–20. [Google Scholar]
  54. Pan, J.M. Utilization of commercial nitrobacteria addtive in the inoculation of a new recirculating aquaculture system. J. Fish. 2004, 28, 419–424. [Google Scholar]
  55. Ju, Z.; Zhou, C.L.; Du, J. Studies on the culture and Applicayion of a nitrite-oxidizing bacterium with high nitrification activity. Microbiol. China 2005, 5, 56–61. [Google Scholar]
  56. Koops, H.P.; Pommerening-Roser, A. Distribution and ecophysiology of the nitrifying bacteria emphasizing cultured species. FEMS Microbiol. Ecol. 2001, 37, 1–9. [Google Scholar] [CrossRef]
  57. Lin, Y.; He, Y.L.; Kong, H.N.; Liu, B.B.; Li, Y.; Inamon, Y. Isolation and characterization of heterotrophic nitrifying bacteria in MBR. J. Environ. Sci. 2005, 17, 589–592. [Google Scholar]
  58. Fujitani, H.; Nomachi, M.; Takahashi, Y.; Hasebe, Y.; Eguchi, M.; Tsuneda, S. Successful enrichment of low-abundant comammox Nitrospira from nitrifying granules under ammonia-limited conditions. FEMS Microbiol. Lett. 2020, 367, fnaa025. [Google Scholar] [CrossRef]
  59. Foesel, B.U.; Gieseke, A.; Schwermer, C.; Stief, P.; Koch, L.; Cytryn, E.; de la Torre, J.R.; van Rijn, J.; Minz, D.; Drake, H.L.; et al. Nitrosomonas Nm143-like ammonia oxidizers and Nitrospira marina-like nitrite oxidizers dominate the nitrifier community in a marine aquaculture biofilm. FEMS Microbiol. Ecol. 2008, 63, 192–204. [Google Scholar] [CrossRef] [Green Version]
  60. Zhang, P.-Y.; Qu, Y.; Yu, D.-S.; Guo, S.-S.; Yang, R.-X. Comparison of Heterotrophic Nitrification and Aerobic Denitrification System by Strain qy37 and Its Accelerating Removal Characteristic of NH4+-N. Huan Jing Ke Xue Huanjing Kexue 2010, 31, 1819–1826. [Google Scholar]
  61. Foss, S.; Harder, J. Thauera linaloolentis sp. nov. and Thauera terpenica sp. nov., isolated on oxygen-containing monoterpenes (linalool, menthol, and eucalyptol) and nitrate. Syst. Appl. Microbiol. 1998, 21, 365–373. [Google Scholar] [CrossRef]
  62. Ma, W.W.; Han, Y.X.; Ma, W.C.; Han, H.J.; Zhu, H.; Xu, C.Y.; Li, K.; Wang, D.X. Enhanced nitrogen removal from coal gasification wastewater by simultaneous nitrification and denitrification (SND) in an oxygen-limited aeration sequencing batch biofilm reactor. Bioresour. Technol. 2017, 244, 84–91. [Google Scholar] [CrossRef]
  63. Mechichi, T.; Stackebrandt, E.; Gad’on, N.; Fuchs, G. Phylogenetic and metabolic diversity of bacteria degrading aromatic compounds under denitrifying conditions, and description of Thauera phenylacetica sp nov., Thauera aminoaromatica sp. nov., and Azoarcus buckelii sp nov. Arch. Microbiol. 2002, 178, 26–35. [Google Scholar] [CrossRef] [PubMed]
  64. Scholten, E.; Lukow, T.; Auling, G.; Kroppenstedt, R.M.; Rainey, F.A.; Diekmann, H. Thauera mechernichensis sp nov., an aerobic denitrifier from a leachate treatment plant. Int. J. Syst. Bacteriol. 1999, 49, 1045–1051. [Google Scholar] [CrossRef] [PubMed]
  65. Song, B.K.; Palleroni, N.J.; Kerkhof, L.J.; Haggblom, M.M. Characterization of halobenzoate-degrading. denitrifying Azoarcus and Thauera isolates and description of Thauera chlorobenzoica sp. nov. Int. J. Syst. Evol. Microbiol. 2001, 51, 589–602. [Google Scholar] [CrossRef] [PubMed] [Green Version]
  66. Reino, C.; Suarez-Ojeda, M.E.; Perez, J.; Carrera, J. Kinetic and microbiological characterization of aerobic granules performing partial nitritation of a low-strength wastewater at 10 degrees C. Water Res. 2016, 101, 147–156. [Google Scholar] [CrossRef] [Green Version]
  67. Hira, D.; Aiko, N.; Yabuki, Y.; Fujii, T. Impact of aerobic acclimation on the nitrification performance and microbial community of landfill leachate sludge. J. Environ. Manag. 2018, 209, 188–194. [Google Scholar] [CrossRef]
  68. Khardenavis, A.A.; Kapley, A.; Purohit, H.J. Simultaneous nitrification and denitrification by diverse Diaphorobacter sp. Appl. Microbiol. Biot. 2007, 77, 403–409. [Google Scholar] [CrossRef]
  69. Liu, C.; Hou, L.J.; Liu, M.; Zheng, Y.L.; Yin, G.Y.; Han, P.; Dong, H.P.; Gao, J.; Gao, D.Z.; Chang, Y.K.; et al. Coupling of denitrification and anaerobic ammonium oxidation with nitrification in sediments of the Yangtze Estuary: Importance and controlling factors. Estuar. Coast. Shelf Sci. 2019, 220, 64–72. [Google Scholar] [CrossRef]
Figure 1. Acrylic transparent tubes erection straight view.
Water 14 01855 g001
Figure 2. Concentrations of ammonia nitrogen (a), nitrite nitrogen (b), and nitrate nitrogen (c) in water after adding different concentrations of nitrifying and denitrifying bacteria. The black “*” indicate significant differences between 0 mg/L groups, the red “*” indicate significant differences between 0.15 mg/L groups, the blue “*” indicate significant differences between 0.30 mg/L groups, and the green “*” indicate significant differences between 0 mg/L groups. (the “*” expression p < 0.05, the “**” expression p < 0.01).
Water 14 01855 g002
Figure 3. Concentrations of COD (a) and TN (b) in the water added with different concentrations of nitrifying and denitrifying bacteria. The black “*” indicate significant differences between 0 mg/L groups, the red “*” indicate significant differences between 0.15 mg/L groups, the blue “*” indicate significant differences between 0.30 mg/L groups, and the green “*” indicate significant differences between 0 mg/L groups. (the “*” expression p < 0.05).
Water 14 01855 g003
Figure 4. C/N ratio in water (a) and C/N ratio in sediment (b) after addition of different concentrations of nitrifying and denitrifying bacteria. The orange “*” indicate significant differences between 0 mg/L groups, the green “*” indicate significant differences between 0.15 mg/L groups, the purple “*” indicate significant differences between 0.30 mg/L groups, and the pink “*” indicate significant differences between 0 mg/L groups. (the “*” expression p < 0.05, the “**” expression p < 0.01).
Water 14 01855 g004
Figure 5. At genus level, species composition of nitrifying bacteria (a) (amoA gene) and denitrifying bacteria (b) (NirS gene) in different concentrations.
Water 14 01855 g005
Figure 6. At genus level, species composition of nitrifying bacteria (a) (amoA gene) and denitrifying bacteria (b) (NirS gene) at different times.
Water 14 01855 g006
Figure 7. Heat maps of nitrifying (a) and denitrifying (b) bacterial species composition (at species level).
Water 14 01855 g007
Figure 8. Diversity analysis of nitrifying bacteria (a) and denitrifying bacteria (b) (the “*” expression p < 0.05).
Water 14 01855 g008
Figure 9. Redundancy analysis of nitrifying bacteria (a), denitrifying bacteria (b), and environmental factors at genus level.
Water 14 01855 g009
Table 1. Physicochemical characteristics of the water samples (the “*” expression p < 0.05, the “**” expression p < 0.01).
GroupTime (Day)WaterTMDO (mg/L)pH
NH4+-N (mg/L)NO2-N (mg/L)NO3-N (mg/L)TN (mg/L)COD (mg/L)
0 m/L01.87 ± 0.270.25 ± 0.081.90 ± 0.3718.6 ± 2.1111.72 ± 0.8510.0 ± 0.029.73 ± 0.568.62 ± 0.41
11.92 ± 0.320.22 ± 0.062.10 ± 0.3519.1 ± 1.8511.65 ± 0.728.5 ± 0.018.95 ± 0.378.92 ± 0.15
41.68 ± 0.180.18 ± 0.051.86 ± 0.3216.2 ± 1.7211.66 ± 0.569.5 ± 0.0110.50 ± 0.348.67 ± 0.47
71.62 ± 0.070.25 ± 0.062.05 ± 0.4218.5 ± 1.3412.03 ± 0.736.7 ± 0.02 *10.32 ± 0.428.70 ± 0.17
101.57 ± 0.150.18 ± 0.062.02 ± 0.2817.8 ± 2.2212.28 ± 0548.6 ± 0.019.97 ± 0.558.72 ± 0.26
151.92 ± 0.240.20 ± 0.082.18 ± 0.2618.2 ± 2.2511.28 ± 0.898.2 ± 0.0110.89 ± 0.878.69 ± 0.28
0.15 mg/L02.28 ± 0.330.32 ± 0.121.87 ± 0.3419.1 ± 1.8515.66 ± 1.5210.1 ± 0.0110.02 ± 0.358.57 ± 0.45
12.12 ± 0.210.27 ± 0.131.72 ± 0.3118.9 ± 1.7415.69 ± 1.338.4 ± 0.029.52 ± 0.389.10 ± 0.47
41.85 ± 0.220.16 ± 0.08 *1.18 ± 0.24 *17.5 ± 1.5615.23 ± 1.879.5 ± 0.0211.12 ± 0.779.34 ± 0.37
71.12 ± 0.15 ** 0.08 ± 0.021.09 ± 0.1816.2 ± 2.6512.64 ± 0.92 *6.8 ± 0.01 *11.34 ± 0.679.13 ± 0.29
100.75 ± 0.080.12 ± 0.011.28 ± 0.1515.9 ± 2.3111.45 ± 0.658.6 ± 0.0210.18 ± 0.659.24 ± 0.26
150.54 ± 0.080.03 ± 0.011.34 ± 0.1213.5 ± 1.88 *12.56 ± 0.488.3 ± 0.0111.52 ± 0.599.16 ± 0.25
0.30 mg/L01.86 ± 0.170.25 ± 0.071.94 ± 0.3320.0 ± 2.2313.20 ± 0.9910.2 ± 0.019.85 ± 0.278.72 ± 0.37
11.52 ± 0.120.21 ± 0.081.82 ± 0.1819.2 ± 2.1113.06 ± 1.338.4 ± 0.028.88 ± 0.858.42 ± 0.31
40.75 ± 0.10 **0.11 ± 0.03 *1.60 ± 0.2417.7 ± 2.2113.28 ± 1.569.6 ± 0.019.87 ± 0.868.55 ± 0.23
70.48 ± 0.06 *0.08 ± 0.031.22 ± 0.15 *16.5 ± 1.5412.05 ± 0.876.8 ± 0.01 *9.23 ± 0.368.79 ± 0.28
100.27 ± 0.080.03 ± 0.011.62 ± 0.18 *15.7 ± 1.3211.62 ± 0.698.5 ± 0.019.17 ± 0.288.62 ± 0.44
150.29 ± 0.080.02 ± 0.011.22 ± 0.1612.8 ± 1.25 *12.16 ± 0.748.2 ± 0.0210.03 ± 0.278.34 ± 0.28
0.60 mg/L02.11 ± 0.180.28 ± 0.092.13 ± 0.3218.6 ± 0.9713.95 ± 1.2310.0 ± 0.029.77 ± 0.558.65 ± 0.37
11.61 ± 0.15 *0.23 ± 0.111.95 ± 0.2418.2 ± 1.3213.29 ± 0.878.5 ± 0.019.03 ± 0.588.55 ± 0.35
41.12 ± 0.17 *0.15 ± 0.03 *1.73 ± 0.1517.3 ± 2.5113.32 ± 0.859.5 ± 0.029.92 ± 0.648.69 ± 0.42
70.54 ± 0.15 **0.03 ± 0.01 **1.31 ± 0.22*13.5 ± 2.36 *14.18 ± 0326.9 ± 0.01 *9.55 ± 0.368.72 ± 0.39
100.47 ± 0.080.02 ± 0.011.30 ± 0.2412.0 ± 2.1613.80 ± 0.568.6 ± 0.019.26 ± 0.388.24 ± 0.41
150.51 ± 0.110.02 ± 0.011.32 ± 0.2610.2 ± 0.87 *13.46 ± 0.898.2 ± 0.0110.13 ± 0.958.13 ± 0.32
Publisher’s Note: MDPI stays neutral with regard to jurisdictional claims in published maps and institutional affiliations.

