Article

Characteristics and Causes of Changing Groundwater Quality in the Boundary Line of the Middle and Lower Yellow River (Right Bank)

1
China Geological Environmental Monitoring Institute, Beijing 100081, China
2
Henan Institute of Geological Survey, Zhengzhou 450001, China
3
School of Water Conservancy and Engineering, Zhengzhou University, Zhengzhou 450001, China
4
Henan Institute of Geological Sciences, Zhengzhou 450001, China
*
Author to whom correspondence should be addressed.
Water 2022, 14(12), 1846; https://doi.org/10.3390/w14121846
Submission received: 20 April 2022 / Revised: 30 May 2022 / Accepted: 2 June 2022 / Published: 8 June 2022

Abstract

:
The alluvial plain in the middle and lower reaches of the Yellow River is an important agricultural production base that affects groundwater quality. Groundwater quality in the region is related to the residential and production uses of water by local residents. Samples of shallow groundwater and river water were collected from the right bank of the middle and lower reaches of the Yellow River to determine the evolution and causes of hydrochemical characteristics, and the relationship between the hydrochemical evolution of river water and groundwater was explored. The results showed that the shallow groundwater in the area received lateral recharge from the Yellow River water. The closer to the Yellow River the groundwater was, the higher the SO42−, Cl, and Na+ concentrations and the lower the HCO3 and Mg2+ concentrations were. Agriculture and aquaculture has influenced and complicated the hydrochemical types of shallow groundwater in recent decades. The groundwater in the area was jointly affected by water–rock interactions and evaporation concentrations; a strong cation exchange effect was detected. Arsenic exceeded the limit in some shallow groundwater, which was mainly distributed in the Yellow River alluvial plain and caused by the reductive sedimentary environment of the Yellow River alluvial plain. The “three nitrogen”, NH4+-N, NO2-N, and NO3-N, demonstrated sporadic local excesses in shallow groundwater, which were related to human activities, such as aquaculture.

1. Introduction

Groundwater is a significant water resource and a major source of water for various purposes [1]. In recent years, industrialization, urbanization, and economic growth have had a significant impact on the groundwater environment in China. The hydrochemical composition of groundwater is controlled by many factors, including hydrogeological conditions, geological structure, climate, topography, elevation, and human activities. Through the analysis of groundwater hydrochemical characteristics, it can indicate the lithology of the groundwater, the meteorological hydrology and environmental characteristics, the water–rock interactions, and reflects the groundwater circulation pathway, groundwater system characteristics, and evolution laws [2]. Assessing groundwater quality and identifying pollutant risks are essential for managing groundwater resources.
Since the 1960s, scholars have paid attention to the hydrochemical characteristics of major rivers on various continents, focusing on their ion sources, migration and transformation processes, and transport fluxes; studying the change process and mechanism of watershed hydrochemical characteristics has led to discussions regarding the protection strategies and mechanisms of the watershed ecological environment [3,4,5]. The analysis of the hydrochemical characteristics of groundwater can assist in identifying hydrogeochemical interactions within groundwater and surrounding environments and in revealing the evolution of hydrochemical processes and is of great significance for the development and utilization of groundwater resources and pipelines.
In recent years, scholars at home and abroad have begun to study the temporal and spatial changes and evolution laws of groundwater chemistry [6]. Liu et al. analyzed the hydrochemical evolution of the North China Plain from the recharge area to the discharge area under the influence of human activities and its impact on the enrichment of fluorine in groundwater. The results show that the land subsidence caused by the excessive exploitation of groundwater and the release of F in pore water are the main reasons for the excessive fluoride in groundwater [7]. Sainath et al. collected and analyzed 33 groundwater samples in a cross-section of the Pravara River Basin, using the Water Quality Index (WQI) and Wilcox plots to infer water quality [8]. For the spatial analysis of water quality, Xu [9] established a river water quality monitoring platform in Jiaxing by GIS, which can visually display the information of river monitoring points and pollution sources on the map to provide support for further pollution control measures. Zhao et al. [10] used two spatial interpolation methods such as Kriging and radial basis function to analyze the situation of water pollution in Liangzi Lake and analyze the spatial distribution of water quality. Spatial analysis combined with GIS can fully understand the distribution of water quality, which plays an important role in exploring pollution sources and pollution control.
Water quality is an important issue related to people’s life and health. The hydrochemical analysis of sampled water is an essential stage in understanding water quality. At present, statistical analysis [11], ion ratio [12], and isotope tracing [13] have been widely used in the determination of groundwater hydrochemistry and water quality evolution. Sun et al. used the Shukarev classification method, Piper’s three-line diagram, Pearson’s correlation, Gibbs diagrams, and ion ratio diagrams to analyse the chemical characteristics and formation mechanism of groundwater in the Dalian area. In this study area, the chemical types found in groundwater were mainly HCO3·Cl-Ca2+, and they showed obvious regional distribution characteristics [14]. Wang et al. used Piper diagrams and isotope analyses to explore the characteristics and spatial changes in the main anions and cations and stable isotopes of hydrogen and oxygen in water and exposed the formation of river water chemical components by combining Gibbs diagrams, endmember diagrams, and correlation analyses [15]. Using the Piper diagrams, Gibbs, principal component analysis, a correlation matrix, and a forward derivation model, Liu et al. analysed the distribution characteristics and control factors of hydrochemistry and hydrogen and oxygen stable isotopes of shallow groundwater in the Fenhe River Basin and revealed the water cycle and water quality evolution process of the basin [16]. Practice has proven that these hydrochemical analysis methods can effectively reveal the chemical characteristics and formation mechanism of groundwater in a region, determine the hydrochemical process of the region, and have important value for the development, utilization, and protection of groundwater resources.
For the analysis of hydrochemistry in the Yellow River Basin, Hu et.al first reported chemical and hydrochemical data [17]. Zhang et al. collected 10 water samples from 10 locations to discuss the weathering process and chemical flux of the Yellow River [18]. Li et al. analyzed 14 water samples collected along the Yellow River and roughly estimated the contribution of silicate, carbonate, evaporation, and atmosphere to the hydrochemistry of the Yellow River [19]. Zhang et al. used the forward model to calculate the silicate weathering of the Yellow River and its CO2 consumption rate [20]. Liu used multivariate statistics and geochemical modeling to study the evolution of water chemistry in the upper reaches of the Yellow River irrigation area [21]. The lower reaches of the Yellow River (the Henan section) are an important industrial and grain base in Henan Province. Over the past 20 years, due to economic development and increasing human demands, human activities in the middle and lower reaches of the Yellow River (the Henan section) have intensified, resulting in an interaction between natural factors and intense human activities that is causing an evolution in groundwater chemical characteristics in this region [22,23]. Yellow River water is transformed into groundwater through lateral seepage. Under the influence of rock weathering, evaporation and concentration, and human activities, the hydrochemical types of groundwater along the coast are changing [24,25]. On the right bank of the Yellow River, there are loess hills, piedmont alluvial plains, flood plains, Yellow River floodplains, and others, and Yellow River floodplain tourist areas, villages, farms, ecological parks, and so on. Compared with the left bank, human activities are more frequent. In addition, the 7.20 flood in Zhengzhou in 2021 attracted widespread attention. Due to the complex hydrogeological conditions on the right bank of the Yellow River, little is known about the impact of natural and human factors on groundwater chemistry. In this context, it is necessary to understand the hydrochemical evolution and water quality of the Yellow River and groundwater in the middle and lower reaches of the Yellow River in Henan.
The change in groundwater quality on the right bank of the middle and lower reaches of the Yellow River is related to the evaluation, utilization, and planning of local water resources and plays a very important role in the sustainable use of groundwater [26,27,28]. What are the main sources and mechanisms of groundwater pollution in the Yellow River Basin? In recent years, research on the middle and lower reaches of the Yellow River has mainly focused on water quality protection, water resource utilization, and changes in water and sediment [29,30,31]. There are few studies on the main sources and mechanisms of groundwater pollution on the right bank. The Yellow River in the right section of the Yellow River is overhanging the river, which has close interaction with groundwater. It is an important research topic to study the influence of the surface water of the Yellow River on groundwater and pay attention to the hydrogeochemical evolution process and genesis of the groundwater, which is of great importance to protect groundwater and the ecological environment along the Yellow River. This study selected the Taohuayu to Huayuankou section on the right bank of the Yellow River as the study area. Based on the four groundwater quality test datasets for 1990, 2011, 2020, and 2021, the hydrochemical evolution characteristics and causes of shallow groundwater in the middle and lower reaches of the Yellow River were examined. The main objectives of this study were to (1) analyse the spatial distribution of hydrochemical characteristics of shallow groundwater in the study area, (2) reveal the main sources of groundwater pollution and the evolution characteristics in the study area in recent years, and (3) explore the formation mechanism of main groundwater pollution sources. The results of this study can provide a scientific basis for the rational exploitation and utilization of groundwater and the protection of water resources in this area [32].

2. Date and Materials
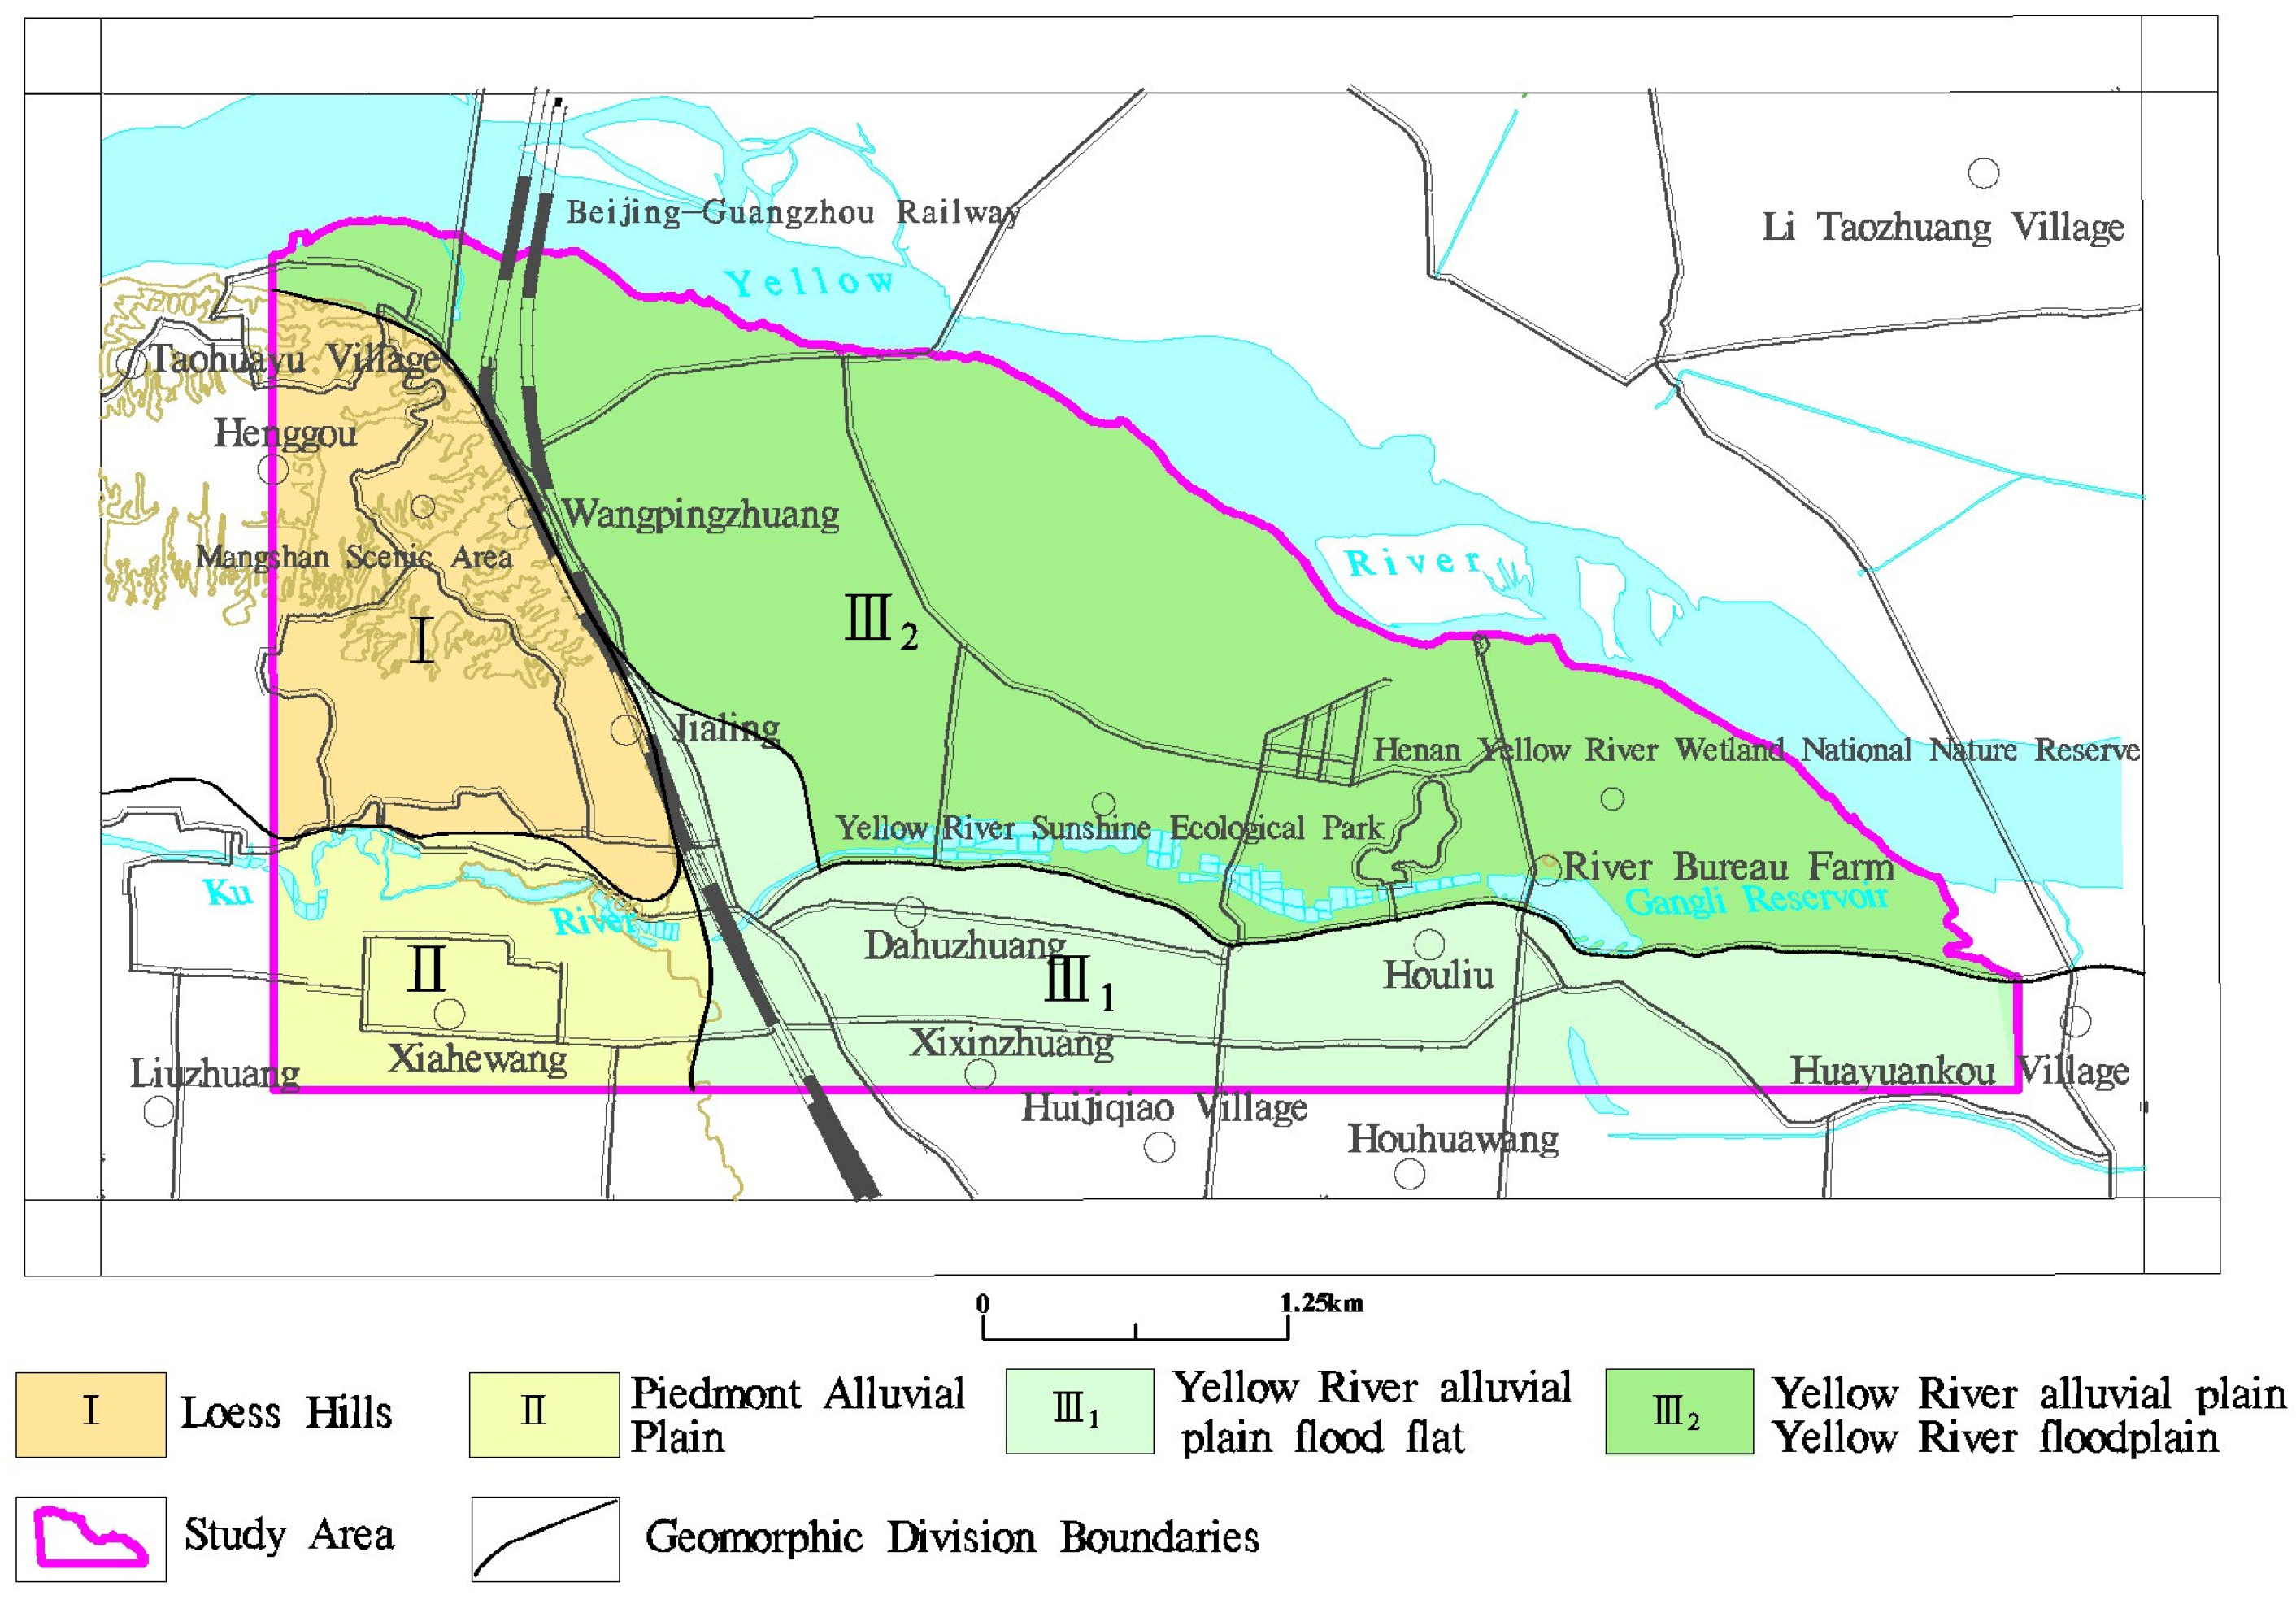
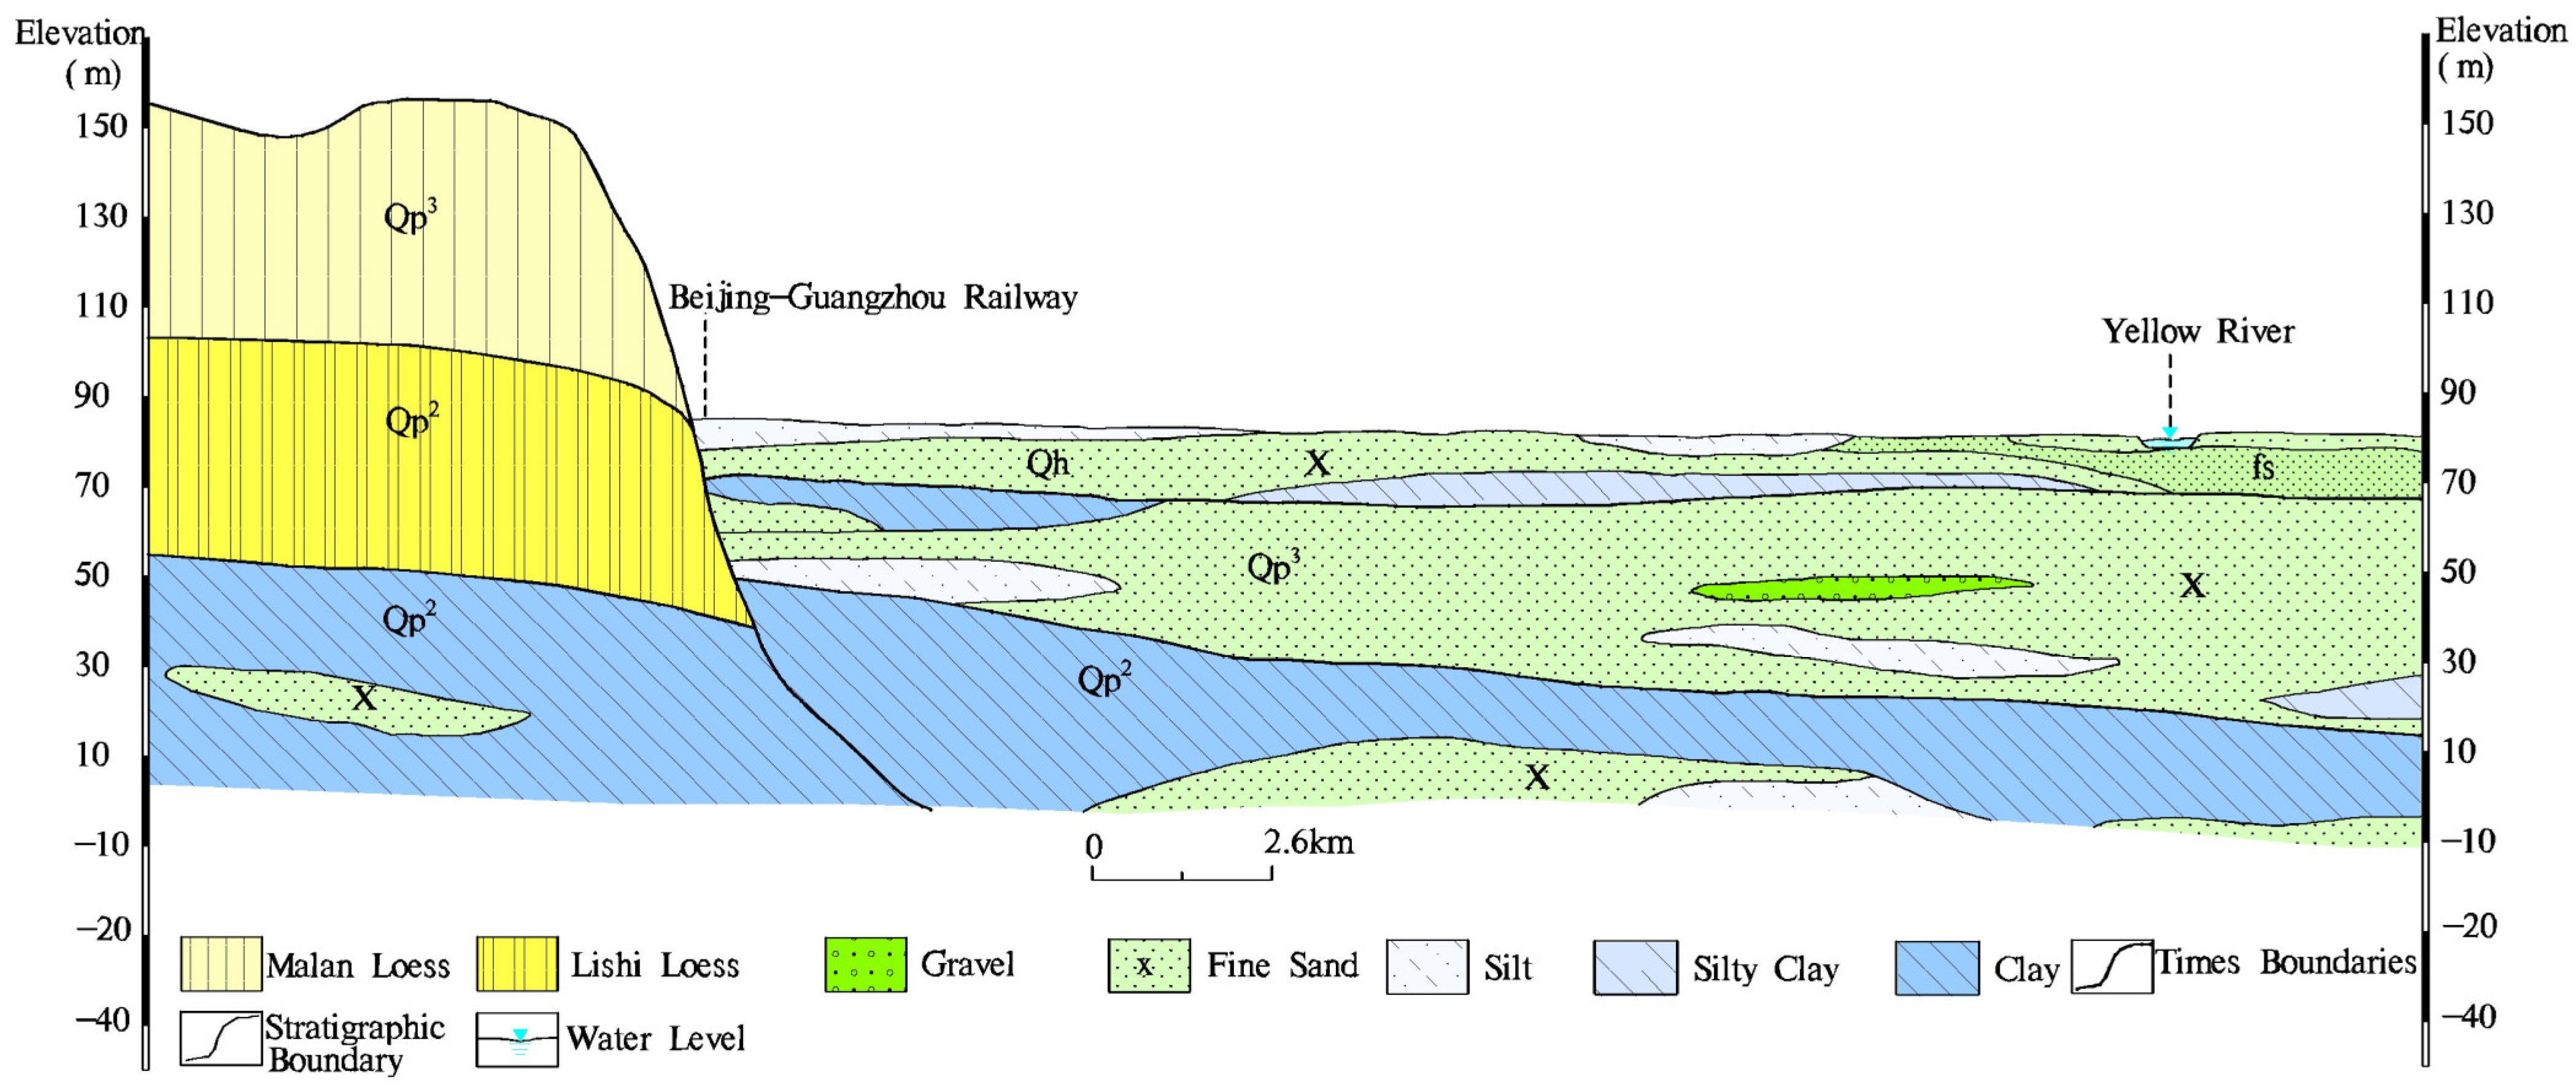
2.1. Study Area

The overall terrain in the study area is high in the west and low in the east. The landform is bounded by the Beijing–Guangzhou Railway. To the west of the railway and to the north of the Ku River are the loess hills, and to the south of the Ku River is a piedmont alluvial plain, and east of the railway is the Yellow River alluvial plain (Figure 1). The topography of the loess hilly area is sharply undulated, with gullies in the edge area, for which the cutting depth can reach 15~20 m. The gully valley is mostly of the wide-mouthed ‘U’ type. The gully is mainly composed of multilevel vertical gully walls where various microgeomorphology types, such as loess columns and steep loess slopes, have developed. The surface layer is Malan loess covered by the upper Pleistocene, and the underlying middle Pleistocene is brown-red loess. The loess is rich in carbonate and the soil layer is deep and loose, and the soil erosion is serious, resulting in strong mechanical erosion and chemical weathering. The topography of the piedmont alluvial plain is relatively flat with small fluctuations. The surface is upper Pleistocene alluvial silt with a thickness of approximately 20 m, and the lower part is middle Pleistocene alluvial silty clay, silt, and silty sand. The Yellow River alluvial plain can be further divided into flood plains and Yellow River floodplains. The floodplain (II1) is distributed south of the Yellow River embankment with flat terrain. The surface layer is composed of a fine sand layer of late Holocene aeolian facies and silty clay of alluvial facies. The lower part is 1~3 layers of brownish-grey dark grey silt and silty clay interbedded layers. The Yellow River floodplain (II2) is distributed north of the Yellow River levee. The floodplain width is generally 0.5~2 km. The floodplain contains a series of distribution ditches; the larger parts of the ditches have a width of 100~500 m and a depth of approximately 0.5~1.5 m. Rivers erode a large amount of sediment from the upstream and deposit it in the downstream. The sediment in the Yellow River alluvial plain is rich in carbonate, and carbonate weathering will provide Ca2+ and Mg2+ for river water. The study area is monsoon climate, carbonate weathering is sensitive to monsoon climate, and the weathering rate is affected by seasonal changes.
The aquifers distributed in different geomorphic units in the study area present different characteristics. The shallow aquifer floor of the loess hills is buried at a depth of 80~100 m and is mainly composed of silt and silty clay of the Quaternary Upper Pleistocene and Middle Pleistocene. The infiltration of atmospheric rainfall forms the upper layer of stagnant water. There is no stable phreatic surface, and the water abundance is weak. The burial depth of the shallow aquifer bottom plate in the piedmont alluvial plain is 60~80 m, which is mainly composed of a fine sand layer of upper Pleistocene silt and middle Pleistocene alluvial facies. The water-bearing sand layer is generally 3~5 layers, and the single layer thickness is not large, approximately 5~8 m. The groundwater table depth is 35~40 m, and it has obvious pressure-bearing properties.
The bottom plate of the shallow aquifer in the Yellow River alluvial plain is 60~80 m deep and is composed of Holocene and Upper Pleistocene sand layers. The thickness of the sand layer is 20~55 m, and the thickness gradually increases from west to east. There are generally 2~3 layers of medium-fine sand layers in the vertical direction; the upper sand layer is relatively coarse, and the lower sand layer is relatively fine (Figure 2). Shallow groundwater is closely related to the hydraulics of the Yellow River. The aquifer is strongly recharged by the lateral seepage of the Yellow River. The aquifer particles are coarse, thick, and water-rich, and are the key research objects in this paper. The shallow groundwater in the study area is mainly recharged by atmospheric precipitation, canal infiltration, irrigation infiltration, and lateral infiltration of the Yellow River, and phreatic evaporation and artificial mining are the main discharge methods. The hydrochemical characteristics of shallow groundwater in plain are affected by climatic conditions (rainfall, evaporation, etc.), groundwater circulation conditions, aquifer medium, and human activities.

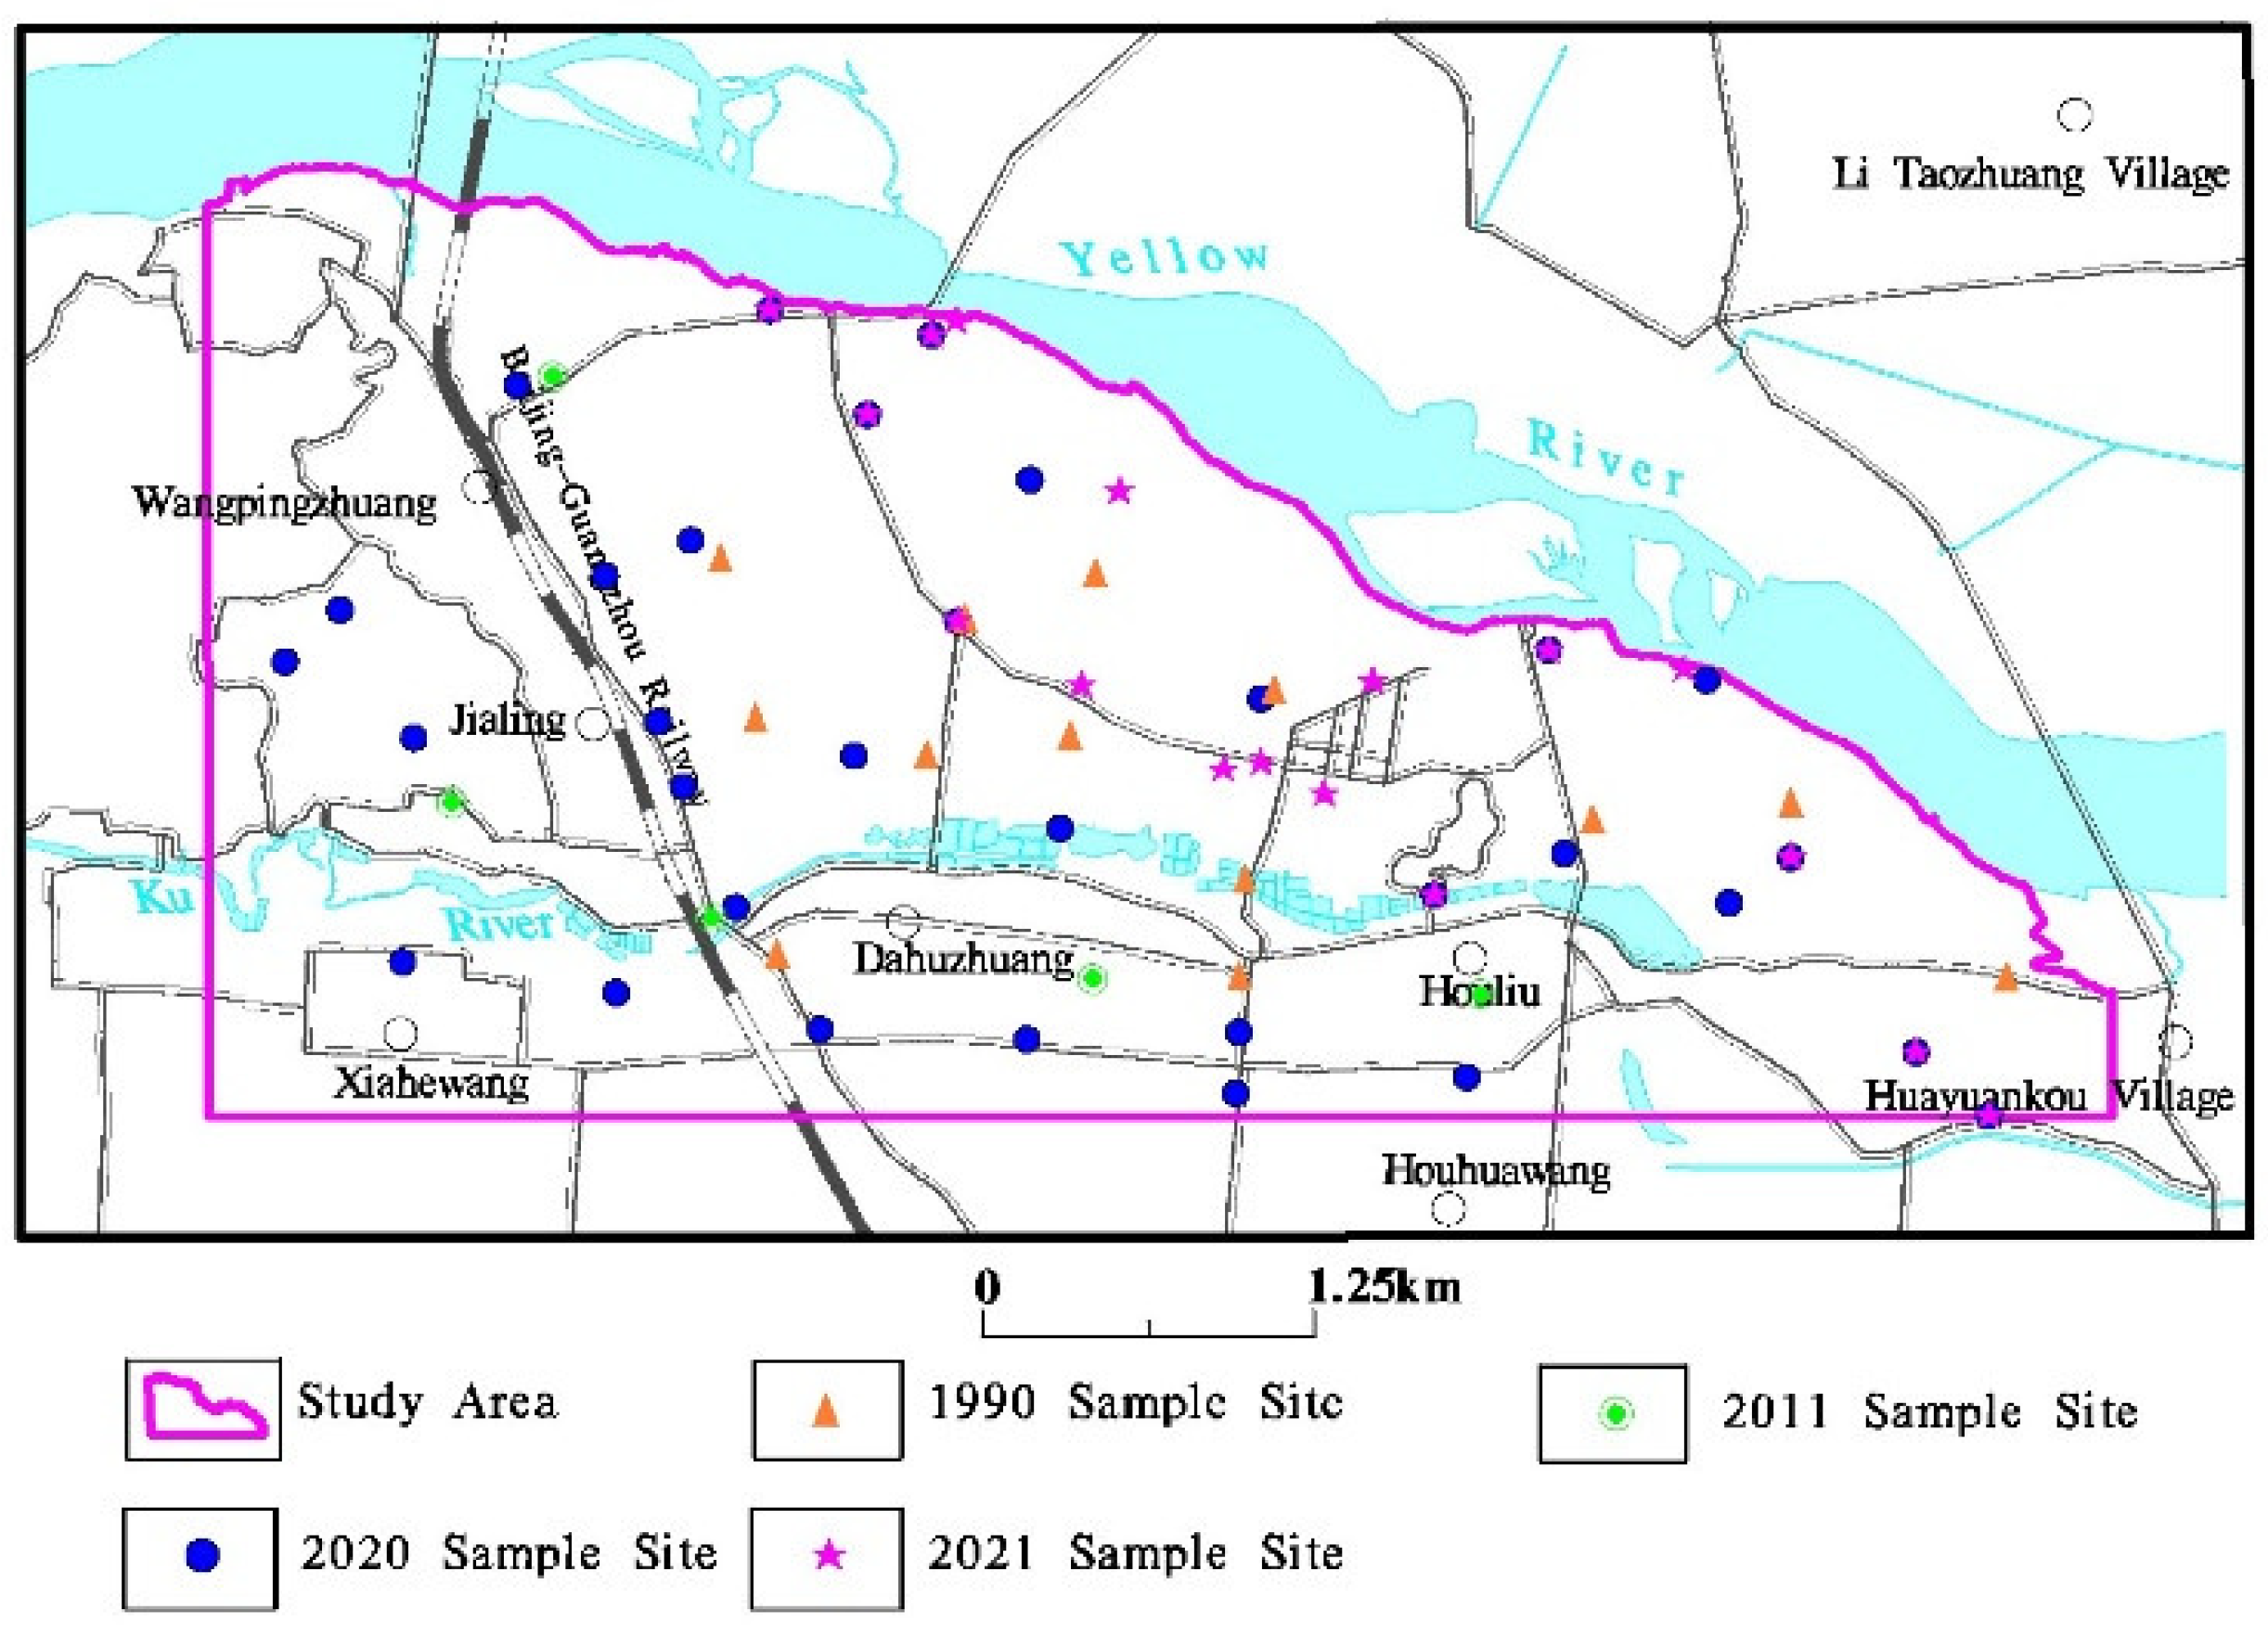
2.2. Sample Collection

Combined with the actual situation of the study area, 13 shallow groundwater samples in 1990, 5 in 2011, 32 in 2020 and 17 in 2021 were obtained, as were 1 Ku River sample (1990) and 2 Yellow River samples (1 in 1990 and 1 in 2020). The spatial distribution of the groundwater samples is shown in Figure 3. All samples were from civil wells with a depth of less than 60 m and were defined as shallow aquifer groundwater from the perspective of aquifer classification. The test items included pH, K+, Na+, Ca2+, Mg2+, HCO3, SO42−, Cl, TDS, NH4+, NO3, NO2, and As. The As and NH4+ test indexes were separately sampled. The water samples of As were added with hydrochloric acid for acidification protection, and the water samples of NH4+ were added with sulfuric acid for acidification protection. Samples were stored in 0~4 °C incubator after field sampling and transferred to the laboratory for testing within 24 h. The pH was measured by portable pH tester. K+, Na+, Ca2+, and Mg2+ were determined by inductively coupled plasma emission spectrometer (iCAP6300). HCO3 was determined by titration. SO42−, Cl, and NO3 were determined by ion chromatograph (ICS-1100). TDS was determined by an analytical balance (ME204E). NH4+ and NO2 were determined by a UV-Vis spectrophotometer (UV). As was determined by double channel atomic fluorescence spectrometer (BAF-2000). In the test of groundwater samples, adding 10% parallel samples for quality control, the error of all repeated samples was less than 5%.

2.3. Methods

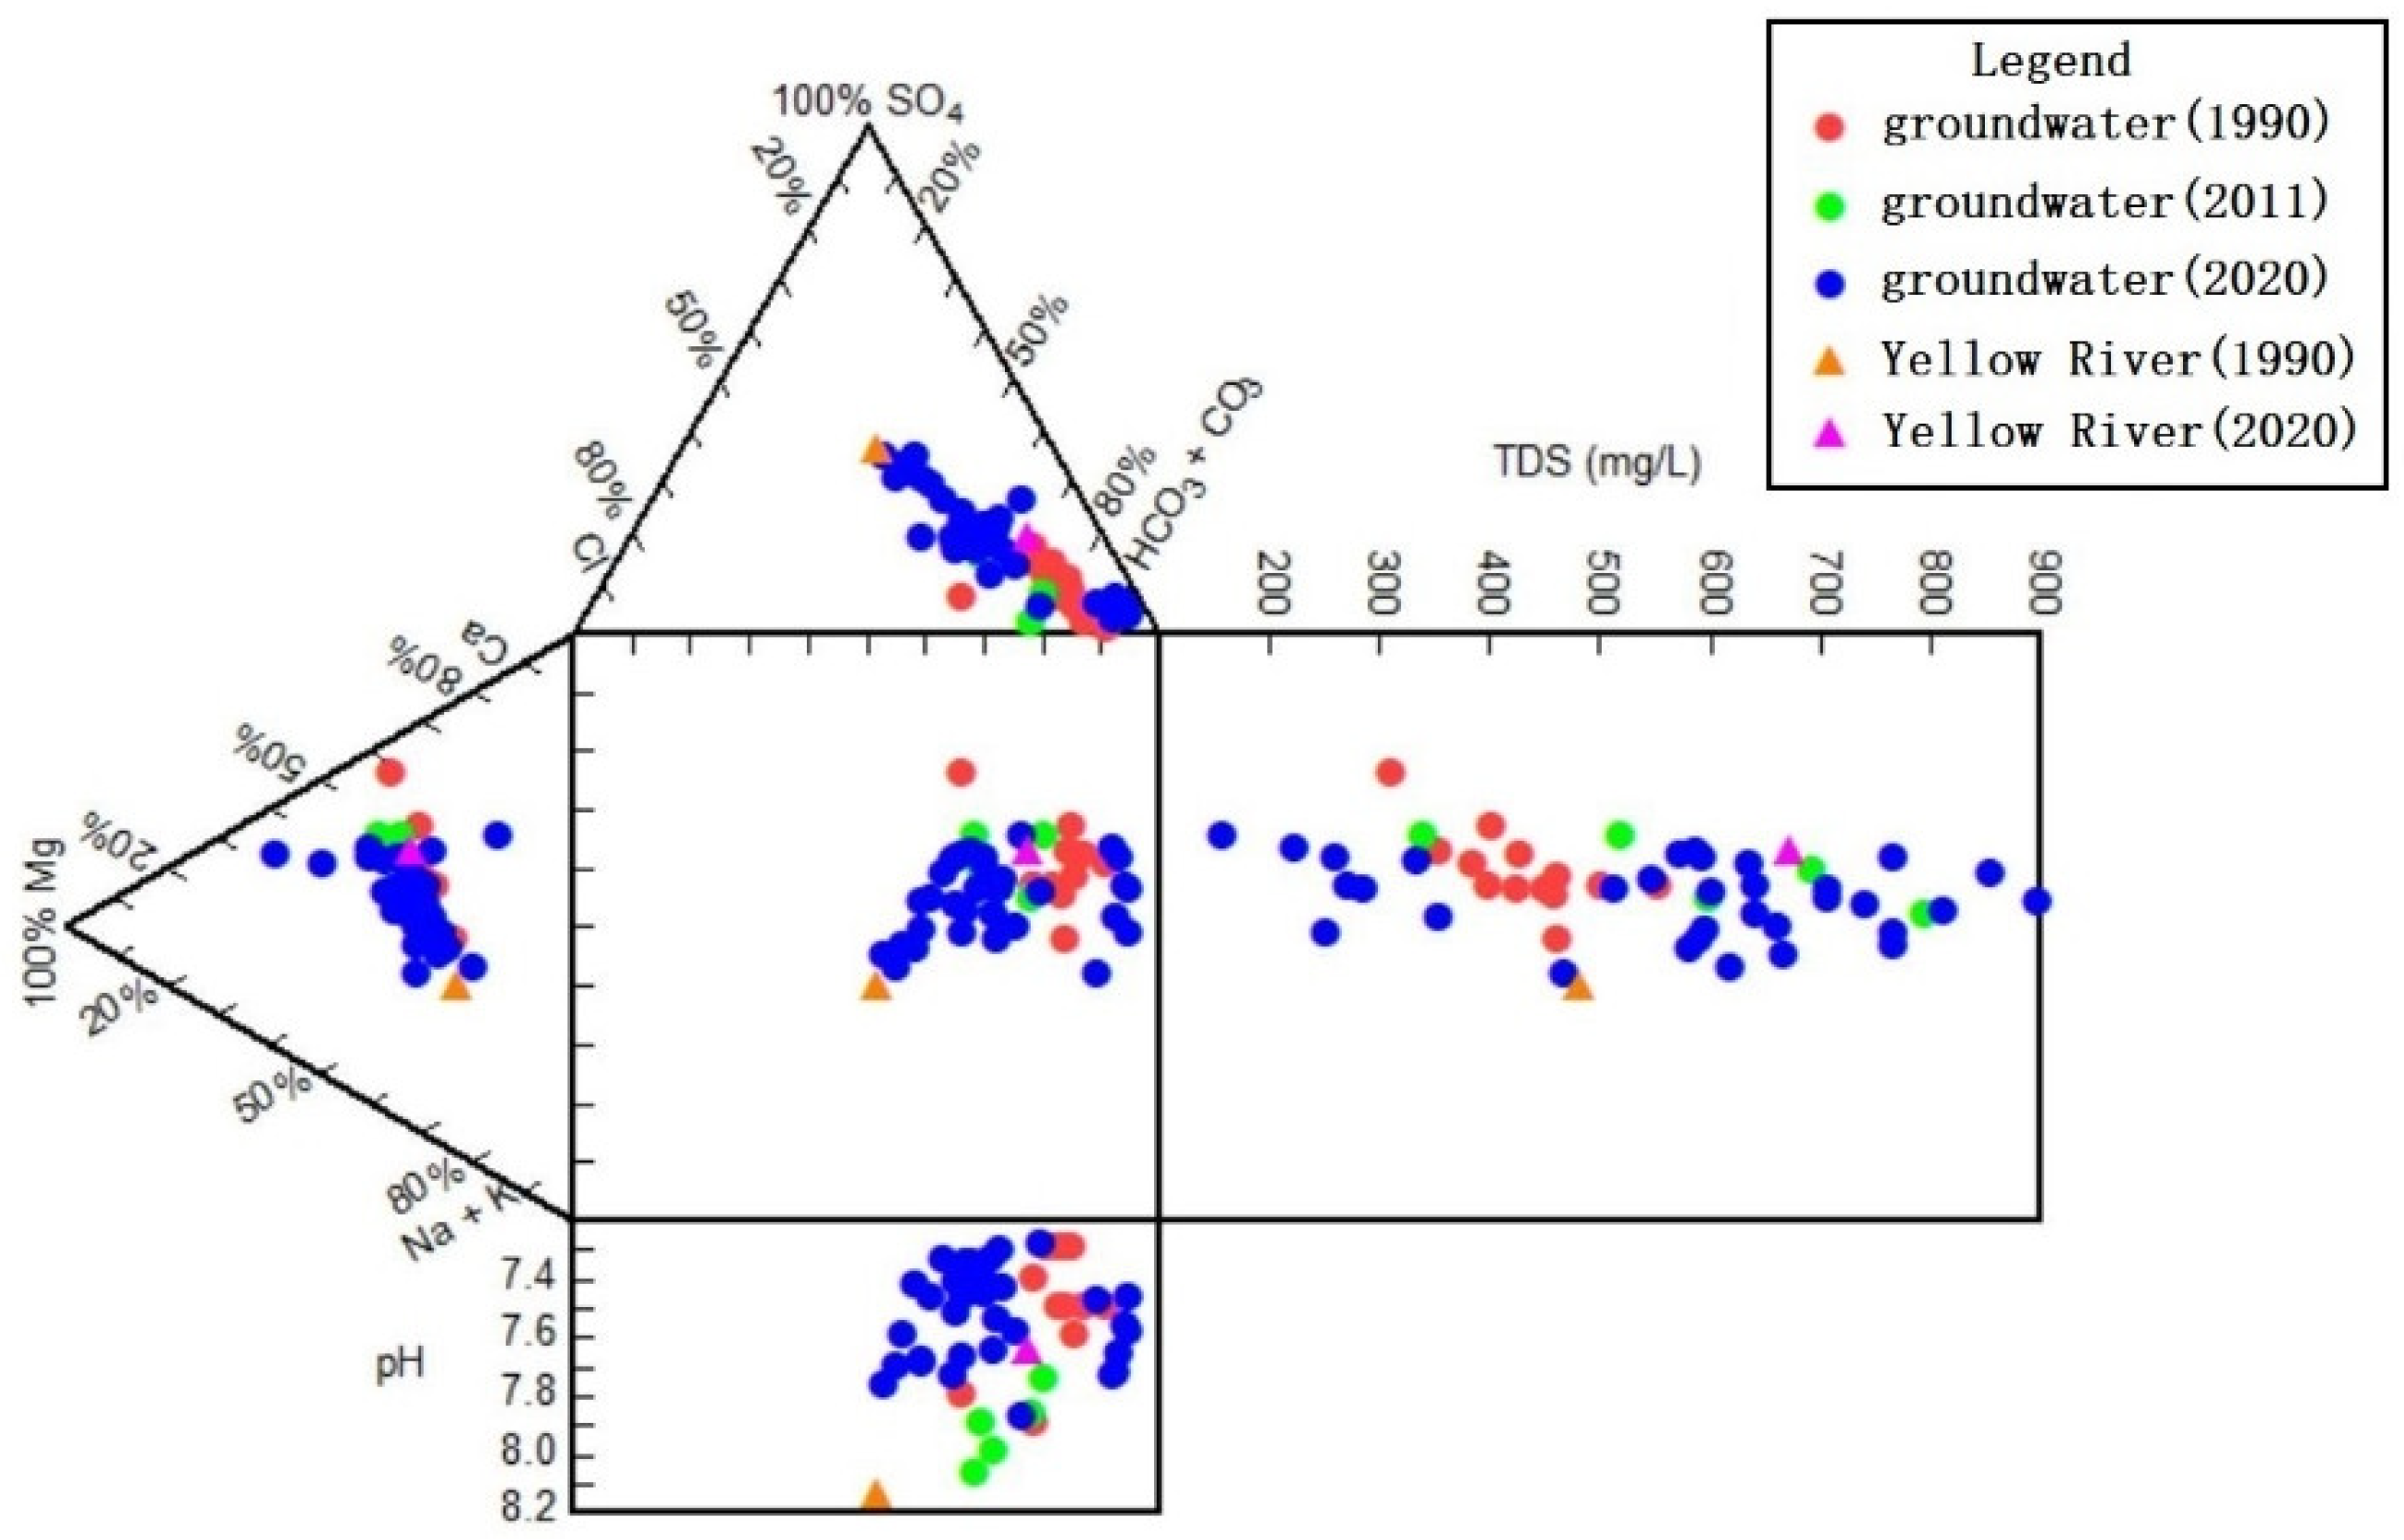
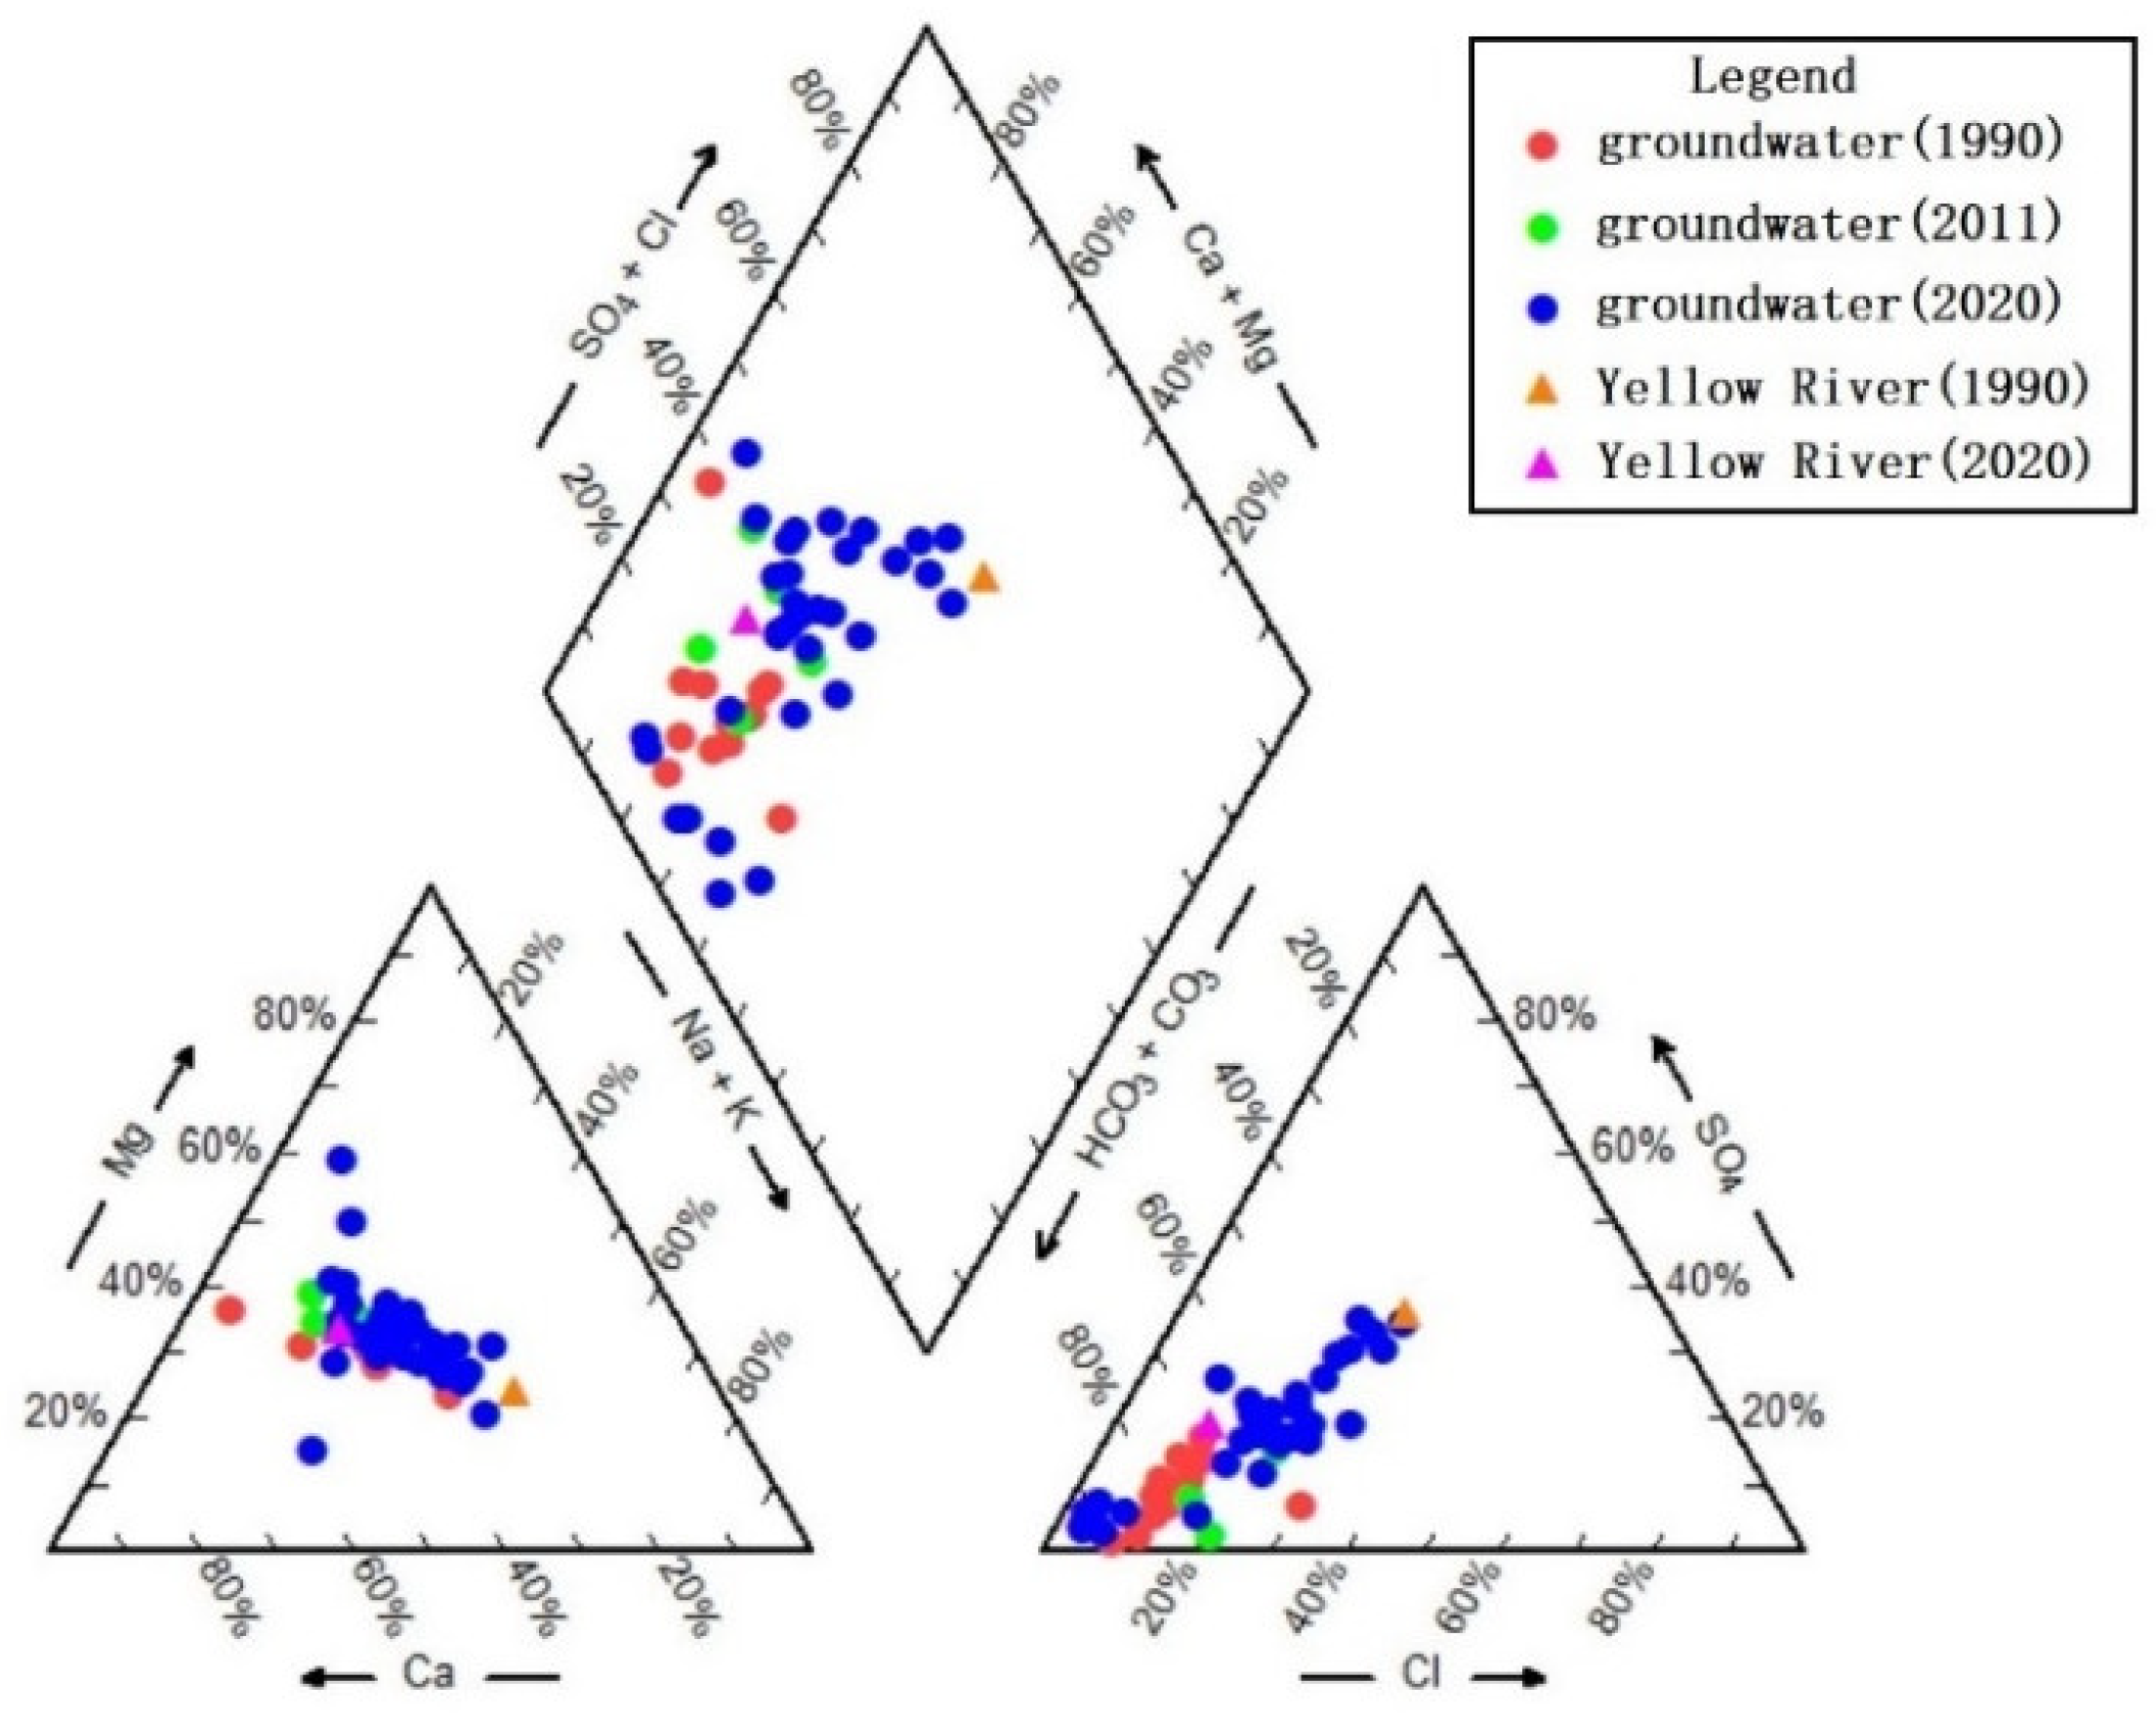
2.3.1. Piper Diagram

Piper diagrams are widely used to study groundwater chemical types and can simply and effectively reflect comprehensive information of water chemical types. The piper diagram is drawn with the main ions in water, indicating the composition proportion of water quality ions contained in the tested water sample and showing the water quality ions that play a major role in the water sample in the piper diagram, so as to obtain the water chemical type of the water sample, and determine which aquifer the water sample belongs to according to the obtained water chemical type, as well as whether the water sample is a single source water or mixed water.
The Piper diagram consists of three parts. The triangle below the left represents the relative mole fraction of cations, and the triangle below the right represents the relative mole fraction of anions [33]. The intersection point obtained by extending to the upper rhombus represents the relative content of anions and cations in water samples. The water quality ion information is represented in the two triangles at the bottom, and then an outer extension line is made along the outermost edge of the triangle to the upper diamond area. The two extension lines intersect at a point inside the upper diamond, and the intersection point is marked. That is, it can comprehensively represent the composition of water chemical components in water samples. Piper diagrams can intuitively show the characteristics of hydrochemical types of samples.

2.3.2. Durov Diagram

The Durov plot uses the equivalent concentration to calculate the percentage content, which is composed of three parts: the square projection area at the centre, the anion triangle plot at the left side of the square projection area, and the cation triangle plot above the square projection area [34]. To ensure the charge balance between anions and cations, the Durov diagram stipulates that the sum of the anions is 50%, the sum of cations is 50%, and the pH and TDS are increased, which are projected on the periphery of the square. The Durov diagram shows more characteristics of TDS and pH values on the basis of the Piper diagram.

2.3.3. Spatial Analysis

A geographic information system can use various spatial analysis methods to manage spatial data information and analyse and process the phenomenon and process of distribution in a certain region [35]. Spatial analysis uses computers to analyse digital maps to obtain and transmit spatial information. Spatial analysis has a wide range of applications, including water pollution monitoring, urban planning, flood disaster analysis, and topography analysis. The prevention and control of water environmental pollution involves a wide range of regions. In this paper, the water quality type and water quality index are combined with the regional position to obtain the spatial distribution characteristics of various water chemical types and the distribution of main ions in the study area. The spatial analysis method can show the enrichment characteristics and variation rules for different characteristic ions in the study area. At the same time, this method plays an important role in studying the evolution relationship between Yellow River water and regional groundwater.

3. Results

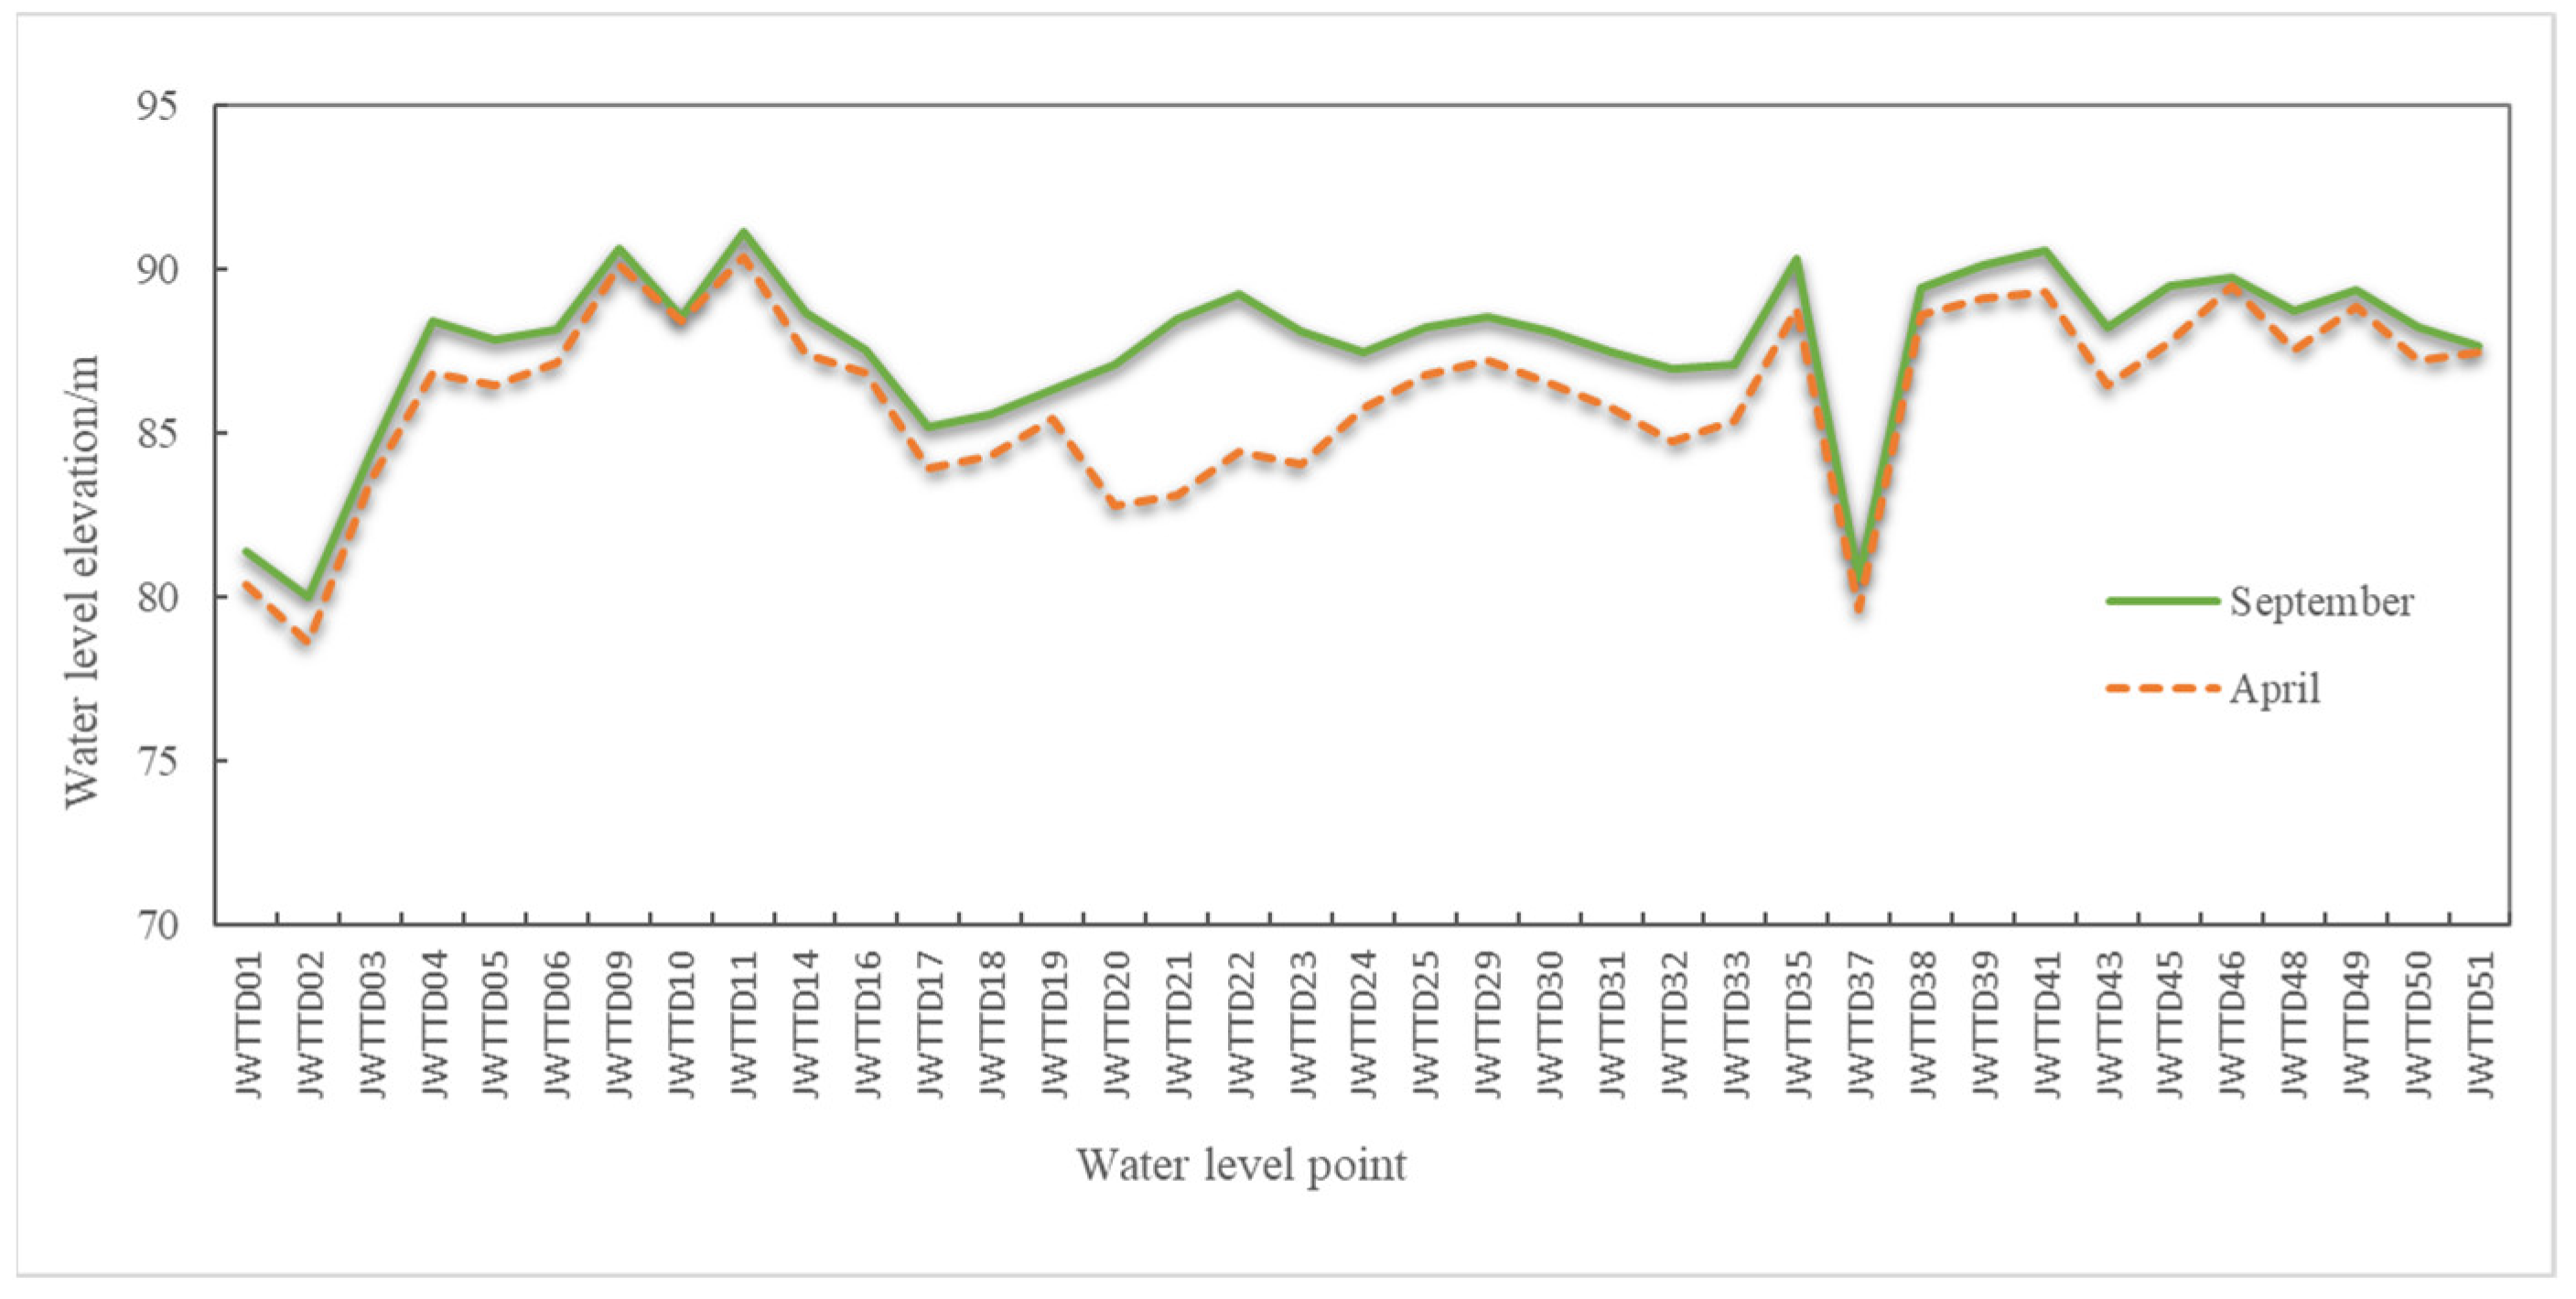
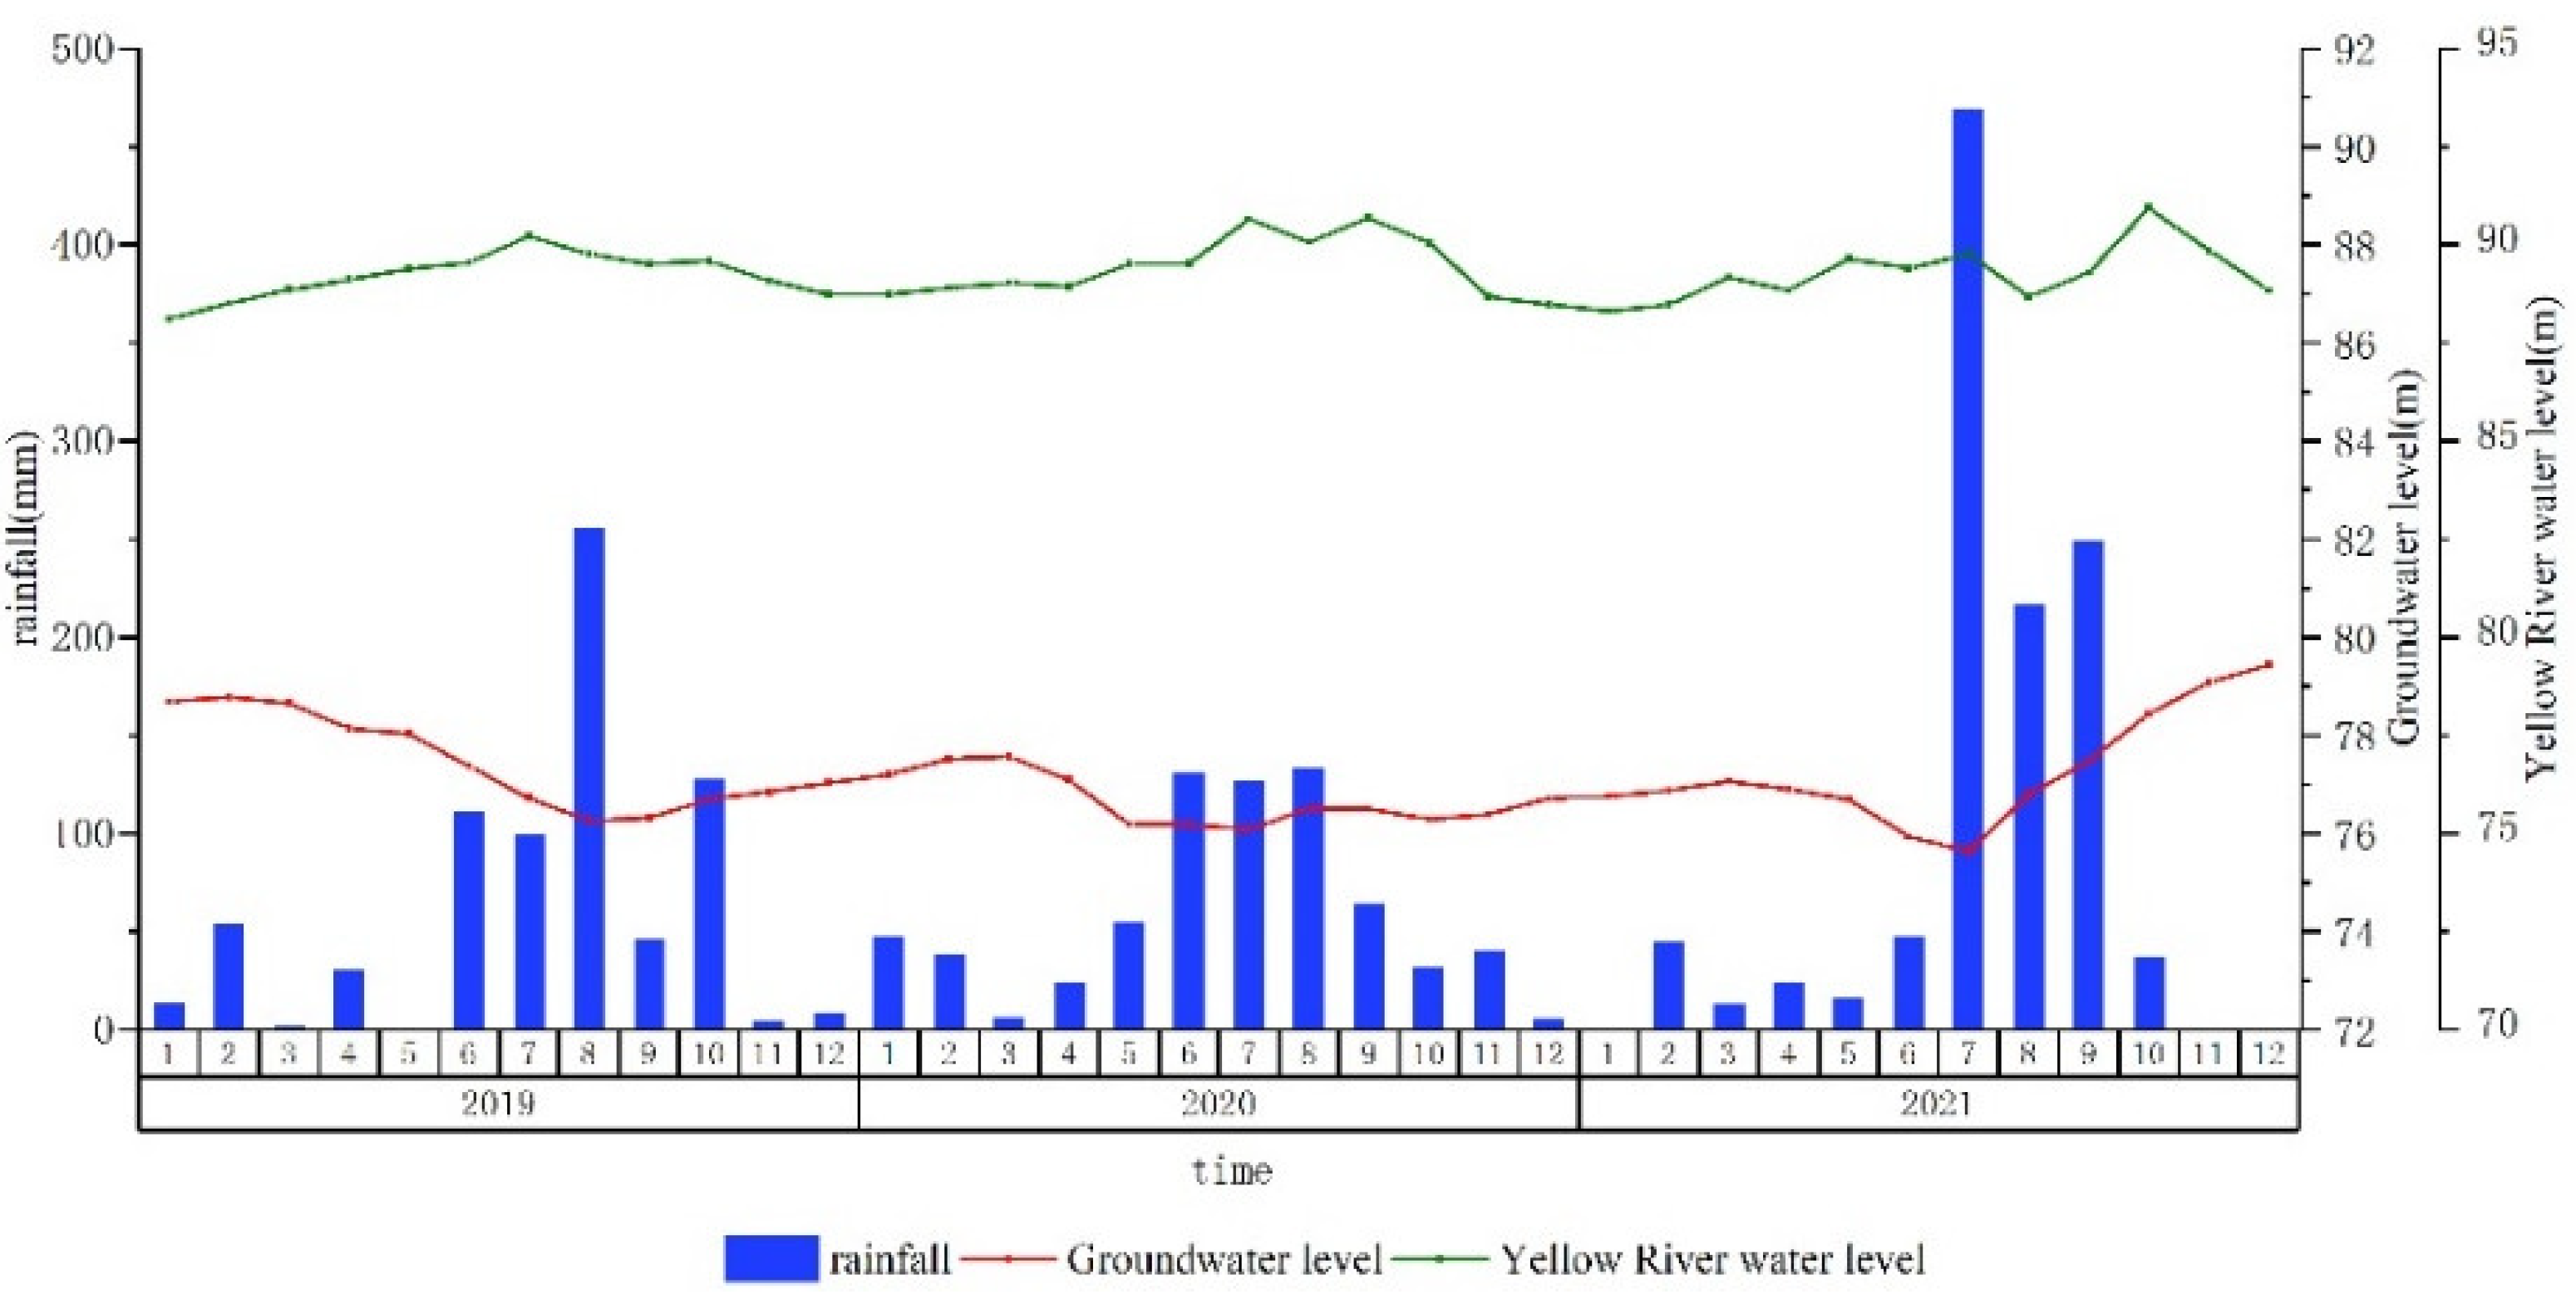
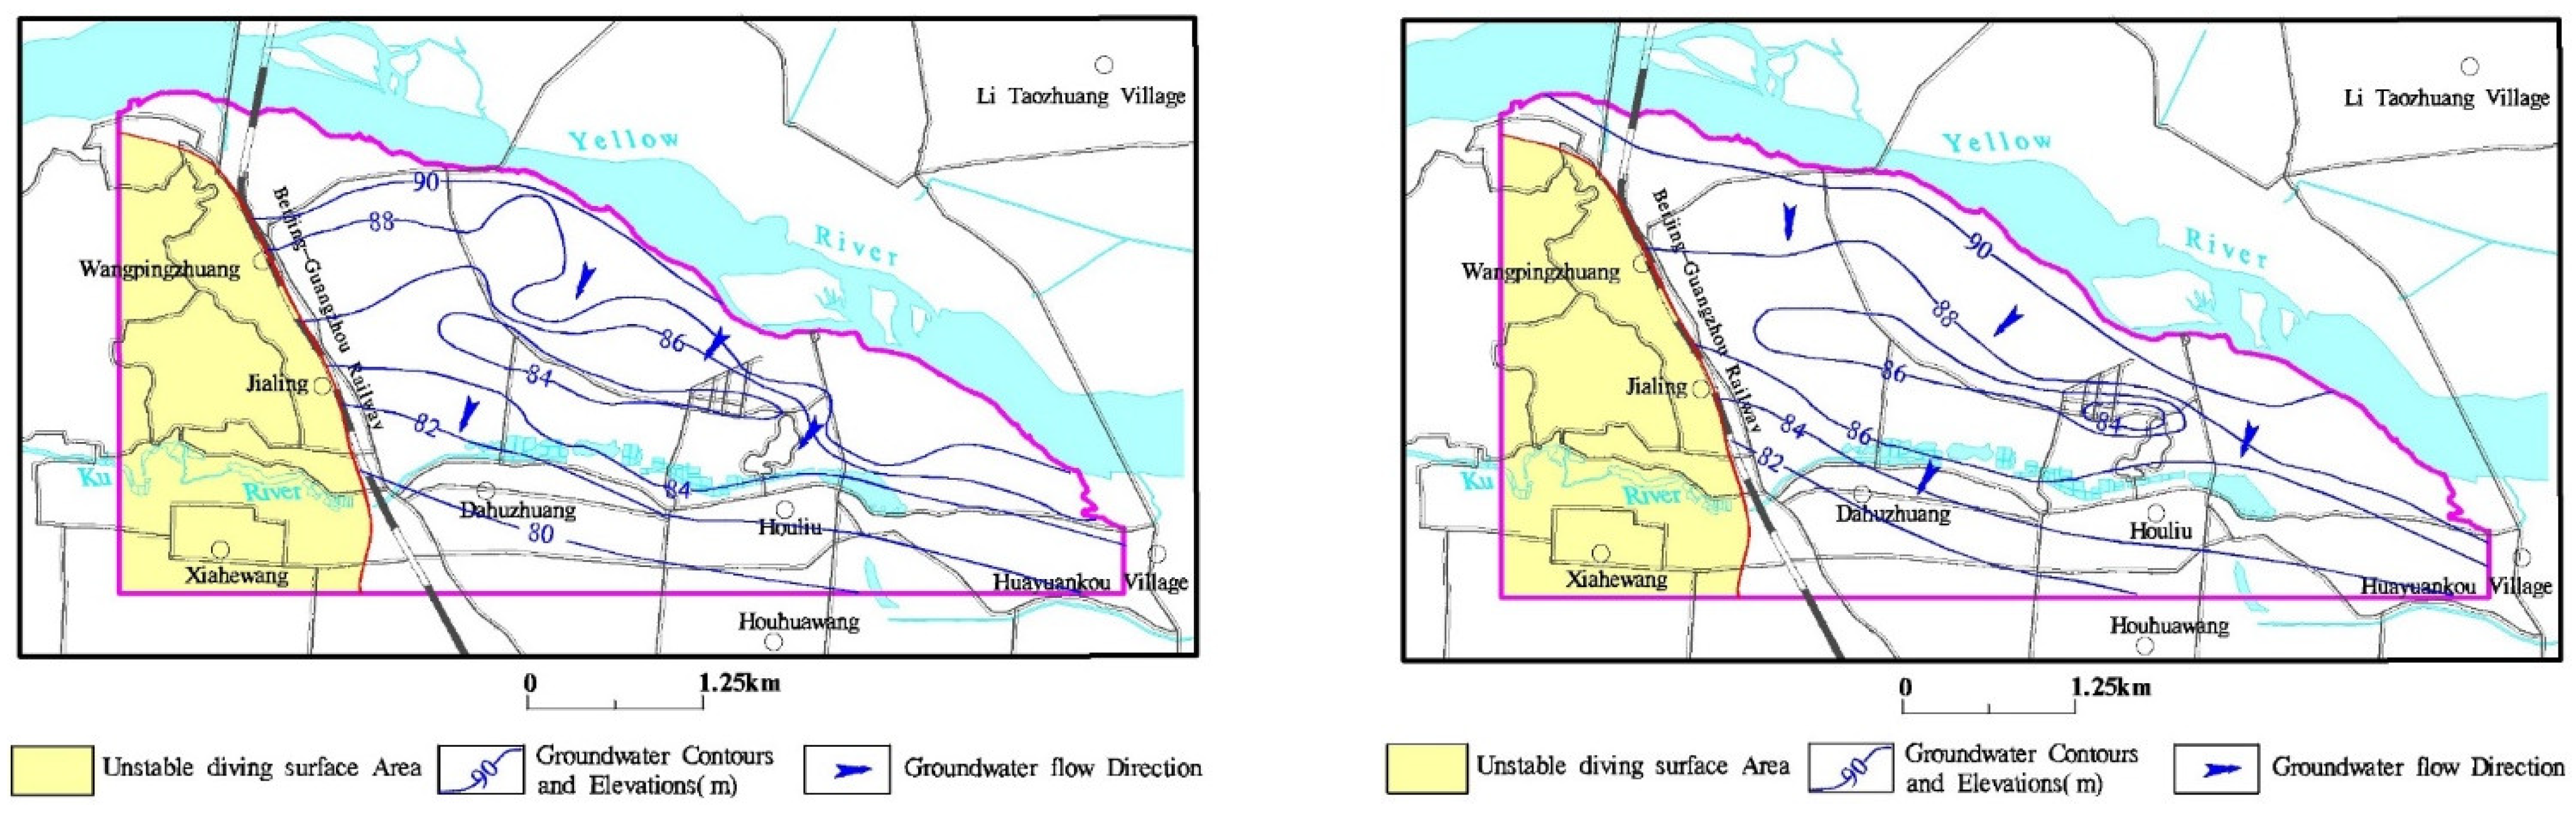
3.1. Change of Groundwater Levels

The direction of shallow groundwater runoff in this area is from north to south. The main recharge methods include lateral infiltration of the Yellow River, precipitation infiltration, irrigation recharge, etc. The discharge methods include mining, overflow, and lateral runoff discharge. The results of the groundwater level survey in the study area in April 2021 are shown in the left of Figure 4. The groundwater flow direction in the study area is from northeast to southwest. The groundwater depth is 4~16 m. The groundwater depth and hydraulic gradient gradually increase from northeast to southwest. The upstream hydraulic gradient is approximately 3.2‰, and the downstream hydraulic gradient is approximately 1.6‰. The groundwater drawdown funnel is formed around the water source exploitation well, and the groundwater gathers around the funnel. The groundwater contour becomes dense, and the hydraulic gradient is the largest at the funnel. The groundwater level of the study area in September after the July 20 rainstorm in Zhengzhou in 2021 is shown in the right of Figure 5. Compared with April, the flow direction of groundwater did not change in September. The groundwater depth is 4~16 m. The groundwater depth and hydraulic gradient increase gradually from northeast to southwest. The hydraulic gradient of groundwater near the Yellow River in the upper reaches is approximately 1.6‰. Along the direction of flow to the Ku River, the groundwater level is approximately 2 m higher than that in April, and the hydraulic gradient is 12.8‰. The water level in April represents the water level in the dry season of the study area, and the water level in September represents the water level in the wet season. The changes of the wet and dry water levels at different water level monitoring points are shown in Figure 5. The water level elevations of all monitoring points fluctuate between 75 m and 95 m. The water level in the wet season is higher than that in the dry season.
The fluctuation of the water level of the Yellow River in the study area is proportional to the rainfall. With the increase in rainfall in the wet season, the water level of the Yellow River rises. In the dry season, the water level of the Yellow River decreases, and the groundwater level is lower than that of the Yellow River. The farther away from the Yellow River the groundwater is, the greater the water level difference (Figure 6).

3.2. Characteristics of Groundwater Quality

3.2.1. Results of Statistical Analysis

The chemical data of shallow groundwater and surface water in the study area from 1990 to 2021 were statistically analysed (Table 1). The results showed that compared with 1990, the HCO3 in the Yellow River water increased significantly in 2020, changing from 166.6 mg/L to 452 mg/L and the pH value decreased slightly, changing from 8.15 to 7.66. The groundwater in the study area was weakly alkaline, the TDS was 156~1250 mg/L, and there was no obvious fluctuation in each year. Except for two sample points in 2021, the groundwater quality met the III standard (≤1000 mg/L). The anions in groundwater were mainly HCO3, and Na+ in cations was the most dominant ion. The contents of Ca2+ and Mg2+ were relatively equal. Compared with 1990, the SO42− content in groundwater has generally increased in the last 30 years, and even reached four times by 2021. The increase in SO42− was mainly due to the influence of human activities, a large number of industrial wastewaters and domestic sewage in some areas, and the infiltration of farm breeding waste into shallow groundwater. In the past three decades, a number of fish pond farms have been developed in the study area, resulting in the increase in SO42− in groundwater in some areas.

3.2.2. Characteristics of Groundwater Chemical Types

The Piper diagram represents the relative concentration of chemical components in groundwater. The Durov diagram shows the characteristics of the TDS and pH values on the basis of the Piper diagram [36]. AQQA software was used to draw the Piper diagram (Figure 7) and the Durov diagram (Figure 8) of the hydrochemical types of groundwater in the study area. The hydrochemical components of groundwater and Yellow River water are shown in Figure 9. These figures show that the TDS of groundwater is low and basically meets the Grade III standard for groundwater quality (1000 mg/L). Most of the cation sinks of groundwater are in the middle position of the lower left triangle. In 1990 and 2011, the anion sinks of the samples were in the lower left of the lower right triangle, and were, namely, bicarbonate water. In 2020, some of the anions in the samples were in the middle position, and the contents of SO42− and Cl were high.
The chemical types of shallow groundwater in 1990 and 2011 were single, mainly HCO3-Na·Ca·Mg and HCO3-Na·Ca. HCO3-Na·Ca type water was distributed in the southwestern part of the study area, and HCO3-Na·Ca·Mg type water was distributed in the north-eastern part of the Yellow River. In 2020, the chemical types of groundwater in the study area became more complicated and increased, and HCO3·SO4-Ca·Mg·Na and HCO3·SO4·Cl-Ca·Mg·Na types were added. The anions were still dominated by HCO3, and the contents of SO42− and Cl increased locally. Spatially, the contents of HCO3 and Mg2+ were lower as they were closer to the water of the Yellow River, while the contents of SO42−, Cl and Na+ were opposite, and the closer they were to the water of the Yellow River, the higher they were. The local groundwater types along the Yellow River were HCO3·SO4·Cl-Na·Ca·Mg, HCO3·Cl-Na·Ca·Mg, HCO3·SO4-Na·Ca, and HCO3·SO4·Cl-Na·Ca (Figure 10).

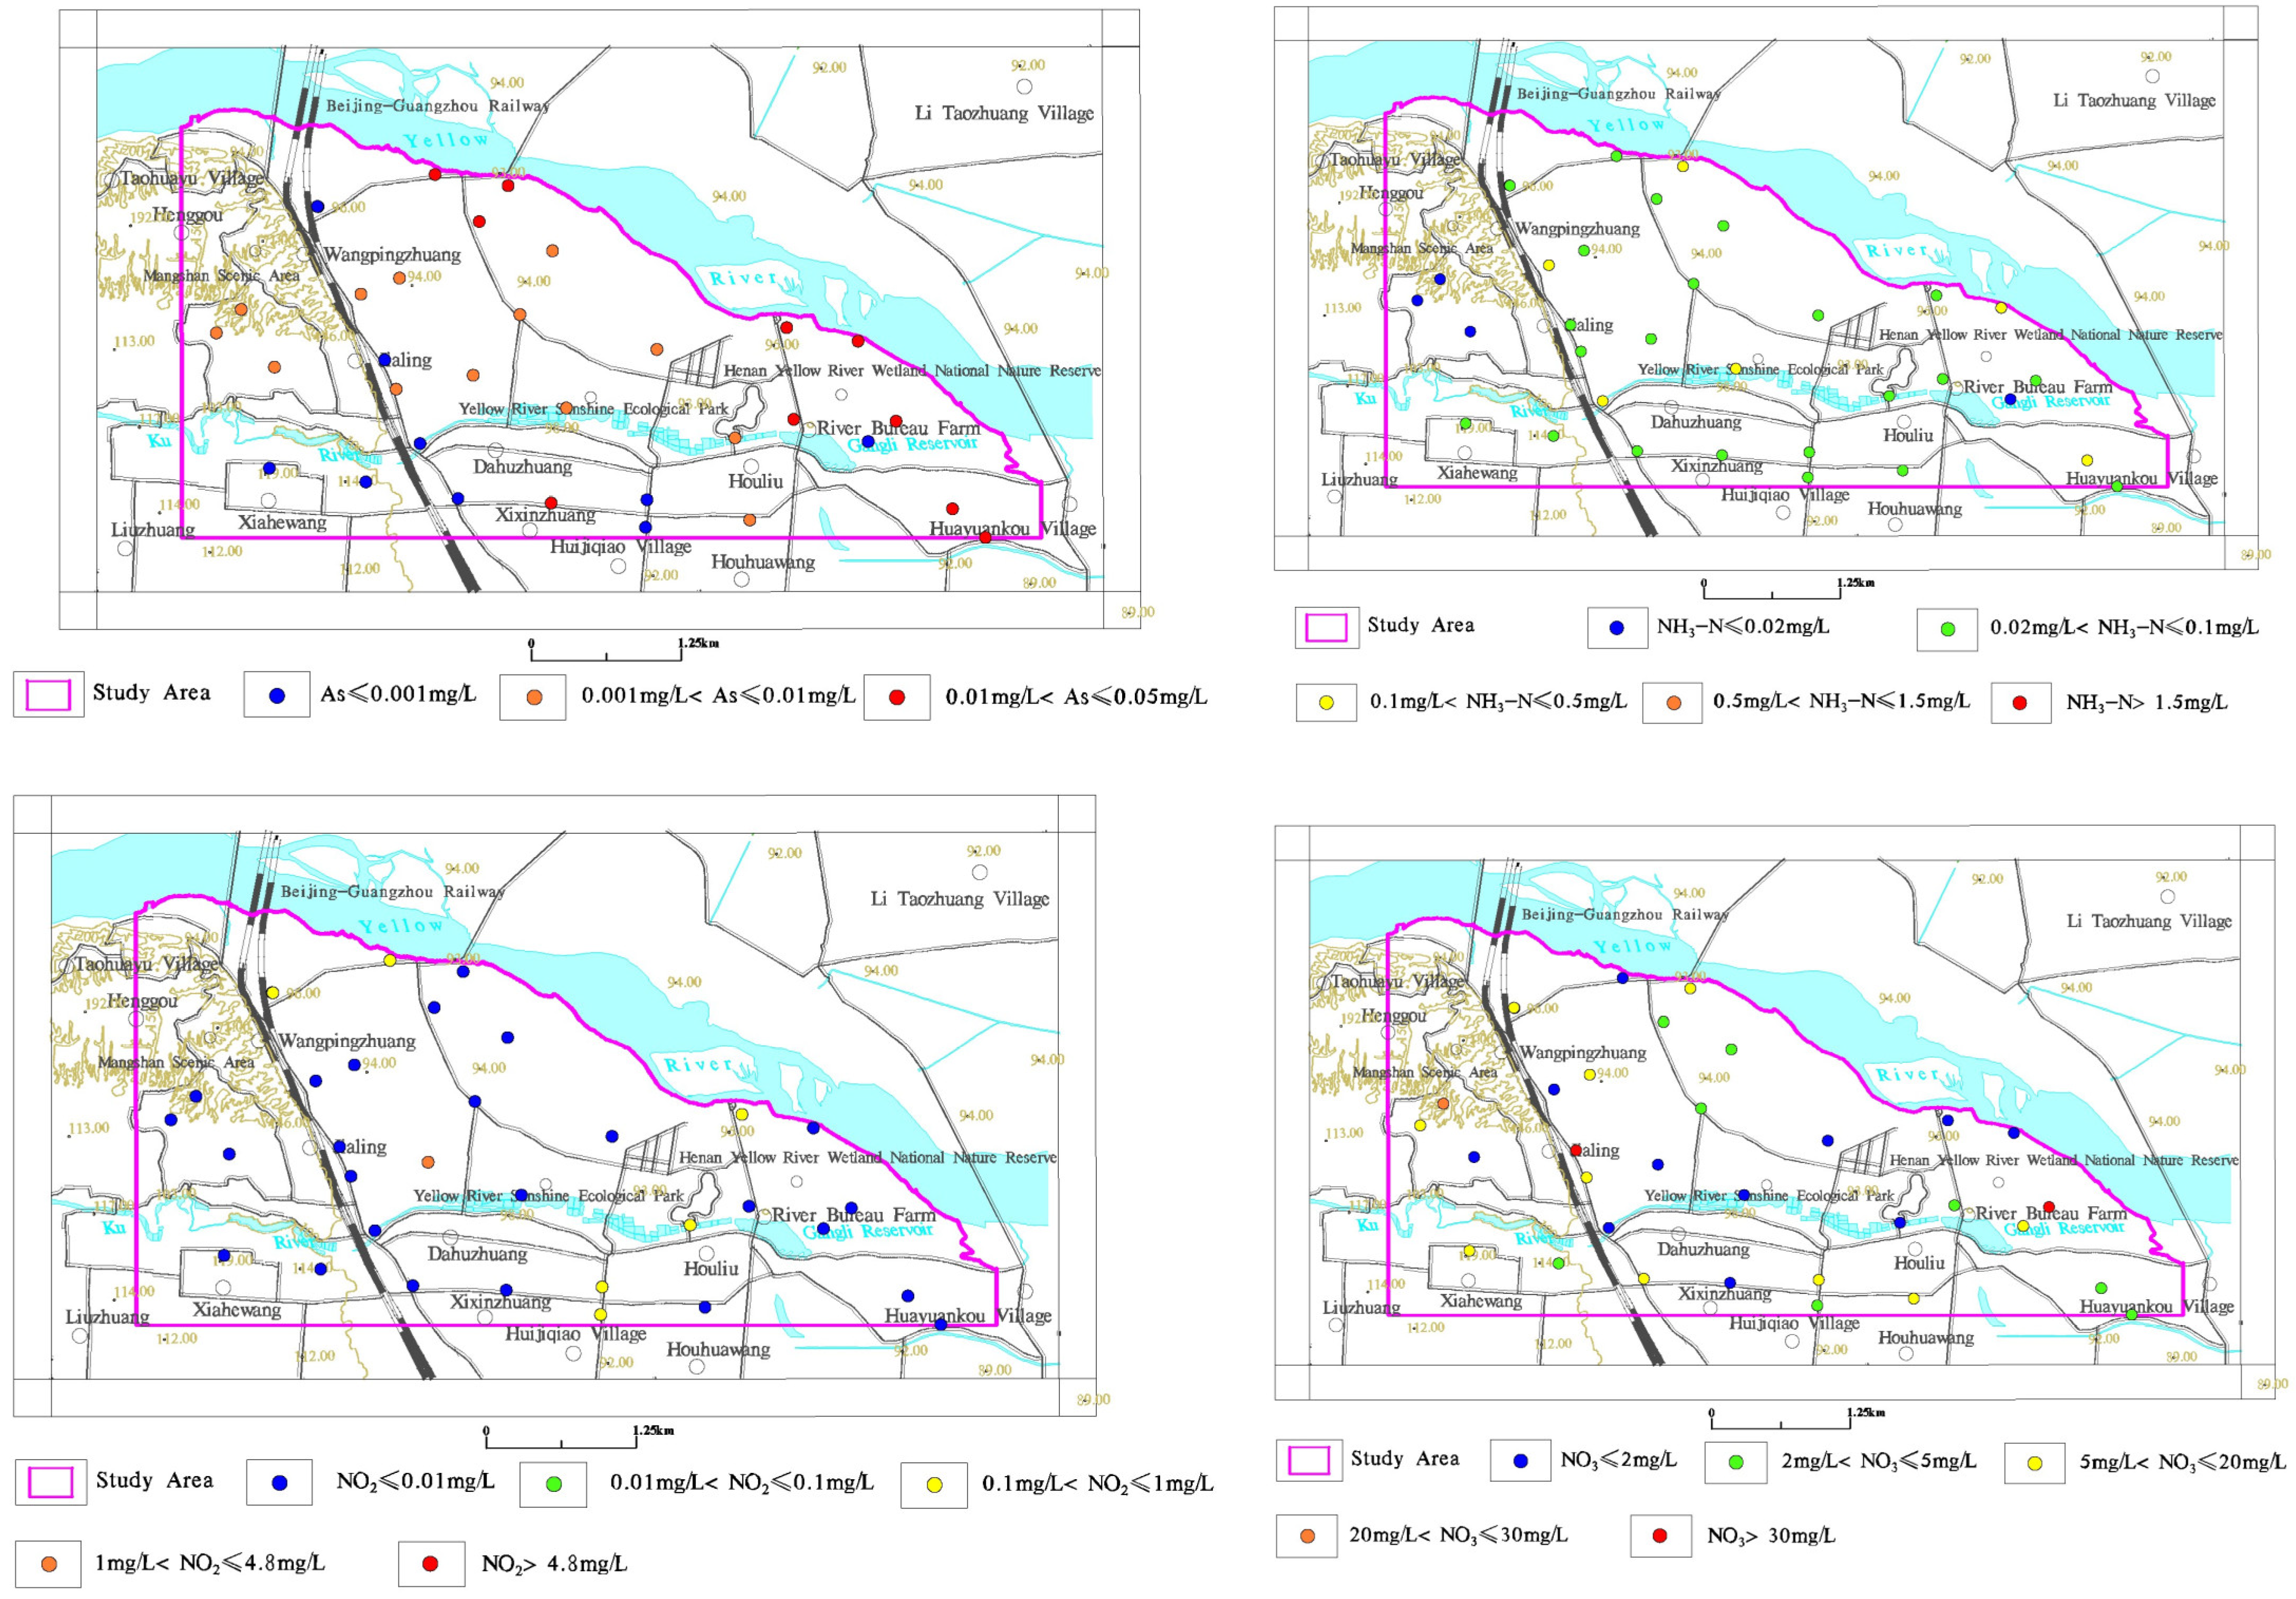
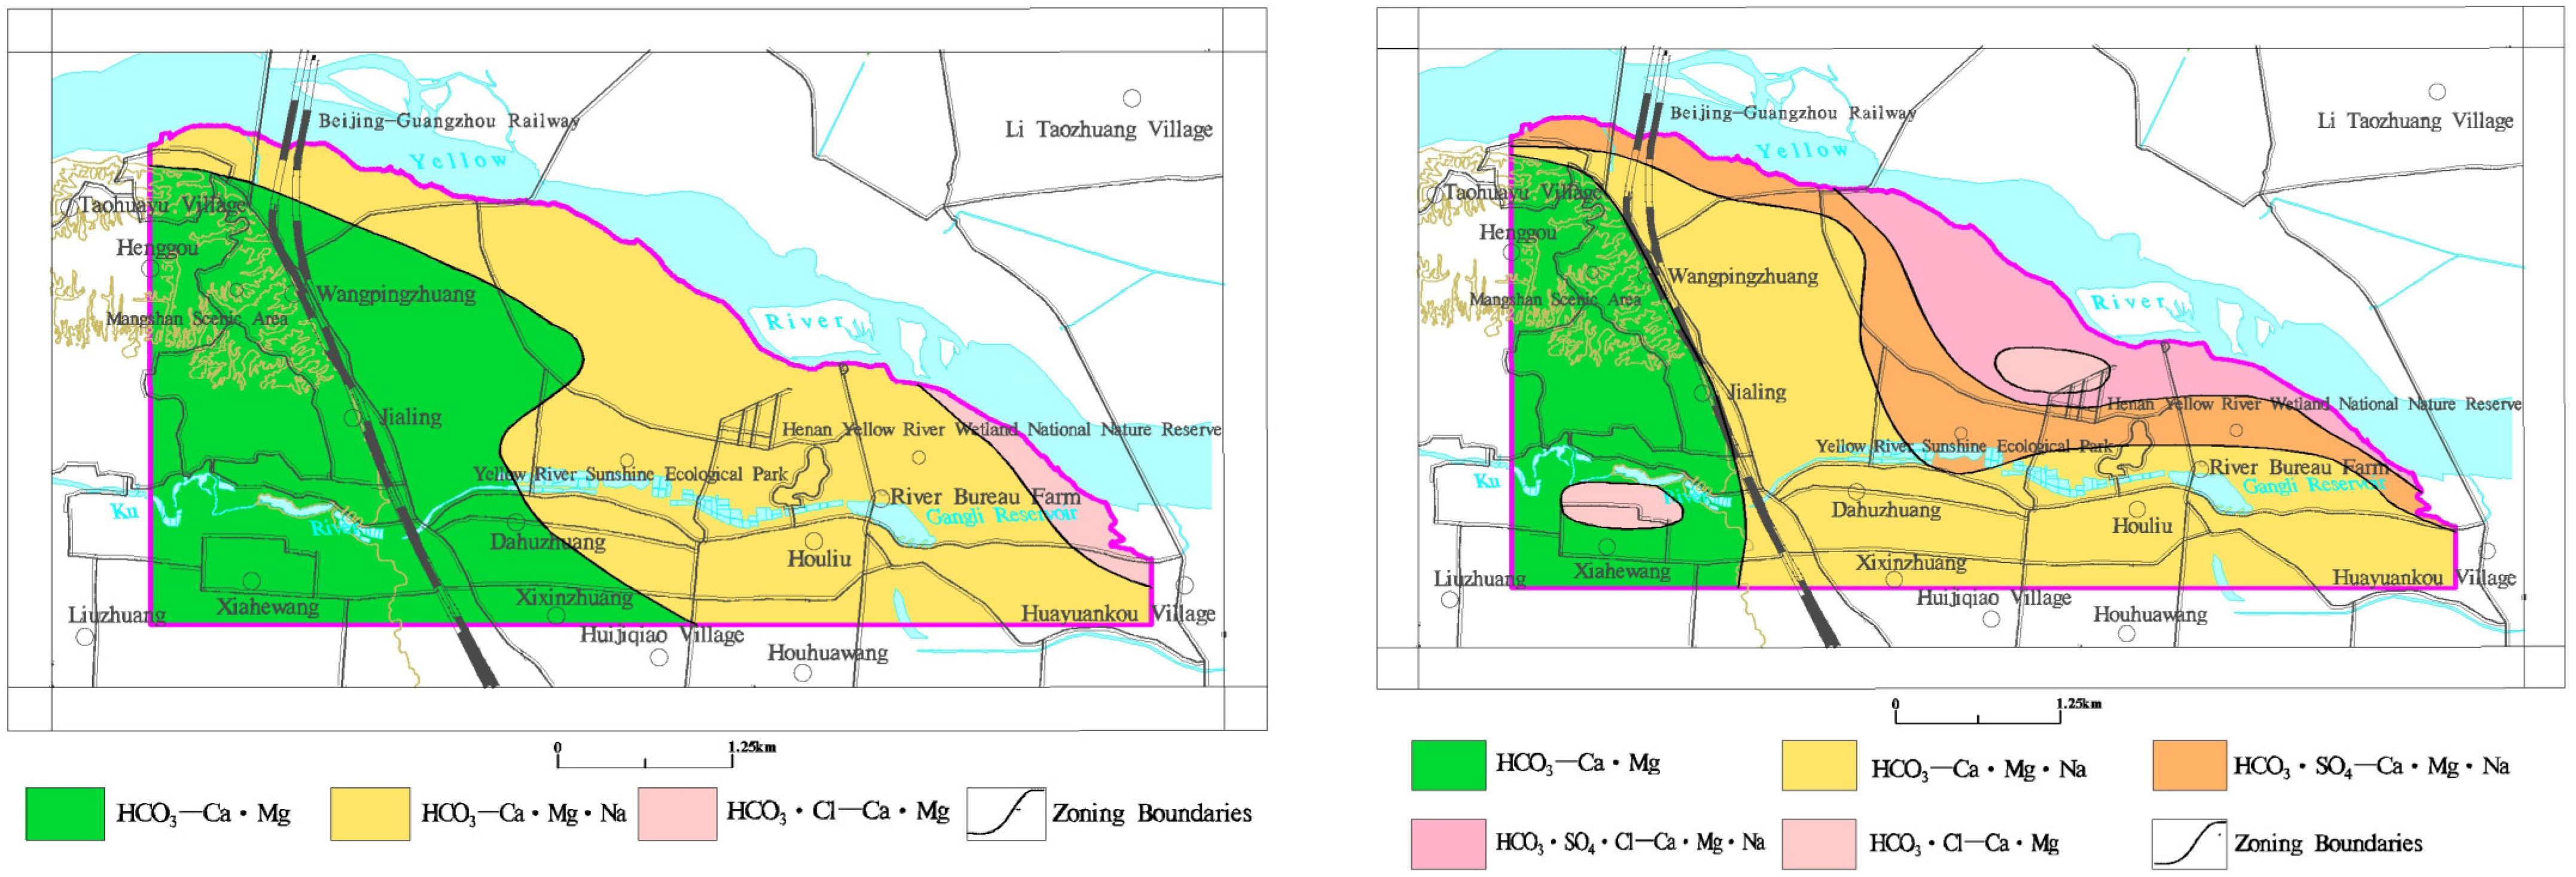
3.2.3. Spatial Distribution Characteristics of Typical Indicators

Arsenic and “three nitrogen” in shallow groundwater in the study area exceeded the standard. Arsenic, nitrate, nitrite, and ammonia nitrogen were selected to analyse their concentration distribution characteristics (Figure 11). In 2020, the excessive points of arsenic (>0.01 mg/L) in groundwater were distributed in lakes in the Yellow River Wetland Park and Houliubei in Huiji District. The excessive points of three nitrogen were distributed in irregular spots. The excessive points of nitrate (>20 mg/L) were distributed at the intersections of Jiangshan Road, Lixihe West Street, and Huagang Road in Huiji District. The excessive points of nitrite were distributed at the intersections of Qunying Road and Taoyuan Road in Huiji District. In 2020, compared with 1990 and 2010, the nitrate content overall increased, the nitrite content overall decreased, and the ammonia nitrogen content overall decreased.

3.3. Study of the Chemical Causes of Groundwater

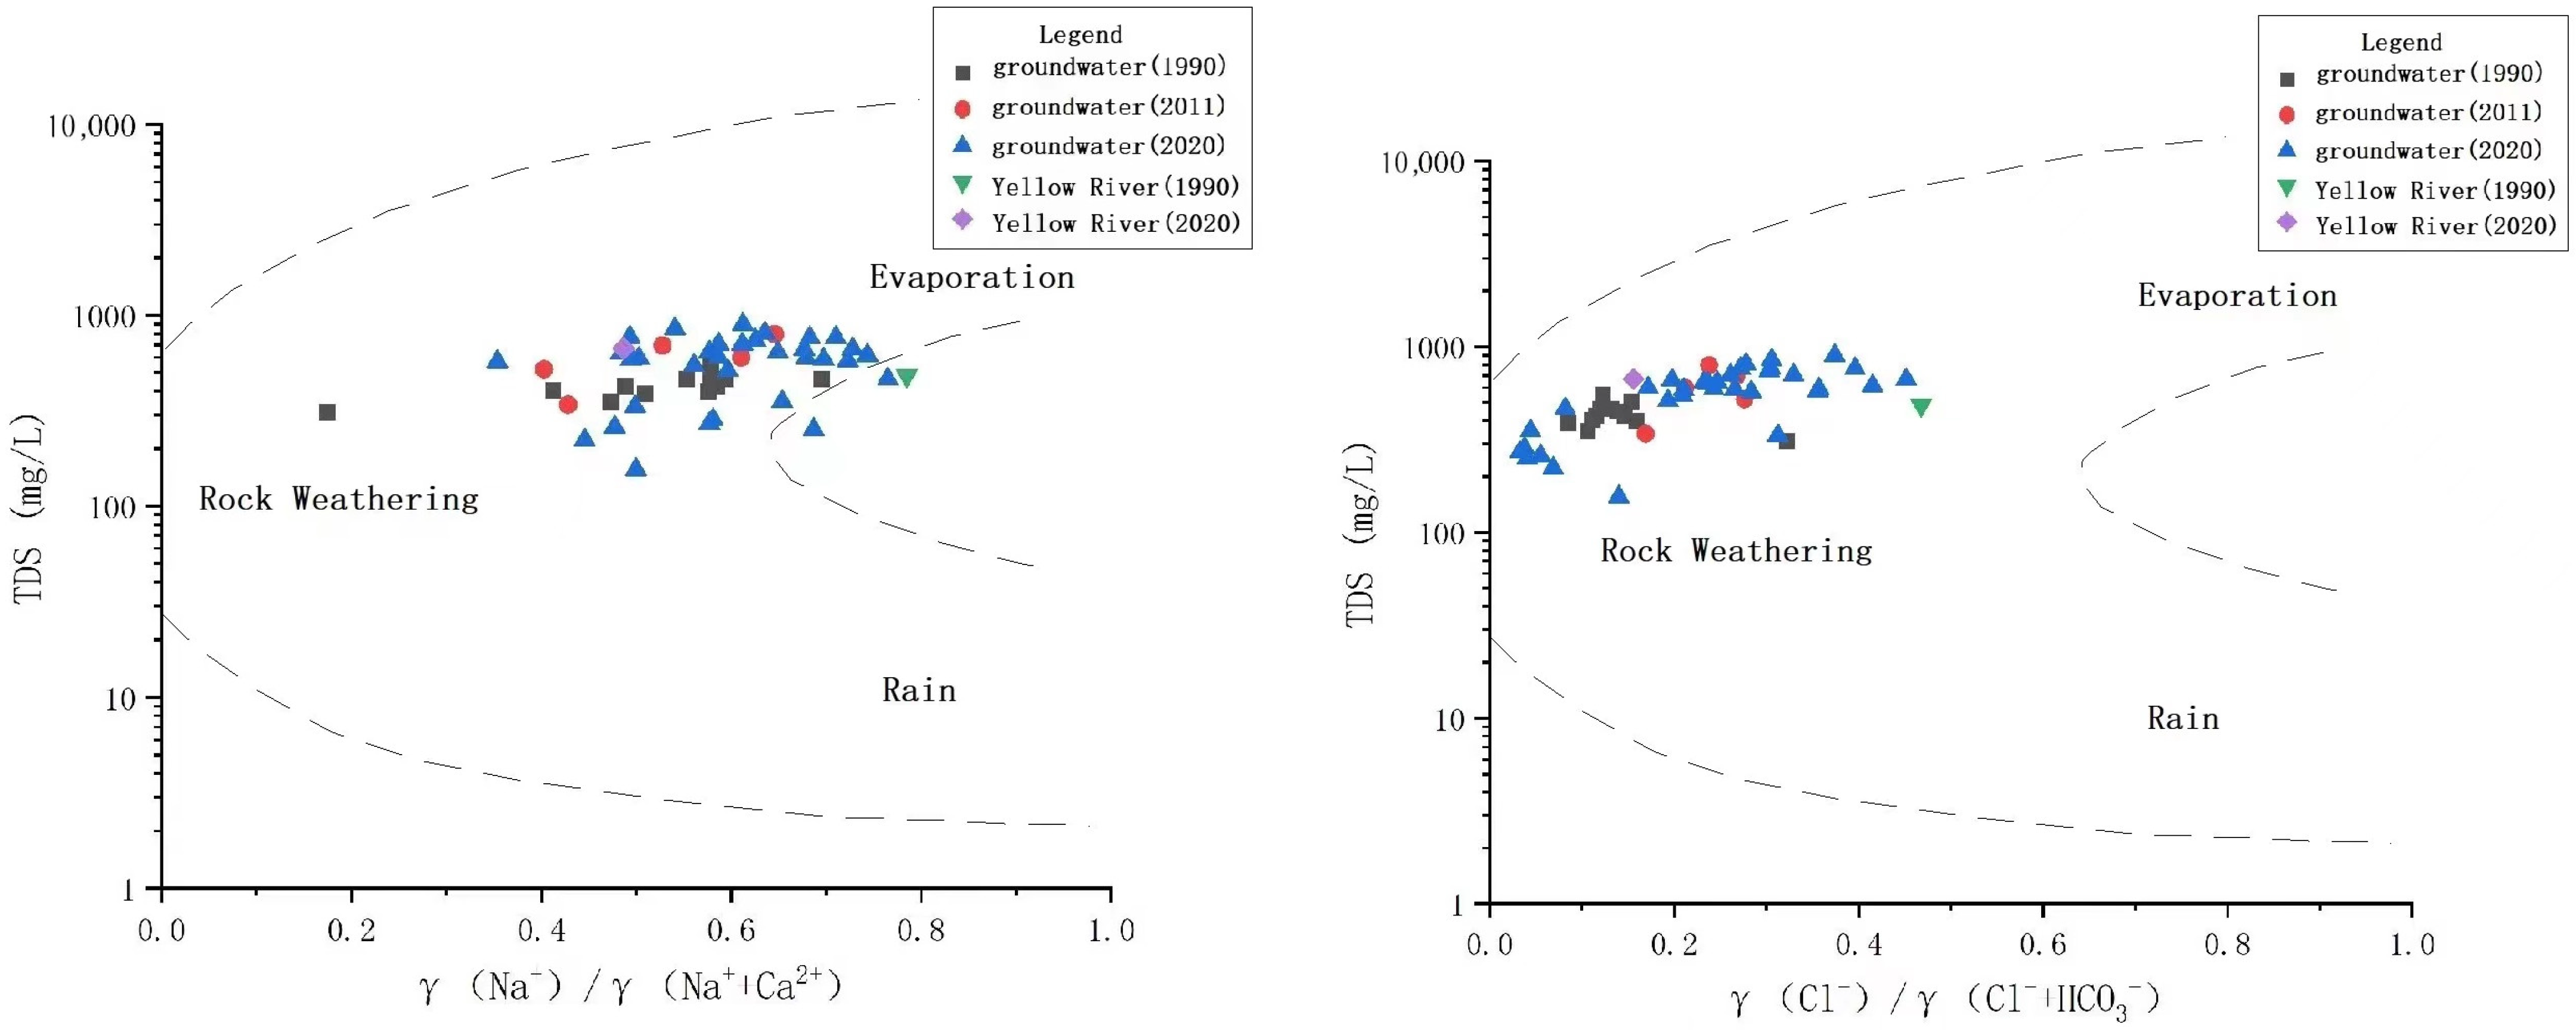
3.3.1. Analysis Based on Gibbs Diagram

The Gibbs diagram can macroscopically show the main ions and their changing trend in groundwater, judge the hydrochemical formation mechanism, and divide the controlling factors into atmospheric precipitation, evaporation concentration, and rock weathering [37]. The Gibbs diagram of the groundwater and Yellow River water in the study area is shown in Figure 12. It can be seen from the figure that the groundwater TDS in the study area is medium, and the γ(Na+)/γ(Na+ + Ca2+) values of groundwater are mostly between 0.4 and 0.8, which are jointly affected by water–rock interactions and evaporation concentrations. Among them, the Na+/(Na+ + Ca2+) ratio is more dispersed, indicating that the proportion of Na+ in different spatial positions is different. The sampling points on the left side are far away from the Yellow River and are mainly affected by rock weathering. The Na+ ratio is only 0.2. The groundwater sampling points on the right have an Na+ ratio ranging from 0.4 to 0.8. These sampling points are close to the Yellow River and are close to the γ(Na+)/γ(Na+ + Ca2+) value of the Yellow River water, indicating that the closer to the Yellow River, the shallower the groundwater depth, the weaker the rock weathering, and the stronger the evaporation.

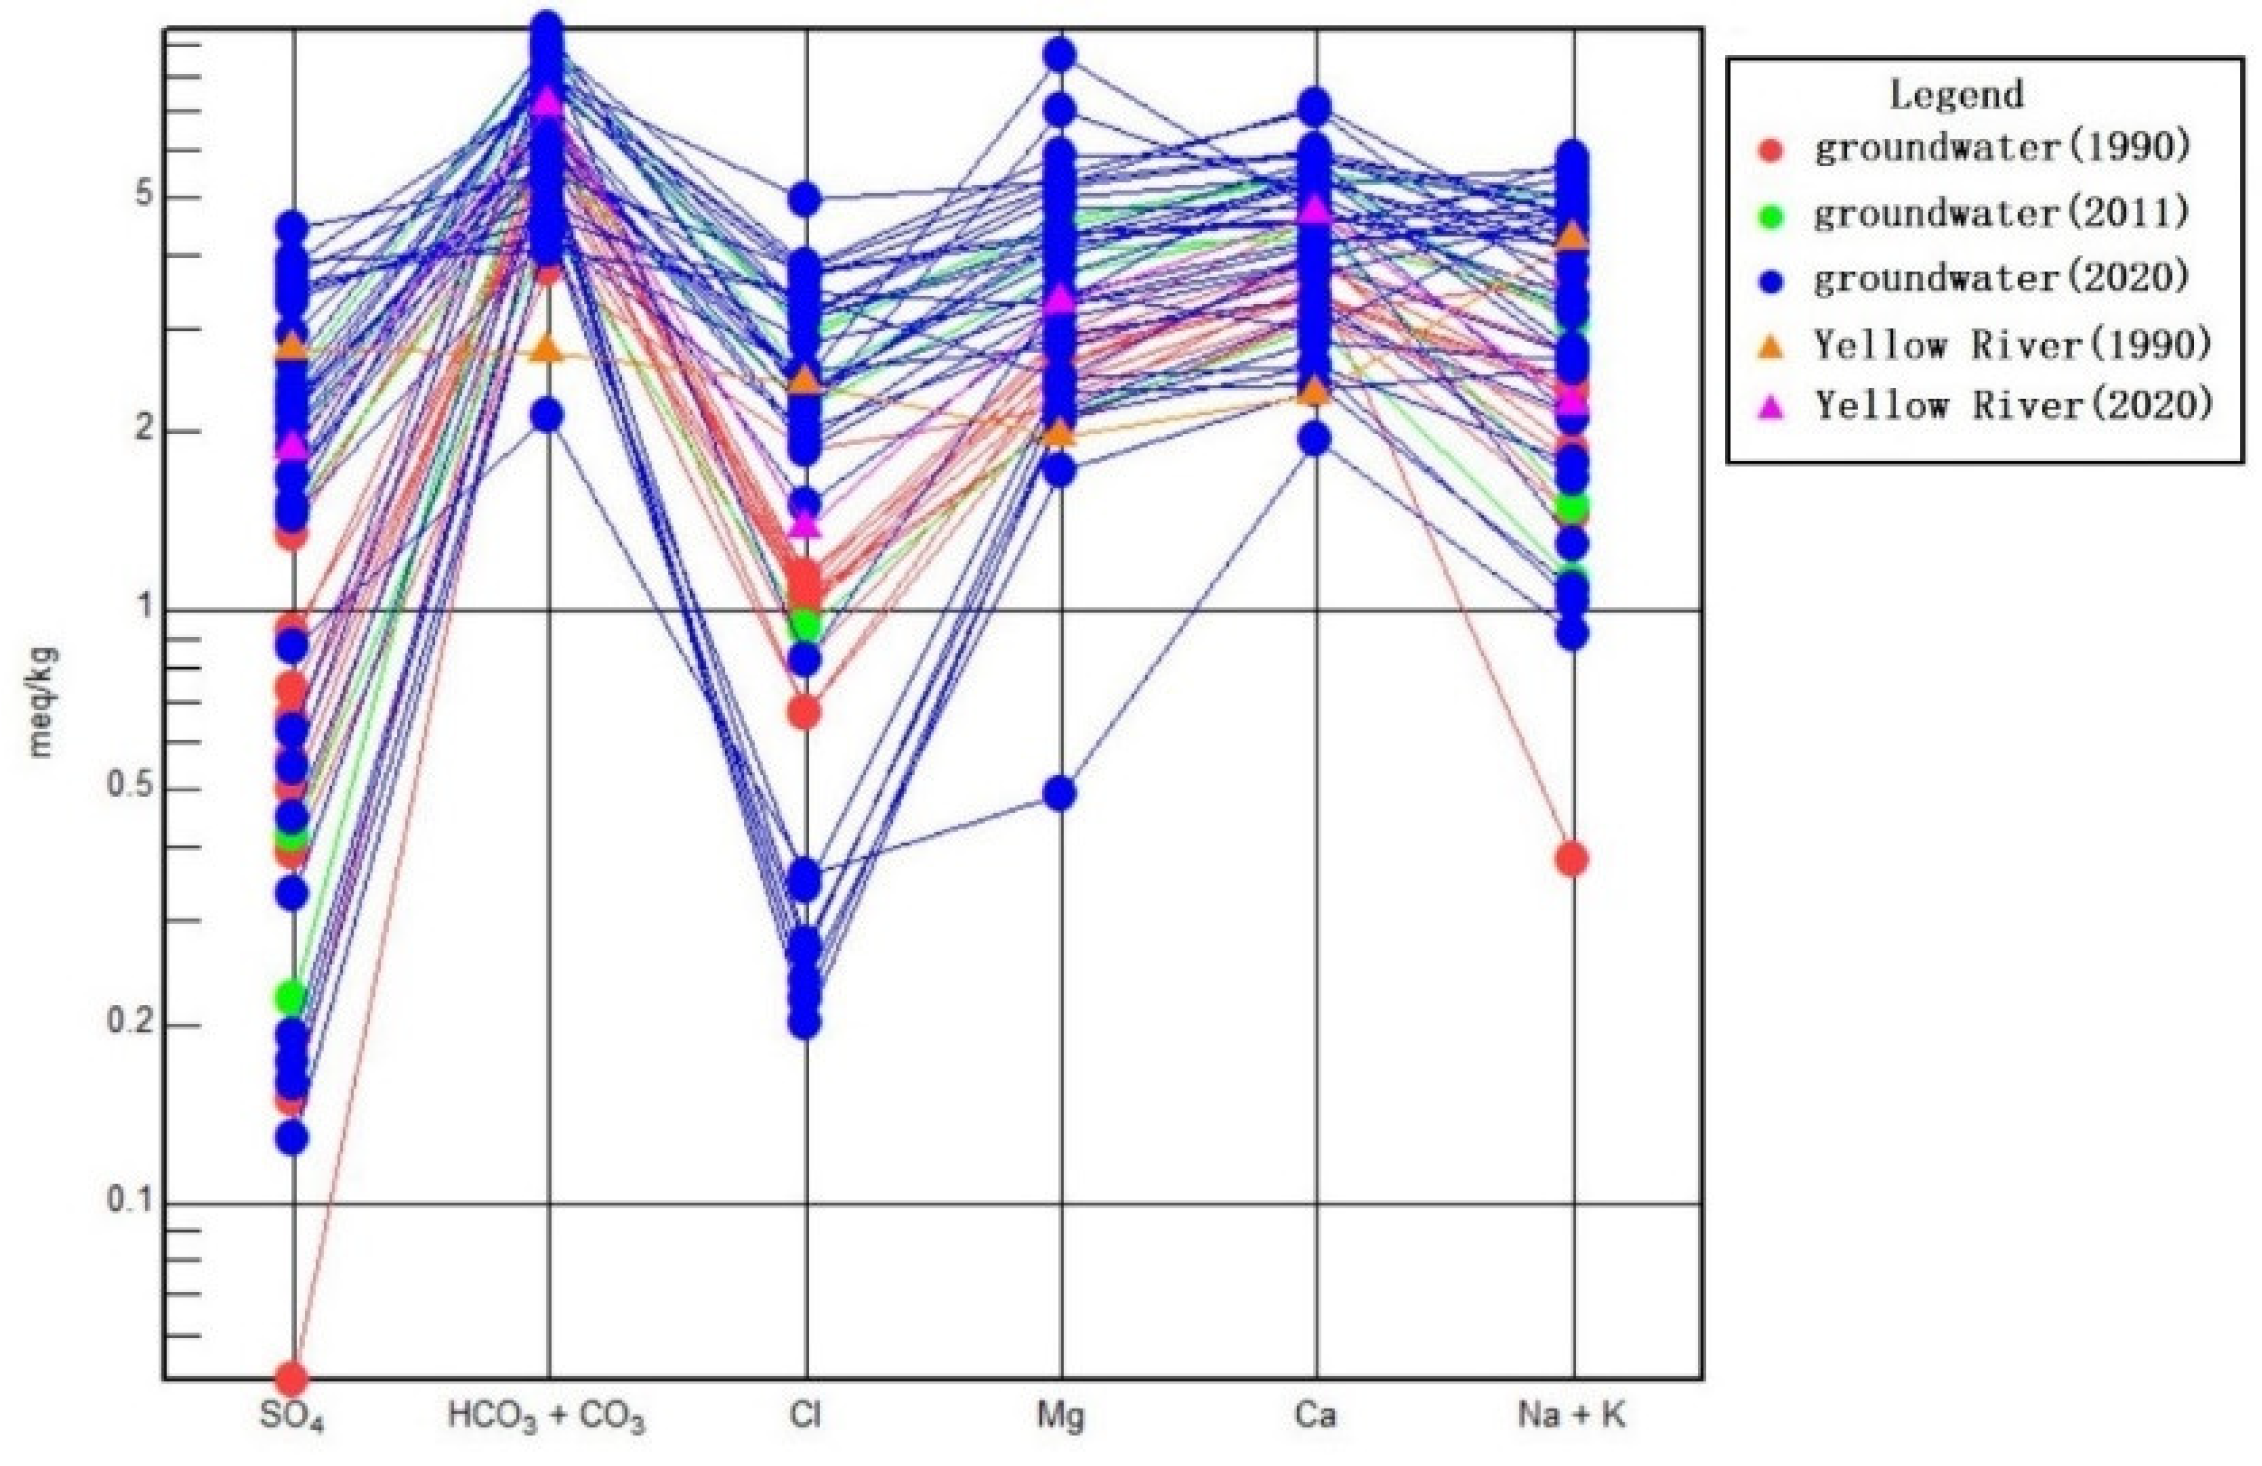
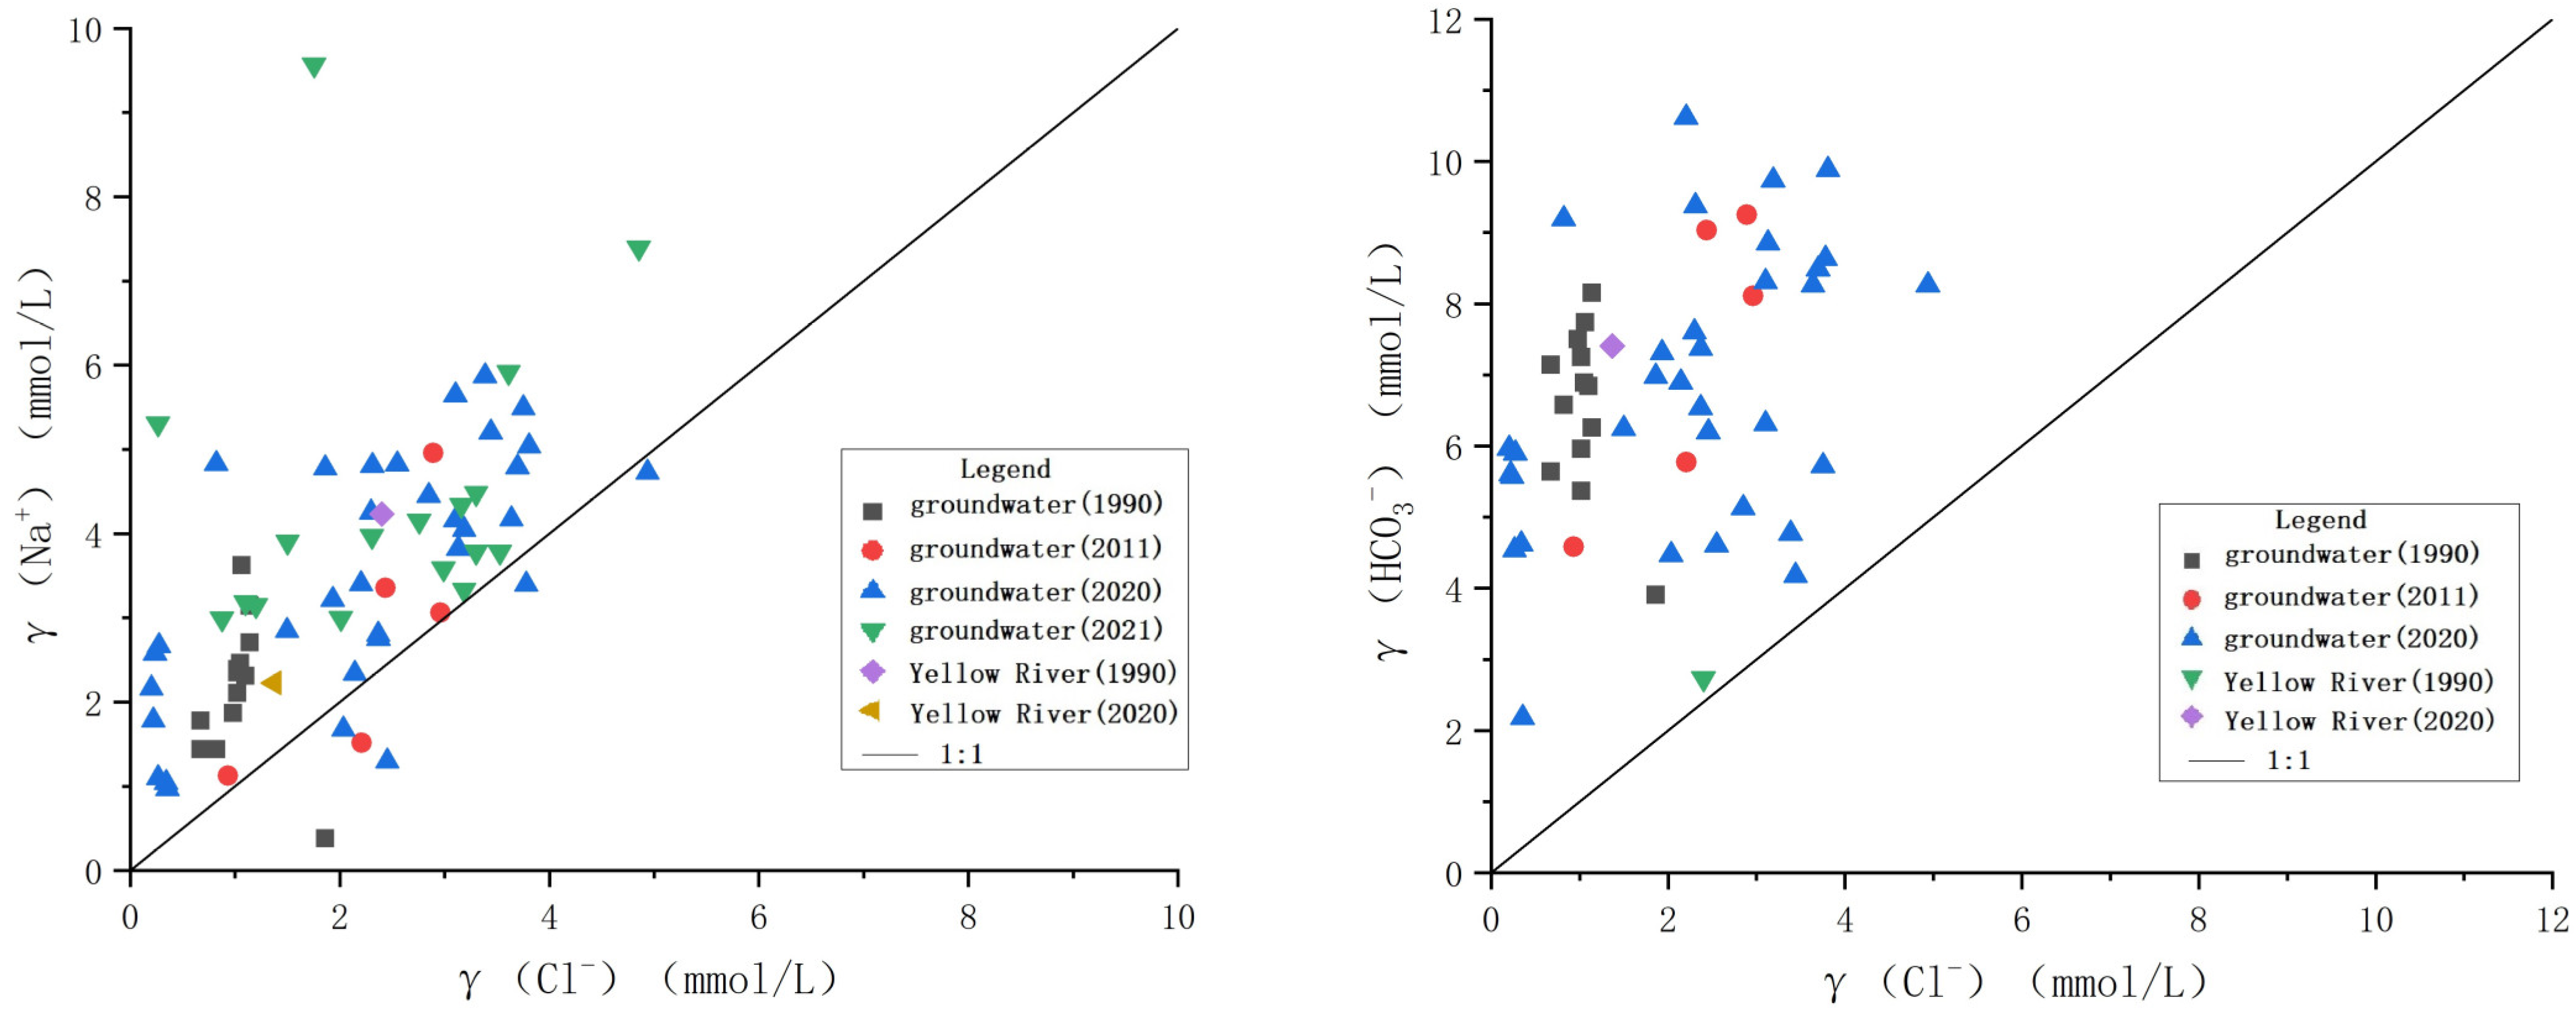
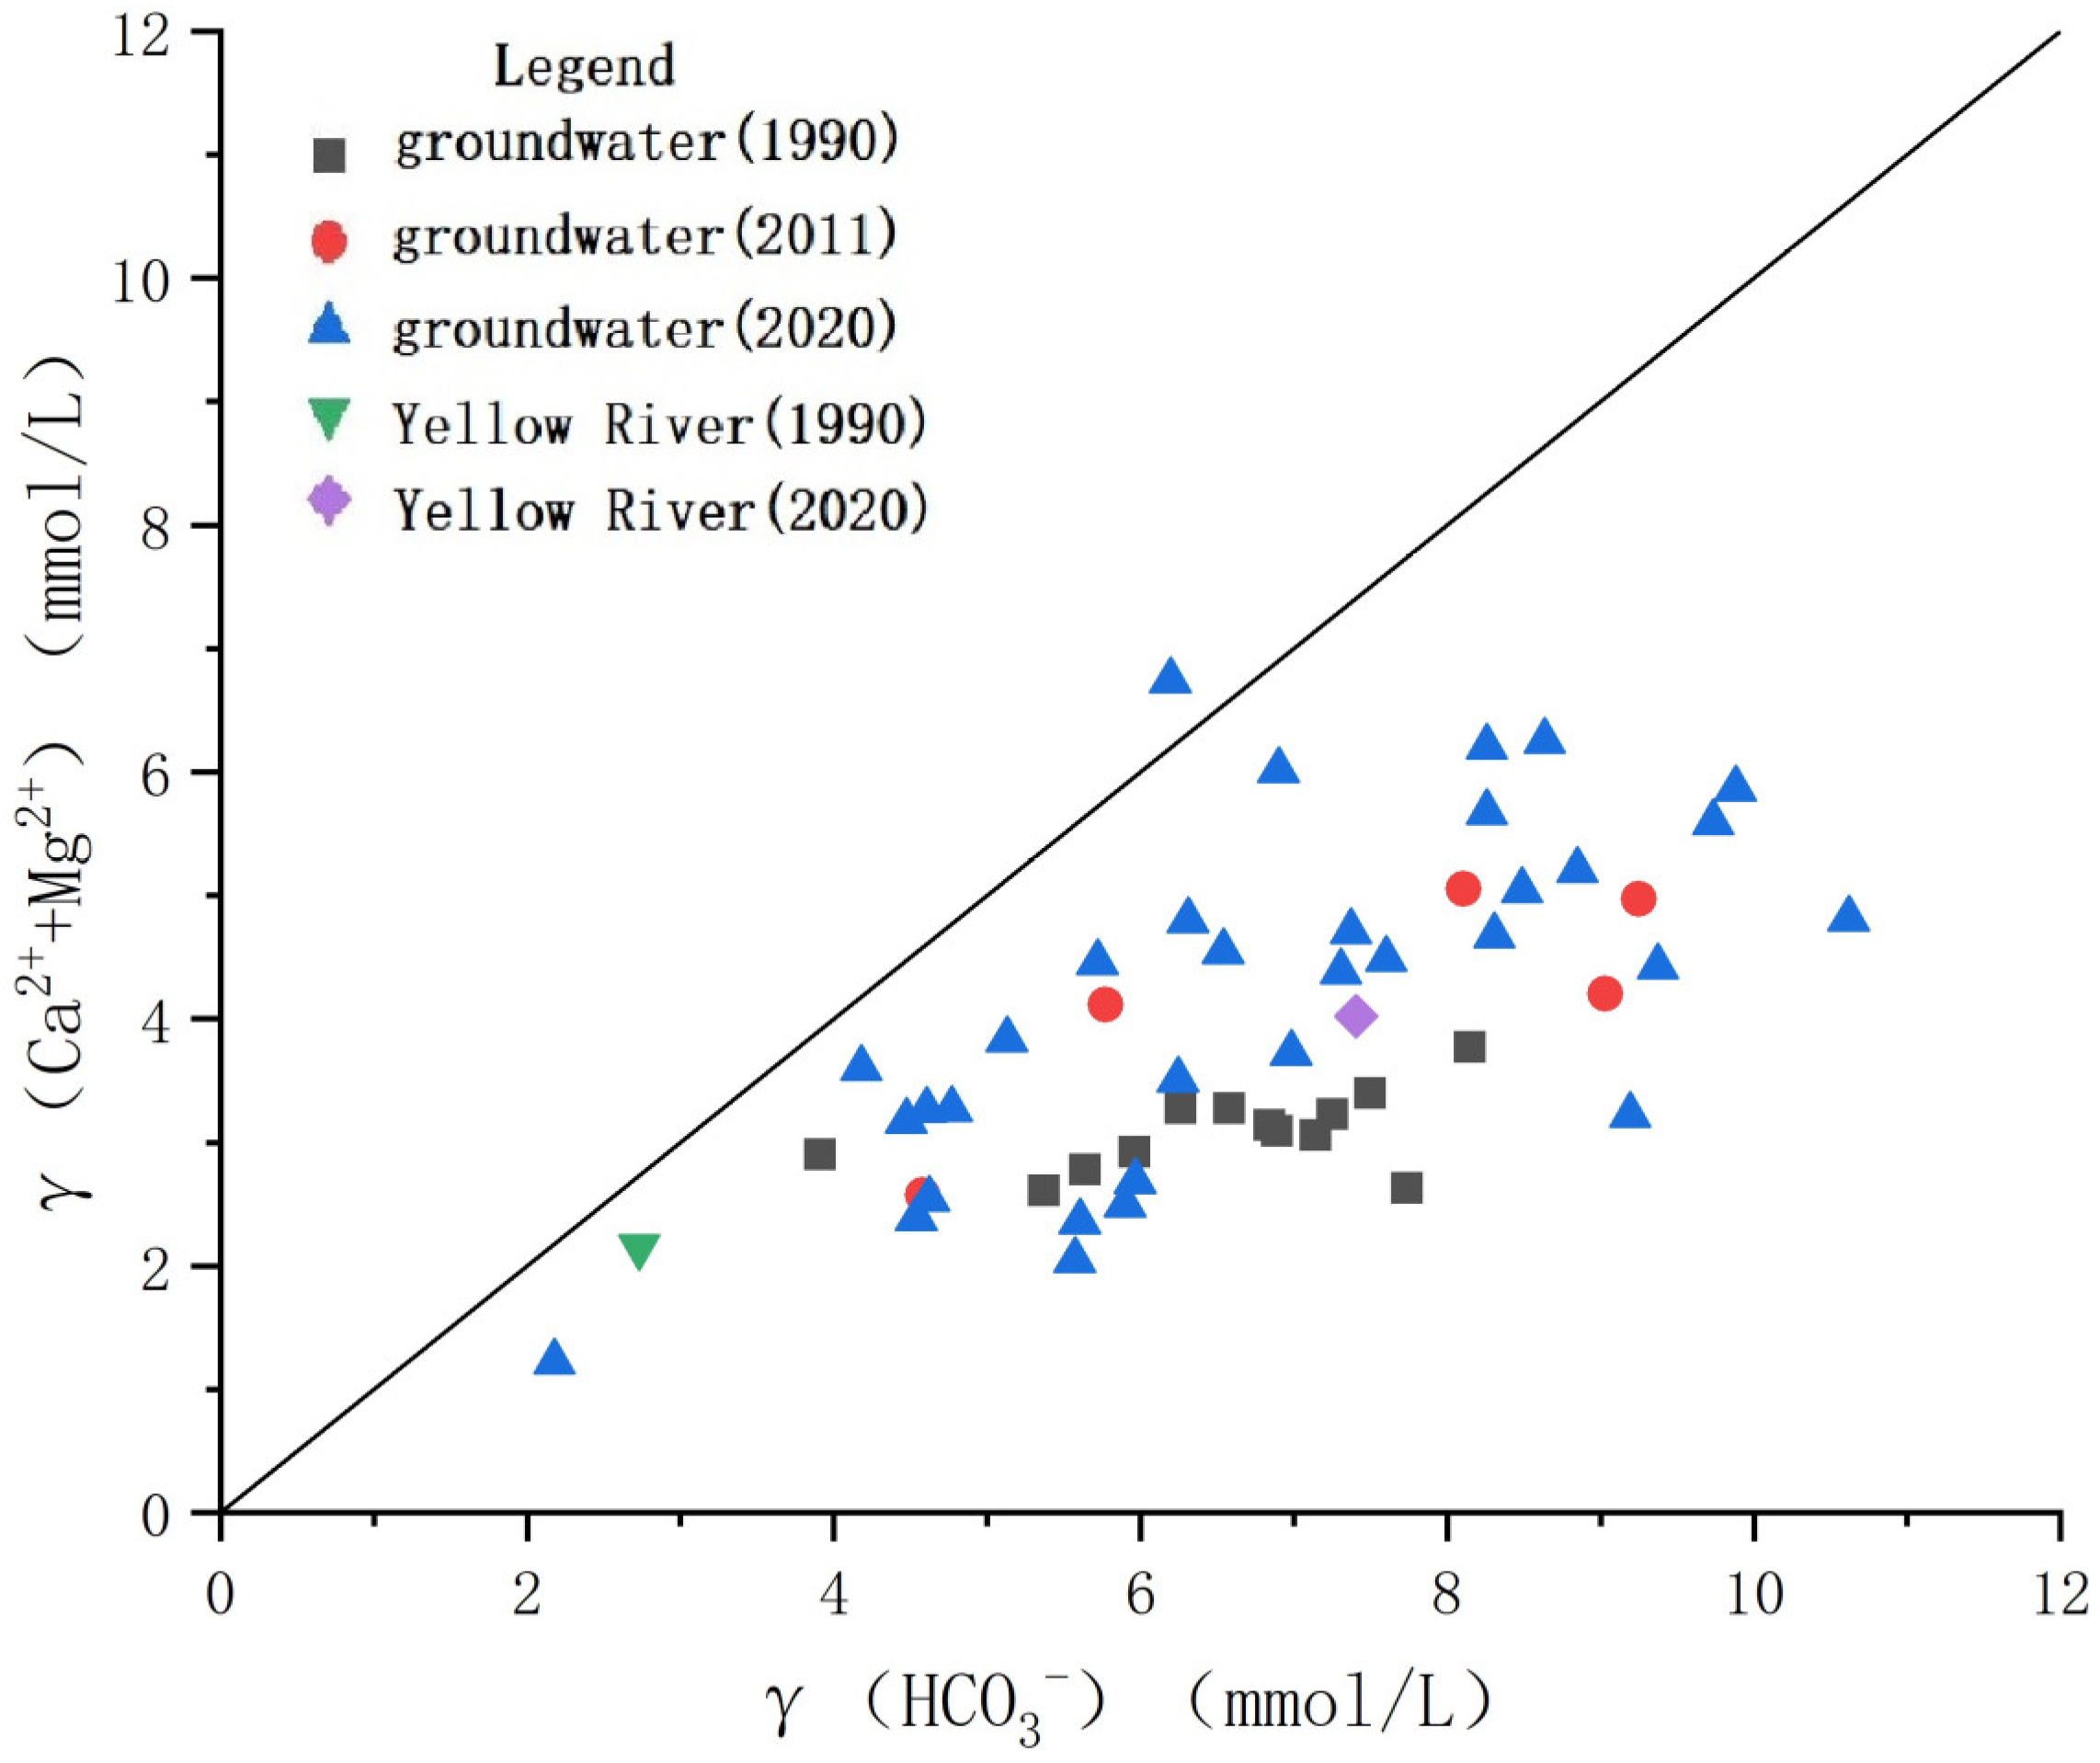
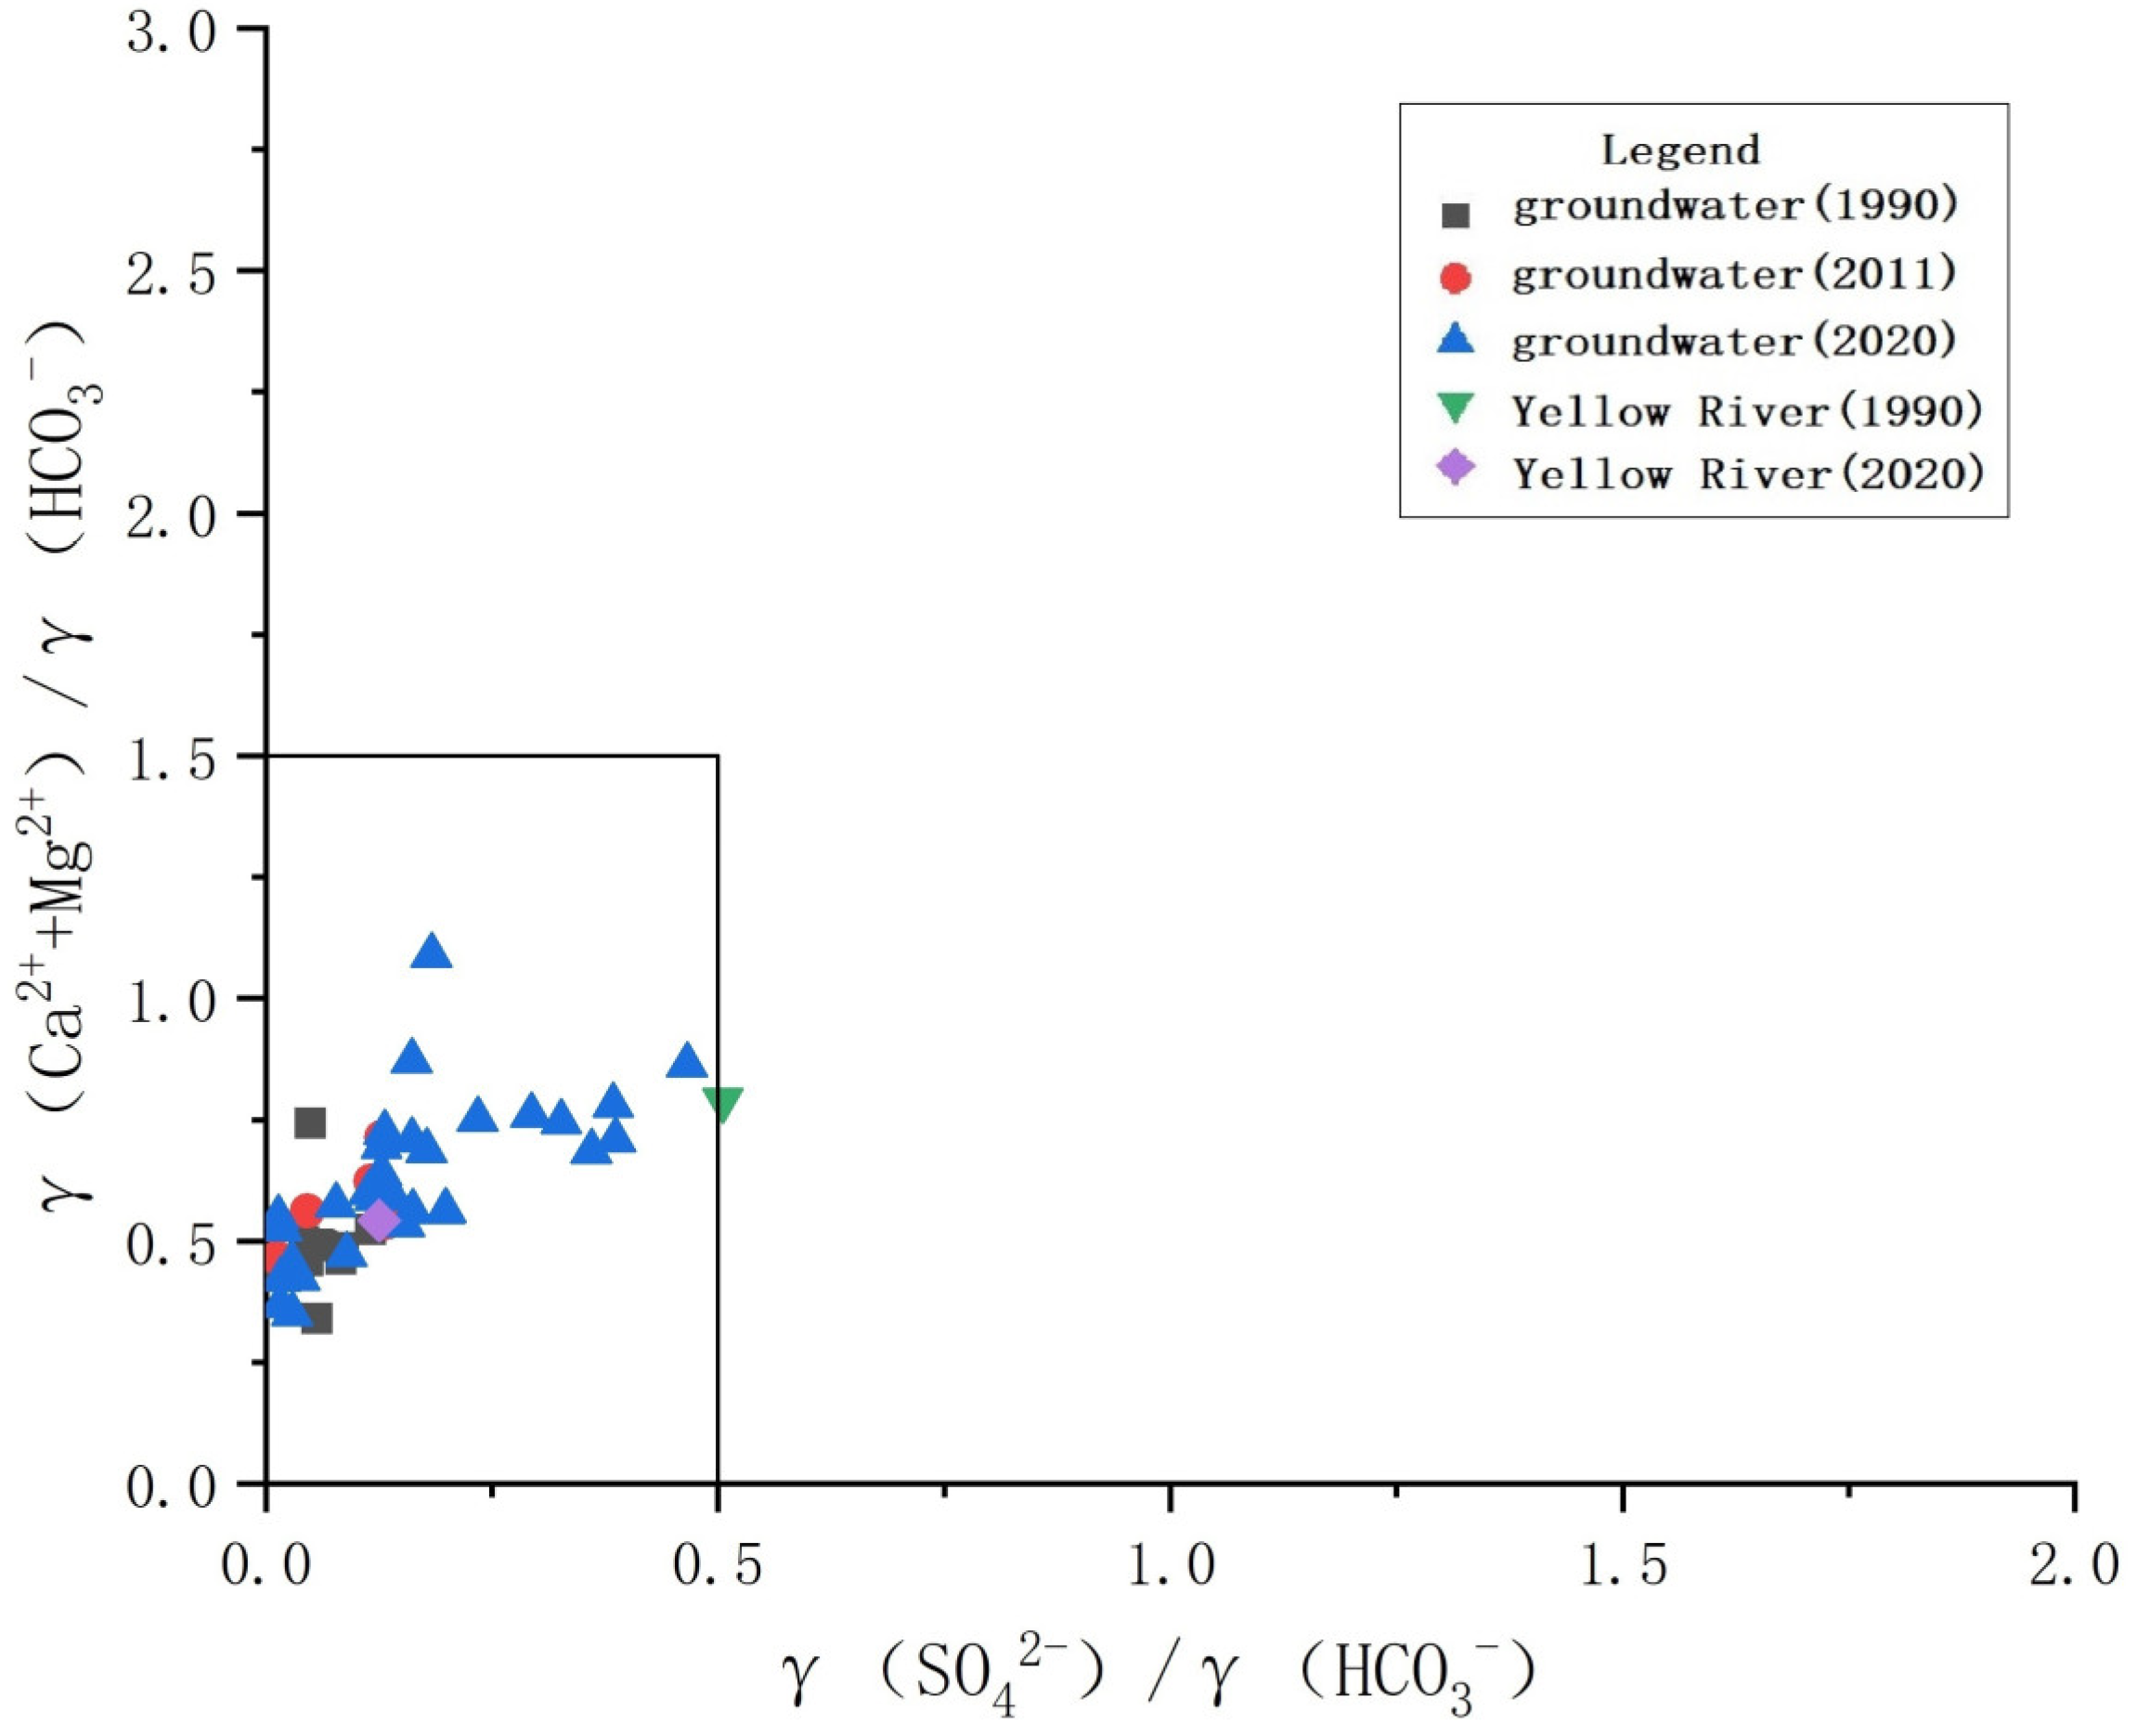
3.3.2. Analysis Based on the Ion Proportion Coefficient

The ion proportional coefficient method can be used to determine the origin of groundwater and the source or formation process of groundwater chemical composition by the milligram equivalent proportional coefficient of different ions [38].
The coefficient of γ(Na+)/γ(Cl) can characterize the enrichment degree of Na+ in groundwater, which is a sign of salt leaching and the accumulation intensity of groundwater. Cl- in natural groundwater often comes from salt rock. The γ(Na+)/γ(Cl) values of groundwater in the study area are almost all greater than one (Figure 13), indicating that Na+ has other major sources in addition to salt rock. Different from the groundwater affected only by evaporation, the γ(Na+)/γ(Cl) value of groundwater in the study area does not remain constant but increases with an increasing Cl concentration, indicating that the groundwater in the study area is jointly controlled by the evaporation concentration and the water–rock interaction. The coefficient of γ(HCO3)/γ(Cl) can reflect the hydrogeochemical process of anions in groundwater along the runoff path (Figure 13). The ratio of the two is above the 1:1 isoline, indicating that calcite, dolomite, and other minerals are dissolved in the study area.
The γ(Ca2+ + Mg2+)/γ(HCO3) ratio can reflect the dissolution characteristics of carbonate rocks in groundwater (Figure 14). Most of the samples are located below the 1:1 isoline, indicating that the ratio of Ca2+ to Mg2+ to HCO3 is slightly lower than one based on the dissolution of carbonate rocks, which may result in cation exchange reactions with Na+. Sample points are distributed in the carbonate dissolution area, indicating that carbonate in groundwater is widely involved in the dissolution of carbonate minerals (Figure 15).

3.3.3. Analysis of Excessive Arsenic in Groundwater

High-arsenic groundwater is generally distributed in alluvial plains and closed basins rich in organic matter. According to the data, the average As content in the Yellow River water is 0.00275 mg/L, which is not enough to cause excessive As in groundwater (content >0.01 mg/L). There are many fish ponds in the study area, but the migration ability of arsenic in the sediment and surface soil of fish ponds is weak. The water source protection area is along the Yellow River, and there are no other pollution sources in the area. The possibility of groundwater arsenic exceeding the standard is very small. The sedimentary environment of sediment interbedded structures in the Yellow River alluvial plain has strong reducibility, and arsenic-rich ferromanganese oxides or hydroxides in primary sedimentary strata are released into groundwater due to reducibility dissolution. At the same time, the groundwater runoff is not smooth, and strong cation exchange occurs. The evaporation and concentration of groundwater aggravates the enrichment of arsenic. In addition, in recent years, water level changes caused by agricultural irrigation and water source replacement in the Yellow River region are potential factors that cause arsenic concentration changes.

3.3.4. Analysis of Excessive Three Nitrogen in Groundwater

There are three main sources of “three nitrogen” pollution in groundwater: agriculture and human activities, including human and livestock manure, fertilizers, pesticide use, and sewage irrigation; urban industry, including wastewater, waste gas, and solid waste caused by chemical fuel combustion; and the random emission of “three wastes” of life. Under suitable natural geological conditions, these nitrogen-containing substances infiltrate into the groundwater through the soil and the vadose zone and accumulate continuously, resulting in an increasingly serious groundwater “three nitrogen” pollution. There is less development of industry in the right bank of the middle and lower reaches of the Yellow River and more development of fish pond aquaculture and other industries. The excess of “three nitrogen” in groundwater may be related to aquaculture and human domestic wastewater discharge.

4. Conclusions

(1)
The shallow groundwater in the study area is weakly alkaline, and the TDS is low. The groundwater chemical types are mainly HCO3Na·Ca·Mg and HCO3Na·Ca. In the past 10 years, the hydrochemical types have become more complex, and the contents of SO42− and Cl have increased locally. The closer HCO3 and Mg2+ are to the Yellow River, the lower the contents are, and the closer SO42−, Cl, and Na+ are to the Yellow River, the higher the contents are.
(2)
The shallow groundwater in the study area is jointly affected by water–rock interactions and evaporation concentrations. The closer to the Yellow River the groundwater is, the shallower its buried depth, the greater the effect of evaporative concentration, and the stronger the cation exchange. The water–rock interaction is manifested in the dissolution of calcite, dolomite, and other carbonate minerals in the study area. At the same time, the carbonate in groundwater is also widely dispersed.
(3)
The arsenic content of shallow groundwater in the study area exceeds the local standard. The exceeding points are mainly distributed in the Yellow River alluvial plain, and there is no class V (>0.05 mg/L) point. The class IV (≤0.05 mg/L) points are mainly distributed in the Yellow River Wetland Park in Huiji District, Houliubei, and other places. The possibility of the artificial pollution of excessive arsenic is very small. The primary reductive sedimentary environment of sediment interbedded structures, such as the Yellow River alluvial plain, intensifies the dissolution of arsenic-rich ferromanganese oxides or hydroxides in the strata. At the same time, the strong evaporation and strong cation exchange in the shallow groundwater depth region aggravate the enrichment of arsenic.
(4)
There are sporadic local excesses of “three nitrogen” in shallow groundwater in the study area, which are attributable to previous fisheries and human domestic sewage discharge. There are many fish ponds in the study area. The nitrogen element in the feed that is put into the fish pond every day is the original source of ammonia nitrogen and nitrite in the water body. Usually, the nitrogen element in the feed that is not absorbed and utilized by the fish body is in the process of various microorganisms. Under the action, it is converted into ammonia nitrogen and nitrite in water. At present, domestic pond aquaculture basically discharges wastewater without treatment. Nitrite, ammonia nitrogen, and organic nitrogen in domestic sewage, domestic garbage and other discharges enter the groundwater through discharge, leaching, and other channels, resulting in groundwater “three nitrogen” exceeding the standard.

Author Contributions

Conceptualization, X.T., H.T. and X.H.; Formal analysis, X.T.; Funding acquisition, R.G.; Investigation, H.T.; Methodology, X.T., H.T. and X.H.; Resources, H.T.; Software, X.T.; Supervision, R.G.; Validation, X.H.; Writing—original draft, X.T.; Writing—review and editing, R.G., Z.L. and S.G. All authors have read and agreed to the published version of the manuscript.

Funding

This work was financially supported by the National Natural Science Foundation of China (NSFC grant NO. 41402221), China Postdoctoral Science Foundation (NO. 2013M540999) and the Science and Technology Project on Water Conservancy of Henan Province (GG202026).

Institutional Review Board Statement

Not applicable.

Informed Consent Statement

Not applicable.

Data Availability Statement

The data presented in this study are available on request from the corresponding author.

Acknowledgments

We would like to extend special thanks to the editor and reviewers for insightful advice and comments on the manuscript.

Conflicts of Interest

The authors declare no conflict of interest. The funders had role in the writing of the manuscript, or in the decision to publish the results.

References

  1. Liu, J.; Gao, Z.; Wang, Z.; Xu, X.; Su, Q.; Wang, S.; Xing, T. Hydrogeochemical processes and suitability assessment of groundwater in the Jiaodong Peninsula, China. Environ. Monit. Assess. 2020, 192, 1–17. [Google Scholar] [CrossRef] [PubMed]
  2. Wang, H.; Jiang, X.W.; Wan, L.; Han, G.; Guo, H. Hydrogeochemical characterization of groundwater flow systems in the discharge area of a river basin. J. Hydrol. 2015, 527, 433–441. [Google Scholar] [CrossRef]
  3. Meybeck, M. Global occurrence of major elements in rivers. Treatise Geochem. 2003, 5, 207–223. [Google Scholar]
  4. Grasby, S.E. Chemical dynamics and weathering rates of a carbonate basin Bow River, southern Alberta. Appl. Geochem. 2003, 15, 67–77. [Google Scholar] [CrossRef]
  5. Millot, R.; Gaillardet, J.; Dupre, B.; Allègre, C.J. The global control of silicate weathering rates and the coupling with physical erosion: New insights from rivers of the Canadian Shield. Earth Planet. Sci. Lett. 2002, 196, 83–98. [Google Scholar] [CrossRef]
  6. Jia, H.; Qian, H.; Zheng, L.; Feng, W.; Wang, H.; Gao, Y. Alterations to groundwater chemistry due to modern water transfer for irrigation over decades. Sci. Total Environ. 2020, 717, 137170. [Google Scholar] [CrossRef]
  7. Li, J.; Wang, Y.; Zhu, C.; Xue, X.; Qian, K.; Xie, X.; Wang, Y. Hydrogeochemical processes controlling the mobilization and enrichment of fluoride in groundwater of the North China Plain. Sci. Total Environ. 2020, 730, 138877. [Google Scholar] [CrossRef]
  8. Aher, S.; Deshmukh, K.; Gawali, P.; Zolekar, R.; Deshmukh, P. Hydrogeochemical characteristics and groundwater quality investigation along the basinal cross-section of Pravara River, Maharashtra, India. J. Asian Earth Sci. X 2022, 7, 100082. [Google Scholar] [CrossRef]
  9. Xu, L.S. Application of GIS in Jiaxing Water Quality Monitoring. Manag. Technol. Small Medium Enterp. 2014, 26, 304–305. [Google Scholar]
  10. Zhao, L.S.; Li, H.G. Comparative study on the application effect of GIS spatial interpolation method in lake water quality evaluation. Mod. Agric. Sci. Technol. 2014, 5, 245–246. [Google Scholar]
  11. Gan, Y.; Zhao, K.; Deng, Y.; Liang, X.; Ma, T.; Wang, Y.X. Groundwater flow and hydrogeochemical evolution in the Jianghan Plain, central China. Hydrogeol. J. 2018, 26, 1609–1623. [Google Scholar] [CrossRef]
  12. Peng, H.; Zou, P.; Ma, C.; Xiong, S.; Lu, T. Elements in potable groundwater in Rugao longevity area, China: Hydrogeochemical characteristics, enrichment patterns and health assessments. Ecotoxicol. Environ. Saf. 2021, 218, 112279. [Google Scholar] [CrossRef] [PubMed]
  13. Qin, W.; Han, D.; Song, X.; Liu, S. Environmental isotopes (δ18O, δ2H, 222Rn) and hydrochemical evidence for understanding rainfall-surface water-groundwater transformations in a polluted karst area. J. Hydrol. 2021, 592, 125748. [Google Scholar] [CrossRef]
  14. Sun, D.M. Analysis of chemical characteristics and formation mechanism of groundwater in Dalian area. Water Resour. Dev. Manag. 2022, 8, 54–58. [Google Scholar]
  15. Wang, Y.S.; Cheng, X.X.; Zhang, M.N.; Qi, X.F. Hydrochemical characteristics and formation mechanism of Malian River in the Yellow River Basin during dry season. Environ. Chem. 2018, 37, 164–172. [Google Scholar]
  16. Liu, X.; Xiang, W.; Si, B.C. Hydrochemical characteristics and stable isotope characteristics of hydrogen and oxygen in shallow groundwater in the Fenhe River Basin. Environ. Sci. 2021, 42, 1739–1749. [Google Scholar]
  17. Ming-Hui, H.; Stallard, R.F.; Edmond, J.M. Major ion chemistry of some large Chinese rivers. Nature 1982, 298, 550–553. [Google Scholar] [CrossRef]
  18. Zhang, J.; Huang, W.W.; Letolle, R.; Jusserand, C. Major element chemistry of the Huanghe (Yellow River), China-weathering processes and chemical fluxes. J. Hydrol. 1995, 168, 173–203. [Google Scholar] [CrossRef]
  19. Li, J.Y.; Zhang, J. Chemical weathering processes and atmospheric CO2 consumption of Huanghe River and Changjiang River basins. Chin. Geogr. Sci. 2003, 15, 16–21. [Google Scholar] [CrossRef]
  20. Zhang, L.J.; Wen, Z.C. Discussion on silicate weathering in the Huanghe drainage basin. Period. Ocean Univ. China 2009, 39, 988–994. [Google Scholar]
  21. Liu, F.; Zhao, Z.; Yang, L.; Ma, Y.; Xu, Y.; Gong, L.; Liu, H. Geochemical characterization of shallow groundwater using multivariate statistical analysis and geochemical modeling in an irrigated region along the upper Yellow River, Northwestern China. J. Geochem. Explor. 2020, 215, 106565. [Google Scholar] [CrossRef]
  22. Zhao, Y.Z.; Yan, Z.P.; Jiao, H.J. Exploration, Development and Protection of Reserve Groundwater Sources in Yanhuang City, Henan Province; Geological Press: Beijing, China, 2013; p. 51. [Google Scholar]
  23. Tong, C.S.; Wu, J.C.; Miao, J.X.; Liu, J.C.; Yu, S.H. Development and utilization of groundwater and evolution of water quality in the North Henan Plain. Hydrogeol. Eng. Geol. 2005, 5, 13–16. [Google Scholar]
  24. Zhai, Q.M.; Ning, Y.X.; Liu, S. Analysis of sediment changes and their impact in the middle and lower reaches of the Yellow River. Henan Sci. Technol. 2020, 16, 78–80. [Google Scholar]
  25. Zhang, J.L.; Luo, Q.S.; Chen, C.X.; An, Q.H. Joint dynamic regulation of reservoir group-channel flow and sediment in the middle and lower reaches of the Yellow River. Adv. Water Sci. 2021, 32, 649–658. [Google Scholar]
  26. Han, S.B.; Li, F.C.; Wang, S.; Li, H.X.; Yuan, L.; Liu, J.T.; Shen, H.Y.; Zhang, X.Q.; Li, C.Q.; Wu, X.; et al. The situation of groundwater resources and its ecological environment in the Yellow River Basin. China Geol. 2021, 48, 1001–1019. [Google Scholar]
  27. Fan, Y.L.; Hu, N. Temporal and spatial dynamic changes of groundwater resources in the middle and lower reaches of the Yellow River. People’s Yellow River 2020, 42, 69–71. [Google Scholar]
  28. Ying, Y.M.; Qing, S.; Li, H.H.; Wang, W. A preliminary study on the spatial and temporal distribution characteristics of arsenic pollutants in the middle and lower reaches of the Yellow River. China Water Transp. (Second. Half Mon.) 2018, 18, 94–95. [Google Scholar]
  29. Tong, C.S.; Cheng, S.P.; Wang, X.K.; Guo, D.X.; Zhan, Y.H. Research on groundwater quality and pollution causes in the Huaihe River Basin (Henan Section). Eng. Investig. 2005, 3, 24–26. [Google Scholar]
  30. Sun, L.; Wang, L.L.; Cao, W.G. Study on the evolution law of hydrochemistry in the influence belt of the lower Yellow River (Henan section). People’s Yellow River 2021, 43, 91–99. [Google Scholar]
  31. Zhang, Q.Q.; Jin, Z.D.; Zhang, F. Seasonal Variation in river water chemistry of the middle reaches of the Yellow River and its controlling factors. J. Geochem. Explor. 2015, 156, 101–113. [Google Scholar] [CrossRef]
  32. Ren, Y.; Cao, W.G.; Pan, D.; Wang, S.; Li, Z.Y.; Li, J.C. Evolution characteristics and change mechanism of arsenic and fluorine in shallow groundwater in typical irrigation areas of Henan in the lower reaches of the Yellow River from 2010 to 2020. Rock Miner. Test. 2021, 40, 846–859. [Google Scholar]
  33. Wang, Y.R.; Shi, L.Q.; Qiu, M. Analysis of chemical characteristics of mine water based on Piper three-line diagram. Shandong Coal Sci. Technol. 2019, 4, 145–147, 150. [Google Scholar]
  34. Ren, X.Z.; Liu, M.; Zhang, Y.Z.; He, Z.M.; Zhu, B.Q. The realization of Durov’s three-line diagram based on Matlab. Geogr. Arid Reg. 2018, 41, 744–750. [Google Scholar]
  35. Jiang, Y.L.; Guan, Z.Q.; Zheng, C.X. Application of GIS spatial analysis in water pollution monitoring. Geospat. Inf. 2004, 3, 32–33. [Google Scholar]
  36. Shen, Z.L. Basis of Hydrology and Geochemistry; Geological Press: Beijing, China, 1999; p. 40. [Google Scholar]
  37. Liu, B.W.; Dong, S.G.; Tang, Z.H.; Xia, M.H. The seasonal variation characteristics of groundwater chemistry in the Tumochuan Plain, Inner Mongolia. Eng. Investig. 2020, 48, 34–40. [Google Scholar]
  38. Hu, C.H.; Zhou, W.B.; Xia, S.Q. Characteristics and source analysis of major ions in hydrochemistry in the Poyang Lake Basin. Environ. Chem. 2011, 30, 1620–1626. [Google Scholar]
Figure 1. Geomorphic map of the study area.
Water 14 01846 g001
Figure 2. Hydrogeological profile of the study area.
Water 14 01846 g002
Figure 3. Distribution map of sampling points in the study area.
Water 14 01846 g003
Figure 4. Contour map of the shallow groundwater level in the study area ((Left)—April 2021; (Right)—September 2021).
Water 14 01846 g004
Figure 5. The groundwater level fluctuation map of different periods.
Water 14 01846 g005
Figure 6. Water level curve of shallow groundwater monitoring points in the study area.
Water 14 01846 g006
Figure 7. Piper map of groundwater in the study area.
Water 14 01846 g007
Figure 8. Durov map of groundwater in the study area.
Water 14 01846 g008
Figure 9. Chemical components of groundwater and Yellow River water in different periods in the study area.
Water 14 01846 g009
Figure 10. Spatial distribution map of groundwater chemical types in the study area. ((Left)—1990, (Right)—2020).
Water 14 01846 g010
Figure 11. Typical indicator concentration evaluation map in groundwater in the study area (As, NH4, NO2, and NO3, respectively).
Water 14 01846 g011
Figure 12. Gibbs map of groundwater in the study area.
Water 14 01846 g012
Figure 13. γ(Na+)/γ(Cl) and γ(HCO3)/γ(Cl).
Water 14 01846 g013
Figure 14. γ(Ca2+ + Mg2+)/γ(HCO3).
Water 14 01846 g014
Figure 15. γ(Ca2+ + Mg2+)/γ(HCO3) and γ(SO42−)/γ (HCO3).
Water 14 01846 g015
Table 1. Statistical analysis table of hydrochemical characteristics of sampling points.
HCO3SO42CIK+ + Na+Ca2+Mg2+TDSpHNO3NH4+NO2As
Yellow
River
1990 166.6132.685.197.346.523.94838.1560.1//
2020 45289.348.651.294.240.16727.660.85/0.160.003
Shallow groundwater1990Min238.602.4023.808.7062.3025.00311.107.300.0000.000//
Max497.3069.6065.9083.3092.0035.40553.507.9010.0000.360//
Mean400.0532.1336.9649.5272.4630.62430.107.482.8000.187//
2011Min279.6510.5733.1525.8460.1425.79339.997.750.46/0.003/
Max564.31118.68105.04114.00109.8655.47795.838.0717.00/0.119/
Mean448.4662.1881.0864.4390.9045.98589.607.918.25/0.031/
2020Min133.006.157.1522.3339.005.96156.007.290.520.0000.0000.000478
Max648.00211.00175.00135.04142.00105.00897.007.8736.000.1531.8400.0492
Mean414.7995.8780.0881.4888.6346.71565.427.547.250.0610.1330.00819
2021Min/39.209.4068.70//466.006.900.010.0280.0000.0007
Max/361.00172.00220.00//1250.007.902.481.1300.2830.0138
Mean/135.7086.94102.54//712.767.480.730.3340.0520.003982
Note: All units except pH are mg/L, “/” means none.
Publisher’s Note: MDPI stays neutral with regard to jurisdictional claims in published maps and institutional affiliations.

